phylogenetic anova: the expression variance and...
TRANSCRIPT

Syst. Biol. 64(5):695–708, 2015© The Author(s) 2015. Published by Oxford University Press, on behalf of the Society of Systematic Biologists. All rights reserved.For Permissions, please email: [email protected]:10.1093/sysbio/syv042Advance Access publication July 13, 2015
Phylogenetic ANOVA: The Expression Variance and Evolution Model forQuantitative Trait Evolution
RORI V. ROHLFS1 AND RASMUS NIELSEN1,2
1Department of Integrative Biology, University of California Berkeley, CA, USA; 2Center for Bioinformatics, University of Copenhagen, Denmark∗Correspondence to be sent to: Department of Integrative Biology, University of California Berkeley, 1005 Valley Life Sciences Bldg #3140 Berkeley, CA
94720 USA; E-mail: [email protected].
Received 5 August 2014; reviews returned 30 October 2014; accepted 8 April 2015Associate Editor: Luke Harmon
Abstract.—A number of methods have been developed for modeling the evolution of a quantitative trait on a phylogeny. Thesemethods have received renewed interest in the context of genome-wide studies of gene expression, in which the expressionlevels of many genes can be modeled as quantitative traits. We here develop a new method for joint analyses of quantitativetraits within- and between species, the Expression Variance and Evolution (EVE) model. The model parameterizes theratio of population to evolutionary expression variance, facilitating a wide variety of analyses, including a test for lineage-specific shifts in expression level, and a phylogenetic ANOVA that can detect genes with increased or decreased ratiosof expression divergence to diversity, analogous to the famous Hudson Kreitman Aguadé (HKA) test used to detectselection at the DNA level. We use simulations to explore the properties of these tests under a variety of circumstancesand show that the phylogenetic ANOVA is more accurate than the standard ANOVA (no accounting for phylogeny)sometimes used in transcriptomics. We then apply the EVE model to a mammalian phylogeny of 15 species typed forexpression levels in liver tissue. We identify genes with high expression divergence between species as candidates forexpression level adaptation, and genes with high expression diversity within species as candidates for expression levelconservation and/or plasticity. Using the test for lineage-specific expression shifts, we identify several candidate genes forexpression level adaptation on the catarrhine and human lineages, including genes putatively related to dietary changesin humans. We compare these results to those reported previously using a model which ignores expression variancewithin species, uncovering important differences in performance. We demonstrate the necessity for a phylogenetic modelin comparative expression studies and show the utility of the EVE model to detect expression divergence, diversity, andbranch-specific shifts. [Comparative expression; expression adaptation; Ornstein–Uhlenbeck model; plasticity; populationvariance].
Quantitative phylogenetic methods account fornonindependence relationships between species usingseveral approaches such as independent contrasts(Felsenstein 1985) and generalized least squares (Martinsand Hansen 1997; Grafen 1989; Rohlf 2001). Thesemethods have provided frameworks for a varietyof phylogenetic approaches which consider variancewithin species (for a review, see Garamszegi 2014).For instance, the phylogenetic mixed model considersboth gradual evolutionary drift and within-speciesvariance (Lynch 1991; Housworth et al. 2004). Anotherapproach transforms comparative quantitative datato account for phylogeny before performing ANOVA(Butler et al. 2000). Still other methods compare ANOVAresults based on raw phylogenetic data to those basedon data simulated under a phylogenetic model tocreate an appropriate null distribution (Garland et al.1993; Harmon et al. 2008; Revell 2012). Sophisticatedextensions of quantitative evolutionary models allowevolutionary scenarios including varying rates ofphenotypic evolution (Pagel 1999; O’Meara et al. 2006).These quantitative trait evolution methods have beenused effectively for a variety of phenotypic, particularlymorphological, traits.
The emergence of transcriptome-wide comparativegene expression studies including multiple individualsper species (Kalinka et al. 2010; Brawand et al.2011; Perry et al. 2012; Necsulea et al. 2014) haspresented a new challenge to quantitative evolutionarymethodology. Like traditional morphological traits,
expression levels can be considered a quantitative traitthat evolves over a phylogeny. Expression levels areparticularly interesting as relatively malleable basicgenetic traits, creating a convenient point of interventionfor adaptation (Whitehead and Crawford 2006; Giladet al. 2006b; Fraser 2011). By examining comparativeexpression levels, we can identify fundamental changesthat underlie adaptation to environmental factors. Thisinvites quantitative genetic investigation of evolutionarymodality (drift, stabilizing selection, adaptive shift, etc.).In addition to a clear genetic basis, expression levelshave strong environmental components (Idaghdouret al. 2010; Pickrell et al. 2010). Changes in expressionlevel may reflect genetic adaptation fixed withinindividuals, or plastic (rapidly changeable) responseto environmental variables. This plasticity allowsexamination of the relationship between expressionplasticity and adaptability. Finally, the large numbersof measurements across genes in transcriptome-wideexpression studies present new analytical opportunities.
Despite the extensive literature of quantitativephylogenetic methods, many early large-scalecomparative expression analyses used traditionalANOVA to detect genes with unusually high expressiondivergence between species, given the expressionvariance within species (Nuzhdin et al. 2004; Giladet al. 2006a; Khaitovich et al. 2006; Whitehead andCrawford 2006). These analyses typically assumeindependence between species. While technicallyuntrue, this assumption has no impact for phylogenies
695
at University of C
alifornia, Berkeley on Septem
ber 9, 2015http://sysbio.oxfordjournals.org/
Dow
nloaded from

696 SYSTEMATIC BIOLOGY VOL. 64
of two species and may have limited impact for the smallnumbers of species analyzed. However, as more speciesare considered in recent studies, the difference in sharedevolutionary history between closely and distantlyrelated species increases, and a complex covariancestructure emerges. In current comparative expressiondata sets across larger phylogenies, the assumption ofspecies independence does not hold, necessitating moresophisticated methods taking into account evolutionaryrelationships (Felsenstein 1985).
More recent comparative expression studies haveemployed classical quantitative trait evolutionarymodels, particularly the model of constrained traitevolution proposed by Hansen (1997) and expanded inlater work (Butler and King 2004; Hansen et al. 2008).This flexible model has been applied to describe theevolution of gene expression under neutral expressionlevel diffusion, constrained diffusion (expected understabilizing selection), and species-specific expressionlevel shifts (Bedford and Hartl 2009). These models areused to calculate the expected species average expressionlevels and expression covariance between species undera particular evolutionary scenario. Likelihood ratio testscan then be formulated to distinguish unconstrainedrandom trait evolution, constrained or stabilized traitevolution, and branch-specific shifts in trait evolution, ashas been successfully analyzed in a number of data sets(Bedford and Hartl 2009; Kalinka et al. 2010; Perry et al.2012; Schraiber et al. 2013). However, these methodsare limited by their inability to model nonphylogeneticvariance (Oakley et al. 2005) and are not designed toinvestigate evolutionary expression variation in relationto expression variance within species.
A number of augmentations to these models allowwithin-species variance as an error term (Lynch 1991;Martins and Hansen 1997; Gu 2004; Ives et al.2007; Felsenstein 2008; Hansen and Bartoszek 2012;Rohlfs et al. 2014). Several models of phenotypicdrift parameterize within-species variance (Lynch 1991;Housworth et al. 2004; Felsenstein 2008), while otheranalyses show how this substantially improves ancestralstate estimation (Martins and Lamont 1998; Ives et al.2007) and evolutionary inference (Harmon and Losos2005; Ives et al. 2007; Revell et al. 2008). Within-species variance has additionally been parameterizedin an evolutionary model allowing for constrained traitevolution (Rohlfs et al. 2014).
We build upon these models to create the unifiedExpression Variance and Evolution (EVE) model,describing both phylogenetic expression level evolutionbetween species and expression level variance withinspecies. Expression levels vary among individuals in apopulation or a species. This expression level variance iscaused by genetic and environmental differences amongindividuals. It may be low if the gene has an importantfunction, is expressed constitutively, and does notrespond to environmental changes. Such genes might bethe genes involved in important cellular functions suchas cell cycle control. Genes that have high expressionlevel variance are genes that either harbor segregating
adaptive variation affecting expression levels, or morelikely, respond to various environmental cues. Suchgenes might, for example, include genes involved inimmunity and defense against pathogens. Our methodallows for expression level evolution under neutralityor selective constraint with a flexible model (Hansen1997; Butler and King 2004; Hansen et al. 2008), whileadding in within-species variance (as was previouslydone under drift (Lynch 1991; Housworth et al. 2004;Felsenstein 2008)). The EVE model re-parameterizes aprevious model, which allows within-species variancesimply as an error term (Rohlfs et al. 2014). Bycontrast, in the EVE model, we parameterize the ratioof expression variance within species to evolutionaryvariance between species, facilitating rigorous novelanalyses directly aimed at this ratio. This can beconsidered a phylogenetic analogy to test for driftvia ratios of between- to within-population variance(Lande 1979; Ackermann and Cheverud 2002; Marroigand Cheverud 2004). We develop this phylogeneticframework with genome-wide expression data in mind,exploiting the large number of expression measurementsover the same individuals. Yet, the EVE model couldbe used for any set of quantitative traits, includingmorphological traits.
The EVE model enables an expression analogyto classic genetic neutrality tests consideringpolymorphism and diversity, namely, the HKAtest (Hudson et al. 1987). In this test, the ratio ofpolymorphism within species to divergence betweenspecies is compared among different genes in thegenome. Under neutrality, this ratio should be thesame (in expectation) for all genes in the genome.However, for genes affected by selection, the numberof polymorphic sites within species may be increasedor decreased relative to the number of fixed differencesbetween species, depending on the directionality andmodality of selection (see e.g., Nielsen 2005).
Analogously, in our model, we parameterize the ratioof within-species expression variance to between-speciesexpression evolutionary variance using a parameter �defined over the phylogeny. This parameter representsthe ratio of within- to between-species variance, whichshould be approximately constant for a given phylogenyover different genes if only constant stabilizing selection(or no selection) is acting on the trait (Lande 1976).We can now construct likelihood ratio tests aimed atdetecting if � varies among genes. Let G=g1,g2,...,gk bethe set of all k genes for which expression values havebeen obtained, and let the value of � for gene i∈G be�i. To test if �i is elevated compared to the rest of thegenes, we then calculate the likelihood under the nullhypothesis of a constant value of � among genes, thatis, �i =�shared for all genes i∈G. We compare it to thealternative hypothesis of �i �=�shared−i, where �shared−i is avalue of � shared for all genes in G except gi. The resultinglikelihood ratio test statistic, formed in the usual fashion,by comparing the log likelihood maximized under theunion of the null and the alternative hypothesis, to thelog likelihood maximized under the null hypothesis, is
at University of C
alifornia, Berkeley on Septem
ber 9, 2015http://sysbio.oxfordjournals.org/
Dow
nloaded from
2015 ROHLFS AND NIELSEN—IDENTIFYING ADAPTIVE AND PLASTIC GENE EXPRESSION 697
then �2 distributed with one degree of freedom understandard regularity conditions.
As a practical matter, we assume that the valueof � estimated for �shared is approximately the sameas the value of � estimated for �shared−i for any i.This assumption is reasonable when there are manygenes and the estimate of �shared is not dominatedby any particular gene. Using this assumption leadsto considerable reductions in computational time. Inthe following, we will therefore in the notation notdistinguish between �shared and �shared−i.
If the null hypothesis is rejected because �i issignificantly larger than �shared, expression divergencebetween species is elevated in gene i relative to thelevel of within species variance. This would suggestthat gene i may be subject to species or branch-specificdirectional selection on expression level. Genes with anunusually low ratio (�i <�shared) show proportionallyhigh expression diversity within species, suggestingconservation of species average expression levels, withexpression variation in response to either environmentalfactors or diversifying selection within species. This testcan also be thought of as an alternative phylogeneticANOVA test as it is essentially an analysis of expressionvariance within- versus between species, accounting forvarying evolutionary relationships between species. Instatistical terms, the analogy is to a one way ANOVAwhere species define the discriminating factor and thetest determines if species share the same mean, butwhere evolutionary dependencies between species areaccounted for.
Since phylogenetic information is included in the EVEmodel itself, a wide variety of evolutionary scenariosmay be specified by selectively constraining parameters,improving flexibility to test different comparativehypotheses. For example, we can test for unusualspecies or lineage-specific expression variance, as maybe observed under recent relaxation or increases ofconstraint on expression level, diversifying selectionon expression level, or under extreme branch-specificdemographic processes. Other tests may be constructedto test for differing expression diversity for groupsof individuals within each species, for instance,evolutionarily conserved age or sex-specific expressionvariance. All of these tests could be performed ona particular gene of interest or on a class of genesof interest, for example, a list of candidate genescould be queried for increased expression diversity inolder individuals. In addition to these novel tests, theEVE model can be used for the same tests as otherexpression evolution models which discount within-species variance. In particular, the EVE model can testfor lineage-specific shifts in constrained expression level,while taking into account within-species variance.
Here, we explore the performance of two EVE modeltests: The test for unusual expression divergence ordiversity and the test for lineage-specific expressionlevel shifts. We use simulations to describe thesetests and formulate expectations under the nullhypotheses. We then apply the tests to a previously
published expression data set of 15 mammals. Weidentify a number of genes with high expression leveldivergence between species as candidates for expressionlevel adaptation to species-specific factors, and geneswith high expression level diversity within speciesas candidates for environmentally responsive geneexpression (plasticity). Using the test for lineage-specificexpression shifts, we identify several strong candidategenes for branch-specific expression adaptation on thecatarrhine and human lineages.
We compare our results to those obtained using thespecies mean (SM) model described by Bedford andHartl (2009) and recently used in a number of studies(Bedford and Hartl 2009; Kalinka et al. 2010; Perryet al. 2012). The SM model considers the evolutionof the mean expression level for each species, ratherthan within species variance. This model can describetrait evolution without constraint, with constraint, orwith a branch-specific adaptive shift in response to anenvironmental factor. By comparing the likelihood ofobserved data under different parametric limits, the SMmodel can be used to identify genes subject to differentevolutionary schemes. We find important differencesbetween our results and those obtained using theSM method, especially for analyses of species-specificexpression shifts (Perry et al. 2012).
METHODS
The EVE Model for Gene Expression Evolution andPopulation Variance
The evolution of quantitative traits by diffusion andconstrained or stabilized diffusion has been modeledusing an Ornstein–Uhlenbeck (OU) process, which canbe thought of as a random walk with a pull towardan optimal value (Lande 1976; Hansen 1997; Butlerand King 2004; Hansen et al. 2008; Bedford and Hartl2009; Kalinka et al. 2010). In an OU model of stabilizingselection on gene expression level, the parameter �i canbe thought of as the optimal expression level for gene i,�2
i the diffusion acting on that expression level, and �ithe rate of adaptation for that expression level (Hansen1997; Butler and King 2004; Hansen et al. 2008; Hansen2012). Over evolutionary time, the stationary variance
of SM expression levels for gene i will be �2i
2�i, which we
refer to as the evolutionary variance.More recently, several Brownian motion and OU-
based models have been augmented to includewithin-species population level variance (Lynch 1991;Felsenstein 2008; Hansen and Bartoszek 2012; Rohlfset al. 2014). Accounting for population variance is crucialto distinguish evolutionary modalities (Rohlfs et al.2014).
The model we describe builds on these OU modelsfor quantitative trait evolution with the additionalparameter � which describes the ratio of population toevolutionary expression level variance. Within speciesj the expression level of any individual k is distributed
at University of C
alifornia, Berkeley on Septem
ber 9, 2015http://sysbio.oxfordjournals.org/
Dow
nloaded from

698 SYSTEMATIC BIOLOGY VOL. 64
−8 −4 0 2 4 6
−5
05
log(β̂i
σ̂i
2
2α̂i
)
log (
σ̂ i2
2α̂i)
FIGURE 1. The maximum likelihood estimated per-gene evolutionary
variance (�̂2
i2�̂i
) and population variance (�̂i�̂2
i2�̂i
) are plotted against eachother. The linear regression line is shown.
as Yjk ∼N(Yj,��2
2�), where Yj is the SM expression level
determined by the OU process. We call this the EVEmodel, which describes a linear relationship betweenpopulation and evolutionary expression level variance.
In his classic paper, Lande (1976) showed thatunder an OU model of stabilizing selection, alinear relationship arises between a quantitative trait’sevolutionary variance and population variance withinspecies. Additionally, the Poisson nature of RNA-Seq andgene expression itself means that both evolutionary andpopulation expression variance increase with expressionmean. With that in mind, our model assumes alinear relationship between evolutionary and populationexpression variance. That assumption is reflected inthe data, which shows a linear relationship between
estimated evolutionary expression level variance ( �̂2i
2�̂i)
and estimated population expression level variance
(�̂i�̂2
i2�̂i
) (Fig. 1).The slope of this linear relationship (parameterized
by �) should be consistent across genes which haveundergone the same evolutionary and demographicprocesses under stabilizing selection. However, in agene, i, which has experienced directional selection onexpression level, �i would be lower as compared toother genes in the same individuals. The directionalselection would drive increased expression divergencebetween species, while maintaining low-expressionvariance within species. Similarly, a gene with plasticexpression may have more variation within speciesthan between as compared to other genes, raising thevalue of �i. High �i could alternatively be explainedby diversifying selection on expression level. Sinceexpression levels are quite plastic, this explanation seemsless plausible without other corroborating information.In this manuscript, since the samples we consider are
opportunistically harvested, presumably under quitevarying environmental conditions, we focus on theenvironmental plasticity hypothesis in the interpretationof our results.
Likelihood Calculations Under the EVE ModelThe EVE model is similar to other OU process-
based phylogenetic models (Butler and King 2004;Bedford and Hartl 2009), with the addition of within-species expression variance in terms of the evolutionaryvariance. As such, under the EVE model expressionlevels across individuals and species, given a fixedphylogeny, follow a multivariate normal distributionidentical to those under SM models at the species level as
E(Yi)=E(Yp)e−�itip +�i(1−e−�itip ) (1)
Var(Yi)=�2
i2�i
(1−e−2�itip)+Var(Yp)e−2�itip (2)
Cov(Yi,Yj)=Var(Ya)exp(−∑
k∈lij
�ktk −∑
k∈lji
�ktk) (3)
where Yi is the expression level in species i; Yp is theSM expression at the parental node p of species i; �i, �2
i ,and �i are the parameter values on the branch leadingto node i; tip is the length of the branch between i andp; Ya is the expression level at the most recent commonancestor of species i and j; and lij is the set of nodes in thelineage of Yi not in the lineage of Yj (Rohlfs et al. 2014).
This multivariate normal distribution describing thespecies-level expression is augmented in the EVEmodel to include individuals within species, so for an
individual k in species i, Yik ∼N(Yi,�i�2
i2�i
). In this way, thewithin-species expression variance parameter describedby Rohlfs et al. (Rohlfs et al. 2014) �2 is re-parameterized
as �i�2
i2�i
. The entire multivariate normal distribution canbe described as
E(Yik)=E(Yi)
Var(Yik)=Var(Yi)+�i�2
i2�i
Cov(Yik,Yil)=Var(Yi)
Cov(Yik,Yjl)=Cov(Yi,Yj)
based on equations (1), (2), and (3), where i �= j andk �= l. With the distribution of expression levels undera particular set of parameters defined according to thismultivariate normal, the likelihood of the data underthe model is simply the probability density. Noticethat sampling and experimental variance is accountedfor (and confounded) in the parameters governing thedistribution of Yik|Yi.
at University of C
alifornia, Berkeley on Septem
ber 9, 2015http://sysbio.oxfordjournals.org/
Dow
nloaded from
2015 ROHLFS AND NIELSEN—IDENTIFYING ADAPTIVE AND PLASTIC GENE EXPRESSION 699
Maximum Likelihood ProceduresFor the test for individual gene departures from
�shared, under the null hypothesis each gene i is governedby parameters �i, �2
i , and �i, reflecting the evolutionaryprocess of each gene based on its degree of expressiondiffusion and constraint. The population expressionvariance in all n genes is controlled by the singleparameter �shared. To more computationally efficientlymaximize the likelihood over these 3n+1 parameters, weuse a nested structure with Brent’s method (Brent 1973)in the outer loop to maximize over the single parameter�shared, and the BFGS algorithm (Broyden 1970; Fletcher1970; Goldfarb 1970; Shanno 1970) in the inner loop tooptimize over �i, �2
i , and �i for each gene. Under thealternative hypothesis, the likelihood of each gene i ismaximized using the BFGS algorithm over �i, �2
i , �i,and �i. To compute the likelihood ratio, the likelihoodsof each individual gene i are computed under H0 :�i =�shared and Ha :�i �=�shared, where �shared considers allof the genes considered. Note that this experimental setup allows better computational efficiency, but relies on�shared over all the genes approximating �shared overall the genes excluding gene i for large numbers ofgenes.
In the likelihood maximization under the nullhypothesis, likelihoods across genes are assumed to beindependent so that for a particular value of �shared,the likelihood of a set of genes is simply the productof the likelihoods of each gene. While this assumptionis currently typical in this sort of analysis, it leavessomething to be desired since the evolution of expressionlevels of inter-related genes are not independent, andnor are the particular expression levels measured in anindividual which may be responding to the environmentof that individual. A more rigorous approach wouldtake into account complex correlation structures acrossgenes, as has been outlined for some evolutionarymodels (Lande and Arnold 1983; Felsenstein 1985, 1988;Lynch 1991). Unfortunately, because of the combinatorialproblem of investigating a very large set of possiblecorrelation structures, a full likelihood approach thatestimates the correlation structure directly for thousandsof genes is not computationally tractable and possiblymay not be based on identifiable models. Instead weuse the independence model as an approximation.If expression patterns are correlated among genes,we can consider this procedure to be a compositelikelihood method (Larribe and Fearnhead 2011) sincethe estimating function is formed by taking the productof functions that individually are valid likelihoodfunctions, but the total product is not necessarily a validlikelihood function. In the case of severe dependencebetween genes, estimates of �shared will tend toward thevalue for correlated genes, leading to over-identificationof genes with �i different from the correlated genes.
For the test of branch-specific expression shift fora particular gene i, under the null hypothesis thelikelihood of each gene i is maximized over �i, �2
i , �i,
and �i. Under the alternative hypothesis the likelihoodof each gene i is maximized with an additional �
parameter (�shift branchi and �non-shift branch
i ) to allow forthe expression shift.
Testing for Deviations from a Constant ExpressionDivergence/Diversity Ratio
The EVE model can, as previously mentioned, beused to test for deviations from a constant ratio ofexpression to divergence ratio among genes, analogousto the HKA test often applied to test for selection atthe DNA level. Specifically, a likelihood ratio can beformed by comparing the likelihood under a null modelwhere � for all genes equals �shared (H0 :�i =�shared) tothe likelihood under the alternative model where �i is afree parameter (Ha :�i �=�shared). If the null hypothesisis rejected in a likelihood ratio test, we can concludethat �i for a particular gene varies significantly from�shared across the genes. A gene where �i <�shared hashigh expression variance between species as comparedto within, or high expression divergence. A genewhere �i >�shared has high-expression variance withinspecies as compared to between, or high expressiondiversity.
An implementation of the EVE model is availableas Supplementary Material on Dryad on Dryad athttp://dx.doi.org/10.5061/dryad.r122k.
Mammalian Expression Data and PhylogenyWe applied the EVE model to analyze a comparative
expression data set over 15 mammalian species with fourindividuals per species (except for armadillos with twoindividuals) which is described in full in Perry et al.(2012). Of the 15 species typed, five are anthropoids(common marmoset [mr], vervet [ve], rhesus macaque[mc], chimpanzee [ch], human [hu]), five are lemurs (aye-aye [ay], Coquerel’s sifaka [sf], black and white ruffedlemur [bw], mongoose lemur [mn], and crowned lemur[cr]), and the remaining five are more distantly relatedmammals (slow loris [sl], northern treeshrew [ts], housemouse [ms], nine-banded armadillo [ar], and gray short-tailed opossum [op]). Since many of these species areendangered and protected, most samples were collectedopportunistically within four hours of death. Liver tissuefrom each individual was typed using RNA-Seq andtranscriptomes were assembled with a robust de novotechnique that was verified on species with referencegenomes available (Perry et al. 2012). Expression levelswere normalized based on each individual, transcriptlength, GC content, and species (Bullard et al. 2010;Pickrell et al. 2010; Perry et al. 2012), as is appropriatefor comparative analysis so that genes are consideredequitably in relation to each other (Dunn et al. 2013).Here, we consider a subset of 675 genes with no missingdata across all species and individuals.
at University of C
alifornia, Berkeley on Septem
ber 9, 2015http://sysbio.oxfordjournals.org/
Dow
nloaded from
700 SYSTEMATIC BIOLOGY VOL. 64
)c)b0.
00.
20.
40.
60.
81.
0
average expr difference
pow
er
opossum
a)
0.0
0.2
0.4
0.6
0.8
1.0
average expr difference
pow
er
human
0 1 2 3 4 5 0 1 2 3 4 5
0.0
0.2
0.4
0.6
0.8
1.0
average expr difference
pow
er
anthropoid
0 1 2 3 4 5
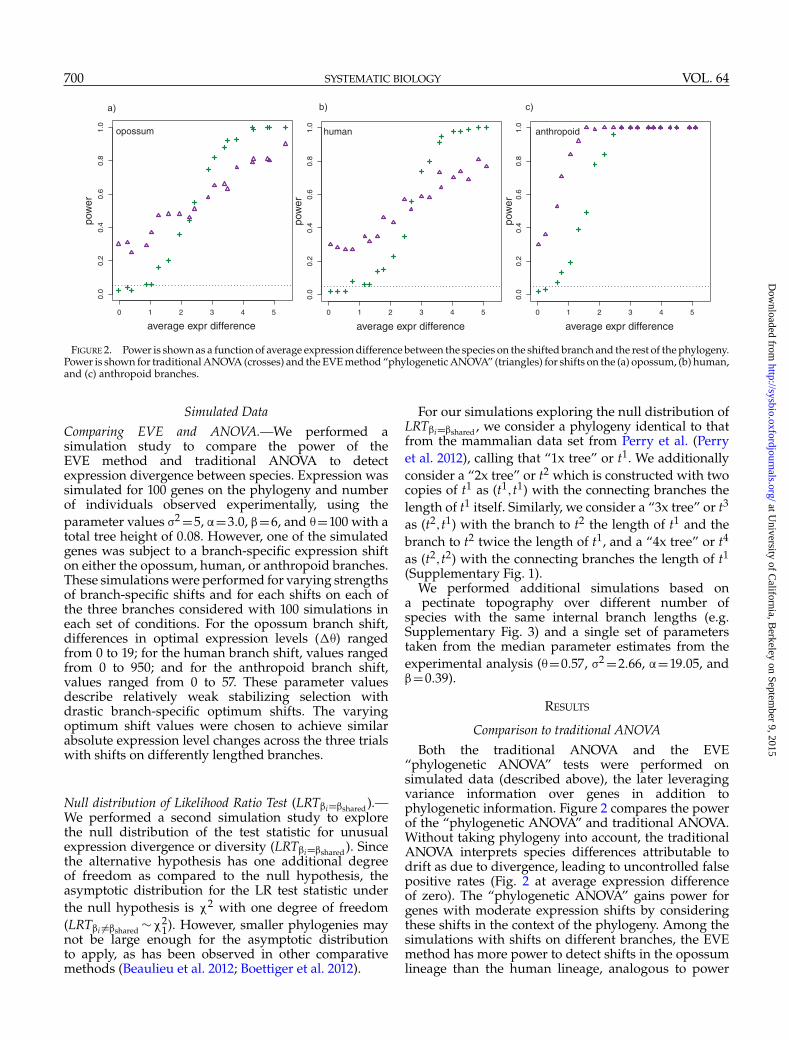
FIGURE 2. Power is shown as a function of average expression difference between the species on the shifted branch and the rest of the phylogeny.Power is shown for traditional ANOVA (crosses) and the EVE method “phylogenetic ANOVA” (triangles) for shifts on the (a) opossum, (b) human,and (c) anthropoid branches.
Simulated DataComparing EVE and ANOVA.—We performed asimulation study to compare the power of theEVE method and traditional ANOVA to detectexpression divergence between species. Expression wassimulated for 100 genes on the phylogeny and numberof individuals observed experimentally, using theparameter values �2 =5, �=3.0, �=6, and �=100 with atotal tree height of 0.08. However, one of the simulatedgenes was subject to a branch-specific expression shifton either the opossum, human, or anthropoid branches.These simulations were performed for varying strengthsof branch-specific shifts and for each shifts on each ofthe three branches considered with 100 simulations ineach set of conditions. For the opossum branch shift,differences in optimal expression levels (��) rangedfrom 0 to 19; for the human branch shift, values rangedfrom 0 to 950; and for the anthropoid branch shift,values ranged from 0 to 57. These parameter valuesdescribe relatively weak stabilizing selection withdrastic branch-specific optimum shifts. The varyingoptimum shift values were chosen to achieve similarabsolute expression level changes across the three trialswith shifts on differently lengthed branches.
Null distribution of Likelihood Ratio Test (LRT�i=�shared ).—We performed a second simulation study to explorethe null distribution of the test statistic for unusualexpression divergence or diversity (LRT�i=�shared ). Sincethe alternative hypothesis has one additional degreeof freedom as compared to the null hypothesis, theasymptotic distribution for the LR test statistic underthe null hypothesis is �2 with one degree of freedom(LRT�i �=�shared ∼�2
1). However, smaller phylogenies maynot be large enough for the asymptotic distributionto apply, as has been observed in other comparativemethods (Beaulieu et al. 2012; Boettiger et al. 2012).
For our simulations exploring the null distribution ofLRT�i=�shared , we consider a phylogeny identical to thatfrom the mammalian data set from Perry et al. (Perryet al. 2012), calling that “1x tree” or t1. We additionallyconsider a “2x tree” or t2 which is constructed with twocopies of t1 as (t1,t1) with the connecting branches thelength of t1 itself. Similarly, we consider a “3x tree” or t3
as (t2,t1) with the branch to t2 the length of t1 and thebranch to t2 twice the length of t1, and a “4x tree” or t4
as (t2,t2) with the connecting branches the length of t1
(Supplementary Fig. 1).We performed additional simulations based on
a pectinate topography over different number ofspecies with the same internal branch lengths (e.g.Supplementary Fig. 3) and a single set of parameterstaken from the median parameter estimates from theexperimental analysis (�=0.57, �2 =2.66, �=19.05, and�=0.39).
RESULTS
Comparison to traditional ANOVABoth the traditional ANOVA and the EVE
“phylogenetic ANOVA” tests were performed onsimulated data (described above), the later leveragingvariance information over genes in addition tophylogenetic information. Figure 2 compares the powerof the “phylogenetic ANOVA” and traditional ANOVA.Without taking phylogeny into account, the traditionalANOVA interprets species differences attributable todrift as due to divergence, leading to uncontrolled falsepositive rates (Fig. 2 at average expression differenceof zero). The “phylogenetic ANOVA” gains power forgenes with moderate expression shifts by consideringthese shifts in the context of the phylogeny. Among thesimulations with shifts on different branches, the EVEmethod has more power to detect shifts in the opossumlineage than the human lineage, analogous to power
at University of C
alifornia, Berkeley on Septem
ber 9, 2015http://sysbio.oxfordjournals.org/
Dow
nloaded from
2015 ROHLFS AND NIELSEN—IDENTIFYING ADAPTIVE AND PLASTIC GENE EXPRESSION 701
differences across branch lengths in sequence-basedtests for divergence (Yang and dos Reis 2011). With bothmethods, the shift on the anthropoid lineage, whichincludes five species, is more easily detected than thesingle species shifts.
Determining Significant Deviations of ExpressionDivergence/Diversity Ratio
Test expectation under the null hypothesis.—At theasymptotic limit, the likelihood ratio test statisticfor testing H0 :�i =�shared versus HA :�i �=�shared,LRT�i �=�shared , is �2
1 distributed under the null hypothesis.However, when applied to small phylogenies, thedistribution of LRT�i �=�shared may not be near theasymptotic limit, and may deviate from a �2
1 (e.g.,Boettiger et al. 2012) (see Supplementary Materials).To explore the null distribution of LRT�i �=�shared overdifferent parameter values and phylogeny sizes,we simulated data under the null hypothesis ofH0 :�i =�shared for four sets of parameter values(Supplementary Table 1) based on the median maximumlikelihood estimates from the experimental data, underfour tree sizes based on the mammalian phylogeny thatwe subsequently will analyze (Supplementary Fig. 1and Supplementary Materials).
While the null distribution resembles theasymptotically expected �2
1 for a phylogeny likethe one analyzed here, we observe some minordeviations (Supplementary Fig. 2). However, as thesize of the phylogeny considered increases, the nulldistribution approaches a �2
1, though it converges moreslowly under some parameter values. As in previousstudies examining parameter estimates over phylogenysize (Boettiger et al. 2012), we see that the parameterestimates improve with phylogeny height and numberof tips, though some are more easily estimable thanothers (Supplementary Figs 5–10). Yet, note that for theset of expression values simulated under a low � value(set 3), the evolutionary variance is very high and is notsaturated in the phylogeny lengths explored here. In thiscase, the phylogenies with longer branches investigatedallow more time for expression levels to vary morewidely, making parameter and likelihood estimationless accurate. This is a case where the null distributionof LRT�i=�shared is far from the asymptotic expectation.
We performed further simulations based on apectinate phylogeny for different numbers of species(Supplementary Figs 3, 11). Again, we see that as thephylogeny size increases, the simulated null distributionmore closely matches the asymptotic expectation. It isimportant to note that the null distribution under apectinate topology more quickly approaches �2
1 than theother topology because there are more varying branchlengths between species in a pectinate phylogeny. Traitevolution methods are powered by multiple varyingbranch length differences between species, making apectinate phylogeny the most informative.
Parametric bootstrap approach for the null distribution.—To account for deviations from the asymptoticallyexpected null distributions of LRT�i �=�shared , we followthe suggestion of Beaulieu et al. (2012) and usea parametric bootstrap. That is, for a particulargene, we simulate expression profiles based on themaximum likelihood parameter estimates under thenull hypothesis. These simulated expression profiles arethen tested for deviation from the null hypothesis todetermine the parametric bootstrapped null distributionof LRT�i �=�shared ,to which the experimental result can becompared.
We performed a parametric bootstrap analysis with100 simulations for each of the genes simulated underthe null hypothesis described above. For each gene,we compared the original test statistic (LRT�i �=�shared ) tothe distribution created by these additional simulationsto determine the parametric bootstrapped P-value.The resulting bootstrapped P-values are approximatelyuniformly distributed between 0 and 1 (SupplementaryFig. 13) as expected. Note that these bootstrappedP-values describe the departure from the null for eachgene individually; a correction for multiple tests mustbe included when considering P-values across genes.Further, note that the bootstrap approach assumesindependence between genes, which, while statisticallyconvenient, could cause inaccuracy when expressionis highly correlated between genes. Generally, theparametric bootstrap approach is most effective foraccurate parameter estimates; in the presence of biasedestimates and a dependence of the distribution of thelikelihood ratio test statistics on parameter values, theparametric bootstrap approach can be biased. It is,therefore, worthwhile to test the parametric bootstrapbefore interpreting results based on it.
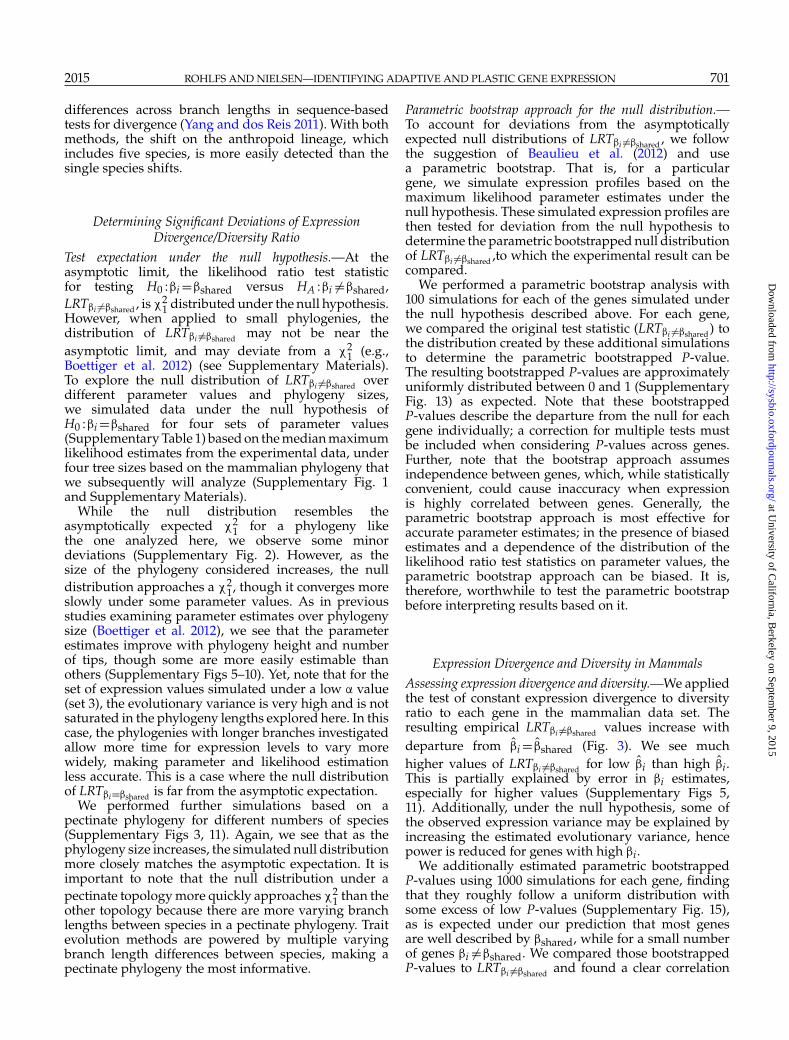
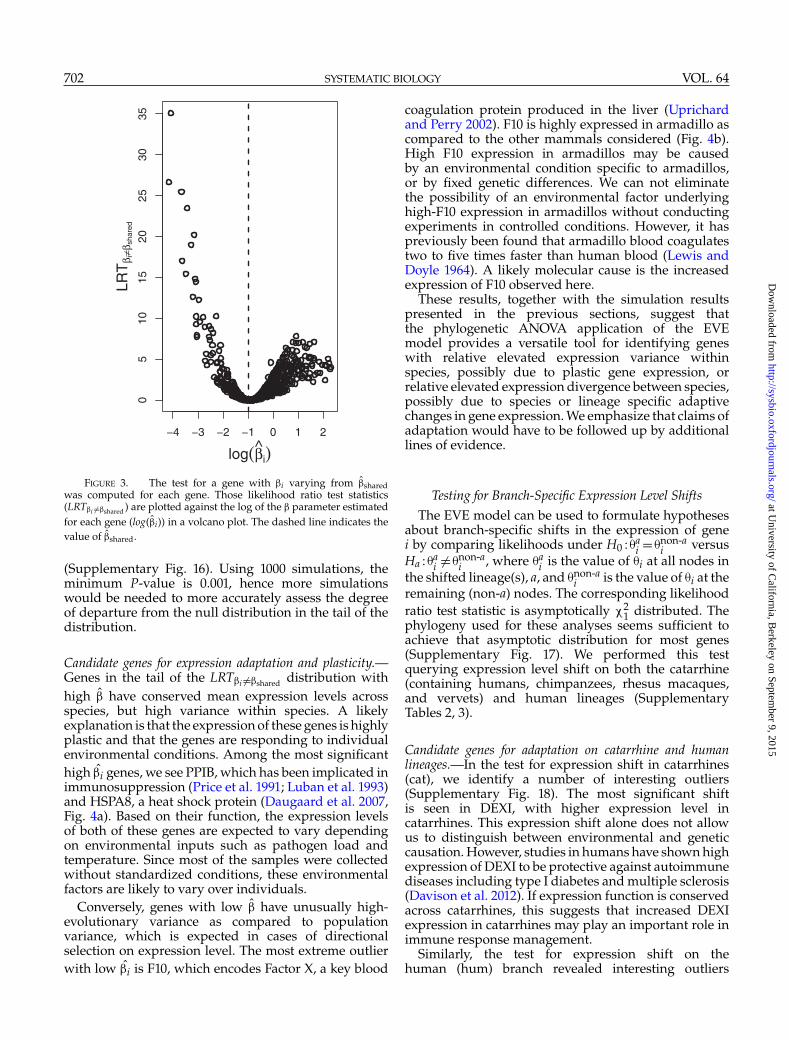
Expression Divergence and Diversity in MammalsAssessing expression divergence and diversity.—We appliedthe test of constant expression divergence to diversityratio to each gene in the mammalian data set. Theresulting empirical LRT�i �=�shared values increase withdeparture from �̂i = �̂shared (Fig. 3). We see muchhigher values of LRT�i �=�shared for low �̂i than high �̂i.This is partially explained by error in �i estimates,especially for higher values (Supplementary Figs 5,11). Additionally, under the null hypothesis, some ofthe observed expression variance may be explained byincreasing the estimated evolutionary variance, hencepower is reduced for genes with high �i.
We additionally estimated parametric bootstrappedP-values using 1000 simulations for each gene, findingthat they roughly follow a uniform distribution withsome excess of low P-values (Supplementary Fig. 15),as is expected under our prediction that most genesare well described by �shared, while for a small numberof genes �i �=�shared. We compared those bootstrappedP-values to LRT�i �=�shared and found a clear correlation
at University of C
alifornia, Berkeley on Septem
ber 9, 2015http://sysbio.oxfordjournals.org/
Dow
nloaded from
702 SYSTEMATIC BIOLOGY VOL. 64
−4 −3 −2 −1 0 1 2
05
1015
2025
3035
log(β̂i)
LRT
β i≠β
shar
ed
FIGURE 3. The test for a gene with �i varying from �̂sharedwas computed for each gene. Those likelihood ratio test statistics(LRT�i �=�shared ) are plotted against the log of the � parameter estimatedfor each gene (log(�̂i)) in a volcano plot. The dashed line indicates thevalue of �̂shared.
(Supplementary Fig. 16). Using 1000 simulations, theminimum P-value is 0.001, hence more simulationswould be needed to more accurately assess the degreeof departure from the null distribution in the tail of thedistribution.
Candidate genes for expression adaptation and plasticity.—Genes in the tail of the LRT�i �=�shared distribution withhigh �̂ have conserved mean expression levels acrossspecies, but high variance within species. A likelyexplanation is that the expression of these genes is highlyplastic and that the genes are responding to individualenvironmental conditions. Among the most significanthigh �̂i genes, we see PPIB, which has been implicated inimmunosuppression (Price et al. 1991; Luban et al. 1993)and HSPA8, a heat shock protein (Daugaard et al. 2007,Fig. 4a). Based on their function, the expression levelsof both of these genes are expected to vary dependingon environmental inputs such as pathogen load andtemperature. Since most of the samples were collectedwithout standardized conditions, these environmentalfactors are likely to vary over individuals.
Conversely, genes with low �̂ have unusually high-evolutionary variance as compared to populationvariance, which is expected in cases of directionalselection on expression level. The most extreme outlierwith low �̂i is F10, which encodes Factor X, a key blood
coagulation protein produced in the liver (Uprichardand Perry 2002). F10 is highly expressed in armadillo ascompared to the other mammals considered (Fig. 4b).High F10 expression in armadillos may be causedby an environmental condition specific to armadillos,or by fixed genetic differences. We can not eliminatethe possibility of an environmental factor underlyinghigh-F10 expression in armadillos without conductingexperiments in controlled conditions. However, it haspreviously been found that armadillo blood coagulatestwo to five times faster than human blood (Lewis andDoyle 1964). A likely molecular cause is the increasedexpression of F10 observed here.
These results, together with the simulation resultspresented in the previous sections, suggest thatthe phylogenetic ANOVA application of the EVEmodel provides a versatile tool for identifying geneswith relative elevated expression variance withinspecies, possibly due to plastic gene expression, orrelative elevated expression divergence between species,possibly due to species or lineage specific adaptivechanges in gene expression. We emphasize that claims ofadaptation would have to be followed up by additionallines of evidence.
Testing for Branch-Specific Expression Level ShiftsThe EVE model can be used to formulate hypotheses
about branch-specific shifts in the expression of genei by comparing likelihoods under H0 :�a
i =�non-ai versus
Ha :�ai �=�non-a
i , where �ai is the value of �i at all nodes in
the shifted lineage(s), a, and �non-ai is the value of �i at the
remaining (non-a) nodes. The corresponding likelihoodratio test statistic is asymptotically �2
1 distributed. Thephylogeny used for these analyses seems sufficient toachieve that asymptotic distribution for most genes(Supplementary Fig. 17). We performed this testquerying expression level shift on both the catarrhine(containing humans, chimpanzees, rhesus macaques,and vervets) and human lineages (SupplementaryTables 2, 3).
Candidate genes for adaptation on catarrhine and humanlineages.—In the test for expression shift in catarrhines(cat), we identify a number of interesting outliers(Supplementary Fig. 18). The most significant shiftis seen in DEXI, with higher expression level incatarrhines. This expression shift alone does not allowus to distinguish between environmental and geneticcausation. However, studies in humans have shown highexpression of DEXI to be protective against autoimmunediseases including type I diabetes and multiple sclerosis(Davison et al. 2012). If expression function is conservedacross catarrhines, this suggests that increased DEXIexpression in catarrhines may play an important role inimmune response management.
Similarly, the test for expression shift on thehuman (hum) branch revealed interesting outliers
at University of C
alifornia, Berkeley on Septem
ber 9, 2015http://sysbio.oxfordjournals.org/
Dow
nloaded from

2015 ROHLFS AND NIELSEN—IDENTIFYING ADAPTIVE AND PLASTIC GENE EXPRESSION 703
op ar ms ts cr mn bw sf ay sl mr ve mc ch hu
02
46
810
1214
F10: LRTβi≠βshared = 35.1
expr
essi
on
op ar ms ts cr mn bw sf ay sl mr ve mc ch hu
010
2030
4050
PPDPF: LRTβi≠βshared = 26.6
op ar ms ts cr mn bw sf ay sl mr ve mc ch hu
0.2
0.4
0.6
0.8
1.0
1.2
NARS: LRTβi≠βshared = 25.5
species species species
24
68
PPIB: LRTβi≠βshared = 7.8
12
34
56
HSPA8: LRTβi≠βshared = 7.1
op ar ms ts cr mn bw sf ay sl mr ve mc ch hu
05
1015
2025
3035
SOD1: LRTβi≠βshared = 7.1
op ar ms ts cr mn bw sf ay sl mr ve mc ch huop ar ms ts cr mn bw sf ay sl mr ve mc ch huspecies species species
expression
a)
b)
FIGURE 4. Each plot shows the expression profile across the 15 species for gene in the extreme tails of the empirical distribution of the teststatistic for a gene-specific �i differing from �shared (LRT�i �=�shared ). a) shows genes with high-�̂i values. b) shows genes with low-�̂i values.
(Supplementary Table 3), notably, two genes linkedto fat metabolism or obesity. In the extreme tail ofthe distribution, we detected human-specific increasedexpression of MGAT1, which aids in metabolism offatty acids to triglycerides (Yen et al. 2002), and theexpression of which has been associated with excessretention of lipids (Lee et al. 2012). Additionally, wesee that TBCA, a tubulin cofactor which assists in thefolding of �-tubulin (Tian et al. 1996), has increasedexpression in humans. Given that reduced expressionof TBCA through a heterozygous deletion has beenassociated with childhood obesity in humans (Glessneret al. 2010), it is possible that the human-specific increasein TBCA expression assists in metabolism of a high-fat diet. However, in both cases, it is unclear if theincreased expression in humans is an evolutionary shiftin expression, helping to adapt to a diet more richin fat, or if the increased expression in humans isenvironmentally responding to the diet. Expression levelstudies can only distinguish between these alternativesif the environmental conditions have been controlledbetween study objects, which for humans is only possiblewith cell line studies. Nonetheless, this new observationof human-specific regulatory changes for genes involvedin fatty acid metabolism is interesting in light of thecorresponding changes diet in humans.
Another gene with a significant expression shiftin humans is BCKDK. BCKDK inactivates the
branched-chain ketoacid dehydrogenase (BCKD)complex, which catalyzes metabolism of branched-chain amino acids (BCAAs). Nonsense and frame shiftmutations in BCKDK have recently been linked to lowlevels of BCAAs and a phenotype including autismand epilepsy (Novarino et al. 2012). The observedincreased human BCKDK expression may slow themetabolism of BCAAs, hence they can be processedinto neurotransmitters (Novarino et al. 2012). Again,whether this shift has an adaptive genetic basis, or is aplastic response to human-specific conditions remainsunclear.
Comparing results using the EVE model and SM model.—We compared our results for the expression shift tests tothose reported in an analysis of the same data by Perryet al. (2012) using the SM model described by Bedfordand Hartl (2009). The distributions of LRT�cat
i �=�non-cati
andLRT�hum
i �=�non-humi
from that analysis deviate substantially
from the �21 distribution expected under the null
hypothesis (Supplementary Fig. 20). This could be due toa number of possible numerical, optimization, or book-keeping errors, as these methods require a number ofimportant technical considerations. In a comparison ofthe rank of expression shift test statistics as computedby Perry et al. (2012) and as computed using the EVEmodel, we see a general lack of correlation with some
at University of C
alifornia, Berkeley on Septem
ber 9, 2015http://sysbio.oxfordjournals.org/
Dow
nloaded from

704 SYSTEMATIC BIOLOGY VOL. 64
0 5 10 15
02
46
810
human
species mean Xθhum≠θnon−hum
β m
odel
LR
Tθ h
um≠θ
non −
hum
0 5 10 15 20
05
1015
20
catarrhine
species mean Xθcat≠θnon−cat
β m
odel
LR
Tθ c
at≠θ
non−
cat
a)
b)
FIGURE 5. Each plot shows (a) LRT�cat
i �=�non−cati
and (b)LRT
�humi �=�non−hum
icalculated using the EVE model (y-axes) and SM
model (x-axes) as implemented in this analysis. The line indicates x=y.
similarity in the extreme outliers discussed in that paper(Supplementary Fig. 21).
To investigate if the results in Perry et al. (2012)were due to numerical problems we re-implementedthe method and compared our results with thosepreviously published by Perry et al. (2012). In ourimplementation, we see that the empirical distributionof test statistics are approximately �2
1 distributed withsome excess of high values (Supplementary Fig. 22) anda much improved correlation to EVE model test statistics(Fig. 5), suggesting that the strong deviations for a �2
1distribution in the Perry et al. (2012) results are largelydue to numerical or optimization errors.
We then proceeded to compare the new results underthe SM model to the results of the EVE model. Whileboth models identify similar genes with branch-specific�i shifts, we see much higher correlation between modelsfor a shift on the catarrhine lineage than on the humanlineage (Fig. 5). Since the SM model ignores variationwithin species, it may identify genes where the meanexpression appears to have shifted, even if the degree ofvariance may make that shift seem less extreme. By the
same token, the EVE method may identify genes with ashift that cannot be explained by the expected withinspecies variance. This difference is most pronouncedwhen considering shift of a single species (such ashumans) where considering variance within that singlespecies may alter the perception of an expression shift.
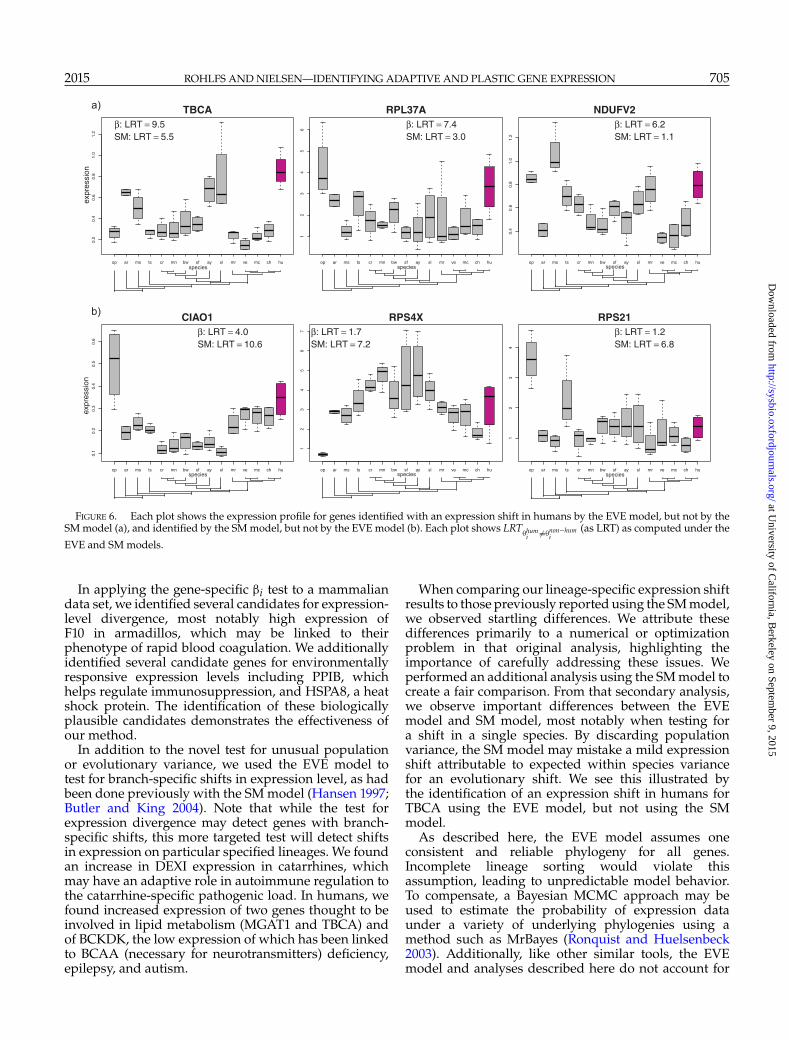
Figure 6 shows the three genes with the biggestdifference in value of LRT�hum
i �=�non-humi
between the EVEand SM models, that is, the genes that are most clearlyidentified by one model, while missed by the other.The gene TBCA, discussed above as a candidate fordiet-associated expression adaptation, is a clear outlierunder the EVE model (LRT�hum
TBCA �=�non-humTBCA
=9.5), but is lesseasily identified using the SM model (LRT�hum
TBCA �=�non-humTBCA
=5.5). These results illustrate the importance of includingwithin-species variance in the analyses of expressiondata evolution.
DISCUSSION
We have described the EVE model for gene expressionevolution which parameterizes the ratio betweenpopulation and evolutionary variance in terms of aparameter � so that, in addition to more classic tests forselection on gene expression level, hypotheses regardingdiversity to divergence ratios can be tested. We haveexplored a test for gene-specific �i, showing that thenull distribution of the test statistic LRT�i �=�shared isasymptotically �2
1, though depending on the size ofthe data set and the value of the parameters, the nulldistribution may not have converged to the asymptote.We show that in these cases, a parametric bootstrapapproach can be used to more accurately assess thesignificance of LRT�i �=�shared values. Since the parametricbootstrap may be sensitive to variance in parameterestimates, it is prudent to verify its effectiveness on aparticular data set with simulations before using it tointerpret data.
The test for gene-specific �i can be thought of as aphylogenetic ANOVA, or as a gene expression analogto the HKA test. This enables a previously unavailableline of inquiry into gene expression divergence, whichmay be indicative of expression-level adaptation todifferent environmental factors between species, andgene expression diversity, which may be indicative ofplastic expression levels responding to environmentalconditions. By utilizing a comparative approach, we candistinguish between genes which have high variancein expression levels within a species simply becauseexpression of this gene has little effect on fitness,so is subject to drift, and genes with functionalconserved expression levels across species along withhigh-expression variance within species because thegene mediates a plastic response to the environment.We have shown that by accounting for phylogeny ourmethod has substantially improved power and reducedfalse positive rate as compared to traditional ANOVA,analogous to other results (Martins et al. 2002).
at University of C
alifornia, Berkeley on Septem
ber 9, 2015http://sysbio.oxfordjournals.org/
Dow
nloaded from
2015 ROHLFS AND NIELSEN—IDENTIFYING ADAPTIVE AND PLASTIC GENE EXPRESSION 705
op ar ms ts cr mn bw sf ay sl mr ve mc ch hu
0.2
0.4
0.6
0.8
1.0
1.2
TBCAβ: LRT = 9.5SM: LRT = 5.5
op ar ms ts cr mn bw sf ay sl mr ve mc ch hu
12
34
56
RPL37Aβ: LRT = 7.4SM: LRT = 3.0
op ar ms ts cr mn bw sf ay sl mr ve mc ch hu
0.4
0.6
0.8
1.0
1.2
NDUFV2β: LRT = 6.2SM: LRT = 1.1
op ar ms ts cr mn bw sf ay sl mr ve mc ch hu
0.1
0.2
0.3
0.4
0.5
0.6
CIAO1β: LRT = 4.0SM: LRT = 10.6
op ar ms ts cr mn bw sf ay sl mr ve mc ch hu
12
34
56
7
RPS4Xβ: LRT = 1.7SM: LRT = 7.2
op ar ms ts cr mn bw sf ay sl mr ve mc ch hu
12
34
RPS21β: LRT = 1.2SM: LRT = 6.8
species species species
speciesspeciesspecies
expr
essi
onex
pres
sion
a)
b)
FIGURE 6. Each plot shows the expression profile for genes identified with an expression shift in humans by the EVE model, but not by theSM model (a), and identified by the SM model, but not by the EVE model (b). Each plot shows LRT
�humi �=�non−hum
i(as LRT) as computed under the
EVE and SM models.
In applying the gene-specific �i test to a mammaliandata set, we identified several candidates for expression-level divergence, most notably high expression ofF10 in armadillos, which may be linked to theirphenotype of rapid blood coagulation. We additionallyidentified several candidate genes for environmentallyresponsive expression levels including PPIB, whichhelps regulate immunosuppression, and HSPA8, a heatshock protein. The identification of these biologicallyplausible candidates demonstrates the effectiveness ofour method.
In addition to the novel test for unusual populationor evolutionary variance, we used the EVE model totest for branch-specific shifts in expression level, as hadbeen done previously with the SM model (Hansen 1997;Butler and King 2004). Note that while the test forexpression divergence may detect genes with branch-specific shifts, this more targeted test will detect shiftsin expression on particular specified lineages. We foundan increase in DEXI expression in catarrhines, whichmay have an adaptive role in autoimmune regulation tothe catarrhine-specific pathogenic load. In humans, wefound increased expression of two genes thought to beinvolved in lipid metabolism (MGAT1 and TBCA) andof BCKDK, the low expression of which has been linkedto BCAA (necessary for neurotransmitters) deficiency,epilepsy, and autism.
When comparing our lineage-specific expression shiftresults to those previously reported using the SM model,we observed startling differences. We attribute thesedifferences primarily to a numerical or optimizationproblem in that original analysis, highlighting theimportance of carefully addressing these issues. Weperformed an additional analysis using the SM model tocreate a fair comparison. From that secondary analysis,we observe important differences between the EVEmodel and SM model, most notably when testing fora shift in a single species. By discarding populationvariance, the SM model may mistake a mild expressionshift attributable to expected within species variancefor an evolutionary shift. We see this illustrated bythe identification of an expression shift in humans forTBCA using the EVE model, but not using the SMmodel.
As described here, the EVE model assumes oneconsistent and reliable phylogeny for all genes.Incomplete lineage sorting would violate thisassumption, leading to unpredictable model behavior.To compensate, a Bayesian MCMC approach may beused to estimate the probability of expression dataunder a variety of underlying phylogenies using amethod such as MrBayes (Ronquist and Huelsenbeck2003). Additionally, like other similar tools, the EVEmodel and analyses described here do not account for
at University of C
alifornia, Berkeley on Septem
ber 9, 2015http://sysbio.oxfordjournals.org/
Dow
nloaded from
706 SYSTEMATIC BIOLOGY VOL. 64
expression correlations between genes, but rather, treateach gene independently. Gene expression data maybe better described using a more complex multivariateapproach (Dunn et al. 2013). Another important caveatis that while the EVE model is well suited to detectadaptive divergence or plasticity of expression, thisdoes not rule out increases in plasticity or canalizationas part of the adaptive process (Lewontin 1974; Lande1976).
The analyses described here provide examplesof how the EVE model can be parameterized totest for expression divergence, diversity, or branch-specific shift. The tests for expression divergence anddiversity can be used to identify genes with expressionsubject to different types of selection. For phylogenieswhere some species are known to be adapted todifferent environmental conditions, the branch-specificexpression shift test can be formulated to identifygenes with changes in expression that putativelyunderlie that adaptation. By changing parameterconstraints, the EVE model can be used to test avariety of additional hypotheses. For example, testsmay be formulated for branch-specific � values, whichmay be expected under branch-specific tightening orrelaxation of constraint, or under unusual branch-specific demographic processes. The EVE model couldalso be used to test hypotheses of gene class-specific(rather than gene-specific) � values, which may varybased on gene class function. For example, genesinvolved in stress response may have a higher � valuethan housekeeping genes.
Like all comparative expression methods, the EVEmethod applies to any heritable quantitative trait withenvironmental components, including metabolomics(Nicholson and Lindon 2008; Cui et al. 2008; Sreekumaret al. 2009) and genome-wide methylation (Pokholoket al. 2005; Pomraning et al. 2009). As larger expressionand other quantitative trait comparative data setsemerge, the versatile EVE model and frameworkdescribed here will facilitate a wide variety ofsophisticated analyses.
SUPPLEMENTARY MATERIAL
Data available from the Dryad Digital Repository:http://dx.doi.org/10.5061/dryad.r122k.
ACKNOWLEDGMENTS
We are immensely grateful to the individuals whoseRNA samples were used in this study, without whichnone of this work would be possible. We thank GeorgePerry and colleagues for making their data and resultsavailable and for assisting us in their interpretation,Youna Hu, Josh Schraiber, Tyler Linderoth, Julien Roux,Joe Felsenstein, Luke Harmon, Frank Anderson, andtwo anonymous reviewers for their valuable discussionson these topics, and Alex Safron for his help drawingschematics.
FUNDING
This work was supported in part by National Institutesof Health grant [2R14003229-07], and National ScienceFoundation award 1103767. The funders had no role instudy design, data collection and analysis, decision topublish, or preparation of the manuscript.
REFERENCES
Ackermann R. R., Cheverud J.M. 2002. Discerning evolutionaryprocesses in patterns of tamarin (genus saguinus) craniofacialvariation. Am. J. Phys. Anthropol. 3:260–271.
Beaulieu J., Jhwueng D.-C., Boettiger C., O’Meara B. 2012. Modelingstabilizing selection: Expanding the Ornstein-Uhlenbeck model ofadaptive evolution. Evolution 66:2369–2383.
Bedford T., Hartl, D. 2009. Optimization of gene expression by naturalselection. Proc. Natl Acad. Sci. USA 106:1133–1138.
Boettiger C., Coop G., Ralph P. 2012. Is your phylogeny informative?Measuring the power of comparative methods. Evolution66:2240–2251.
Brawand D., Soumillon M., Necsulea A., Julien P., Csrdi G., Harrigan P.,Weier M., Liechti A., Aximu-Petri A., Kircher M., Albert F., Zeller U.,Khaitovich P., Grtzner F., Bergmann S., Nielsen R., Pääbo S.,Kaessmann H. 2011. The evolution of gene expression levels inmammalian organs. Nature 478:343–348.
Brent R. 1973. An algorithm with guaranteed convergence forfinding a zero of a function. In B. Dejon and P. Henrici, editors.Algorithms for minimization without derivatives. Englewood Cliffs (NJ):Prentice-Hall.
Broyden C. 1970. The convergence of a class of double-rankminimization algorithms. J. Inst. Math. Appl. 6:76–90.
Bullard J., Purdom E., Hansen K., Dudoit S. 2010. Evaluation ofstatistical methods for normalization and differential expression inmRNA-Seq experiments. BMC Bioinformatics 11:94.
Butler M., King A. 2004. Phylogenetic comparative analysis: a modelingapproach for adaptive evolution. Am. Nat. 164:683–695.
Butler M., Schoener T., Losos, J. 2000. The relationship between sexualsize dimorphism and habitat use in greater antillean anolis lizards.Evolution 54:259–272.
Cui Q., Lewis I.A., Hegeman A.D., Anderson M.E., Li J., Schulte C.F.,Westler W.M., Eghbalnia H.R., Sussman M.R., Markley J.L. 2008.Metabolite identification via the madison metabolomics consortiumdatabase. Nature Biotechnol. 26:162–164.
Daugaard M., Rohde M., Jäättelä M. 2007. The heat shock protein 70family: Highly homologous proteins with overlapping and distinctfunctions. FEBS Lett. 581:3702–3710.
Davison L.J., Wallace C., Cooper J.D., Cope N.F., Wilson N.K.,Smyth D.J., Howson J.M., Saleh N., Al-Jeffery A., Angus K.L.,Stevens H.E., Nutland S., Duley S., Coulson R.M., Walker N.M.,Burren O.S., Rice C.M., Cambien F., Zeller T., Munzel T., Lackner K.,Blankenberg S., Fraser P., Gottgens B., Todd J.A. 2012. Long-rangeDNA looping and gene expression analyses identify DEXI as anautoimmune disease candidate gene. Hum. Mol. Genet. 21:322–333.
Dunn C.W., Luo X., Wu Z. 2013. Phylogenetic analysis of geneexpression. Integr. Comp. Biol. 53:847–856.
Felsenstein J. 1985. Phylogenies and the comparative method. Am. Nat.125:1–15.
Felsenstein J. 1988. Phylogenies and quantitative characters. Annu. Rev.Ecol. Syst. 19:445–471.
Felsenstein J. 2008. Comparative methods with sampling error andwithin-species variation: contrasts revisited and revised. Am. Nat.171:713–725.
Fletcher R. 1970. A new approach to variable metric algorithms.Comput. J. 13:317–322.
Fraser H. 2011. Genome-wide approaches to the study of adaptive geneexpression evolution. Bioessays 33:469–477.
Garamszegi L., ed. 2014. Modern phylogenetic comparative methodsand their application in evolutionary biology. 4th ed. New York:Springer.
at University of C
alifornia, Berkeley on Septem
ber 9, 2015http://sysbio.oxfordjournals.org/
Dow
nloaded from

2015 ROHLFS AND NIELSEN—IDENTIFYING ADAPTIVE AND PLASTIC GENE EXPRESSION 707
Garland T., Dickerman A., Janis C., Jones J. 1993. Phylogeneticanalysis of covariance by computer simulation. Syst. Biol. 42:265–292.
Gilad Y., Oshlack A., Smyth G., Speed T., White K. 2006a.Expression profiling in primates reveals a rapid evolution of humantranscription factors. Nature 440:242–245.
Gilad Y., Oshlack A., Rifkin S. 2006b. Natural selection on geneexpression. Trends Genet. 22: 456–461.
Glessner J.T., Bradfield J.P., Wang K., Takahashi N., Zhang H.,Sleiman P.M., Mentch F.D., Kim C.E., Hou C., Thomas K.A.,Garris M.L., Deliard S., Frackelton E.C., Otieno F.G., Zhao J.,Chiavacci R.M., Li M., Buxbaum J.D., Berkowitz R.I.,Hakonarson H., Grant S.F. 2010. A genome-wide study reveals copynumber variants exclusive to childhood obesity cases. Am. J. Hum.Genet. 87:661–666.
Goldfarb D. 1970. A family of variable metric updates derived byvariational means. Math. Comput. 24:23–26.
Grafen A. 1989. The phylogenetic regression. Philos. T. Roy. Soc. B.326:119–157.
Gu X. 2004. Statistical framework for phylogenomic analysis of genefamily expression profiles. Genetics 167:531–542.
Hansen T. 1997. Stabilizing selection and the comparative analysis ofadaptation. Evolution 51:1341–1351.
Hansen T., Bartoszek K. 2012. Interpreting the evolutionaryregressions: the interplay between observational and biologicalerrors in phylogenetic comparative studies. Syst. Biol. 61:413–425.
Hansen T., Pienaar J., Orzack S. 2008. A comparative methodfor studying adaptation to a randomly evolving environment.Evolution 62:1965–1977.
Hansen T.F. 2012. Adaptive landscapes and macroevolutionarydynamics. In E. Svensson and R. Calsbeek, editors, The adaptivelandscape in evolutionary biology, Oxford, UK: Oxford UniversityPress. pp. 205–226.
Harmon L.J., Losos J.B. 2005. The effect of intraspecific sample sizeon type I and type II error rates in comparative studies. Evolution59:2705–2710.
Harmon L.J., Weir J.T., Brock C.D., Glor R.E., Challenger W. 2008.GEIGER: Investigating evolutionary radiations. Bioinformatics24:129–131.
Housworth E., Martins E., Lynch, M. 2004. The phylogenetic mixedmodel. Am. Nat. 163:84–96.
Hudson R., Kreitman M., Aguadé M. 1987. A test of neutral molecularevolution based on nucleotide data. Genetics 116:153–159.
Idaghdour Y., Czika W., Shianna K., Lee S., Visscher P., Martin H.,Miclaus K., Jadallah S., Goldstein D., Wolfinger R., Gibson G.2010. Geographical genomics of human leukocyte gene expressionvariation in southern morocco. Nature Genet. 42:62–67.
Ives A., Midford P., Garland T. 2007. Within-species variation andmeasurement error in phylogenetic comparative methods. Syst.Biol. 56:252–270.
Kalinka A., Varga K., Gerrard D., Preibisch S., Corcoran D., JarrellsJ., Ohler U., Bergman C., Tomancak P. 2010. Gene expressiondivergence recapitulates the developmental hourglass model.Nature 468:811–816.
Khaitovich P., Kelso J., Franz H., Visagie J., Giger T., Joerchel S.,Petzold E., Green R.E., Lachmann M., Pääbo S. 2006. Functionality ofintergenic transcription: an evolutionary comparison. PLoS Genet.2:e171.
Lande R. 1976. Natural selection and random genetic drift inphenotypic evolution. Evolution 30:314–334.
Lande R. 1979. Quantitative genetic analysis of multivariate evolution,applied to brain: body size allometry. Evolution 33:402–416.
Lande R., Arnold S.J. 1983. Measurement of selection on correlatedcharacters. Evolution 37:1210–1226.
Larribe F., Fearnhead P. 2011. On composite likelihoods in statisticalgenetics. Stat. Sinica 21:43–69.
Lee Y., Ko E., Kim J., Kim E., Lee H., Choi H., Yu J., Kim H.,Seong J., Kim K., Kim J. 2012. Nuclear receptor PPAR-regulatedmonoacylglycerol O-acyltransferase 1 (MGAT1) expression isresponsible for the lipid accumulation in diet-induced hepaticsteatosis. Proc. Natl Acad. Sci. USA 109:13656–13661.
Lewis J.H., Doyle A.P. 1964. Coagulation, protein and cellular studieson armadillo blood. Comp. Biochem. Phys. 12:61–66.
Lewontin R. 1974. The analysis of variance and the analysis of causes.Am. J. Hum. Genet. 26:400–411.
Luban J., Bossolt K L., Franke E.K., Kalpana G.V., Goff S.P. 1993. Humanimmunodeficiency virus type 1 Gag protein binds to cyclophilins Aand B. Cell 73:1067–1078.
Lynch M. 1991. Methods for the analysis of comparative data inevolutionary biology. Evolution 45:1065–1080.
Marroig G., Cheverud J.M. 2004. Did natural selection or genetic driftproduce the cranial diversification of neotropical monkeys? Am.Nat. 163:417–428.
Martins E., Diniz-Filho J., Housworth E. 2002. Adaptive constraints andthe phylogenetic comparative method: a computer simulation test.Evolution 56:1–13.
Martins E., Hansen T. 1997. Phylogenies and the comparative method:a general approach to incorporating phylogenetic information intothe analysis of interspecific data. Am. Nat. 149:646–667.
Martins E.P., Lamont J. 1998. Estimating ancestral states of acommunicative display: a comparative study of cyclura rockiguanas. Anim. Behav. 55:1685–1706.
Necsulea A., Soumillon M., Warnefors M., Liechti A., Daish T., ZellerU., Baker J. C., Grutzner F., Kaessmann H. 2014. The evolution oflncRNA repertoires and expression patterns in tetrapods. Nature505:635–640.
Nicholson J., Lindon J. 2008. Systems biology: metabolomics. Nature455:1054–1065.
Nielsen R. 2005. Molecular signatures of natural selection. Ann. Rev.Genet. 39:197–218.
Novarino G., El-Fishawy P., Kayserili H., Meguid N.A., Scott E.M.,Schroth J., Silhavy J.L., Kara M., Khalil R.O., Ben-Omran T., Ercan-Sencicek A.G., Hashish A.F., Sanders S.J., Gupta A.R., Hashem H.S.,Matern D., Gabriel S., Sweetman L., Rahimi Y., Harris R.A.,State M.W., Gleeson J.G. 2012. Mutations in BCKD-kinase leadto a potentially treatable form of autism with epilepsy. Science338:394–397.
Nuzhdin S., Wayne M., Harmon K., McIntyre L. 2004. Common patternof evolution of gene expression level and protein sequence inDrosophila. Mole. Biol. Evol. 21:1308–1317.
Oakley T., Gu Z., Abouheif E., Patel N., Li W. 2005. Comparativemethods for the analysis of gene-expression evolution: anexample of using yeast functional genomic data. Mol. Biol. Evol.22:40–50.
O’Meara B.C., Ané C., Sanderson M.J., Wainwright P.C. 2006. Testingfor different rates of continuous trait evolution using likelihood.Evolution 60:922–933.
Pagel M. 1999. Inferring the historical patterns of biological evolution.Nature 401:887–884.
Perry G., Melsted P., Marioni J., Wang Y., Bainer R., Pickrell J., MicheliniK., Zehr S., Yoder A., Stephens M., Pritchard J., Gilad Y. 2012.Comparative RNA sequencing reveals substantial genetic variationin endagered primates. Genome Res. 22:602–610.
Pickrell J., Marioni J., Pai A., Degner J., Engelhardt B., NkadoriE., Veyrieras J.-B., Stephens M., Gilad Y., Pritchard J. 2010.Understanding mechanisms underlying human gene expressionvariation with RNA sequencing. Nature 464:768–772.
Pokholok D.K., Harbison C.T., Levine S., Cole M., Hannett N.M.,Lee T.I., Bell G.W., Walker K., Rolfe P.A., Herbolsheimer E.,Zeitlinger J., Lewitter F., Gifford D.K., Young R.A. 2005. Genome-wide map of nucleosome acetylation and methylation in yeast. Cell122:517–527.
Pomraning K.R., Smith K.M., Freitag M. 2009. Genome-wide highthroughput analysis of DNA methylation in eukaryotes. Methods47:142–150.
Price E.R., Zydowsky L.D., Jin M.J., Baker C.H., McKeon F.D., WalshC.T. 1991. Human cyclophilin B: A second cyclophilin gene encodesa peptidyl-prolyl isomerase with a signal sequence. Proc. Natl Acad.Sci. USA 88:1903–1907.
Revell L.J. 2012. Phytools: an R package for phylogenetic comparativebiology (and other things). Methods Ecol. Evol. 3:217–223.
Revell L.J., Harmon L.J., Collar D.C. 2008. Phylogenetic signal,evolutionary process, and rate. Syst. Biol. 57:591–601.
Rohlf F.J. 2001. Comparative methods for the analysis ofcontinuous variables: geometric interpretations. Evolution 55:2143–2160.
at University of C
alifornia, Berkeley on Septem
ber 9, 2015http://sysbio.oxfordjournals.org/
Dow
nloaded from

708 SYSTEMATIC BIOLOGY VOL. 64
Rohlfs R., Harrigan P., Nielsen R. 2014. Modeling gene expressionevolution with an extended Ornstein-Uhlenbeck process accountingfor within-species variation. Mol. Biol. Evol. 31:201–211.
Ronquist F., Huelsenbeck J.P. 2003. MrBayes 3: Bayesian phylogeneticinference under mixed models. Bioinformatics 19:1572–1574.
Schraiber J., Mostovoy Y., Hsu T., Brem R. 2013. Inferring evolutionaryhistories of pathway regulation from transcriptional profiling data.PLoS Comput. Biol. 9:e1003255.
Shanno D. 1970. Conditioning of quasi-newton methods for functionminimization. Math. Comput. 24:647–656.
Sreekumar A., Poisson L.M., Rajendiran T.M., Khan A.P., Cao Q., Yu J.,Laxman B., Mehra R., Lonigro R.J., Li Y., Nyati M.K., Ahsan A.,Kalyana-Sundaram S., Han B., Cao X., Byun J., Omenn G.S., GhoshD., Pennathur S., Alexander D.C., Berger A., Shuster J.R., Wei J.T.,Varambally S., Beecher C., Chinnaiyan A.M. 2009. Metabolomic
profiles delineate potential role for sarcosine in prostate cancerprogression. Nature 457:910–914.
Tian G., Huang Y., Rommelaere H., Vandekerckhove J., Ampe C.,Cowan N.J. 1996. Pathway leading to correctly folded �-tubulin. Cell86:287–296.
Uprichard J., Perry D.J. 2002. Factor X deficiency. Blood Rev.16:97–110.
Whitehead A., Crawford D. 2006. Variation within and amongspecies in gene expression: Raw material for evolution. Mol. Ecol.15:1197–1211.
Yang Z., dos Reis M. 2011. Statistical properties of the branch-site testof positive selection. Mol. Biol. Evol. 28:1217–1228.
Yen C.-L.E., Stone S.J., Cases S., Zhou P., Farese R.V. 2002. Identificationof a gene encoding MGAT1, a monoacylglycerol acyltransferase.Proc. Natl Acad. Sci. 99:8512–8517.
at University of C
alifornia, Berkeley on Septem
ber 9, 2015http://sysbio.oxfordjournals.org/
Dow
nloaded from