phthalocyanines: photochemical ... our foreign collaborators, dr. fethi bedioui and dr. sophie...
TRANSCRIPT

PHTHALOCYANINES: PHOTOCHEMICAL,
ELECTROCHEMICAL AND BIOMIMETIC CATALYTIC
BEHAVIOUR
A thesis submitted in fulfillment of the requirements for the
degree of
DOCTOR OF PHILOSOPHY
of
RHODES UNIVERSITY
by
Nthapo Sehlotho
February 2007

ii
Dedications
To all who are interested in the study of; what things are made of,
why things happen and how they happen.

iii
Acknowledgements
My greatest heartfelt gratitude goes to God, my creator. His presence and
love have sustained me through the valleys, storms and winds of research and
writing up this thesis.
I thank my supervisor Professor Tebello Nyokong for selflessly giving of
her knowledge, time and guidance. Prof, working under your supervision has
moulded me into a scientist I am today. I thank you for the travel opportunities
you have given me; there is a saying that the world is like a book, if one does not
travel, it is like reading the first page. I am not on page one, thanks to you.
To our foreign collaborators, Dr. Fethi Bedioui and Dr. Sophie Griveau at
Laboratoire de Pharmacologie Chimique et Génétique, Ecole Nationale
Supérieure de Chimie de Paris, Paris, France, I thank you for having me in your
institution and sharing your expertise with me. I also thank Professor José Zagal
at Facultad de Quimica y Biologia, Universidad de Santiago de Chile, Casilla 40,
Correo 33, Santiago, Chile for his invaluable contribution to the collaboration.
I thank Rhodes University chemistry department for giving me the
opportunity to study and also tutor undergraduate students. To my fellow
researchers in lab S22, I thank you for being a family away from home.
A great thank you goes to my sponsors, the government of Lesotho, NRF,
CCETSA and Egide (France).
Lastly, I thank my family and friends for their love and support.
iv
Abstract
This thesis explored use of metallophthalocyanines as electrocatalysts
towards thiol and thiocyanate oxidation, nitrosothiol decomposition and reduction
of oxygen, as well as biomimetic and photo-catalysts of cyclohexene oxidation. 2-
mercaptoethanol (2-ME), L-cysteine (CYS) and reduced glutathione (GSH) thiols
were oxidized on cobalt tetra ethoxythiophene and cobalt tetra phenoxy pyrrole
phthalocyanine modified glassy carbon electrodes, whose catalytic activity was
found to depend on pH, film thickness and method of electrode modification.
Oxidation of thiocyanate (SCN-), CYS and 2-ME was catalyzed by a self-
assembled monolayer of cobalt tetraethoxythiophene Thiocyanate oxidation
occurred via two electron transfer, whereas that of CYS and 2-ME required 1
electron. The oxidations of SCN- and 2-ME were catalyzed by ring based
processes, while CYS was catalyzed by both CoIII/CoII process and ring-based
processes.
Oxidation of GSH and 2-ME was conducted on screen printed graphite
electrodes modified with cobalt phthalocyanine. Activity depended on method of
electrode modification and CoPc % composition. Decomposition of S-
nitrosoglutathione occurred in the presence of copper ions and NaBH4. Reduced
and oxidized glutathione were detected as products using cobalt phthalocyanine
adsorbed on an ordinary pyrolytic graphite electrode.
Reduction of oxygen was electro-catalyzed by adsorbed manganese
phthalocyanine complexes on glassy carbon electrodes. FePc, FePc(Cl)16, CoPc
v
and CoPc substituted with phenoxypyrrole and ethoxythiophene ligands were
also used as electro-catalysts. Oxygen reduction occurred via two electron
transfer in acidic and neutral media forming hydrogen peroxide, while water was
formed in basic media via four electron transfer.
Cyclohexene oxidation using tert-butylhydroperoxide or chloroperoxy
benzoic acid as oxidants in the presence of FePc, FePc(Cl)16 and CoPc formed
cyclohexene oxide, 2-cyclohexen-1-ol, 2- cyclohexen-1-one and adipic acid.
Product selectivity depended on the nature of catalyst and oxidant. The
FePc(Cl)16 catalyst was transformed into a µ-oxo dimer during the oxidation
process while MIIIPc intermediates were formed with CoIIPc and FeIIPc catalysts.
Cyclohexene photooxidation catalyzed by zinc phthalocyanine using either
red or white light formed 2-cyclohexen-1-one, 2-cyclohexen-1-ol, trans-
cyclohexane diol, cyclohexene oxide and cyclohexene hydroperoxide via singlet
oxygen and radical mechanisms. Product yields depended on the light
wavelength and intensity, solvent, irradiation time and the rate of photo-
degradation of the catalyst.
vi
List of contents
Title page i
Dedications ii
Acknowledgements iii
Abstract iv
List of contents vi
List of abbreviations x
List of symbols xii
List of figures xiv
List of tables xxiii
List of schemes xxv
1. Introduction 1
1.1 Phthalocyanines 2
1.1.1 Background of phthalocyanines 2
1.1.2 Spectroscopic characterization of phthalocyanines 5
1.1.3 Electrochemistry of phthalocyanines 8
1.2 Background on electrochemical methods 10
1.2.1 Voltammetry 13
1.2.2 Mass transport 17
1.2.3 Hydrodynamic systems 18
List of contents
vii
1.2.3.1 Rotating disc electrode 19
1.2.3.2 Kinetics of electrode reactions 23
1.2.3.3 The transfer coefficient, α 24
1.2.3.4 Reaction order 26
1.3 Electro-catalysis 27
1.3.1 Use of metallophthalocyanines in electro-catalysis 27
1.3.2 Electrode modification 30
1.3.3 Characterization of modified electrodes 36
1.4 Overview of studied analytes 38
1.4.1 Electrocatalysis of thiocyanate oxidation 40
1.4.2 Electrocatalysis of thiol oxidation 43
1.4.3 Decomposition of nitrosothiols 47
1.4.4 Electrocatalysis of oxygen reduction 49
1.5 Use of metallophthalocyanines in biomimetic catalysis 55
1.6 Use of metallophthalocyanines in photo-catalysis 59
1.7 General aims of thesis 65
2. Experimental 66
2.1 Materials 67
2.2 Apparatus 68
2.3 Electrochemical methods 71
2.3.1 Electrode preparation 72
2.3.2 Electrode modification and characterization 75
List of contents
viii
2.3.2.1 Monomer adsorption 75
2.3.2.2 Electro-polymerization/deposition 76
2.3.2.3 Self-assembled monolayers 76
2.3.3 Electro-catalysis 77
2.4 Biomimetic catalysis 79
2.5 Photo catalysis 80
2.6 Syntheses 82
2.6.1 Iron (II) hexadecachlorophthalocyanine, FePc(Cl)16 83
2.6.2 Zinc phthalocyanine, ZnPc 83
2.6.3 Manganese tetrapentoxy pyrrole phthalocyanine 84
3. Electrocatalysis 88
3.1 Thiol oxidation 90
3.1.1 Adsorbed CoPc complexes 6b and 6c 90
3.1.2 Electro-deposited CoPc complexes 6b and 6c 106
3.1.3 Self-assembled monolayers 111
3.1.3.1 Characterization of SAM 111
3.1.3.2 L-cysteine oxidation on CoTEThPc-SAM 117
3.1.3.3 2-Mercaptoethanol oxidation on CoTEThPc-SAM 125
3.1.4 Screen printed carbon electrodes 128
3.2 Decomposition of S-nitrosoglutathione 141
3.3 Thiocyanate oxidation 146
List of contents
ix
3.4 Oxygen reduction 153
3.4.1 Characterization of new MnTPePyrPc, complex 7c 155
3.4.2 Characterization of adsorbed MnPc complexes 157
3.4.3 Oxygen reduction on MnPc complexes 163
3.4.4 Oxygen reduction on CoPc and FePc complexes 169
3.4.4.1 Characterization of adsorbed MPc complexes 170
3.4.4.2 Oxygen reduction 172
3.4.5 Mechanism of oxygen reduction 180
4. Biomimetic catalysis 193
4.1 Oxidation of cyclohexene 195
4.2 Fate of the catalysts 204
5. Photocatalysis 212
5.1. Photo-oxidation of cyclohexene 214
5.2. Solvent effects 222
5.3. Fate of the ZnPc catalyst 225
5.4. Singlet oxygen versus radical mechanisms 226
6. Conclusions 231
7. References 237
x
List of abbreviations
BAS BioAnalytical systems
CE Counter electrode
CME Chemically modified electrodes
CPBA Chloroperoxybenzoic acid
CV Cyclic voltammetry
DABCO Diazabicyclooctane
DBU 1,8-diazabicyclo[5.4.0] undec-7-ene
DCM Dichloromethane
DMF Dimethylformamide
DMSO Deuterated dimethylsulfoxide
DPBF 1,3-diphenylisobenzofuran
GC Gas chromatography
GCE Glassy carbon electrode
GC-MS Gas chromatography-mass spectrometry
HOMO Highest occupied molecular orbital
HRP Horseradish peroxidase
IR Infrared
LMCT Ligand-to-metal charge transfer
LOP Lacto-peroxidase
LSV Linear sweep voltammetry
LUMO Lowest unoccupied molecular orbital
MLCT Metal-to-ligand charge transfer
MPc Metallophthalocyanine 3MPc* Excited triplet state of MPc
MPc-SAM Metallophthalocyanine-Self-assembled monolayer
NHE Normal hydrogen electrode
NMR Nuclear magnetic resonance
OPGE Ordinary pyrolytic graphite electrode
P Porphyrin
xii
List of symbols
α Fraction of light absorbed/electron transfer coefficient
A Absorbance/ ampere/ electrode area/ activity
b Tafel slope
C Coulomb/concentration
δ Layer thickness
D Diffusion coefficient
ε Extinction coefficient
E Potential
Eo Standard potential
Eo’ Formal potential
Epa Anodic peak potential
Epc Cathodic peak potential
φ Quantum yield
φP Singlet oxygen quantum yield
φ∆ Photobleaching quantum yield
F Faraday’s constant
f rotations per minute
γ Activity coefficient
η Overpotential
Ipa Anodic peak current
Ipc Cathodic peak current
k rate constant
K Kelvin
λ Wavelength
m Reaction order
m/z Mass to charge ratio
mV Millivolts
n Number of electrons
List of Symbols
xiii
nα Number of electrons in rate-determining step
NA Avogadro’s number
O2(3Σg) Triplet state oxygen
O2(1∆g) Singlet state oxygen
π Pi-bonding
π* Pi anti-bonding
Q Electrical charge
Γ Surface coverage/concentration
Γibf Ion barrier factor
r Radius of electrode
R Gas constant
t Time
T Temperature
v Scan rate/ velocity/ kinematic viscosity/ wavenumber
V Volts
ω Angular rotation rate
∆E Change in potential
xiv
List of figures
Figure 1.1: Molecular structures of 1) porphyrin (P) and 2) phthalocyanine (Pc).
Figure 1.2: Molecular orbitals involved in major absorption transitions, orbital
order adapted from Gouterman.
Figure 1.3: Typical UV/Vis spectra of a) metal-free and b) metalled
phthalocyanines.
Figure 1.4: Electron transfer at a metallic electrode. Potential applied to Fermi
level facilitates a) reduction and b) oxidation.
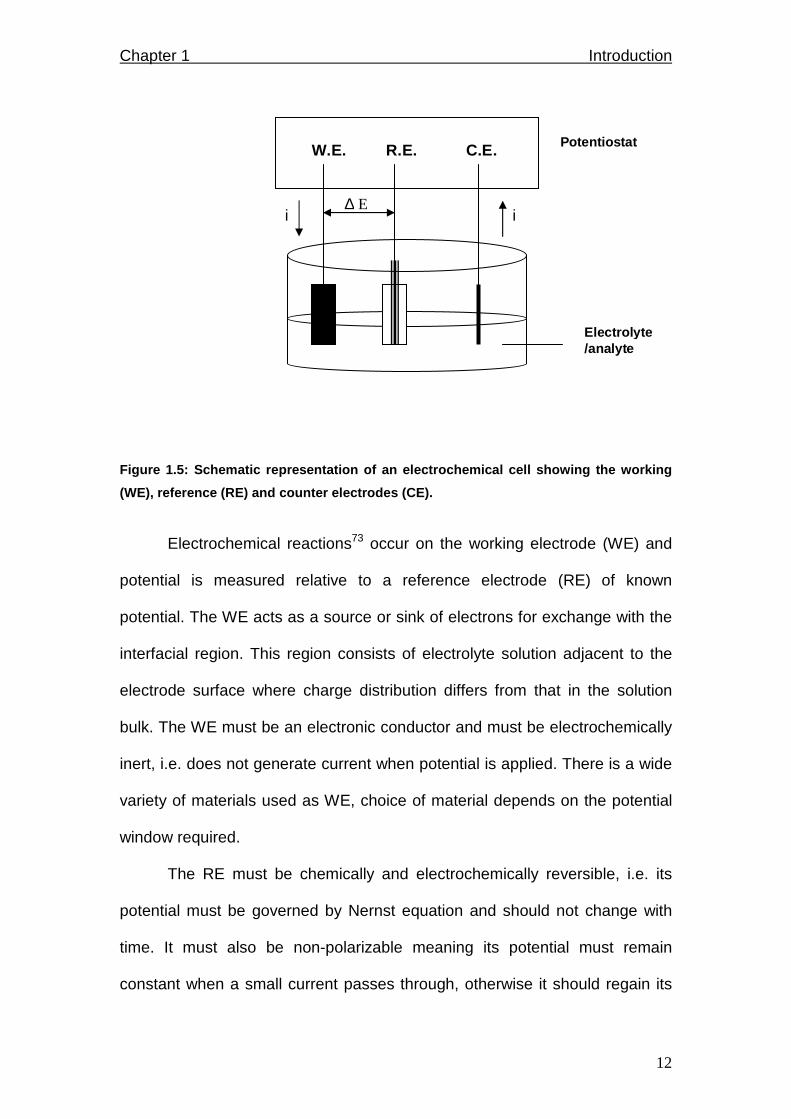
Figure 1.5: Schematic representation of an electrochemical cell showing the
working (WE), reference (RE) and counter electrodes (CE).
Figure 1.6: A typical cyclic voltammogram of a reduction-oxidation reaction.
Figure 1.7: Streamlines for a rotating disc electrode.
Figure 1.8: Rotating disc electrode voltammogram of an irreversible cathodic
reaction.
Figure 1.9: Energy profiles for different values of charge transfer coefficients.
Figure 1.10: A schematic representation of an electro-catalytic reaction.
Figure 1.11: Structure of planes of an ordinary pyrolytic graphite.
List of figures
xv
Figure 1.12: a) Umbrella, b) octopus and c) vertical orientations of MPc-SAMs.
Figure 1.13: Electro-polymerization of NiTPhPyrPc in DMF and 0.1 M TBABF4 at
200 mV/s.
Figure 1.14: Molecular structures of electro-chemically studied analytes; 2-
mercaptoethanol, L-cysteine, reduced-glutathione and S-
nitrosoglutathione.
Figure 1.15: Molecular structures of phthalocyanine complexes used in electro-
catalytic oxidation of thiols and thiocyanate; CoPc, CoTPhPyrPc
and CoTEThPc.
Figure 1.16: Different configurations adopted by molecular oxygen upon
interaction with metal sites.
Figure 1.17: Molecular structures of phthalocyanine complexes used in electro-
catalytic reduction of oxygen; MnPc, MnTAPc, MnTPePyrPc,
MnTPhPyrPc, MnTMerPyPc and MnTEThPc.
Figure 1.18: Molecular structures of FePc and FePc(Cl)16 complexes used as
biomimetic catalysts for oxidation of cyclohexene.
Figure 1.19: Modified Jablonski diagram illustrating processes that occur when a
phthalocyanine molecule absorbs UV/Vis light.
List of figures
xvi
Figure 2.1: Photolysis setup used for zinc phthalocyanine photocatalyzed
oxidation of cyclohexene.
Figure 2.2: A laser flash photolysis set up.
Figure 2.3: Photographs and schematic representations of fabricated SPCEs
on alumina ceramic and Labtek platforms.
Figure 3.1: Molecular structures of phthalocyanine complexes used in electro-
catalytic oxidation of thiols and thiocyanate; CoPc, CoTPhPyrPc
and CoTEThPc.
Figure 3.2: Cyclic voltammograms of OPG electrodes modified by adsorption
of a) CoTPhPyrPc 6b and b) CoTEThPc 6c in 0.5 M NaOH.
Figure 3.3: Cyclic voltammograms of oxidation of a) 2-ME, b) CYS and c) GSH
on CoTEThPc 6c and B: CoTPhPyrPc 6b complexes adsorbed on
GCE in 0.5 M NaOH solution.
Figure 3.4. Cyclic voltammograms of catalytic oxidation of 2-ME by adsorbed
CoTEThPc 6c at varying concentrations. Insert is a variation of
current and concentration.
Figure 3.5. Cyclic voltammograms of oxidation of 2.5 mM 2-ME in a) 0.5 M
NaOH (pH~13) and b) PBS (pH = 7.2) solution catalyzed by
adsorbed CoTEThPc 6c complex. Scan rate = 100 mV/s.
Figure 3.6. RDEs of catalytic oxidation in 0.5 M NaOH solution catalyzed by
adsorbed CoTEThPc 6c. Inserts = Koutecky-Levich plots.
List of figures
xvii
Figure 3.7. Plots of, A. log I vs log C and B. 1/ω1/2 vs 1/I for 2-ME catalytic
oxidation on CoTEThPc 6c adsorbed on GCE.
Figure 3.8. Tafel plots of thiol oxidation catalyzed by adsorbed CoTEThPc 6c.
Figure 3.9: Electropolymerization of CoTPhPyrPc 6b on GCE in DMF and 0.1
M TBABF4 at 200 mV/s.
Figure 3.10: Cyclic voltammograms of 2.5 mM 2-ME oxidation on a) adsorbed
and b) electrodeposited 6c on GCE in 0.5 M NaOH at 100 mV/s.
Figure 3.11: Cyclic voltammograms of i) unmodified Au electrode and ii)
CoTEThPc-SAM in a) 0.01 M KOH, b)1 mM CuSO4 in 0.5 M H2SO4,
c) 1 mM Fe(NH4)(SO4)2 in 1 mM HClO4 and d) 1 mM Na2SO4 in pH
4 solution. Scan rate = 50 mV/s.
Figure 3.12: Cyclic voltammograms of CoTEThPc-SAM in pH 4 buffer solution
showing redox processes related to CoIII/II peaks. Scan rate = 50
mV/s. Insert is variation of CoIII/II peak current with scan rate.
Figure 3.13: Cyclic voltammograms of L-cysteine on i) bare Au and ii)
CoTEThPc-SAM in a) pH 4 and b) pH 1, 3 and 5 solutions. Scan
rate = 50 mV/s.
Figure 3.14: Pourbaix diagram for 1 mM L-cysteine on CoTEThPc-SAM.
Figure 3.15: UV-Vis spectral changes observed on addition of L-cysteine to
solutions of CoTEThPc in DMF.
Figure 3.16: Plot of square root of scan rate versus peak current for 1 mM L-
cysteine oxidation on CoTEThPc-SAM in pH 4.
List of figures
xviii
Figure 3.17: Cyclic voltammograms of 2-ME in pH 4 solution on CoTEThPc-
SAM.
Figure 3.18: Pourbaix diagram for 1 mM 2-mercaptoethanol on CoTEThPc-
SAM.
Figure 3.19: Cyclic voltammograms of 1 mM Fe(CN)63-/Fe(CN)6
4- in 0.1 M KCl
on i) bare SPCE and ii) 5 % CoPc-SPCE at 100 mV/s.
Figure 3.20. Cyclic voltammograms of a) 2 mM 2-ME and b) 0.01 M GSH in 0.1
M NaOH (pH~13) on 5 % CoPc-SPCE at 50 mV/s.
Figure 3.21: Cyclic voltammograms of a) 3 mM 2-ME and b) 0.01 M GSH in
PBS (pH = 7.4) on 5 % CoPc-SPCE at 50 mV/s.
Figure 3.22: a) Cyclic voltammograms of various concentrations of 2-ME in 0.1
M NaOH (pH ~ 13) on 5 % CoPc-SPCE at 50 mV/s. b) Variation of
concentration and peak current for 2-ME oxidation in 0.1 M NaOH
on 5 % CoPc-SPCE.
Figure 3.23: Cyclic voltammograms of 50 mM GSH at 1% CoPc-SPCE, 2.5%
CoPc-SPCE and 5% CoPc-SPCE in a) PBS (pH 7.4) and b) 0.1 M
NaOH aqueous solution.
Figure 3.24: Cyclic voltammograms of a) 10 mM GSH and b) 1 mM K4Fe(CN)6
in PBS (pH 7.4) at different 1% and 2.5% CoPc-SPCEs.
Figure 3.25: Cyclic voltammograms of a) 3 mM 2-ME and b) 1 mM K4Fe(CN)6 in
PBS (pH 7.4) at different 1% and 2.5% CoPc-SPCEs.
List of figures
xix
Figure 3.26: Cyclic voltammograms of CoPc adsorbed on OPG in PBS (pH 7.4)
at 50 mV/s.
Figure 3.27: Cyclic voltammograms of CoPc adsorbed on OPG in a) commercial
Dulbecco phosphate buffer saline (pH 7.4), in the presence of b) 5
mM glucose, c) 5 mM glucose + 10 µM Cu(NO3)2 and d) 5 mM
glucose + 10 µM Cu(NO3)2 + 1 mM GSH at 50 mV/s.
Figure 3.28: Cyclic voltammograms of CoPc adsorbed on OPG in a) aerobic
phosphate buffer (pH 7.4), in the presence of b)1 mM GSNO, c) 1
mM GSNO + 0.025 mM Cu(NO3)2 and d) after immediate addition
of 1 mM NaBH4 and e) 1 minute later curve at 50 mV/s.
Figure 3.29: Cyclic voltammograms of 1 mM thiocyanate in pH 4 solution on a)
bare Au and b) CoTEThPc-SAM. Scan rate = 50 mV/s.
Figure 3.30: Pourbaix diagram of 1 mM thiocyanate on CoTEThPc-SAM.
Figure 3.31: Plots of a) Ep versus log υ and b) log ip vs log [SCN-] for oxidation of
thiocyanate on CoTEThPc-SAM in pH 4.
Figure 3.32: UV-Vis spectral changes observed on addition of SCN- to solutions
of CoTEThPc in DMF.
Figure 3.33: Molecular structures of phthalocyanine complexes used in electro-
catalytic reduction of oxygen; MnPc, MnTAPc, MnTPePyrPc,
MnTPhPyrPc, MnTMerPyPc and MnTEThPc.
Figure 3.34: UV/Visible spectrum of MnTPePyrPc 7c in DMF.
List of figures
xx
Figure 3.35: Cyclic voltammograms in i) nitrogen-purged and ii) oxygen
saturated pH 5 buffer solutions of complexes 7a to 7f. Scan rate =
50 mV/s.
Figure 3.36: Pourbaix diagram for MnIII/II couple of complex 7c.
Figure 3.37: Cyclic voltammogram of 7c showing MnIII/II couple in pH 12 at scan
rates of 100 - 400 mV/s. Insert is a plot of peak current versus scan
rate.
Figure 3.38: Cyclic voltammograms of oxygen reduction in pH 12 for adsorbed
MnPc complexes a) 7a, 7b and 7e, b) 7c, 7d and 7f at 50 mV/s.
Figure 3.39: Plot of square root of scan rate versus peak current for oxygen
reduction on MnPc in pH 12.
Figure 3.40: Rotating disk electrode voltammograms of adsorbed MnPc
complexes in pH a) 5 and b) 12 oxygen saturated solutions.
Figure 3.41: Cyclic voltammograms in pH 7 buffer solution of glassy carbon
electrodes modified by adsorption of a) 6a and b) 8 at 50 mV/s.
Figure 3.42: Plots of Ip versus ν for MIII/II peak of a) CoPc and b) FePc adsorbed
on GCE in pH 7 buffer solution.
Figure 3.43: Cyclic voltammograms of oxygen reduction reaction in oxygen
saturated pH 7 buffer solutions on unmodified GCE, 6a, 6b, 6c, 8
and 9 modified electrodes at 50 mV/s.
Figure 3.44: Pourbaix diagram of oxygen reduction reaction electro-catalyzed by
complexes 6a, 6b, 6c, 8 and 9.
List of figures
xxi
Figure 3.45: Rotating disk electrode (RDE) voltammograms of oxygen reduction
in pH 12 on adsorbed MPc complexes.
Figure 3.46: Tafel slopes of oxygen reduction reaction electro-catalyzed by
complexes 6a, 6b, 6c, 8 and 9 in pH 12 buffer solutions.
Figure 3.47: UV/Visible spectra of complexes 7a, 7c to 7f in DMF.
Figure 3.48: UV/Visible spectra of complexes 6a, 6b, 6c and 9 in DMF.
Figure 4.1: Gas chromatograms for biomimetic oxidation of cyclohexene using
TBHP as an oxidant and FePc(Cl)16 as the catalyst.
Figure 4.2: Variation of product yield with time for i) 2-cyclohexen-1-one, ii) 2
cyclohexen-1-ol and iii) cyclohexene oxide.
Figure 4.3: Variation of product yield with substrate to oxidant molar ratios for i)
2-cyclohexen-1-one ii) 2-cyclohexen-1-ol and iii) cyclohexene
oxide.
Figure 4.4: Variation of product yield with the amount of catalyst for i) 2-
cyclohexen-1-one ii) 2-cyclohexen-1-ol and iii) cyclohexene oxide.
Figure 4.5: Effect of the nature of catalyst on the 2-cyclohexen-1-one product
yield for i) FePc(Cl)16 ii) FePc and iii) CoPc catalysts.
Figure 4.6: Absorption spectral changes observed on addition of 0.5 mol dm-3
TBHP oxidant to a reaction mixture of FePc(Cl)16 catalyst and
cyclohexene.
List of figures
xxii
Figure 4.7: Absorption spectral changes observed on addition of 0.5 mol dm-3
CPBA oxidant to a reaction mixture of FePc(Cl)16 catalyst and
cyclohexene.
Figure 4.8: Absorption spectral changes observed on addition of 0.5 moldm-3
TBHP oxidant to a reaction mixture of a) FePc and b) CoPc
catalysts and cyclohexene.
Figure 5.1: Gas chromatogram of cyclohexene oxidation photo-catalyzed by
ZnPc in 1,4-dioxane under white light irradiation.
Figure 5.2: Variation of 2-cyclohexen-1-one with time on photolysis with i) white
or ii) red light and in the presence of ZnPc photocatalyst.
Figure 5.3: Variation of product yield with time for i) 2-cyclohexen-1-one ii) 2-
cyclohexen-1-ol iii) trans-cyclohexanediol and iv) cyclohexene
oxide under white light irradiation.
Figure 5.4: Photodegradation of ZnPc in 1,4-dioxane with visible light.
Figure 5.5: A triplet absorption curve of ZnPc in THF.
Figure 5.6: Variation of absorbance of ZnPc catalyst with time upon white light
photolysis at various light intensities.
Figure 5.7: Kinetic curves for product formation from the ZnPc-photocatalyzed
oxidation of cyclohexene in 1,4-dioxane under white light irradiation
conditions in the presence of i) air, ii) nitrogen, iii) bubbled oxygen,
iv) DPBF and v) DABCO.
xxiii
List of tables
Table 1.1: Electrochemical data for electro-catalytic oxidation of thiocyanate
by self-assembled monolayers of metallophthalocyanines on gold
electrodes in pH 4 solutions.
Table 1.2: Electrochemical data for 2-mercaptoethanol, L-cysteine and
reduced glutathione oxidation.
Table 1.3: Electrochemical data for oxygen reduction catalyzed by MPcs.
Table 1.4: Data for cyclohexene epoxidation catalyzed by MPs and MPcs.
Table 1.5: Data for photocatalyzed oxidation of cyclohexene by metallo-
porphyrins.
Table 2.1: Electrodes and modifiers used for electrocatalysis of thiol &
thiocyanate oxidation and oxygen reduction.
Table 3.1: Catalytic efficiency of adsorbed CoTEThPc 6c and CoTPhPyrPc 6b
in terms of peak potentials Ep and currents Ip in 0.5 M NaOH.
Table 3.2: Electrochemical data for thiol oxidation in 0.5 M NaOH catalyzed by
complexes 6b and 6c.
Table 3.3: Catalytic current intensities of electrodeposited CoTEThPc 6c and
electro-polymerized CoTPhPyrPc 6b on glassy carbon electrode for
the electro-oxidation of 2-ME.

List of tables
xxiv
Table 3.4: Electrochemical data of thiol and thiocyanate oxidation on
electrodes modified by CoPc complexes.
Table 3.5: Catalytic factor (f) calculated for the oxidation of GSH and 2-ME in
neutral aqueous solution for different CoPc-SPCEs.
Table 3.6: Oxygen reduction data in pH 5 for complexes 7a - 7f adsorbed on
GCE.
Table 3.7: Oxygen reduction data for complexes 6a, 6b, 6c, 8 and 9 in pHs 2,
7 and 12.
Table 4.1. Product yields, selectivities and turnover numbers for the oxidation
of cyclohexene using TBHP oxidant and FePc(Cl)16 catalyst in a 3:7
DMF-CH2Cl2 solvent mixture.
Table 4.2: Product selectivities for cyclohexene oxidation using FePc(Cl)16 9,
FePc 8 and CoPc 6a catalysts and TBHP oxidant.
Table 5.1: Comparison of cyclohexene ZnPc-photocatalyzed oxidation product
yields in the various solvents at various light intensities with white
light irradiation.
xxv
List of schemes
Scheme 1.1: Examples of phthalocyanine synthetic routes.
Scheme 1.2: Type II mechanism of photo-catalysis.
Scheme 1.3: Type I mechanism of photo-catalysis.
Scheme 3.1: Thiol oxidation mechanism in alkaline media.
Scheme 3.2: Mechanism of L-cysteine oxidation in acidic media catalyzed by
CoIIIPc/CoIIPc redox couple.
Scheme 3.3: Mechanism of L-cysteine oxidation in acidic media catalyzed by
CoIIIPc-1 /CoIIIPc-2 redox couple.
Scheme 3.4: Thiocyanate oxidation mechanism in acidic media catalyzed by
CoIIIPc-1 /CoIIIPc-2 redox couple.
Scheme 3.5: Synthesis of MnTPePyrPc 7c.
Scheme 3.6: Oxygen adsorption onto an electrode.
Scheme 3.7: Mechanism of oxygen reduction catalyzed by MnPc complexes.
Scheme 3.8: Mechanism of oxygen reduction catalyzed by CoPc and FePc
complexes.
Scheme 4.1. The mechanism for FeIIPc(Cl)16 transformation during the catalytic
oxidation of cyclohexene.
List of schemes
xxvi
Scheme 4.2. Products formed from oxidation of cyclohexene by TBHP or CPBA
oxidants in the presence of FePc(Cl)16, CoPc or FePc catalysts.
Scheme 5.1: Type I mechanism of photo-catalysis.
Scheme 5.2. Hydrogen abstraction and formation of MPc radicals.
Scheme 5.3. Quenching of excited states by chlorinated solvents.
Scheme 5.4: Type II mechanism of photolysis.
Scheme 5.5: Degradation of MPc by singlet oxygen.
Scheme 5.6: Suggested mechanism for the formation of photolysis products.

Chapter 1
Introduction

Chapter 1 Introduction
2
1.1 Phthalocyanines
The main aim of the project is to use phthalocyanines (Pcs) as
catalysts, hence their properties will be discussed first.
1.1.1 Background of phthalocyanines
Phthalocyanines are conjugated, aromatic, symmetrical, macrocyclic
complexes with an 18 π electron system1. They contain four isoindole groups
which are linked by four nitrogen atoms. Unmetallated Pcs (2, Fig. 1.1) are
planar exhibiting D2h symmetry whereas their metallated counterparts exhibit
D4h symmetry. They are similar to naturally occurring porphyrins (1, Fig. 1.1);
but have extended conjugation engendered by benzene rings, hence have
improved chemical and thermal stability. Another set consisting of four
benzene rings can be fused onto the Pc ring yielding naphthalocyanines, then
subsequently anthralocyanines.
Phthalocyanines were discovered in the 1930’s and were used as blue
and blue-green pigments and dyes2. Over time, their properties have been
developed, these include semi-conductivity in the 1940’s3 and synthetic
modifications in the 1970’s4. Amongst their numerous applications, they are
now currently employed as photo-sensitizers in photodynamic therapy of
cancer (PDT)5,6, involved in linear7 and non-linear optics8, used as electro9,10
and biomimetic11,12 catalysts and as fluorescent agents13. They are also used
as thin, light-absorbing films to coat compact discs (CDs)14.

Chapter 1 Introduction
3
N
N H H N
N
NNN
N H
N
H N
NN
Porphyrin 1
Phthalocyanine 2
1
2
3
4
Figure 1.1: Molecular structures of 1) porphyrin (P ) and 2) phthalocyanine (Pc).
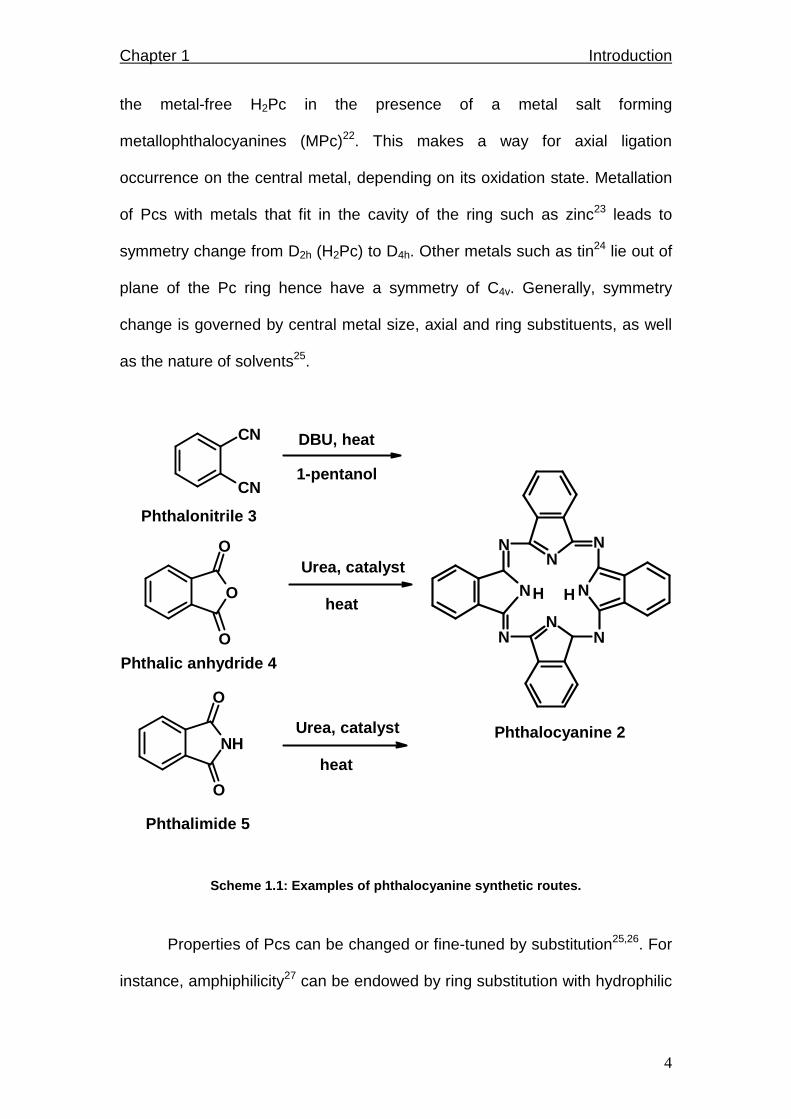
Pcs are synthesized by various methods (Scheme 1.1) and these
include cyclotetramerization of a) phthalonitriles 315, b) phthalic anhydrides 416
and c) phthalimides 517. Formation of Pcs from condensation of phthalonitriles
occurs upon heating in an appropriate high boiling solvent such as 1-pentanol
in the presence of an organic base such as 1,8-diazabicyclo[5.4.0]undec-7-
ene (DBU)18. Condensation of phthalic anhydrides 4 and phthalimides 5 to
form Pcs occurs in the presence of a nitrogen source such as urea and a
catalyst such as ammonium molybdate19. Unsubstituted Pcs have 16
hydrogen atoms on the ring which are ideal substitution sites. Substituents
can be introduced onto the precursors to afford ring substituted Pcs20. Ring
substitution occurs on peripheral (2 and 3) or non-peripheral positions (1 and
4) (see 2, Fig. 1.1 for numbering), depending on the initial substitution position
on the precursors.
Metallation in Pcs is afforded by performing precursor condensation
reactions in the presence of metal salts21. It can also be achieved by refluxing
Chapter 1 Introduction
4
the metal-free H2Pc in the presence of a metal salt forming
metallophthalocyanines (MPc)22. This makes a way for axial ligation
occurrence on the central metal, depending on its oxidation state. Metallation
of Pcs with metals that fit in the cavity of the ring such as zinc23 leads to
symmetry change from D2h (H2Pc) to D4h. Other metals such as tin24 lie out of
plane of the Pc ring hence have a symmetry of C4v. Generally, symmetry
change is governed by central metal size, axial and ring substituents, as well
as the nature of solvents25.
CN
CN
O
O
O
NH
O
O
NNN
N
N
N
NN
H H
Phthalonitrile 3
Phthalic anhydride 4
Phthalimide 5
DBU, heat
1-pentanol
Urea, catalyst
heat
Phthalocyanine 2Urea, catalyst
heat
Scheme 1.1: Examples of phthalocyanine synthetic ro utes.
Properties of Pcs can be changed or fine-tuned by substitution25,26. For
instance, amphiphilicity27 can be endowed by ring substitution with hydrophilic
Chapter 1 Introduction
5
and hydrophobic groups. In addition, substitution eliminates aggregation28,
which is basically Pc-Pc stacking. Axial and ring substituents create steric
hinderance hence the bulkier the ligands, the more pronounced the effect.
Substitution also makes way for making complex structures such as
porphyrin-phthalocyanine conjugates29. Substituents can also coordinate to
form µ-oxo dimers30, sandwich-type dimers31, polymers32 or long chain Pc
complexes33. Moreover, substitution facilitates chromatographic analysis
because of varying polarity34. Symmetry of the Pc may be altered by
substitution due to geometric perturbations35.
1.1.2 Spectroscopic characterization of phthalocyan ines
Pcs make colourful solutions, depending on the solvent, central metal
and substituents on the ring. They exhibit strong absorption in the red region
of the electromagnetic spectrum with extinction coefficients36,37 greater than
105 L mol-1 cm-1. The peak positions vary depending on the nature of the Pc.
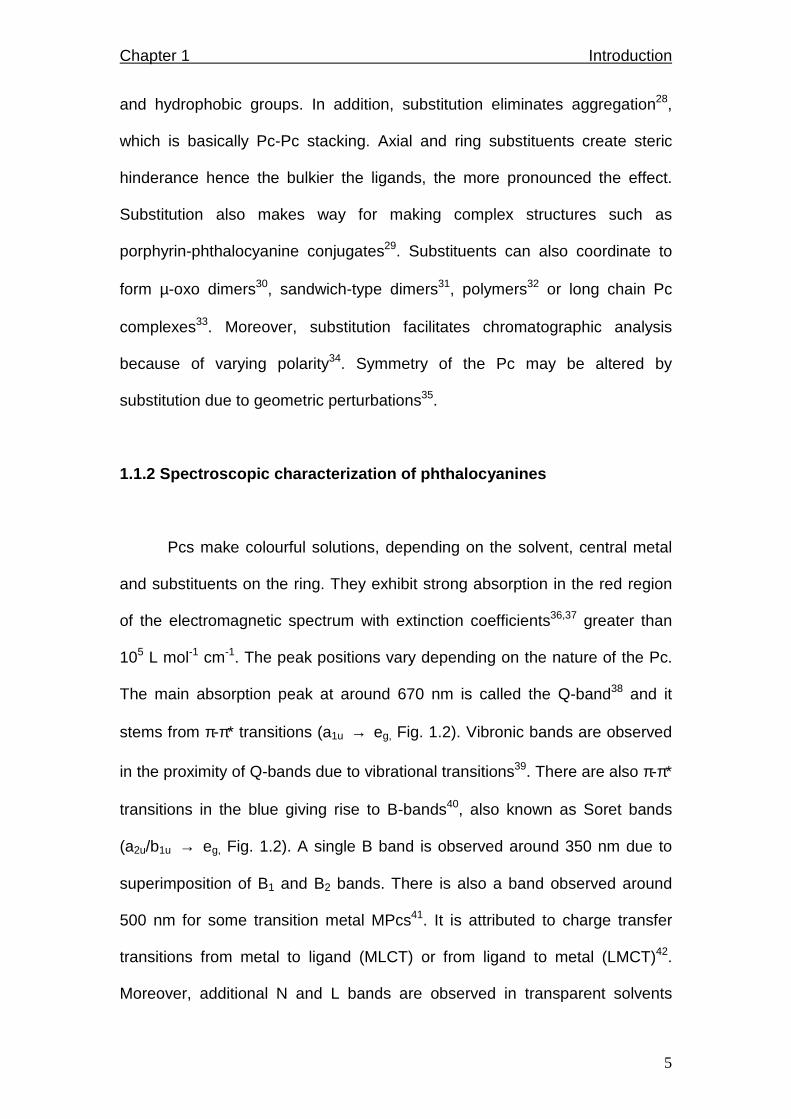
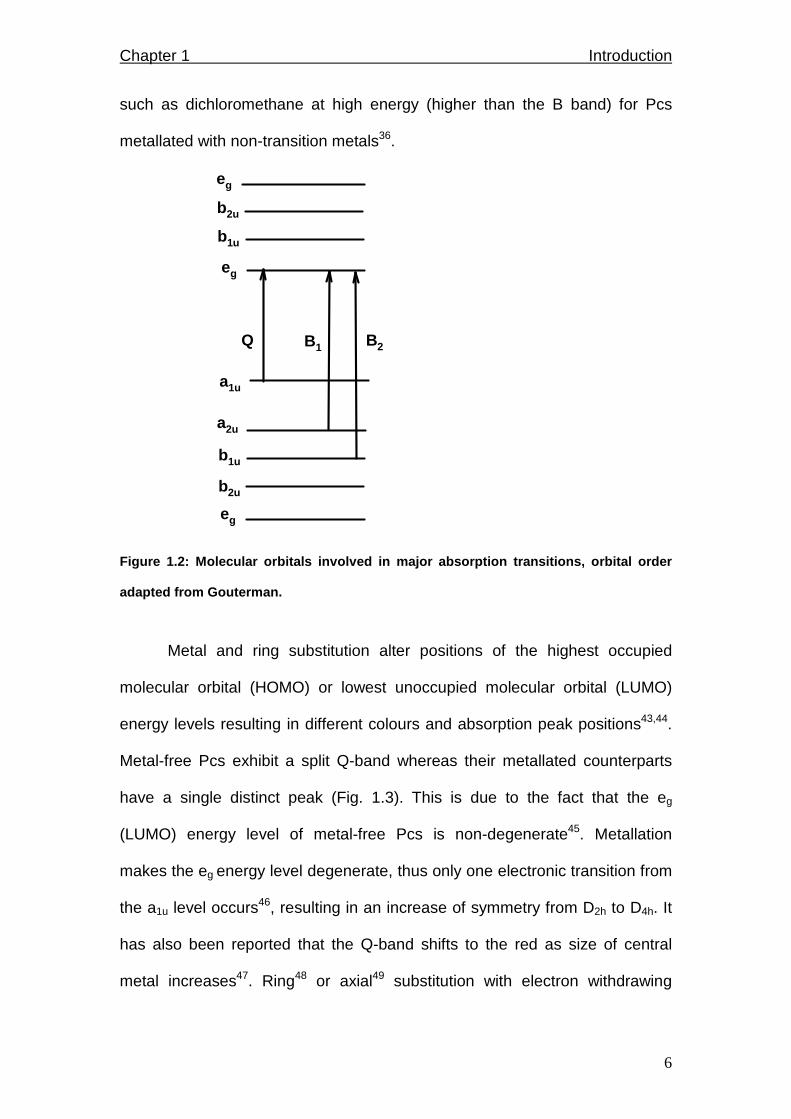
The main absorption peak at around 670 nm is called the Q-band38 and it
stems from π-π* transitions (a1u → eg, Fig. 1.2). Vibronic bands are observed
in the proximity of Q-bands due to vibrational transitions39. There are also π-π*
transitions in the blue giving rise to B-bands40, also known as Soret bands
(a2u/b1u → eg, Fig. 1.2). A single B band is observed around 350 nm due to
superimposition of B1 and B2 bands. There is also a band observed around
500 nm for some transition metal MPcs41. It is attributed to charge transfer
transitions from metal to ligand (MLCT) or from ligand to metal (LMCT)42.
Moreover, additional N and L bands are observed in transparent solvents
Chapter 1 Introduction
6
such as dichloromethane at high energy (higher than the B band) for Pcs
metallated with non-transition metals36.
a1u
b1u
b2u
b2u
a2u
eg
eg
b1u
eg
Q B1 B2
Figure 1.2: Molecular orbitals involved in major ab sorption transitions, orbital order
adapted from Gouterman.
Metal and ring substitution alter positions of the highest occupied
molecular orbital (HOMO) or lowest unoccupied molecular orbital (LUMO)
energy levels resulting in different colours and absorption peak positions43,44.
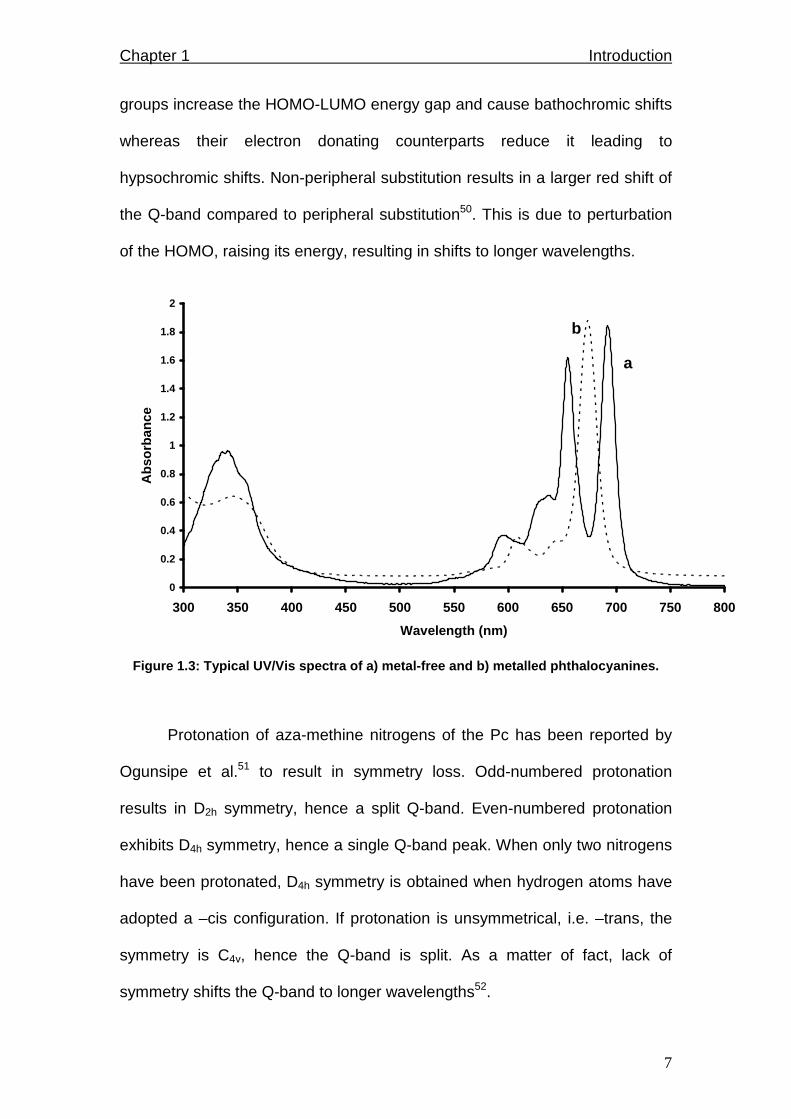
Metal-free Pcs exhibit a split Q-band whereas their metallated counterparts
have a single distinct peak (Fig. 1.3). This is due to the fact that the eg
(LUMO) energy level of metal-free Pcs is non-degenerate45. Metallation
makes the eg energy level degenerate, thus only one electronic transition from
the a1u level occurs46, resulting in an increase of symmetry from D2h to D4h. It
has also been reported that the Q-band shifts to the red as size of central
metal increases47. Ring48 or axial49 substitution with electron withdrawing
Chapter 1 Introduction
7
groups increase the HOMO-LUMO energy gap and cause bathochromic shifts
whereas their electron donating counterparts reduce it leading to
hypsochromic shifts. Non-peripheral substitution results in a larger red shift of
the Q-band compared to peripheral substitution50. This is due to perturbation
of the HOMO, raising its energy, resulting in shifts to longer wavelengths.
0
0.2
0.4
0.6
0.8
1
1.2
1.4
1.6
1.8
2
300 350 400 450 500 550 600 650 700 750 800
Wavelength (nm)
Abs
orba
nce
a
b
Figure 1.3: Typical UV/Vis spectra of a) metal-free and b) metalled phthalocyanines.
Protonation of aza-methine nitrogens of the Pc has been reported by
Ogunsipe et al.51 to result in symmetry loss. Odd-numbered protonation
results in D2h symmetry, hence a split Q-band. Even-numbered protonation
exhibits D4h symmetry, hence a single Q-band peak. When only two nitrogens
have been protonated, D4h symmetry is obtained when hydrogen atoms have
adopted a –cis configuration. If protonation is unsymmetrical, i.e. –trans, the
symmetry is C4v, hence the Q-band is split. As a matter of fact, lack of
symmetry shifts the Q-band to longer wavelengths52.
Chapter 1 Introduction
8
The nature of solvent affects UV/Vis spectra of Pcs53. Conjugated and
aromatic solvents shift Q-bands to the red54. Solvents such as chloroform
oxidize the Pc ring leading to a decrease of Q-band intensity, appearance of a
broad charge-transfer peak around 500 nm and colour change to purple39.
Decomposition of solvents such as DMSO55 forms various ligating substances
which coordinate with the Pc yielding multiple Q-bands. Peaks associated
with n-π* transitions shift to the blue with increasing solvent polarity whereas
π-π* transitions shift to the red56. Furthermore, solvents with high refractive
indices such as 1-chloronaphthalene reduce the HOMO-LUMO energy gap,
hence cause a red shift57.
Phthalocyanines maybe characterized by other techniques such as
infra-red (IR) and nuclear magnetic resonance (NMR) spectroscopies, as well
as mass spectrometry and elemental analysis.
1.1.3 Electrochemistry of phthalocyanines
The electrochemical activity of unmetallated Pcs is related to
processes occurring on the ring. Oxidation is removal of electron(s) from the
HOMO while reduction is the addition of electron(s) to the LUMO, in H2Pc
derivatives. The Pc skeleton exists as a dianion, Pc(-2), successive removal
of up to two electrons from the HOMO (a1u) results in the formation of Pc(-1)
and Pc(0) π-cation radicals, respectively58. Similarly, successive addition of
up to four electrons to the LUMO (eg) results in the formation of Pc(-3), Pc(-4),
Pc(-5) and Pc(-6) π-anion radicals respectively59. These processes can be
monitored with electrochemical methods such as amperometry. Peak
Chapter 1 Introduction
9
separation between the first oxidation and reduction processes is equal to
~1.6 V for H2Pc60.
Metallophthalocyanines (MPcs) containing electroactive central metals
exhibit electroactivity associated with the central metals, in addition to ring
processes61. Examples of electroactive metals include cobalt, iron and
manganese while electrochemically inactive metals include zinc and
magnesium. Peaks or couples linked to oxidation or reduction of the central
metal usually lie between those for ring oxidation or reduction processes62.
Moreover, electroactive ligands substituted on the Pc also exhibit their own
characteristic redox peaks or couples63. Potentials at which redox couples are
observed depend on the nature of the molecule and solvent64. Redox
processes of MPc complexes are assigned successfully using spectro-
electrochemistry65,66. This technique involves recording UV/Vis spectra as
potential is applied. It therefore requires unique electrodes such as indium tin
oxide (ITO)67,68, which are optically transparent, conductive, mechanically
strong, resistant to corrosion and exhibit low background currents.
Central metal or phthalocyanine ring oxidation and reduction can be
afforded by other non-electrochemical methods. Oxidation is afforded by use
of oxidizing agents such as bromine, and photochemically by irradiation with
light of suitable wavelength in the presence of an appropriate electron
acceptor. On the other hand, reduction is achieved by use of reducing agents
such as sodium borohydride and by photochemical irradiation in the presence
of an appropriate electron donor. Ring oxidation to π cation radical is
accompanied by loss of intensity of the Q band39, formation of new bands36

Chapter 1 Introduction
10
near 500 nm (charge transfer), 830 nm (Pc-1 monomer), 720 nm and 1040 nm
due to (Pc-1)2 dimer and solution colour change to purple1.
Ring reduction involves addition of electrons to the eg LUMO energy
level resulting in the collapse of the Q-band69 and formation of two bands in
the 500 - 600 nm region70. Additional bands are observed near 780 and 860
nm. Ring reduction is accompanied by colour change71 to bluish purple,
purple, blue and blue-green for Pc-3 anion, Pc-4 dianion, Pc-5 trianion and Pc-6
tetraanions respectively. Furthermore, oxidation or reduction processes
occurring at the central metal of MPcs are characterized by a shift of the Q-
band without a drastic decrease of peak intensity1. Intensities of B and Q
bands are not affected since they are due to π-π transitions. However, charge
transfer bands near 500 nm due to metal to ligand (MLCT) or ligand to metal
(LMCT) transitions may be lost or formed.
1.2 Background on electrochemical methods
Electrochemical methods play an important part in this thesis hence the
background on electrochemistry is provided in this section. Electrochemistry is
a branch of chemistry that deals with reactions that occur on the interface of
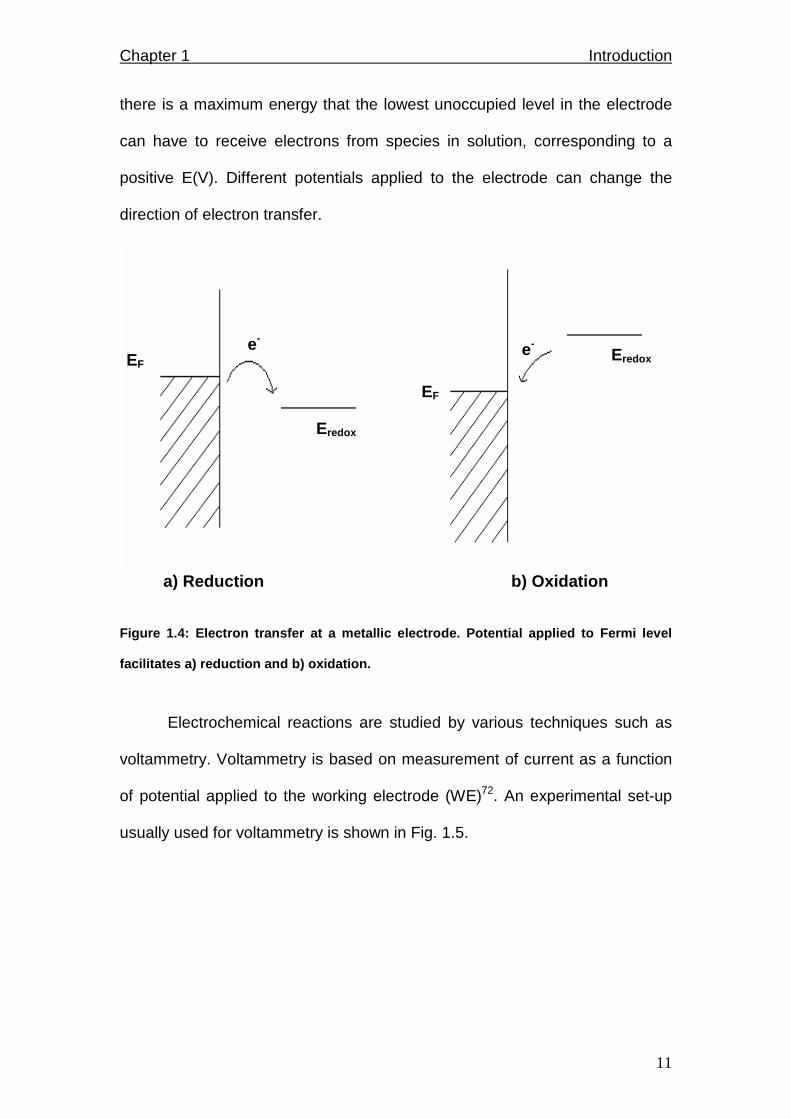
an electronic conductor and an ionic conductor. In metallic electrodes,
electrons are removed or transferred to the highest occupied orbital, the Fermi
level Ef (Fig. 1.4). Consider a typical reduction reaction; O + ne- → R, where
O and R are soluble. For a reduction, there is a minimum energy that the
transferable electrons from the electrode must have before electron transfer
can occur, corresponding to a negative E (V). The inverse is true for oxidation;
Chapter 1 Introduction
11
there is a maximum energy that the lowest unoccupied level in the electrode
can have to receive electrons from species in solution, corresponding to a
positive E(V). Different potentials applied to the electrode can change the
direction of electron transfer.
Figure 1.4: Electron transfer at a metallic electro de. Potential applied to Fermi level
facilitates a) reduction and b) oxidation.
Electrochemical reactions are studied by various techniques such as
voltammetry. Voltammetry is based on measurement of current as a function
of potential applied to the working electrode (WE)72. An experimental set-up
usually used for voltammetry is shown in Fig. 1.5.
EF
Eredox e-
b) Oxidation
e-
EF
Eredo x
a) Reduction
Chapter 1 Introduction
12
Electrolyte /analyte
W.E. R.E. C.E.
Potentiostat
∆ E i i
Figure 1.5: Schematic representation of an electroc hemical cell showing the working
(WE), reference (RE) and counter electrodes (CE).
Electrochemical reactions73 occur on the working electrode (WE) and
potential is measured relative to a reference electrode (RE) of known
potential. The WE acts as a source or sink of electrons for exchange with the
interfacial region. This region consists of electrolyte solution adjacent to the
electrode surface where charge distribution differs from that in the solution
bulk. The WE must be an electronic conductor and must be electrochemically
inert, i.e. does not generate current when potential is applied. There is a wide
variety of materials used as WE, choice of material depends on the potential
window required.
The RE must be chemically and electrochemically reversible, i.e. its
potential must be governed by Nernst equation and should not change with
time. It must also be non-polarizable meaning its potential must remain
constant when a small current passes through, otherwise it should regain its
Chapter 1 Introduction
13
original value after such current flow. Lastly, it must have a small potential
thermal coefficient, i.e. its potential must be temperature independent. The
counter electrode (CE) has to be more conducting than the RE, otherwise
current flow might alter potential of the reference electrode. CE should have a
much larger surface area than the WE (at least 5 times). Since electrode
reaction rate is strongly dependent on surface area, it is recommended that a
CE of much larger surface area compared to the WE must be used to obtain a
much faster reaction rate for the reaction occurring at the CE than those
occurring at the WE. Thus the reactions occurring at the WE are the slowest,
they determine the overall reaction rate and the data obtained through the
potentiostat reflect the behaviour and properties of reactions occurring at the
WE.
1.2.1 Voltammetry
Voltammetry is a potential sweep technique that is widely used to study
electrode processes as mentioned earlier. It consists of application of a
continuously time-varying potential to the WE at any measured rate. In linear
sweep voltammetry (LSV), potential is scanned from the initial potential Ei in
one direction stopping at the final potential Ef, whereas in cyclic voltammetry
(CV), the sweep direction is reversed at Ef to the initial potential (Ei). The scan
direction can be either positive or negative depending on the reaction studied.
Application of potential results in the occurrence of oxidation or reduction
reactions of electroactive species in solution. In addition, adsorption,

Chapter 1 Introduction
14
deposition or polymerization may occur. A typical cyclic voltammogram (CV)
of a general reduction-oxidation reaction R ↔ O + ne- is shown in Fig. 1.6.
-300 -100 100 300 500
E (mV) vs SCE
Ipa, Epa
Ipc, Epc
5 uA
Ei
Ef
O R + ne-
R O + ne-
Figure 1.6: A typical cyclic voltammogram of a redu ction-oxidation reaction.
At the beginning of potential sweep, nothing happens thus background
current is detected. At a potential close to Epa, R gets oxidized to O and the
current increases because of electron transfer. At potential Epa, the current
reaches its maximum since equilibrium is reached between surface
concentrations of O and R. Generally, there is an on-going competition
between electron transfer at the electrode surface and diffusion of fresh
solution towards the electrode surface. As potential application continues, the
diffusion layer increases, decreasing the driving force for diffusion. Therefore
less compound (R) arrives at the surface of the electrode per unit time, thus
current signal becomes smaller; decaying exponentially following a profile

Chapter 1 Introduction
15
proportional to t-1/2. When potential Epc is reached, O gets reduced back to R
and the formed R subsequently moves into the bulk of the solution. If potential
sweep continues, the cycle recurs. The potential of the half reactions is given
by Nernst equation (eq. 1.1):
[O][R]
ln nFRT
EE 0 −= 1.1
where Eº is standard electrode potential (potential when all reactants and
products are at unit activity), R is the gas constant, n is number of moles of
electrons, F is Faraday’s constant, T is temperature in Kelvin, [R] and [O] are
activities of reduced and oxidized species respectively.
Substituting numerical values for the constants and converting to base 10
logarithms at 25ºC, eq. 1.1 becomes eq.1.2,
[O][R]
log n
0.0592EE 0 −= 1.2
Activity of a species ax is related to its molar concentration [X] by equation
1.3:
Ax = γx[X] 1.3
where γx is activity coefficient of X, a parameter that depends on ionic
strength of the solution. It is usually approximated to be unity because of high
concentrations of electrolytes added in solution hence activity is equal to
molar concentration.
Reversible systems
When surface concentrations of O and R are maintained at values
required by the Nernst equation, the system is in equilibrium throughout the
potential scan. Species formed in the forward reaction is regenerated in the
Chapter 1 Introduction
16
reverse reaction, i.e. O + ne- ↔ R. The reaction is termed reversible and it
has the following characteristics:
1. Peak current, iP (A) is given by the Randles-Sevcik equation at 25ºC,
(eq. 1.4):
ip = 2.69x10⁵n3/2ACD1/2v1/2 1.4
where n is number of moles of electrons transferred, A is electrode
area (cm2), C is molar concentration (mol/L), D is diffusion coefficient
(cm2/s) and v is the scan rate (V/s).
2. Peak separation, ∆E (Epc - Epa ) = 59/n mV at all scan rates at 25ºC.
3. Peak current ratio, Ipa/ Ipc = 1 at all scan rates.
4. Peak current function, ip/v1/2 is independent of scan rate.
5. The formal potential Eº’ is given by mean of peak potentials. Eº’ is
potential when the ratio of analytical concentrations of reactants and
products are exactly unity, for the reaction stoichiometry of 1.
6. The electrode reaction kinetics are fast to maintain Nernstian
concentrations.
7. Oxidized and reduced species are stable.
8. Peaks are sharp and intense.
Irreversible systems
On the other hand, when the system is not in equilibrium and surface
concentrations of O and R are not maintained at values required by the
Nernst equation, it is said to be irreversible. The most common irreversible
system has no return peak. Irreversible processes have the following features:
Chapter 1 Introduction
17
1. Peak current is given by the Randles-Sevcik equation at 25ºC (eq. 1.5):
ip = 2.99x10⁵n3/2(αnα)1/2ACD1/2v1/2 1.5
where the symbols have their usual meaning, α is a transfer coefficient
and nα is number of electrons involved in a charge transfer step.
2. Peak current function, ip/v1/2 is dependent on scan rate.
3. Slow electrode reaction kinetics.
4. Peaks are broad and small.
Some processes are intermediate between reversible and irreversible;
they are said to be quasi-reversible. There is a return peak but peak
separation ∆E is greater than 59/n mV. Peak separation increases with
increasing scan rate since to maintain Nernstian surface concentrations of O
and R, electron transfer kinetics should be fast and this depends on the
relative values of standard electron transfer rate constant k0 and the scan
rate. Reversibility can be restored by increasing the scan rate; this eliminates
the effect of the reaction (R → P) that follows the electron transfer.
1.2.2 Mass transport
Analyte movement from the bulk solution, through the interfacial region,
onto the electrode can occur via diffusion, migration or convection. Diffusion is
species movement driven by a concentration gradient. Convection is forced
movement and can be achieved by agitation or stirring. Migration occurs
against a charge gradient under the influence of the electric field and is
therefore for charged species only. To relate analytical signal to the
concentration of analyte in solution in amperometric experiments, the mode of

Chapter 1 Introduction
18
ion transport must be solely diffusion. Migration is eliminated by addition of
high concentrations of an inert electrolyte so that it carries all the charge.
Convection is eliminated by carrying out experiments in steady conditions,
avoiding any physical movement. A number of electrochemical reaction
parameters can be obtained from the voltammograms, but there are
limitations which include the following;
1. The effects of slow heterogeneous electron transfer and chemical
reactions cannot be separated. If they are both present, then rate
constants for these processes can be calculated only by simulation
methods.
2. There is a background charging current throughout the experiment
which restricts the detection limit to about 10-5 M. In addition, the ratio
of the peak faradaic current to the charging current decreases with
increasing scan rate v (since peak current ip is proportional to v1/2), and
this places an upper limit on the value of v that can be used.
1.2.3 Hydrodynamic systems
Electrode reactions are studied in reproducible experimental conditions
so comparisons can be made and authentic conclusions drawn. To obtain
both kinetic and thermodynamic parameters, conditions where the system is
not reversible are used. Reversible reactions kinetics are faster than mass
transport, hence ko (standard rate constant) is much greater than kd (mass
transfer coefficient). ko cannot be changed so kd has to be increased until the
reaction becomes at least quasi-reversible. This is done by various methods:
Chapter 1 Introduction
19
1. Hydrodynamic = increasing convection
2. Microelectrodes = decreasing size
3. Linear sweep = increasing sweep rate
4. Step and pulse techniques = increasing amplitude and/or frequency
5. Impedance = increasing perturbation frequency and registering higher
harmonics.
These methods basically facilitate mass transport hence more analyte
reaches the electrode. This enhances measured currents, leading to greater
sensitivity and reproducibility.
1.2.3.1 Rotating disc electrode
In hydrodynamic systems, convection is increased by rotating the working
electrode. This makes rotating disc electrode (RDE) systems ideal for
studying electrode reactions. The following apply for RDE systems:
1. Rate of reaction is varied by altering rotation speed. The higher the
rotation speed, the faster the reaction.
2. Analyte flow near electrode is laminar instead of turbulent as in solution
bulk, and this enables velocity calculations.
3. The system does not depend significantly on physical properties of
electrolytes.
4. Natural convection is suppressed.
5. Peak and limiting currents (Ip and IL) are obtained from one experiment.
6. Interfacial region is confined close to the electrode surface. When the
thickness of the stagnant layer remains constant throughout the
Chapter 1 Introduction
20
duration of the experiment, the electrode surface becomes uniformly
accessible to electroactive species that arrive from solution bulk.
7. Derived equations agree well with theory and experiment.
Hydrodynamic systems have the same set-up as an ordinary
electrochemical cell and they are usually monitored with LSV74. The only
difference is the working electrode rotates hence mass transport is governed
by both convection and diffusion. A rotating disc electrode consists of a disc
electrode embedded in the middle of a plane surface that rotates around its
axis in a fluid, the disc being centered on the axis. The electrode body is
usually cylindrical with a sheath around the disc; the sheath is significantly
larger than the disc so as to approximate a surface of infinite dimension. It is
assumed that there are no edge effects, which are convection effects caused
by walls of the cell, electrode body, etc. As a result of rotation, the solution is
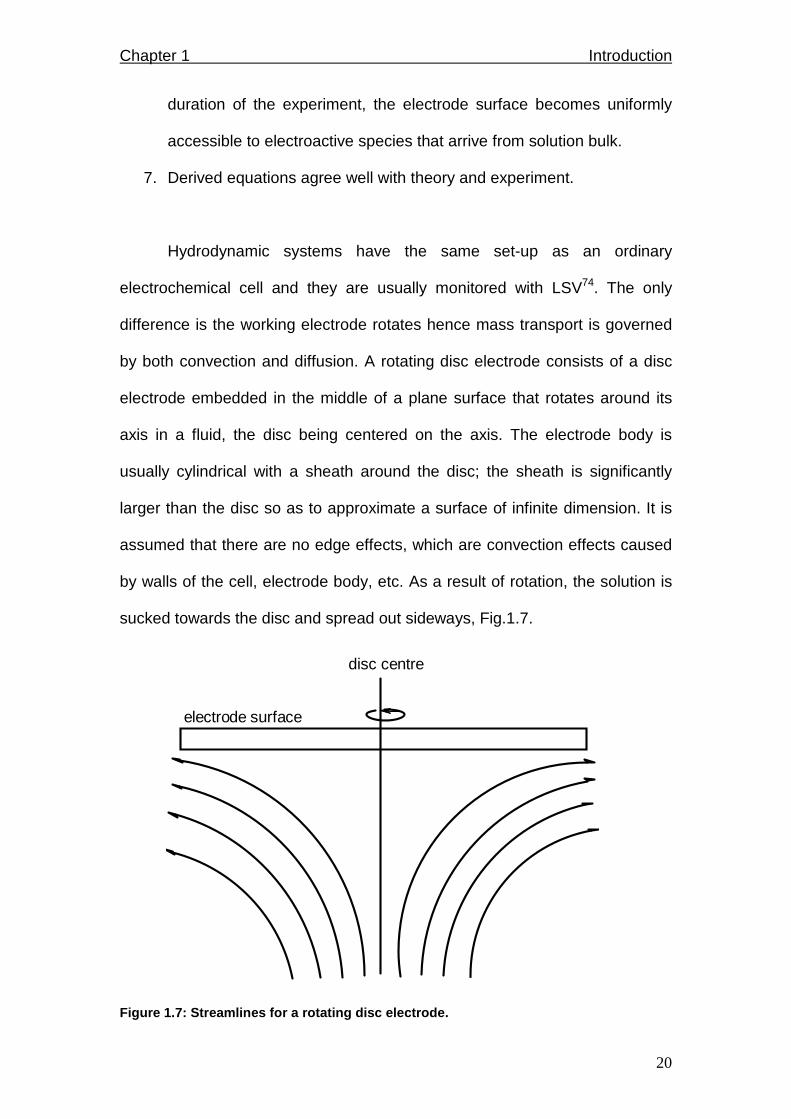
sucked towards the disc and spread out sideways, Fig.1.7.
electrode surface
disc centre
Figure 1.7: Streamlines for a rotating disc electro de.
Chapter 1 Introduction
21
There are different regions of solution flow in RDE systems. In the bulk
of the solution, the flow is turbulent due to electrode rotation. The extent of
turbulence depends on the speed of rotation. The flow becomes less turbulent
closer to the electrode surface. Adjacent to the electrode surface, the flow
then becomes laminar i.e. parallel layers of solution slide by each other
parallel to the electrode. Velocity gradients occur within this layer of thickness
δH. Very close to the electrode surface, there is a thin layer, almost stuck to it
called the stagnant layer. It has thickness δ and the assumption is there is no
convection within that diffusion layer. It has been demonstrated that:
δ = 3/1
vD
δH 1.7
where D is the diffusion coefficient and v is the velocity. In aqueous solution,
D ~10-5 cm2/s and v ~10-2 cm2/s, therefore δ ~ 0.1 δH. This shows how thin
and compact the stagnant layer is relative to the solution bulk hence the
assumption that convection does not occur within it.
In the bulk of the solution, concentrations are maintained
homogeneous by the stirring action. As long as the electrode area is small
and the experiment is not prolonged, the bulk concentrations will not be
altered appreciably by the electrolytic conversion of O to R at the surface. The
removal of O at the electrode surface sets up a concentration gradient across
the stagnant solution layer. O diffuses across this layer to the electrode
surface where it is electrolyzed to R, which then diffuses back across the layer
into the bulk solution.
As the rotation speed is increased the distance that the material can
diffuse from the surface before being removed by convection is decreased.
Chapter 1 Introduction
22
This results in a higher flux of material to the surface at higher rotation
speeds. It is for this reason that upper limit of rotation speed is set at 10 000
rotations per minute (r.p.m.) to inhibit electrode passivation and fouling. It also
ensures conformity to equations that describe analyte movement in RDE
experiments. The mass transport limited current arises from the fact that the
system reaches a steady state and so the current reaches a plateau once the
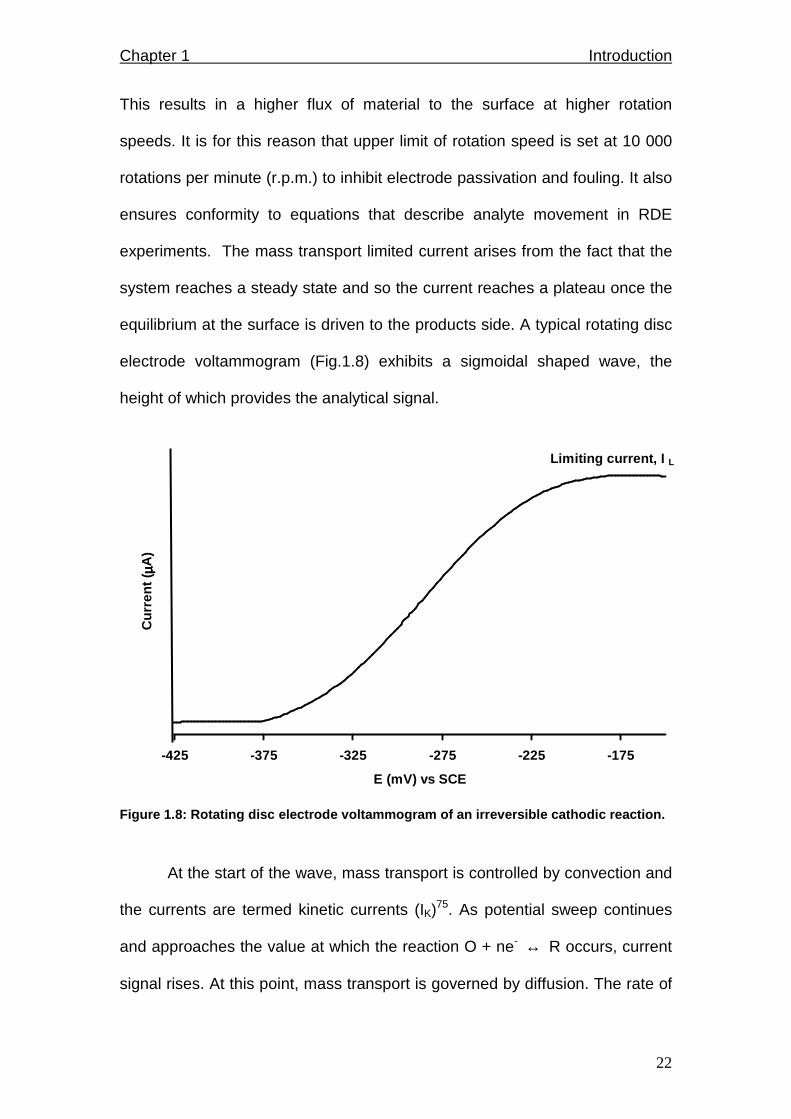
equilibrium at the surface is driven to the products side. A typical rotating disc
electrode voltammogram (Fig.1.8) exhibits a sigmoidal shaped wave, the
height of which provides the analytical signal.
-425 -375 -325 -275 -225 -175
E (mV) vs SCE
Cur
rent
(µµ µµA
)
Limiting current, I L
Figure 1.8: Rotating disc electrode voltammogram of an irreversible cathodic reaction.
At the start of the wave, mass transport is controlled by convection and
the currents are termed kinetic currents (IK)75. As potential sweep continues
and approaches the value at which the reaction O + ne- ↔ R occurs, current
signal rises. At this point, mass transport is governed by diffusion. The rate of
Chapter 1 Introduction
23
transport of electroactive species is equal to the rate of their reaction on the
electrode surface under steady state conditions. A plateau is reached when all
O or R that reaches the electrode is reduced or oxidized, and this is termed
the limiting current IL. It is predicted by Levich equation (eq. 1.8);
IL = 0.62nFAD2/3ω1/2v-1/6C 1.8
where A is electrode area, v is kinematic viscosity (cm2/s), which is a ratio of
solution’s viscosity to its density. ω is angular rotation rate of the electrode
(radians/second); calculated from rotations per minute (f) using the
relationship, ω = 2πf/60. At a uniformly accessible electrode, IL is directly
proportional to the electrode area. When the electrode area is large, there will
be more room for high concentrations of analyte to reach the electrode and
undergo the chemical reaction, hence the limiting current will be higher.
The Levich equation can be used to give valuable information. When
all constants are known, the total number of electrons involved in an electrode
reaction can be determined. A linear variation of limiting current and square
root of angular rotation rate indicates a diffusion-controlled process.
1.2.3.2 Kinetics of electrode reactions
Electrode reaction kinetics are measured as current is passed in
hydrodynamic systems76,77. The mass transfer coefficient kd describes the rate
of diffusion within diffusion layer of thickness δ + δH (see above); ka and kc are
rate constants of the electrode reactions for oxidation and reduction
respectively. For a simple electrode reduction reaction O + ne- → R, the rate
constant is;
Chapter 1 Introduction
24
−−=
RT
)EnF(Eαexpkk
0'c
0c 1.9
For oxidation, it is;
−−=
RT
)EnF(Eαexpkk
0'a
0a 1.10
where ko is the standard rate constant. αa and αc are charge transfer
coefficients for anodic and cathodic processes respectively. ka and kc maybe
determined from kinetic currents (IK) as shown by eqn. 1.11 for kc,
IK = nFCAkc 1.11
where symbols are as described above.
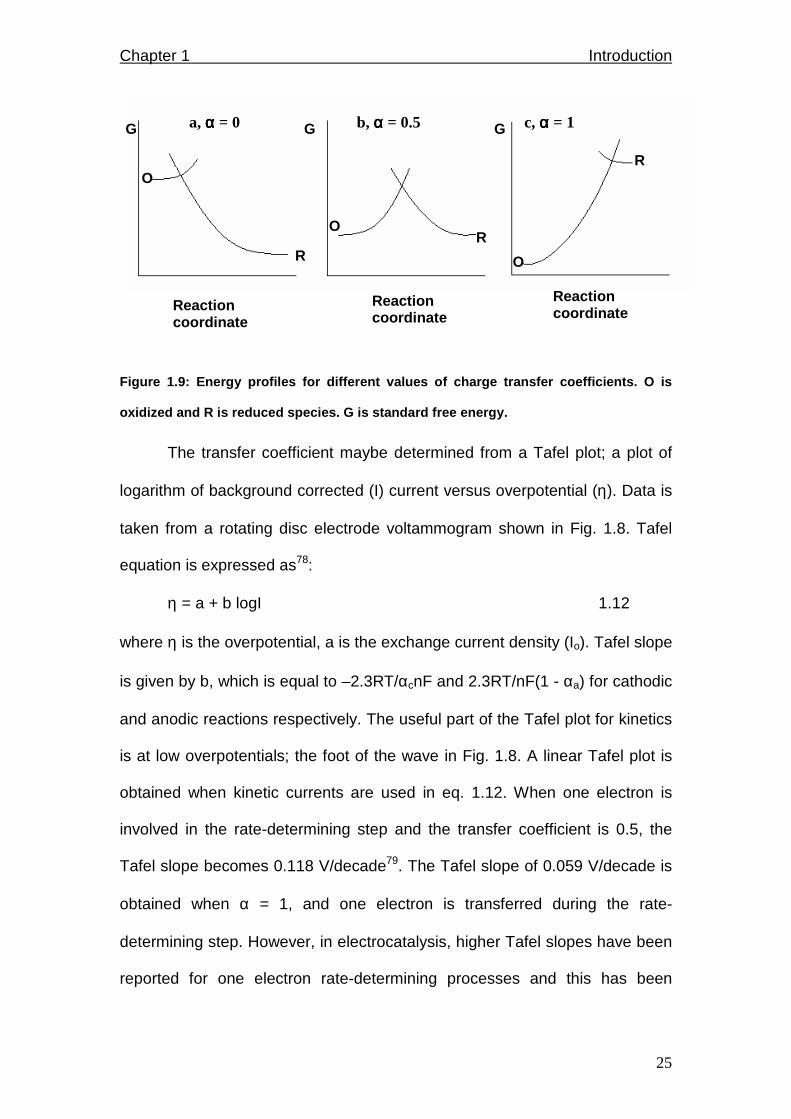
1.2.3.3 The transfer coefficient, αααα
The transfer coefficient is a measure of symmetry of the activated
barrier and it varies between 0 and 1. α is equal to 0.5 for a metallic electrode
and a simple electron transfer process, indicating that the activated complex
is exactly halfway between products and reactants on the reaction coordinate;
the structure of the activated complex reflecting reagent and product equally
(Fig. 1.9b). For a simple one step electron transfer, αa + αc = 1. α valued at 0
or 1 indicates that the activated complex has predominantly the structure of
oxidized or reduced species respectively (Fig. 1.9 a and c).
Chapter 1 Introduction
25
Figure 1.9: Energy profiles for different values of charge transfer coefficients. O is
oxidized and R is reduced species. G is standard fr ee energy.
The transfer coefficient maybe determined from a Tafel plot; a plot of
logarithm of background corrected (I) current versus overpotential (η). Data is
taken from a rotating disc electrode voltammogram shown in Fig. 1.8. Tafel
equation is expressed as78:
η = a + b logI 1.12
where η is the overpotential, a is the exchange current density (Io). Tafel slope
is given by b, which is equal to –2.3RT/αcnF and 2.3RT/nF(1 - αa) for cathodic
and anodic reactions respectively. The useful part of the Tafel plot for kinetics
is at low overpotentials; the foot of the wave in Fig. 1.8. A linear Tafel plot is
obtained when kinetic currents are used in eq. 1.12. When one electron is
involved in the rate-determining step and the transfer coefficient is 0.5, the
Tafel slope becomes 0.118 V/decade79. The Tafel slope of 0.059 V/decade is
obtained when α = 1, and one electron is transferred during the rate-
determining step. However, in electrocatalysis, higher Tafel slopes have been
reported for one electron rate-determining processes and this has been
O
R
O R
O
R
G G G
Reaction coordinate
Reaction coordinate
Reaction coordinate
a, αααα = 0 b, αααα = 0.5 c, αααα = 1
Chapter 1 Introduction
26
attributed to high transfer coefficients or strong binding between analytes and
catalysts80. Furthermore, it has been postulated that Tafel slopes close to
0.118 V/decade involve Temkin kinetics whereas those close to 0.059
V/decade involve Langmuir kinetics81. These are related to adsorption
conditions of catalysts on electrodes.
1.2.3.4 Reaction order
Reaction order can be determined from plots of 1/I versus ω-1/2 based
on Koutecky-Levich equation75 (eq. 1.13):
Cνω0.62nFAD1
nFCAk1
I1
1/61/22/3c
−+= 1.13
where symbols have their usual meaning. Current variables (I) are taken at
different potentials along the rising part of the wave, at different rotation
speeds. Parallel linear plots of 1/I versus ω-1/2 at different potentials indicate
first order reaction82. Note that the y-intercept of the 1/I versus ω-1/2 plots give
rate constants of electrode reactions.
The reaction order m, can also be determined from the following
equation83, eq. 1.14:
−+=
LK I
I1 log mI logI log 1.14
where symbols have their usual meaning. I values are taken at the reaction
peak potential (Epa or Epc) determined from cyclic voltammetry or peak at half-
height in RDE voltammograms. The value of I at this potential and different
rotation speeds is then employed in eq. 1.14.
Chapter 1 Introduction
27
1.3 Electrocatalysis
It has already been mentioned that the principal aim of the project is to use
phthalocyanines as catalysts. Electrocatalysis is one type of catalysis where
these complexes have been extensively used, hence this is discussed in this
section. Electrocatalysis is defined as the increase of electron transfer rate of
electrochemical reactions by using a catalyst. The catalyst acts as a mediator,
thus it takes an active part in the reaction but is not consumed.
1.3.1 Use of metallophthalocyanines in electrocatal ysis
Electrochemical reactions are monitored successfully on conventional
working electrodes such as glassy carbon electrodes. However, some
reactions occur slowly and with difficulty. This has brought about the use of
electrocatalysts to counteract these problems. Phthalocyanine complexes
have been used as electrocatalysts in various reactions such as thiol
oxidation10 and oxygen reduction84. This is because these complexes have
various oxidation states. They can also be metallated with electroactive
central metals such as cobalt, iron and manganese, which greatly enhance
their electrocatalytic behaviour. Ligands substituted on the Pc ring can be
electroactive, contributing to the overall electrocatalytic efficiency of the Pc.
Electroactive phthalocyanines interact with reagents while undergoing
electrochemical reactions thereby facilitating electron transfer processes85.
This leads to reactions occurring at reduced overpotentials86 and increased

Chapter 1 Introduction
28
current densities87 rendering phthalocyanine complexes as good
electrocatalysts.
The redox (O/R) couple of the electrocatalyst basically mediates and
therefore hastens electron transfer process between the electrode and the
substrate, (Fig. 1.10). The electrochemical reaction undergone by the
substrate, oxidation in this case, will occur at a potential close to the O/R
formal potential, Eo’ of the electrocatalyst. The return peak of the O/R couple
(O → R), will not be observed since the oxidized species would have
interacted with the substrate.
O
R
Sred
Sox Products(s)
- e-
heterogenous homogenous redox reaction
electrode
Figure 1.10: A schematic representation of an elect rocatalytic reaction. S is the
substrate.
Examples of reaction mechanisms electrocatalyzed by metallo-
phthalocyanines include oxygen reduction whereby oxidation of the central
metal forming superoxide anion occurs first88. This is followed by reduction of
the formed adduct, during which oxygen gets reduced. This is represented by
the following reaction sequence,
Chapter 1 Introduction
29
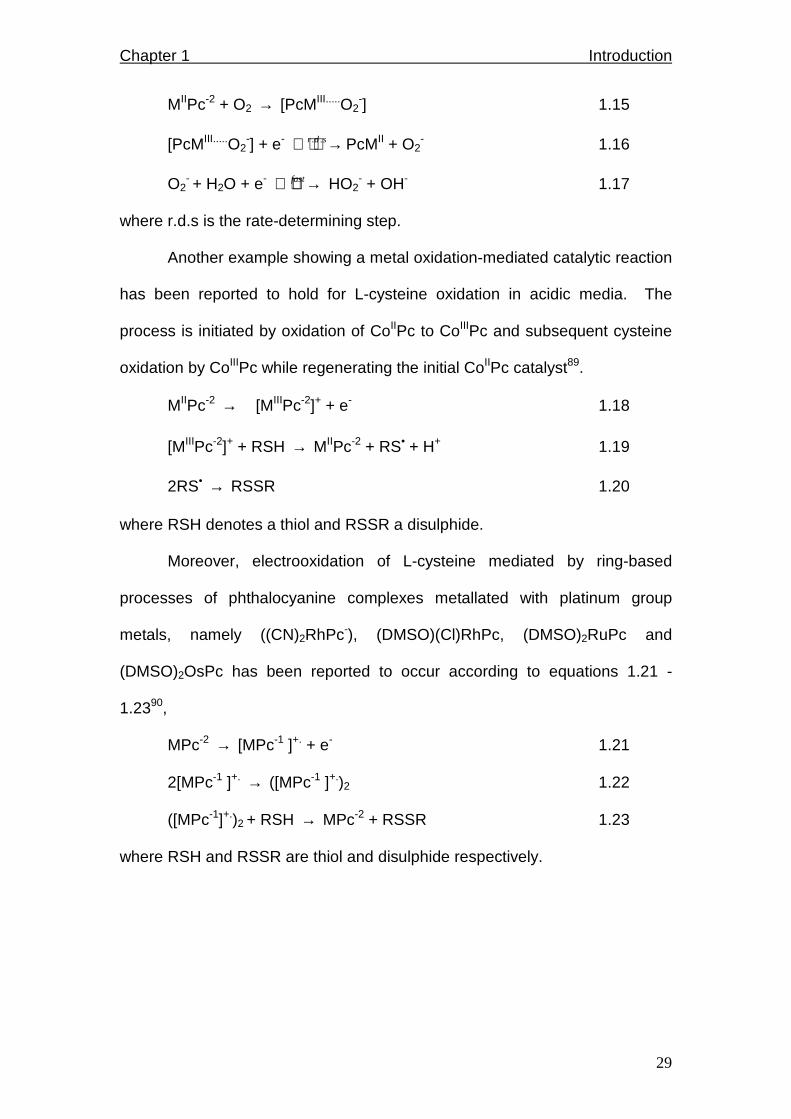
MIIPc-2 + O2 → [PcMIII.....O2-] 1.15
[PcMIII.....O2-] + e- → sdr .. PcMII + O2
- 1.16
O2- + H2O + e- → fast HO2
- + OH- 1.17
where r.d.s is the rate-determining step.
Another example showing a metal oxidation-mediated catalytic reaction
has been reported to hold for L-cysteine oxidation in acidic media. The
process is initiated by oxidation of CoIIPc to CoIIIPc and subsequent cysteine
oxidation by CoIIIPc while regenerating the initial CoIIPc catalyst89.
MIIPc-2 → [MIIIPc-2]+ + e- 1.18
[MIIIPc-2]+ + RSH → MIIPc-2 + RS• + H+ 1.19
2RS• → RSSR 1.20
where RSH denotes a thiol and RSSR a disulphide.
Moreover, electrooxidation of L-cysteine mediated by ring-based
processes of phthalocyanine complexes metallated with platinum group
metals, namely ((CN)2RhPc-), (DMSO)(Cl)RhPc, (DMSO)2RuPc and
(DMSO)2OsPc has been reported to occur according to equations 1.21 -
1.2390,
MPc-2 → [MPc-1 ]+. + e- 1.21
2[MPc-1 ]+. → ([MPc-1 ]+.)2 1.22
([MPc-1]+.)2 + RSH → MPc-2 + RSSR 1.23
where RSH and RSSR are thiol and disulphide respectively.
Chapter 1 Introduction
30
1.3.2 Electrode modification
Conventional surfaces that are used as working electrodes are made of
various materials; criterion of choice is governed mainly by the useful potential
range in a particular solvent and electrolyte for reactions studied. Electrode’s
potential window is limited by solvent and electrolyte decomposition, electrode
dissolution and passivation. Factors such as microstructure and roughness of
the electrode surface, blocking of active sites by adsorbed species and nature
of functional groups on the electrode surface are also taken into consideration
as they affect kinetics of electrode reactions. In this work, the following
electrode materials have been used; glassy carbon (GCE), ordinary pyrolytic
graphite (OPG), gold and screen printed carbon (SPCE).
GCE is the most commonly used carbon electrode. It is made up of an
amorphous form of carbon. It is denser than natural graphite, isotropic, non-
homogenous and with unknown composition. GCE can be polished to a
mirror finish and does not show any memory effects, hence can be used in
ultratrace analysis. It has surface functionalities such as OH and COOH
groups. Its surface characteristics and area are inconsistent but a new layer is
exposed after polishing. GCE is hard and resistant to chemical attack and
thus more mechanically durable. Chemical resistance is a consequence of the
disordered structure and therefore the inability to form intercalation
compounds. It is also highly resistant to corrosion by acid and alkaline agents.
It is a good thermal conductor with a high level of resistance to thermal shock,
thus it can be employed in various temperatures.

Chapter 1 Introduction
31
OPG is made of ordered sheets of hexagonally bonded carbon atoms
arranged in the same direction (Fig. 1.11). It has distinct planes, the basal and
the edge; of varying population of chemical functionalities. The plane exposed
on the surface is dependant on pre-treatment method. The basal plane
surface is non-ionic, hydrophobic and rich in π-electron density. The high π-
electron density permits strong chemisorptive interactions, especially with
unsaturated compounds. The edge plane has carboxylic acid and hydroxyl
groups which makes it more conducting than the basal plane. These groups
can be enhanced by chemical pre-treatment procedures such as heating in air
at elevated temperatures (400 - 500 oC), leaving the surface oxidized.
Electroactive species can then be attached onto the electrode after activation,
leading to formation of chemically modified electrodes. Pyrolytic graphite is
anisotropic, very reproducible and slightly denser than natural graphite. It is
more porous than glassy carbon, thus allows easy adsorption of electrode
modifiers.
OHO
OH
O
O
O
O
Basal Edge
Figure 1.11: Structure of planes of an ordinary pyr olytic graphite.
Chapter 1 Introduction
32
SPCEs are made of carbon black. These electrodes are made by
printing a mixture of graphite powder in an appropriate solvent onto ceramic
tiles91. They are highly miniaturized compared to their conventional, orthodox
counterparts. They are thus more applicable in biological systems where their
small size enables facile manoeuvring92. SPCEs offer advantages of use of
small sample volumes and avoidance of electrolyte leakage problems93. Their
methods of preparation are amendable to mass production hence they are
made at low cost and reproducibly. The electrodes are disposable hence
eliminate the extra, tiresome duty of cleaning and polishing.
Gold is a noble metal; as an electrode it is highly conductive exhibiting
negligible background currents, high sensitivity and reproducibility. It is
however prone to corrosion and passivation.
The aforementioned electrodes namely GCE, OPG, Au and SPCEs
can be chemically modified with Pcs to enhance their electrocatalytic
character. There are various methods of electrode modification depending on
the electrode material, properties of the Pc and analytes as well as the type of
reaction studied. These include composite carbon cements94, spin coating95,
vapour deposition96, Langmuir-Blodgett films97, (drop-dry) adsorption98, self
assembly99, electrodeposition100 and electropolymerization101. Electrode
modification methods used in this work include adsorption (drop-dry) whereby
a known volume of Pc solution is spread onto the electrode surface and
rinsed off after a known time interval. The Pc adheres onto the electrode
material and the bulk of the Pc film is held together by simple π-π interactions
between the N4 macrocycles102. There is also a likelihood of forming rough

Chapter 1 Introduction
33
MPc films103 upon solvent evaporation. This can be prevented by shortening
adsorption time hence allowing only partial evaporation.
Self-assembly method104 was also used in this work whereby the Pc
molecule self-organizes onto electrodes during immersion in Pc solution
leading to formation of self-assembled monolayers (SAMs). These are usually
formed on gold or silver electrodes via the strong covalent silver/gold-sulphur
bond by sulphur-containing Pcs105. The sulphur moiety of the Pc can be either
axially or ring substituted. MPc-SAMs have been reported to be dense and
highly ordered exhibiting regular and packed orientation on the electrodes.
Generally, SAM orientation on the electrode is determined by the number,
position and size of ring substituents on the Pc. They adopt an umbrella-
like106 orientation on the electrode when the MPc bonds to the electrode by an
axially bound sulphur ligand (Fig. 1.12 a). An octopus107 orientation is adopted
when the MPc lies flat on the electrode via sulphur-containing ring
substituents (Fig. 1.12 b).
a) umbrella b) octopus c) vertical
Figure 1.12: a) Umbrella, b) octopus and c) vertica l orientations of MPc-SAMs.
Au Au Au
S
M
S S S S S S S S S
M M
Chapter 1 Introduction
34
Another method of forming MPc-SAMs on gold electrodes involves pre-
forming SAM with an appropriate ligand which will then coordinate with the
MPc, adopting a vertical orientation on the electrode (Fig. 1.12 c). This
method eliminates the tedious, time-consuming duty of synthesizing sulphur-
containing MPcs. Ozoemena et al.108 formed SAM with 4-mercaptopyrimidine
on gold and then axially ligated FePc via the Fe-N bond onto the SAM. Mixed
SAMs have also been formed by electrode immersion into a mixture of
different thiols109. The solvent in which the Pc is dissolved affects the
composition of the monolayer. Ethanol is the preferred solvent because it
does not have a ‘memory effect’; it does not get incorporated into the SAM109.
Desirable solvents evaporate easily and also reduce gold oxide that is readily
formed on gold electrodes upon air exposure. Moreover, long adsorption
times of at least 12 hours afford formation of defect-free and well-ordered
SAMs110. Self-assembled monolayers are exploited as electrocatalysts
because they are stable and reproducible.
Electrodes were also modified by electrodeposition and electro
polymerization in this work. These methods involve repetitive oxidative or
reductive cycling around appropriate MPc redox processes resulting in the
coating of the MPc film onto the electrode. With electrodeposition, simple MPc
layer stacking occurs111 whereas with electropolymerization, polymeric films
are formed112. Electropolymerization is initiated with difficulty because it
strongly depends on electrode material, polishing and MPc monomer
solution113. Polymer radical ions must be capable of instigating oxidation or
reduction of fresh monomer to sustain polymer growth, otherwise electrode
passivation soon occurs and film growth is prevented.
Chapter 1 Introduction
35
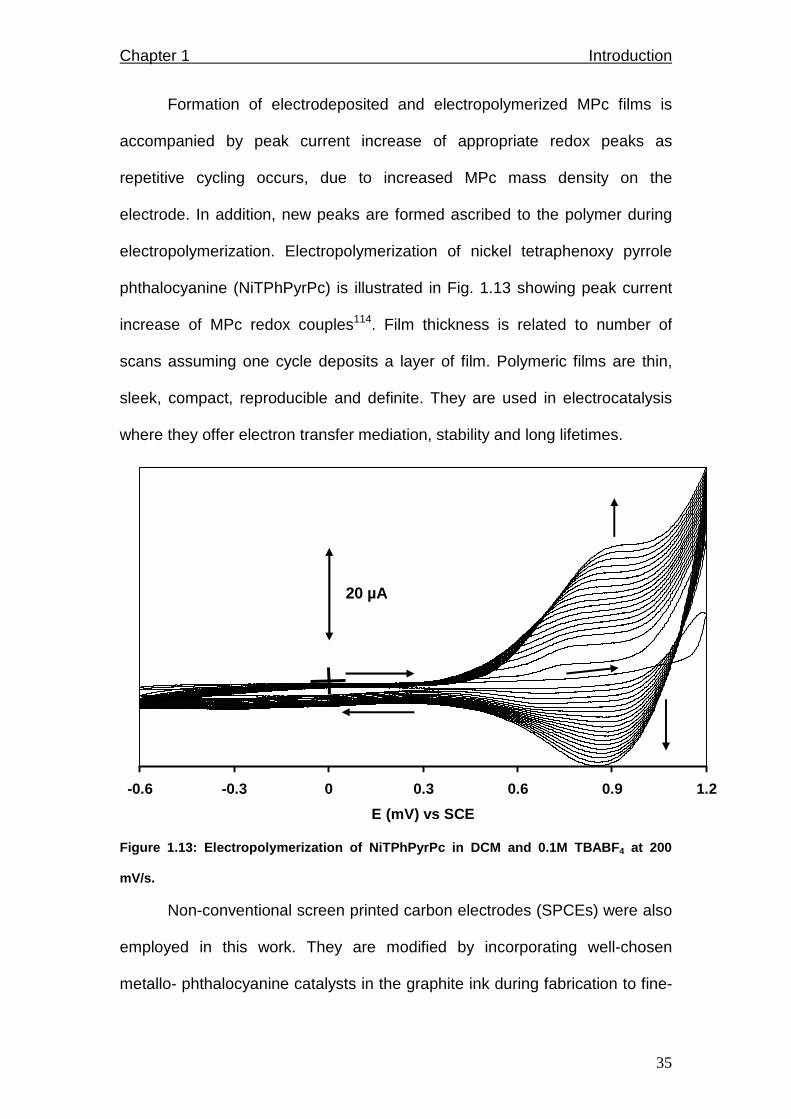
Formation of electrodeposited and electropolymerized MPc films is
accompanied by peak current increase of appropriate redox peaks as
repetitive cycling occurs, due to increased MPc mass density on the
electrode. In addition, new peaks are formed ascribed to the polymer during
electropolymerization. Electropolymerization of nickel tetraphenoxy pyrrole
phthalocyanine (NiTPhPyrPc) is illustrated in Fig. 1.13 showing peak current
increase of MPc redox couples114. Film thickness is related to number of
scans assuming one cycle deposits a layer of film. Polymeric films are thin,
sleek, compact, reproducible and definite. They are used in electrocatalysis
where they offer electron transfer mediation, stability and long lifetimes.
-0.6 -0.3 0 0.3 0.6 0.9 1.2
E (mV) vs SCE
20 µA
Figure 1.13: Electropolymerization of NiTPhPyrPc in DCM and 0.1M TBABF 4 at 200
mV/s.
Non-conventional screen printed carbon electrodes (SPCEs) were also
employed in this work. They are modified by incorporating well-chosen
metallo- phthalocyanine catalysts in the graphite ink during fabrication to fine-
Chapter 1 Introduction
36
tune their catalytic behaviour towards specific analytes115, as was the case in
this work. These electrodes can also be modified by already-discussed
methods such as electrodeposition116 and electropolymerization117.
1.3.3 Characterization of modified electrodes
There are various methods that are employed to confirm chemical
modification of electrodes such as FT-Raman118 and IR spectroscopy119,
scanning-probe measurements120, electrochemistry121 and x-ray photo
electron spectroscopy122. In cyclic voltammetry, peaks due to the MPc
electrode modifiers are prominent if film formation on the electrode surface is
successful. Moreover, polymer peaks should also be eminent, in the case of
electropolymerization.
The amount of electroactive species (ΓMPc) on the electrode surface is
determined by integration of MPc peak area using the following relationship
(eq. 1.24),
Q = nFAΓMPc 1.24
where Q is charge under oxidative or reductive MPc peak, n is number of
moles of electrons transferred, F is Faraday’s constant and A is electrode
area. Surface coverage can also be determined by recording CVs of the
surface-confined MPc redox process at various scan rates using the
relationship (eq. 1.25),
4RTAνFn
I MPc22
P
Γ= 1.25
Chapter 1 Introduction
37
where Ip is peak current, v is the scan rate, R is the gas constant, T is the
temperature and the rest of the constants have their usual meaning. This
equation can only be used if the Ip versus v plot is linear and passes through
the origin. Surface coverage in the 10-10 mol/cm2 indicates that there is a
monolayer of MPc on the electrode123.
Formation of SAMs on electrodes is probed by exploring their barrier
propensity towards occurrence of electrode reactions. Electrochemical
methods used for establishing SAM formation include blockage of gold oxide
formation124,125, under-potential deposition (UPD) of metals such as copper126
and prevention of electron transfer in redox reactions127,128 such as
[Fe(H2O)6]3+/[Fe(H2O6)]
2+. When SAM has been formed, lower currents if any,
are observed for these processes. Factors used to qualitatively characterize
SAMs include ion barrier factor (Γibf)129 which is calculated using eq. 1.26130,
Γibf = 1 - Bare
SAM
Q
Q 1.26
where QSAM and QBARE is charge under peaks of MPc-SAM and bare gold
electrodes, respectively. This factor is a measure of how well SAMs have
isolated Au electrode surface from the electrolyte. The disappearance of the
gold oxide or UDP peaks of Cu is used to establish SAM formation as well as
to calculate ion barrier factor. Γibf should be equal to unity for complete
isolation of Au from the aqueous solution.
Another factor that is used to characterize SAMs is interfacial
capacitance, Cs. It is a measure of ion permeability through SAM, it tells us
how densely packed and defect free the SAM is131. The closer the calculated
Cs value is to zero, the fewer the defects and pinholes of the SAM. This
Chapter 1 Introduction
38
indicates that the SAM is less permeable to the electrolyte ions which would
otherwise traverse to the electrode surface. A decrease in charging current
observed with MPc-SAMs, is attributed to the presence of a layer of low
dielectric constant between the electrode and the electrolyte. Cs is calculated
using eq. 1.27132,
νAi
C chs = 1.27
where ich is the background charging current (µA), v is the scan rate (V s-1)
and A is the electrode area.
1.4 Overview of studied analytes
A range of analytes that has been studied electrochemically in this
work and catalyzed by metallophthalocyanines is shown in Fig. 1.14. They are
2-mercaptoethanol (2-ME), L-cysteine (CYS), reduced-glutathione (GSH),
thiocyanate (SCN-), S-nitrosoglutathione (GSNO) and oxygen. 2-ME is a thiol
that is involved in cleaving protein disulfide bonds in humans133. This disulfide
bond intermolecular cleavage allows protein subunits to separate facilitating
migration. CYS is a non-essential thiolic amino acid that maintains the
structure of proteins in our bodies amongst its numerous biological roles134.
GSH is an endogenous antioxidant that plays a major role in reducing reactive
oxygen species formed during cellular metabolism and the respiratory
burst135. It also forms disulfide bonds with cysteine residues in proteins. The
above-mentioned thiols namely 2-ME, CYS and GSH are involved in industrial
processes as well; such as oil-sweetening136 and food deterioration
marking137. Consequently, they end up being pollutants.
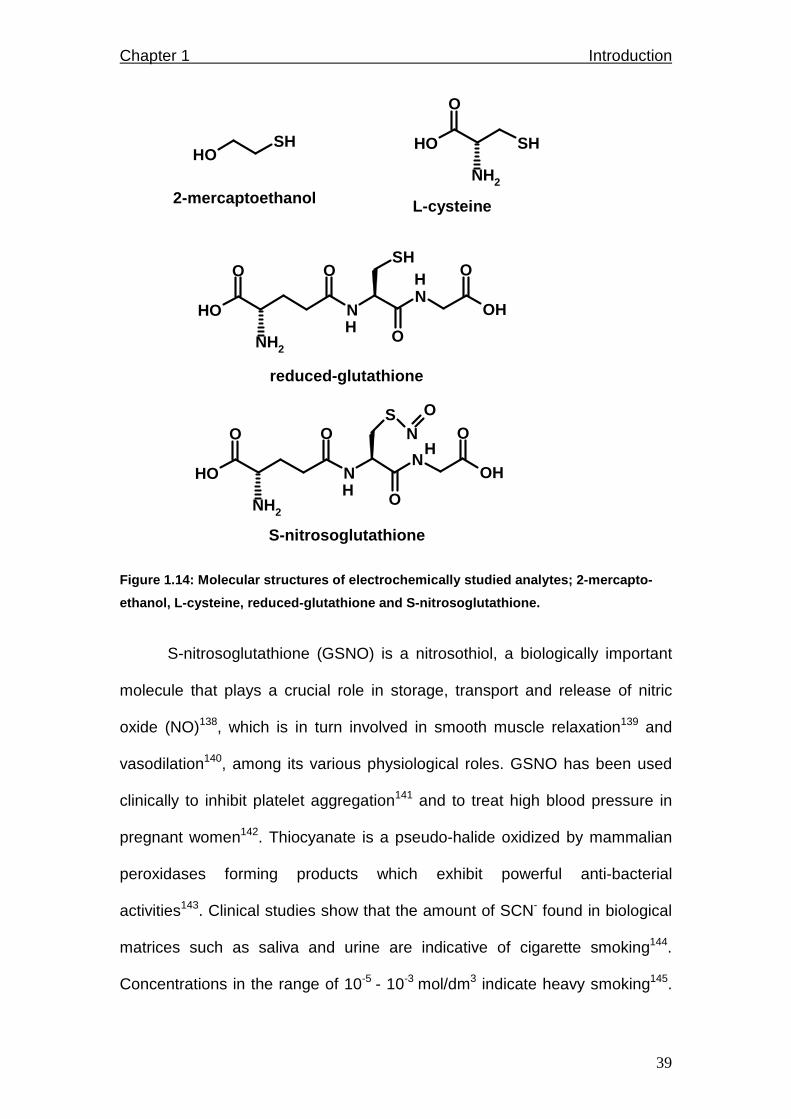
Chapter 1 Introduction
39
OH NN
OH
O O O
O
SH
NH2
H
H
OH SH
O
NH2
OHSH
NH2
H
HN
OH NN
OH
O O O
O
S O
2-mercaptoethanol L-cysteine
reduced-glutathione
S-nitrosoglutathione
Figure 1.14: Molecular structures of electrochemica lly studied analytes; 2-mercapto-
ethanol, L-cysteine, reduced-glutathione and S-nitrosoglutathione.
S-nitrosoglutathione (GSNO) is a nitrosothiol, a biologically important
molecule that plays a crucial role in storage, transport and release of nitric
oxide (NO)138, which is in turn involved in smooth muscle relaxation139 and
vasodilation140, among its various physiological roles. GSNO has been used
clinically to inhibit platelet aggregation141 and to treat high blood pressure in
pregnant women142. Thiocyanate is a pseudo-halide oxidized by mammalian
peroxidases forming products which exhibit powerful anti-bacterial
activities143. Clinical studies show that the amount of SCN- found in biological
matrices such as saliva and urine are indicative of cigarette smoking144.
Concentrations in the range of 10-5 - 10-3 mol/dm3 indicate heavy smoking145.
Chapter 1 Introduction
40
Oxygen is a source of life; it generates energy in our bodies. The same
capacity is exploited industrially in fuel cells146.
The above analytes need to be studied, detected and quantified. This
will provide invaluable insight into their biological and industrial properties,
their levels in the environment and bodies, as well as ways of eliminating or
reducing their pollutant capacity. In this work, they will be studied by
electrochemical techniques where electrochemical sensors will be employed.
These methods are so chosen because of their inherent sensitivity, selectivity,
simplicity, facileness and low detection limits.
1.4.1 Electrocatalysis of thiocyanate oxidation
Oxidation of thiocyanate occurs at high overpotentials on conventional
electrodes, hence the need for catalysis. Analysis and detection of
thiocyanate anion involves oxidation to dirhodane/thiocyanogen ((SCN)2)
intermediate which subsequently hydrolyzes to form cyanide and sulphate
ions147. This mechanism has been observed for SCN- oxidation by
horseradish peroxidase (HRP) as follows148,
SCN- →HRP SCN• 1.28
SCN• + SCN• → (SCN)2 1.29
3(SCN)2 + 4H2O → CN- + 5SCN- + 8H+ + SO42- 1.30
When catalyzed by lacto-peroxidase (LPO), thiocyanate oxidation occurs at
less positive potentials and greater turnover values via two electron transfer
steps149. The formed thiocyanogen ((SCN)2) intermediate hydrolyzes forming
Chapter 1 Introduction
41
the most stable oxidation product HOSCN which subsequently dissociates at
pH > 5.3150 as follows,
H2O2 + 2SCN- + 2H+ →LPO (SCN)2 + 2H2O 1.31
(SCN)2 + H2O → HOSCN + SCN- + H+ 1.32
HOSCN ⇔ H+ + OSCN- 1.33
HOSCN is obtained at equimolar concentrations of H2O2 and SCN-, CN- may
be formed when the ratio of [H2O2] to [SCN-] exceeds one. Higher turnovers
are obtained with LPO catalysis than HRP because the formed CN- in the
latter binds with the heme Fe deactivating the enzyme. SCN- oxidation
products vary with the type of enzyme used depending on initial binding sites
of SCN- with the enzyme151,152.
Catalysts containing Fe are the most efficient because Fe is the
catalytic moiety of biological enzymes such as Cytochrome P450s which
catalyze SCN- oxidation reactions. Direct one step two-electron oxidation of
SCN- in the presence of Fe(V) or Fe(III) has been reported153. The lowest
overpotential has been observed in acidic conditions, pH 4 being the
optimum154. Literature is scanty on SCN- oxidation catalyzed by MPcs. The
reaction occurs in pH 4 buffer solutions at about 0.72 V versus the saturated
calomel electrode (SCE) on bare gold and on MPc-SAMs as tabulated in
Table 1.1155. The most promising electrocatalysis was by a self-assembled
monolayer of FePc axially ligated to mercaptopyridine on gold electrodes
where SCN- oxidation occurred at 0.6 V/(SCE) in pH 4 buffer solution106. The
proposed mechanism involved axial ligation of SCN- to the central metal of the
MPc, followed by oxidation to HSCN as follows156;
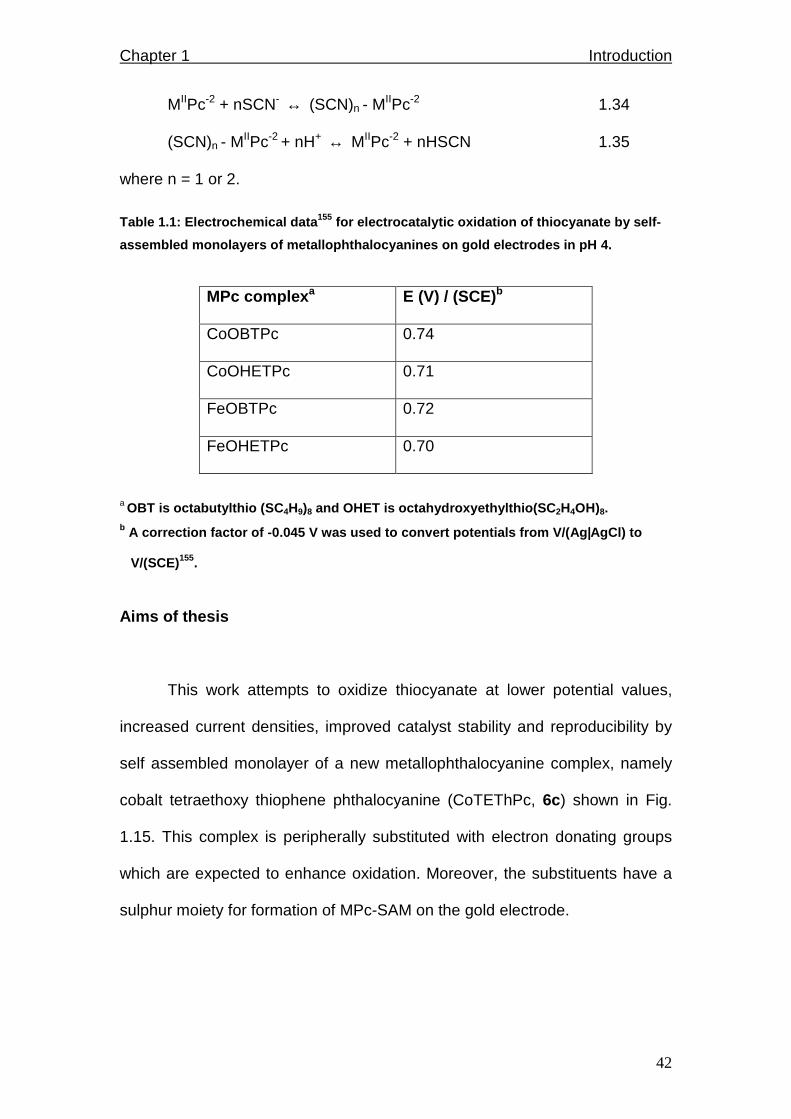
Chapter 1 Introduction
42
MIIPc-2 + nSCN- ↔ (SCN)n - MIIPc-2 1.34
(SCN)n - MIIPc-2 + nH+ ↔ MIIPc-2 + nHSCN 1.35
where n = 1 or 2.
Table 1.1: Electrochemical data 155 for electrocatalytic oxidation of thiocyanate by se lf-
assembled monolayers of metallophthalocyanines on g old electrodes in pH 4.
MPc complex a E (V) / (SCE)b
CoOBTPc 0.74
CoOHETPc 0.71
FeOBTPc 0.72
FeOHETPc 0.70
a OBT is octabutylthio (SC 4H9)8 and OHET is octahydroxyethylthio(SC 2H4OH)8. b A correction factor of -0.045 V was used to conver t potentials from V/(Ag ||||AgCl) to V/(SCE)155.
Aims of thesis
This work attempts to oxidize thiocyanate at lower potential values,
increased current densities, improved catalyst stability and reproducibility by
self assembled monolayer of a new metallophthalocyanine complex, namely
cobalt tetraethoxy thiophene phthalocyanine (CoTEThPc, 6c) shown in Fig.
1.15. This complex is peripherally substituted with electron donating groups
which are expected to enhance oxidation. Moreover, the substituents have a
sulphur moiety for formation of MPc-SAM on the gold electrode.
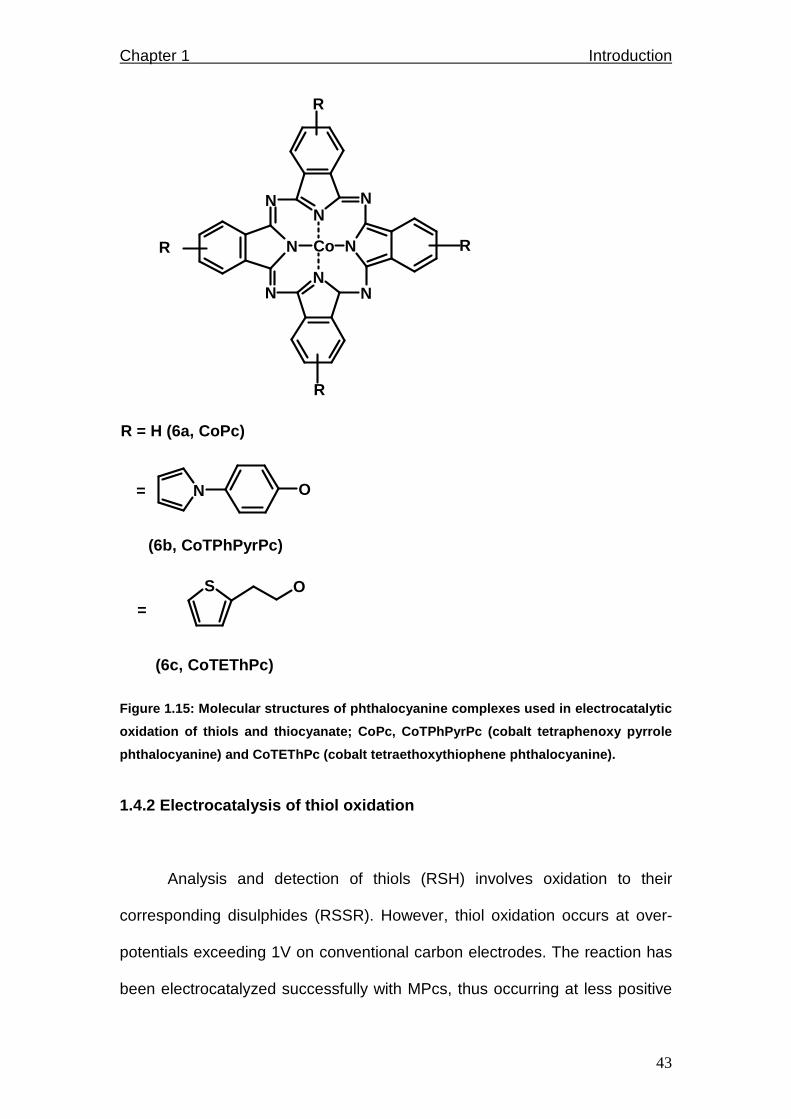
Chapter 1 Introduction
43
NNN
N
N
N
NN
Co
R
R
R
R
N O
S O
=
(6b, CoTPhPyrPc)
=
(6c, CoTEThPc)
R = H (6a, CoPc)
Figure 1.15: Molecular structures of phthalocyanine complexes used in electrocatalytic
oxidation of thiols and thiocyanate; CoPc, CoTPhPyr Pc (cobalt tetraphenoxy pyrrole
phthalocyanine) and CoTEThPc (cobalt tetraethoxythi ophene phthalocyanine).
1.4.2 Electrocatalysis of thiol oxidation
Analysis and detection of thiols (RSH) involves oxidation to their
corresponding disulphides (RSSR). However, thiol oxidation occurs at over-
potentials exceeding 1V on conventional carbon electrodes. The reaction has
been electrocatalyzed successfully with MPcs, thus occurring at less positive
Chapter 1 Introduction
44
overpotentials. MPcs with cobalt as the central metal exhibited the best
catalytic behaviour for thiol oxidation amongst other transition metals157, and
this was attributed to good orbital overlap between its d-orbitals ( xzd and 2zd )
and the thiol sp-orbitals as predicted by perturbation theory. It has also been
reported that thiol oxidation occurs at lower potentials in alkaline media
because of predominance of thiolate ions; pKas of 2-ME, CYS and GSH lie
between 8 and 10158. At pH greater than 8, thiolate anions are prevalent,
readily available to interact with catalysts and subsequently get oxidized.
Shortcomings encountered with use of MPcs in thiol oxidation reactions
include short catalyst lifetime, irreproducibility and instability9. Electrodes
modified by adsorbed MPcs are short-lived because of weak interactive forces
between the electrode and the MPc. Their electropolymerized counterparts
have compact films hence are more thermally and chemically long-lasting159.
The only great challenge with the latter is initiating polymerization and
obtaining reproducible films since it depends strongly on electrode material,
polishing and the MPc monomer solution.
Thiol oxidation occurs via various mechanisms depending on the
reaction conditions and the catalytic site. L-cysteine oxidation in pH 4
catalyzed by ring processes of some platinum group metal phthalocyanines
was discussed above, equations 1.19 – 1.21. Catalysis mediated by metal
oxidized MPcs was also described above in equations 1.16 – 1.18. Moreover,
thiols can reduce central metals of MPcs to form coordinate adducts. These
intermediates subsequently get oxidized, disintegrate and release thiolate
radicals that dimerize to form disulphides by eqs. 1.36 – 1.40160;
Chapter 1 Introduction
45
R-SH → RS- + H+ 1.36
RS- + PcMII → [PcMI – (SR)]- 1.37
[PcMI – (SR)]- → sdr .. [PcMII – (SR)] + e- 1.38
[PcMII – (SR)] → PcMII + RS• 1.39
RS• + RS• → fast RS-RS 1.40
where r.d.s is the rate-determining step. Other abbreviations are as defined
earlier.
There are numerous reports on electrocatalytic thiol oxidation mediated
by MPcs. These were conducted on different electrode materials, electrolytes,
pH media, catalysts as well as different mode of electrode modification. 2-ME,
CYS and GSH oxidations data is tabulated in Table 1.2. Thiol oxidation occurs
easily in alkaline media because thiols readily dissociate in such media,
thereby interacting with catalysts, and consequently getting oxidized. This is
recapitulated in Table 1.2 whereby 2-ME oxidation is reported only in alkaline
solutions. This work therefore aims to carry out thiol oxidation in acidic
conditions and at lower potentials than already reported. This will enable
eradication of thiols in industrial waste regardless of pH of the effluents.

Chapter 1 Introduction
46
Table 1.2: Electrochemical data 155 for 2-mercaptoethanol, l-cysteine and reduced
glutathione oxidation.
Complex a Electrode Method of
Modification Analyte E (V) /
(SCE)b Medium
CoTAPc GCE Polymer 2-ME -0.29 0.5 M NaOH
CoTAPc GCE Drop-dry 2-ME -0.32 0.5 M NaOH
CoOBTPc Au SAM CYS 0.38 pH 4
CoOHETPc Au SAM CYS 0.46 pH 4
CoPc GCE Deposition CYS 0.63 pH 3.5
CoPc GCE Deposition CYS -0.03 pH 9
CoTSPc OPGE Dip-dry CYS 0.2 0.2 M NaOH
CoPcc OPGE Drop-dry GSH 0.0 pH 7.4
aTA is tetraamino, TS is tetrasulphonato, OBT and OH ET are as defined above.
b A correction factor of -0.045 V was used to convert potentials from V/(Ag ||||AgCl) to
V/(SCE)155. creference 161
Aims of thesis
To oxidize 2-mercaptoethanol, L-cysteine and reduced-glutathione at
reduced overpotentials, increased current intensities, faster electron transfer
rates in a wide pH range and increased detection limits using the following
new metallo-phthalocyanine complexes (Fig. 1.15): Cobalt tetraphenoxy
pyrrole phthalocyanine (CoTPhPyrPc, 6b) and cobalt tetraethoxy thiophene
phthalocyanine (CoTEThPc, 6c). These complexes have cobalt as the central
metal because it has been reported to exhibit excellent electrocatalytic
behaviour towards thiol oxidation. Phenoxy pyrrole ligand is used as a

Chapter 1 Introduction
47
substituent because it can polymerize via the pyrrole group101. The ethoxy
thiophene ligand induces self-assembly capability to the MPc via the sulphur
group. Moreover, phenoxy pyrrole and ethoxy thiophene substituents are
electron donating, making cobalt easy to oxidize93, thus enhancing thiol
oxidation.
1.4.3 Decomposition of nitrosothiols
Nitrosothiols (RSNO) decompose in human bodies via homolytic
cleavage of the S-N bond yielding nitric oxide (NO) and the corresponding
disulphide (RSSR)162. Copper and selenium containing proteins have been
reported to catalyze this reaction in biological systems163. Furthermore,
homolytic cleavage of RSNOs can be triggered by light164 or reduced metal
catalysis165 such as Cu+. Small molecular weight thiols such as glutathione
and cysteine mediate nitrosothiol decomposition by reduced metal ion
catalysis. Chemically synthesized reducing agents such as sodium
borohydride (NaBH4) and sodium dithionite (Na2S2O4) still perform the same
function166. GSNO decomposition catalyzed by cupric ions occurs via the
following sequence,
GSNO →+Cu GS• + NO 1.41
GS• + GS• → GSSG 1.42
It has been reported that reduced metal ions are more efficient
catalysts than their oxidized counterparts. However, metal salts in the reduced
oxidation state (eg. Cu+) are unstable. Their higher valency counterparts are
Chapter 1 Introduction
48
used instead, reduced in situ and dissipated in nitrosothiol decomposition
before reoxidation; hence the use of reducing agents. The catalytic redox
state of copper was investigated by comparison of degree of a decline in
amount of nitric oxide detected in the presence of chelating agents167. The
amount of nitric oxide detected was lower in the presence of copper (I)
chelator (neocuproine) showing that free copper (I) is needed, thus the
catalytic redox state is +1.
Nitric oxide can be detected by various methods such as use of Clark-
type electrodes168. Detection of nitric oxide is difficult because of its low
concentration, high activity and fleeting presence. NO is an extremely
powerful ligand, it reacts with hemeproteins, metalloenzymes, non-heme
metal complexes to form various adducts169. On the other hand, disulphides
can be detected electrochemically using cobalt phthalocyanine modified
carbon electrodes161,170. Concentrations in the micromolar range can be
detected with high sensitivity; ideal for biological applications.
S-nitrosoglutathione decomposition reaction has been studied
extensively in physiological conditions by detecting NO release166,167, whose
challenges have been mentioned above. It is therefore important to study this
reaction by detecting GSSG, so as to have a complete sketch of the overall
GSNO decomposition process.
This work explores for the first time GSH/GSSG detection from Cu+-
catalyzed GSNO decomposition using an ordinary pyrolytic graphite (OPG)
electrode modified by adsorption of cobalt phthalocyanine, complex 6a; the
reaction being monitored by cyclic voltammetry. Detection limits are aimed at
Chapter 1 Introduction
49
micromolar range or less for application in biological systems where GSNO
decomposition takes place.
1.4.4 Electrocatalysis of oxygen reduction
Oxygen reduction is a very important biological and industrial reaction.
It is a cathode reaction in fuel cells, potentially efficient, emission free energy
source171. The reaction should occur at the least negative potential for
efficient energy production. It is desirable that the reaction goes to completion
and forms water via a four electron transfer mechanism. However, oxygen
gets reduced to hydrogen peroxide via a two electron process but the
peroxide can still get reduced further via another two electron process to form
water.
Platinum electrocatalyzes oxygen reduction to water in fuel cells172,
hence yielding high power output. However, in direct methanol fuel cells, Pt is
not methanol tolerant173. Also, Pt is a noble and expensive metal hence
substitutes have to be found. Generally, fuel cell catalysts should catalyze
four-electron oxygen reduction, be thermally and chemically stable, have a
long lifetime and tolerate the fuel used. Moreover, the reaction product water
should be easily managed146.
N4 metal chelates such as metallophthalocyanines (MPcs),
metalloporphyrins (MPs) and metallotetraaza-annulenes (MTAA) have been
studied as precious metal fuel cell alternative electrocatalysts174. Porphyrins
interact with oxygen in nature so oxygen reduction is not alien to them175.
However, porphyrins are not thermally and chemically stable. They cannot

Chapter 1 Introduction
50
withstand harsh fuel cell environments hence are short-lived. Furthermore,
they mostly catalyze two electron transfer which subsequently yields low
energy output176. Stability can be improved by pyrolysis at high temperatures
(300 - 900ºC)177, but this entails alteration of integrity of the macrocycles and
it becomes difficult to identify the nature of the catalytic site. Also, some
porphyrin complexes sublime at such elevated temperatures. Oxygen
reduction catalysis via four electron transfer can be improved by using thick
films and this is achieved by polymerization178. Pyrolysis also promotes four
electron oxygen reduction177.
MPcs have improved chemical and thermal stability compared to MPs,
hence are the most promising candidates. MPcs have good tolerance of fuel
electrolytes such as acids171, polymers172 and methanol173. Generally, MPcs
are efficient in alkaline solutions even though this medium poses difficulty of
electrolyte decarbonation179. Performance of MPcs depends on the central
metal, ligands and support180. Their activity towards oxygen reduction is better
with dimeric species than their monomeric counterparts. This was observed
with µ-oxo-bridged dimer of iron (III) pyridine Pc181. The geometry is cofacial
on electrodes facilitating coordination and splitting of oxygen. It has been
reported that metals with half-filled d-orbitals such as Fe and Mn are better
oxygen reduction catalysts182. The net MPc catalytic activity is linked to the
redox potential of the MIII/II process; the more positive the redox potential, the
higher the activity183. The redox potential is affected by substituents as well;
electron donating ligands shift it to the negative while electron withdrawing
ones shift it to the positive184.
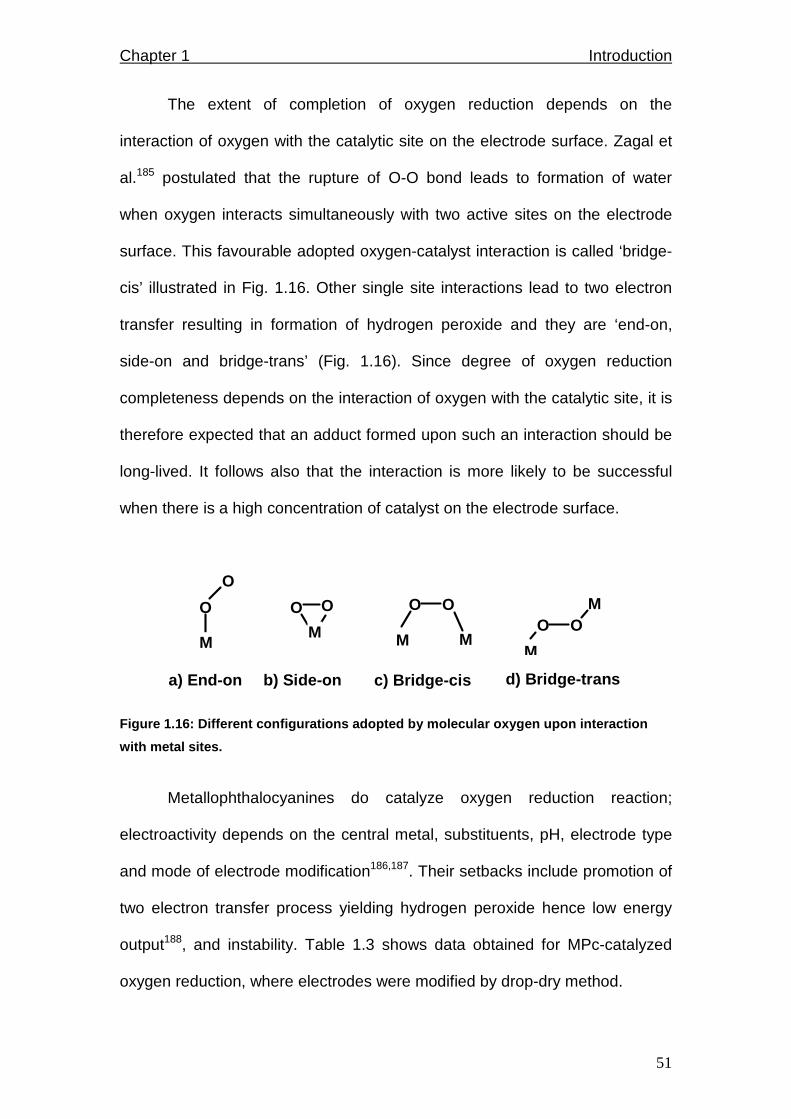
Chapter 1 Introduction
51
The extent of completion of oxygen reduction depends on the
interaction of oxygen with the catalytic site on the electrode surface. Zagal et
al.185 postulated that the rupture of O-O bond leads to formation of water
when oxygen interacts simultaneously with two active sites on the electrode
surface. This favourable adopted oxygen-catalyst interaction is called ‘bridge-
cis’ illustrated in Fig. 1.16. Other single site interactions lead to two electron
transfer resulting in formation of hydrogen peroxide and they are ‘end-on,
side-on and bridge-trans’ (Fig. 1.16). Since degree of oxygen reduction
completeness depends on the interaction of oxygen with the catalytic site, it is
therefore expected that an adduct formed upon such an interaction should be
long-lived. It follows also that the interaction is more likely to be successful
when there is a high concentration of catalyst on the electrode surface.
O
O
O O O O
MO O
M
MM M
M
a) End-on b) Side-on c) Bridge- cis d) Bridge- trans
Figure 1.16: Different configurations adopted by mo lecular oxygen upon interaction
with metal sites.
Metallophthalocyanines do catalyze oxygen reduction reaction;
electroactivity depends on the central metal, substituents, pH, electrode type
and mode of electrode modification186,187. Their setbacks include promotion of
two electron transfer process yielding hydrogen peroxide hence low energy
output188, and instability. Table 1.3 shows data obtained for MPc-catalyzed
oxygen reduction, where electrodes were modified by drop-dry method.
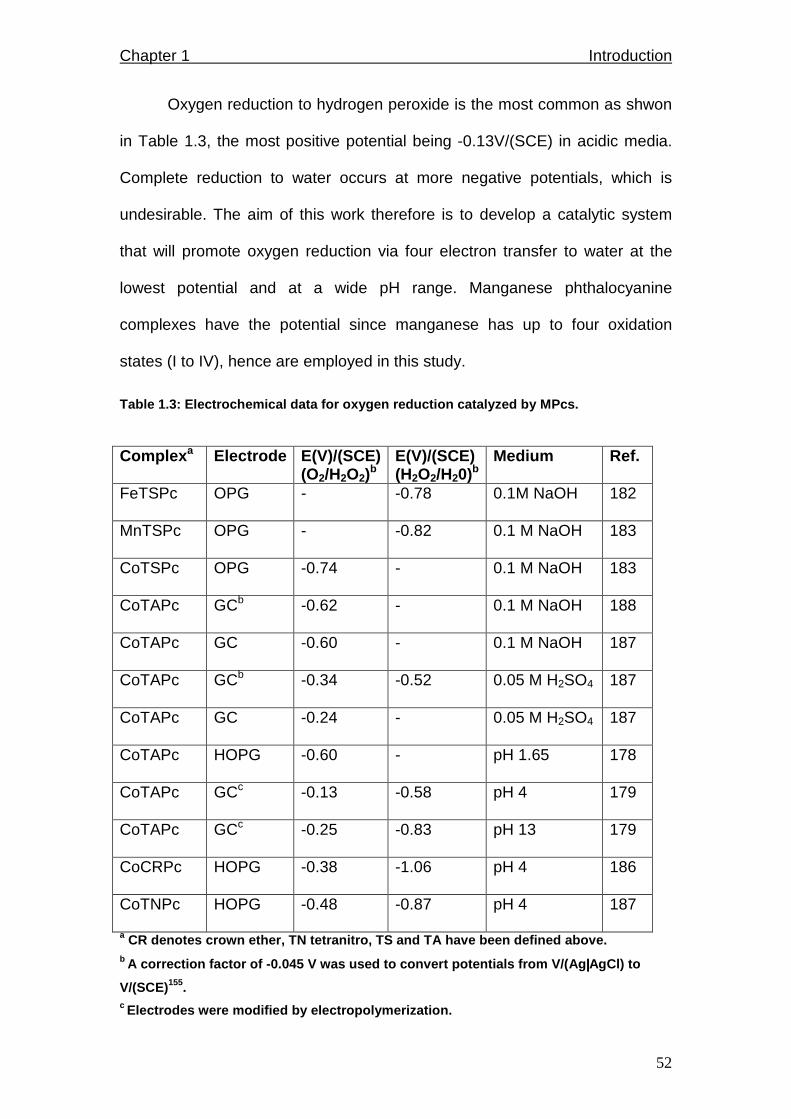
Chapter 1 Introduction
52
Oxygen reduction to hydrogen peroxide is the most common as shwon
in Table 1.3, the most positive potential being -0.13V/(SCE) in acidic media.
Complete reduction to water occurs at more negative potentials, which is
undesirable. The aim of this work therefore is to develop a catalytic system
that will promote oxygen reduction via four electron transfer to water at the
lowest potential and at a wide pH range. Manganese phthalocyanine
complexes have the potential since manganese has up to four oxidation
states (I to IV), hence are employed in this study.
Table 1.3: Electrochemical data for oxygen reductio n catalyzed by MPcs.
Complex a Electrode E(V)/(SCE)
(O2/H2O2)b E(V)/(SCE) (H2O2/H20)b
Medium Ref.
FeTSPc OPG - -0.78 0.1M NaOH 182
MnTSPc OPG - -0.82 0.1 M NaOH 183
CoTSPc OPG -0.74 - 0.1 M NaOH 183
CoTAPc GCb -0.62 - 0.1 M NaOH 188
CoTAPc GC -0.60 - 0.1 M NaOH 187
CoTAPc GCb -0.34 -0.52 0.05 M H2SO4 187
CoTAPc GC -0.24 - 0.05 M H2SO4 187
CoTAPc HOPG -0.60 - pH 1.65 178
CoTAPc GCc -0.13 -0.58 pH 4 179
CoTAPc GCc -0.25 -0.83 pH 13 179
CoCRPc HOPG -0.38 -1.06 pH 4 186
CoTNPc HOPG -0.48 -0.87 pH 4 187
a CR denotes crown ether, TN tetranitro, TS and TA h ave been defined above. b A correction factor of -0.045 V was used to convert potentials from V/(Ag ||||AgCl) to
V/(SCE)155. c Electrodes were modified by electropolymerization.

Chapter 1 Introduction
53
Aims of thesis
To conduct oxygen reduction on glassy carbon electrode modified by
adsorption of manganese phthalocyanine complexes. The reaction is
expected to occur at positive potentials in a wide pH range, via four electron
transfer process on stable, long-lived catalysts. Manganese is used as a
central metal because it has been reported to exhibit the best electrocatalytic
behavior towards oxygen reduction. This is because its d-orbitals are half
filled and of energy that allows constructive overlap and energy transfer with
the p-orbitals of oxygen189. Complexes employed are (Fig. 1.17): a)
manganese phthalocyanine (MnPc, 7a), b) manganese tetraamino
phthalocyanine (MnTAPc, 7b), c) manganese tetrapentoxy pyrrole
phthalocyanine (MnTPePyrPc, 7c), d) manganese tetraphenoxy pyrrole
phthalocyanine (MnTPhPyrPc, 7d), e) manganese tetramercapto pyrimidine
phthalocyanine (MnTMerPyPc, 7e) and f) manganese tetraethoxy thiophene
phthalocyanine (MnTEThPc, 7f). All complexes are new except MnPc and
MnTAPc, allowing investigation of substituents effect on electrocatalytic
activity.
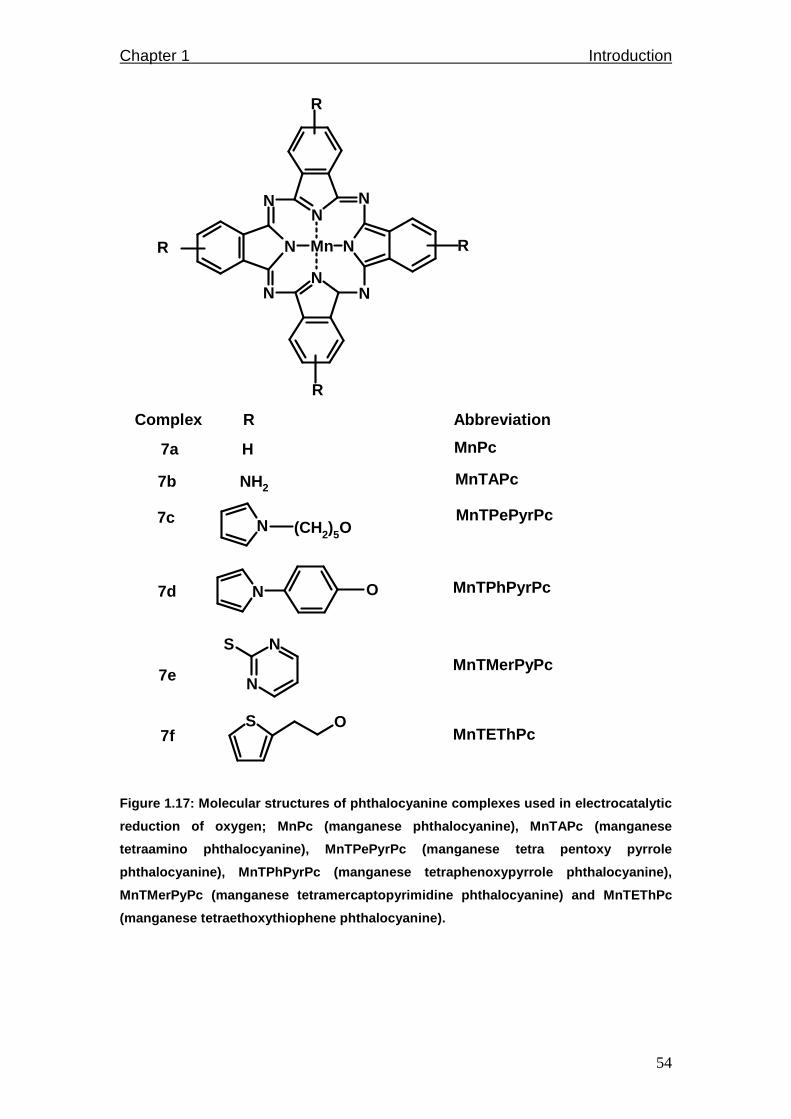
Chapter 1 Introduction
54
NNN
N
N
N
NN
Mn
R
R
R
R
N
N
N
NS
(CH2)5O
S O
MnTPePyrPc
MnTPhPyrPc
MnTEThPc
MnTMerPyPc
7a H
Complex R Abbreviation
7b NH2
7c
7d
7e
7f
O
MnTAPc
MnPc
Figure 1.17: Molecular structures of phthalocyanine complexes used in electrocatalytic
reduction of oxygen; MnPc (manganese phthalocyanine ), MnTAPc (manganese
tetraamino phthalocyanine), MnTPePyrPc (manganese t etra pentoxy pyrrole
phthalocyanine), MnTPhPyrPc (manganese tetraphenoxy pyrrole phthalocyanine),
MnTMerPyPc (manganese tetramercaptopyrimidine phtha locyanine) and MnTEThPc
(manganese tetraethoxythiophene phthalocyanine).
Chapter 1 Introduction
55
1.5 Use of metallophthalocyanines in biomimetic ca talysis
This section describes the use of MPcs as biomimetic catalysts in
addition to electrocatalysis described above. Experiments were undertaken to
explore biomimetic catalytic activity of MPcs for oxidation of a selected
substrate cyclohexene. Cyclohexene is produced in large quantities by
petroleum industrial companies as waste or bi-products. It is therefore
imperative to re-use such compounds for other purposes as a way of
conserving our already-scarce and depleted natural resources. Alkenes can
be partially oxidized to fine chemicals such as alcohols, ketones and
aldehydes; which can then be used for other beneficial purposes. Alkene
oxidation reactions have been conducted by use of oxidizing agents but these
reactions are very slow and yield minute products. There is a need to speed
up the reactions, to keep up with the rate of alkene production from petroleum
industries as well as increase oxidation product yields.
Biomimetic catalysis stems from catalytic activity of a family of
enzymes called Cytochrome P450 which catalyzes numerous oxidation
reactions that occur in human bodies. These enzymes have a -haem group
(porphyrin) and they use the Fe moiety as a catalyst. Porphyrins have been
synthesized and used to mimic the behaviour of Cytochrome P450
enzymes190. Porphyrins have been used as catalysts in oxidation of alkanes
and alkenes with great success191. The only setback is chemical and thermal
instability192. This was however circumvented by ring substitution with electron
withdrawing ligands193.
Chapter 1 Introduction
56
Phthalocyanines have been used as catalysts for alkane and alkene
oxidation reactions to mimic Cytochrome P450s194. Phthalocyanines have
improved thermal and chemical stability; they are cheaper and more readily
available than porphyrins. Their resistance towards oxidative degradation and
catalytic capability are also improved by ring substitution with electron
withdrawing groups such as halogens195. Metallophthalocyanines oxidize the
relatively inert carbon-hydrogen bonds in the presence of oxidants (ROOH)
according to the overall mechanism, eq. 1.43 – 1.44196,
MnPc + 2ROOH → [Mn+1Pc]+ + ROO• + RO• + H2O 1.43
ROO•, RO• + C=C → epoxide, alcohol, ketone 1.44
where ROO• + RO• are oxidant radicals. The reaction involves interaction of
MPcs with oxidants forming high valent intermediates and oxidant radicals.
The latter yield epoxides by addition to the olefin double bond or allylic
oxidation products such as alcohols and ketones by abstracting an allylic
hydrogen atom197. No oxidation products are detected when oxidation
reactions occur in the presence of radical scavengers showing involvement of
radicals198.
Oxidation of alkanes and alkenes by MPcs allows control of the active
form of oxygen, hence results in selectivity of formed products. Product
selectivity has been reported to depend also on the nature of oxidant used199;
cyclohexene epoxidation occurred only when hydrogen peroxide was used as
an oxidant instead of tert-butyl hydroperoxide (TBHP)200. Selectivity can also
be fine-tuned by the type and oxidation state of central metal of the MPc194,
and the ability of the central metal to form µ-oxo or peroxo-bridged
intermediate compounds. CoPc-catalyzed cyclohexene oxidation yields more
Chapter 1 Introduction
57
cyclohexenol than cyclohexenone whereas the inverse holds for FePc
catalyst201. Furthermore, catalytic activity depends on the central metal; higher
cyclohexene oxidation product yields were obtained when Fe was the central
metal, followed by Mn, then Co201.
The solvent in which the reaction occurs affects product selectivity202.
Basic solvents stabilize catalysts against oxidative degradation by their
electron donating ability. Coordinating solvents shield the catalysts from
attack by oxidants. Radicals are stabilized in basic solvents203, hence
prolonging substrate interaction with the catalytic species. Generally, MPc-
catalyzed hydrocarbon oxidations result in high turnover rates, wide product
range and product yields of ~100 %204. Table 1.4 shows data for cyclohexene
oxidation catalyzed by MPs and MPcs yielding cyclohexene epoxide.
Substituted manganese porphyrins were good catalysts205; their
epoxide yields were comparable to those obtained with iron phthalocyanine
complexes. However, they were short-lived since they complexed with the
oxidant forming a very unstable oxo-Mn(V) intermediate. This high valent
intermediate however leads to formation of allylic products (alcohols and
ketones). Amongst the phthalocyanine catalysts, those with iron as the central
metal exhibited highest epoxide yields. This was even more pronounced with
axial206 or ring substitution207, which has been reported to stabilize Pc
complexes against oxidative degradation.

Chapter 1 Introduction
58
Table 1.4: Data for cyclohexene epoxidation catalyz ed by MPs and MPcs.
Catalysta Solvent Oxidant % Yield Ref.
MnM2-OH
PTTP(Ac)
CH2Cl2 O2, (Iodosylbenzene) 49 205
MnM2-Br
PTTP(Ac)
CH2Cl2 O2, (Iodosylbenzene) 55 205
ClFePc CH2Cl2:MeOH: H2O
80:18:2
Iodosylbenzene,
(Imidazole)
56 206
MnPc CH2Cl2 O2, (isobutyraldehyde) 25 201
FePc CH2Cl2 O2, (isobutyraldehyde) 32 201
CoPc CH2Cl2 O2, (isobutyraldehyde) 13 201
FeTTBPc CH2Cl2 O2, (isobutyraldehyde) 57 207
MnTTBPc CH2Cl2 O2, (isobutyraldehyde) 38 207
CoTTBPc CH2Cl2 O2, (isobutyraldehyde) 21 207
a MnM2-OHPTTP(Ac) is (5-(2-hydroxyphenyl)-10,15,20)-tritolyl porphyrinmanganese(III)
acetate, MnM 2-BrPTTP(Ac) is (5-(2-(3-bromo-1-propoxy)phenyl)-10,15, 20)-
tritolylporphyrin manganese(III) acetate and TTBPc is tetra-tert-butylphthalocyanine.
Aims of thesis
To catalyze oxidation of cyclohexene by Cytochrome P450 mimics -
iron poly-chloro phthalocyanine complex (FePc(Cl)16 9, Fig. 1.18) in the
presence of chemical oxidants. Fe is chosen as the central metal because it is
the catalytic moiety in Cytochrome P450 enzymes and FePc complexes gave
highest yields towards cyclohexene oxidation as shown in Table 1.4. The
complex is halogenated on the ring to improve stability against oxidative
degradation. Cyclohexene oxidation has been studied extensively with
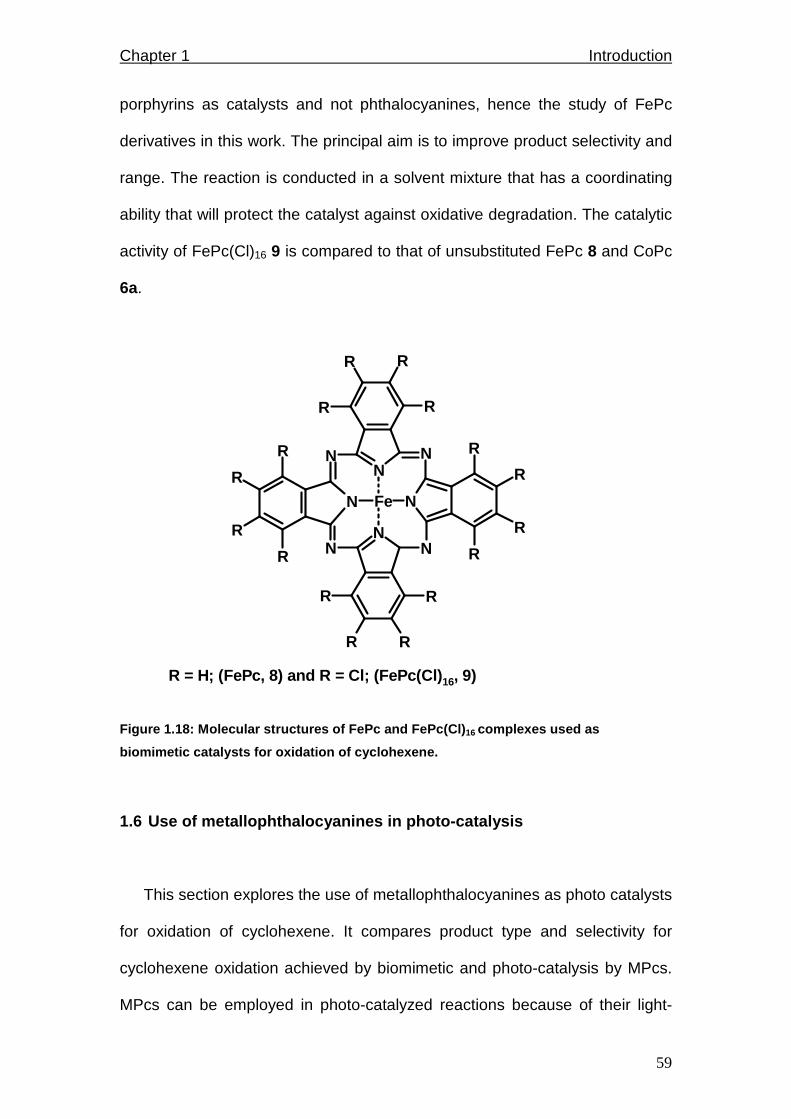
Chapter 1 Introduction
59
porphyrins as catalysts and not phthalocyanines, hence the study of FePc
derivatives in this work. The principal aim is to improve product selectivity and
range. The reaction is conducted in a solvent mixture that has a coordinating
ability that will protect the catalyst against oxidative degradation. The catalytic
activity of FePc(Cl)16 9 is compared to that of unsubstituted FePc 8 and CoPc
6a.
NNN
N
N
N
NN
Fe
R
R
R
R
RR
R
R
R
R
R R
R R
R
R
R = H; (FePc, 8) and R = Cl; (FePc(Cl) 16, 9)
Figure 1.18: Molecular structures of FePc and FePc( Cl)16 complexes used as
biomimetic catalysts for oxidation of cyclohexene.
1.6 Use of metallophthalocyanines in photo-catalys is
This section explores the use of metallophthalocyanines as photo catalysts
for oxidation of cyclohexene. It compares product type and selectivity for
cyclohexene oxidation achieved by biomimetic and photo-catalysis by MPcs.
MPcs can be employed in photo-catalyzed reactions because of their light-
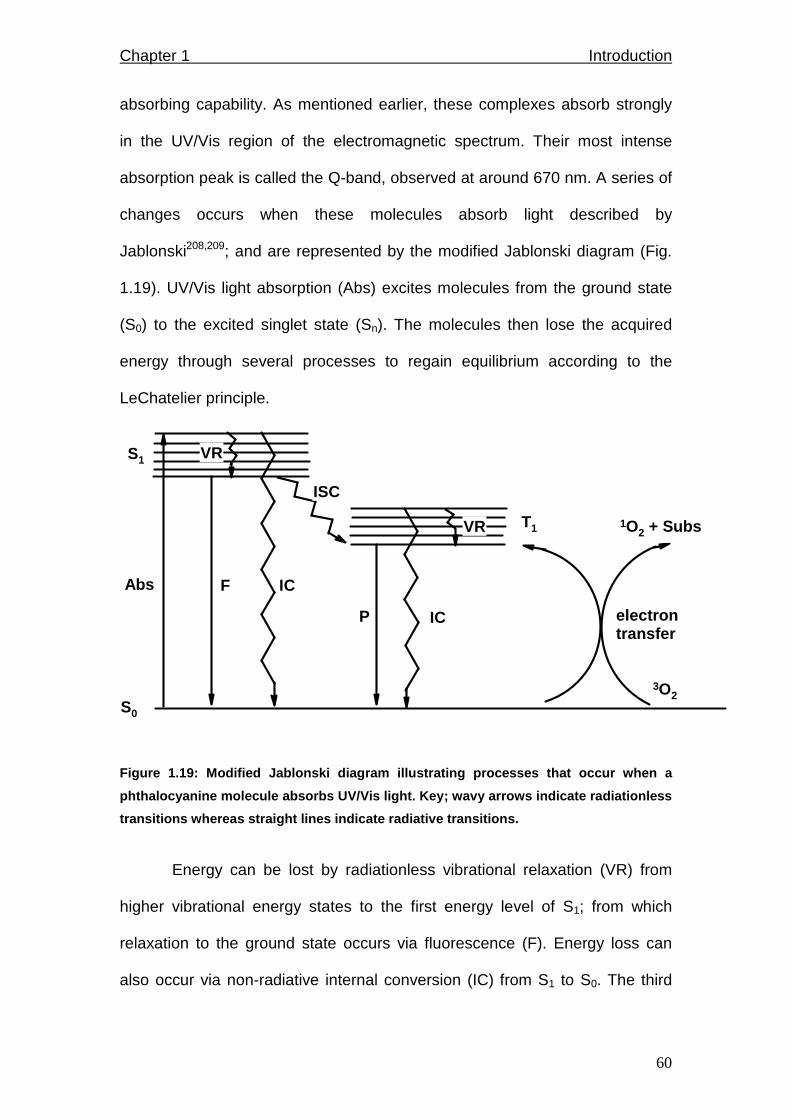
Chapter 1 Introduction
60
absorbing capability. As mentioned earlier, these complexes absorb strongly
in the UV/Vis region of the electromagnetic spectrum. Their most intense
absorption peak is called the Q-band, observed at around 670 nm. A series of
changes occurs when these molecules absorb light described by
Jablonski208,209; and are represented by the modified Jablonski diagram (Fig.
1.19). UV/Vis light absorption (Abs) excites molecules from the ground state
(S0) to the excited singlet state (Sn). The molecules then lose the acquired
energy through several processes to regain equilibrium according to the
LeChatelier principle.
S0
S1
T1
Abs F
P
IC
VR
ISC
IC electrontransfer
VR
3O2
1O2 + Subs
Figure 1.19: Modified Jablonski diagram illustratin g processes that occur when a
phthalocyanine molecule absorbs UV/Vis light. Key; wavy arrows indicate radiationless
transitions whereas straight lines indicate radiati ve transitions.
Energy can be lost by radiationless vibrational relaxation (VR) from
higher vibrational energy states to the first energy level of S1; from which
relaxation to the ground state occurs via fluorescence (F). Energy loss can
also occur via non-radiative internal conversion (IC) from S1 to S0. The third
Chapter 1 Introduction
61
way is via intersystem crossing (ISC), which is transfer from the excited
singlet (S1) to the excited triplet state (T1). Subsequently relaxation to the
ground state occurs via phosphorescence (P) or non-radiative internal
conversion. Alternatively, the first excited triplet state (T1) can interact with
substrates (subs) and induce a series of chemical reactions. In this work,
oxygen is the substrate that absorbs energy getting excited from the triplet to
the singlet state, hence triggering a series of photo-catalyzed reactions.
Cyclohexene is a substrate whose oxidation is photo-catalyzed by zinc
phthalocyanine (ZnPc 10) in this work. The aim is to conduct the reaction
while avoiding catalyst destruction by harsh oxidizing agents as employed in
biomimetic catalysis. Phthalocyanine complexes need to have a diamagnetic
central metal for generation of sufficient singlet oxygen. FePc(Cl)16 employed
in biomimetic catalysis is paramagnetic and cannot be employed in
photocatalysis. Zinc phthalocyanine is used as a photo-catalyst because its
central metal zinc is a diamagnetic metal whose excited singlet state (1MPc*)
is known to undergo intersystem crossing (ISC) to the excited triplet state
(3MPc*) readily. Since the excited triplet state will be highly populated, it is
expected that it will interact constructively with ground triplet state molecular
oxygen (3O2) generating excited singlet state oxygen (1O2). Singlet oxygen is
very reactive and will therefore consequently catalyze the substrate
cyclohexene. This is known as Type II mechanism of photo-catalysis
described by Scheme 1.2210:

Chapter 1 Introduction
62
MPc →hv 1MPc* →ISC 3MPc* 1.45
3MPc* + 3O2 → 1O2 + MPc 1.46
1O2 + substrate → Oxidation products 1.47
Scheme 1.2: Type II mechanism of photo-catalysis.
However, the excited triplet state of the MPc not only generates singlet
state oxygen upon interaction with triplet state oxygen, but also radicals211. It
also interacts with cyclohexene substrate generating radical ions, which
propagate further radical ion formation and subsequently afford catalyzed
substrate oxidation212. This is known as Type I mechanism and it is
represented by Scheme 1.3213:
3MPc* + 3O2 → O2-•+ MPc+• 1.48
3MPc* + Subs → MPc-• + Subs+• 1.49
MPc-•+ 3O2 → O2-•+ MPc 1.50
O2-• →
+H HO2• 1.51
HO2• + Subs→ H2O2+ Subs• 1.52
Subs+•, Subs•, H2O2 → Oxidation products 1.53
Scheme 1.3: Type I mechanism of photo-catalysis. Su bs is substrate, cyclohexene in
this case.
It has been reported that Type II mechanism is more prevalent in
photo-initiated oxidation reactions214, thus the magnitude of singlet oxygen
quantum yields (φ∆) which express the amount of singlet oxygen generated
per quanta of light is often employed as a main criteria in choosing
photosensitizers used in photocatalytic reactions. It is for this reason that
ZnPc is used in this work, since it has been reported to have high φ∆ of ~ 0.6

Chapter 1 Introduction
63
in different organic solvents215,216. Triplet lifetime (τT) of the photosensitizer in
a particular reaction medium should also be considered so as to maximize
efficiency of the reaction. The triplet lifetime should be long enough to interact
constructively with triplet state oxygen. Lifetime of formed radicals should also
be long enough to effect catalysis.
Literature is very scanty on the use of MPcs as alkene photocatalysts.
Cyclohexene oxidation has been performed by metallo-porphyrins
successfully and the results are shown in Table 1.5. Product selectivity has
been observed to vary with ring substituents for the porphyrin of the same
metal217,218. Electron withdrawing substituents increased catalyst stability and
hence improved product yields219, the higher their number, the more
prominent the effect. In most cases, cyclohexene photocatalysis yields mainly
cyclohexene hydroperoxide which disintegrates into cyclohexenol and
cyclohexenone with time220. Generally photocatalyzed cyclohexene oxidation
involves radical mechanism but formed products vary according to the central
metal, substituents and reaction medium.
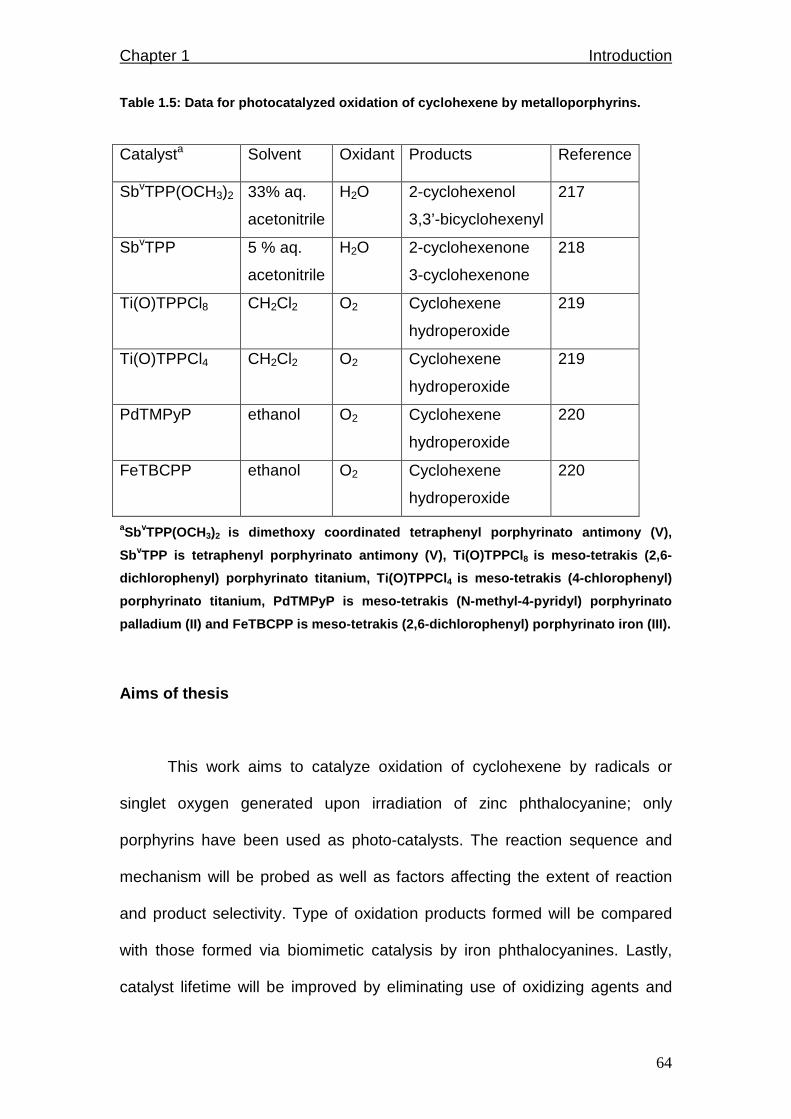
Chapter 1 Introduction
64
Table 1.5: Data for photocatalyzed oxidation of cyc lohexene by metalloporphyrins.
Catalysta Solvent Oxidant Products Reference
SbvTPP(OCH3)2 33% aq.
acetonitrile
H2O 2-cyclohexenol
3,3’-bicyclohexenyl
217
SbvTPP 5 % aq.
acetonitrile
H2O 2-cyclohexenone
3-cyclohexenone
218
Ti(O)TPPCl8 CH2Cl2 O2 Cyclohexene
hydroperoxide
219
Ti(O)TPPCl4 CH2Cl2 O2 Cyclohexene
hydroperoxide
219
PdTMPyP ethanol O2 Cyclohexene
hydroperoxide
220
FeTBCPP ethanol O2 Cyclohexene
hydroperoxide
220
aSbvTPP(OCH3)2 is dimethoxy coordinated tetraphenyl porphyrinato a ntimony (V),
SbvTPP is tetraphenyl porphyrinato antimony (V), Ti(O) TPPCl8 is meso-tetrakis (2,6-
dichlorophenyl) porphyrinato titanium, Ti(O)TPPCl 4 is meso-tetrakis (4-chlorophenyl)
porphyrinato titanium, PdTMPyP is meso-tetrakis (N- methyl-4-pyridyl) porphyrinato
palladium (II) and FeTBCPP is meso-tetrakis (2,6-di chlorophenyl) porphyrinato iron (III).
Aims of thesis
This work aims to catalyze oxidation of cyclohexene by radicals or
singlet oxygen generated upon irradiation of zinc phthalocyanine; only
porphyrins have been used as photo-catalysts. The reaction sequence and
mechanism will be probed as well as factors affecting the extent of reaction
and product selectivity. Type of oxidation products formed will be compared
with those formed via biomimetic catalysis by iron phthalocyanines. Lastly,
catalyst lifetime will be improved by eliminating use of oxidizing agents and
Chapter 1 Introduction
65
thereby investigate the effect of prolonged catalyst presence on product
formation.
1.7 General aims of thesis
Goals of this thesis are summarized as follows:
a) To modify electrodes by adsorption, self-assembly, electrodeposition
and electropolymerization of appropriate metallophthalocyanines
(MPcs, Figs. 1.15 and 1.17) and use them as electrocatalysts for
reduction of molecular oxygen, oxidation of thiocyanate (SCN-), as well
as oxidation of thiols, namely 2-mercaptoethanol (2-ME), L-cysteine
(CYS) and reduced-glutathione (GSH).
b) Use hexadecachloro iron phthalocyanine (FePc(Cl)16) complex as a
biomimetic catalyst for cyclohexene oxidation using tert-
butylhydroperoxide (TBHP) and chloroperoxybenzoic acid (CPBA) as
oxidants. To compare its catalytic activity to that of unsubstituted FePc
and CoPc: To determine the effects of ring substitution with electron
withdrawing chloride anions, nature of central metal and oxidant on
product selectivity, turnovers and yields.
c) Use zinc phthalocyanine (ZnPc) complex as a photocatalyst for
cyclohexene oxidation using singlet oxygen and radicals generated
upon the Pc’s excitation with UV/Vis light. To compare product yields,
selectivity and turnovers with those obtained from biomimetic catalyzed
oxidation reaction.

Chapter 2
Experimental
This section describes experimental procedures carried out in this work.
Chapter 2 Experimental
67
2.1 Materials
Dimethylformamide (DMF), tetrahydrofuran (THF), dichloromethane
(DCM), dimethyl sulphoxide (DMSO), DMSO-d6, methanol, ethanol and
acetone were purchased from SAARCHEM, Johannesburg, South Africa.
They were of HPLC/GC grade and used as received. L-cysteine (CYS), 2-
mercaptoethanol (2-ME), reduced glutathione (GSH), S-nitrosoglutathione
(GSNO), urea, cyclohexanone, tetrabutyl-ammonium tetrafluoroborate
(TBABF4), 1-pentanol, zinc acetate, 5-amino pentanol, 2,5-
dimethoxytetrahydrofuran, cyclohexene, tert-butylhydroperoxide (TBHP, 70%
in water), chloro-peroxybenzoic acid (CPBA), diazabicyclooctane (DABCO),
cyclohexene oxide, 2-cyclohexen-1-ol, 2-cyclohexen-1-one, 1,3-
diphenylbenzofuran (DPBF), 3,4-dichloroanhydride, phthalonitrile, trans-1,2-
cyclohexanediol and adipic acid were purchased from Aldrich, Steinheim,
Germany. They were of analytical reagent grade and used without any further
purification.
Potassium thiocyanate, iodine and bromine were purchased from
Riedel-de Haen, Steinheim, Germany; 2-thienyl-2-ethanol was from Fluka,
Steinheim, Germany; tert-butanol and nitrobenzene were purchased from
Merck, Steinheim, Germany; and they were used as received. Hydrogen
peroxide (H2O2), KH2PO4, K2HPO4, NaBH4, NaOH, Fe(CN)6, Na2HPO4,
NaH2PO4, KOH, Na2SO4, NaCl, KBr, CaCl2, MnCl2, K2CO3, HCl, KCl, HClO4,
Fe(NH4)(SO4)2, CuSO4, H2O2, H2SO4, lithium, potassium iodide, ammonium
molybdate, iron chloride tetrahydrate (FeCl2.4H2O), 2-propanol, glacial acetic
acid, 1,4-dioxane, potassium and sodium thiosulphate, pH 4 and pH 7
Chapter 2 Experimental
68
phosphate buffer tablets were purchased from SAARCHEM, Johannesburg,
South Africa. They were of reagent grade and used as received.
Cellulose acetate was purchased from Sigma Chemical (Paris,
France), whereas graphite powder was from Fluka (Paris, France). Alumina
ceramic plates were purchased from The Laser Cutting Company Ltd.
(Sheffield, UK) while silver-silver chloride ink was from GEM-Gwent
(Pontypool, UK). These reagents were used as received. Iron (II)
phthalocyanine (FePc) and cobalt phthalocyanine (CoPc) were purchased
from Aldrich (Steinheim, Germany) while MnPc was from EASTMAN (Miami,
USA). They were of analytical reagent grade and used without any
purification. Zinc phthalocyanine and iron hexadecachloro phthalocyanine
(FePc(Cl)16) were synthesized; the procedure is outlined below.
Cobalt tetra phenoxypyrrole phthalocyanine (CoTPhPyrPc 6b)101 and
cobalt tetra ethoxythiophene phthalocyanine (CoTEThPc 6c)221 were
synthesized and characterized as reported by our research group, as well as
manganese complexes tetra substituted with amino (MnTAPc 7b)112, phenoxy
pyrrole (MnTPhPyrPc 7d)101, mercaptopyrimidine (MnTMerPyPc 7e)222 and
ethoxy thiophene (MnTEThPc 7f)221. The synthesis of pentoxy pyrrole
substituted MnPc (MnTPePyrPc 7c) will be discussed below.
2.2 Apparatus
Electrochemical experiments were carried out using the conventional
three-electrode cell system and a Princeton Applied Research Inc.
potentiostat/galvanostat model 263A (USA) or a BioAnalytical Systems (BAS)

Chapter 2 Experimental
69
100 B/W Electrochemical Workstation. pH values were measured using a pH
meter (WTW, Germany).
IR spectra (KBr pellets) were recorded on a Perkin-Elmer spectrum
2000 Fourier Transform Infrared (FTIR) spectrometer. 1H-nuclear magnetic
resonance (1H-NMR, 400 MHz) spectra were obtained in DMSO-d6 using
Bruker EMX 400 NMR spectrometer. Adsorption column chromatography was
performed using silica gel 60 (0.040 - 0.063 mm) obtained from Merck.
Elemental analyses were performed with a Carlo Erba NA 1500 Nitrogen
analyzer at the University of the Western Cape, Cape Town, South Africa.
The GC traces were recorded with a Hewlett-Packard HP 5890 Gas
Chromatograph fitted with an FID detector, using a cross-linked methyl
siloxane capillary column (30 m length, 0.32 mm internal diameter and 0.25
µm film thickness). The parameters for analysis were: carrier gas N2 at 30.7
cm s-1, injector temperature = 200 °C, detector temperature = 250 °C. Mass
spectra were recorded with Finnnigan LCQ-MS coupled with J & W Scientific
column of 30 m length, 0.32 mm internal diameter and 0.25 µm film
thickness. UV/Visible spectra were recorded with the Cary 500 UV/Visible/NIR
spectrophotometer.
Irradiation in the visible region was carried out with a General Electric
Quartz line lamp (300 W), with a 600 nm glass cut off filter (Schott) being used
to filter off ultraviolet light, leaving the Pc’s Q-band; the excitation area of
interest. The photolysis set-up is shown in Fig. 2.1. For irradiation using white
light, the 600 nm glass filter was left out. The light intensity was measured
with a power meter (POWER MAX5100-with incorporated Molectron detector)
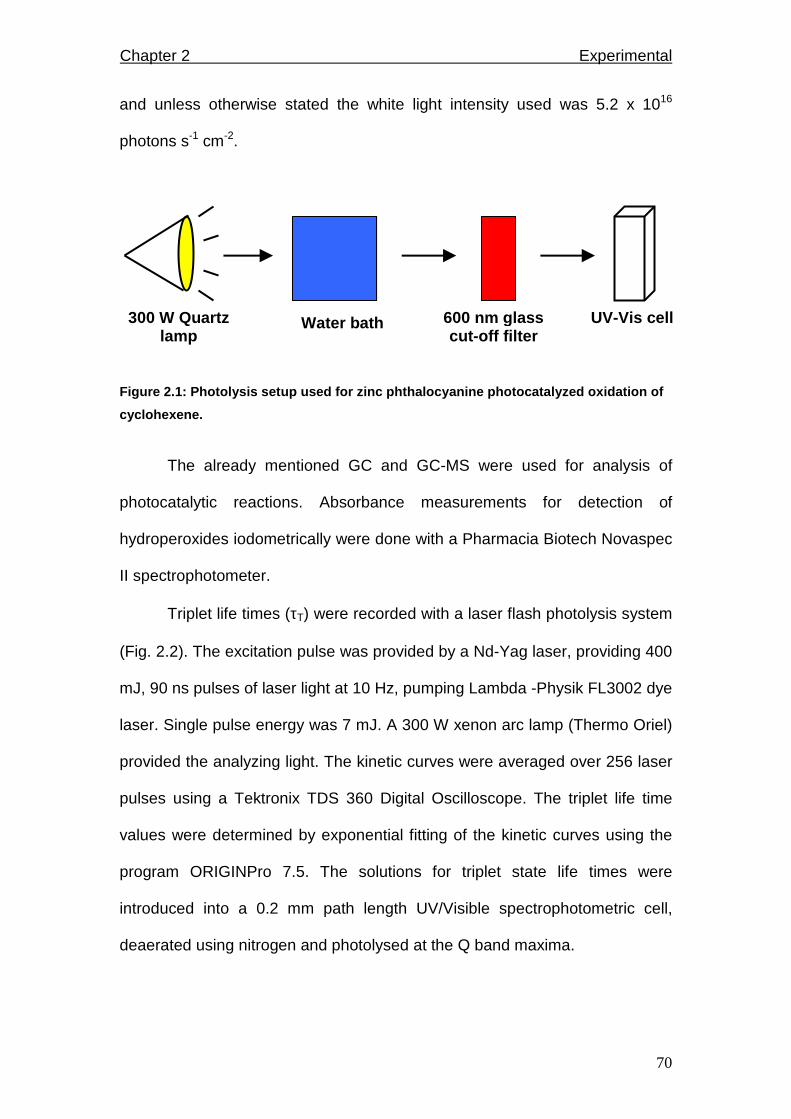
Chapter 2 Experimental
70
and unless otherwise stated the white light intensity used was 5.2 x 10¹⁶
photons s-1 cm-2.
Figure 2.1: Photolysis setup used for zinc phthaloc yanine photocatalyzed oxidation of
cyclohexene.
The already mentioned GC and GC-MS were used for analysis of
photocatalytic reactions. Absorbance measurements for detection of
hydroperoxides iodometrically were done with a Pharmacia Biotech Novaspec
II spectrophotometer.
Triplet life times (τT) were recorded with a laser flash photolysis system
(Fig. 2.2). The excitation pulse was provided by a Nd-Yag laser, providing 400
mJ, 90 ns pulses of laser light at 10 Hz, pumping Lambda -Physik FL3002 dye
laser. Single pulse energy was 7 mJ. A 300 W xenon arc lamp (Thermo Oriel)
provided the analyzing light. The kinetic curves were averaged over 256 laser
pulses using a Tektronix TDS 360 Digital Oscilloscope. The triplet life time
values were determined by exponential fitting of the kinetic curves using the
program ORIGINPro 7.5. The solutions for triplet state life times were
introduced into a 0.2 mm path length UV/Visible spectrophotometric cell,
deaerated using nitrogen and photolysed at the Q band maxima.
300 W Quartz lamp
Water bath 600 nm glass cut-off filter
UV-Vis cell
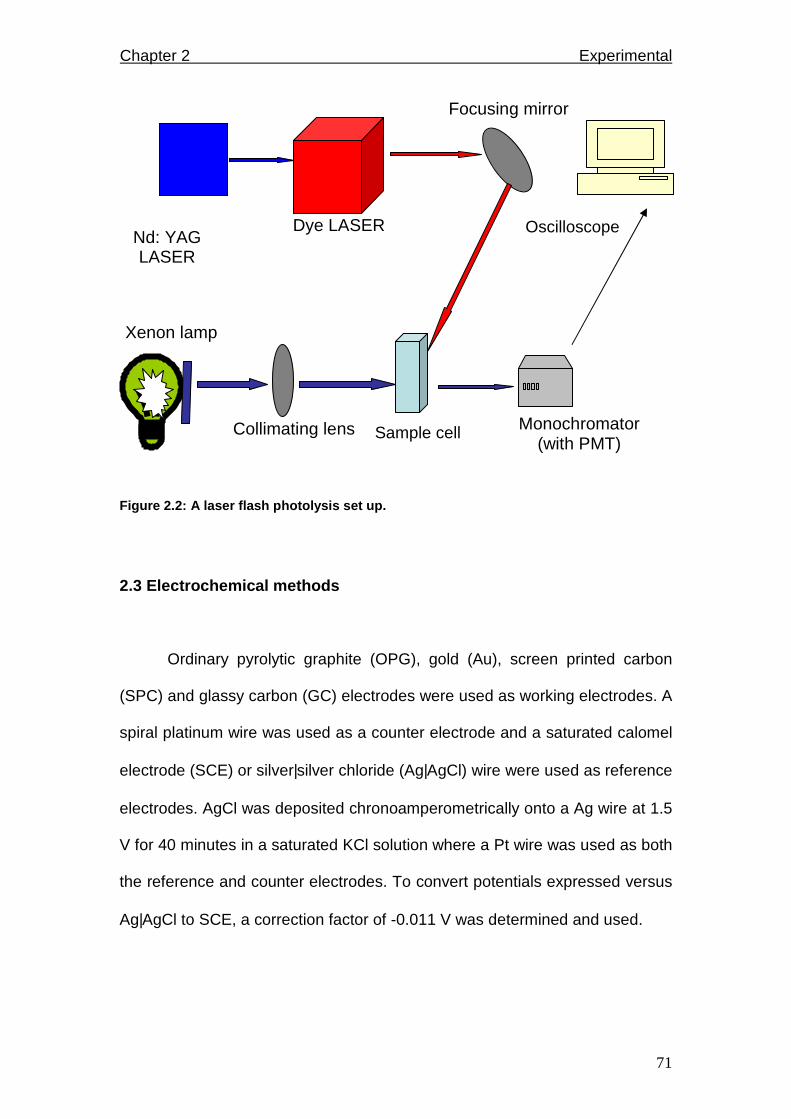
Chapter 2 Experimental
71
Figure 2.2: A laser flash photolysis set up.
2.3 Electrochemical methods
Ordinary pyrolytic graphite (OPG), gold (Au), screen printed carbon
(SPC) and glassy carbon (GC) electrodes were used as working electrodes. A
spiral platinum wire was used as a counter electrode and a saturated calomel
electrode (SCE) or silver|silver chloride (Ag|AgCl) wire were used as reference
electrodes. AgCl was deposited chronoamperometrically onto a Ag wire at 1.5
V for 40 minutes in a saturated KCl solution where a Pt wire was used as both
the reference and counter electrodes. To convert potentials expressed versus
Ag|AgCl to SCE, a correction factor of -0.011 V was determined and used.
Nd: YAG LASER
Dye LASER
Xenon lamp
Monochromator (with PMT)
Focusing mirror
Collimating lens
Oscilloscope
Sample cell
Chapter 2 Experimental
72
2.3.1 Electrode preparation
A glassy carbon (GC) disk electrode from Radiometer-Tacussel
(France) was mounted on Teflon and had a geometrical area of 0.071 cm2. It
was cleaned before each experiment by polishing on 1 and 0.25 µm diamond
pastes, followed by extensive rinsing with ultra-pure Millipore water. Another
GC electrode of 0.071 cm2 was purchased from BAS and cleaned by polishing
on alumina (<10 µM) slurries on a BAS feltpad. An ordinary pyrolytic graphite
(OPG) electrode of 0.44 cm2 was obtained from Pine Instruments (USA). It
was cleaned by polishing on 800 and 1200 grit emery paper and 1 µm
alumina, followed by rinsing with ultra-pure Millipore water. Au electrode of
0.020 cm2 was purchased from BAS and cleaned on alumina slurries on a
diamond pad, then on a smoother Buehler pad. The electrode was rinsed with
Millipore water and sonicated in ethanol to remove residual alumina particles.
The electrode was then immersed in a strong oxidizing piranha solution (1:3
(v/v) 30% H2O2 and concentrated H2SO4) to remove any organic particles that
could still be on the electrode. All electrodes were rinsed with Millipore water
after polishing, followed by respective solvents in which experiments were to
be conducted.
Screen printed carbon electrodes (SPCEs) were fabricated by printing
graphite ink (Fluka, France) mixture in cyclohexanone onto alumina ceramic
plates obtained from The Laser Cutting Company Ltd. (Sheffield, UK). The
counter and working electrodes as well as the conducting tracks were
prepared using a graphite ink. The ink was prepared by mixing 1.4 g graphite
powder with 3.4 g of cyclohexanone mixture containing 7 % w/w cellulose
Chapter 2 Experimental
73
acetate binder. Another batch was incorporated with cobalt phthalocyanine
(CoPc) complex. Two procedures were used. In the first one, 0.7 g of graphite
powder was mixed with 2 g of cellulose acetate solution in cyclohexanone.
CoPc (37 mg) was then added and mixed for 30 minutes using Roll-mill,
affording 5 % CoPc-SPCE. The viscosity of the resulting ink modified with
CoPc was adjusted by adding a few droplets of cyclohexanone. The obtained
electrodes are denoted as 5 % CoPc-SPCE.
In the second procedure, 100 mg of CoPc was dissolved in 20 mL of
chloroform. Different volumes of this solution were mixed with 1 g graphite
powder, made up to 11 g with cyclohexanone and homogenized. Mixing 2, 5
or 10 mL of CoPc chloroform solution with 1 g graphite powder afforded %
CoPc composition of 1.0, 2.5 or 5.0 %, respectively. Then 0.7 g of this
mixture was mixed with 2 g of cellulose acetate binder (7 % in cyclohexanone)
to make the ink which was then homogenized with a Roll-mill. The obtained
electrodes are denoted 1 % CoPc-SPCE, 2.5 % CoPc-SPCE, and 5 % CoPc-
SPCE, respectively. Finally, silver-silver chloride ink (GEM-Gwent ,Pontypool,
UK) was printed onto the ceramic plates and used as a reference electrode.
SPCEs were made by printing onto alumina ceramic tiles (The Laser
Cutting Company Ltd., Sheffield, UK) and permanox-recovered plastic
substrate (InterMed, Nunc, USA). Two electrode configurations (Fig. 2.3a and
b) were designed; a) is a three-electrode configuration that was initially
designed by Ledru et al.91 for amperometric biosensing in flow injection
analysis. A five electrode set-up (Fig. 2.3b) was designed to obtain an optimal
number of electrodes for use in multidetection of one or several analytes, or
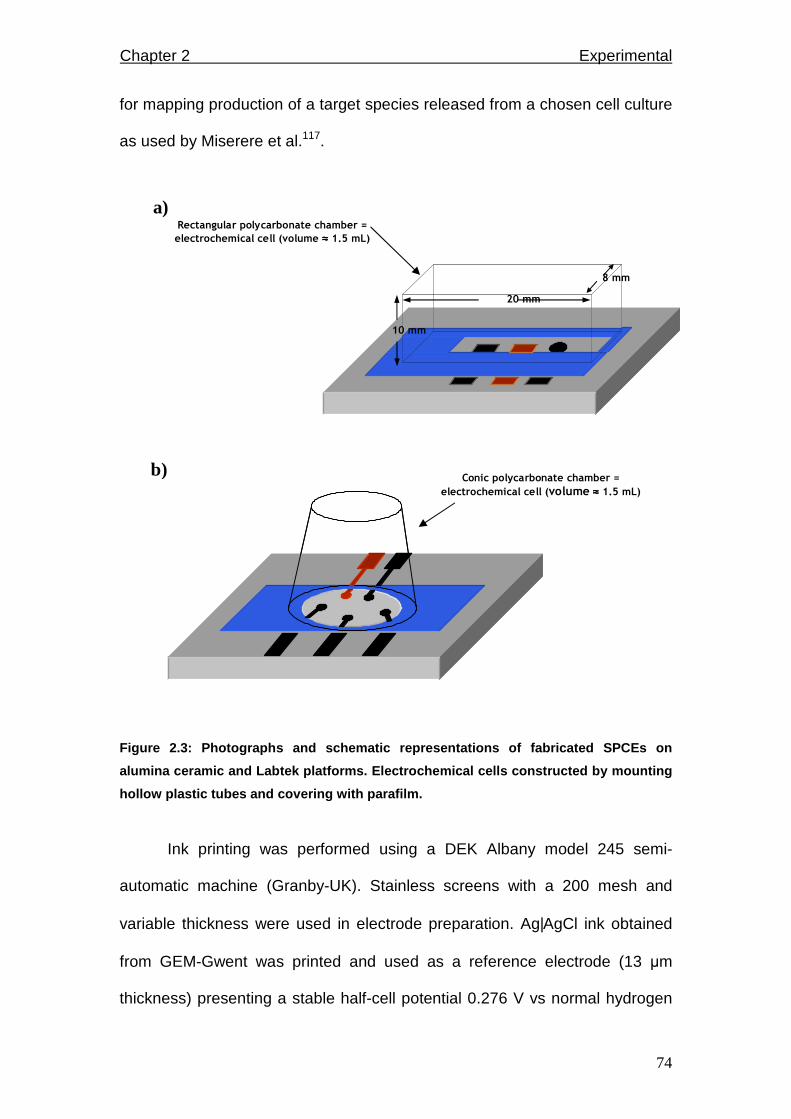
Chapter 2 Experimental
74
for mapping production of a target species released from a chosen cell culture
as used by Miserere et al.117.
Rectangular polycarbonate chamber =
electrochemical cell (volume ≈≈≈≈ 1.5 mL)
8 mm
10 mm
20 mm
b) Conic polycarbonate chamber =
electrochemical cell (volume ≈≈≈≈ 1.5 mL)
a)
Figure 2.3: Photographs and schematic representatio ns of fabricated SPCEs on
alumina ceramic and Labtek platforms. Electrochemic al cells constructed by mounting
hollow plastic tubes and covering with parafilm.
Ink printing was performed using a DEK Albany model 245 semi-
automatic machine (Granby-UK). Stainless screens with a 200 mesh and
variable thickness were used in electrode preparation. Ag|AgCl ink obtained
from GEM-Gwent was printed and used as a reference electrode (13 µm
thickness) presenting a stable half-cell potential 0.276 V vs normal hydrogen
Chapter 2 Experimental
75
electrode (NHE). Counter and working electrodes (23 µm thickness), as well
as conducting tracks were also printed using graphite-cellulose acetate ink
described above. Finally the non-conductive dielectric layer of 36 µm
thickness was printed to define the working area surface. Note that in the case
of the five-electrode configuration (Fig. 2.3b), there is a difference in the real
active area from one electrode to another due to the uncoated section of the
tracks left after the non-conductive dielectric layer was printed. All printed
layers were cured at room temperature for 6 hours.
2.3.2 Electrode modification and characterization
2.3.2.1 Monomer adsorption
Glassy carbon and ordinary pyrolytic graphite working electrodes were
modified with monomers of CoTPhPyrPc 6b and CoTEThPc 6c complexes by
placing 10 µL of 1 mM solution of the complexes in THF and DCM,
respectively, on the electrode surface for 30 minutes. Unabsorbed complexes
were removed by rinsing with their respective solvents, followed by rinsing
with ethanol. Adsorption of CoPc 6a onto OPG electrode as well as of MnPc
complexes 7a - 7f onto glassy carbon electrodes was afforded by spreading
out 10 µL of 1 mM solution of the complexes in DMF for 30 minutes. Similarly,
residual solution was rinsed off with DMF, then ethanol before further use in
experiments.

Chapter 2 Experimental
76
2.3.2.2 Electropolymerization/electrodeposition
Electropolymerization of CoTPhPyrPc 6b onto a glassy carbon
electrode was achieved by repetitive cycling of the electrode between -0.6 and
1.6 V/(SCE) at 0.2 Vs-1 in a 1 mM DCM solution of the complex containing 0.1
M TBABF4. The growth of the film was observed by monitoring the increase
in the charge attributed to the reversible redox couple of the metal centre
CoIII/II located at ~0.85 V/(SCE). Electrodeposition of CoTEThPc 6c onto the
GCE was achieved in the range 0.2 to 1.6 V/(SCE) at 0.2 Vs-1 in a 1 mM THF
solution of the complex containing 0.1 M TBABF4 electrolyte.
Electrodeposition of the complex on the electrode was observed by charge
increase of the signal attributed to the CoIII/II couple at ~0.90 V/(SCE), and
also with the signal at ~1.6 V/(SCE) due to the oxidation of the thiophene
group.
2.3.2.3 Self-assembled monolayers
A self-assembled monolayer of CoTEThPc 6c was formed by
immersing a clean Au electrode in a nitrogen-purged 1 mM CoTEThPc 6c
solution in DMF for 72 hours at room temperature. The longer the immersion
time period, the better the MPc arrangement on the electrode. The
CoTEThPc-SAM electrode was then rinsed with DMF and Millipore water.
CVs of CoTEThPc-SAM were scanned in 0.01 M KOH, 1 mM CuSO4 in 0.5 M
H2SO4, 1 mM Fe(NH4)(SO4)2 in 1 mM HClO4 solutions to check blockage of
Chapter 2 Experimental
77
anodic gold oxide formation, under-potential deposition (UDP) of Cu and the
[Fe(H2O)6]3+/[Fe(H2O)6]
2+ redox couple, respectively.
For all modified electrodes, CVs were recorded in oxygen-free buffer
solutions to check redox couples of MPc films on the electrode surfaces.
Buffer solutions were prepared from commercial phosphate buffer tablets and
the pH adjusted to the required value by addition of 0.5 M NaOH or 0.5 M
H2SO4 accordingly. In other cases, buffer solutions composed of NaH2PO4 or
KH2PO4, Na2HPO4 or K2HPO4 and NaOH salts. Electrolytic solutions were
routinely deoxygenated by bubbling with argon or nitrogen. An oxygen-free
atmosphere was maintained during voltammetric scans, except for oxygen
reduction reactions.
2.3.3 Electrocatalysis
Electrodes modified with metallophthalocyanines were employed in
electrocatalysis of analyte reactions, details of which are summarized in Table
2.1. Glassy carbon electrodes modified by adsorption, electropolymerization
and electrodeposition of CoTPhPyrPc 6b and CoTEThPc 6c were used to
electrocatalyze oxidation of 2-mercaptoethanol (2-ME), L-cysteine (CYS) and
reduced-glutathione (GSH). In another set of experiments, GSH was
catalyzed by CoPc 6a adsorbed on an ordinary pyrolytic graphite (OPG)
electrode. GSH and 2-ME were also electrocatalyzed by CoPc 6a
incorporated into screen printed carbon electrodes (SPCEs). Reactions were
conducted in pH 13 (0.5 M NaOH) and pH 7 buffer solutions, the latter
composed of KH2PO4 and NaOH salts. S-nitrosoglutathione (GSNO)
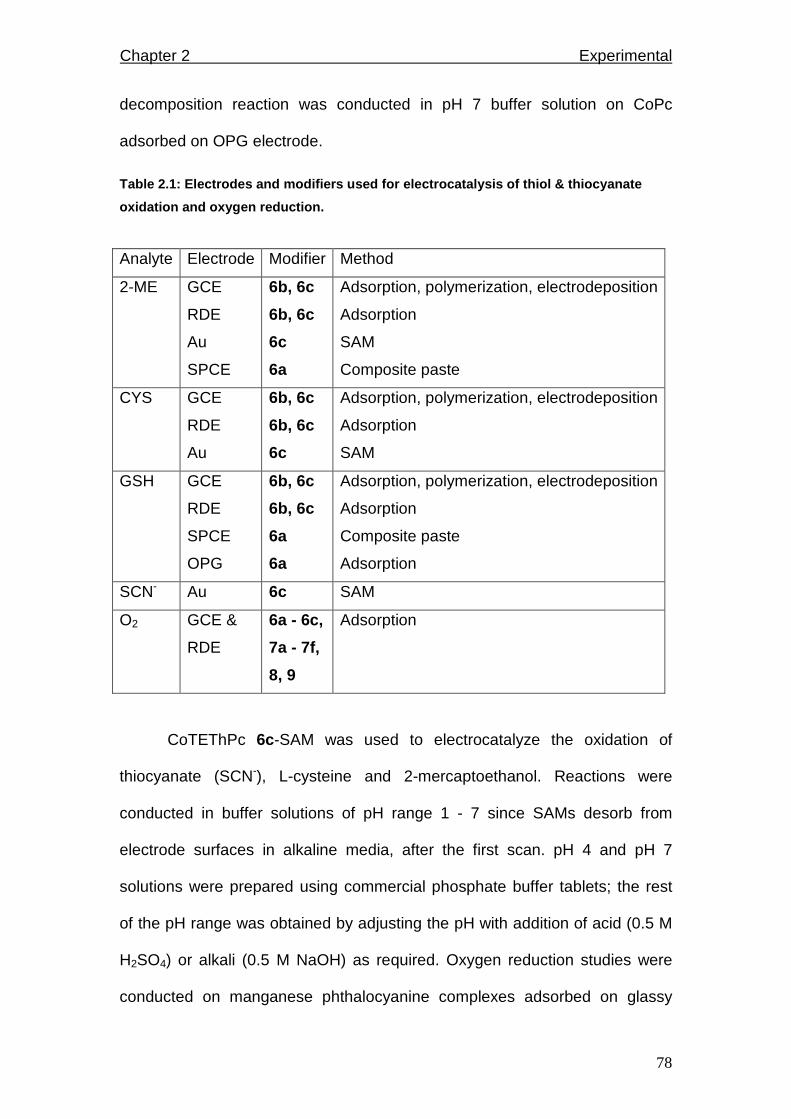
Chapter 2 Experimental
78
decomposition reaction was conducted in pH 7 buffer solution on CoPc
adsorbed on OPG electrode.
Table 2.1: Electrodes and modifiers used for electr ocatalysis of thiol & thiocyanate
oxidation and oxygen reduction.
Analyte Electrode Modifier Method
2-ME GCE
RDE
Au
SPCE
6b, 6c
6b, 6c
6c
6a
Adsorption, polymerization, electrodeposition
Adsorption
SAM
Composite paste
CYS GCE
RDE
Au
6b, 6c
6b, 6c
6c
Adsorption, polymerization, electrodeposition
Adsorption
SAM
GSH GCE
RDE
SPCE
OPG
6b, 6c
6b, 6c
6a
6a
Adsorption, polymerization, electrodeposition
Adsorption
Composite paste
Adsorption
SCN- Au 6c SAM
O2 GCE &
RDE
6a - 6c,
7a - 7f,
8, 9
Adsorption
CoTEThPc 6c-SAM was used to electrocatalyze the oxidation of
thiocyanate (SCN-), L-cysteine and 2-mercaptoethanol. Reactions were
conducted in buffer solutions of pH range 1 - 7 since SAMs desorb from
electrode surfaces in alkaline media, after the first scan. pH 4 and pH 7
solutions were prepared using commercial phosphate buffer tablets; the rest
of the pH range was obtained by adjusting the pH with addition of acid (0.5 M
H2SO4) or alkali (0.5 M NaOH) as required. Oxygen reduction studies were
conducted on manganese phthalocyanine complexes adsorbed on glassy

Chapter 2 Experimental
79
carbon electrodes in buffer solutions of pH 1 - 13. Oxygen gas was then
bubbled into the buffer solutions to attain saturation.
Thiocyanate and thiol oxidation as well as oxygen reduction reactions
were studied using cyclic voltammetry (CV) and rotating disc electrode (RDE)
voltammetry.
2.4 Biomimetic reactions
These reactions were employed for transformation of cyclohexene. The
solvent mixture containing DMF and DCM (3:7) was employed for the
catalysis, since all the reagents dissolved and this ratio has been reported to
give highest product yields for cyclohexane oxidation catalyzed by the
FePc(Cl)16 complex196. Cyclohexene (1.5 M) oxidation was attempted at room
temperature in the DMF/DCM solvent mixture for 8 hours. The same reaction
was attempted in the presence of either 0.5 M oxidants (TBHP or CPBA) or
1.5 mg/mL of catalyst (FePc(Cl)16 9, CoPc 6a or FePc 8), and when oxidant
and catalyst were both present.
The reaction was monitored by recording GC traces as the oxidation
reaction progressed. Integrity of the catalysts during the course of the
reactions was probed by recording UV/Visible absorption spectra. The
oxidation products were identified by spiking using standards and by
comparison of retention times of standards with those of product peaks in gas
chromatography. The nature of the products was also determined by a gas
chromatograph connected to a mass spectrometer (GC-MS). Reactions were
run at least in triplicates and not always using the same batches of the

Chapter 2 Experimental
80
catalysts, oxidant or substrate. Product yields were calculated based on the
substrate using equation 2.1;
100% x ne][cyclohexe
[product] yield% = 2.1
Turnover numbers were calculated using the ratio of moles of product to initial
moles of catalyst, eq. 2.2;
moles catalyst initial
moles product 2.2
Product selectivity was determined as the relative distribution of formed
products.
2.5 Photocatalytic reactions
Photocatalytic reactions for phototransformation of cyclohexene were
conducted in a number of solvents, namely THF, 3:7 DMF-CH2Cl2 and 1,4-
dioxane. However, catalytic reactions were studied mainly in the latter since
both cyclohexene and ZnPc dissolved completely and oxidation products were
obtained in the highest yields compared to the other two solvents. The
reaction mixtures consisting of known amounts of the catalyst (ZnPc 10) and
the substrate (cyclohexene) were prepared in 5 mL glass sample vials and
their gas chromatograph (GC) traces recorded. This was followed by
irradiation of the reaction mixtures with either red or white light for a noted
time period, while stirring. Reactions were run at least in triplicates and with
varying amounts of reagents used and irradiation periods.
Chapter 2 Experimental
81
GC traces were recorded periodically during the course of the reaction.
Similarly, UV/Visible absorption spectra were recorded periodically but the
solutions had to be diluted before recording the spectra. For monitoring the
fate of the catalyst, experiments were conducted in a 1 cm path-length
spectrophotometric cell fitted with a tight fitting stopper. Concentrations of the
catalyst were determined using its molar extinction coefficient. This was
determined spectrophotometrically and was found to be 1.8 x 10⁵ dm3 mol-1
cm-1 in 1,4-dioxane at 665 nm.
In order to determine the catalytic effect of ZnPc under white light, GC
traces for the photolysis of cyclohexene in the absence of ZnPc were
subtracted from those in the presence of the catalyst, since cyclohexene
degrades to some small degree in the absence of a catalyst, under white light
conditions.
The oxidation products were identified by spiking using standards and
by measurements of retention times in gas chromatography. The nature of the
products were further confirmed by mass to charge ratios of molecular ion
peaks and fragmentation patterns as obtained from a gas chromatograph
connected to a mass spectrometer (GC-MS). Cyclohexene hydroperoxide
was identified using iodine liberation methods, followed by titration of iodine
with sodium thiosulphate or recording of the ultra violet spectra of iodine at
351 nm223,224.
Singlet oxygen is the reactive species in photocatalysis reactions and
its quantum yield is important. Singlet oxygen quantum yields (φ∆) which
express the amount of singlet oxygen generated by phthalocyanine complex
per quanta of light could not be determined in this work. This is because there
Chapter 2 Experimental
82
is no reference in solvents which were employed for photocatalysis, namely
THF, 3:7 DMF-CH2Cl2 and 1,4-dioxane. However relative singlet oxygen
quantum yields were determined by monitoring the rate of degradation of 1,3-
diphenyl isobenzofuran (DPBF) a radical scavenger upon interaction with
singlet oxygen generated from irradiation of MPc in the presence of oxygen,
using the set-up shown in Fig. 2.1.
Photobleaching quantum yields (φP) which express photodegradation of
MPcs per quanta of light irradiated were also determined using the set-up
shown in Fig. 2.1. φP gives a measure of stability of the MPc towards light.
This is important because the amount of light employed in photocatalytic
reactions should not be too high so not to degrade the catalyst in the process.
Equation 2.3 was employed in the calculations,
φP ( )
tI
VCC
abs
t0 −= 2.3
where Co and Ct in mol L-1 are the Pc concentrations before and after
irradiation respectively. V is the reaction volume, t is the irradiation time, and
Iabs is absorbed light intensity; the overlap integral of the radiation source
intensity and the absorption of the Pc (the action spectrum)26. Iabs = αSI/Na
where α is a fraction of light absorbed by the MPc, S the irradiated sample vial
area, I is light intensity and Na is the Avogadro’s number.
2.6 Syntheses
This section deals with the syntheses of MPc complexes (FePc(Cl16)
and ZnPc) which were not readily available in the laboratory and had to be

Chapter 2 Experimental
83
synthesized even though their synthesis is known. Of the MnPc complexes,
MnTPePyrPc 7c was the only one whose synthesis had not been reported
before and its synthesis is therefore reported below.
2.6.1 Iron (II) hexadecachlorophthalocyanine, FePc( Cl)16, 9
FePc(Cl)16 was synthesized, purified and characterized according to
literature methods225. 3,4-Dichloroanhydride (0.01 mol), 0.0025 mol iron (II)
chloride tetrahydrate, (0.4 mmol) ammonium molybdate and excess urea
(~0.05 mol) were finely ground together and added to 10 mL nitrobenzene.
The mixture was heated under reflux for 5 hours between 180 - 190 oC. The
solid products were filtered and washed with methanol. The products were
then Soxhlet extracted overnight using methanol to remove the remaining
nitrobenzene. The resulting deep green solid was boiled for 5 minutes in 1 M
HCl (30 mL) saturated with sodium chloride. The solid product was isolated by
centrifuge and heated at 90 oC for 30 minutes in 1 M NaOH saturated with
NaCl. The product was again isolated by centrifuge and treated with 1.0 M
HCl and NaOH. Finally, the dark green solid was washed with water until free
from NaOH and dried at 100 oC overnight.
FePc(Cl)16: IR (KBr disk) v/cm-1: 1709, 1645, 1392, 1318, 1273, 1214, 1195,
1158, 1089, 753, 715.
UV-Visible (DMF): λmax/nm (log ε) : 677 (4.87), 335 (3.34).
Chapter 2 Experimental
84
2.6.2 Zinc phthalocyanine, ZnPc, 10
ZnPc was synthesized, purified and characterized using literature
methods226. A solution of 0.6 mmol of phthalonitrile and zinc acetate (0.023
mmol) in 5 mL dry 1-pentanol was refluxed for 20 minutes in the presence of
nitrogen. Refluxing was continued until the UV-Visible spectrum of the solution
had a distinct Q-band - characteristic of a phthalocyanine. This occurred
within an hour. Pentanol was removed by blowing out with nitrogen while
heating continued. The product was transferred into 10 mL of water and the
pH adjusted to 5 using dilute HCl. The product was then filtered and the
unreacted phthalonitrile was removed by Soxhlet extraction with methanol.
ZnPc: IR (KBr) v/cm-1: 1612, 1513, 1467, 1328, 1093, 725.
UV-Visible (DMF): λmax/nm (log ε) : 672 (5.2), 344 (3.7).
1H NMR DMSO-d6; δ (ppm): 9.44 (d, 4H), 8.26 (d, 4H), 7.70 (m, 8H)
2.6.3 Manganese tetrapentoxy pyrrole phthalocyanine (MnTPePyrPc, 7c)
Manganese tetrapentoxy pyrrole phthalocyanine (MnTPePyrPc, 7c)
was synthesized by adopting a procedure reported before for the synthesis of
tetra propoxy pyrrole substituted metal phthalocyanines as follows, (Scheme
3.5)227.
N-pyrrole substituted pentan-1-ol, 12. Compound 12 was synthesized
according to the procedure reported for the synthesis of the ethanol
analogue227 . 5-Aminopentanol (50 g, 0.817 mol) was added to 100 mL of
glacial acetic acid with continuous stirring. The mixture was cooled in an ice
bath containing sodium chloride (NaCl), keeping the temperature below 20 oC
Chapter 2 Experimental
85
since the reaction is exothermic. One portion of 25 g (0.19 mol) of 2,5-
dimethoxytetrahydrofuran 11 was then added to the solution while stirring and
left to stand for 10 minutes. The acetic acid was distilled off under reduced
pressure and the residue was treated with 200 mL of water. The product was
extracted five times from water with dichloromethane (DCM). The extracted
organic solution was treated, three times, with a saturated aqueous solution of
sodium sulphate followed by distilling off DCM. The residue was stirred
overnight with a mixture of 30 mL methanol and 30 mL 20% aqueous solution
of NaCl. Then the mixture was saturated with NaCl while stirring and left to
stand for 30 minutes. The mixture was then transferred into a separating
funnel and the organic product was extracted with DCM. Since there were
traces of water in the DCM extract, the product was dried with calcium
chloride. Finally, DCM was distilled off under reduced pressure. Yield: 30%.
IR (KBr) v/cm-1: 3097, 2939, 1655, 1503, 1430, 1280, 1087, 1070, 982, 866,
730.
1H NMR DMSO-d6: δ (ppm): 3.2 (d, 1H, pyrrole), 4.0 - 3.6 (m, 10H, pentyl),
6.30 (t, 2H, pyrolle), 6.91 (t, 2H, pyrrole).
5-(Pyrrol-1-yl)pentoxy phthalonitrile, 13 . Compound 13 was synthesized by
following literature reports for similar complexes227: 5-(pyrrol-1-yl) pentan-1-ol
12 (0.3 g, 1.9 mmol) and 0.27 g (1.56 mmol) of 4-nitrophthalonitrile
(synthesized according to reported method228) were added to 0.6 g dry K2CO3
in 15 mL dry DMSO. The mixture was stirred under nitrogen for 48 hours at
room temperature. The product was poured into 100 mL of 0.1 M HCl solution
to afford a yellowish-brown precipitate. The precipitated product was washed
Chapter 2 Experimental
86
with cold water (four times) and finally with methanol (two times). The
resulting solid was dried in the oven at 50 oC.
IR (KBr) v/cm-1: 3442, 3106, 3063, 2229 (C≡N), 1598, 1516, 1486, 1244 (C-O-
C), 1205, 1076, 840, 727.
1H NMR DMSO-d6: δ (ppm): 6.29 (s, 2H), 7.30 (d, 2H), 7.38 (d, 2H), 7.44 (m,
1H), 7.50 (d, 2H), 7.85 (d, 1H), 8.10 (d, 1H).
Manganese tetrapentoxy pyrrole phthalocyanine (MnTP ePyrPc, 7c). The
first step was the synthesis of unmetallated tetrapentoxy pyrrole
phthalocyanine (H2TPePyrPc, 14) which was achieved by dissolving 1.2 g
(4.30 mmol) of 5-(pyrrol-1-yl)-pentoxyphthalonitrile, 13 in 15 mL dry pentanol
and stirring under reflux for 15 minutes. Following this, 10 mg lithium was
added to the mixture while stirring and the solution turned green immediately.
UV-Visible spectra of the product were used to monitor the formation of the
Pc. After one hour, the product was allowed to cool to room temperature and
methanol was added to the solution to precipitate out the product. The
product was Soxhlet extracted with methanol for 24 hours, to remove
unreacted phthalonitrile. After this treatment, the product was found to be
predominantly metal free Pc. No further purification was done. Complex 14
was used for synthesis of the manganese derivative 7c, by reaction of 0.4 g
(0.36 mmol) of 14 with 0.027 g (0.023 mmol) of manganese chloride in dry
pentanol under reflux for 1 hour. The solution was transferred into distilled
methanol to precipitate out the solid. Finally, the product was purified by
column chromatography using dichloromethane as eluting solvent and its
purity was confirmed by thin layer chromatography. Characterization of the
products gave satisfactory results.
Chapter 2 Experimental
87
H2TPePyrPc, 14: Yield: 60%. IR (KBr) v/cm-1: 3280, 3097, 2930, 2865, 1615,
1487, 1235 (C-O-C), 1090, 940, 826, 721.
UV-Visible (DMF): λmax/nm, (log ε): 330 (4.48), 635 (4.01), 670 (4.65), 700
(4.65).
1H NMR DMSO-d6: δ (ppm): 6.19 (d, 8H, pyrolle), 7.32 (d, 8H, pyrrole), 8.41
(s, 4H, Pc), 9.00 (s, 8H, Pc).
MnTPePyrPc, 7c: Yield: 92%. IR (KBr) v/cm-1: 2930, 2856, 2370, 1638, 1509,
1341, 1244 (C-O-C), 1137, 1082, 823, 710, 630, 285 (Mn-Cl).
UV-Visible (DMF): λmax/nm, (log ε): 641 (4.4).
Elemental analysis: C68H68MnN12O4 (1171 gmol-1). Analytically calculated: C,
69.63%; H, 5.83%; N, 14.29%. Found: C, 68.7%; H, 5.64%; N, 13.56%.
Chapter 3
Electrocatalysis
Metallophthalocyanines are applied principally in electrocatalysis of oxidation
of thiols and thiocyanates as well as reduction of oxygen in this thesis. This
section lays out the results obtained from these studies.
Chapter 3 Electrocatalysis
89
This work has been published in the following journals as;
1. Nthapo Sehlotho, Sophie Griveau, Nadine Ruillé, Mohammed Boutjita,
Tebello Nyokong and Fethi Bedioui.
Electrocatalyzed oxidation of reduced glutathione and 2-
mercaptoethanol by cobalt phthalocyanine-containing screen printed
graphite electrodes.
Mater. Sci. Eng., (2006) Article in press.
2. Nthapo Sehlotho, Sophie Griveau, Tebello Nyokong and Fethi Bedioui.
Cobalt phthalocyanine molecular electrode for the electrochemical
investigation of the release of glutathione upon copper-catalyzed
decomposition of S-nitrosoglutathione.
Electroanalysis, (2006) Article in press.
3. Nthapo Sehlotho and Tebello Nyokong.
Effects of ring substituents on electrocatalytic activity of manganese
phthalocyanines towards the reduction of oxygen.
J. Electroanal. Chem., 595 (2006 )161-167.
4. Nthapo Sehlotho and Tebello Nyokong.
Electrocatalytic oxidation of thiocyanate, L-cysteine and 2-
mercaptoethanol by self-assembled monolayer of cobalt tetraethoxy
thiophene phthalocyanine.
Electrochim. Acta, 55 (2006) 4463-4470.
5. Nthapo Sehlotho, Tebello Nyokong, José H. Zagal and Fethi Bedioui.
Electrocatalysis of oxidation of 2-mercaptoethanol, L-cysteine and
reduced glutathione by adsorbed and electrodeposited cobalt tetra
phenoxypyrrole and tetra ethoxythiophene substituted phthalocyanines.
Electrochim. Acta, 51 (2006) 5125-5130.
For publications 1, 2 and 5, experiments were conducted in Laboratoire de
Pharmacologie Chimique et génétique, Ecole Nationale Supérieure de Chimie de
Paris, FRANCE, Aug – Dec 2004 and Feb – May 2006 as a collaboration between
governments of France and South Africa.
Chapter 3 Electrocatalysis
90
3.1 Thiol oxidation
3.1.1 Adsorbed CoPc complexes, 6b and 6c
Phthalocyanines metallated with cobalt compared to other transition
metals such as Fe and Mn have been reported to exhibit excellent catalytic
activity towards thiol oxidation; this is attributed to good orbital overlap
between cobalt’s d-orbitals and sp-orbitals of the thiols. On this basis, cobalt
phthalocyanine complexes 6b and 6c, Fig. 3.1 are employed as electro
catalysts towards thiol oxidation in this work. These complexes are ring-
substituted with phenoxy pyrrole and ethoxy thiophene ligands respectively,
allowing the study of substituent effect on the catalytic oxidation of thiols.
Moreover, pyrrole ligand forms stable polymers hence it was connected by a
phenoxy spacer to enhance polymerization while the thiophene ligand forms
stable self-assembled monolayers via the sulphur moiety. Different methods
of electrode modification, namely adsorption, electropolymerization and self-
assembly will therefore be employed and compared in terms of efficiency
towards thiol oxidation.
Electrochemical properties and thiol catalytic activity of CoPc 6a has
been studied extensively157: Adsorption of 6b and 6c was confirmed by
recording cyclic voltammograms of modified glassy carbon (GC) electrodes in
0.5 M NaOH solutions (pH ~ 13). Thiol oxidation was to be conducted in such
alkaline media based on the fact that it has been reported to occur at much
less negative potentials at pHs greater than dissociation constants of thiols158,
hence electrode characterization was done in alkaline media. For thiols that
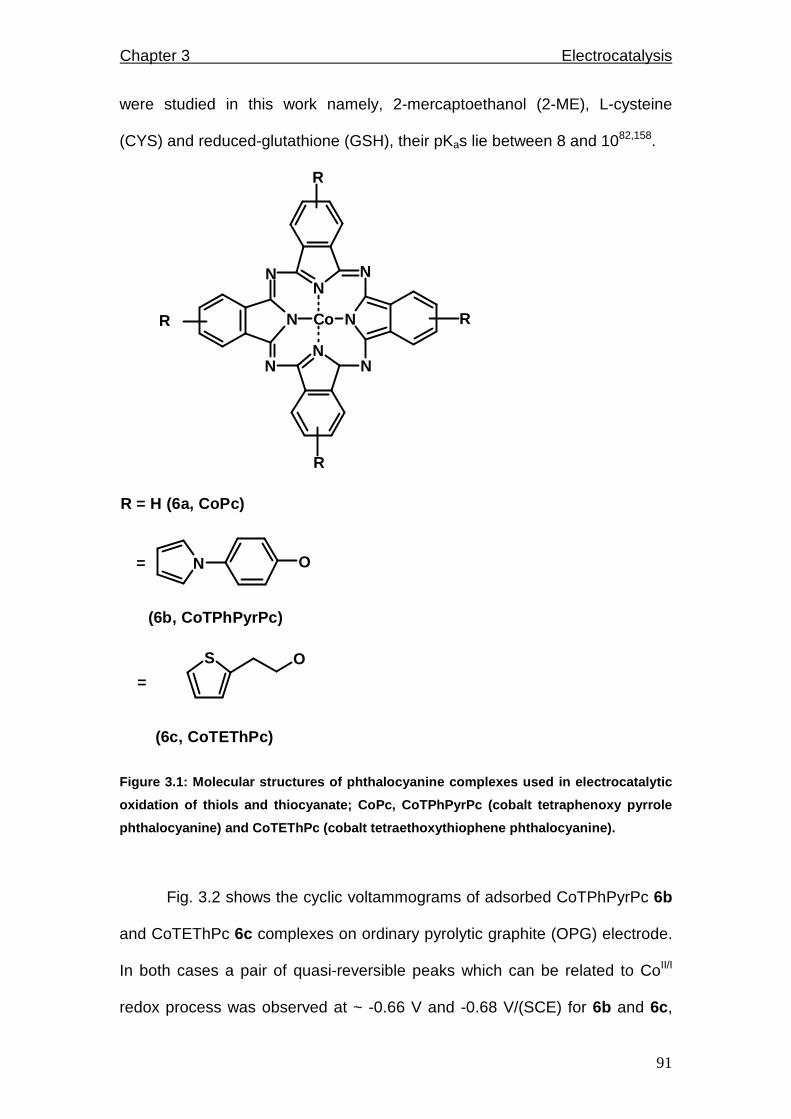
Chapter 3 Electrocatalysis
91
were studied in this work namely, 2-mercaptoethanol (2-ME), L-cysteine
(CYS) and reduced-glutathione (GSH), their pKas lie between 8 and 1082,158.
NNN
N
N
N
NN
Co
R
R
R
R
N O
S O
=
(6b, CoTPhPyrPc)
=
(6c, CoTEThPc)
R = H (6a, CoPc)
Figure 3.1: Molecular structures of phthalocyanine complexes used in electrocatalytic
oxidation of thiols and thiocyanate; CoPc, CoTPhPyr Pc (cobalt tetraphenoxy pyrrole
phthalocyanine) and CoTEThPc (cobalt tetraethoxythi ophene phthalocyanine).
Fig. 3.2 shows the cyclic voltammograms of adsorbed CoTPhPyrPc 6b
and CoTEThPc 6c complexes on ordinary pyrolytic graphite (OPG) electrode.
In both cases a pair of quasi-reversible peaks which can be related to CoII/I
redox process was observed at ~ -0.66 V and -0.68 V/(SCE) for 6b and 6c,
Chapter 3 Electrocatalysis
92
respectively. Surface coverage was determined by integration of charge under
the peaks and was found to be 9.85 and 1.23 x 10⁻¹⁰ mol/cm2 for 6b and 6c
respectively. The surface coverage values of ~ 1 x 10⁻¹⁰ mol/cm2 indicate that
adsorbed films are lying flat and are composed of one layer of MPc108,123,
though there is a higher concentration of 6b (9.85 x 10⁻¹⁰) than of 6c (1.23 x
10-10) on the electrode surface.
A different electrode OPG was employed for characterization other than
glassy carbon electrodes on which thiol oxidation was to be conducted
because OPG offers excellent MPc adsorption by virtue of being more porous
compared to GC electrodes. It is rich in π-electron density permitting strong
chemisorptive interactions hence forms more intact films. However OPG
electrodes show ‘memory effects’ thus desorption of MPc complexes or any
other material by polishing and sonication is tedious and difficult leading to the
electrode surface wearing off in the process, rendering OPG electrodes less
user-friendly and expensive in terms of re-use. OPG electrodes were
therefore used only for characterization purposes whereas GC electrodes
were used for routine analyses, as the latter are easy to clean, modify and re-
use.

Chapter 3 Electrocatalysis
93
-1400 -1200 -1000 -800 -600 -400 -200 0 200
E (mV) vs SCE
a
b
10 µµµµA
┼
Figure 3.2: Cyclic voltammograms of OPG electrodes modified by adsorption of a)
CoTPhPyrPc 6b and b) CoTEThPc 6c in 0.5 M NaOH solu tion showing Co(II/I) redox
couples.
Fig. 3.3 shows cyclic voltammograms in the presence of 1 mM thiol
solutions, namely 2-ME, CYS and GSH in 0.5 M NaOH on glassy carbon
electrodes modified by 30 minute-adsorption of CoTEThPc 6c (Fig. 3.3 A) and
CoTPhPyrPc 6b complexes (Fig. 3.3 B). In all cases, a large oxidation current
was observed starting from -0.4 V for 2-ME, -0.3 V for CYS and -0.25 V/(SCE)
for GSH, which is related to the electrocatalytic oxidation of the thiols at the
modified electrodes. It should be noted that no thiol oxidation was observed at
the bare glassy carbon electrode within the examined potential range of -1.30
to 0.20 V/(SCE).
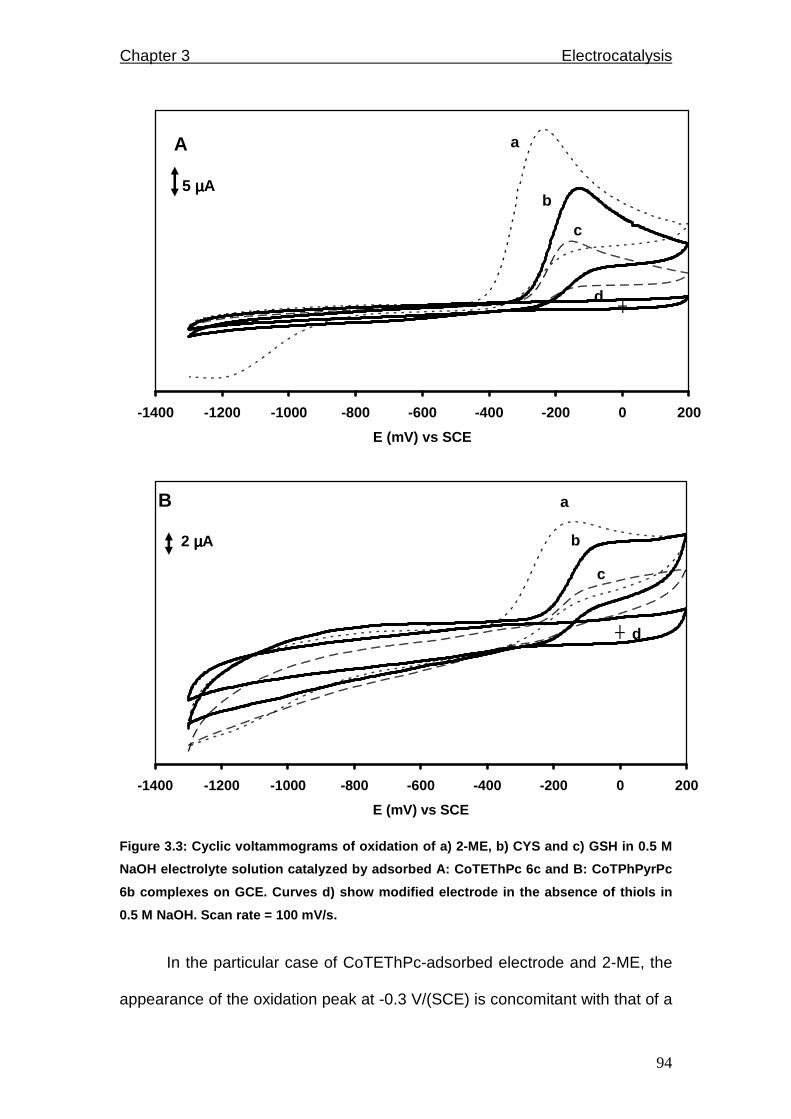
Chapter 3 Electrocatalysis
94
-1400 -1200 -1000 -800 -600 -400 -200 0 200
E (mV) vs SCE
a
b
c
d
A
5 µµµµA
┼
-1400 -1200 -1000 -800 -600 -400 -200 0 200
E (mV) vs SCE
B a
b
c
d
2 µµµµA
┼
Figure 3.3: Cyclic voltammograms of oxidation of a) 2-ME, b) CYS and c) GSH in 0.5 M
NaOH electrolyte solution catalyzed by adsorbed A: CoTEThPc 6c and B: CoTPhPyrPc
6b complexes on GCE. Curves d) show modified electr ode in the absence of thiols in
0.5 M NaOH. Scan rate = 100 mV/s.
In the particular case of CoTEThPc-adsorbed electrode and 2-ME, the
appearance of the oxidation peak at -0.3 V/(SCE) is concomitant with that of a
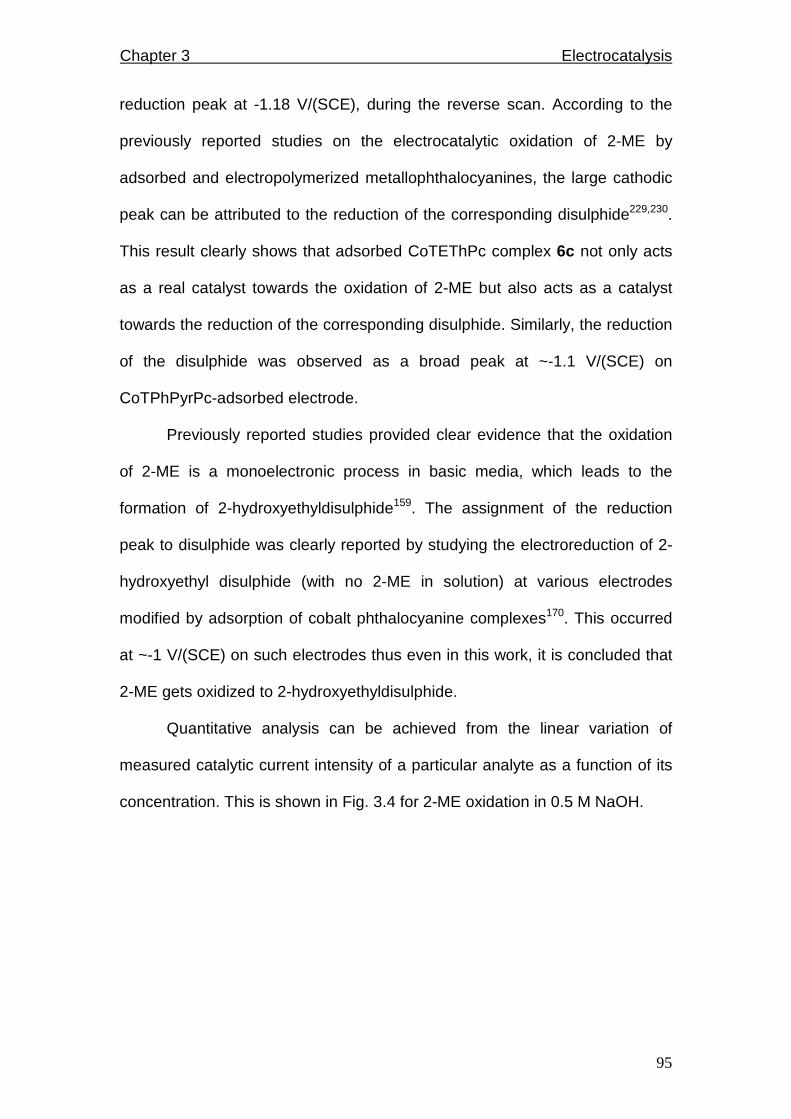
Chapter 3 Electrocatalysis
95
reduction peak at -1.18 V/(SCE), during the reverse scan. According to the
previously reported studies on the electrocatalytic oxidation of 2-ME by
adsorbed and electropolymerized metallophthalocyanines, the large cathodic
peak can be attributed to the reduction of the corresponding disulphide229,230.
This result clearly shows that adsorbed CoTEThPc complex 6c not only acts
as a real catalyst towards the oxidation of 2-ME but also acts as a catalyst
towards the reduction of the corresponding disulphide. Similarly, the reduction
of the disulphide was observed as a broad peak at ~-1.1 V/(SCE) on
CoTPhPyrPc-adsorbed electrode.
Previously reported studies provided clear evidence that the oxidation
of 2-ME is a monoelectronic process in basic media, which leads to the
formation of 2-hydroxyethyldisulphide159. The assignment of the reduction
peak to disulphide was clearly reported by studying the electroreduction of 2-
hydroxyethyl disulphide (with no 2-ME in solution) at various electrodes
modified by adsorption of cobalt phthalocyanine complexes170. This occurred
at ~-1 V/(SCE) on such electrodes thus even in this work, it is concluded that
2-ME gets oxidized to 2-hydroxyethyldisulphide.
Quantitative analysis can be achieved from the linear variation of
measured catalytic current intensity of a particular analyte as a function of its
concentration. This is shown in Fig. 3.4 for 2-ME oxidation in 0.5 M NaOH.
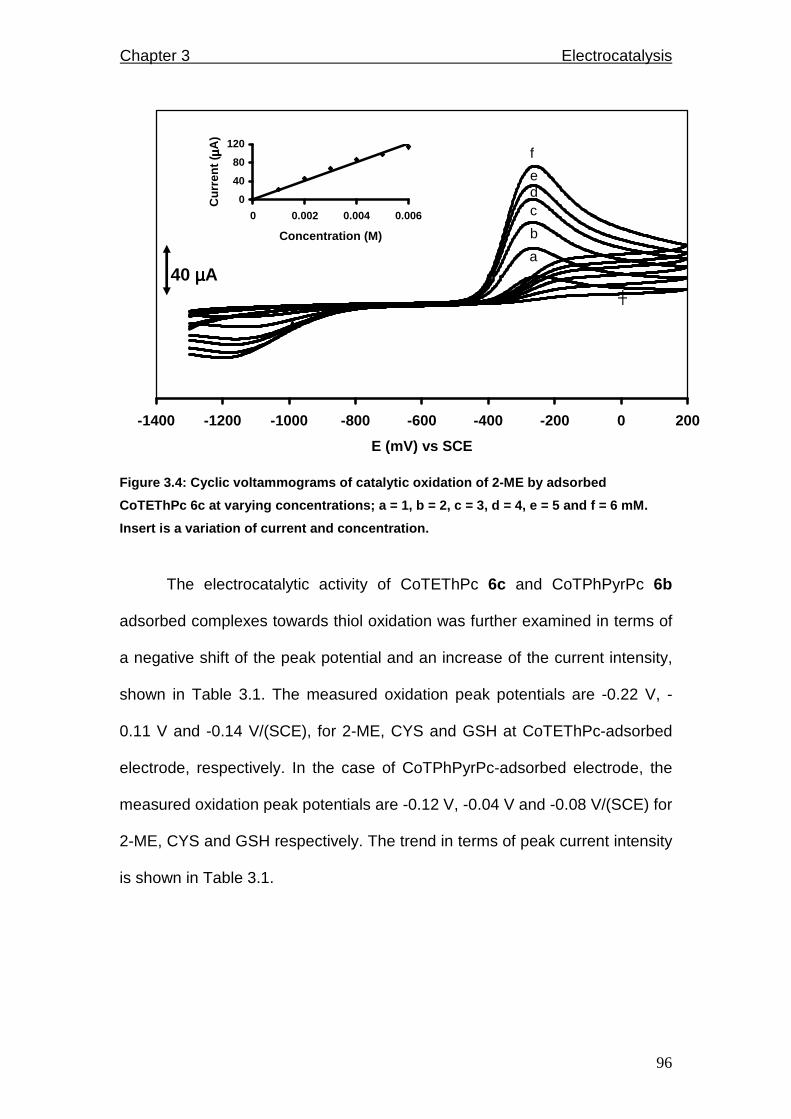
Chapter 3 Electrocatalysis
96
-1400 -1200 -1000 -800 -600 -400 -200 0 200
E (mV) vs SCE
f
a40 µµµµA
0
40
80
120
0 0.002 0.004 0.006
Concentration (M)
Cur
rent
(µµ µµA
)
┼
b
cde
Figure 3.4: Cyclic voltammograms of catalytic oxida tion of 2-ME by adsorbed
CoTEThPc 6c at varying concentrations; a = 1, b = 2 , c = 3, d = 4, e = 5 and f = 6 mM.
Insert is a variation of current and concentration.
The electrocatalytic activity of CoTEThPc 6c and CoTPhPyrPc 6b
adsorbed complexes towards thiol oxidation was further examined in terms of
a negative shift of the peak potential and an increase of the current intensity,
shown in Table 3.1. The measured oxidation peak potentials are -0.22 V, -
0.11 V and -0.14 V/(SCE), for 2-ME, CYS and GSH at CoTEThPc-adsorbed
electrode, respectively. In the case of CoTPhPyrPc-adsorbed electrode, the
measured oxidation peak potentials are -0.12 V, -0.04 V and -0.08 V/(SCE) for
2-ME, CYS and GSH respectively. The trend in terms of peak current intensity
is shown in Table 3.1.
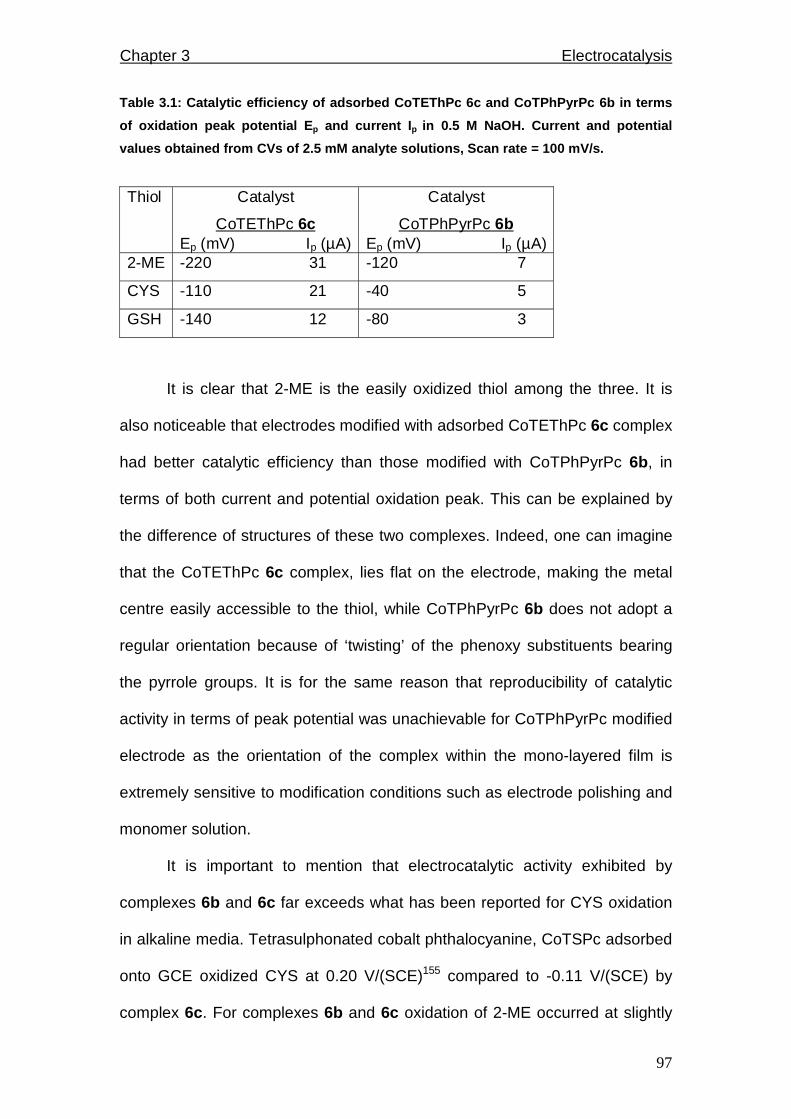
Chapter 3 Electrocatalysis
97
Table 3.1: Catalytic efficiency of adsorbed CoTEThP c 6c and CoTPhPyrPc 6b in terms
of oxidation peak potential E p and current I p in 0.5 M NaOH. Current and potential
values obtained from CVs of 2.5 mM analyte solution s, Scan rate = 100 mV/s.
Thiol Catalyst
CoTEThPc 6c Ep (mV) Ip (µA)
Catalyst
CoTPhPyrPc 6b Ep (mV) Ip (µA)
2-ME -220 31 -120 7
CYS -110 21 -40 5
GSH -140 12 -80 3
It is clear that 2-ME is the easily oxidized thiol among the three. It is
also noticeable that electrodes modified with adsorbed CoTEThPc 6c complex
had better catalytic efficiency than those modified with CoTPhPyrPc 6b, in
terms of both current and potential oxidation peak. This can be explained by
the difference of structures of these two complexes. Indeed, one can imagine
that the CoTEThPc 6c complex, lies flat on the electrode, making the metal
centre easily accessible to the thiol, while CoTPhPyrPc 6b does not adopt a
regular orientation because of ‘twisting’ of the phenoxy substituents bearing
the pyrrole groups. It is for the same reason that reproducibility of catalytic
activity in terms of peak potential was unachievable for CoTPhPyrPc modified
electrode as the orientation of the complex within the mono-layered film is
extremely sensitive to modification conditions such as electrode polishing and
monomer solution.
It is important to mention that electrocatalytic activity exhibited by
complexes 6b and 6c far exceeds what has been reported for CYS oxidation
in alkaline media. Tetrasulphonated cobalt phthalocyanine, CoTSPc adsorbed
onto GCE oxidized CYS at 0.20 V/(SCE)155 compared to -0.11 V/(SCE) by
complex 6c. For complexes 6b and 6c oxidation of 2-ME occurred at slightly
Chapter 3 Electrocatalysis
98
less negative values of -0.12 and -0.22 V/(SCE) respectively compared to -
0.29 and -0.32 V/(SCE) on adsorbed and polymerized cobalt tetraamino
phthalocyanine (CoTAPc) respectively155, both in alkaline media. Moreover,
GSH oxidation in alkaline solutions occurred at -0.08 and -0.14 V/(SCE)
catalyzed by complexes 6b and 6c respectively, and these were slightly less
negative than observed on polymerized CoTAPc which exhibited GSH
oxidation peak at -0.20 V/(SCE)229. This nonetheless shows that complexes
6b and 6c employed as electrocatalysts in this work exhibit comparable
activity on average towards thiol oxidation as other complexes that have been
studied before.
Electrocatalytic reactions were also performed in phosphate buffer
solution at pH 7.2 so as to get information about how well our modified
electrodes could behave in physiological conditions since this is one area of
application. In the case of the more easily oxidized thiol, namely 2-ME, it was
observed that catalytic activity is greatly decreased at pH 7.2, as shown in Fig.
3.5 both in terms of potential and current. 2-ME oxidation peak was observed
at -0.22 V/(SCE) in pH 13 with current intensity of 31 µA while it occurred at 0.
13 V/(SCE) in pH 7.2 with a current intensity of 6 µA. This is not surprising
since the active species that interacts with the adsorbed catalyst is RS- anion
which predominates at pH values higher than the thiol pKa (which is in the
range 9 -1082,158).

Chapter 3 Electrocatalysis
99
-1400 -1200 -1000 -800 -600 -400 -200 0 200
E (mV) vs SCE
a
b
10 µµµµA
┼
Figure 3.5: Cyclic voltammograms of oxidation of 2 .5 mM 2-ME in a) 0.5 M NaOH
(pH~13) and b) PBS (pH = 7.2) solution catalyzed by adsorbed CoTEThPc 6c complex.
Scan rate = 100 mV/s.
Rotating disk electrodes (RDE) experiments were performed to better
understand processes occurring in solution. Typical quasi-stationary current-
potential curves obtained at different rotation rates are shown in Fig. 3.6. It
appears that a typical diffusion plateau is observed for the catalytic oxidation
current. The Levich equation, eq. 3.1 (same as eq. 1.8) was employed,
IL = 0.62nFAD2/3ω1/2v-1/6C 3.1
where symbols are as described before. Linear correlations (inserts Fig. 3.6)
indicating diffusion-controlled mass transport were obtained from plots of IL vs
ω½ and IL vs C where IL, ω and C represent measured limiting current intensity,
electrode rotation rate and thiol concentration, respectively. The limiting
current values were taken at -0.15 V for both plots. However, deviations were

Chapter 3 Electrocatalysis
100
observed at high thiol concentrations and electrode rotation speeds because
of electrode passivation and fouling.
Chapter 3 Electrocatalysis
101
-500 -400 -300 -200 -100
E (mV) vs SCE
0
10
20
30
0 2 4 6 8
C (10-3 M)
I L ( µµ µµ
A)
A d
c
b
a
5 µµµµA
-500 -450 -400 -350 -300 -250 -200 -150
E (mV) vs SCE
0
20
40
60
80
0 10 20 30
ωωωω1/2
I L ( µµ µµ
A)
a
eB
10 µµµµA
bcd
Figure 3.6: RDEs of catalytic oxidation in 0.5 M Na OH solution catalyzed by adsorbed
CoTEThPc 6c at A: different concentrations of 2-ME, a = 2, b = 4, c = 6 and d = 8 mM at
5000 rpm and B: different rotation speeds of a = 10 00, b = 2000, c = 3000, d = 4000 and
e = 5000 rpm; 2-ME concentration = 2.5 mM. Scan rat e = 10 mV/s. Inserts = Koutecky-
Levich plots.
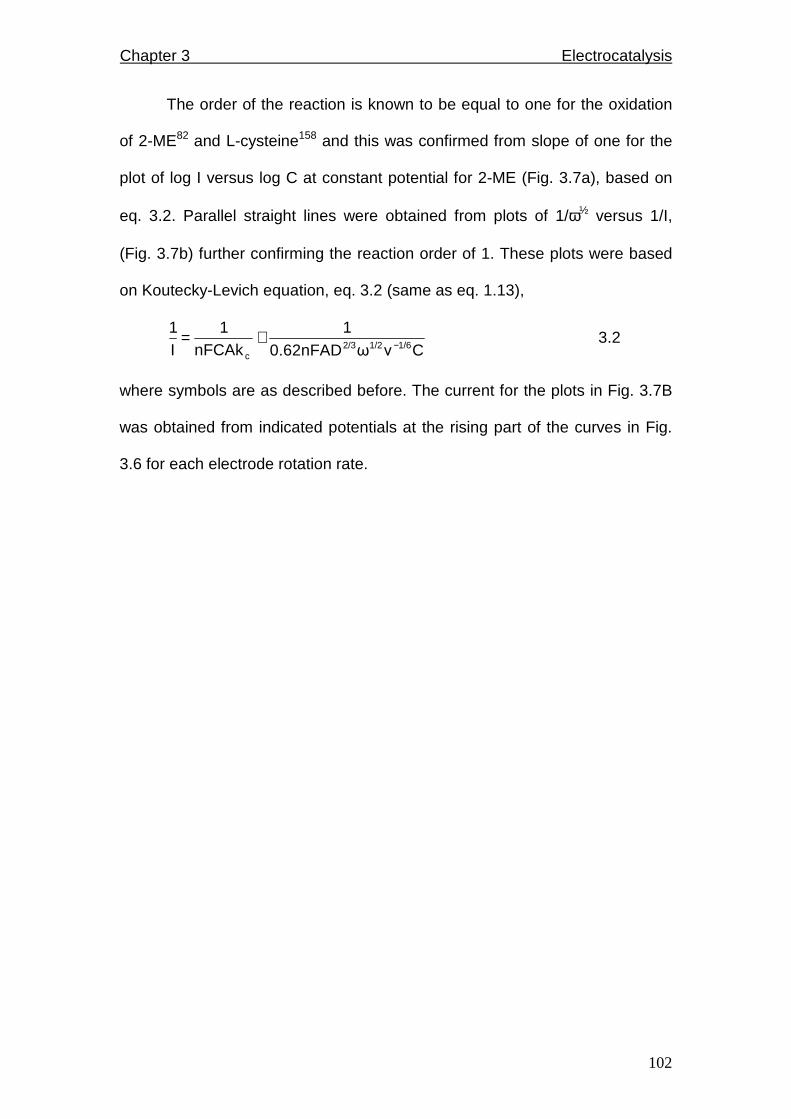
Chapter 3 Electrocatalysis
102
The order of the reaction is known to be equal to one for the oxidation
of 2-ME82 and L-cysteine158 and this was confirmed from slope of one for the
plot of log I versus log C at constant potential for 2-ME (Fig. 3.7a), based on
eq. 3.2. Parallel straight lines were obtained from plots of 1/ω½ versus 1/I,
(Fig. 3.7b) further confirming the reaction order of 1. These plots were based
on Koutecky-Levich equation, eq. 3.2 (same as eq. 1.13),
Cνω0.62nFAD1
nFCAk1
I1
1/61/22/3c
−+= 3.2
where symbols are as described before. The current for the plots in Fig. 3.7B
was obtained from indicated potentials at the rising part of the curves in Fig.
3.6 for each electrode rotation rate.

Chapter 3 Electrocatalysis
103
y = 0.9304x + 4.1473
1.3
1.5
1.7
1.9
2.1
-3 -2.9 -2.8 -2.7 -2.6 -2.5 -2.4 -2.3 -2.2
log C
log
i pA
0.015
0.025
0.035
0.045
0.04 0.06 0.08 0.1
1/ωωωω1/2
1/I
- 0.200V
- 0.225V
- 0.250V
B
Figure 3.7: Plots of, A. log I vs log C and B. 1/ ω1/2 vs 1/I; RDE data of 2-ME catalytic
oxidation on GCE modified by adsorption of CoTEThPc 6c at 1000 rpm rotation speed
at indicated potential values -0.200, -0.225 and -0 .250 V/(SCE) indicating reaction order
of one for 2-ME oxidation.
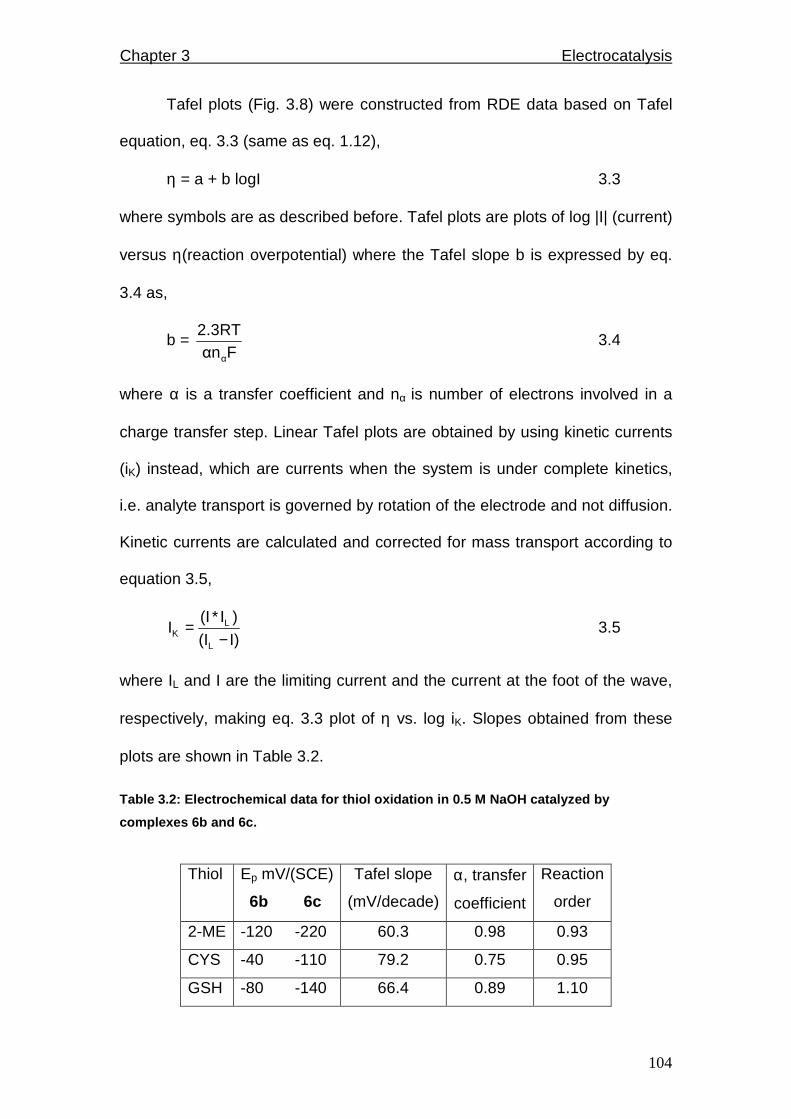
Chapter 3 Electrocatalysis
104
Tafel plots (Fig. 3.8) were constructed from RDE data based on Tafel
equation, eq. 3.3 (same as eq. 1.12),
η = a + b logI 3.3
where symbols are as described before. Tafel plots are plots of log |I| (current)
versus η(reaction overpotential) where the Tafel slope b is expressed by eq.
3.4 as,
b = Fαn
2.3RT
α
3.4
where α is a transfer coefficient and nα is number of electrons involved in a
charge transfer step. Linear Tafel plots are obtained by using kinetic currents
(iK) instead, which are currents when the system is under complete kinetics,
i.e. analyte transport is governed by rotation of the electrode and not diffusion.
Kinetic currents are calculated and corrected for mass transport according to
equation 3.5,
I)(I)I*(I
IL
LK −
= 3.5
where IL and I are the limiting current and the current at the foot of the wave,
respectively, making eq. 3.3 plot of η vs. log iK. Slopes obtained from these
plots are shown in Table 3.2.
Table 3.2: Electrochemical data for thiol oxidation in 0.5 M NaOH catalyzed by
complexes 6b and 6c.
Thiol Ep mV/(SCE)
6b 6c
Tafel slope
(mV/decade)
α, transfer
coefficient
Reaction
order
2-ME -120 -220 60.3 0.98 0.93
CYS -40 -110 79.2 0.75 0.95
GSH -80 -140 66.4 0.89 1.10
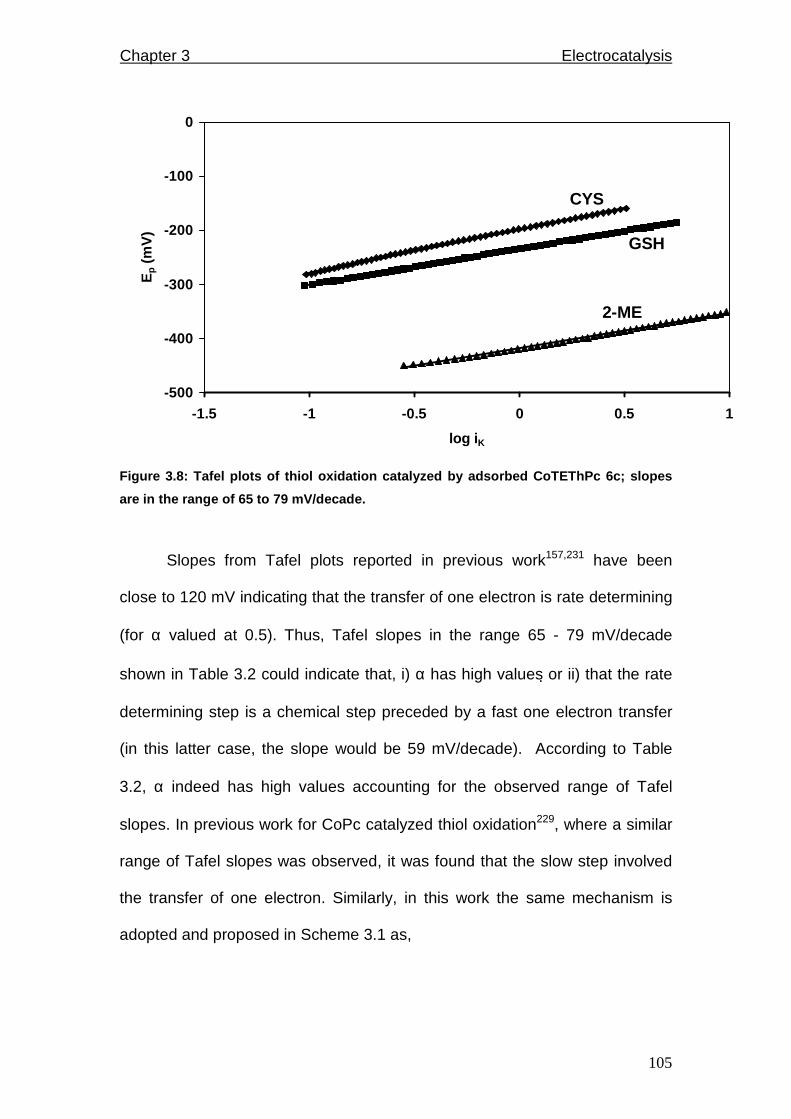
Chapter 3 Electrocatalysis
105
-500
-400
-300
-200
-100
0
-1.5 -1 -0.5 0 0.5 1
log i K
Ep (
mV
)
2-ME
CYS
GSH
Figure 3.8: Tafel plots of thiol oxidation catalyze d by adsorbed CoTEThPc 6c; slopes
are in the range of 65 to 79 mV/decade.
Slopes from Tafel plots reported in previous work157,231 have been
close to 120 mV indicating that the transfer of one electron is rate determining
(for α valued at 0.5). Thus, Tafel slopes in the range 65 - 79 mV/decade
shown in Table 3.2 could indicate that, i) α has high values or ii) that the rate
determining step is a chemical step preceded by a fast one electron transfer
(in this latter case, the slope would be 59 mV/decade). According to Table
3.2, α indeed has high values accounting for the observed range of Tafel
slopes. In previous work for CoPc catalyzed thiol oxidation229, where a similar
range of Tafel slopes was observed, it was found that the slow step involved
the transfer of one electron. Similarly, in this work the same mechanism is
adopted and proposed in Scheme 3.1 as,
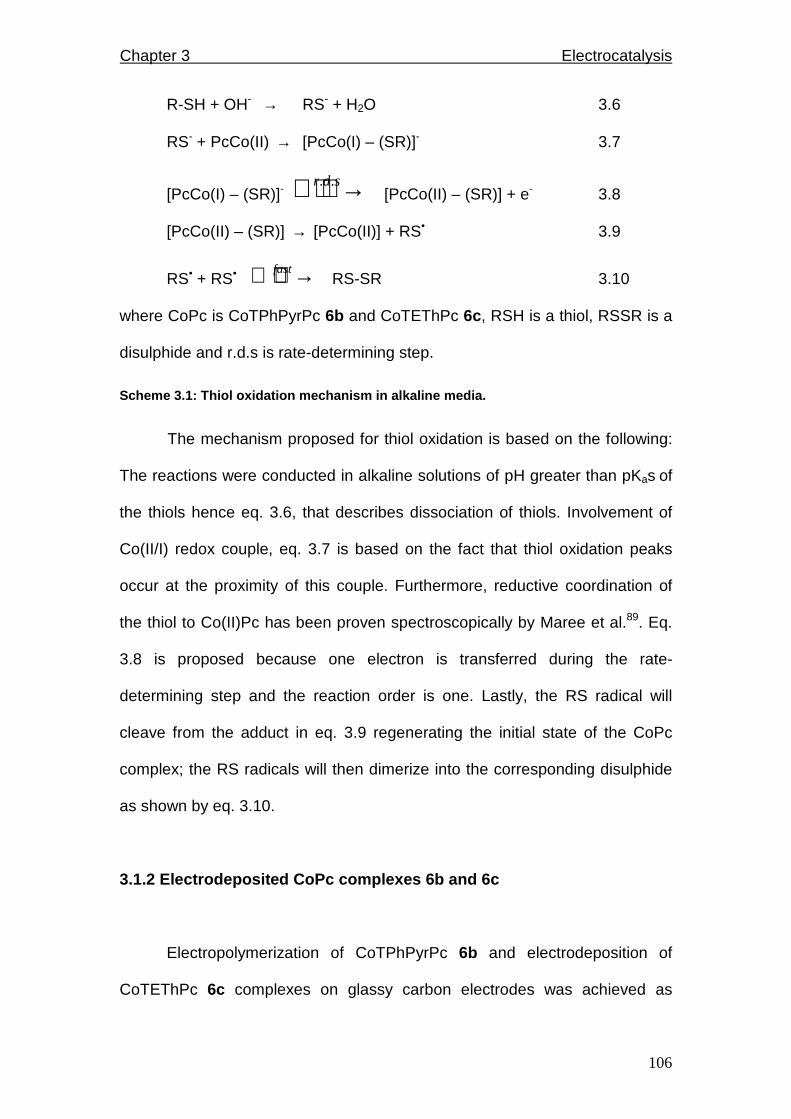
Chapter 3 Electrocatalysis
106
R-SH + OH- → RS- + H2O 3.6
RS- + PcCo(II) → [PcCo(I) – (SR)]- 3.7
[PcCo(I) – (SR)]- → sdr .. [PcCo(II) – (SR)] + e- 3.8
[PcCo(II) – (SR)] → [PcCo(II)] + RS• 3.9
RS• + RS• → fast RS-SR 3.10
where CoPc is CoTPhPyrPc 6b and CoTEThPc 6c, RSH is a thiol, RSSR is a
disulphide and r.d.s is rate-determining step.
Scheme 3.1: Thiol oxidation mechanism in alkaline m edia.
The mechanism proposed for thiol oxidation is based on the following:
The reactions were conducted in alkaline solutions of pH greater than pKas of
the thiols hence eq. 3.6, that describes dissociation of thiols. Involvement of
Co(II/I) redox couple, eq. 3.7 is based on the fact that thiol oxidation peaks
occur at the proximity of this couple. Furthermore, reductive coordination of
the thiol to Co(II)Pc has been proven spectroscopically by Maree et al.89. Eq.
3.8 is proposed because one electron is transferred during the rate-
determining step and the reaction order is one. Lastly, the RS radical will
cleave from the adduct in eq. 3.9 regenerating the initial state of the CoPc
complex; the RS radicals will then dimerize into the corresponding disulphide
as shown by eq. 3.10.
3.1.2 Electrodeposited CoPc complexes 6b and 6c
Electropolymerization of CoTPhPyrPc 6b and electrodeposition of
CoTEThPc 6c complexes on glassy carbon electrodes was achieved as
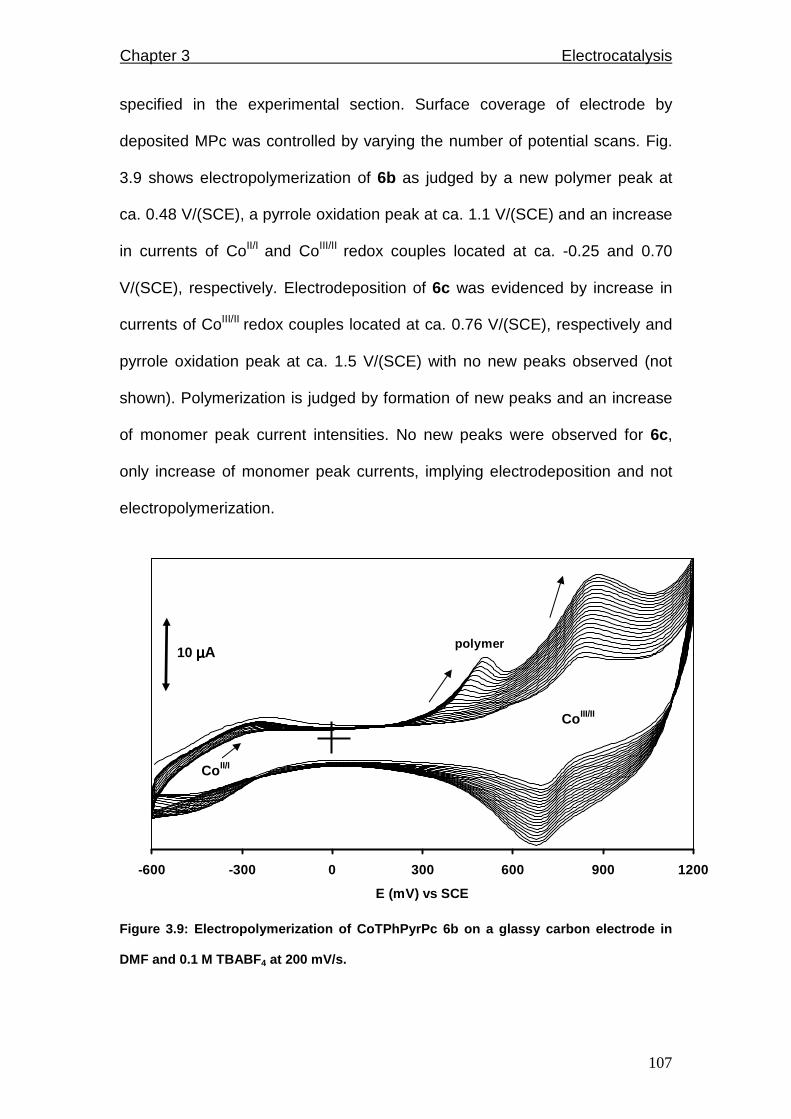
Chapter 3 Electrocatalysis
107
specified in the experimental section. Surface coverage of electrode by
deposited MPc was controlled by varying the number of potential scans. Fig.
3.9 shows electropolymerization of 6b as judged by a new polymer peak at
ca. 0.48 V/(SCE), a pyrrole oxidation peak at ca. 1.1 V/(SCE) and an increase
in currents of CoII/I and CoIII/II redox couples located at ca. -0.25 and 0.70
V/(SCE), respectively. Electrodeposition of 6c was evidenced by increase in
currents of CoIII/II redox couples located at ca. 0.76 V/(SCE), respectively and
pyrrole oxidation peak at ca. 1.5 V/(SCE) with no new peaks observed (not
shown). Polymerization is judged by formation of new peaks and an increase
of monomer peak current intensities. No new peaks were observed for 6c,
only increase of monomer peak currents, implying electrodeposition and not
electropolymerization.
-600 -300 0 300 600 900 1200
E (mV) vs SCE
10 µµµµA
Co II/I
Co III/II
polymer
Figure 3.9: Electropolymerization of CoTPhPyrPc 6b on a glassy carbon electrode in
DMF and 0.1 M TBABF 4 at 200 mV/s.

Chapter 3 Electrocatalysis
108
Pyrrole ligand forms stable polymers; in the case of CoTPhPyrPc 6b
where there is an electron-donating spacer between the pyrrole and the
phthalocyanine chromophore, polymerization occurs even more readily
because of increase in reactivity of radical cations as well as spatial flexibility.
This enhanced polymerization has been reported for propoxy pyrrole
substituted phthalocyanines, wherein better results were obtained for longer
electron rich spacers227. CoTEThPc complex was electrodeposited, it did not
electropolymerize. Electropolymerization of thiophene complexes is known to
be possible using thiophenes with no substituents on the ortho positions of the
pyrrole. Introduction of the ethoxy substituent at the ortho position may have
produced a blocking of the polymerization process. It is also possible that the
radicals formed during electrooxidation of the thiophene groups are too
unstable to participate in further coupling so that no polymers are formed.
Catalytic oxidation of 2-ME, CYS and GSH, characterized by cyclic
voltammetry, was observed with electropolymerized CoTPhPyrPc 6b and
electrodeposited CoTEThPc 6c but the activity was not as high as that of the
adsorbed complexes above. CVs of 2-ME on adsorbed and electrodeposited
CoTEThPc 6c (10 scans) are shown in Fig. 3.10. Peak potentials are
observed at -0.22 and -0.21 V/(SCE) for adsorption and electrodeposition with
current intensities of 53 and 42 µA for 2.5 mM 2-ME solution respectively.
Note the difference in IP values in Table 3.1, it is a different batch of
experiments. Activity is better on electrodes modified by adsorption than
electrodeposition because adsorbed films are held loosely and are less
compact than their electrodeposited counterparts offering easy access for the
thiol to interact effectively with the metal centre of the catalyst.
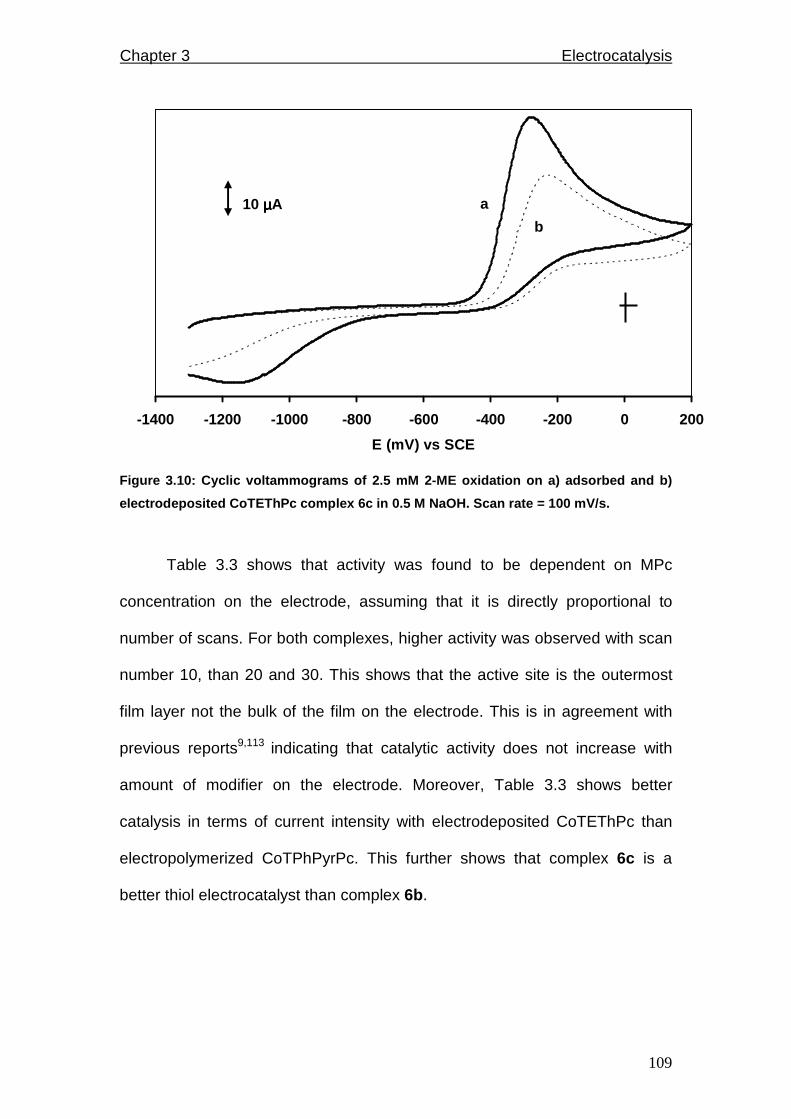
Chapter 3 Electrocatalysis
109
-1400 -1200 -1000 -800 -600 -400 -200 0 200
E (mV) vs SCE
10 µ µ µ µA a
b
Figure 3.10: Cyclic voltammograms of 2.5 mM 2-ME ox idation on a) adsorbed and b)
electrodeposited CoTEThPc complex 6c in 0.5 M NaOH. Scan rate = 100 mV/s.
Table 3.3 shows that activity was found to be dependent on MPc
concentration on the electrode, assuming that it is directly proportional to
number of scans. For both complexes, higher activity was observed with scan
number 10, than 20 and 30. This shows that the active site is the outermost
film layer not the bulk of the film on the electrode. This is in agreement with
previous reports9,113 indicating that catalytic activity does not increase with
amount of modifier on the electrode. Moreover, Table 3.3 shows better
catalysis in terms of current intensity with electrodeposited CoTEThPc than
electropolymerized CoTPhPyrPc. This further shows that complex 6c is a
better thiol electrocatalyst than complex 6b.

Chapter 3 Electrocatalysis
110
Table 3.3: Catalytic current intensities of electro deposited CoTEThPc 6c and
electropolymerized CoTPhPyrPc 6b (obtained by 10, 2 0 and 30 scans) on glassy
carbon electrode for the electrooxidation of 2-ME.
Procedure of electrode
modification
Catalyst 6c
Currenta(µA)
Catalyst 6b
Currenta(µA)
Adsorption
10 scans
20 scans
30 scans
53
42
38
37
29
10
4
3
aCurrent values obtained from CVs of 2.5 mM 2-ME in 0.5 M NaOH aqueous solutions.
Scan rate = 100 mV/s.
Electrocatalytic activity of electrodeposited CoTEThPc 6c towards thiol
oxidation based on peak current intensity was found to depend on the anodic
potential limit, for a given number of electrodeposition scans. Current intensity
was found to be optimum when the anodic limit was 1.6 V/(SCE); it decreased
by ca. 40 % and 50 % at 1.4 V and 1.8 V/(SCE) anodic limits, respectively.
RDE experiments for both electropolymerized 6b and electrodeposited 6c
complexes yielded the same data as their adsorbed counterparts discussed
above, in that one electron was transferred during the rate-determining step
and the order of the reaction was determined to be one.
Tafel slopes were 62.6, 75.0 and 70.4 mV/decade for 2-ME, CYS and
GSH respectively with the corresponding transfer coefficients, α of 1.06, 1.27
and 1.19 respectively. α of 1 shows that products are even more favoured
than for adsorbed complexes where it ranged from 0.75 to 0.98. In general, α
of 0.5 indicates that the activated complex is exactly halfway between
products and reactants on the reaction coordinate; the structure of the

Chapter 3 Electrocatalysis
111
activated complex reflecting reagent and product equally. α valued at 0 or 1
indicates that the activated complex has predominantly the structure of
reactant or product species respectively. The same mechanism for thiol
oxidation for adsorbed complexes shown in Scheme 3.1 also holds for
electrodeposited complexes in alkaline media.
It must be mentioned that both electropolymerized 6b and electro
deposited 6c were stable to poisoning. The electrodes could be used
repeatedly for days without losing sensitivity and electrocatalytic activity. This
is very important as stable sensors are desired for analysis. On the other
hand, their adsorbed counterparts were deactivated after about 10 scans and
had to be re-coated.
3.1.3 Self-assembled monolayers
Gold electrode was modified by a self-assembled monolayer of
CoTEThPc 6c. This complex was suitable because it has a sulphur moiety
through which it can bind to Au, forming a very strong Au-S bond. The
modified electrode was then used to catalyze thiol and thiocyanate oxidation
reactions.
3.1.3.1 Characterization of SAM
Electrochemical methods used for establishing SAM formation include
blockage of gold oxide formation124,125 under-potential deposition (UPD) of
metals such as copper126 and prevention of electron transfer in redox
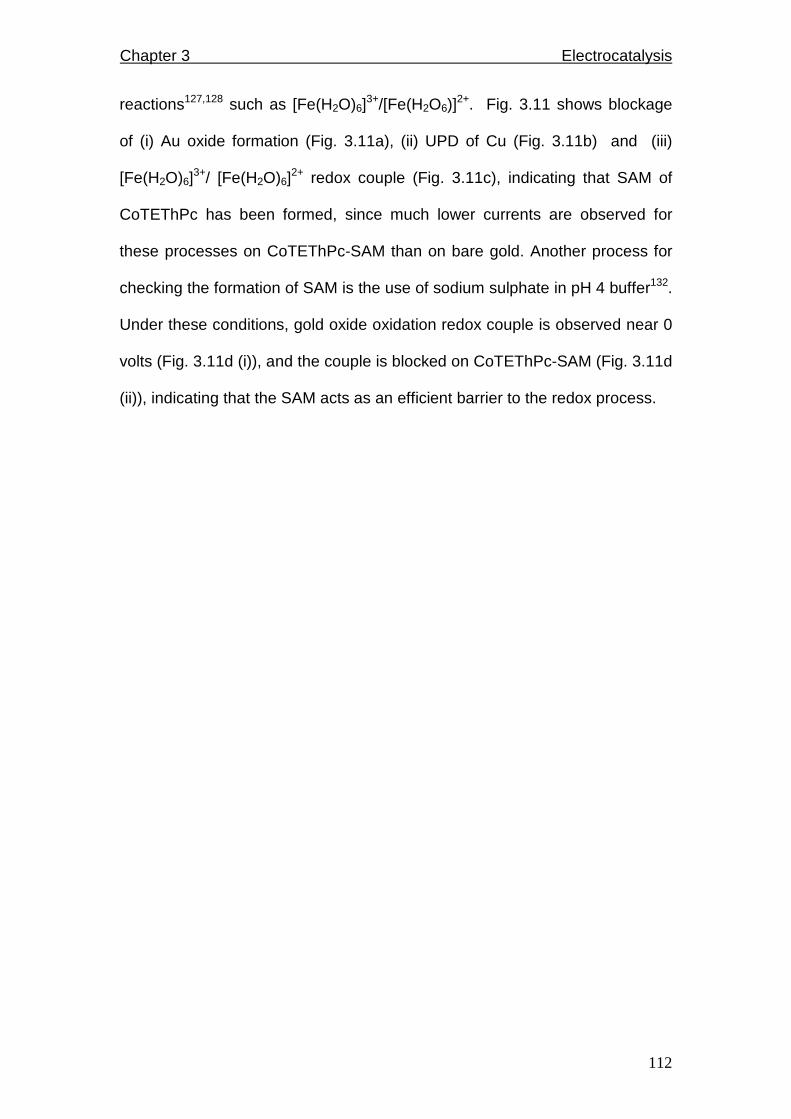
Chapter 3 Electrocatalysis
112
reactions127,128 such as [Fe(H2O)6]3+/[Fe(H2O6)]
2+. Fig. 3.11 shows blockage
of (i) Au oxide formation (Fig. 3.11a), (ii) UPD of Cu (Fig. 3.11b) and (iii)
[Fe(H2O)6]3+/ [Fe(H2O)6]
2+ redox couple (Fig. 3.11c), indicating that SAM of
CoTEThPc has been formed, since much lower currents are observed for
these processes on CoTEThPc-SAM than on bare gold. Another process for
checking the formation of SAM is the use of sodium sulphate in pH 4 buffer132.
Under these conditions, gold oxide oxidation redox couple is observed near 0
volts (Fig. 3.11d (i)), and the couple is blocked on CoTEThPc-SAM (Fig. 3.11d
(ii)), indicating that the SAM acts as an efficient barrier to the redox process.
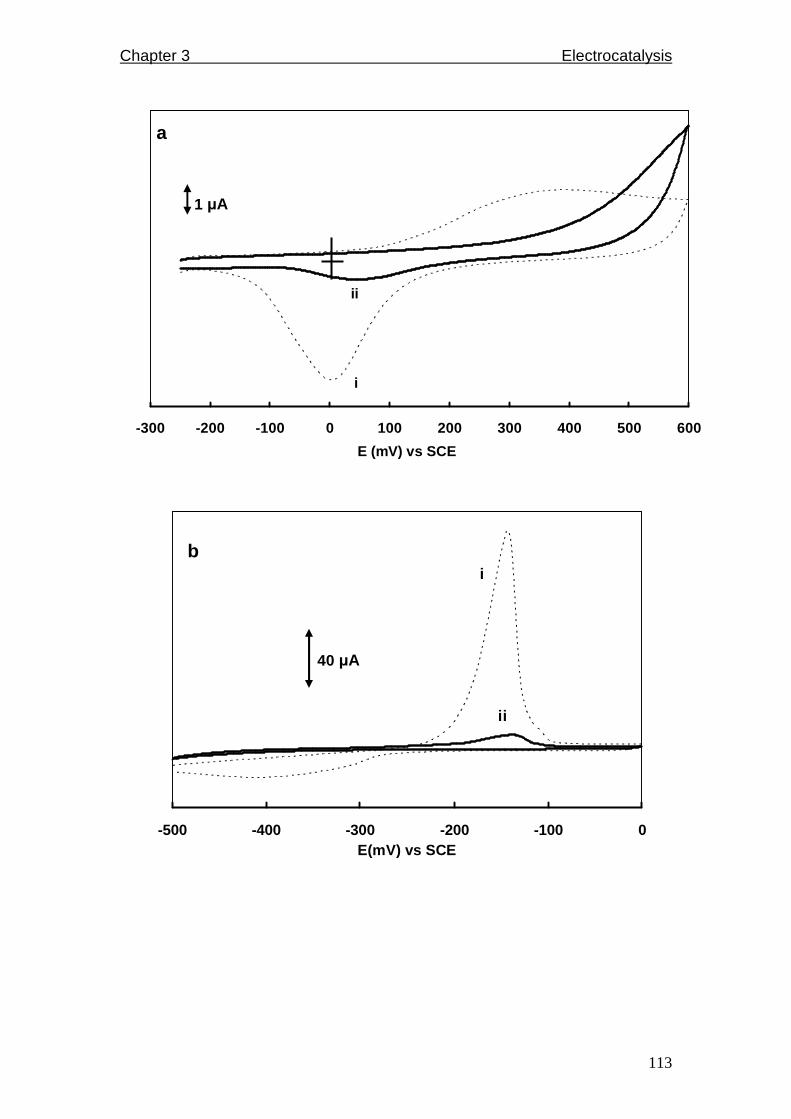
Chapter 3 Electrocatalysis
113
-300 -200 -100 0 100 200 300 400 500 600
E (mV) vs SCE
1 µA
i
ii
a
-500 -400 -300 -200 -100 0E(mV) vs SCE
40 µA
i
ii
b
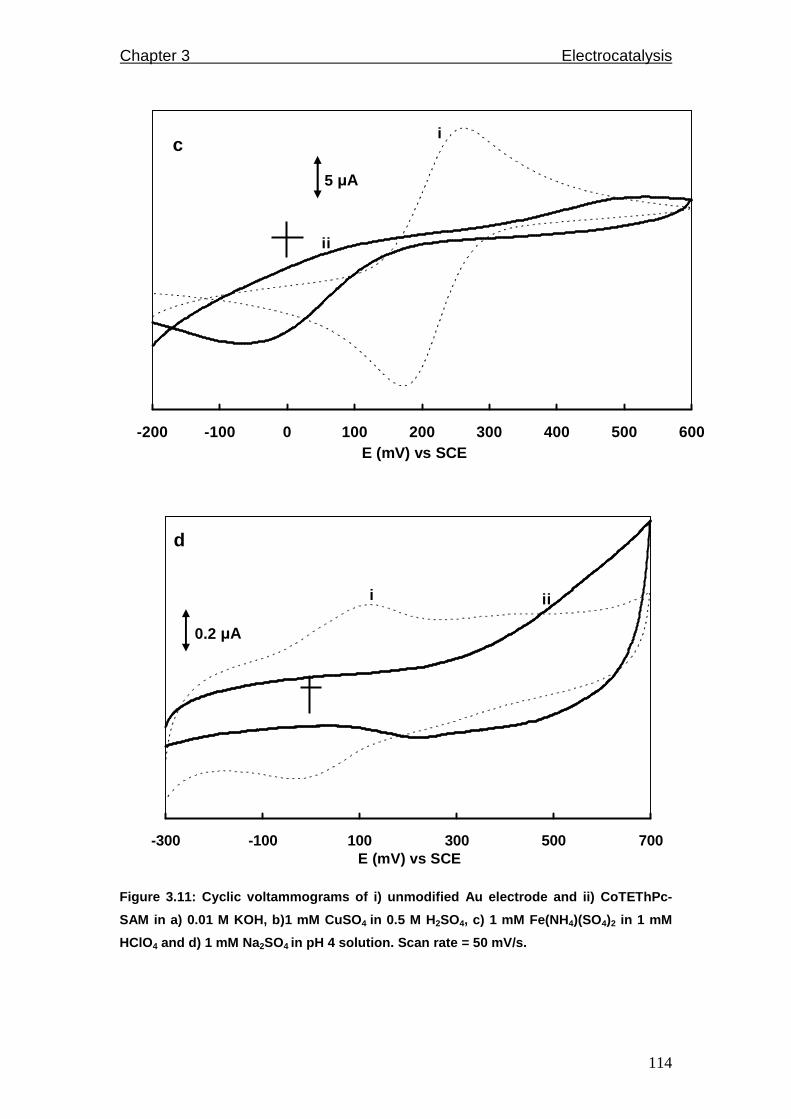
Chapter 3 Electrocatalysis
114
-200 -100 0 100 200 300 400 500 600E (mV) vs SCE
5 µA
i
ii
c
-300 -100 100 300 500 700E (mV) vs SCE
i ii
0.2 µA
d
Figure 3.11: Cyclic voltammograms of i) unmodified Au electrode and ii) CoTEThPc-
SAM in a) 0.01 M KOH, b)1 mM CuSO 4 in 0.5 M H 2SO4, c) 1 mM Fe(NH 4)(SO4)2 in 1 mM
HClO4 and d) 1 mM Na 2SO4 in pH 4 solution. Scan rate = 50 mV/s.
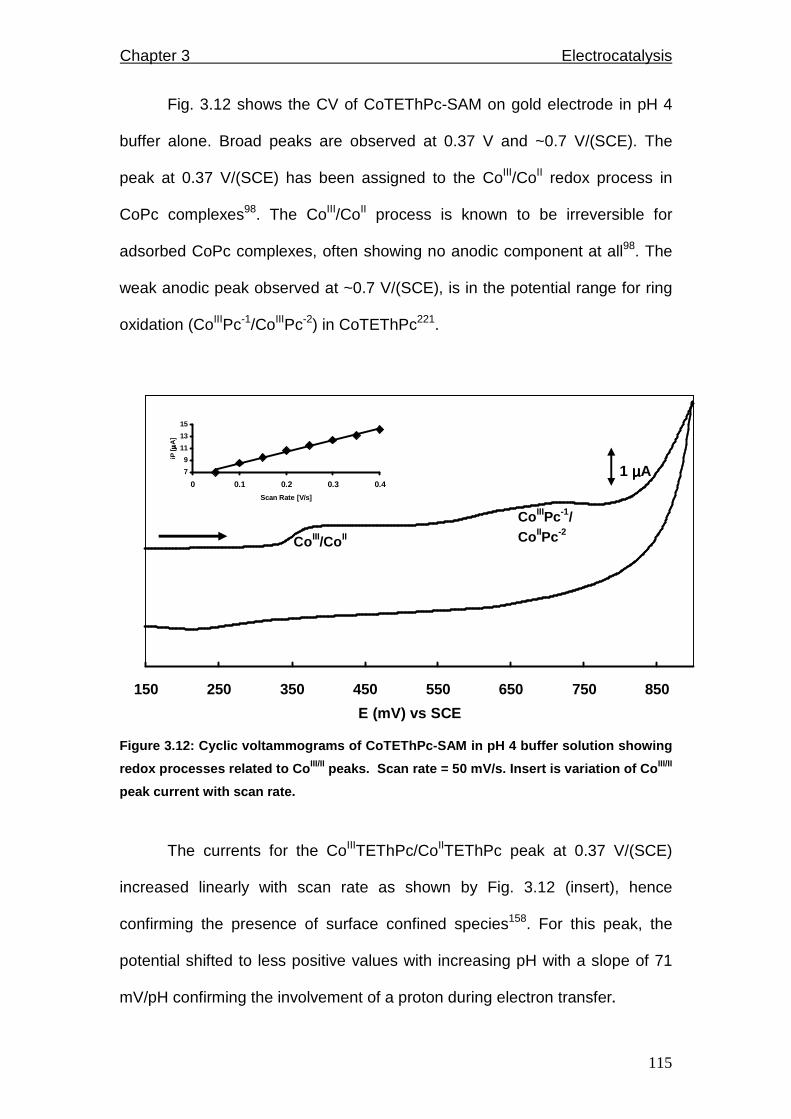
Chapter 3 Electrocatalysis
115
Fig. 3.12 shows the CV of CoTEThPc-SAM on gold electrode in pH 4
buffer alone. Broad peaks are observed at 0.37 V and ~0.7 V/(SCE). The
peak at 0.37 V/(SCE) has been assigned to the CoIII/CoII redox process in
CoPc complexes98. The CoIII/CoII process is known to be irreversible for
adsorbed CoPc complexes, often showing no anodic component at all98. The
weak anodic peak observed at ~0.7 V/(SCE), is in the potential range for ring
oxidation (CoIIIPc-1/CoIIIPc-2) in CoTEThPc221.
150 250 350 450 550 650 750 850
E (mV) vs SCE
1 µµµµA7
9
11
13
15
0 0.1 0.2 0.3 0.4
Scan Rate [V/s]
iP [
µµ µµA
]
Co III/Co II
Co IIIPc-1/Co IIPc-2
Figure 3.12: Cyclic voltammograms of CoTEThPc-SAM i n pH 4 buffer solution showing
redox processes related to Co III/II peaks. Scan rate = 50 mV/s. Insert is variation o f Co III/II
peak current with scan rate.
The currents for the CoIIITEThPc/CoIITEThPc peak at 0.37 V/(SCE)
increased linearly with scan rate as shown by Fig. 3.12 (insert), hence
confirming the presence of surface confined species158. For this peak, the
potential shifted to less positive values with increasing pH with a slope of 71
mV/pH confirming the involvement of a proton during electron transfer.

Chapter 3 Electrocatalysis
116
Factors used to qualitatively characterize SAMs include ion barrier
factor, (Γibf) which is calculated using eq. 3.11129,130, which is the same as eq.
1.26,
Γibf BARE
SAM
Q
Q 1−= 3.11
where symbols are as defined before. This factor is a measure of how well
SAMs have isolated Au electrode surface from the electrolyte, hence the
disappearance of the gold oxide peak is used to establish SAM formation. Fig.
3.11a (CVs of bare Au and CoTEThPc-SAM in 0.01 KOH) and Fig. 3.11b
(CVs of bare Au and CoTEThPc-SAM in 1 mM CuSO4) were employed in this
work to calculate ion barrier factor. Γibf should be equal to unity for complete
isolation of Au from the aqueous solution. Using Figs. 3.11a and b, Γibf was
calculated to be 0.9, which is close enough to unity indicating that the formed
CoTEThPc-SAM is a relatively good barrier.
Another factor that is used to characterize SAMs is interfacial
capacitance, Cs. It is a measure of ion permeability through SAM, it tells us
how densely packed and defect free the SAM is129,131. The lower the Cs is, the
fewer the defects of the SAM and hence the less permeable are the
electrolyte ions to the electrode surface. A decrease in charging current
observed with Au-SAMs, is attributed to the presence of a layer of low
dielectric constant between the electrode and the electrolyte. Cs was
calculated using eq. 3.12132, same as eq. 1.27,
νAi
C chs = 3.12
where symbols are as defined before. Cs was calculated to be 104 and 6
µF/cm2 for bare Au and CoTEThPc-SAM, respectively, using current values

Chapter 3 Electrocatalysis
117
between -0.1 and -0.2 V/(SCE) (in Fig. 3.11d). The lower value for
CoTEThPc-SAM compared to bare gold shows that the SAM is relatively free
of defects, and again indicates a low permeability to the ions of the electrolyte.
Surface coverage of redox active film was estimated from a plot of
background corrected peak current vs. scan rate according to eq. 3.13232,
introduced as eq. 1.25,
4RTAνFn
I MPc22
P
Γ= 3.13
where symbols have their usual meaning. ΓMPc was found to be 1.3 x 10⁻¹⁰
mol cm-2, a value which is in the range for monolayer coverage233,234.
3.1.3.2 L-cysteine oxidation on CoTEThPc-SAM
Fig. 3.13a shows the CV of L-cysteine in pH 4 buffer on CoTEThPc-
SAM. No peaks due to L-cysteine were observed on bare gold. Two peaks
are observed on CoTEThPc-SAM (Fig. 3.13a) at 0.53 V (II) and 0.77 V/(SCE)
(I). The oxidation of L-cysteine is known to be mediated by CoIIIPc/CoIIPc
couple in CoPc complexes235. Peak II at 0.53 V/(SCE) is due to L-cysteine
oxidation, mediated by the CoIII/CoII couple, since it is close to this couple
(Fig. 3.11). This peak (II) was not prominent at very low pH (e.g. pH 1 in Fig.
3.13b, only II labeled for clarity). At pH 1, one main peak (I) was observed at
0.88 V/(SCE) with a shoulder (II) near 0.75 V/(SCE) (Fig. 3.13b). As the pH
increased e.g. pH 3 in Fig. 3.13b, peak I shifted to less positive potentials and
decreased in intensity while peak II become more pronounced and also
shifted to less positive potentials, until only one peak remained at pH 7 (not
shown). Peak I is in the range of ring based (Pc-1) oxidation for the
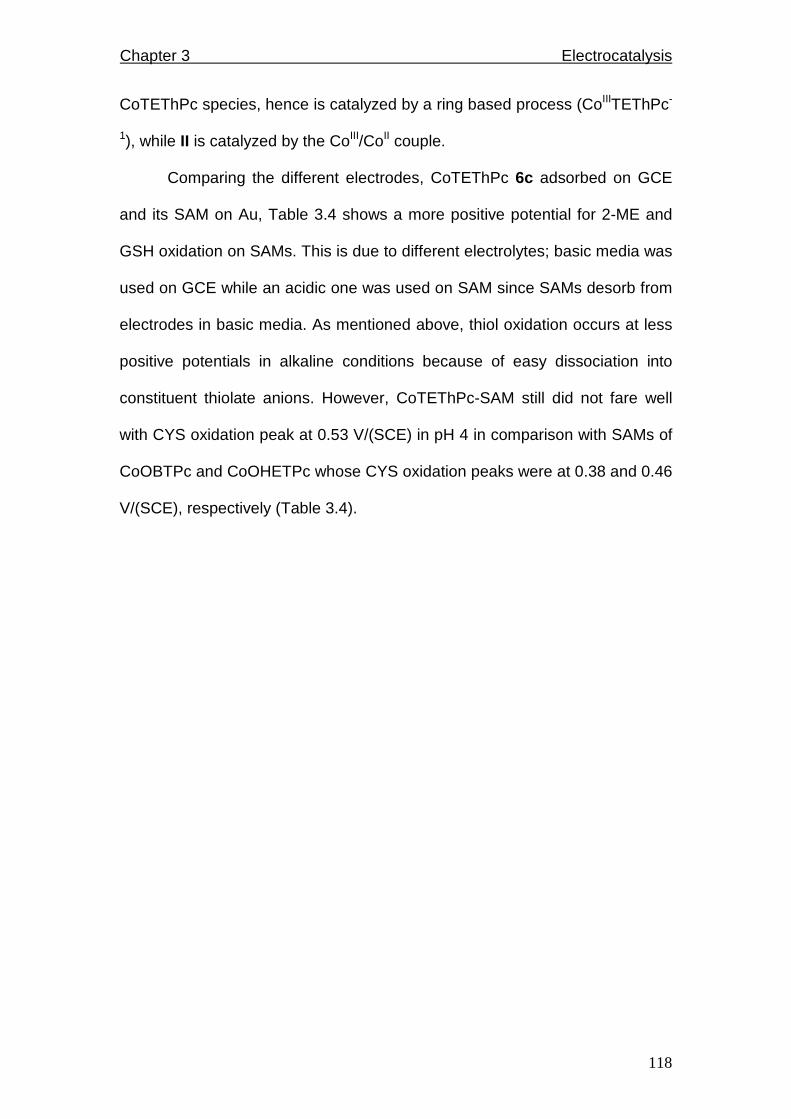
Chapter 3 Electrocatalysis
118
CoTEThPc species, hence is catalyzed by a ring based process (CoIIITEThPc-
1), while II is catalyzed by the CoIII/CoII couple.
Comparing the different electrodes, CoTEThPc 6c adsorbed on GCE
and its SAM on Au, Table 3.4 shows a more positive potential for 2-ME and
GSH oxidation on SAMs. This is due to different electrolytes; basic media was
used on GCE while an acidic one was used on SAM since SAMs desorb from
electrodes in basic media. As mentioned above, thiol oxidation occurs at less
positive potentials in alkaline conditions because of easy dissociation into
constituent thiolate anions. However, CoTEThPc-SAM still did not fare well
with CYS oxidation peak at 0.53 V/(SCE) in pH 4 in comparison with SAMs of
CoOBTPc and CoOHETPc whose CYS oxidation peaks were at 0.38 and 0.46
V/(SCE), respectively (Table 3.4).

Chapter 3 Electrocatalysis
119
0 100 200 300 400 500 600 700 800 900E (mV) vs SCE
1 µµµµA
ii
i
a
II
I
0 100 200 300 400 500 600 700 800 900
E (mV) vs SCE
5 µµµµApH 5
pH 3
pH 1
II
IIII
b
Figure 3.13: Cyclic voltammograms of L-cysteine on i) bare Au and ii) CoTEThPc-SAM
in a) pH 4 and b) pH 1, 3 and 5 solutions. Scan rat e = 50 mV/s.
Chapter 3 Electrocatalysis
120
Table 3.4: Electrochemical data of thiol and thiocy anate oxidation on electrodes
modified by CoPc complexes.
Catalyst Electrode Method of
modification
Media Analyte EP V/(SCE)
6a OPG
SPC
Adsorption
Composite paste
pH 7.4
pH 7.4
pH 13
GSH
GSH
2-ME
GSH
2-ME
0.050
0.47
0.18
0.05
-0.34
6b GC Adsorption &
Polymerization
(10 scans)
pH 13 2-ME
CYS
GSH
-0.12
-0.04
-0.08
6c GC
Au
Adsorption &
Polymerization
(10 scans)
SAM
pH 13
pH 4
2-ME
CYS
GSH
SCN-
CYS
2-ME
-0.22
-0.11
-0.14
0.64
0.53, 0.77
0.78
CoOBTPc a Au SAM pH 4 CYS 0.38
CoOHETPc a Au SAM pH 4 CYS 0.46
aData excerpted from reference 155.
Abbreviations: OBT; octabutylthio (SC 4H9)8, OHET; octahydroxyethylthio (SC 2H4OH)8,
GC; glassy carbon, OPG; ordinary pyrolytic graphite , SPC; screen printed carbon,
SAM; self-assembled monolayer, 2-ME; 2-mercaptoetha nol, CYS; L-cysteine, GSH;
reduced glutathione and SCN -; thiocyanate.
The potentials of both peaks in Fig. 3.13 become less positive as pH
increased as shown by Fig. 3.14 with slopes of 30 mV/pH for I and 60 mV/pH
for II, showing that process II involves one electron and one proton, and
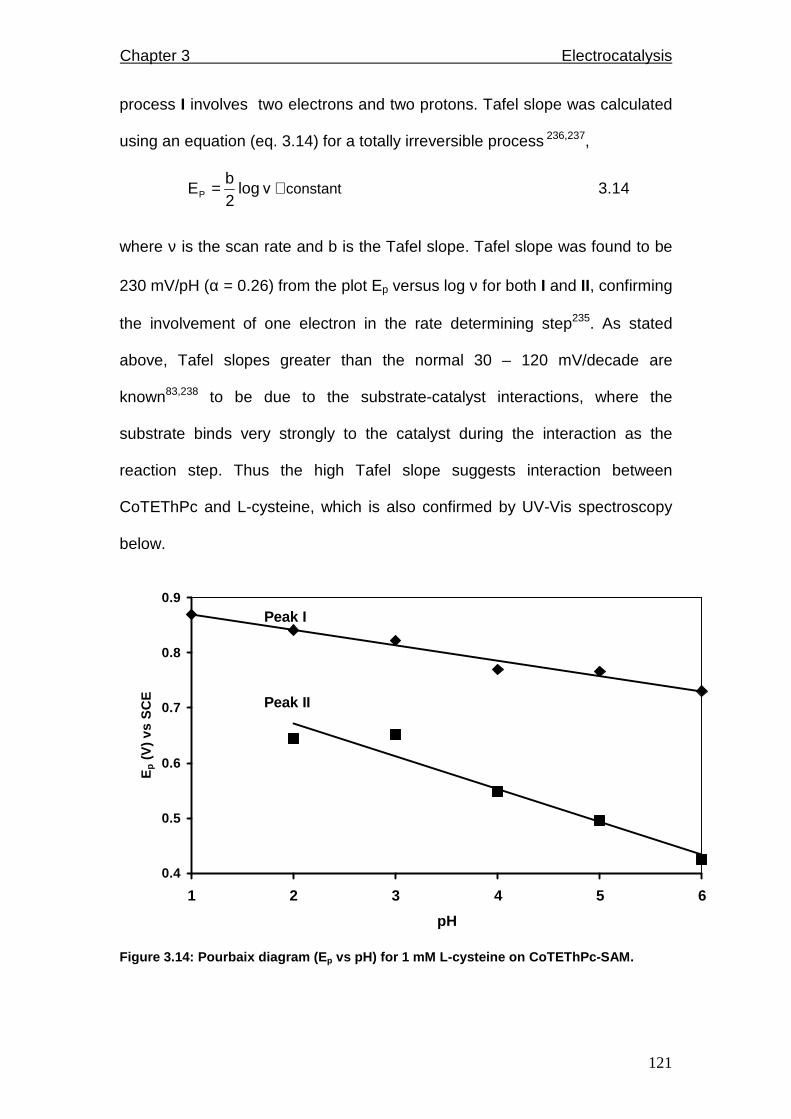
Chapter 3 Electrocatalysis
121
process I involves two electrons and two protons. Tafel slope was calculated
using an equation (eq. 3.14) for a totally irreversible process 236,237,
+= ν log 2b
EP constant 3.14
where ν is the scan rate and b is the Tafel slope. Tafel slope was found to be
230 mV/pH (α = 0.26) from the plot Ep versus log ν for both I and II, confirming
the involvement of one electron in the rate determining step235. As stated
above, Tafel slopes greater than the normal 30 – 120 mV/decade are
known83,238 to be due to the substrate-catalyst interactions, where the
substrate binds very strongly to the catalyst during the interaction as the
reaction step. Thus the high Tafel slope suggests interaction between
CoTEThPc and L-cysteine, which is also confirmed by UV-Vis spectroscopy
below.
0.4
0.5
0.6
0.7
0.8
0.9
1 2 3 4 5 6
pH
Ep (
V)
vs S
CE Peak II
Peak I
Figure 3.14: Pourbaix diagram (E p vs pH) for 1 mM L-cysteine on CoTEThPc-SAM.

Chapter 3 Electrocatalysis
122
From the well known mechanism for catalytic oxidation of L-cysteine on
CoPc complexes89,239 and the fact that the oxidation of L-cysteine (process II,
Fig. 3.13) occurs at the potentials for the CoIII/CoII process for CoTEThPc, the
following mechanism (Scheme 3.2) is proposed for the oxidation of L-cysteine
in acidic media on CoTEThPc-SAM catalyzed by the CoIII/CoII couple (process
II);
CoIITEThPc-2 → sdr .. [CoIIITEThPc-2]+ + e- 3.15
[CoIIITEThPc-2]+ + RSH → [RHS-CoIIITEThPc-2]+ 3.16
[RHS-CoIIITEThPc-2]+ → CoIITEThPc-2 + RS• + H+ 3.17
RS• + RS• → fast RSSR 3.18
where RSH is L-cysteine, RSSR is L-cystine and r.d.s is rate-determining
step.
Scheme 3.2: Mechanism of L-cysteine oxidation in acidic media catalyzed by Co IIIPc/
Co IIPc redox couple.
Equation 3.15 is proposed since catalytic oxidation of L-cysteine
occurs at potentials in the stability range of the CoIII/CoII couple (Fig. 3.11). It
is also the rate-determining step since Tafel slopes showed transfer of one
electron during this step. The coordination of L-cysteine to CoIIITEThPc-2 (eq.
3.16) was confirmed by UV/Visible spectroscopy as follows: Addition of L-
cysteine to chemically generated CoIIITEThPc-2 species (using bromine)
resulted in small bathochromic shifts associated with coordination of L-
cysteine to the CoIIITEThPc species, Fig. 3.15; such spectral changes are
associated with axial ligation in MPc complexes25. No spectral changes were
observed on addition of L-cysteine to the CoIITEThPc-2 species. These
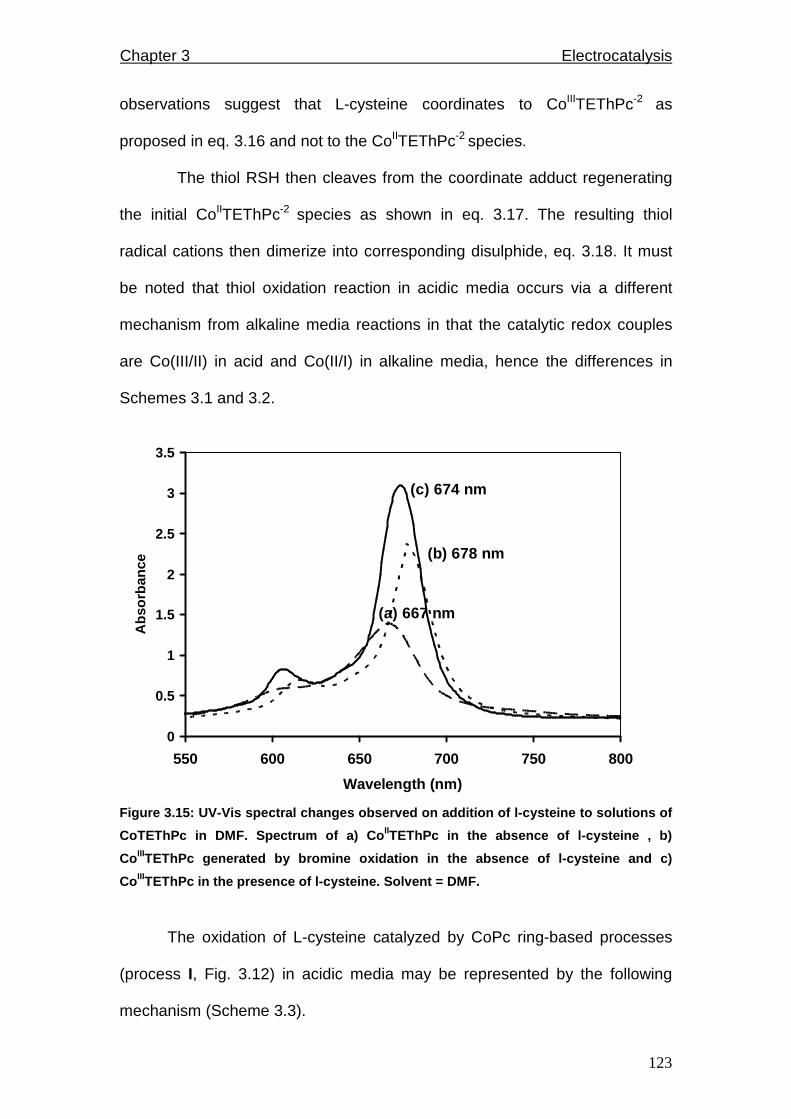
Chapter 3 Electrocatalysis
123
observations suggest that L-cysteine coordinates to CoIIITEThPc-2 as
proposed in eq. 3.16 and not to the CoIITEThPc-2 species.
The thiol RSH then cleaves from the coordinate adduct regenerating
the initial CoIITEThPc-2 species as shown in eq. 3.17. The resulting thiol
radical cations then dimerize into corresponding disulphide, eq. 3.18. It must
be noted that thiol oxidation reaction in acidic media occurs via a different
mechanism from alkaline media reactions in that the catalytic redox couples
are Co(III/II) in acid and Co(II/I) in alkaline media, hence the differences in
Schemes 3.1 and 3.2.
0
0.5
1
1.5
2
2.5
3
3.5
550 600 650 700 750 800
Wavelength (nm)
Abs
orba
nce
(a) 667 nm
(b) 678 nm
(c) 674 nm
Figure 3.15: UV-Vis spectral changes observed on ad dition of l-cysteine to solutions of
CoTEThPc in DMF. Spectrum of a) Co IITEThPc in the absence of l-cysteine , b)
Co IIITEThPc generated by bromine oxidation in the absenc e of l-cysteine and c)
Co IIITEThPc in the presence of l-cysteine. Solvent = DMF.
The oxidation of L-cysteine catalyzed by CoPc ring-based processes
(process I, Fig. 3.12) in acidic media may be represented by the following
mechanism (Scheme 3.3).

Chapter 3 Electrocatalysis
124
CoIITEThPc-2 → sdr .. [CoIIITEThPc-2]+ + e- 3.19
[CoIIITEThPc-2]+ → [CoIIITEThPc-1]2+ + e- 3.20
[CoIIITEThPc-1]2+ + 2RSH → CoIITEThPc-2 + RS• + 2H+ 3.21
RS• + RS• → fast RSSR 3.22
where r.d.s denotes rate-determining step, RSH is the thiol and RSSR is the
disulphide.
Scheme 3.3: Mechanism of L-cysteine oxidation in acidic media catalyzed by Co IIIPc-1
/Co IIIPc-2 redox couple.
Eqs. 3.19 and 3.20 are proposed because L-cysteine oxidation occurs
in the range of CoIIIPc-1/CoIIIPc-2 couple, Fig. 3.12. Two electrons are
transferred during oxidation as evidenced by slopes of 30 mV/pH in Fig. 3.14,
for process I. Eq. 3.21 shows oxidation of the thiol with regeneration of the
initial CoIITEThPc-2 catalytic species and formation of thiol radicals which
subsequently dimerize into the disulphide according to eq. 3.22. Coordination
of RSH to the CoIIITEThPc-2 is possible as shown by Fig. 3.15.
Lastly, it must be mentioned that both peaks I and II in Fig. 3.13 for L-
cysteine oxidation are both diffusion-controlled in the studied pH range of 1 –
7, as evidenced by the linear plot of peak current versus square root of scan
rate (Fig. 3.16). Detection limits were determined using 3σ criterion and were
valued at 2.5 x 10⁻⁸ M. CoTEThPc-SAM was very stable and could be re-used
for longer than a month, exhibiting reproducible electrocatalytic activity. It was
rinsed and stored in pH 4 buffer solutions in between experiments.
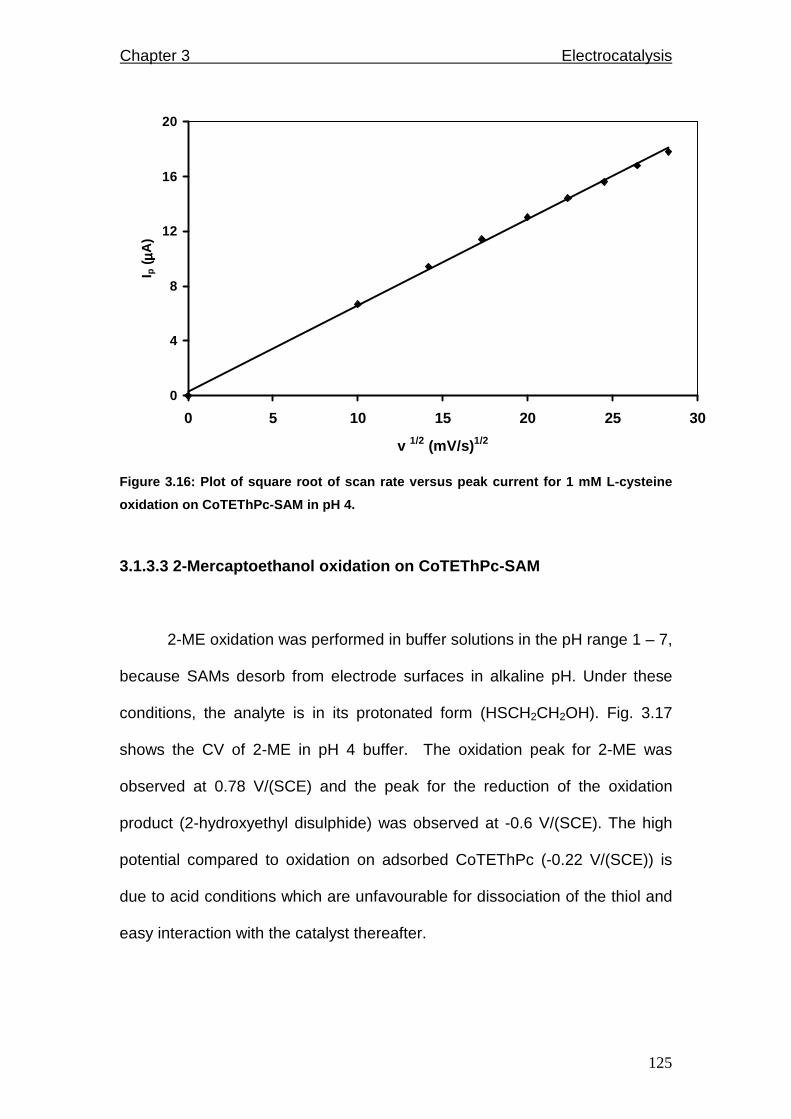
Chapter 3 Electrocatalysis
125
0
4
8
12
16
20
0 5 10 15 20 25 30
v 1/2 (mV/s)1/2
I p (
µµ µµA)
Figure 3.16: Plot of square root of scan rate versu s peak current for 1 mM L-cysteine
oxidation on CoTEThPc-SAM in pH 4.
3.1.3.3 2-Mercaptoethanol oxidation on CoTEThPc-SAM
2-ME oxidation was performed in buffer solutions in the pH range 1 – 7,
because SAMs desorb from electrode surfaces in alkaline pH. Under these
conditions, the analyte is in its protonated form (HSCH2CH2OH). Fig. 3.17
shows the CV of 2-ME in pH 4 buffer. The oxidation peak for 2-ME was
observed at 0.78 V/(SCE) and the peak for the reduction of the oxidation
product (2-hydroxyethyl disulphide) was observed at -0.6 V/(SCE). The high
potential compared to oxidation on adsorbed CoTEThPc (-0.22 V/(SCE)) is
due to acid conditions which are unfavourable for dissociation of the thiol and
easy interaction with the catalyst thereafter.
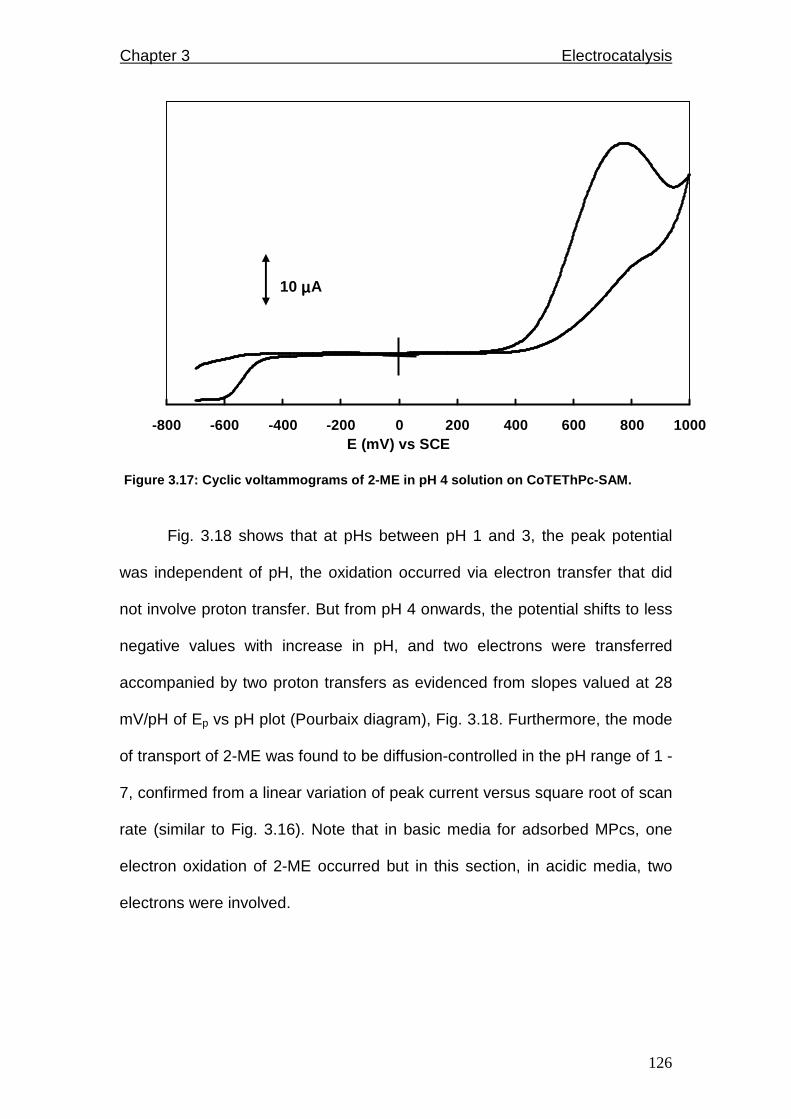
Chapter 3 Electrocatalysis
126
-800 -600 -400 -200 0 200 400 600 800 1000E (mV) vs SCE
10 µµµµA
Figure 3.17: Cyclic voltammograms of 2-ME in pH 4 s olution on CoTEThPc-SAM.
Fig. 3.18 shows that at pHs between pH 1 and 3, the peak potential
was independent of pH, the oxidation occurred via electron transfer that did
not involve proton transfer. But from pH 4 onwards, the potential shifts to less
negative values with increase in pH, and two electrons were transferred
accompanied by two proton transfers as evidenced from slopes valued at 28
mV/pH of Ep vs pH plot (Pourbaix diagram), Fig. 3.18. Furthermore, the mode
of transport of 2-ME was found to be diffusion-controlled in the pH range of 1 -
7, confirmed from a linear variation of peak current versus square root of scan
rate (similar to Fig. 3.16). Note that in basic media for adsorbed MPcs, one
electron oxidation of 2-ME occurred but in this section, in acidic media, two
electrons were involved.
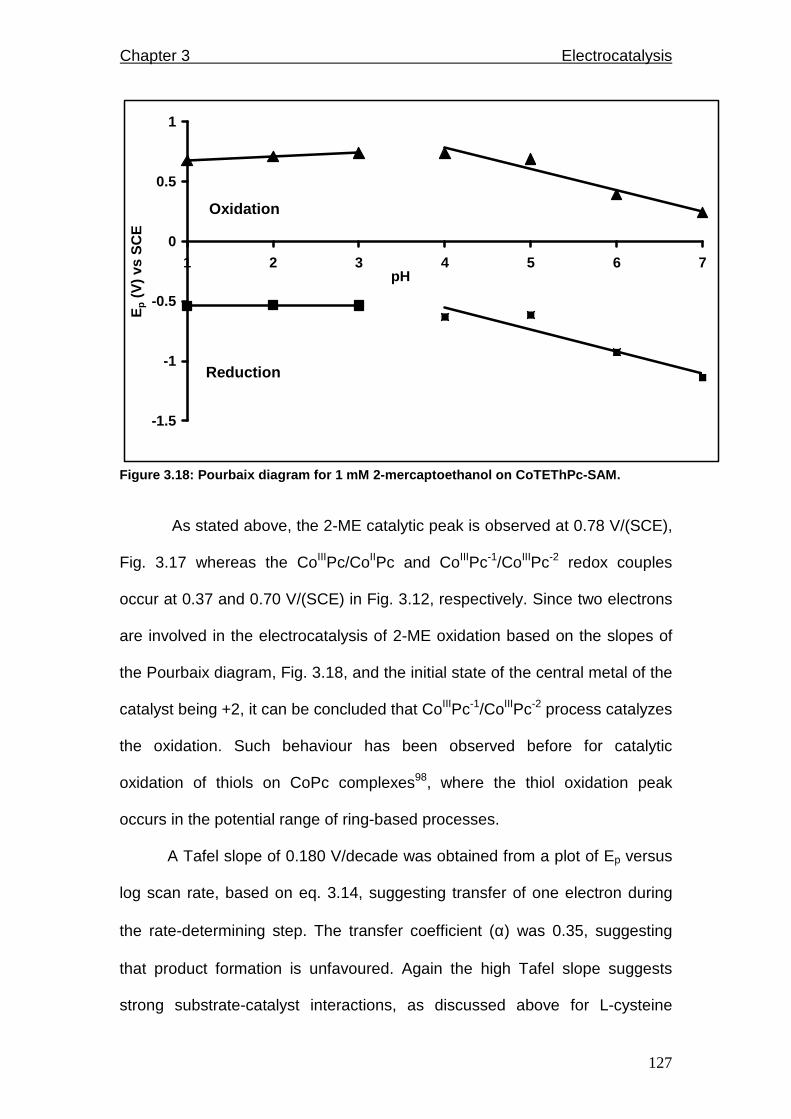
Chapter 3 Electrocatalysis
127
-1.5
-1
-0.5
0
0.5
1
1 2 3 4 5 6 7pH
Ep (
V)
vs S
CE
Oxidation
Reduction
Figure 3.18: Pourbaix diagram for 1 mM 2-mercaptoet hanol on CoTEThPc-SAM.
As stated above, the 2-ME catalytic peak is observed at 0.78 V/(SCE),
Fig. 3.17 whereas the CoIIIPc/CoIIPc and CoIIIPc-1/CoIIIPc-2 redox couples
occur at 0.37 and 0.70 V/(SCE) in Fig. 3.12, respectively. Since two electrons
are involved in the electrocatalysis of 2-ME oxidation based on the slopes of
the Pourbaix diagram, Fig. 3.18, and the initial state of the central metal of the
catalyst being +2, it can be concluded that CoIIIPc-1/CoIIIPc-2 process catalyzes
the oxidation. Such behaviour has been observed before for catalytic
oxidation of thiols on CoPc complexes98, where the thiol oxidation peak
occurs in the potential range of ring-based processes.
A Tafel slope of 0.180 V/decade was obtained from a plot of Ep versus
log scan rate, based on eq. 3.14, suggesting transfer of one electron during
the rate-determining step. The transfer coefficient (α) was 0.35, suggesting
that product formation is unfavoured. Again the high Tafel slope suggests
strong substrate-catalyst interactions, as discussed above for L-cysteine
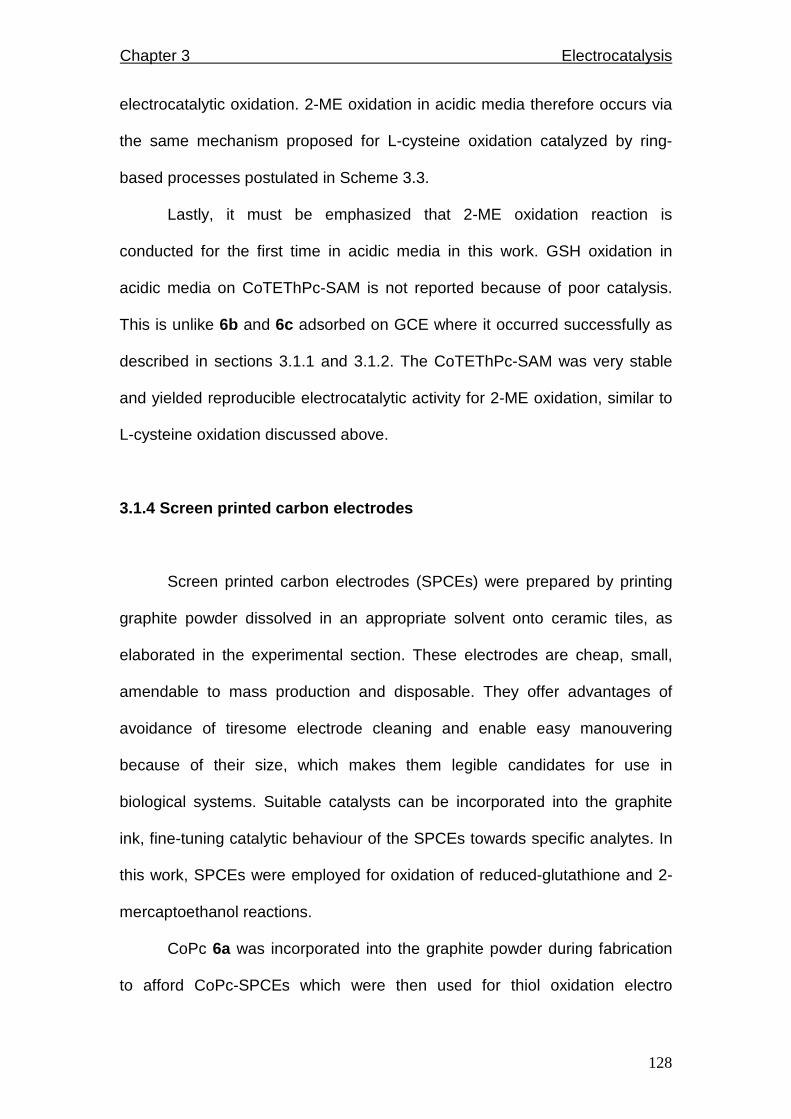
Chapter 3 Electrocatalysis
128
electrocatalytic oxidation. 2-ME oxidation in acidic media therefore occurs via
the same mechanism proposed for L-cysteine oxidation catalyzed by ring-
based processes postulated in Scheme 3.3.
Lastly, it must be emphasized that 2-ME oxidation reaction is
conducted for the first time in acidic media in this work. GSH oxidation in
acidic media on CoTEThPc-SAM is not reported because of poor catalysis.
This is unlike 6b and 6c adsorbed on GCE where it occurred successfully as
described in sections 3.1.1 and 3.1.2. The CoTEThPc-SAM was very stable
and yielded reproducible electrocatalytic activity for 2-ME oxidation, similar to
L-cysteine oxidation discussed above.
3.1.4 Screen printed carbon electrodes
Screen printed carbon electrodes (SPCEs) were prepared by printing
graphite powder dissolved in an appropriate solvent onto ceramic tiles, as
elaborated in the experimental section. These electrodes are cheap, small,
amendable to mass production and disposable. They offer advantages of
avoidance of tiresome electrode cleaning and enable easy manouvering
because of their size, which makes them legible candidates for use in
biological systems. Suitable catalysts can be incorporated into the graphite
ink, fine-tuning catalytic behaviour of the SPCEs towards specific analytes. In
this work, SPCEs were employed for oxidation of reduced-glutathione and 2-
mercaptoethanol reactions.
CoPc 6a was incorporated into the graphite powder during fabrication
to afford CoPc-SPCEs which were then used for thiol oxidation electro
Chapter 3 Electrocatalysis
129
catalysis. CoPc was so chosen because phthalocyanine complexes with
cobalt as the metal centre have been reported to exhibit exceptional electro
catalytic behaviour towards thiol oxidation compared to other transition metals
such as Fe and Mn. Moreover, this complex is readily available; it can be
purchased at a low price. It should be noted that modification of SPCEs with
MPcs requires large quantitites of complexes, for instance 100 mg of CoPc
was used to make CoPc-SPCEs employed in this work. It is for this reason
that CoTPhPyrPc 6b and CoTEThPc 6c complexes were not used as
modifiers because their synthesis is difficult and results in minute product
yields.
Incorporation of CoPc into the graphite ink mixture of the SPCEs was
confirmed by probing reversibility of a well-known reversible FeIII/II redox
couple of the ferricyanide system. Indeed, the couple was more resolved and
had a smaller peak separation on CoPc-SPCE than on unmodified SPCE (Fig.
3.19), confirming presence of CoPc on the electrode surface. Also cyclic
voltammograms of CoPc-SPCEs were recorded in pH 7.4 buffer solution.
These exhibited CoII/I redox couple peaks at ~-0.70 V /(SCE) (Fig. 3.20a (i)),
proving the presence of CoPc on the SPCE surfaces. Note that this couple
has been observed at -0.66 and -0.68 V /(SCE) for CoTPhPyrPc 6b and
CoTEThPc 6c adsorbed on OPG electrodes in 0.5 M NaOH solution. The
variation in potential is due to different complexes and media, as well as
electrode material.
Chapter 3 Electrocatalysis
130
-300 -200 -100 0 100 200 300 400 500 600
E (mV) vs SCE
10 µµµµA
i
ii
Figure 3.19: Cyclic voltammograms of 1 mM Fe(CN) 63-/Fe(CN)6
4- in 0.1 M KCl on i) bare
SPCE and ii) 5 % CoPc-SPCE. Scan rate = 100 mV/s.
Electrooxidation of GSH and 2-ME was performed on 5% CoPc-SPCEs
(prepared from CoPc dissolved in cyclohexanone solution) in neutral and in
alkaline solution. Fig. 3.20 shows the cyclic voltammograms of GSH and 2-ME
in 0.1 M NaOH (pH ~13). Electrooxidation peaks of GSH and 2-ME were
observed at 0.05 and -0.34 V/(SCE), respectively. Note that in neutral solution
(phosphate buffer, pH 7.4), the peaks were observed at 0.47 V and 0.18
V/(SCE) for GSH and 2-ME, respectively (Fig. 3.21). As expected, reaction
overpotentials were greatly reduced in alkaline media240. In both cases, it
should be noted that oxidation of GSH and 2-ME was not observed at bare
SPCEs (without CoPc) in the investigated potential range (data not shown).
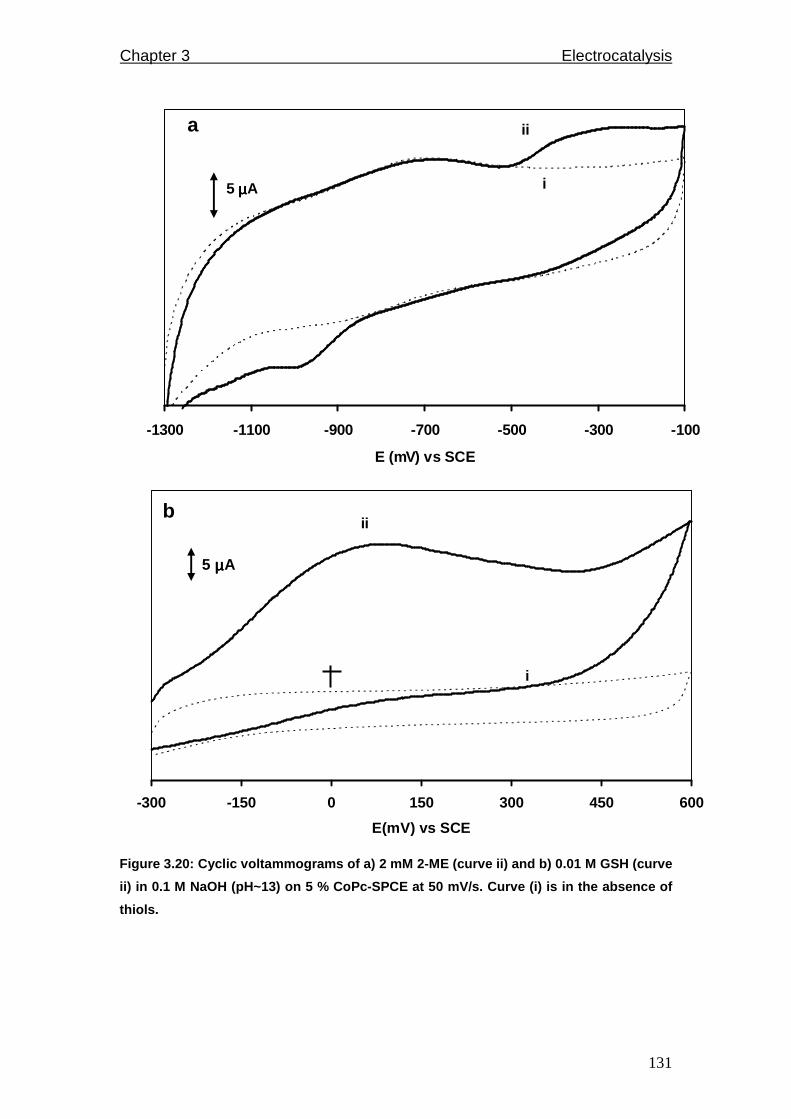
Chapter 3 Electrocatalysis
131
-1300 -1100 -900 -700 -500 -300 -100
E (mV) vs SCE
a
5 µµµµA i
ii
-300 -150 0 150 300 450 600
E(mV) vs SCE
b
5 µµµµA
i
ii
Figure 3.20: Cyclic voltammograms of a) 2 mM 2-ME ( curve ii) and b) 0.01 M GSH (curve
ii) in 0.1 M NaOH (pH~13) on 5 % CoPc-SPCE at 50 mV /s. Curve (i) is in the absence of
thiols.
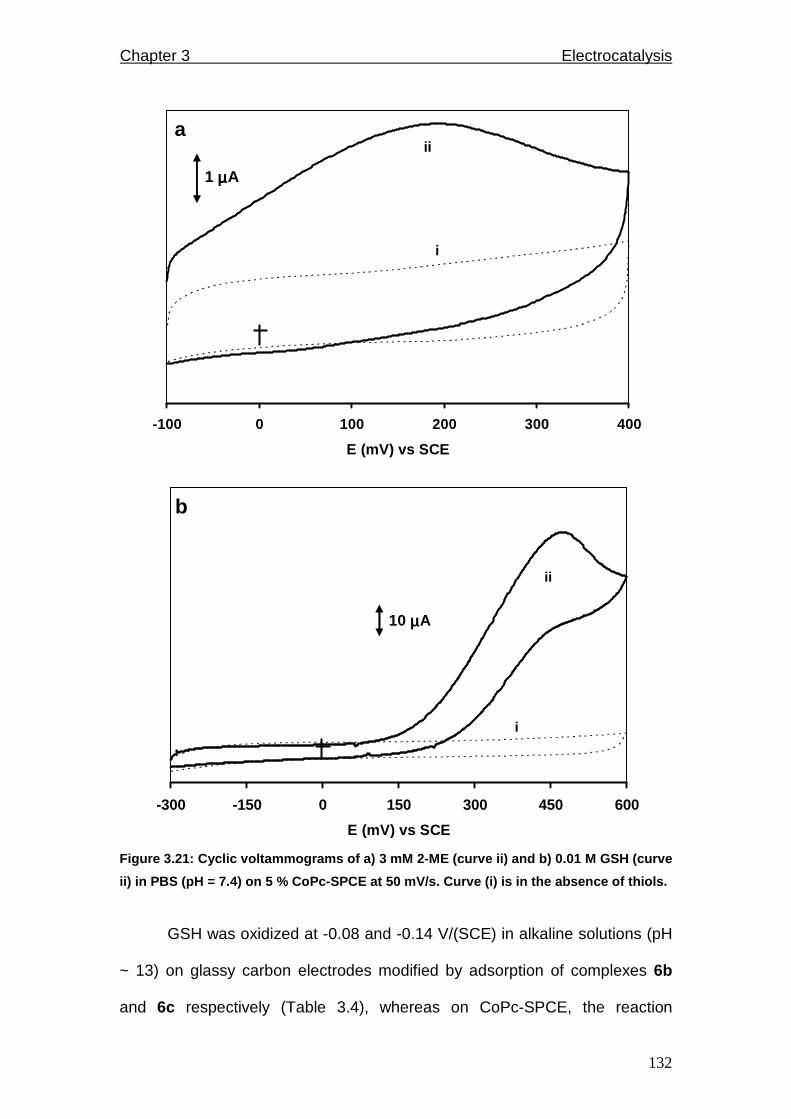
Chapter 3 Electrocatalysis
132
-100 0 100 200 300 400
E (mV) vs SCE
a
1 µµµµA
i
ii
-300 -150 0 150 300 450 600
E (mV) vs SCE
b
10 µ µ µ µA
i
ii
Figure 3.21: Cyclic voltammograms of a) 3 mM 2-ME ( curve ii) and b) 0.01 M GSH (curve
ii) in PBS (pH = 7.4) on 5 % CoPc-SPCE at 50 mV/s. Curve (i) is in the absence of thiols.
GSH was oxidized at -0.08 and -0.14 V/(SCE) in alkaline solutions (pH
~ 13) on glassy carbon electrodes modified by adsorption of complexes 6b
and 6c respectively (Table 3.4), whereas on CoPc-SPCE, the reaction
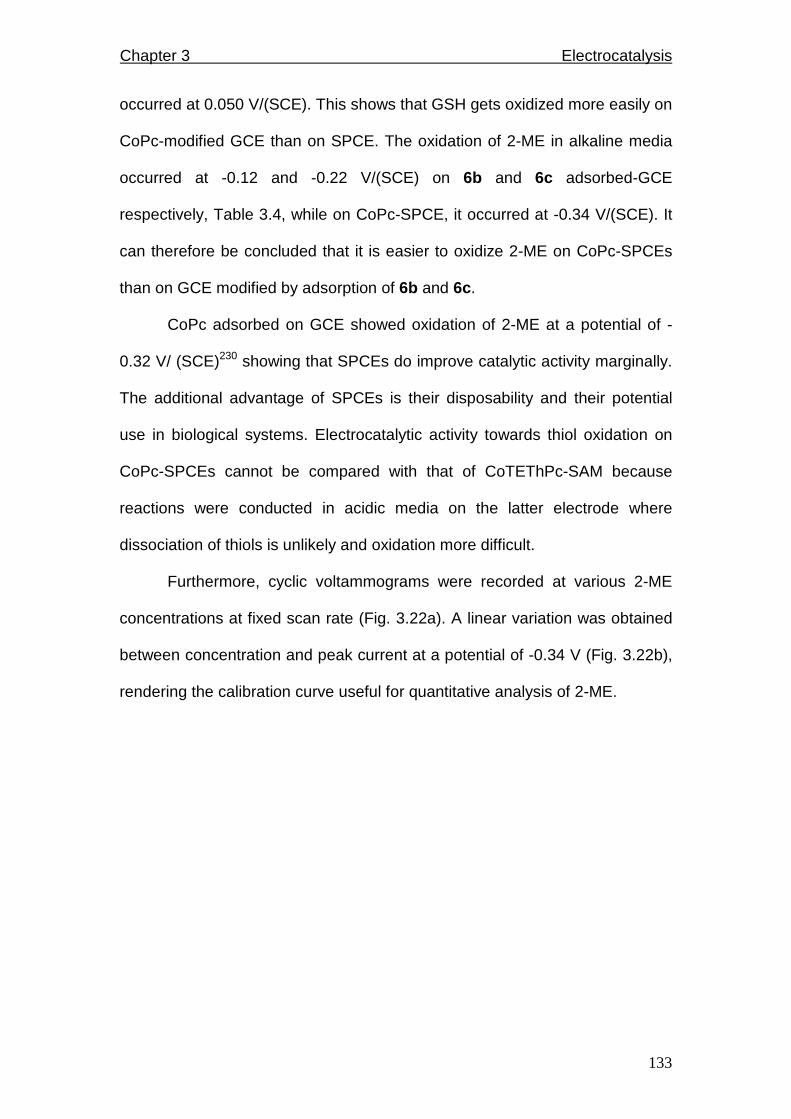
Chapter 3 Electrocatalysis
133
occurred at 0.050 V/(SCE). This shows that GSH gets oxidized more easily on
CoPc-modified GCE than on SPCE. The oxidation of 2-ME in alkaline media
occurred at -0.12 and -0.22 V/(SCE) on 6b and 6c adsorbed-GCE
respectively, Table 3.4, while on CoPc-SPCE, it occurred at -0.34 V/(SCE). It
can therefore be concluded that it is easier to oxidize 2-ME on CoPc-SPCEs
than on GCE modified by adsorption of 6b and 6c.
CoPc adsorbed on GCE showed oxidation of 2-ME at a potential of -
0.32 V/ (SCE)230 showing that SPCEs do improve catalytic activity marginally.
The additional advantage of SPCEs is their disposability and their potential
use in biological systems. Electrocatalytic activity towards thiol oxidation on
CoPc-SPCEs cannot be compared with that of CoTEThPc-SAM because
reactions were conducted in acidic media on the latter electrode where
dissociation of thiols is unlikely and oxidation more difficult.
Furthermore, cyclic voltammograms were recorded at various 2-ME
concentrations at fixed scan rate (Fig. 3.22a). A linear variation was obtained
between concentration and peak current at a potential of -0.34 V (Fig. 3.22b),
rendering the calibration curve useful for quantitative analysis of 2-ME.
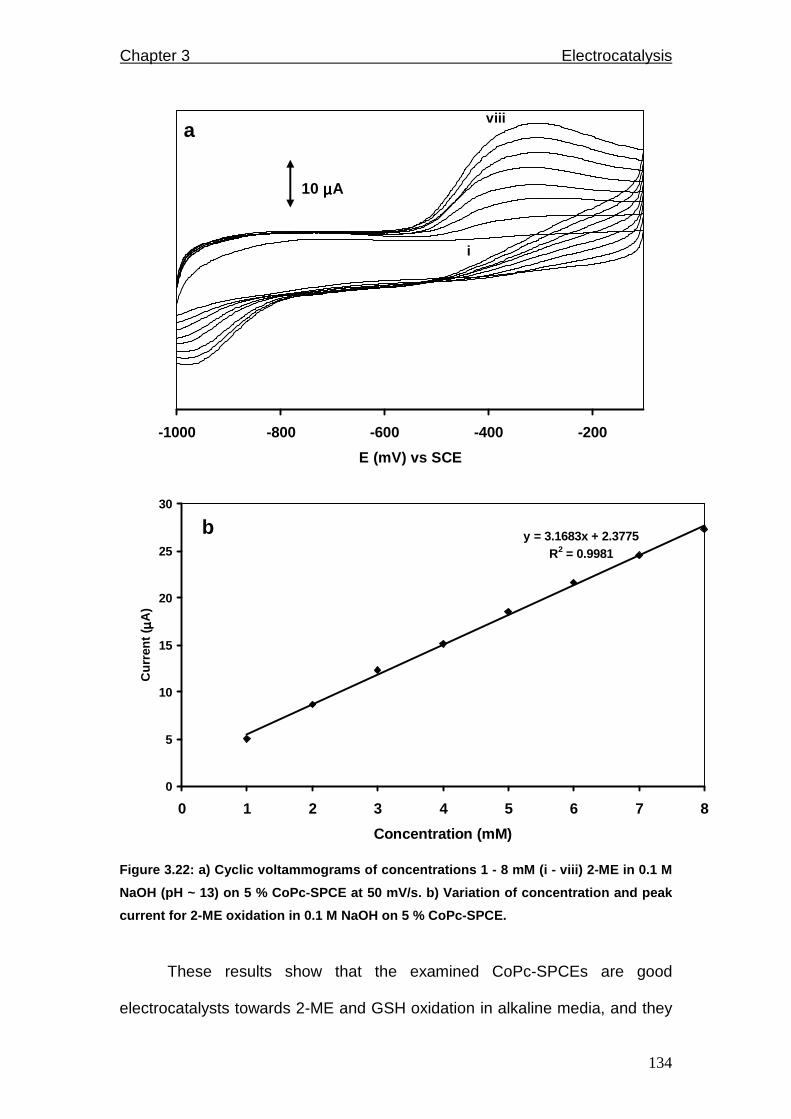
Chapter 3 Electrocatalysis
134
-1000 -800 -600 -400 -200
E (mV) vs SCE
a
10 µ µ µ µA
i
viii
y = 3.1683x + 2.3775R2 = 0.9981
0
5
10
15
20
25
30
0 1 2 3 4 5 6 7 8
Concentration (mM)
Cur
rent
(µµ µµA
)
b
Figure 3.22: a) Cyclic voltammograms of concentrati ons 1 - 8 mM (i - viii) 2-ME in 0.1 M
NaOH (pH ~ 13) on 5 % CoPc-SPCE at 50 mV/s. b) Vari ation of concentration and peak
current for 2-ME oxidation in 0.1 M NaOH on 5 % CoP c-SPCE.
These results show that the examined CoPc-SPCEs are good
electrocatalysts towards 2-ME and GSH oxidation in alkaline media, and they

Chapter 3 Electrocatalysis
135
are better than CoPc-GCE for 2-ME. In order to further assess the catalytic
activity that stemmed from CoPc incorporated in the SPCEs, electrooxidation
reactions were performed on SPCEs of various CoPc % composition of 1.0,
2.5 and 5.0 % prepared from CoPc dissolved in chloroform. Fig. 3.23 shows
the cyclic voltammograms of GSH recorded at 1 %, 2.5 % and 5 % CoPc-
SPCEs in neutral and alkaline solutions. In both cases, electrode loading of
5% CoPc-SPCEs showed the poorest catalytic activity, in terms of current
intensity.

Chapter 3 Electrocatalysis
136
0 100 200 300 400 500 600
E (mV) vs SCE
i
ii
iii5 µµµµA
a
-400 -300 -200 -100 0 100 200 300 400
E (mV) vs SCE
5 µ µ µ µA
b
i
ii
iii
Figure 3.23: Cyclic voltammograms of 50 mM GSH at 1 % CoPc-SPCE (curve i), 2.5%
CoPc-SPCE (curve ii) and 5% CoPc-SPCE (curve iii) i n a) PBS (pH 7.4) and b) 0.1 M
NaOH aqueous solutions.
To ascertain that thiol current intensity results from various amounts of
CoPc incorporated in the inks of SPCEs, peak intensity of the well known
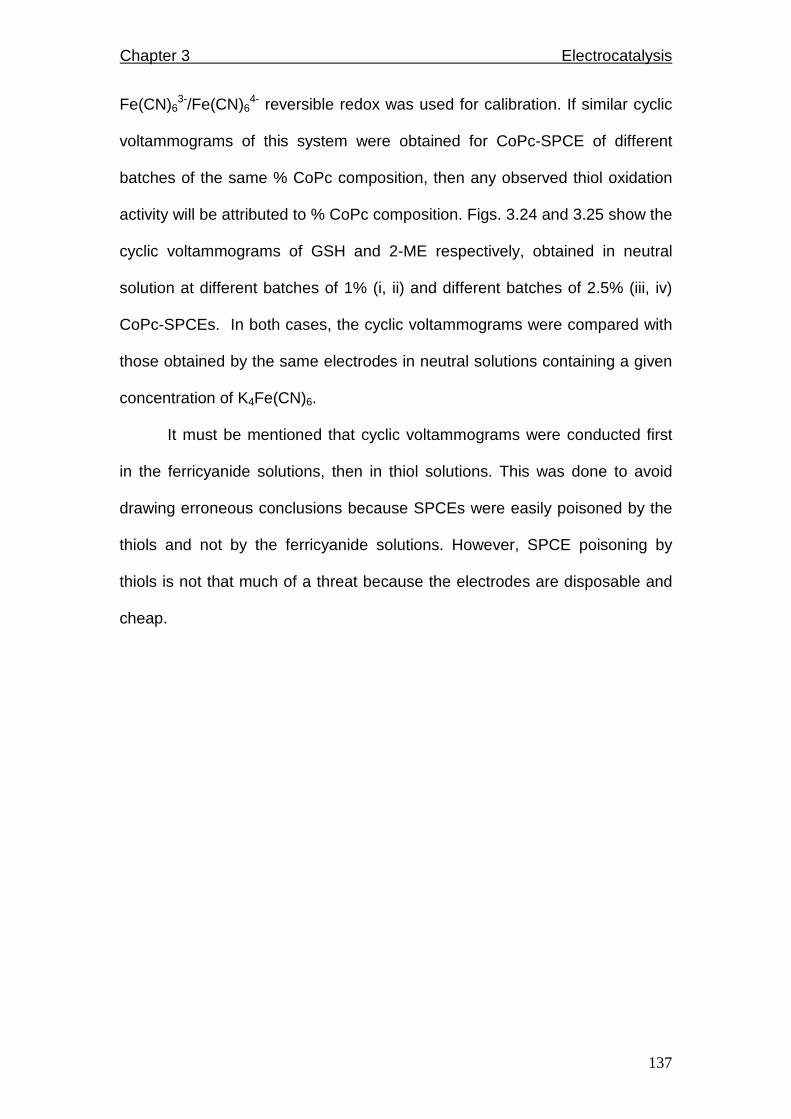
Chapter 3 Electrocatalysis
137
Fe(CN)63-/Fe(CN)6
4- reversible redox was used for calibration. If similar cyclic
voltammograms of this system were obtained for CoPc-SPCE of different
batches of the same % CoPc composition, then any observed thiol oxidation
activity will be attributed to % CoPc composition. Figs. 3.24 and 3.25 show the
cyclic voltammograms of GSH and 2-ME respectively, obtained in neutral
solution at different batches of 1% (i, ii) and different batches of 2.5% (iii, iv)
CoPc-SPCEs. In both cases, the cyclic voltammograms were compared with
those obtained by the same electrodes in neutral solutions containing a given
concentration of K4Fe(CN)6.
It must be mentioned that cyclic voltammograms were conducted first
in the ferricyanide solutions, then in thiol solutions. This was done to avoid
drawing erroneous conclusions because SPCEs were easily poisoned by the
thiols and not by the ferricyanide solutions. However, SPCE poisoning by
thiols is not that much of a threat because the electrodes are disposable and
cheap.
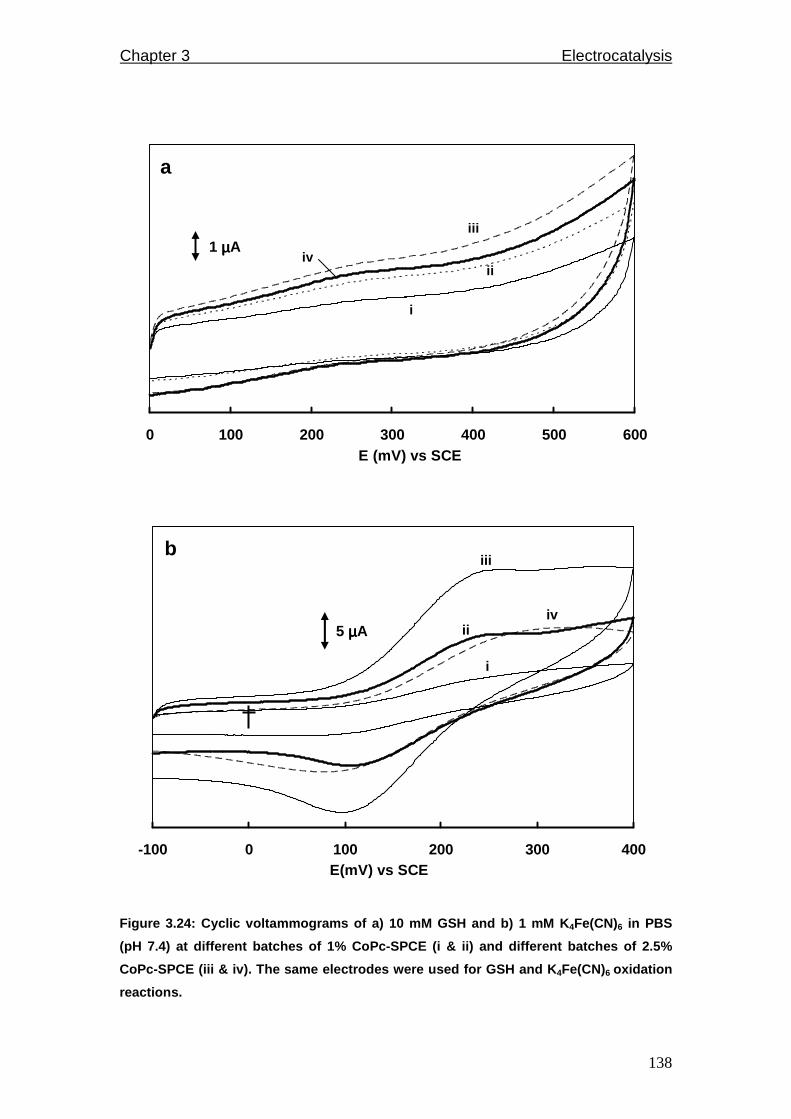
Chapter 3 Electrocatalysis
138
0 100 200 300 400 500 600E (mV) vs SCE
1 µµµµA
i
ii
iii
iv
a
-100 0 100 200 300 400E(mV) vs SCE
5 µµµµA
i
ii
iii
iv
b
Figure 3.24: Cyclic voltammograms of a) 10 mM GSH a nd b) 1 mM K 4Fe(CN)6 in PBS
(pH 7.4) at different batches of 1% CoPc-SPCE (i & ii) and different batches of 2.5%
CoPc-SPCE (iii & iv). The same electrodes were used for GSH and K 4Fe(CN)6 oxidation
reactions.

Chapter 3 Electrocatalysis
139
-200 -100 0 100 200 300 400
E (mV) vs SCE
2 µµµµAi
ii
iii
iva
-100 0 100 200 300 400
E (mV) vs SCE
5 µµµµAi
ii
iiiivb
Figure 3.25: Cyclic voltammograms of a) 3 mM 2-ME a nd b) 1 mM K 4Fe(CN)6 in PBS (pH
7.4) at batches of different 1% CoPc-SPCE (i & ii) and different batches of 2.5% CoPc-
SPCE (iii & iv). The same electrodes were used for GSH and K 4Fe(CN)6 oxidation
reactions.

Chapter 3 Electrocatalysis
140
Cyclic voltammograms of SPCEs of the same CoPc % composition did
not have the same peak intensities of the Fe(CN)63-/Fe(CN)6
4- redox probe as
shown in Figs. 3.24b and 3.25b, nor of thiol oxidation reactions (Figs. 3.24a
and 3.25a). Thus varying electrocatalytic activity in terms of peak current
intensities towards thiol oxidation could not be attributed to varying amounts of
CoPc incorporated in SPCEs, much to the disagreement of the stated
hypothesis above. However to rationalize the obtained results, a catalytic
factor f was used (Table 3.5), which is defined as the ratio ∆I/∆Ip where ∆I is
the difference between the highest and lowest measured oxidation current of
a given thiol at a given potential (0.1 V and 0.2 V/(SCE) for 2-ME and GSH,
respectively), on different batches of electrodes of the same CoPc %
composition. ∆Ip is the difference between the peak intensities for Fe(CN)63-
/Fe(CN)64- reduction process on different batches of electrodes of the same
CoPc % composition.
Table 3.5: Catalytic factor (f) calculated for the oxidation of GSH and 2-ME in neutral
aqueous solution for different CoPc-SPCEs.
% CoPc-SPCE Thiol (mM) Catalytic factor, f
1 GSH (10 mM) 0.41
2.5 GSH (10 mM) 0.66
1 2-ME (3 mM) 1.11
2.5 2-ME (3mM) 3.01
The higher the f value, the more efficient is the catalyst. The largest f
factor was observed for 2.5 % CoPc-SPCE, which also had the highest
catalytic currents than 1.0 % CoPc-SPCE in Figs. 3.24 and 3.25, meaning that

Chapter 3 Electrocatalysis
141
the 2.5 % composition was more efficient than the 1.0 % composition. It
should be noted that in all cases, the electrodes (i.e. 2.5 % CoPc-SPCE) that
exhibited the highest activities towards the thiol oxidation also exhibited the
highest peak intensities for the reference redox probe (Fe(CN)63-/Fe(CN)6
4-).
The inverse holds for the 1.0 % CoPc-SPCE, which exhibited lowest activities
for thiol oxidation and ferricyanide redox process.
3.2 Decomposition of S-nitrosoglutathione
In this work, decomposition reaction of s-nitrosoglutathione (GSNO)
which results in formation of thiols is studied in physiological pH. NaBH4 is
used as a reducing agent whereas Cu2+ is used as a source of catalytically
active Cu+ cations. This is a similar study to the previous section in that thiols
are detected, though indirectly as opposed to the previous methods that
involved detection of thiols that have been added to analyte solutions. The
reaction is monitored by electrochemical detection of the formed thiol by cyclic
voltammetry. This will be afforded by use of an ordinary pyrolytic graphite
(OPG) electrode that has been modified by adsorption of CoPc.
CoPc-OPG electrode has been used successfully for detection of GSH
in physiological media before161. Moreover, CoPc is readily available and the
media used in this study is harsh for substituted MPc complexes as the
substituents can detach or complex with components of the reaction solution
leading to interferences. In this context, the possibility of electrochemically
detecting GSH oxidation formed upon Cu+-catalyzed decomposition of GSNO
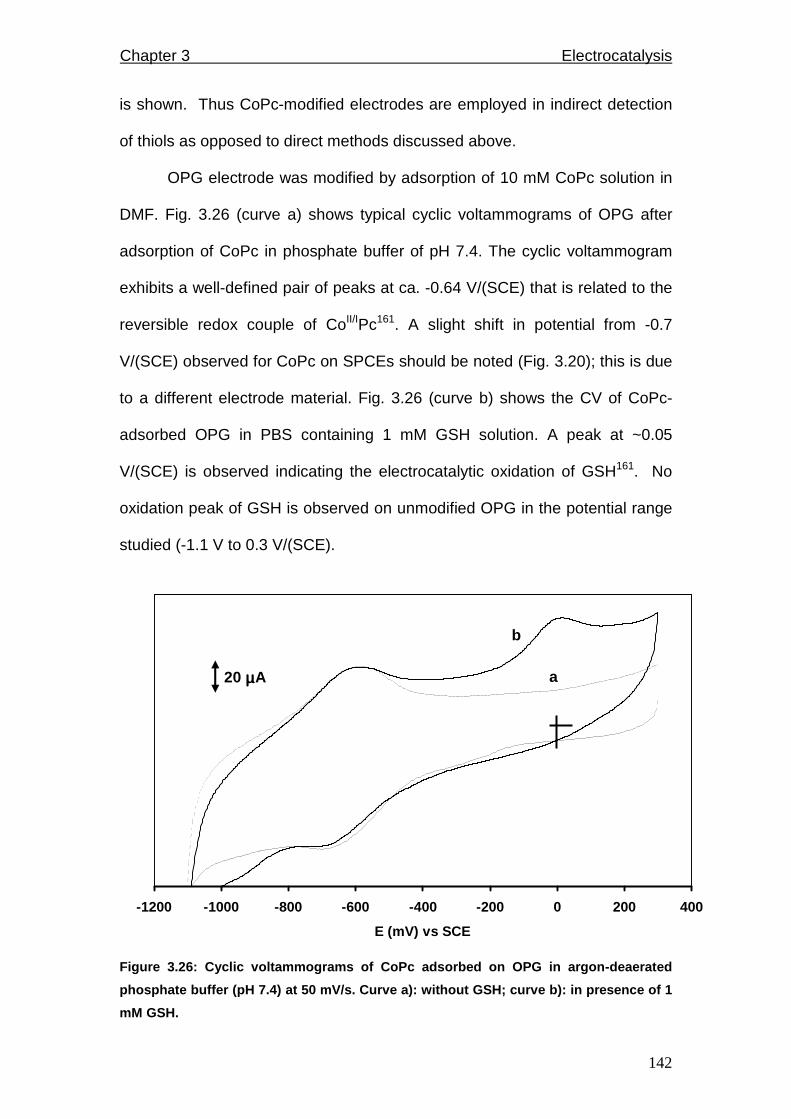
Chapter 3 Electrocatalysis
142
is shown. Thus CoPc-modified electrodes are employed in indirect detection
of thiols as opposed to direct methods discussed above.
OPG electrode was modified by adsorption of 10 mM CoPc solution in
DMF. Fig. 3.26 (curve a) shows typical cyclic voltammograms of OPG after
adsorption of CoPc in phosphate buffer of pH 7.4. The cyclic voltammogram
exhibits a well-defined pair of peaks at ca. -0.64 V/(SCE) that is related to the
reversible redox couple of CoII/IPc161. A slight shift in potential from -0.7
V/(SCE) observed for CoPc on SPCEs should be noted (Fig. 3.20); this is due
to a different electrode material. Fig. 3.26 (curve b) shows the CV of CoPc-
adsorbed OPG in PBS containing 1 mM GSH solution. A peak at ~0.05
V/(SCE) is observed indicating the electrocatalytic oxidation of GSH161. No
oxidation peak of GSH is observed on unmodified OPG in the potential range
studied (-1.1 V to 0.3 V/(SCE).
-1200 -1000 -800 -600 -400 -200 0 200 400
E (mV) vs SCE
20 µµµµA a
b
Figure 3.26: Cyclic voltammograms of CoPc adsorbed on OPG in argon-deaerated
phosphate buffer (pH 7.4) at 50 mV/s. Curve a): wit hout GSH; curve b): in presence of 1
mM GSH.

Chapter 3 Electrocatalysis
143
-1200 -1000 -800 -600 -400 -200 0 200 400E (mV) vs SCE
50 µµµµAc
b
a
d
GSNO decomposition has been reported in the presence of Cu(NO3)2
and NaBH4 reducing agent to form the catalytically active species Cu+
cations166. Fig. 3.27a shows the cyclic voltammogram of CoPc adsorbed on
OPG in phosphate buffer solution, Fig. 3.27b shows the CV when glucose
was added to the physiological buffered solution for nutriment reasons. Fig.
3.27c shows the CV of adsorbed CoPc onto OPG with Cu(NO3)2 added to the
electrolyte. No peaks, other than those related to CoII/IPc were observed due
to the added reagents in the potential range studied. Fig. 3.27d shows GSH
oxidation peak at 0.05 V/(SCE). This clearly shows that GSH oxidation occurs
in this potential range without any complications from the copper procatalyst,
glucose or any other electrochemical interference at the OPG electrode
modified by adsorption of the CoPc complex.
Figure 3.27: Cyclic voltammograms of CoPc adsorbed on OPG in commercial Dulbecco
phosphate buffer saline (pH 7.4) without (curve a) and with: 5 mM glucose (curve b); 5
mM glucose + 10 µM Cu(NO3)2 (curve c) and 5 mM glucose + 10 µM Cu(NO3)2 + 1 mM
GSH (curve d). Scan rate = 50 mV/s.
Chapter 3 Electrocatalysis
144
Fig. 3.28 (curve a) shows the cyclic voltammogram of CoPc adsorbed
on OPG electrode in phosphate buffer of pH 7.4. These studies were
conducted in the presence of atmospheric oxygen to mimick biological
systems where the electrodes will be eventually used. Upon addition of 1 mM
GSNO, a new reduction peak is observed at -0.9 V/(SCE), Fig. 3.28, curve b.
This is due to a redox activity of GSNO. Indeed, similar reductive peak was
recently reported in the case of GSNO on a hanging mercury electrode241. But
the most remarkable result is that no redox process occurs in the potential
range where the GSH is expected to be oxidized.
An oxygen reduction peak is observed at -0.23 V/(SCE). Also, it is
important to note that no changes in the cyclic voltammogram were observed
when 0.025 mM of the procatalyst Cu2+ was added (Fig. 3.28, curve c). Upon
addition of 1 mM NaBH4 (Fig. 3.28, curve d), a large anodic peak at ca. 0.05
V/(SCE) appeared. With time, this peak decreased in intensity (Fig. 3.28,
curve e) until it diminished completely within 2 minutes. The GSNO reduction
peak also decreased in intensity with time, but it stabilized (by ca. 25%) when
the GSH oxidation peak was no longer observed. This shows that, after
addition of NaBH4 to Cu2+, the products formed upon the decomposition of
GSNO are unstable and short-lived.

Chapter 3 Electrocatalysis
145
-1200 -1000 -800 -600 -400 -200 0 200
E (mV) vs SCE
100 µµµµA
a
d
e
b,c
Figure 3.28: Cyclic voltammograms in aerobic phosph ate buffer (pH 7.4) of CoPc
adsorbed on OPG without (curve a) and in the presen ce of 1 mM GSNO (curve b); 1 mM
GSNO + 0.025 mM Cu(NO 3)2 (curve c) and after immediate addition of 1 mM NaB H4
(curve d) and 1 minute later (curve e) . Scan rate = 50 mV/s.
The Cu+-catalyzed decomposition of GSNO as a rule leads to the
formation of NO and GSSG. But NaBH4 is a strong reducing agent that
reduces disulphide for analysis and quantification of total plasma thiols242,243,
it reduces GSSG to GSH. The oxidation of the reduced glutathione can thus
be transiently observed at the electrode through its peak at 0.05 V/(SCE)
(Figs. 3.28d and 3.28e). Since NaBH4 is primarily involved in reducing Cu2+
and the formed GSSG/GSH undergo several side reactions such as
complexation with cupric and cuprous ions244,245, it is conceivable that the
peak due to the oxidation of GSH does not last longer than for a few minutes.
It is highly likely that the formed disulphide GSSG got reduced on this
electrode. The reduction of GSSG has been reported to occur at -0.92
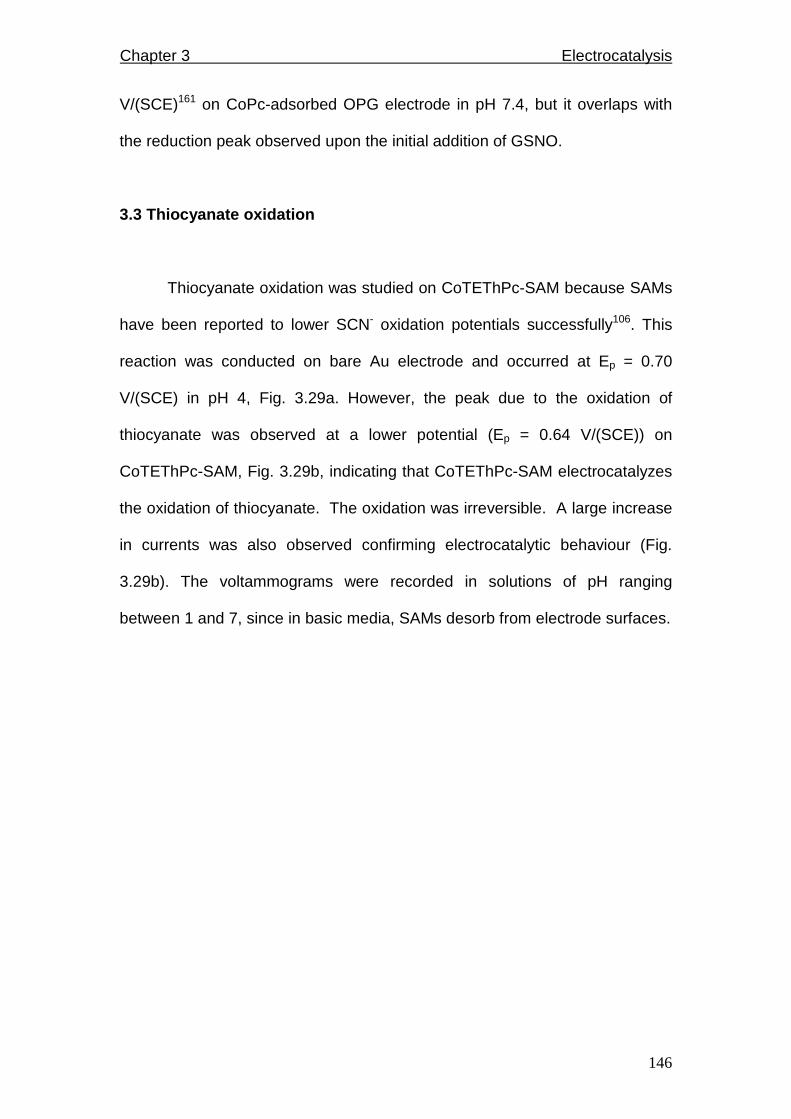
Chapter 3 Electrocatalysis
146
V/(SCE)161 on CoPc-adsorbed OPG electrode in pH 7.4, but it overlaps with
the reduction peak observed upon the initial addition of GSNO.
3.3 Thiocyanate oxidation
Thiocyanate oxidation was studied on CoTEThPc-SAM because SAMs
have been reported to lower SCN- oxidation potentials successfully106. This
reaction was conducted on bare Au electrode and occurred at Ep = 0.70
V/(SCE) in pH 4, Fig. 3.29a. However, the peak due to the oxidation of
thiocyanate was observed at a lower potential (Ep = 0.64 V/(SCE)) on
CoTEThPc-SAM, Fig. 3.29b, indicating that CoTEThPc-SAM electrocatalyzes
the oxidation of thiocyanate. The oxidation was irreversible. A large increase
in currents was also observed confirming electrocatalytic behaviour (Fig.
3.29b). The voltammograms were recorded in solutions of pH ranging
between 1 and 7, since in basic media, SAMs desorb from electrode surfaces.
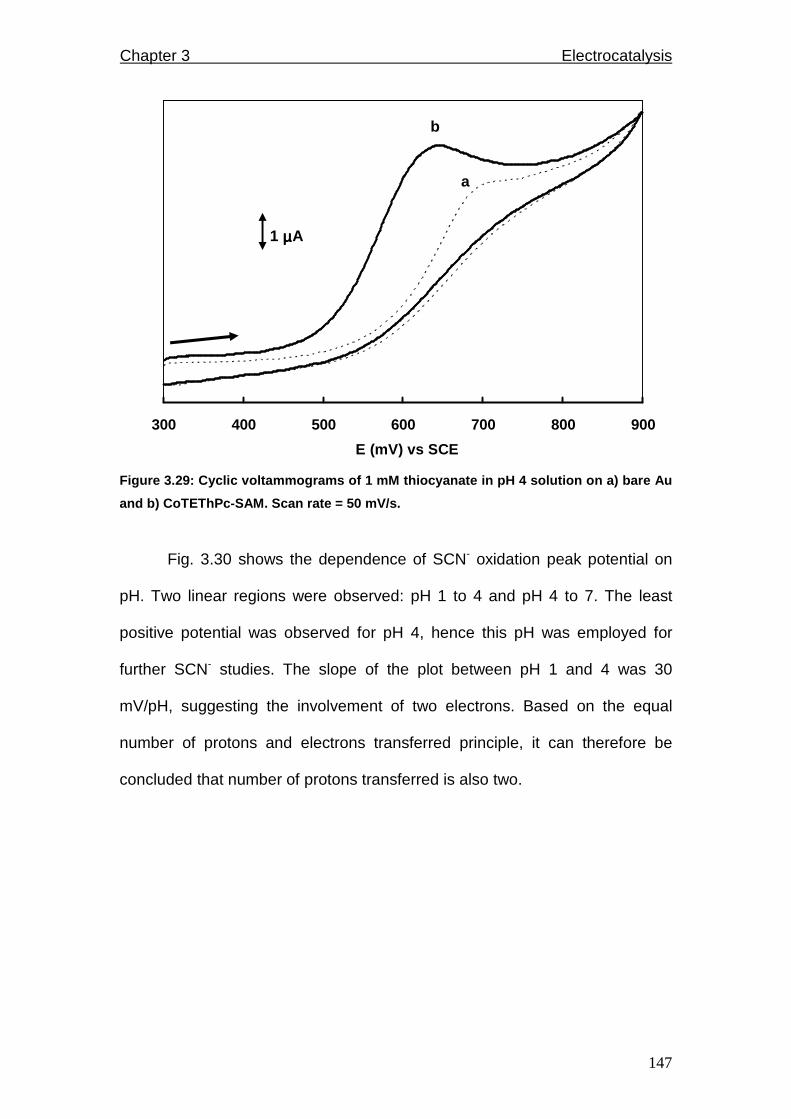
Chapter 3 Electrocatalysis
147
300 400 500 600 700 800 900
E (mV) vs SCE
1 µ µ µ µA
a
b
Figure 3.29: Cyclic voltammograms of 1 mM thiocyana te in pH 4 solution on a) bare Au
and b) CoTEThPc-SAM. Scan rate = 50 mV/s.
Fig. 3.30 shows the dependence of SCN- oxidation peak potential on
pH. Two linear regions were observed: pH 1 to 4 and pH 4 to 7. The least
positive potential was observed for pH 4, hence this pH was employed for
further SCN- studies. The slope of the plot between pH 1 and 4 was 30
mV/pH, suggesting the involvement of two electrons. Based on the equal
number of protons and electrons transferred principle, it can therefore be
concluded that number of protons transferred is also two.
Chapter 3 Electrocatalysis
148
0.66
0.68
0.7
0.72
0.74
0.76
0.78
1 2 3 4 5 6 7
pH
Ep (
V)
vs S
CE
Figure 3.30: Pourbaix diagram (E p vs pH) of 1 mM thiocyanate solution on CoTEThPc-
SAM.
The oxidation of SCN- is known to occur by two one-electron steps
when catalyzed by horse radish peroxidase148. Direct one step two-electron
oxidation of SCN- in the presence of Fe(V) or Fe(III) has been reported147,153.
Thus the observation of a two-electron oxidation of SCN- evidenced in Fig.
3.30 is in accordance with literature. The oxidation of SCN- is known to result
in the intermediate formation of radicals which dimerize to form (SCN)2, which
further hydrolyzes to form CN- and sulphate ions147,148. The oxidation process
for thiocyanate was diffusion controlled as judged by the linearity of the plot of
peak current versus square root of scan rate (similar to Fig. 3.16).
In order to determine the Tafel slope, the usual equation (Eq. 3.14) for
a totally irreversible process was employed236,237. A plot of Ep vs log ν (Fig.
3.31a) gave a linear relationship. The Tafel slope (b = 0.059/αn) of 116
Chapter 3 Electrocatalysis
149
mV/decade was obtained, indicating one electron transfer is involved in the
rate-determining step. The electrocatalysis of thiocyanate was found to be
diffusion-controlled based on the slope of one from a plot of log ip versus
log SCN- concentration (Fig. 3.31b), based on Koutecky-Levich equation
(eq. 3.2).
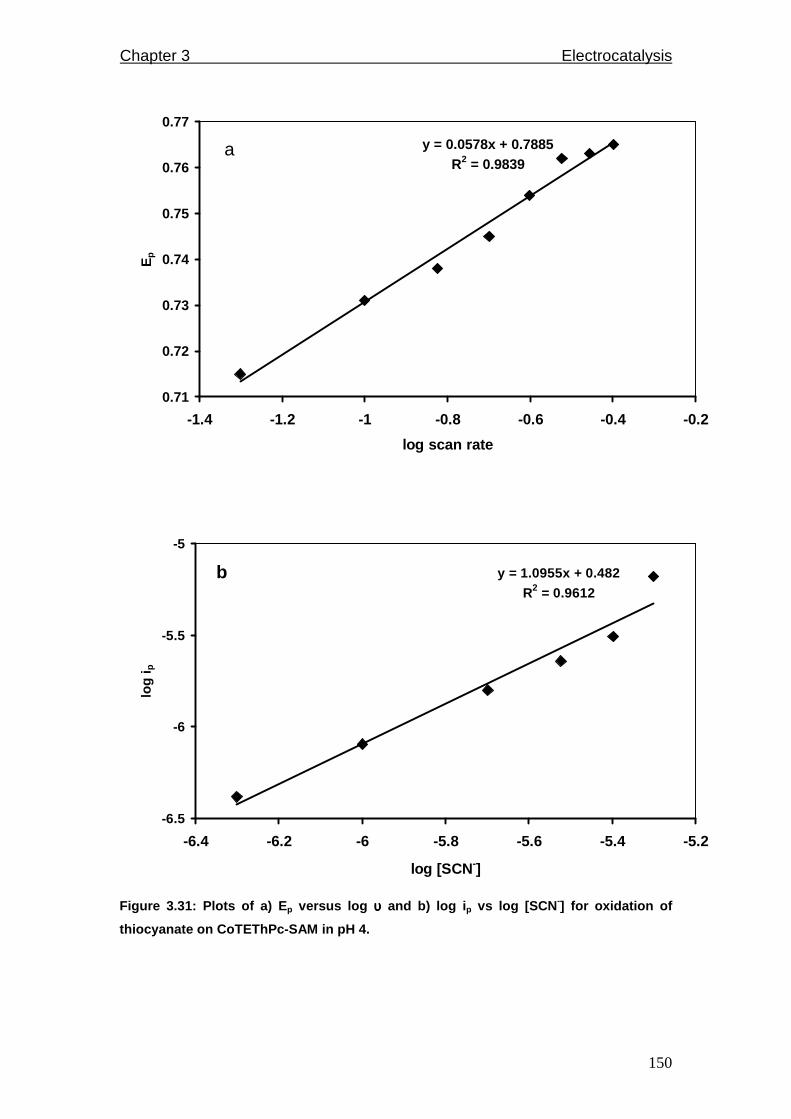
Chapter 3 Electrocatalysis
150
y = 0.0578x + 0.7885R2 = 0.9839
0.71
0.72
0.73
0.74
0.75
0.76
0.77
-1.4 -1.2 -1 -0.8 -0.6 -0.4 -0.2
log scan rate
Ep
a
y = 1.0955x + 0.482
R2 = 0.9612
-6.5
-6
-5.5
-5
-6.4 -6.2 -6 -5.8 -5.6 -5.4 -5.2
log [SCN -]
log
i p
b
Figure 3.31: Plots of a) E p versus log υυυυ and b) log i p vs log [SCN -] for oxidation of
thiocyanate on CoTEThPc-SAM in pH 4.
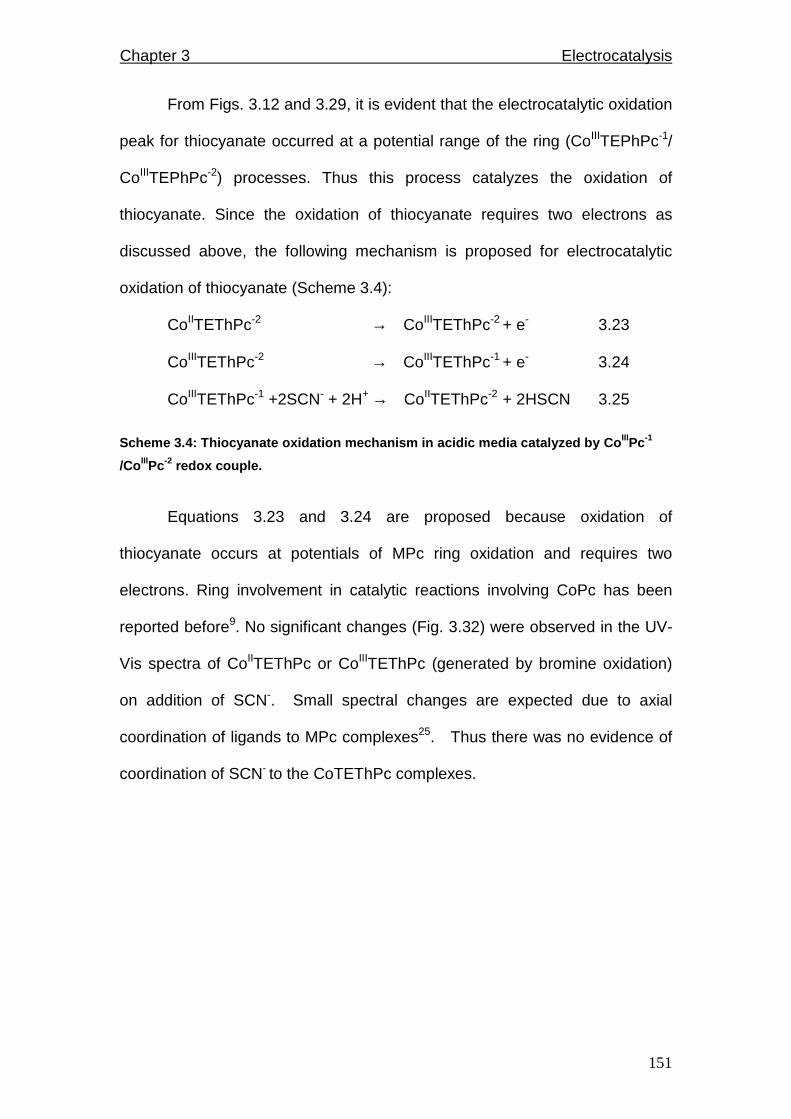
Chapter 3 Electrocatalysis
151
From Figs. 3.12 and 3.29, it is evident that the electrocatalytic oxidation
peak for thiocyanate occurred at a potential range of the ring (CoIIITEPhPc-1/
CoIIITEPhPc-2) processes. Thus this process catalyzes the oxidation of
thiocyanate. Since the oxidation of thiocyanate requires two electrons as
discussed above, the following mechanism is proposed for electrocatalytic
oxidation of thiocyanate (Scheme 3.4):
CoIITEThPc-2 → CoIIITEThPc-2 + e- 3.23
CoIIITEThPc-2 → CoIIITEThPc-1 + e- 3.24
CoIIITEThPc-1 +2SCN- + 2H+ → CoIITEThPc-2 + 2HSCN 3.25
Scheme 3.4: Thiocyanate oxidation mechanism in acid ic media catalyzed by Co IIIPc-1
/Co IIIPc-2 redox couple.
Equations 3.23 and 3.24 are proposed because oxidation of
thiocyanate occurs at potentials of MPc ring oxidation and requires two
electrons. Ring involvement in catalytic reactions involving CoPc has been
reported before9. No significant changes (Fig. 3.32) were observed in the UV-
Vis spectra of CoIITEThPc or CoIIITEThPc (generated by bromine oxidation)
on addition of SCN-. Small spectral changes are expected due to axial
coordination of ligands to MPc complexes25. Thus there was no evidence of
coordination of SCN- to the CoTEThPc complexes.
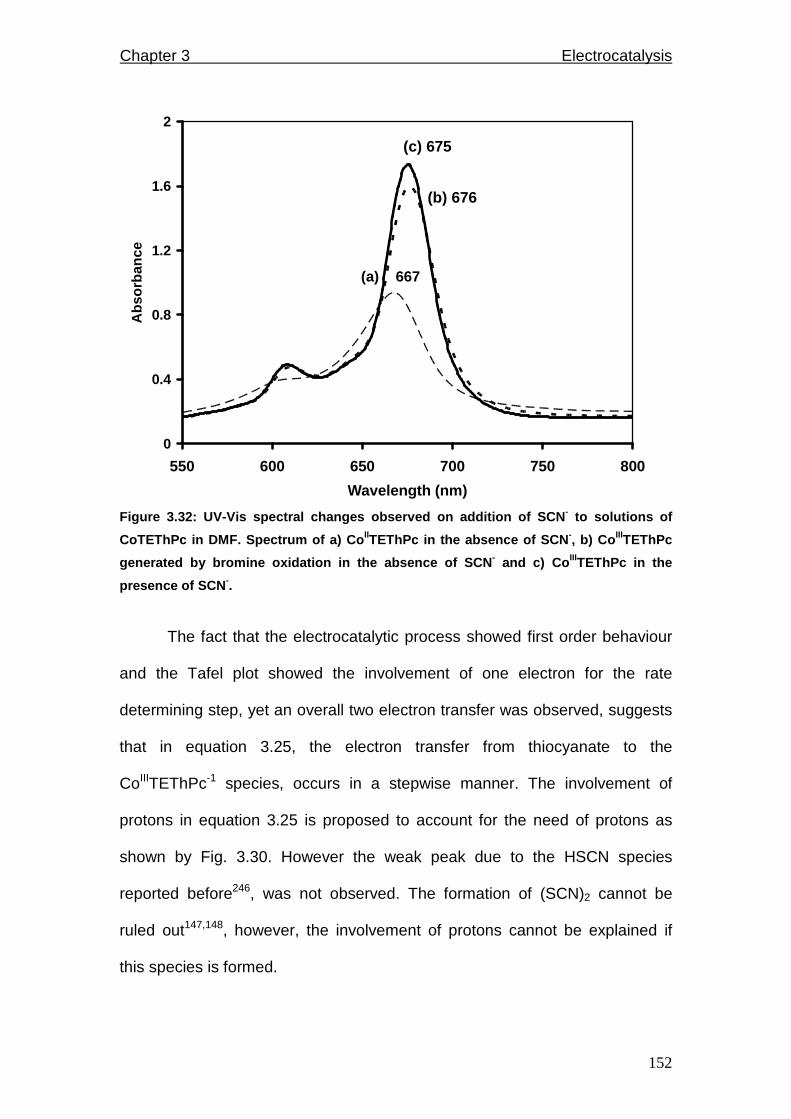
Chapter 3 Electrocatalysis
152
0
0.4
0.8
1.2
1.6
2
550 600 650 700 750 800
Wavelength (nm)
Abs
orba
nce
(b) 676
(c) 675
(a) 667
Figure 3.32: UV-Vis spectral changes observed on ad dition of SCN - to solutions of
CoTEThPc in DMF. Spectrum of a) Co IITEThPc in the absence of SCN -, b) Co IIITEThPc
generated by bromine oxidation in the absence of SC N- and c) Co IIITEThPc in the
presence of SCN -.
The fact that the electrocatalytic process showed first order behaviour
and the Tafel plot showed the involvement of one electron for the rate
determining step, yet an overall two electron transfer was observed, suggests
that in equation 3.25, the electron transfer from thiocyanate to the
CoIIITEThPc-1 species, occurs in a stepwise manner. The involvement of
protons in equation 3.25 is proposed to account for the need of protons as
shown by Fig. 3.30. However the weak peak due to the HSCN species
reported before246, was not observed. The formation of (SCN)2 cannot be
ruled out147,148, however, the involvement of protons cannot be explained if
this species is formed.
Chapter 3 Electrocatalysis
153
Detection limits for the analysis of thiocyanate were determined using
3σ criterion and were valued at 3.4 x 10⁻⁷ M, which is in the same range as
reported before246. Similar to L-cysteine and 2-ME oxidation on CoTEThPc-
SAM discussed above, the modified electrode was very stable and exhibited
reproducible electrocatalytic activity towards thiocyanate oxidation.
3.4 Oxygen reduction
Reduction of oxygen is an important reaction in industry because it
forms the basis of operation of fuel cells; emission free energy sources. It is
studied in this work on glassy carbon electrodes which are easy to clean and
re-use. It is catalyzed by manganese phthalocyanines, Mn has half filled d-
orbitals of energy that allows constructive overlap and energy transfer with p-
orbitals of oxygen189. The aim is to achieve four electron transfer leading to
formation of water that results in high energy output and not the two electron
transfer that leads to formation of hydrogen peroxide, with less energy. The
MnPc complexes employed as electrocatalysts for reduction of oxygen in this
work are shown in Fig. 3.33.

Chapter 3 Electrocatalysis
154
NNN
N
N
N
NN
Mn
R
R
R
R
N
N
N
NS
(CH2)5O
S O
MnTPePyrPc
MnTPhPyrPc
MnTEThPc
MnTMerPyPc
7a H
Complex R Abbreviation
7b NH2
7c
7d
7e
7f
O
MnTAPc
MnPc
Figure 3.33: Molecular structures of phthalocyanine complexes used in electrocatalytic
reduction of oxygen; MnPc (manganese phthalocyanine ), MnTAPc (manganese
tetraamino phthalocyanine), MnTPePyrPc (manganese t etrapentoxy pyrrole
phthalocyanine), MnTPhPyrPc (manganese tetraphenoxy pyrrole phthalocyanine),
MnTMerPyPc (manganese tetramercaptopyrimidine phtha locyanine) and MnTEThPc
(manganese tetraethoxythiophene phthalocyanine).
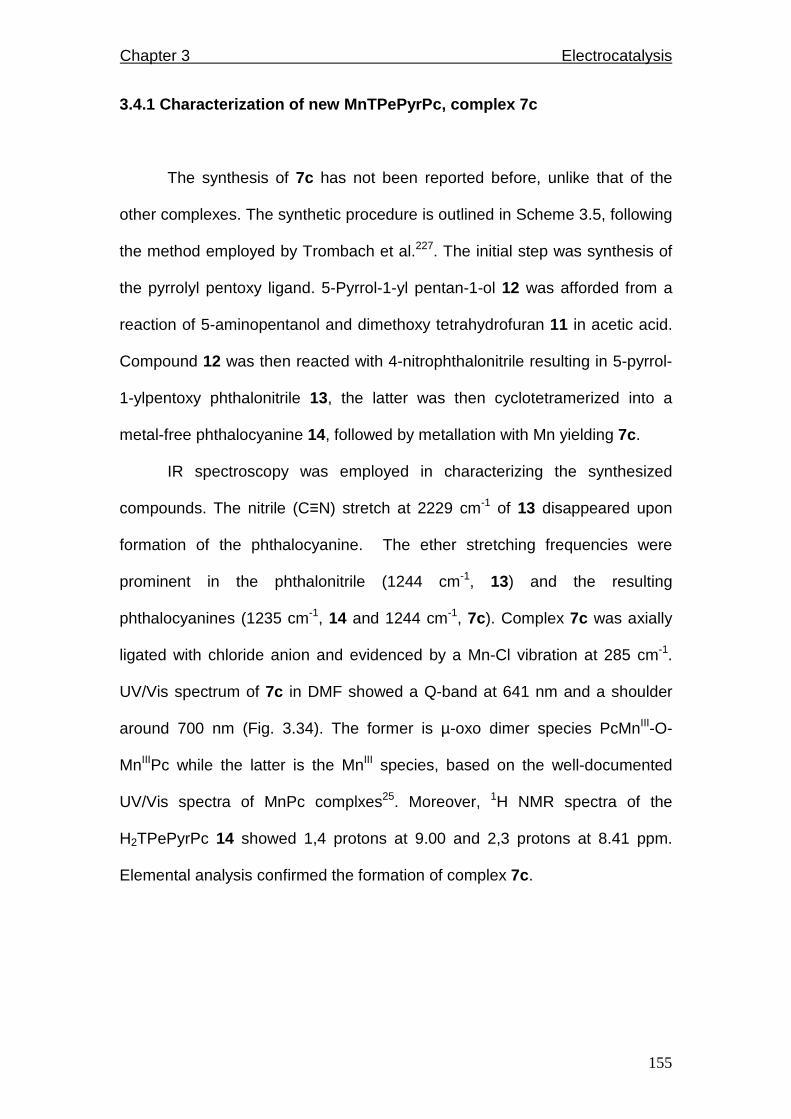
Chapter 3 Electrocatalysis
155
3.4.1 Characterization of new MnTPePyrPc, complex 7 c
The synthesis of 7c has not been reported before, unlike that of the
other complexes. The synthetic procedure is outlined in Scheme 3.5, following
the method employed by Trombach et al.227. The initial step was synthesis of
the pyrrolyl pentoxy ligand. 5-Pyrrol-1-yl pentan-1-ol 12 was afforded from a
reaction of 5-aminopentanol and dimethoxy tetrahydrofuran 11 in acetic acid.
Compound 12 was then reacted with 4-nitrophthalonitrile resulting in 5-pyrrol-
1-ylpentoxy phthalonitrile 13, the latter was then cyclotetramerized into a
metal-free phthalocyanine 14, followed by metallation with Mn yielding 7c.
IR spectroscopy was employed in characterizing the synthesized
compounds. The nitrile (C≡N) stretch at 2229 cm-1 of 13 disappeared upon
formation of the phthalocyanine. The ether stretching frequencies were
prominent in the phthalonitrile (1244 cm-1, 13) and the resulting
phthalocyanines (1235 cm-1, 14 and 1244 cm-1, 7c). Complex 7c was axially
ligated with chloride anion and evidenced by a Mn-Cl vibration at 285 cm-1.
UV/Vis spectrum of 7c in DMF showed a Q-band at 641 nm and a shoulder
around 700 nm (Fig. 3.34). The former is µ-oxo dimer species PcMnIII-O-
MnIIIPc while the latter is the MnIII species, based on the well-documented
UV/Vis spectra of MnPc complxes25. Moreover, 1H NMR spectra of the
H2TPePyrPc 14 showed 1,4 protons at 9.00 and 2,3 protons at 8.41 ppm.
Elemental analysis confirmed the formation of complex 7c.

Chapter 3 Electrocatalysis
156
O
OMe
OMe
NNN
N
N
N
NN
Mn
R
R
R
R
H2N(CH2)5OHN(CH2)5OH
K2CO3/DMSO
CN
CNN(CH2)5O
NNN
N
N
N
NN
R
R
R
R H HMnCl2
Pentanol
N(CH2)5O
Acetic acid
4-nitrophthalonitrile
Li, Pentanol
R =
1113
14
7c
12
Scheme 3.5: Synthesis of MnTPePyrPc, 7c.
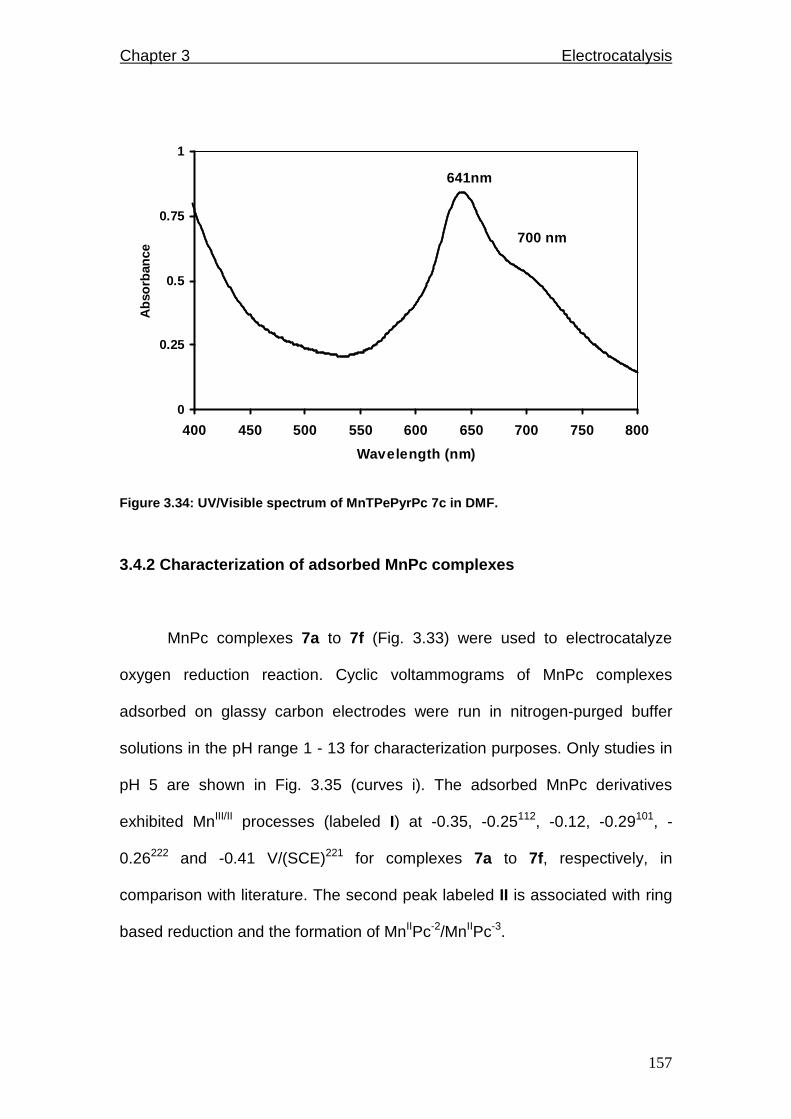
Chapter 3 Electrocatalysis
157
0
0.25
0.5
0.75
1
400 450 500 550 600 650 700 750 800
Wavelength (nm)
Abs
orba
nce
641nm
700 nm
Figure 3.34: UV/Visible spectrum of MnTPePyrPc 7c i n DMF.
3.4.2 Characterization of adsorbed MnPc complexes
MnPc complexes 7a to 7f (Fig. 3.33) were used to electrocatalyze
oxygen reduction reaction. Cyclic voltammograms of MnPc complexes
adsorbed on glassy carbon electrodes were run in nitrogen-purged buffer
solutions in the pH range 1 - 13 for characterization purposes. Only studies in
pH 5 are shown in Fig. 3.35 (curves i). The adsorbed MnPc derivatives
exhibited MnIII/II processes (labeled I) at -0.35, -0.25112, -0.12, -0.29101, -
0.26222 and -0.41 V/(SCE)221 for complexes 7a to 7f, respectively, in
comparison with literature. The second peak labeled II is associated with ring
based reduction and the formation of MnIIPc-2/MnIIPc-3.
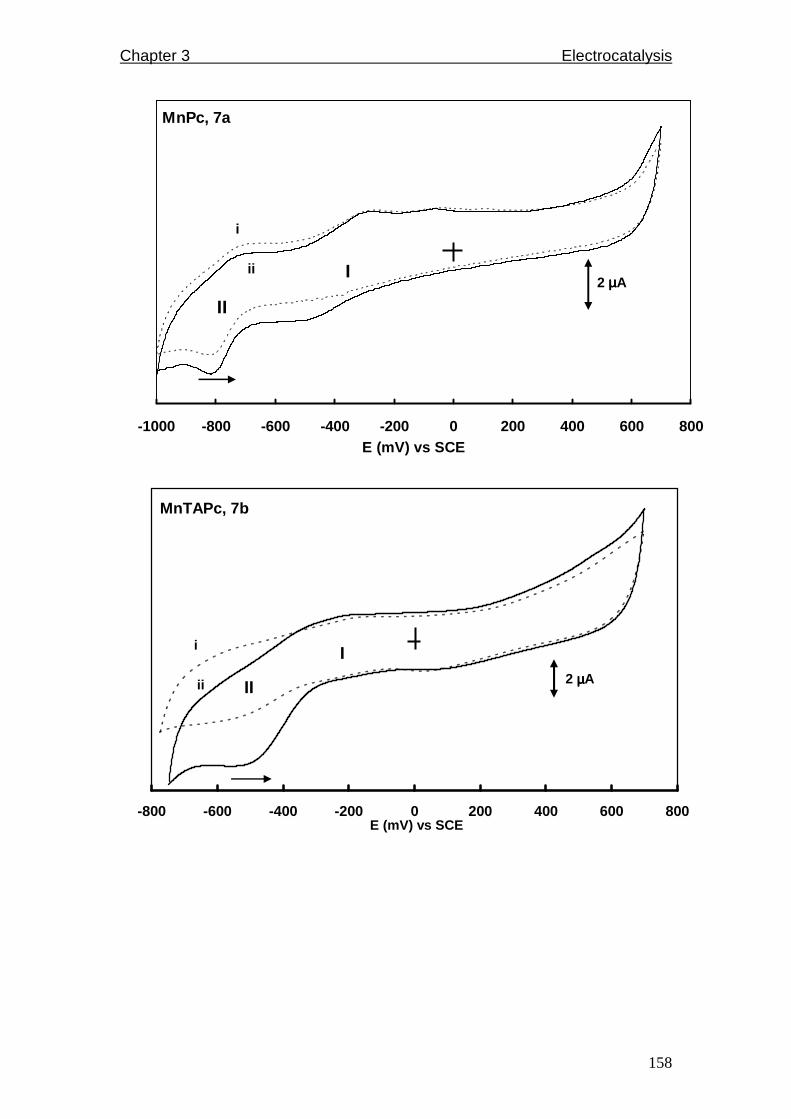
Chapter 3 Electrocatalysis
158
-1000 -800 -600 -400 -200 0 200 400 600 800E (mV) vs SCE
2 µµµµA
i
ii
MnPc, 7a
I
II
-800 -600 -400 -200 0 200 400 600 800E (mV) vs SCE
2 µµµµA
i
ii
MnTAPc, 7b
I
II
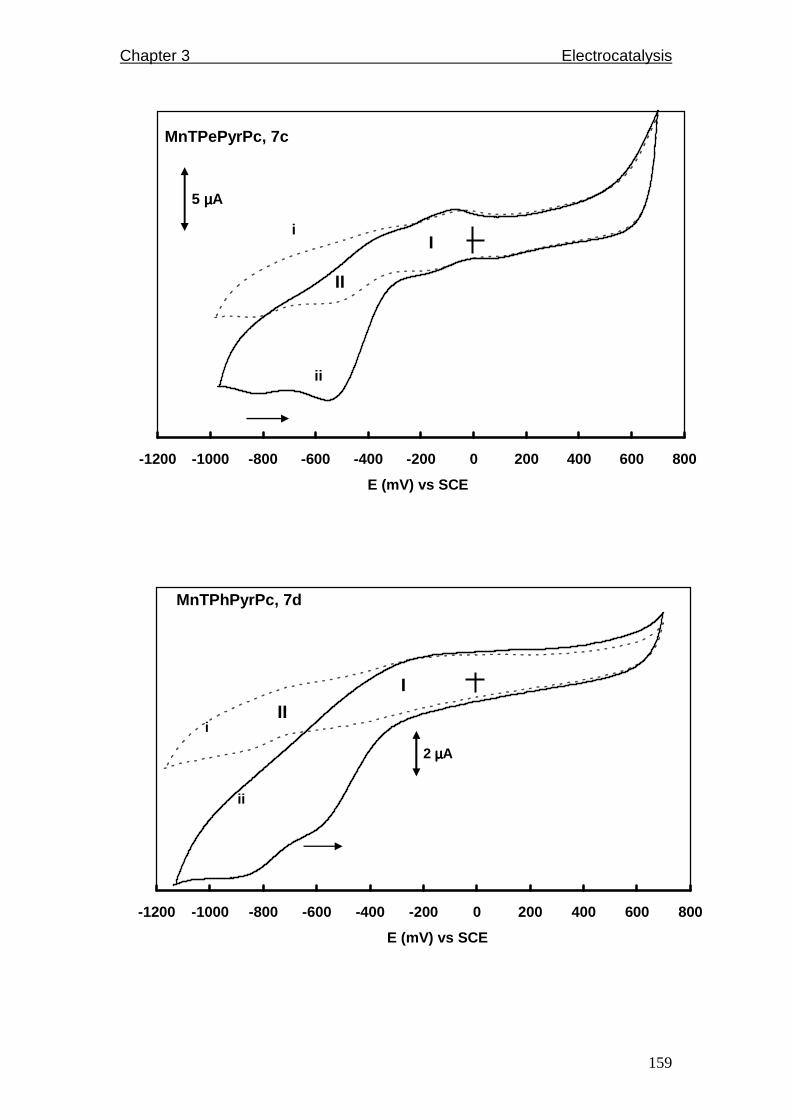
Chapter 3 Electrocatalysis
159
-1200 -1000 -800 -600 -400 -200 0 200 400 600 800
E (mV) vs SCE
5 µµµµA
i
ii
MnTPePyrPc, 7c
I
II
-1200 -1000 -800 -600 -400 -200 0 200 400 600 800
E (mV) vs SCE
2 µµµµA
i
ii
MnTPhPyrPc, 7d
III
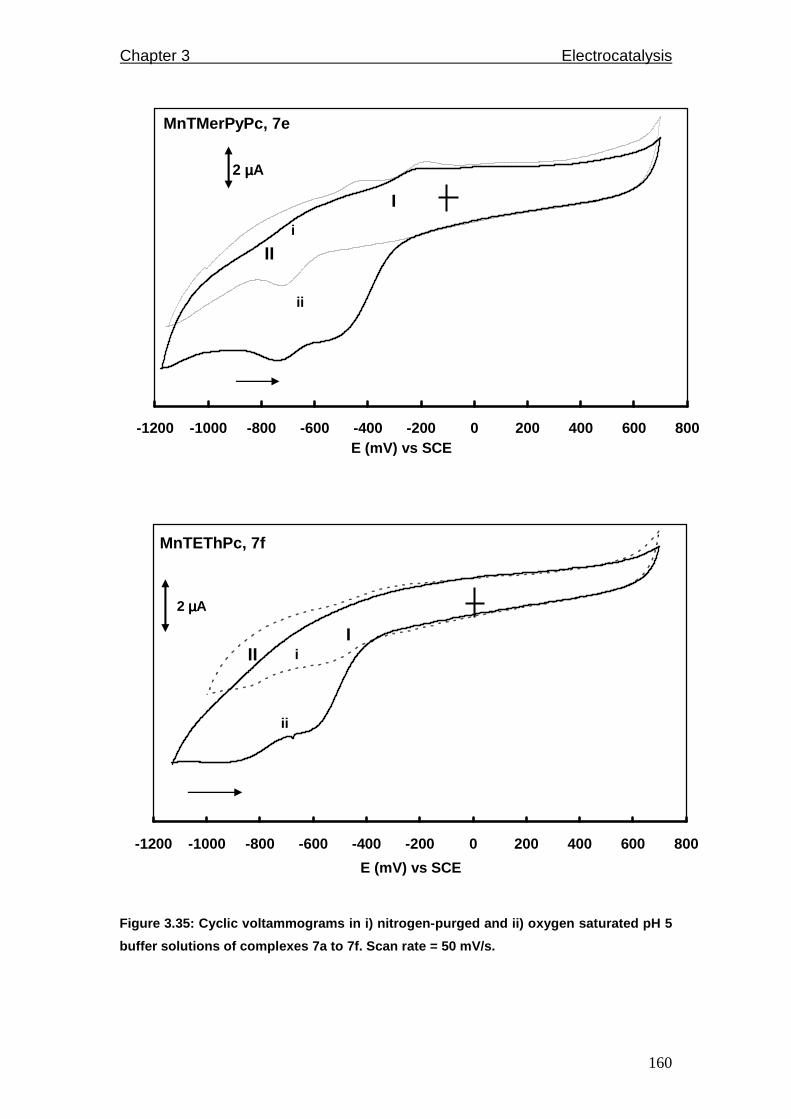
Chapter 3 Electrocatalysis
160
-1200 -1000 -800 -600 -400 -200 0 200 400 600 800E (mV) vs SCE
2 µµµµA
i
ii
MnTMerPyPc, 7e
I
II
-1200 -1000 -800 -600 -400 -200 0 200 400 600 800
E (mV) vs SCE
2 µµµµA
i
ii
MnTEThPc, 7f
III
Figure 3.35: Cyclic voltammograms in i) nitrogen-pu rged and ii) oxygen saturated pH 5
buffer solutions of complexes 7a to 7f. Scan rate = 50 mV/s.

Chapter 3 Electrocatalysis
161
Peak potentials for the MnIII/II couple shifted to the negative with
increasing pH, an average slope of ~-0.06V/pH was observed for all
complexes in the pH range of 1 to 6 indicating a transfer of one proton and
one electron. This is shown in Fig. 3.36 for MnTPePyrPc, 7c.
-600
-400
-200
0
200
0 2 4 6 8 10 12 14
pH
Ep
(mV
) vs
SC
E
Figure 3.36: Pourbaix diagram (E p vs pH) for Mn III/II couple of complex 7c.
The surface coverage of adsorbed films was probed by recording the
CVs of 7a to 7f at different scan rates based on equation 3.13232. This is
shown for complex 7c in Fig. 3.37. Surface coverage was calculated from the
plots of Ip versus ν to be 3.6, 1.1, 4.8, 7.6, 8.2 and 6.8 x 10⁻¹⁰ for complexes
7a to 7f respectively, Table 3.6, indicating monolayer thickness. Linearity of
the Ip versus ν plots indicated surface confined adsorbed species158, further
confirming adsorption of MPc complexes.
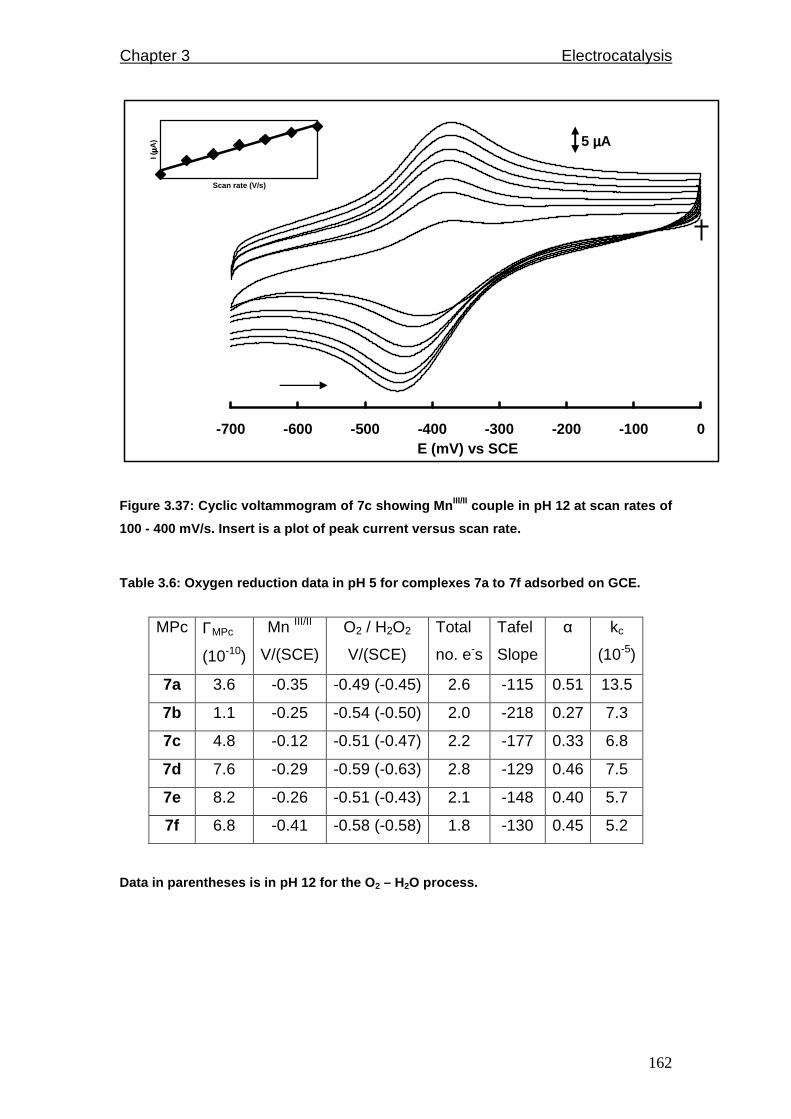
Chapter 3 Electrocatalysis
162
-700 -600 -500 -400 -300 -200 -100 0E (mV) vs SCE
5 µµµµA
Scan rate (V/s)
I (µµ µµA
)
Figure 3.37: Cyclic voltammogram of 7c showing Mn III/II couple in pH 12 at scan rates of
100 - 400 mV/s. Insert is a plot of peak current ve rsus scan rate.
Table 3.6: Oxygen reduction data in pH 5 for comple xes 7a to 7f adsorbed on GCE.
MPc ΓMPc
(10-10)
Mn III/II
V/(SCE)
O2 / H2O2
V/(SCE)
Total
no. e-s
Tafel
Slope
α kc
(10-5)
7a 3.6 -0.35 -0.49 (-0.45) 2.6 -115 0.51 13.5
7b 1.1 -0.25 -0.54 (-0.50) 2.0 -218 0.27 7.3
7c 4.8 -0.12 -0.51 (-0.47) 2.2 -177 0.33 6.8
7d 7.6 -0.29 -0.59 (-0.63) 2.8 -129 0.46 7.5
7e 8.2 -0.26 -0.51 (-0.43) 2.1 -148 0.40 5.7
7f 6.8 -0.41 -0.58 (-0.58) 1.8 -130 0.45 5.2
Data in parentheses is in pH 12 for the O 2 – H2O process.
Chapter 3 Electrocatalysis
163
3.4.3 Oxygen reduction on MnPc complexes
Oxygen gets reduced to hydrogen peroxide, followed by reduction of
the latter to water on MPc modified electrodes247, each step requiring two
electrons. In acid and slightly alkaline media, the CV for oxygen reduction on
MPc modified electrodes shows two peaks due to oxygen reduction to
hydrogen peroxide and subsequent hydrogen peroxide reduction to water247.
In highly alkaline solutions, the reaction goes to completion with only one peak
observed due to four electron reduction of oxygen to water247. In this study, a
similar trend in activity was observed. Fig. 3.35 shows enhancement of
currents of the MnPc complexes in the presence of oxygen, confirming
catalytic reduction of oxygen.
Two peaks are observed for all complexes (except 7b) due to the
formation of hydrogen peroxide and water. The presence of the two peaks in
the range for MnIIIPc-2/MnIIPc-2 and the ring process MnIIPc-2/MnIIPc-3 confirms
that both of these processes catalyze the oxygen reduction, as has been
reported before247. However, in highly alkaline solutions (pH 9 - 13), there is
only one peak for all complexes (Fig. 3.38), due to reduction of oxygen to
water. Based on the ease of the reduction (shifting of potential to less
negative values) of oxygen to water in Fig. 3.38, which reflects the efficiency
of these molecules as catalysts for the process, the MnPc complexes may be
ranked as follows in pH 12 (Table 3.6): 7e ≈ 7a ≈ 7c > 7b > 7f > 7d. The ease
of reduction of oxygen is not directly related to the redox potential of the
MnIIIPc/MnIIPc couple, which followed this trend in pH 5 buffer (Table 3.6): 7f
(-0.41 V) > 7a (-0.35 V) > 7d (-0.29 V) > 7e (-0.26 V) > 7b (-0.25) > 7c (-0.12
Chapter 3 Electrocatalysis
164
V/(SCE)). Note that the MnIIIPc/MnIIPc redox couple of the complexes was not
clearly defined in pH 12 buffer solutions.
Plots of peak current versus square root of scan rate for the reduction
of oxygen were linear for all studied complexes in the pH range 1 - 13
indicating oxygen reduction to hydrogen peroxide or water is diffusion-
controlled. This is shown for MnPc in pH 12 in Fig. 3.39.
Rotating disc electrode (RDE) experiments were conducted to further
elucidate studied reactions. These experiments were conducted in pH 5, 8
and 12 (Fig. 3.40 shown for pH 5 and 12) since in these solutions, different
mechanisms were highly probable as explained above. Unfortunately only
single runs at low rotation speeds were done because the catalyst was lost
from the surface. However, runs were done in triplicates and averages are
reported.
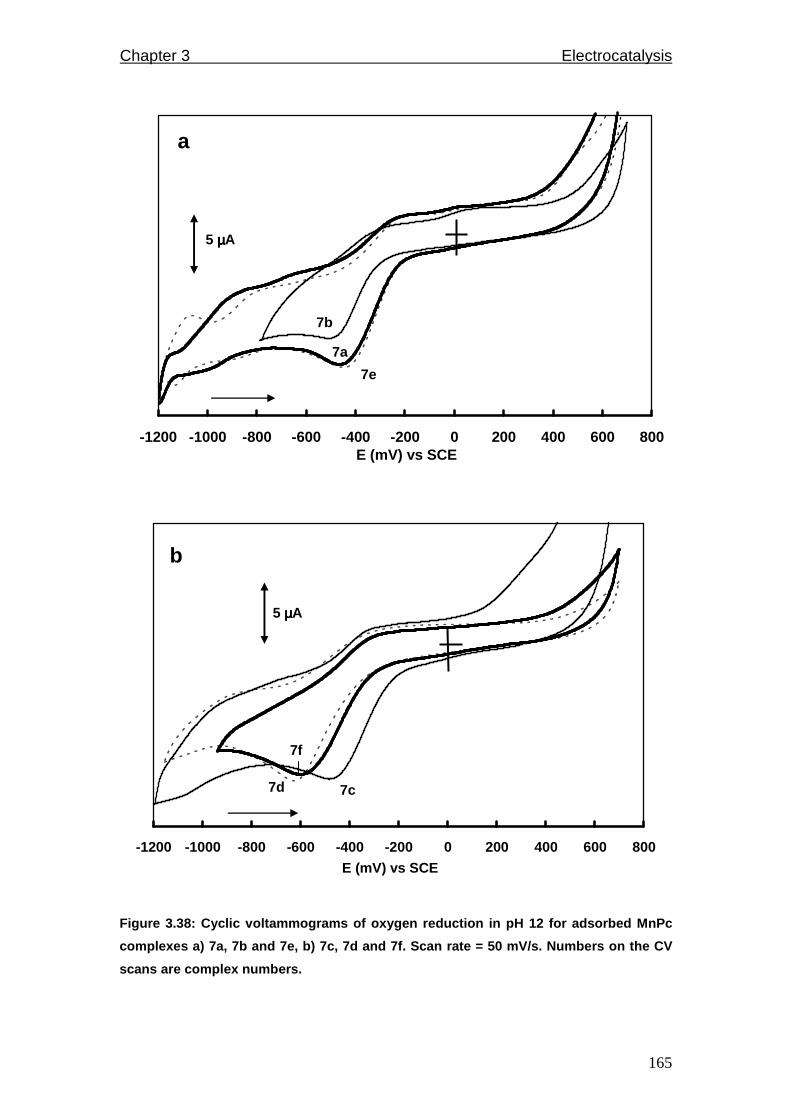
Chapter 3 Electrocatalysis
165
-1200 -1000 -800 -600 -400 -200 0 200 400 600 800E (mV) vs SCE
5 µµµµA
7e
7a
7b
a
-1200 -1000 -800 -600 -400 -200 0 200 400 600 800
E (mV) vs SCE
5 µµµµA
b
7d 7c
7f
Figure 3.38: Cyclic voltammograms of oxygen reducti on in pH 12 for adsorbed MnPc
complexes a) 7a, 7b and 7e, b) 7c, 7d and 7f. Scan rate = 50 mV/s. Numbers on the CV
scans are complex numbers.

Chapter 3 Electrocatalysis
166
0
5
10
15
20
25
30
0 0.1 0.2 0.3 0.4 0.5 0.6 0.7
v1/2 (V/s)1/2
I P (
µµ µµA)
Figure 3.39: Plot of square root of scan rate vers us peak current for oxygen reduction
on MnPc in pH 12.
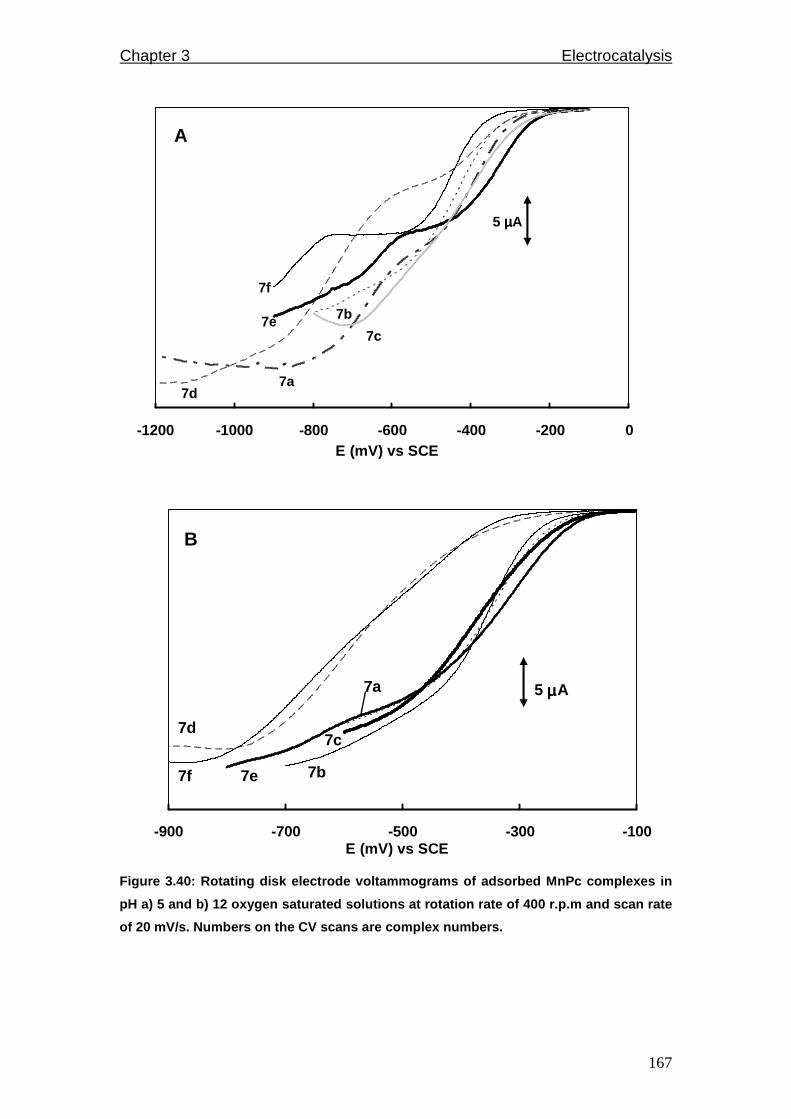
Chapter 3 Electrocatalysis
167
-1200 -1000 -800 -600 -400 -200 0E (mV) vs SCE
7d7a
7f
7e7c
7b
5 µµµµA
A
-900 -700 -500 -300 -100E (mV) vs SCE
5 µµµµA
7b7e7f
7d7c
7a
B
Figure 3.40: Rotating disk electrode voltammograms of adsorbed MnPc complexes in
pH a) 5 and b) 12 oxygen saturated solutions at rot ation rate of 400 r.p.m and scan rate
of 20 mV/s. Numbers on the CV scans are complex num bers.
Chapter 3 Electrocatalysis
168
The number of electrons transferred during oxygen reduction was
calculated from the magnitude of limiting current at 400 rotations per minute
(r.p.m.). This was based on Levich equation (eq. 3.1), where D, C and ν
values are 1.67 x 10⁻⁵, 1.3 µM and 9.97 x 10⁻³ cm2/s respectively as reported
in literature for oxygen178,248. The total number of electrons transferred was
calculated to be on average 2 in pHs 1 to 5 and 4 in pHs greater than 5, Table
3.6.
Tafel slopes were calculated from the same RDE data. These were
obtained from plots of log |iK| versus η, based on Tafel equation, eq. 3.3.
Calculated Tafel slopes in pH 5 are shown in Table 3.6. The values of the
Tafel slopes suggest the involvement of one electron in the rate determining
step. However these values are larger than the expected 120 mV/decade in
some cases suggesting strong binding of the analyte to the catalyst80,83.
Electron transfer coefficients, α were calculated from Tafel slopes using eq.
3.4, they were on average close to 0.5 indicating an equal chance of the
activated complex to go to the product or reactant side.
The reaction order m was determined using equation 3.26, introduced
as eq. 1.1483 in Chapter 1,
−+=
LK I
I 1 log mI logI log 3.26
where symbols have their usual meaning. Log I versus log (1 – I/IL) could not
be plotted because RDEs could not be recorded at various rotation speeds
due to loss of adsorbed catalysts from the electrode surface. The reaction
order was found to be one for all studied complexes in the pH range 1 – 13,
by substituting variables in eq. 3.26. IL values were taken from the plateau of
Chapter 3 Electrocatalysis
169
the RDE voltammograms of oxygen reduction reaction at 400 r.p.m whereas I
values were taken from the same RDE plot at the oxygen reduction peak
potential, determined from cyclic voltammograms; these values are listed in
Table 3.6 for reactions conducted in pHs 5 and 12. It should be noted that eq.
3.26 was used for determintation of reaction order instead of 3.2 where log of
peak current is plotted against log of analyte concentration because
concentration of oxygen could not be varied and measured accurately.
Rate constants of cathodic oxygen reduction reaction were determined
using equation 3.27, which was introduced as eq. 1.11 in Chapter 1,
iK = nFCAkc 3.27
where symbols have their usual meaning. The electron transfer constant kc
was found to be in the 10-5 range (Table 3.6) for all complexes in the pH range
studied indicating slow reaction kinetics. The obtained kinetic parameters are
used to derive a mechanism for oxygen reduction reaction electrocatalyzed by
manganese phthalocyanine complexes that will be provided below.
3.4.4 Oxygen reduction on a selection of CoPc and F ePc complexes
Complexes selected for use as electrocatalysts of oxygen reduction
were CoPc 6a, CoTPhPyrPc 6b, CoTEThPc 6c, FePc 8 and FePc(Cl)16 9.
The activity of unsubstituted complexes 6a and 8 will be compared to that of
MnPc 7a to determine the effect of central metal on catalytic efficiency. The
other substituted complexes offer investigation of substituent effect.
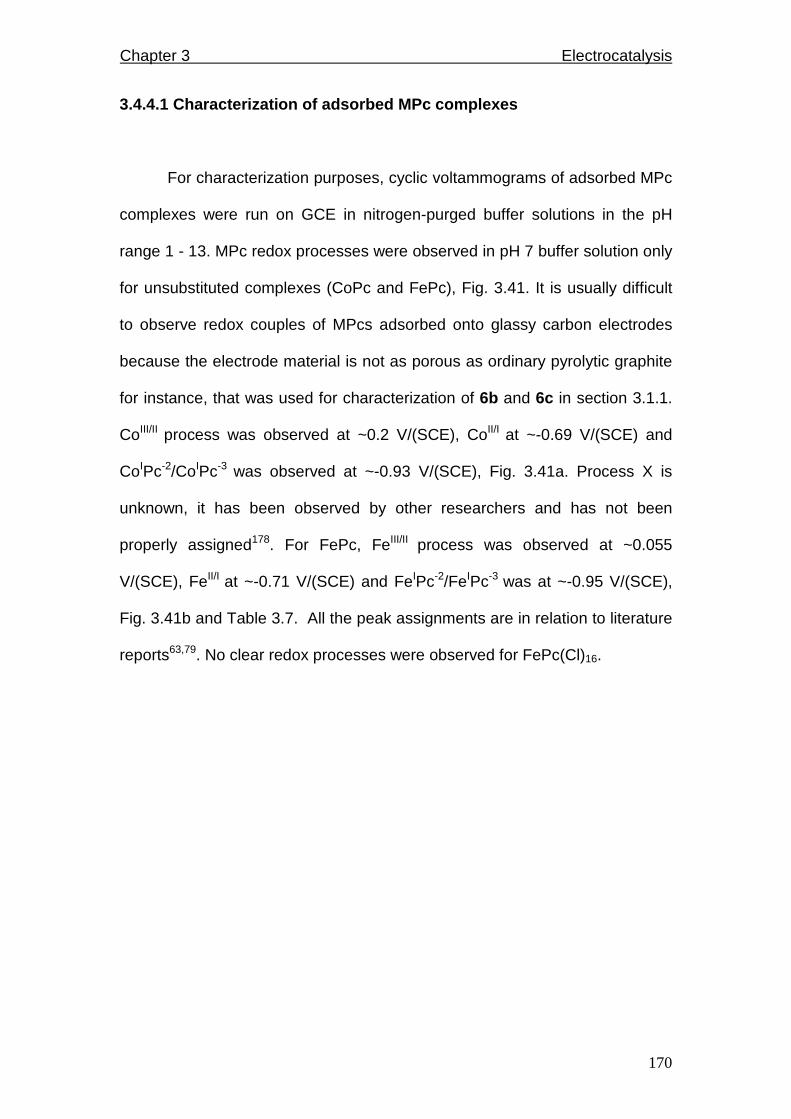
Chapter 3 Electrocatalysis
170
3.4.4.1 Characterization of adsorbed MPc complexes
For characterization purposes, cyclic voltammograms of adsorbed MPc
complexes were run on GCE in nitrogen-purged buffer solutions in the pH
range 1 - 13. MPc redox processes were observed in pH 7 buffer solution only
for unsubstituted complexes (CoPc and FePc), Fig. 3.41. It is usually difficult
to observe redox couples of MPcs adsorbed onto glassy carbon electrodes
because the electrode material is not as porous as ordinary pyrolytic graphite
for instance, that was used for characterization of 6b and 6c in section 3.1.1.
CoIII/II process was observed at ~0.2 V/(SCE), CoII/I at ~-0.69 V/(SCE) and
CoIPc-2/CoIPc-3 was observed at ~-0.93 V/(SCE), Fig. 3.41a. Process X is
unknown, it has been observed by other researchers and has not been
properly assigned178. For FePc, FeIII/II process was observed at ~0.055
V/(SCE), FeII/I at ~-0.71 V/(SCE) and FeIPc-2/FeIPc-3 was at ~-0.95 V/(SCE),
Fig. 3.41b and Table 3.7. All the peak assignments are in relation to literature
reports63,79. No clear redox processes were observed for FePc(Cl)16.

Chapter 3 Electrocatalysis
171
-1000 -700 -400 -100 200 500 800E (mV) vs SCE
I
II
III
1 µµµµA
A
X
-1000 -700 -400 -100 200 500E (mV) vs SCE
B
I
II
III
1 µµµµA
Figure 3.41: Cyclic voltammograms in nitrogen-purge d pH 7 buffer solution of glassy
carbon electrodes modified by adsorption of a) CoPc 6a and b) FePc 8. Scan rate = 50
mV/s.
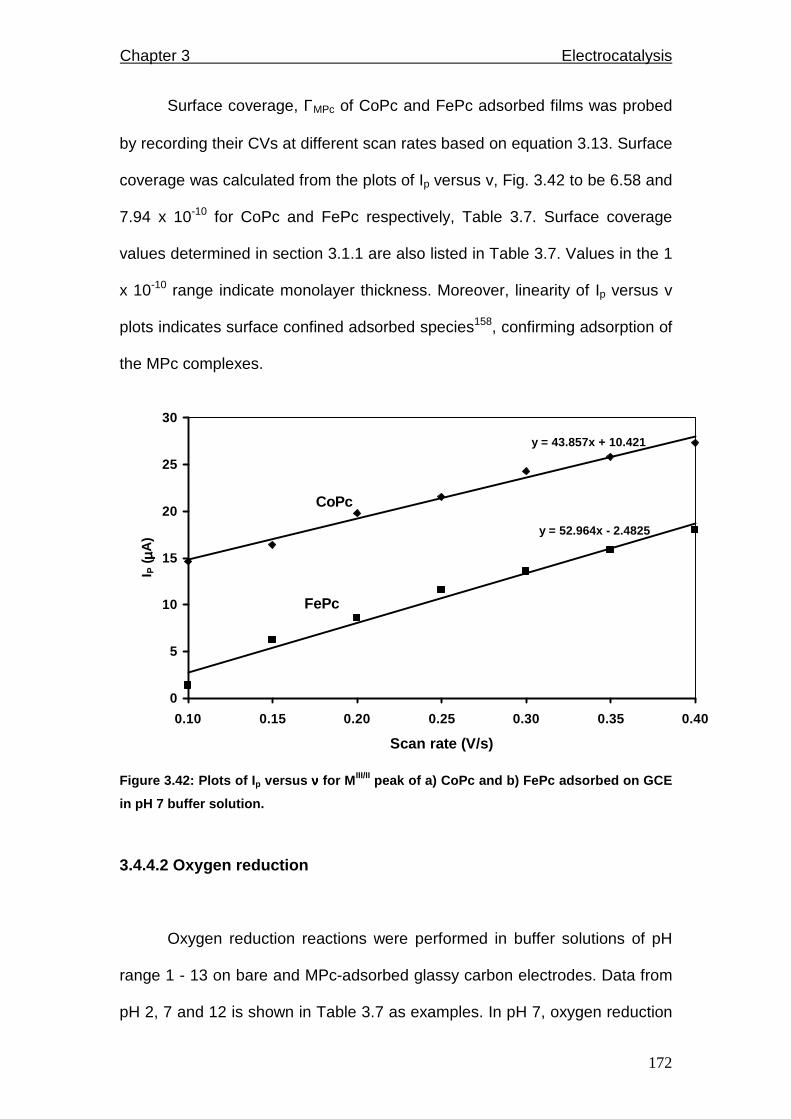
Chapter 3 Electrocatalysis
172
Surface coverage, ΓMPc of CoPc and FePc adsorbed films was probed
by recording their CVs at different scan rates based on equation 3.13. Surface
coverage was calculated from the plots of Ip versus v, Fig. 3.42 to be 6.58 and
7.94 x 10⁻¹⁰ for CoPc and FePc respectively, Table 3.7. Surface coverage
values determined in section 3.1.1 are also listed in Table 3.7. Values in the 1
x 10-10 range indicate monolayer thickness. Moreover, linearity of Ip versus v
plots indicates surface confined adsorbed species158, confirming adsorption of
the MPc complexes.
y = 43.857x + 10.421
y = 52.964x - 2.4825
0
5
10
15
20
25
30
0.10 0.15 0.20 0.25 0.30 0.35 0.40
Scan rate (V/s)
I P (
µµ µµA)
CoPc
FePc
Figure 3.42: Plots of I p versus νννν for M III/II peak of a) CoPc and b) FePc adsorbed on GCE
in pH 7 buffer solution.
3.4.4.2 Oxygen reduction
Oxygen reduction reactions were performed in buffer solutions of pH
range 1 - 13 on bare and MPc-adsorbed glassy carbon electrodes. Data from
pH 2, 7 and 12 is shown in Table 3.7 as examples. In pH 7, oxygen reduction
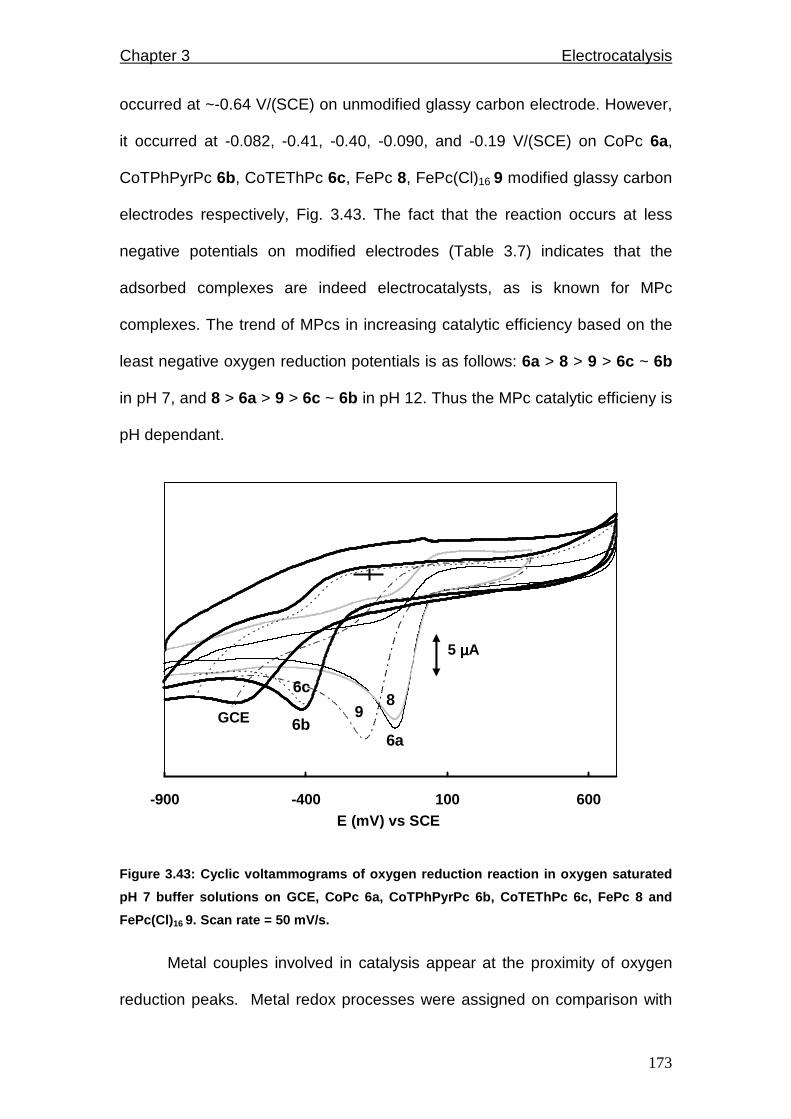
Chapter 3 Electrocatalysis
173
occurred at ~-0.64 V/(SCE) on unmodified glassy carbon electrode. However,
it occurred at -0.082, -0.41, -0.40, -0.090, and -0.19 V/(SCE) on CoPc 6a,
CoTPhPyrPc 6b, CoTEThPc 6c, FePc 8, FePc(Cl)16 9 modified glassy carbon
electrodes respectively, Fig. 3.43. The fact that the reaction occurs at less
negative potentials on modified electrodes (Table 3.7) indicates that the
adsorbed complexes are indeed electrocatalysts, as is known for MPc
complexes. The trend of MPcs in increasing catalytic efficiency based on the
least negative oxygen reduction potentials is as follows: 6a > 8 > 9 > 6c ~ 6b
in pH 7, and 8 > 6a > 9 > 6c ~ 6b in pH 12. Thus the MPc catalytic efficieny is
pH dependant.
-900 -400 100 600E (mV) vs SCE
6a
6c
6b
89
5 µµµµA
GCE
Figure 3.43: Cyclic voltammograms of oxygen reducti on reaction in oxygen saturated
pH 7 buffer solutions on GCE, CoPc 6a, CoTPhPyrPc 6 b, CoTEThPc 6c, FePc 8 and
FePc(Cl) 16 9. Scan rate = 50 mV/s.
Metal couples involved in catalysis appear at the proximity of oxygen
reduction peaks. Metal redox processes were assigned on comparison with
Chapter 3 Electrocatalysis
174
literature reports as stated above. The Co(II/I) redox process of adsorbed
CoPc was observed at ~-0.69 V/(SCE) while the Co(III/II) process was at ~0.2
V/(SCE) in pH 7 (Fig. 3.41a). For FePc, the Fe(III/II) redox process was
observed at 0.06 V/SCE while that of Fe(II/I) was at ~-0.71 V/SCE, Fig. 3.41b.
In both cases, oxygen reduction peaks were situated in between M(III/II) and
M(II/I) peaks (Fig. 3.43), but since the oxygen reduction peaks lie negative of
the M(III/II) redox processes, it can be concluded that the M(III/II) redox
processes are involved in catalysis of oxygen reduction.
Oxygen reduction peak position was observed to vary with pH as
shown in Fig. 3.44. In acidic media, slope of Ep vs pH is 60 mV/pH on average
was observed but in neutral and alkaline media, the potential remained
constant with increase in pH. The observed trend is in agreement with
literature reports178, and it was attributed to pH dependence of a product
formed in acidic media as opposed to the pH-independent one formed in
alkaline conditions. Plots of peak current versus square root of scan rate for
the reduction of oxygen were linear, similar to Fig. 3.39, for all studied
complexes in the pH range 1 - 13 indicating that oxygen reduction reaction is
diffusion-controlled.
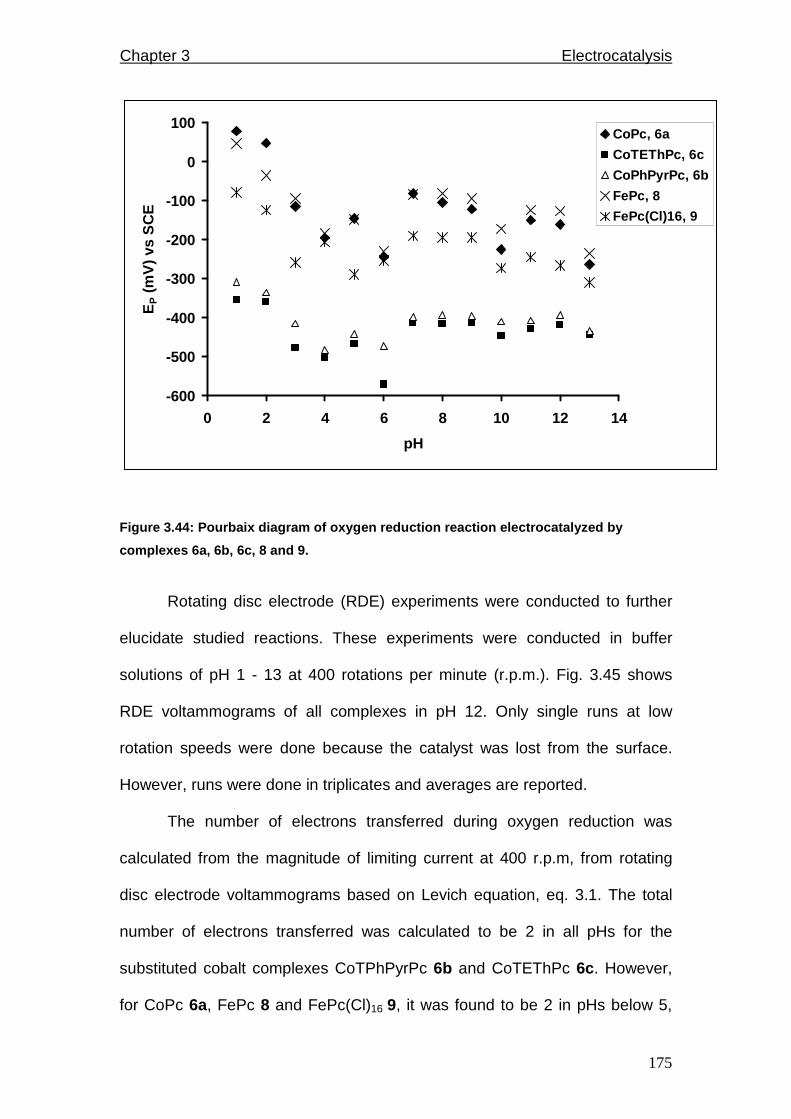
Chapter 3 Electrocatalysis
175
-600
-500
-400
-300
-200
-100
0
100
0 2 4 6 8 10 12 14
pH
EP (
mV
) vs
SC
ECoPc, 6a
CoTEThPc, 6c
CoPhPyrPc, 6b
FePc, 8
FePc(Cl)16, 9
Figure 3.44: Pourbaix diagram of oxygen reduction r eaction electrocatalyzed by
complexes 6a, 6b, 6c, 8 and 9.
Rotating disc electrode (RDE) experiments were conducted to further
elucidate studied reactions. These experiments were conducted in buffer
solutions of pH 1 - 13 at 400 rotations per minute (r.p.m.). Fig. 3.45 shows
RDE voltammograms of all complexes in pH 12. Only single runs at low
rotation speeds were done because the catalyst was lost from the surface.
However, runs were done in triplicates and averages are reported.
The number of electrons transferred during oxygen reduction was
calculated from the magnitude of limiting current at 400 r.p.m, from rotating
disc electrode voltammograms based on Levich equation, eq. 3.1. The total
number of electrons transferred was calculated to be 2 in all pHs for the
substituted cobalt complexes CoTPhPyrPc 6b and CoTEThPc 6c. However,
for CoPc 6a, FePc 8 and FePc(Cl)16 9, it was found to be 2 in pHs below 5,
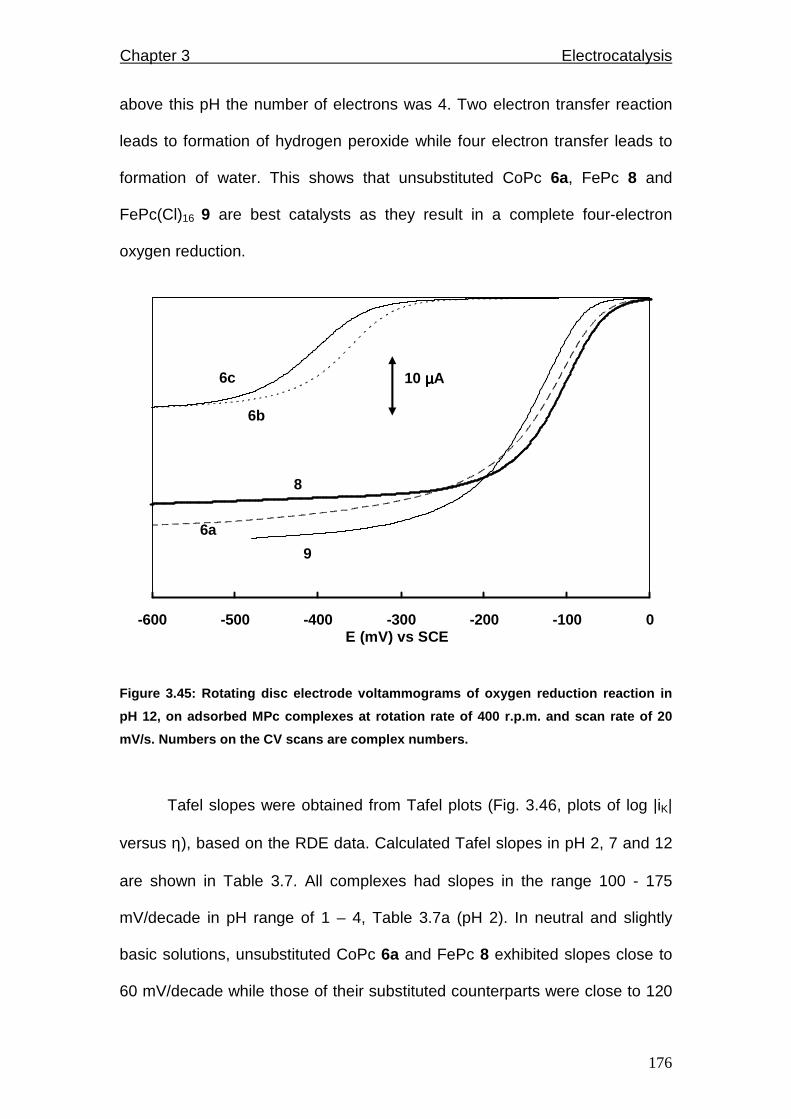
Chapter 3 Electrocatalysis
176
above this pH the number of electrons was 4. Two electron transfer reaction
leads to formation of hydrogen peroxide while four electron transfer leads to
formation of water. This shows that unsubstituted CoPc 6a, FePc 8 and
FePc(Cl)16 9 are best catalysts as they result in a complete four-electron
oxygen reduction.
-600 -500 -400 -300 -200 -100 0E (mV) vs SCE
10 µµµµA
6b
6c
8
6a
9
Figure 3.45: Rotating disc electrode voltammograms of oxygen reduction reaction in
pH 12, on adsorbed MPc complexes at rotation rate o f 400 r.p.m. and scan rate of 20
mV/s. Numbers on the CV scans are complex numbers.
Tafel slopes were obtained from Tafel plots (Fig. 3.46, plots of log |iK|
versus η), based on the RDE data. Calculated Tafel slopes in pH 2, 7 and 12
are shown in Table 3.7. All complexes had slopes in the range 100 - 175
mV/decade in pH range of 1 – 4, Table 3.7a (pH 2). In neutral and slightly
basic solutions, unsubstituted CoPc 6a and FePc 8 exhibited slopes close to
60 mV/decade while those of their substituted counterparts were close to 120
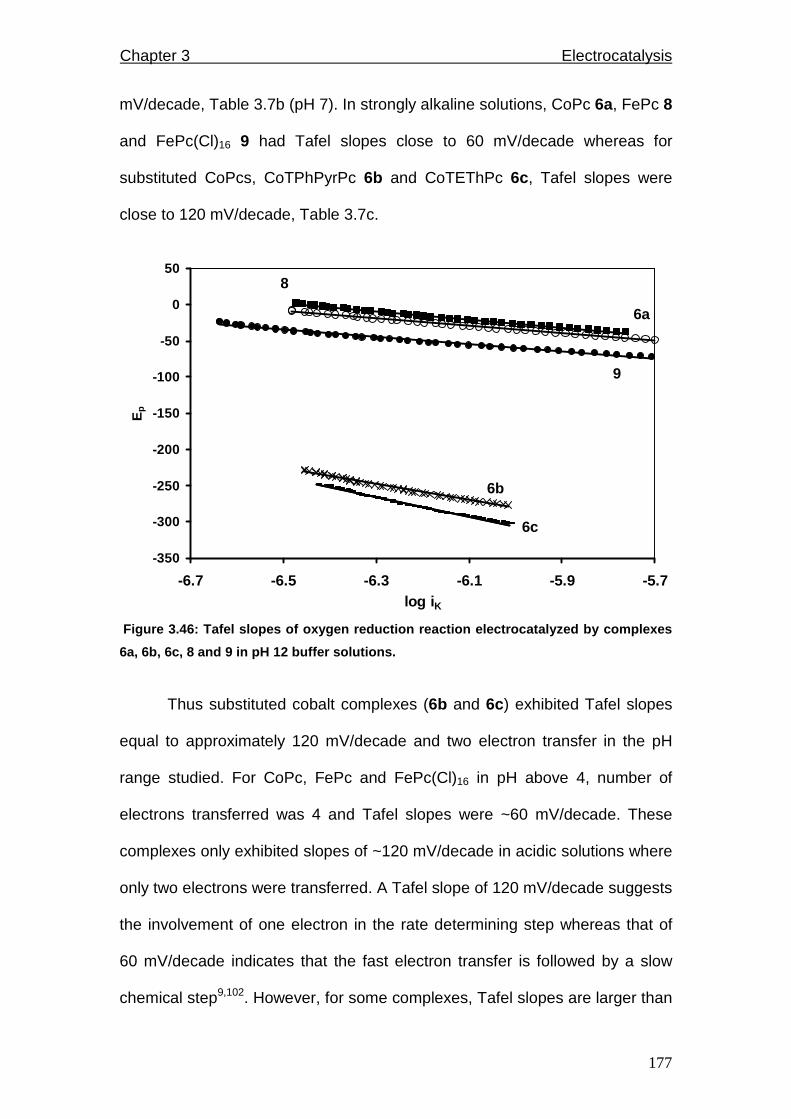
Chapter 3 Electrocatalysis
177
mV/decade, Table 3.7b (pH 7). In strongly alkaline solutions, CoPc 6a, FePc 8
and FePc(Cl)16 9 had Tafel slopes close to 60 mV/decade whereas for
substituted CoPcs, CoTPhPyrPc 6b and CoTEThPc 6c, Tafel slopes were
close to 120 mV/decade, Table 3.7c.
-350
-300
-250
-200
-150
-100
-50
0
50
-6.7 -6.5 -6.3 -6.1 -5.9 -5.7log i K
Ep
8
6c
9
6b
6a
Figure 3.46: Tafel slopes of oxygen reduction reac tion electrocatalyzed by complexes
6a, 6b, 6c, 8 and 9 in pH 12 buffer solutions.
Thus substituted cobalt complexes (6b and 6c) exhibited Tafel slopes
equal to approximately 120 mV/decade and two electron transfer in the pH
range studied. For CoPc, FePc and FePc(Cl)16 in pH above 4, number of
electrons transferred was 4 and Tafel slopes were ~60 mV/decade. These
complexes only exhibited slopes of ~120 mV/decade in acidic solutions where
only two electrons were transferred. A Tafel slope of 120 mV/decade suggests
the involvement of one electron in the rate determining step whereas that of
60 mV/decade indicates that the fast electron transfer is followed by a slow
chemical step9,102. However, for some complexes, Tafel slopes are larger than
Chapter 3 Electrocatalysis
178
the expected 120 mV/decade suggesting strong binding of the analyte to the
catalyst80,83.
Electron transfer coefficients (α) were calculated from Tafel slopes
using equation 3.4 described above for an irreversible process. The calculated
values for pH 2, 7 and 12 are shown in Table 3.7. Generally, when one
electron is involved in the rate-determining step (i.e. nα = 1), which is the case
for oxygen reduction reaction, α is equal to 0.5 for Tafel slopes of 120
mV/decade. But for slopes of 60 mV/decade, α is equal to 1. α valued at
approximately 0.5 indicates that there is an equal probability that the reaction
activated transition state can form either products or reactants. This holds for
substituted cobalt complexes 6b and 6c in the pH range studied and for other
complexes, 6a, 8 and 9 in pHs below 5, Table 3.7.
Transfer coefficients values of approximately 1 were found for CoPc
6a, FePc 8 and FePc(Cl)16 9 in pHs greater than 5, shown for pHs 7 and 12 in
Table 3.7. This implies that the reaction equilibrium favours product formation
only. This therefore shows that the transfer coefficient is pH dependant for
these complexes, in agreement with a literature report178. The reaction order
was determined using equation 3.26 described above and it was found to be
one on average for all studied complexes in pH range 1 - 13. Heterogeneous
electron transfer rate constants kc of cathodic oxygen reduction reaction were
determined using RDE data based on eq. 3.27. kc was found to be in the 10-5
range for all complexes in the pH range studied (Table 3.7), indicating that
reaction kinetics are slow.
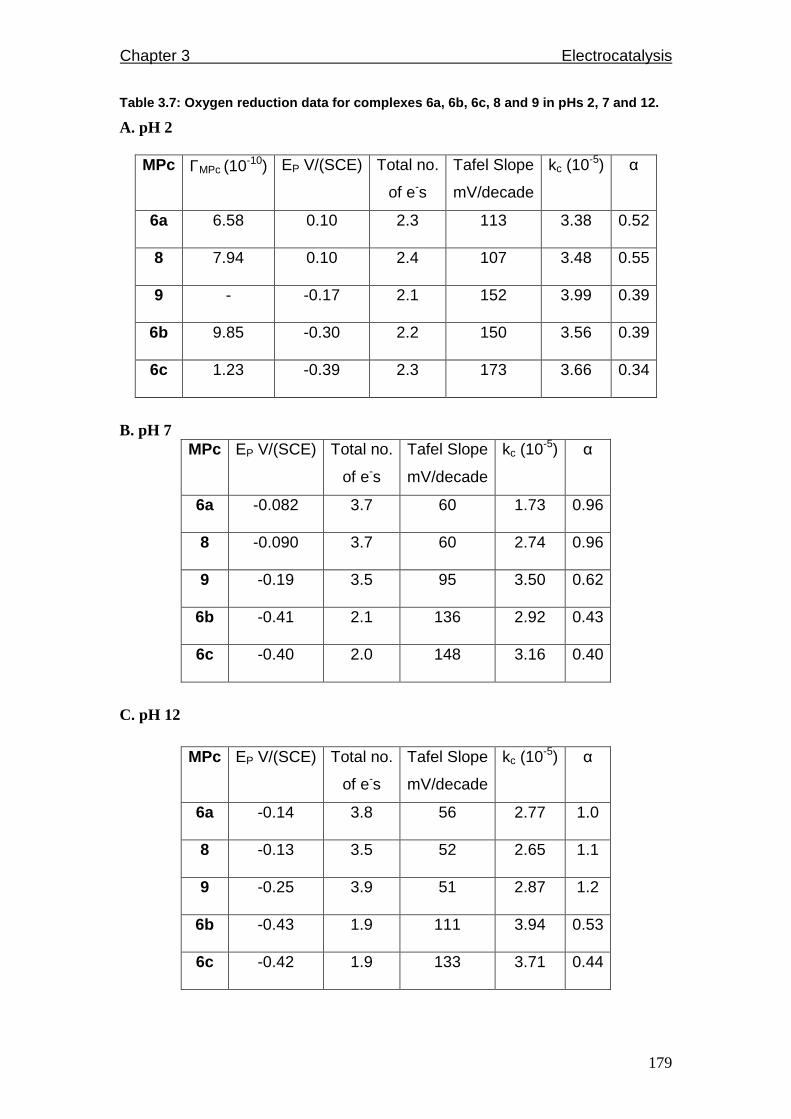
Chapter 3 Electrocatalysis
179
Table 3.7: Oxygen reduction data for complexes 6a, 6b, 6c, 8 and 9 in pHs 2, 7 and 12.
A. pH 2 MPc
ΓMPc (10-10) EP V/(SCE) Total no.
of e-s
Tafel Slope
mV/decade
kc (10-5) α
6a 6.58 0.10 2.3 113 3.38 0.52
8 7.94 0.10 2.4 107 3.48 0.55
9 - -0.17 2.1 152 3.99 0.39
6b 9.85 -0.30 2.2 150 3.56 0.39
6c 1.23 -0.39 2.3 173 3.66 0.34
B. pH 7 MPc
EP V/(SCE) Total no.
of e-s
Tafel Slope
mV/decade
kc (10-5) α
6a -0.082 3.7 60 1.73 0.96
8 -0.090 3.7 60 2.74 0.96
9 -0.19 3.5 95 3.50 0.62
6b -0.41 2.1 136 2.92 0.43
6c -0.40 2.0 148 3.16 0.40
C. pH 12
MPc
EP V/(SCE) Total no.
of e-s
Tafel Slope
mV/decade
kc (10-5) α
6a -0.14 3.8 56 2.77 1.0
8 -0.13 3.5 52 2.65 1.1
9 -0.25 3.9 51 2.87 1.2
6b -0.43 1.9 111 3.94 0.53
6c -0.42 1.9 133 3.71 0.44
Chapter 3 Electrocatalysis
180
3.4.5 Mechanism of oxygen reduction
Oxygen reduction is an inner sphere process, meaning the reactant
must interact with an active site on the surface of the electrode157,184. Oxygen
is an acceptor while MPc is a donor. The interaction becomes possible when
the symmetry of the involved frontier orbitals is right and relative energy levels
are close. The 2p electrons of oxygen interact with electrons in the partially
filled d-orbitals of the metal of the MPc, accompanied by intramolecular
electron transfer from the metal to oxygen. This happens between molecular
orbital (MO) of the central metal M in MPc complexes and oxygen; this
interaction is more prominent for Mn compared to other transition metals such
as Fe and Co because Mn has lower energy d-orbitals. Energy gap between
participating MOs of oxygen and MnPc is described in terms of
hardness157,184. This is expressed as half the difference between lowest
unoccupied molecular orbital of the acceptor (oxygen in this case) and highest
occupied molecular orbital of the donor (MPc in this case); ½{E LUMO(A) – E
HOMO(D)}157,184. The larger the gap, the higher the hardness and the more
stable the system is, hence low reactivity.
Substituents on the MPc have an effect on the MO energy levels.
Electron-withdrawing groups lower the energy of the MO of MPc, while their
electron-donating counterparts increase it189. Lowering of energy levels of MO
of MPc minimizes the gap between MO of MPc and that of oxygen. The
system becomes soft, the interaction is enhanced and thus reactivity
increases. It is therefore theoretically expected that electron withdrawing
ligands will increase catalytic activity of MPcs towards oxygen reduction.
Chapter 3 Electrocatalysis
181
Electron-donating substituents are expected to have an opposite effect. Log k
(k = rate constant) of oxygen reduction catalyzed by CoPcs with electron
donating substituents was found to decrease when plotted against sum of
Hammett parameters of the substituents184.
In this work, effect of substituents on electrocatalytic activity towards
oxygen reduction was investigated by comparison of reaction peak potentials.
For the MnPc complexes in this work, the ease of reduction of oxygen in pH
12 based on reaction peak potentials followed the order, stated above: 7a (-
0.45) ≈ 7c (-0.47) ≈ 7e (-0.43) > 7b (-0.51) > 7f (-0.58) > 7d (-0.63), showing
that the unsubstituted complex 7a, is a better catalyst than for example 7b
(which contains electron-donating substituents) in agreement with literature.
For other complexes FePc 8 and FePc(Cl)16 9, peak potentials were at -0.13
and -0.25 V/(SCE) respectively, in pH 12. It is therefore obvious that this
electron withdrawing group Cl- does not enhance electrocatalytic activity since
oxygen reduction occurs at more negative potentials. In the case of CoPc 6a
and its substituted counterparts CoTPhPyrPc 6b and CoTEThPc 6c, oxygen
reduction occurred in pH 12 at -0.14, -0.43 and -0.42 V/(SCE) respectively.
This shows that electrocatalytic activity was greatly reduced in the presence of
substituents.
Similarly the effect of central metal of the phthalocyanine catalysts was
probed by comparison of oxygen reduction peak potentials. In pH 12, oxygen
reduction peaks were observed at -0.45 (Table 3.6), -0.13 and -0.14 V/(SCE)
(Table 3.7) for MnPc, CoPc and FePc, respectively. The catalytic activity trend
is more conspicuous in pH 7 where oxygen reduction peaks are observed at -
0.49, -0.082 and -0.090 V/(SCE) for MnPc, CoPc and FePc, respectively. This
Chapter 3 Electrocatalysis
182
is not in agreement with perturbation theory wherein Mn is expected to exhibit
the highest electrocatalytic activity by virtue of good orbital overlap with
oxygen, compared to Fe and Co. However, a similar trend in catalytic activity
of Mn, Fe and Co phthalocyanines towards reduction of oxygen has been
observed before171.
Interaction of oxygen with MPcs
It has been reported that when MnPcs interact with oxygen, either the
superoxide or the µ-oxo-bridged dimer are formed249,250. This has been
confirmed with UV/Vis spectroscopy251,252. Furthermore, it has been reported
that oxygen adsorption on the electrode can involve electron transfer leading
to its activation as shown in Scheme 3.6, eq. 3.28. It can also occur without
electron transfer (eq. 3.29); the former has been proven spectroscopically253.
S + O2 = S-O2- 3.28
S + O2 = S-O2, 3.29
where S is the electrode surface.
Scheme 3.6: Oxygen adsorption onto an electrode.
In this study, formation of adducts upon interaction of MPc complexes
with oxygen was probed using UV/Vis spectroscopy, Fig. 3.47. In all MnPc
complexes, the starting species is the MnIIIPc as evidenced by the red shifted
Q band with λ > 700 nm. Oxygen was bubbled to MnIIIPc solutions and no
shifts of spectral bands were observed for all MnPc complexes, curves ii.
Fresh solutions of the complexes were reduced using sodium borohydride,
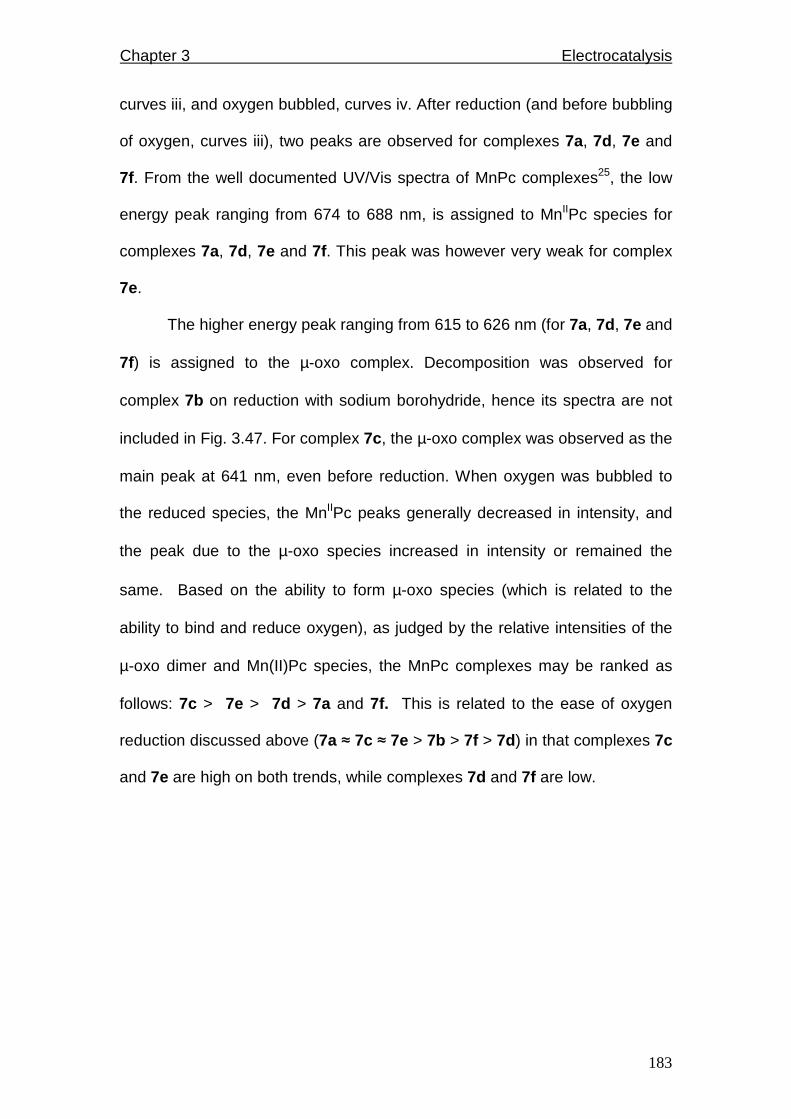
Chapter 3 Electrocatalysis
183
curves iii, and oxygen bubbled, curves iv. After reduction (and before bubbling
of oxygen, curves iii), two peaks are observed for complexes 7a, 7d, 7e and
7f. From the well documented UV/Vis spectra of MnPc complexes25, the low
energy peak ranging from 674 to 688 nm, is assigned to MnIIPc species for
complexes 7a, 7d, 7e and 7f. This peak was however very weak for complex
7e.
The higher energy peak ranging from 615 to 626 nm (for 7a, 7d, 7e and
7f) is assigned to the µ-oxo complex. Decomposition was observed for
complex 7b on reduction with sodium borohydride, hence its spectra are not
included in Fig. 3.47. For complex 7c, the µ-oxo complex was observed as the
main peak at 641 nm, even before reduction. When oxygen was bubbled to
the reduced species, the MnIIPc peaks generally decreased in intensity, and
the peak due to the µ-oxo species increased in intensity or remained the
same. Based on the ability to form µ-oxo species (which is related to the
ability to bind and reduce oxygen), as judged by the relative intensities of the
µ-oxo dimer and Mn(II)Pc species, the MnPc complexes may be ranked as
follows: 7c > 7e > 7d > 7a and 7f. This is related to the ease of oxygen
reduction discussed above (7a ≈ 7c ≈ 7e > 7b > 7f > 7d) in that complexes 7c
and 7e are high on both trends, while complexes 7d and 7f are low.

Chapter 3 Electrocatalysis
184
300 400 500 600 700 800
Wavelength (nm)
Abs
orba
nce
706
674615MnPc, 7a
i
ii
iiiiv
400 450 500 550 600 650 700 750 800
Wavelength (nm)
Abs
orba
nce
641nmMnTPePyrPc, 7c
i
iviii
ii

Chapter 3 Electrocatalysis
185
300 400 500 600 700 800
Wavelength (nm)
Abs
orba
nce
717
680
623
MnTPhPyrPc, 7d
i
ii
iii
iv
300 400 500 600 700 800
Wavelength (nm)
Abs
orba
nce 714
688
626MnTMerPyPc, 7e
i
ii
iii
iv
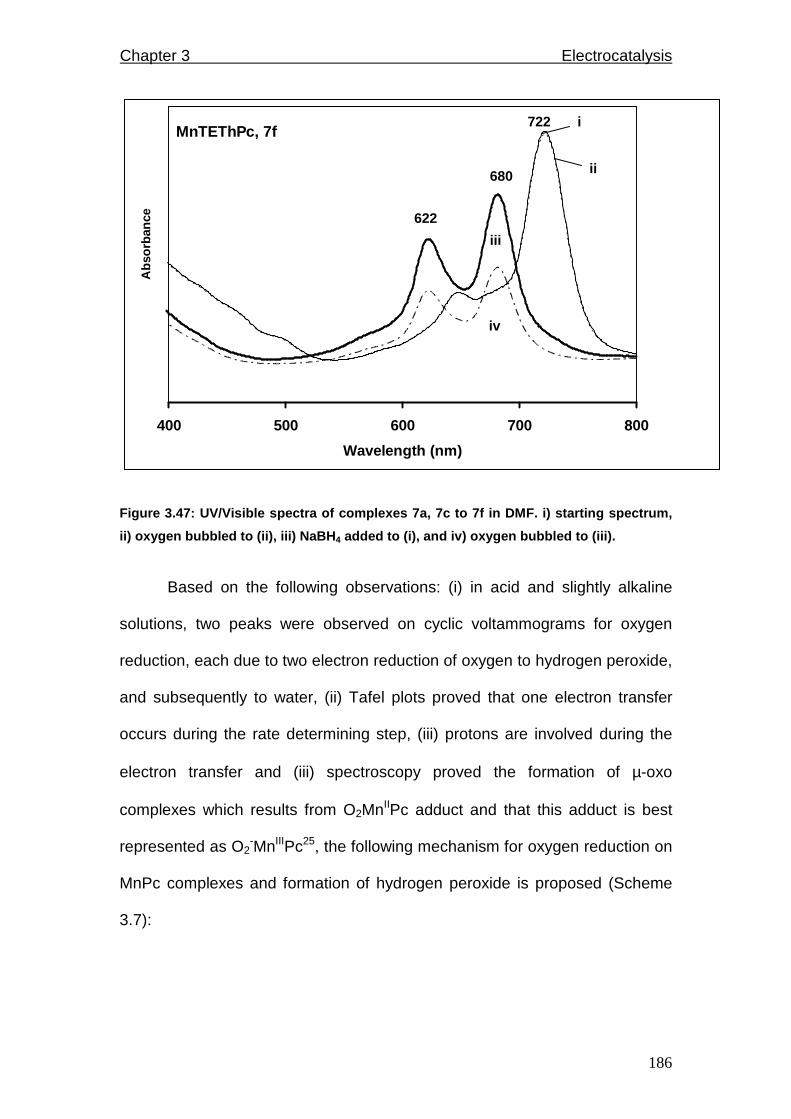
Chapter 3 Electrocatalysis
186
400 500 600 700 800
Wavelength (nm)
Abs
orba
nce
722
680
622
MnTEThPc, 7f
iii
iv
i
ii
Figure 3.47: UV/Visible spectra of complexes 7a, 7c to 7f in DMF. i) starting spectrum,
ii) oxygen bubbled to (ii), iii) NaBH 4 added to (i), and iv) oxygen bubbled to (iii).
Based on the following observations: (i) in acid and slightly alkaline
solutions, two peaks were observed on cyclic voltammograms for oxygen
reduction, each due to two electron reduction of oxygen to hydrogen peroxide,
and subsequently to water, (ii) Tafel plots proved that one electron transfer
occurs during the rate determining step, (iii) protons are involved during the
electron transfer and (iii) spectroscopy proved the formation of µ-oxo
complexes which results from O2MnIIPc adduct and that this adduct is best
represented as O2-MnIIIPc25, the following mechanism for oxygen reduction on
MnPc complexes and formation of hydrogen peroxide is proposed (Scheme
3.7):
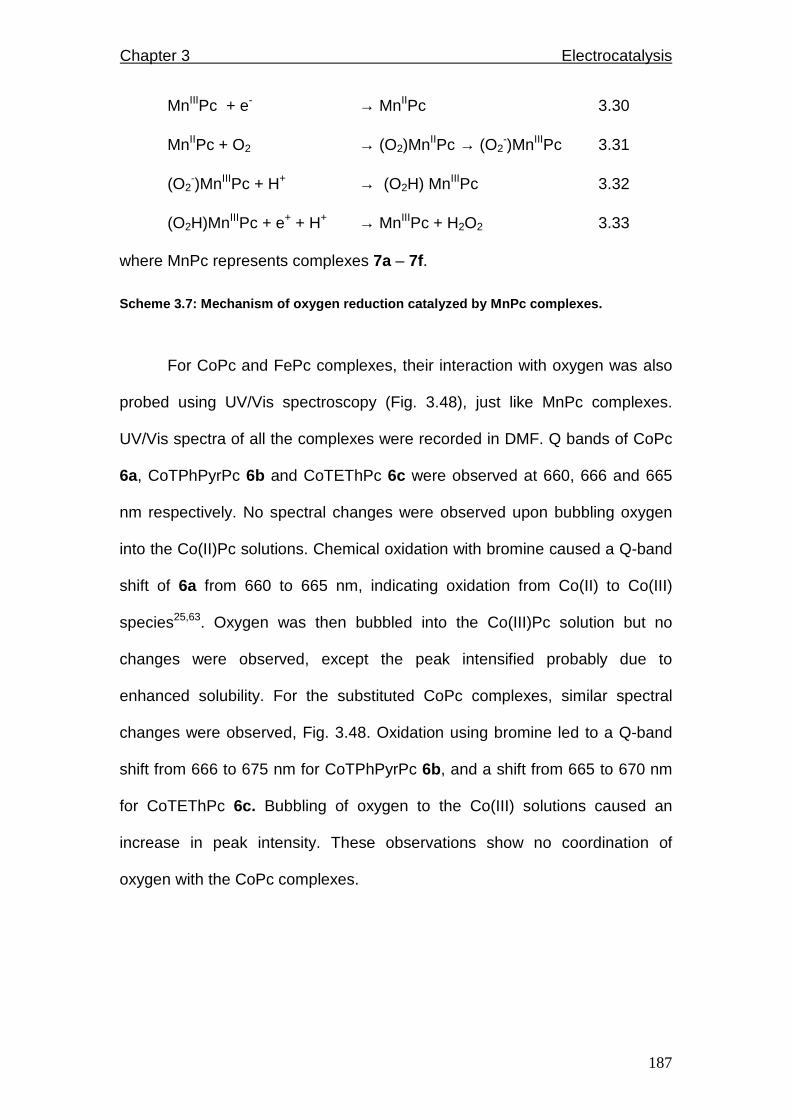
Chapter 3 Electrocatalysis
187
MnIIIPc + e- → MnIIPc 3.30
MnIIPc + O2 → (O2)MnIIPc → (O2-)MnIIIPc 3.31
(O2-)MnIIIPc + H+ → (O2H) MnIIIPc 3.32
(O2H)MnIIIPc + e+ + H+ → MnIIIPc + H2O2 3.33
where MnPc represents complexes 7a – 7f.
Scheme 3.7: Mechanism of oxygen reduction catalyzed by MnPc complexes.
For CoPc and FePc complexes, their interaction with oxygen was also
probed using UV/Vis spectroscopy (Fig. 3.48), just like MnPc complexes.
UV/Vis spectra of all the complexes were recorded in DMF. Q bands of CoPc
6a, CoTPhPyrPc 6b and CoTEThPc 6c were observed at 660, 666 and 665
nm respectively. No spectral changes were observed upon bubbling oxygen
into the Co(II)Pc solutions. Chemical oxidation with bromine caused a Q-band
shift of 6a from 660 to 665 nm, indicating oxidation from Co(II) to Co(III)
species25,63. Oxygen was then bubbled into the Co(III)Pc solution but no
changes were observed, except the peak intensified probably due to
enhanced solubility. For the substituted CoPc complexes, similar spectral
changes were observed, Fig. 3.48. Oxidation using bromine led to a Q-band
shift from 666 to 675 nm for CoTPhPyrPc 6b, and a shift from 665 to 670 nm
for CoTEThPc 6c. Bubbling of oxygen to the Co(III) solutions caused an
increase in peak intensity. These observations show no coordination of
oxygen with the CoPc complexes.
Chapter 3 Electrocatalysis
188
550 580 610 640 670 700 730
Wavelength (nm)
Abs
orba
nce
660
665CoPc, 6a
i
ii
iii
500 550 600 650 700 750 800
Wavelength (nm)
Abs
orba
nce
666 nm 675 nmCoTPhPyPc, 6b
i
iii
ii
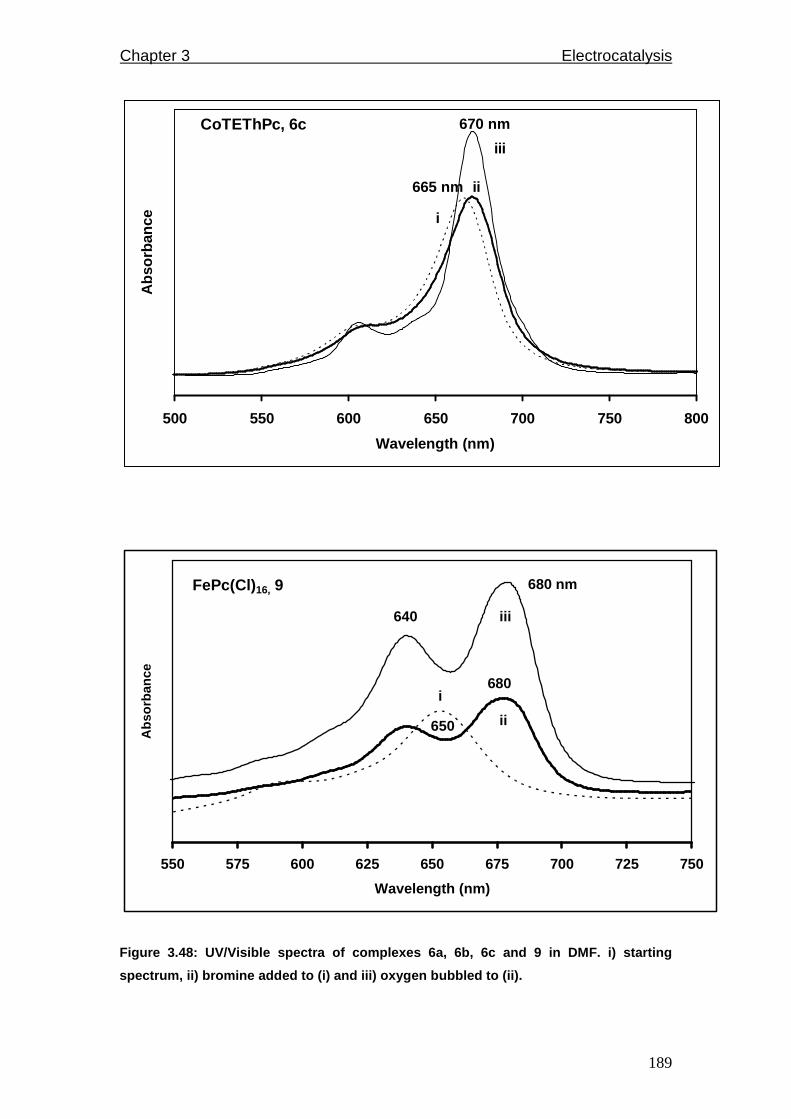
Chapter 3 Electrocatalysis
189
500 550 600 650 700 750 800
Wavelength (nm)
Abs
orba
nce
665 nm
670 nmCoTEThPc, 6c
i
ii
iii
550 575 600 625 650 675 700 725 750
Wavelength (nm)
Abs
orba
nce
680
640
680 nm FePc(Cl) 16, 9
i
iii
ii650
Figure 3.48: UV/Visible spectra of complexes 6a, 6b , 6c and 9 in DMF. i) starting
spectrum, ii) bromine added to (i) and iii) oxygen bubbled to (ii).
Chapter 3 Electrocatalysis
190
The Q band of FePc(Cl)16 9 was observed at 650 nm in DMF. The band
split upon oxidation using bromine into components at 640 and 680 nm. The
split Q band indicates oxidation to Fe (III). The lower energy component
denotes formation of Fe (III) while its counterpart at higher energy is attributed
to the µ-oxo dimer25,63. Both peaks intensified upon oxygenation. Similar
spectral changes were observed for FePc. These studies show that
interaction of oxygen with iron (II) complexes leads to formation of Fe (III) µ-
oxo dimers, confirming involvement of the Fe (III/II) redox couple in oxygen
reduction reactions.
In summary, Co (III/II) and Fe (III/II) couples were involved in catalysis
based on their CV peak positions relative to the oxygen reduction peaks.
Oxygen is electrocatalytically reduced to hydrogen peroxide in buffer solutions
of pHs below 5 by all studied complexes, Table 3.7. Water is formed at higher
pH by CoPc 6a, FePc 8 and FePc(Cl)16 9 as judged four electron transfer,
Table 3.7, whereas substituted cobalt complexes, 6b and 6c form only
hydrogen peroxide in all pH range studied. Protons were also involved in the
reaction, this is shown by the Pourbaix diagram in Fig. 3.44. For hydrogen
peroxide formation, Tafel slopes of 120 mV/decade were obtained indicating
that one electron transfer occurs during the rate determining step for
complexes 6a, 8 and 9 at pH less than 5. Tafel slopes of 60 mV/decade were
obtained when water is the product at pH greater than 5, implying that one
electron transfer is followed by a slow chemical step.
Based on the above observations, the following mechanism (Scheme
3.8) based on literature reports81,185 is therefore proposed for oxygen
Chapter 3 Electrocatalysis
191
reduction catalyzed by iron phthalocyanine complexes when two electrons are
transferred and Tafel slopes are 60 mV/decade:
[FeIIIPc]+ + e- → FeIIPc 3.34
FeIIPc + O2 → sdr .. (O2-)FeIIIPc 3.35
(O2-)FeIIIPc + H+ → [(O2H)FeIIIPc]+ 3.36
[(O2H)FeIIIPc]+ + e- + H+ → [FeIIIPc]+ + H2O2 3.37
For oxygen reduction catalyzed by cobalt phthalocyanine complexes involving
transfer of two electrons and 60 mV/decade Tafel slopes, the mechanism is
as follows:
[CoIIIPc]+ + e- → CoIIPc 3.38
CoIIPc + O2 + 2e- + 2H+ → sdr .. [CoIIIPc]+ + H2O2 3.39
Scheme 3.8: Mechanism of oxygen reduction catalyzed by CoPc and FePc complexes.
At the beginning of oxygen reduction reactions, positive potential is
applied that oxidizes the catalysts, hence eqs. 3.34 and 3.38 are proposed
that involve reduction of the MPcs from M(III) to M(II). The reduced species
then interact with oxygen whereby the formed adduct of the iron species will
be in the +3 state, eq. 3.35. This superoxide species does not exist for Co as
reported in literature185; oxygen does not coordinate with the Co metal centre
as proven by UV/Vis spectroscopy, Fig. 3.48. The (O2-)FeIIIPc adduct is then
protonated (eq. 3.36), followed by cleavage of the (O2H) and subsequent
protonation leading to formation of hydrogen peroxide, eq. 3.37. The peroxide
can then undergo further two electron transfer to form water.
The same oxygen reduction mechanism holds for 120 mV/decade Tafel
slopes, the difference lies in the rate-determining step which will be eq. 3.36.

Chapter 3 Electrocatalysis
192
The difference in Tafel slopes stems from different adsorption conditions. For
120 mV/decade slopes, the reaction occurs under Langmuir adsorption
conditions while for Tafel slopes of 60 mV/decade, it occurs under Temkin
adsorption conditions81,179.
In conclusion, oxygen reduction is catalyzed by MnPc, CoPc and FePc
complexes. The best electrocatalytic activity in terms of peak potentials and
complete reduction via four electron transfer was afforded by unsubstituted
Co, Fe and Mn phthalocyanines. Substitution with either electron-donating or
electron-withdrawing ligands lowers electrocatalytic efficiency of the catalysts.
Substituted CoPcs produced H2O2 in all pHs whereas unsubstituted CoPc and
FePc produced it in pHs below 5, and above this pH, they formed water.
MnPc complexes form the peroxide in acidic and slightly alkaline media, but at
high pH, they form water.
Chapter 4
Biomimetic catalysis
This section describes results obtained from use of metallo-phthalocyanines
as biomimetic catalysts for oxidation of cyclohexene in the presence of
chemical oxidants.

Chapter 4 Biomimetic catalysis
194
This work has been published as;
Nthapo Sehlotho and Tebello Nyokong
Catalytic activity of iron and cobalt phthalocyanine complexes towards
the oxidation of cyclohexene using tert-butylhydroperoxide and
chloroperoxybenzoic acid.
J. Mol. Cat. A: Chem., 209 (2004) 51-57.
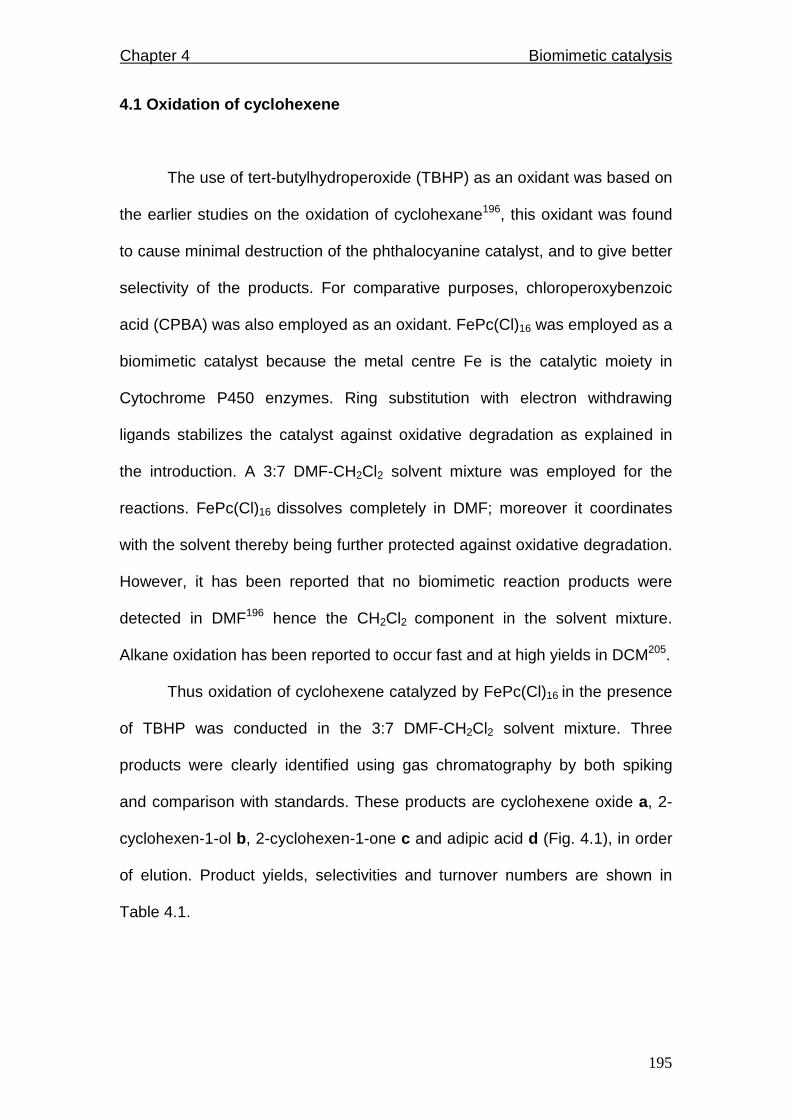
Chapter 4 Biomimetic catalysis
195
4.1 Oxidation of cyclohexene
The use of tert-butylhydroperoxide (TBHP) as an oxidant was based on
the earlier studies on the oxidation of cyclohexane196, this oxidant was found
to cause minimal destruction of the phthalocyanine catalyst, and to give better
selectivity of the products. For comparative purposes, chloroperoxybenzoic
acid (CPBA) was also employed as an oxidant. FePc(Cl)16 was employed as a
biomimetic catalyst because the metal centre Fe is the catalytic moiety in
Cytochrome P450 enzymes. Ring substitution with electron withdrawing
ligands stabilizes the catalyst against oxidative degradation as explained in
the introduction. A 3:7 DMF-CH2Cl2 solvent mixture was employed for the
reactions. FePc(Cl)16 dissolves completely in DMF; moreover it coordinates
with the solvent thereby being further protected against oxidative degradation.
However, it has been reported that no biomimetic reaction products were
detected in DMF196 hence the CH2Cl2 component in the solvent mixture.
Alkane oxidation has been reported to occur fast and at high yields in DCM205.
Thus oxidation of cyclohexene catalyzed by FePc(Cl)16 in the presence
of TBHP was conducted in the 3:7 DMF-CH2Cl2 solvent mixture. Three
products were clearly identified using gas chromatography by both spiking
and comparison with standards. These products are cyclohexene oxide a, 2-
cyclohexen-1-ol b, 2-cyclohexen-1-one c and adipic acid d (Fig. 4.1), in order
of elution. Product yields, selectivities and turnover numbers are shown in
Table 4.1.
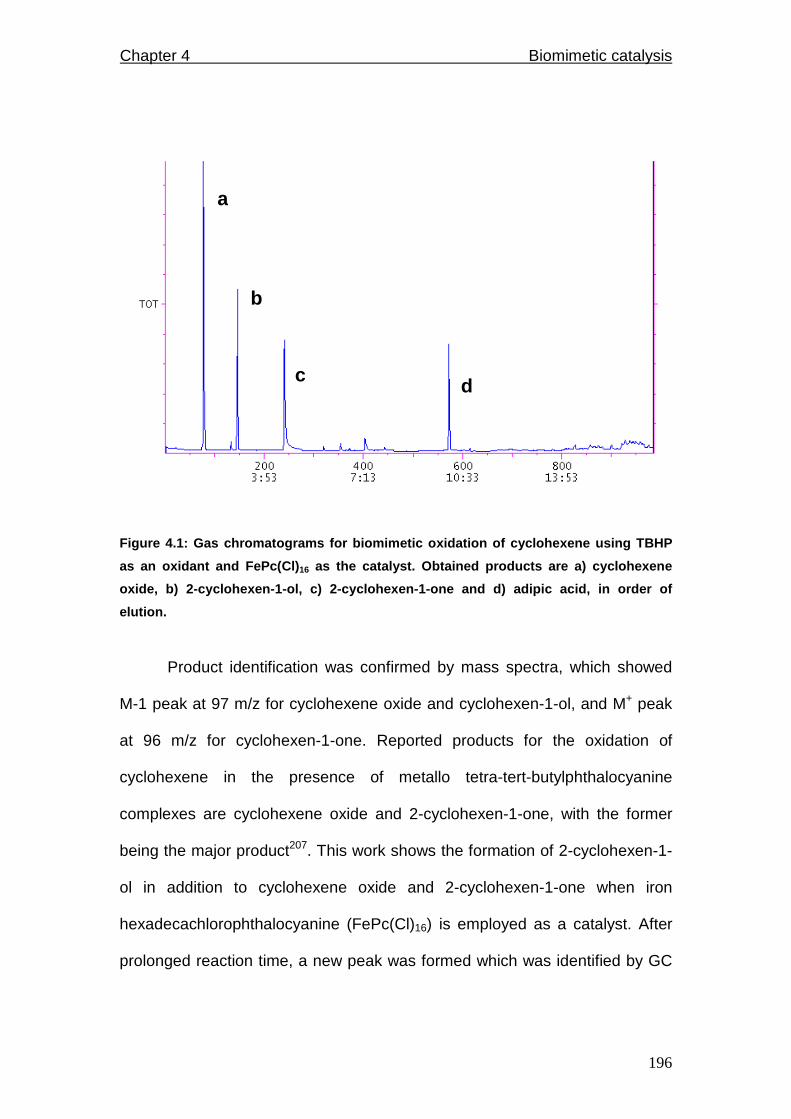
Chapter 4 Biomimetic catalysis
196
d
b
a
c
Figure 4.1: Gas chromatograms for biomimetic oxidat ion of cyclohexene using TBHP
as an oxidant and FePc(Cl) 16 as the catalyst. Obtained products are a) cyclohex ene
oxide, b) 2-cyclohexen-1-ol, c) 2-cyclohexen-1-one and d) adipic acid, in order of
elution.
Product identification was confirmed by mass spectra, which showed
M-1 peak at 97 m/z for cyclohexene oxide and cyclohexen-1-ol, and M+ peak
at 96 m/z for cyclohexen-1-one. Reported products for the oxidation of
cyclohexene in the presence of metallo tetra-tert-butylphthalocyanine
complexes are cyclohexene oxide and 2-cyclohexen-1-one, with the former
being the major product207. This work shows the formation of 2-cyclohexen-1-
ol in addition to cyclohexene oxide and 2-cyclohexen-1-one when iron
hexadecachlorophthalocyanine (FePc(Cl)16) is employed as a catalyst. After
prolonged reaction time, a new peak was formed which was identified by GC
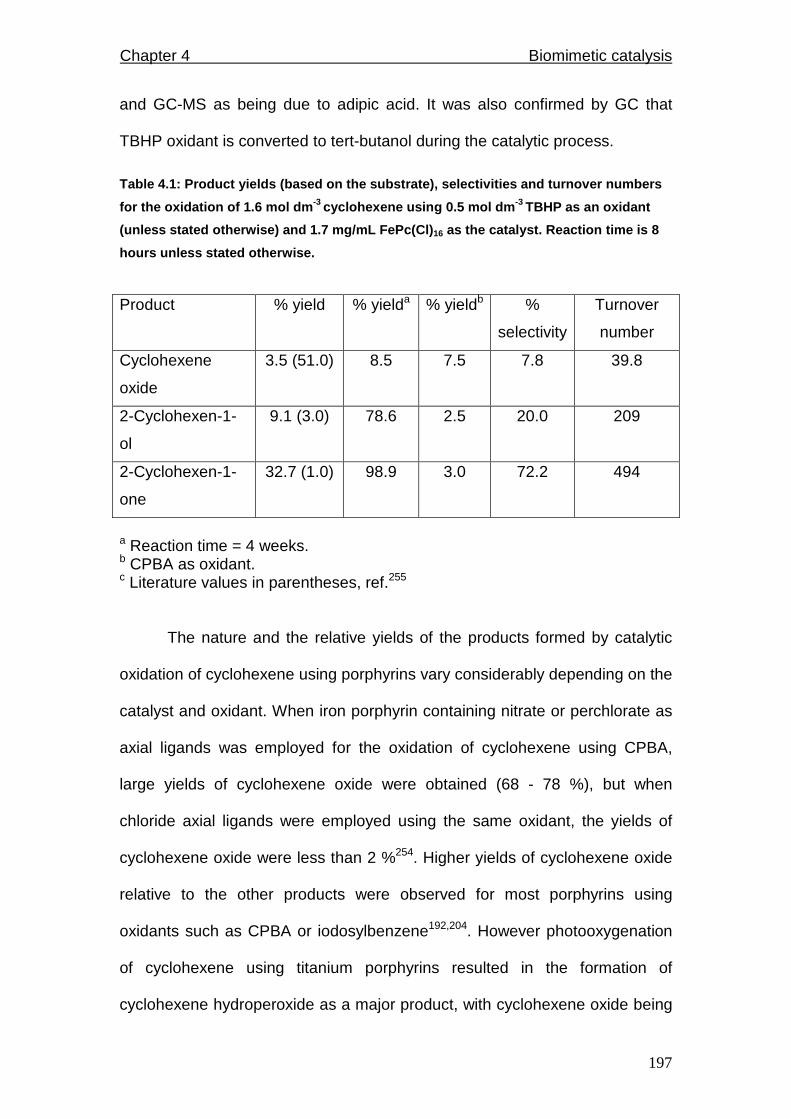
Chapter 4 Biomimetic catalysis
197
and GC-MS as being due to adipic acid. It was also confirmed by GC that
TBHP oxidant is converted to tert-butanol during the catalytic process.
Table 4.1: Product yields (based on the substrate), selectivities and turnover numbers
for the oxidation of 1.6 mol dm -3 cyclohexene using 0.5 mol dm -3 TBHP as an oxidant
(unless stated otherwise) and 1.7 mg/mL FePc(Cl) 16 as the catalyst. Reaction time is 8
hours unless stated otherwise.
Product % yield % yielda % yieldb %
selectivity
Turnover
number
Cyclohexene
oxide
3.5 (51.0) 8.5 7.5 7.8 39.8
2-Cyclohexen-1-
ol
9.1 (3.0) 78.6 2.5 20.0 209
2-Cyclohexen-1-
one
32.7 (1.0) 98.9 3.0 72.2 494
a Reaction time = 4 weeks. b CPBA as oxidant. c Literature values in parentheses, ref.255
The nature and the relative yields of the products formed by catalytic
oxidation of cyclohexene using porphyrins vary considerably depending on the
catalyst and oxidant. When iron porphyrin containing nitrate or perchlorate as
axial ligands was employed for the oxidation of cyclohexene using CPBA,
large yields of cyclohexene oxide were obtained (68 - 78 %), but when
chloride axial ligands were employed using the same oxidant, the yields of
cyclohexene oxide were less than 2 %254. Higher yields of cyclohexene oxide
relative to the other products were observed for most porphyrins using
oxidants such as CPBA or iodosylbenzene192,204. However photooxygenation
of cyclohexene using titanium porphyrins resulted in the formation of
cyclohexene hydroperoxide as a major product, with cyclohexene oxide being
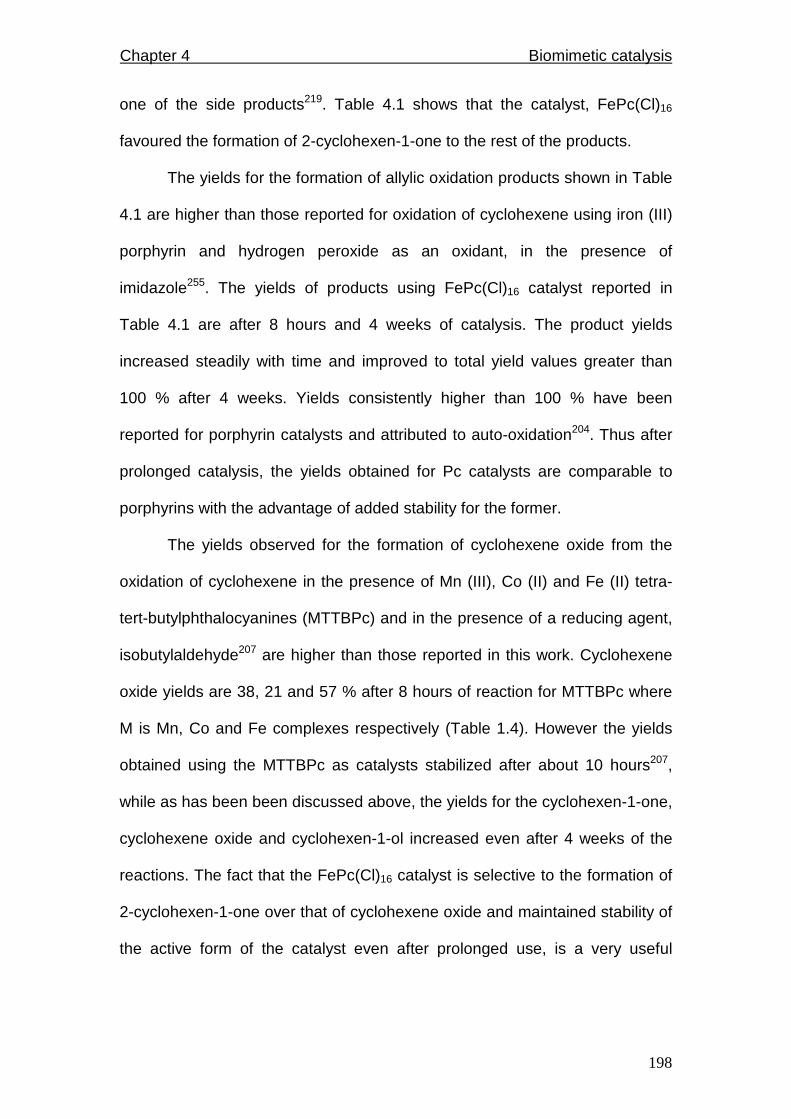
Chapter 4 Biomimetic catalysis
198
one of the side products219. Table 4.1 shows that the catalyst, FePc(Cl)16
favoured the formation of 2-cyclohexen-1-one to the rest of the products.
The yields for the formation of allylic oxidation products shown in Table
4.1 are higher than those reported for oxidation of cyclohexene using iron (III)
porphyrin and hydrogen peroxide as an oxidant, in the presence of
imidazole255. The yields of products using FePc(Cl)16 catalyst reported in
Table 4.1 are after 8 hours and 4 weeks of catalysis. The product yields
increased steadily with time and improved to total yield values greater than
100 % after 4 weeks. Yields consistently higher than 100 % have been
reported for porphyrin catalysts and attributed to auto-oxidation204. Thus after
prolonged catalysis, the yields obtained for Pc catalysts are comparable to
porphyrins with the advantage of added stability for the former.
The yields observed for the formation of cyclohexene oxide from the
oxidation of cyclohexene in the presence of Mn (III), Co (II) and Fe (II) tetra-
tert-butylphthalocyanines (MTTBPc) and in the presence of a reducing agent,
isobutylaldehyde207 are higher than those reported in this work. Cyclohexene
oxide yields are 38, 21 and 57 % after 8 hours of reaction for MTTBPc where
M is Mn, Co and Fe complexes respectively (Table 1.4). However the yields
obtained using the MTTBPc as catalysts stabilized after about 10 hours207,
while as has been been discussed above, the yields for the cyclohexen-1-one,
cyclohexene oxide and cyclohexen-1-ol increased even after 4 weeks of the
reactions. The fact that the FePc(Cl)16 catalyst is selective to the formation of
2-cyclohexen-1-one over that of cyclohexene oxide and maintained stability of
the active form of the catalyst even after prolonged use, is a very useful

Chapter 4 Biomimetic catalysis
199
observation. High turn-over values were obtained for the catalytic process
employing FePc(Cl)16, Table 4.1.
The biomimetic catalytic activity of FePc(Cl)16 was compared to that of
unsubstituted FePc and CoPc after 8 hours of reaction time. FePc showed
selectivity towards cyclohexen-1-ol not cyclohexen-1-one observed for
perchlorinated FePc(Cl)16, Table 4.2. Unsubstituted CoPc, however showed
selectivity towards the cyclohexen-1-one, Table 4.2. When CPBA was
employed as an oxidant, FePc(Cl)16 was found to be selective towards
cyclohexene oxide, instead of cyclohexen-1-one observed when TBHP was
employed for the same catalyst. Product yields are also tabulated in Table
4.2; these are comparable for the three catalysts. However, yields for FePc
and CoPc levelled off after 24 hours of reaction due to degradation of
catalysts, unlike FePc(Cl)16 whose yields are tabulated in Table 4.1 after 4
weeks of reaction. This shows therefore that ring halogenation does indeed
stabilize biomimetic catalysts against oxidative degradation, rendering them
useful over extended periods.
Table 4.2: Product selectivities and yields (in par entheses) for oxidation of 1.6 mol dm -3
cyclohexene using 1.7 mg/mL FePcCl 16 9, FePc 8 and CoPc 6a as catalysts and 0.5 mol
dm -3 TBHP as an oxidant. Reaction time is 8 hours.
Product FePc(Cl)16 FePc(Cl)16a FePc CoPc
Cyclohexene oxide 7.8 (3.5) 57.7 3.8 (4.7) 5.5 (4.5)
2-Cyclohexen-1-ol 20.0 (9.1) 19.2 71.2 (26.0) 33.7 (8.9)
2-Cyclohexen-1-one 72.2 (32.7) 23.1 25.0 (27.1) 60.8 (46.1) a CPBA as an oxidant.
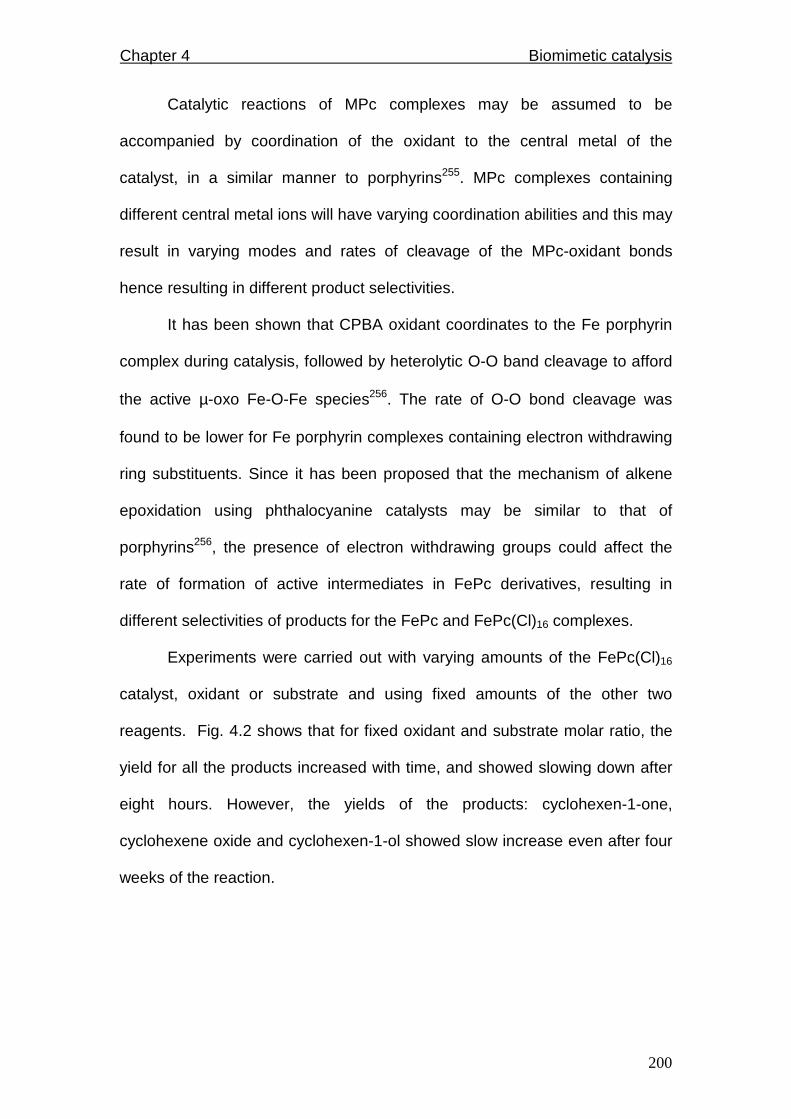
Chapter 4 Biomimetic catalysis
200
Catalytic reactions of MPc complexes may be assumed to be
accompanied by coordination of the oxidant to the central metal of the
catalyst, in a similar manner to porphyrins255. MPc complexes containing
different central metal ions will have varying coordination abilities and this may
result in varying modes and rates of cleavage of the MPc-oxidant bonds
hence resulting in different product selectivities.
It has been shown that CPBA oxidant coordinates to the Fe porphyrin
complex during catalysis, followed by heterolytic O-O band cleavage to afford
the active µ-oxo Fe-O-Fe species256. The rate of O-O bond cleavage was
found to be lower for Fe porphyrin complexes containing electron withdrawing
ring substituents. Since it has been proposed that the mechanism of alkene
epoxidation using phthalocyanine catalysts may be similar to that of
porphyrins256, the presence of electron withdrawing groups could affect the
rate of formation of active intermediates in FePc derivatives, resulting in
different selectivities of products for the FePc and FePc(Cl)16 complexes.
Experiments were carried out with varying amounts of the FePc(Cl)16
catalyst, oxidant or substrate and using fixed amounts of the other two
reagents. Fig. 4.2 shows that for fixed oxidant and substrate molar ratio, the
yield for all the products increased with time, and showed slowing down after
eight hours. However, the yields of the products: cyclohexen-1-one,
cyclohexene oxide and cyclohexen-1-ol showed slow increase even after four
weeks of the reaction.
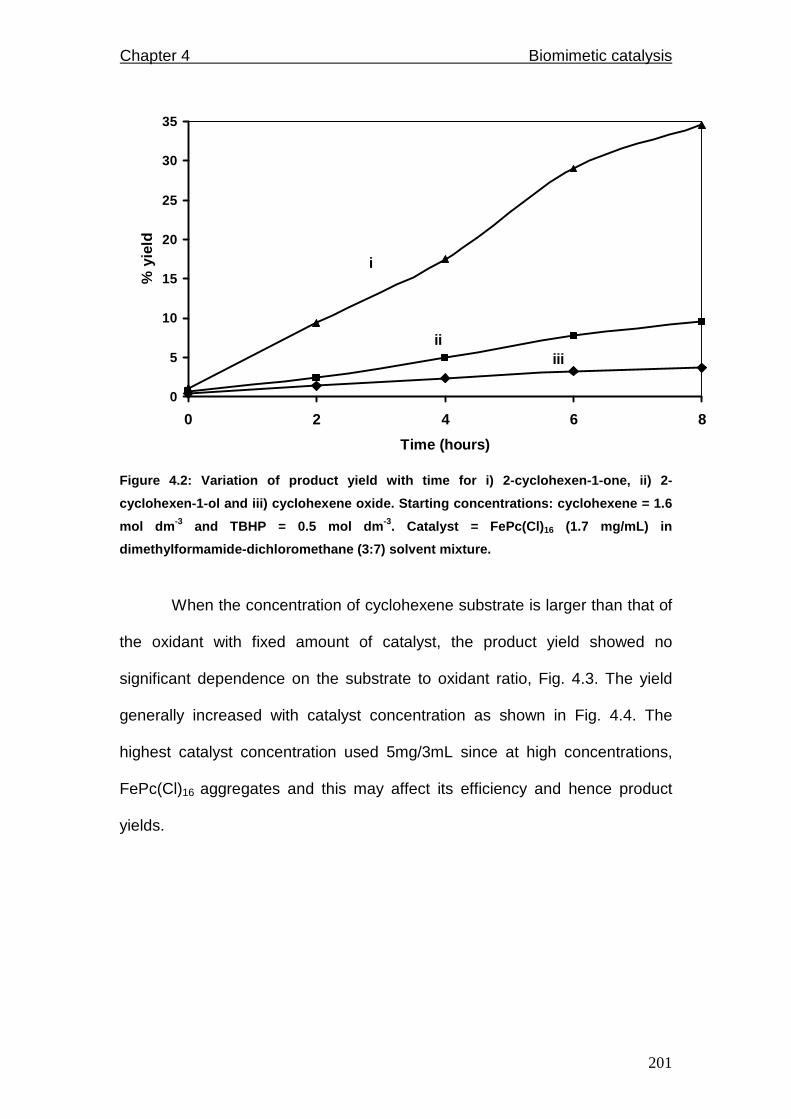
Chapter 4 Biomimetic catalysis
201
0
5
10
15
20
25
30
35
0 2 4 6 8
Time (hours)
% y
ield
i
iiiii
Figure 4.2: Variation of product yield with time fo r i) 2-cyclohexen-1-one, ii) 2-
cyclohexen-1-ol and iii) cyclohexene oxide. Startin g concentrations: cyclohexene = 1.6
mol dm -3 and TBHP = 0.5 mol dm -3. Catalyst = FePc(Cl) 16 (1.7 mg/mL) in
dimethylformamide-dichloromethane (3:7) solvent mix ture.
When the concentration of cyclohexene substrate is larger than that of
the oxidant with fixed amount of catalyst, the product yield showed no
significant dependence on the substrate to oxidant ratio, Fig. 4.3. The yield
generally increased with catalyst concentration as shown in Fig. 4.4. The
highest catalyst concentration used 5mg/3mL since at high concentrations,
FePc(Cl)16 aggregates and this may affect its efficiency and hence product
yields.
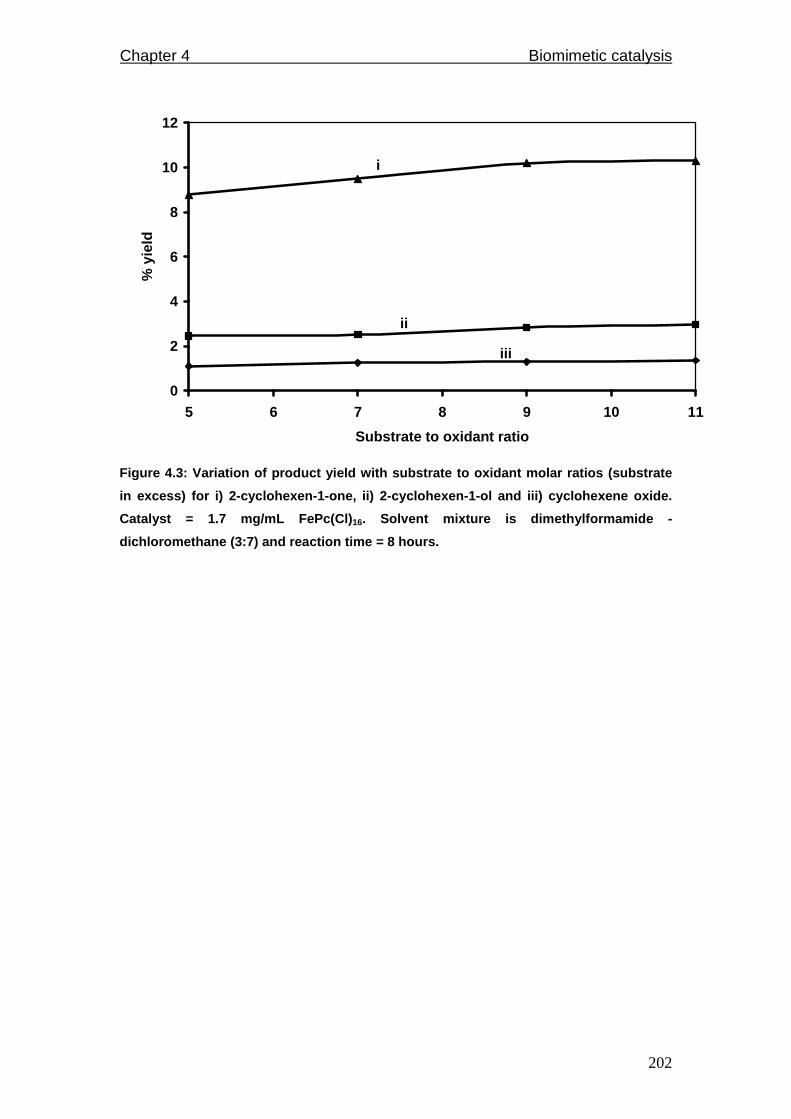
Chapter 4 Biomimetic catalysis
202
0
2
4
6
8
10
12
5 6 7 8 9 10 11
Substrate to oxidant ratio
% y
ield
i
ii
iii
Figure 4.3: Variation of product yield with substra te to oxidant molar ratios (substrate
in excess) for i) 2-cyclohexen-1-one, ii) 2-cyclohe xen-1-ol and iii) cyclohexene oxide.
Catalyst = 1.7 mg/mL FePc(Cl) 16. Solvent mixture is dimethylformamide -
dichloromethane (3:7) and reaction time = 8 hours.
Chapter 4 Biomimetic catalysis
203
0
5
10
15
20
25
30
35
1 2 3 4 5
Catalyst (mg/3ml)
% y
ield
i
ii
iii
Figure 4.4: Variation of product yield with the amo unt of catalyst for i) 2 cyclohexen-1-
one, ii) 2-cyclohexen-1-ol and iii) cyclohexene oxi de. Starting concentrations:
cyclohexene = 1.6 mol dm -3 and TBHP = 0.5 mol dm -3. Solvent mixture is
dimethylformamide-dichloromethane (3:7) and reactio n time = 8 hours.
When unsubstituted FePc or CoPc were employed as catalysts, the
products were formed within a very short time, but the product yield did not
increase significantly with time even after about four hours, Fig. 4.5.
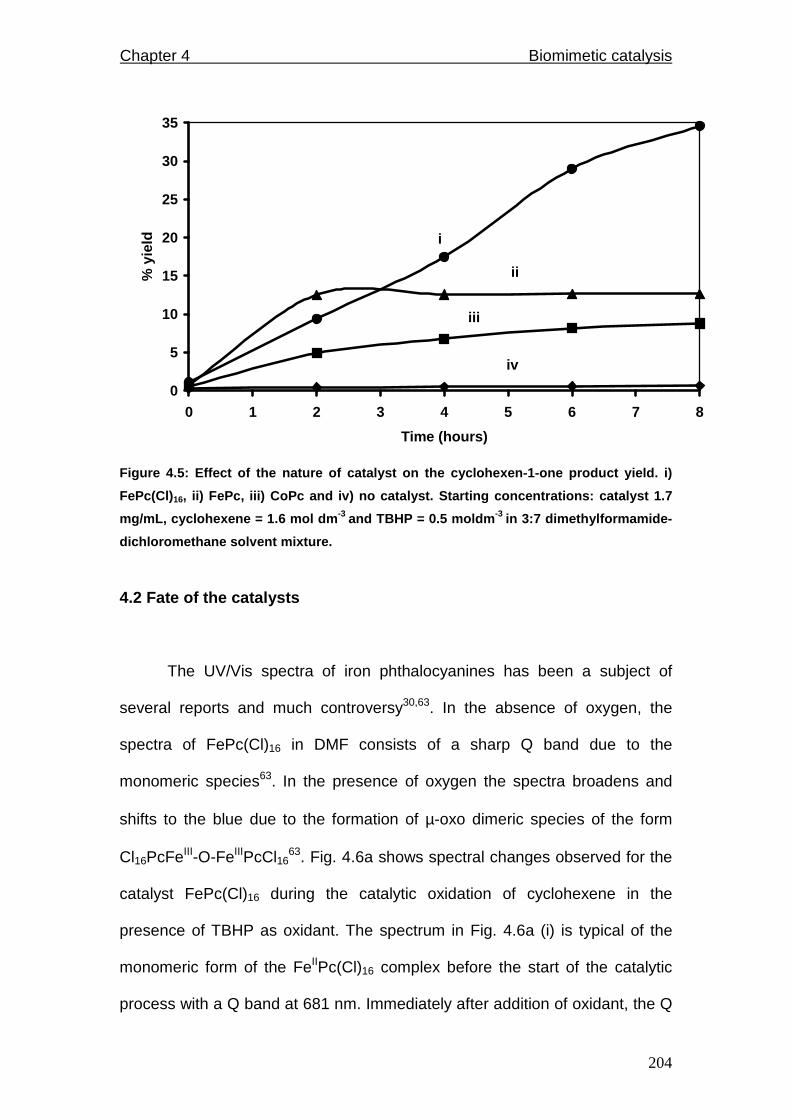
Chapter 4 Biomimetic catalysis
204
0
5
10
15
20
25
30
35
0 1 2 3 4 5 6 7 8
Time (hours)
% y
ield i
ii
iii
iv
Figure 4.5: Effect of the nature of catalyst on the cyclohexen-1-one product yield. i)
FePc(Cl) 16, ii) FePc, iii) CoPc and iv) no catalyst. Starting concentrations: catalyst 1.7
mg/mL, cyclohexene = 1.6 mol dm -3 and TBHP = 0.5 moldm -3 in 3:7 dimethylformamide-
dichloromethane solvent mixture.
4.2 Fate of the catalysts
The UV/Vis spectra of iron phthalocyanines has been a subject of
several reports and much controversy30,63. In the absence of oxygen, the
spectra of FePc(Cl)16 in DMF consists of a sharp Q band due to the
monomeric species63. In the presence of oxygen the spectra broadens and
shifts to the blue due to the formation of µ-oxo dimeric species of the form
Cl16PcFeIII-O-FeIIIPcCl1663. Fig. 4.6a shows spectral changes observed for the
catalyst FePc(Cl)16 during the catalytic oxidation of cyclohexene in the
presence of TBHP as oxidant. The spectrum in Fig. 4.6a (i) is typical of the
monomeric form of the FeIIPc(Cl)16 complex before the start of the catalytic
process with a Q band at 681 nm. Immediately after addition of oxidant, the Q
Chapter 4 Biomimetic catalysis
205
band decreased in intensity and it became split (Fig. 4.6a (ii)). The split
components were observed at 648 and 678 nm. The split in the Q band is
typical of the oxidation of FeIIPc to FeIIIPc species25. Thus spectral changes
shown in Fig. 4.6a are consistent with the oxidation of the FeIIPc(Cl)16 and the
formation of the FeIIIPc(Cl)16 species.
Following the split of the Q band, the 678 nm band decreased in
intensity and finally disappeared as the catalytic process proceeded, Fig. 4.6b.
The 648 nm band on the other hand gradually shifted to lower wavelengths
and after about eight hours, this band was observed at 636 nm, Fig. 4.6b (ii).
Oxidants such as iodosobenzene are known to convert FeIIPc species to the
µ-oxo species, PcFeIII-O-FeIIIPc30, which is characterized by a low intensity
broad Q band at ~ 630 nm. Thus the final spectrum in Fig. 4.6b (ii) is typical of
the µ-oxo species, confirming that the final form of the catalyst following the
oxidation of cyclohexene using TBHP oxidant, is the Cl16PcFeIII-O-FeIIIPcCl16
species. The oxidation is probably accompanied by some degradation of the
catalyst as judged by the decrease in the Q band intensity, though the PcFeIII-
O-FeIIIPc species typically show a weak Q band.

Chapter 4 Biomimetic catalysis
206
0
0.2
0.4
0.6
0.8
1
1.2
1.4
1.6
350 450 550 650 750
Wavelength (nm)
Abs
orba
nce
i
ii
a
648 678
681
0
0.2
0.4
0.6
0.8
1
1.2
1.4
1.6
300 350 400 450 500 550 600 650 700 750 800
Wavelength (nm)
Abs
orba
nce i
ii
b
636
678648
Figure 4.6: Absorption spectral changes observed on addition of 0.5 moldm -3 TBHP
oxidant to a reaction mixture containing 1.7 mg/mL FePc(Cl) 16 catalyst and 1.6 mol dm -3
cyclohexene. For spectral measurements, the solutio n made of these reagents was
diluted a hundred fold. (a) i) before addition and ii) immediately after addition of TBHP
to catalyst-substrate mixture. (b) i) same as spect rum (ii) in Fig 4.6a and (ii) spectrum
eight hours after addition of TBHP to catalyst/subs trate mixture.

Chapter 4 Biomimetic catalysis
207
The catalyst was still present even after four weeks of catalysis, with
the yields of the products still increasing. The solution turned from blue to
brown, even though the 636 nm band was still present after four weeks of
catalysis. When CPBA was employed as an oxidant for cyclohexene oxidation
using FeIIPc(Cl)16 catalyst, fast degradation of the catalyst was observed, with
the final formation of a weak high energy band at 636 nm, Fig. 4.7, hence
confirming the formation the µ-oxo species as was the case with TBHP.
However complete disappearance of 636 nm band was observed within two
hours when CPBA was employed as an oxidant, showing that this oxidant
degrades the phthalocyanine molecule more readily than TBHP.
0
0.2
0.4
0.6
0.8
1
1.2
1.4
1.6
300 350 400 450 500 550 600 650 700 750 800
Wavelength (nm)
Abs
orba
nce
i
ii
681
636
Figure 4.7: Absorption spectral changes observed on addition of 0.5 moldm -3 CPBA
oxidant to a reaction mixture containing 1.7 mg/mL FePc(Cl) 16 catalyst and 1.6 mol dm -3
cyclohexene. For spectral measurements, the soluti on made of these reagents was
diluted a hundred fold. i) before addition and ii) immediately after addition of CPBA to
catalyst-substrate mixture.

Chapter 4 Biomimetic catalysis
208
Oxidation of cyclohexane using the FePc(Cl)16 catalyst and chloro-
peroxybenzoic acid oxidant196, showed different spectral features from those
reported here in that the µ-oxo dimer was not formed, only the FeIIIPc species
was observed. Thus the formation of the µ-oxo species following oxidation of
FeIIPc species may be determined by both the nature of the substrate and the
oxidant.
The CoPc and FePc catalysts were readily deactivated, with the
solutions changing from blue to brown in a very short time (within two hours).
For FePc catalyzed-cyclohexene oxidation, the Q band of FePc at 660 nm
shifted to 675 nm on addition of TBHP oxidant, consistent with the formation
of the FeIIIPc species (Fig. 4.8a). However the latter degraded very fast,
based on the abrupt decrease in peak intensity. For the CoPc catalyst, an
initial shift of the Q band from 660 nm to 670 nm, typical of oxidation of CoIIPc
to CoIIIPc25 was observed (Fig. 4.8b). Thereafter, total disappearance of the Q
band within an hour was observed. Thus for both CoPc and FePc, the MIIIPc
species are implicated in the catalytic process. However both of these
catalysts are readily degraded and hence the unsubstituted CoPc and FePc
catalysts are not efficient for the catalytic oxidation of cyclohexene. This
therefore shows that ring substitution with electron-withdrawing ligands indeed
enhances metallophthalocyanine stability against oxidative degradation.

Chapter 4 Biomimetic catalysis
209
0
0.1
0.2
0.3
0.4
0.5
0.6
300 400 500 600 700 800
Wavelength (nm)
Abs
orba
nce
660
675
335
i
ii
a
0.1
0.25
0.4
0.55
0.7
0.85
1
300 400 500 600 700 800
Wavelength (nm)
Abs
orba
nce 330
340
660
670
i
ii
b
Figure 4.8: Absorption spectral changes observed on addition of 0.5 moldm -3 TBHP
oxidant to a reaction mixture of 1.7 mg/mL a) FePc and b) CoPc catalysts and 1.6 mol
dm -3 cyclohexene. For spectral measurements, the solutio n made of these reagents
was diluted a hundred fold. i) before addition and ii) immediately after addition of TBHP
to catalyst-substrate mixture.
Chapter 4 Biomimetic catalysis
210
Spectral changes shown in Fig. 4.6 suggest the following mechanism
for the FeIIPc(Cl)16 catalyst, Scheme 4.1:
FeIIPc(Cl)16 + ROOH →••− ROROO , FeIIIPc(Cl)16 4.1
FeIIIPc(Cl)16 →ROOH Cl16PcFeIII-O-FeIIIPcCl16 4.2
Scheme 4.1. The mechanism for Fe IIPc(Cl) 16 transformation during the catalytic
oxidation of cyclohexene. ROOH represents oxidan ts, TBHP or CPBA.
It is expected that ROO• and RO• radicals will be formed, since these
have been suggested as the species involved in the catalytic processes
involving phthalocyanines and porphyrins257. When a radical scavenger
diazabicyclooctane (DABCO) was added to the reaction mixture, there was a
decrease in product yield, confirming the involvement of radicals in the
mechanism for the catalytic oxidation of cyclohexene. It has also been shown
that when FeIIIPc is employed as a catalyst, with iodosylbenzene as an
oxidant, an O=FeIVPc species is an intemediate in the epoxidation of
alkenes206. However there is no spectroscopic evidence for the formation of
an O=FeIVPc intermediate in this work.
Product formation for the transformation of cyclohexene in the
presence of FePc(Cl)16 and TBHP (or CPBA) oxidant may be represented by
Scheme 4.2 as follows:
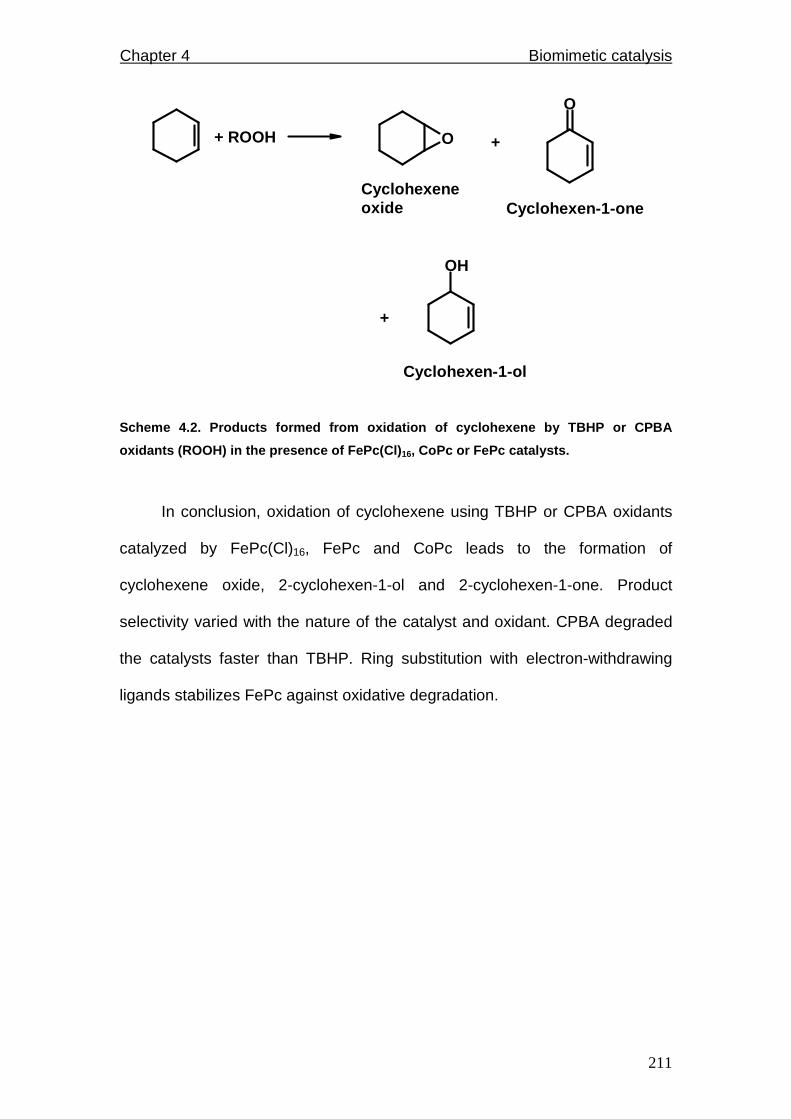
Chapter 4 Biomimetic catalysis
211
O
O
OH
+ ROOH +
+
Cyclohexeneoxide Cyclohexen-1-one
Cyclohexen-1-ol
Scheme 4.2. Products formed from oxidation of cyclo hexene by TBHP or CPBA
oxidants (ROOH) in the presence of FePc(Cl) 16, CoPc or FePc catalysts.
In conclusion, oxidation of cyclohexene using TBHP or CPBA oxidants
catalyzed by FePc(Cl)16, FePc and CoPc leads to the formation of
cyclohexene oxide, 2-cyclohexen-1-ol and 2-cyclohexen-1-one. Product
selectivity varied with the nature of the catalyst and oxidant. CPBA degraded
the catalysts faster than TBHP. Ring substitution with electron-withdrawing
ligands stabilizes FePc against oxidative degradation.
Chapter 5
Photocatalysis
In this section, an account of results obtained from zinc phthalocyanine (ZnPc)
photo-catalyzed oxidation of cyclohexene is outlined.
Chapter 5 Photocatalysis
213
This work has been published as;
Nthapo Sehlotho and Tebello Nyokong
Zinc phthalocyanine photocatalyzed oxidation of cyclohexene
J. Mol. Cat. A: Chem., 219 (2004) 201- 207.
Chapter 5 Photocatalysis
214
5.1 Photo-oxidation of cyclohexene
ZnPc was employed as a photocatalyst for cyclohexene oxidation
because the central metal Zn is diamagnetic and its excited singlet state is
known to undergo intersystem crossing to the triplet state readily, where it can
transfer its energy to oxygen generating sufficient catalytic singlet oxygen.
Singlet oxygen quantum yields (φ∆) of ZnPc are high, for instance φ∆ has been
reported to be ~ 0.6 in DMF215. Experiments were done using white and
visible light in the presence and absence of ZnPc catalyst, to probe the
efficiency of ZnPc as a photocatalyst. Light of different wavelengths and
intensities was used to investigate their effect on the photocatalytic efficiency
of the system towards cyclohexene oxidation.
Experiments were conducted in a number of solvents, namely 1,4-
dioxane, THF, benzene and 3:7 DMF-CH2Cl2 mixture. Criteria of solvent
choice was as follows: For 1,4-dioxane, THF and benzene, photochemical
and fluorescenece studies of ZnPc and its derivatives have been studied
before51,57. They were found to be photostable in these solvents, and hence it
was interesting to explore their photocatalytic behaviour. ZnPc is very soluble
in the 3:7 DMF-CH2Cl2 solvent mixture. Moreover, this solvent mixture has
been employed in biomimetic oxidation of cyclohexene, thus this forms a
basis for comparison of catalytic efficiency towards cyclohexene oxidation
using different methods but the same solvent system.
Fig. 5.1 shows a gas chromatogram under white light irradiation of
cyclohexene oxidation reaction catalyzed by ZnPc in 1,4-dioxane. Products
were identified to be cyclohexene oxide a, 2-cyclohexen-1-ol b, 2-cyclohexen-
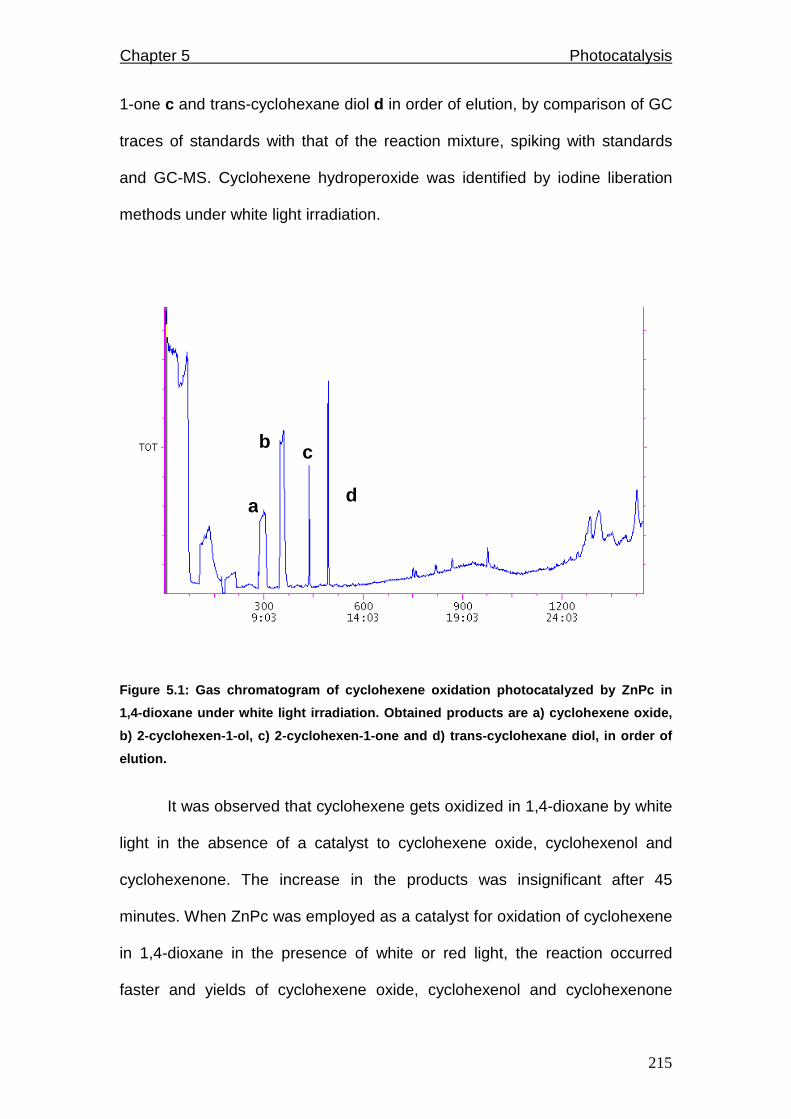
Chapter 5 Photocatalysis
215
a
c b
d
1-one c and trans-cyclohexane diol d in order of elution, by comparison of GC
traces of standards with that of the reaction mixture, spiking with standards
and GC-MS. Cyclohexene hydroperoxide was identified by iodine liberation
methods under white light irradiation.
Figure 5.1: Gas chromatogram of cyclohexene oxidati on photocatalyzed by ZnPc in
1,4-dioxane under white light irradiation. Obtained products are a) cyclohexene oxide,
b) 2-cyclohexen-1-ol, c) 2-cyclohexen-1-one and d) trans-cyclohexane diol, in order of
elution.
It was observed that cyclohexene gets oxidized in 1,4-dioxane by white
light in the absence of a catalyst to cyclohexene oxide, cyclohexenol and
cyclohexenone. The increase in the products was insignificant after 45
minutes. When ZnPc was employed as a catalyst for oxidation of cyclohexene
in 1,4-dioxane in the presence of white or red light, the reaction occurred
faster and yields of cyclohexene oxide, cyclohexenol and cyclohexenone
Chapter 5 Photocatalysis
216
increased compared to in the absence of ZnPc. This proves that ZnPc is
indeed a photocatalyst. Data reported in this work is therefore corrected for
cyclohexene oxidation in the absence of ZnPc catalyst. In the presence of the
catalyst following white light irradiation, trans-cyclohexane diol and
cyclohexene hydroperoxide were observed in addition to cyclohexene oxide,
cyclohexenol and cyclohexenone, which are observed in the absence of the
catalyst. Thus the presence of the catalyst results in the formation of a wider
range of products.
It should be mentioned that the same oxidation products were obtained
with red light irradiation except cyclohexene hydroperoxide, even though the
product yields were higher with white light irradiation than with red light. Fig.
5.2 shows an increase in % yields of 2-cyclohexen-1-one over time with white
(i) and red (ii) light. White light irradiation exhibits higher % yields than red
light irradiation. The products formed using ZnPc as a photocatalyst are
similar to those formed during the photo-oxygenation of cyclohexene in the
presence of titanium (IV) porphyrins except that trans-cyclohexanediol was
not obtained using the latter catalyst219.
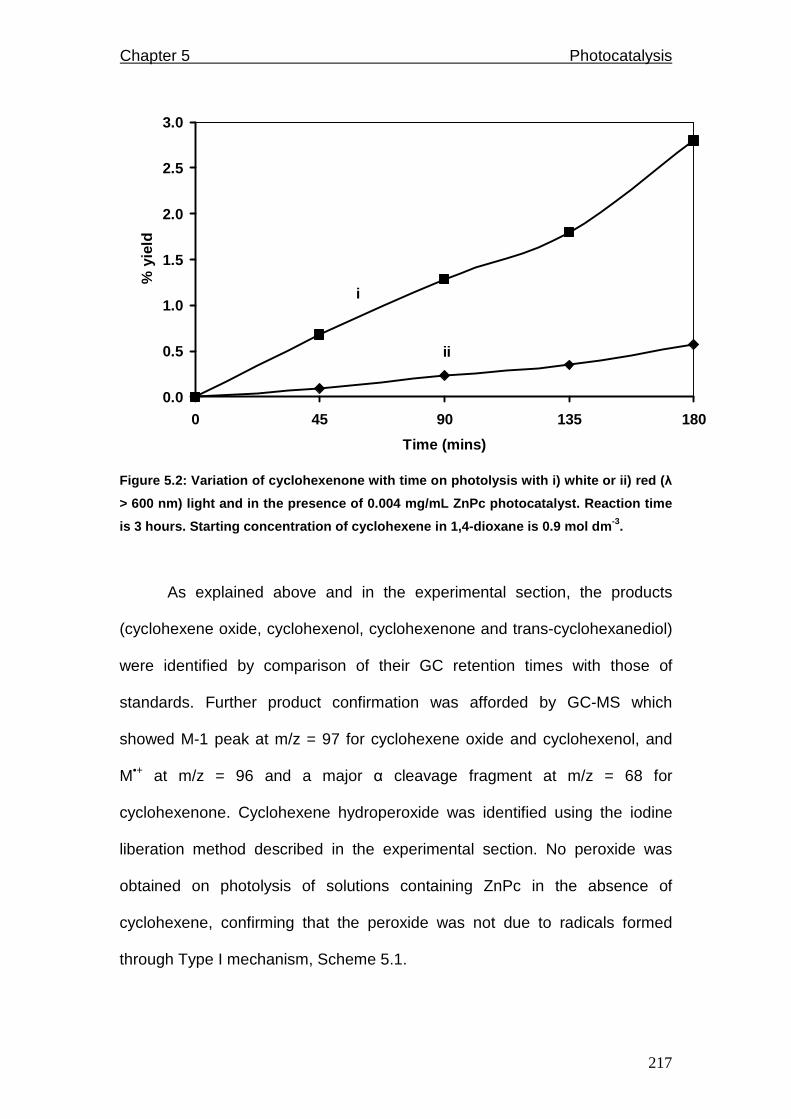
Chapter 5 Photocatalysis
217
0.0
0.5
1.0
1.5
2.0
2.5
3.0
0 45 90 135 180
Time (mins)
% y
ield
i
ii
Figure 5.2: Variation of cyclohexenone with time on photolysis with i) white or ii) red ( λ
> 600 nm) light and in the presence of 0.004 mg/mL ZnPc photocatalyst. Reaction time
is 3 hours. Starting concentration of cyclohexene i n 1,4-dioxane is 0.9 mol dm -3.
As explained above and in the experimental section, the products
(cyclohexene oxide, cyclohexenol, cyclohexenone and trans-cyclohexanediol)
were identified by comparison of their GC retention times with those of
standards. Further product confirmation was afforded by GC-MS which
showed M-1 peak at m/z = 97 for cyclohexene oxide and cyclohexenol, and
M•+ at m/z = 96 and a major α cleavage fragment at m/z = 68 for
cyclohexenone. Cyclohexene hydroperoxide was identified using the iodine
liberation method described in the experimental section. No peroxide was
obtained on photolysis of solutions containing ZnPc in the absence of
cyclohexene, confirming that the peroxide was not due to radicals formed
through Type I mechanism, Scheme 5.1.
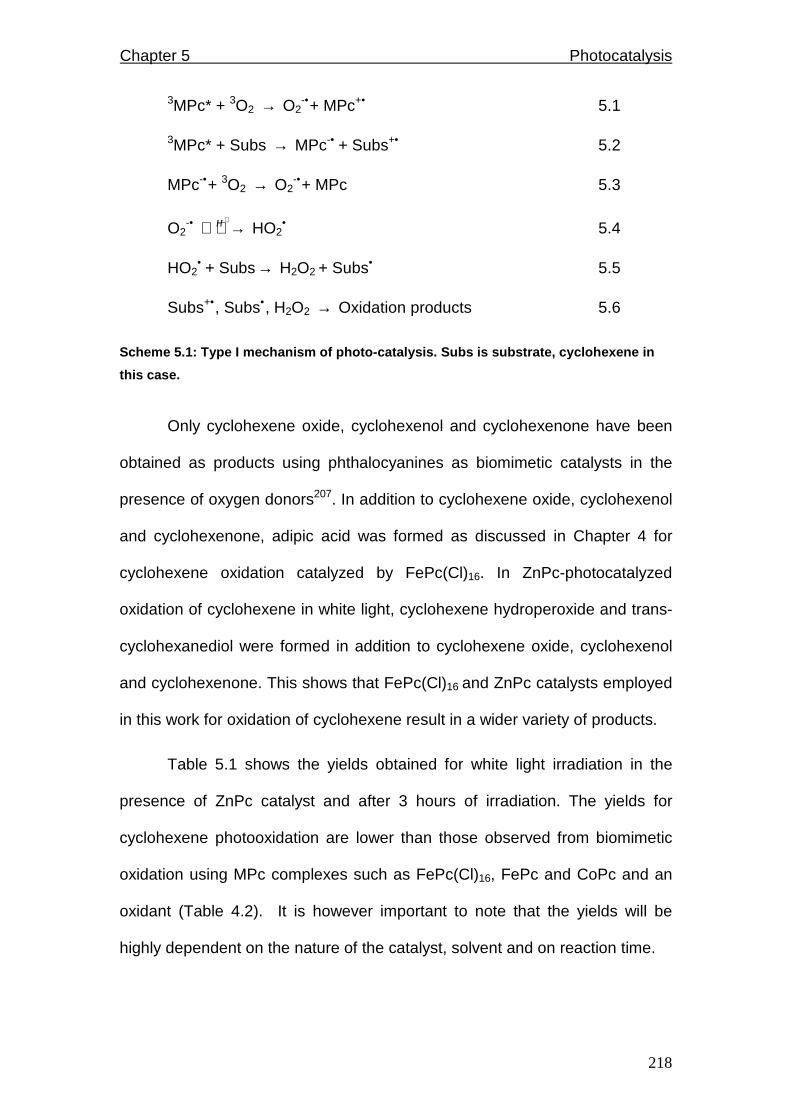
Chapter 5 Photocatalysis
218
3MPc* + 3O2 → O2-•+ MPc+• 5.1
3MPc* + Subs → MPc-• + Subs+• 5.2
MPc-•+ 3O2 → O2-•+ MPc 5.3
O2-• →
+H HO2• 5.4
HO2• + Subs→ H2O2 + Subs• 5.5
Subs+•, Subs•, H2O2 → Oxidation products 5.6
Scheme 5.1: Type I mechanism of photo-catalysis. Su bs is substrate, cyclohexene in
this case.
Only cyclohexene oxide, cyclohexenol and cyclohexenone have been
obtained as products using phthalocyanines as biomimetic catalysts in the
presence of oxygen donors207. In addition to cyclohexene oxide, cyclohexenol
and cyclohexenone, adipic acid was formed as discussed in Chapter 4 for
cyclohexene oxidation catalyzed by FePc(Cl)16. In ZnPc-photocatalyzed
oxidation of cyclohexene in white light, cyclohexene hydroperoxide and trans-
cyclohexanediol were formed in addition to cyclohexene oxide, cyclohexenol
and cyclohexenone. This shows that FePc(Cl)16 and ZnPc catalysts employed
in this work for oxidation of cyclohexene result in a wider variety of products.
Table 5.1 shows the yields obtained for white light irradiation in the
presence of ZnPc catalyst and after 3 hours of irradiation. The yields for
cyclohexene photooxidation are lower than those observed from biomimetic
oxidation using MPc complexes such as FePc(Cl)16, FePc and CoPc and an
oxidant (Table 4.2). It is however important to note that the yields will be
highly dependent on the nature of the catalyst, solvent and on reaction time.
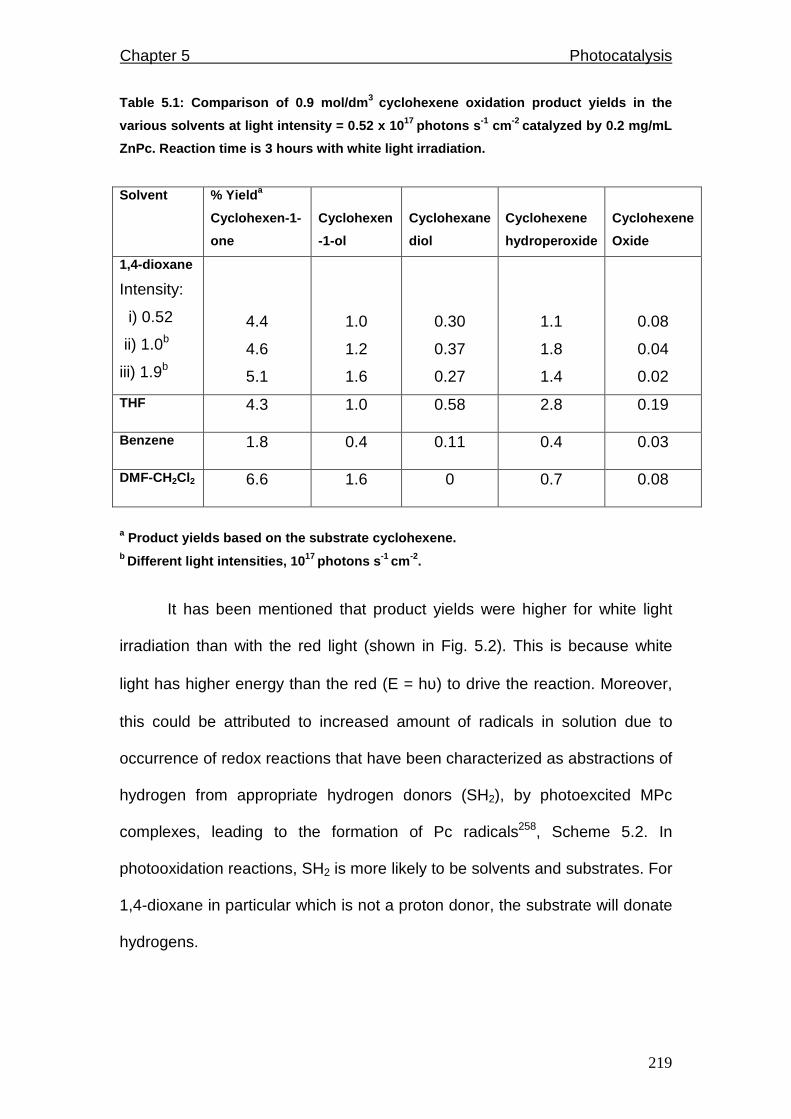
Chapter 5 Photocatalysis
219
Table 5.1: Comparison of 0.9 mol/dm 3 cyclohexene oxidation product yields in the
various solvents at light intensity = 0.52 x 10 17 photons s -1 cm -2 catalyzed by 0.2 mg/mL
ZnPc. Reaction time is 3 hours with white light irr adiation.
Solvent % Yield a
Cyclohexen-1-
one
Cyclohexen
-1-ol
Cyclohexane
diol
Cyclohexene
hydroperoxide
Cyclohexene
Oxide
1,4-dioxane
Intensity:
i) 0.52
ii) 1.0b
iii) 1.9b
4.4
4.6
5.1
1.0
1.2
1.6
0.30
0.37
0.27
1.1
1.8
1.4
0.08
0.04
0.02
THF 4.3 1.0 0.58 2.8 0.19
Benzene 1.8 0.4 0.11 0.4 0.03
DMF-CH2Cl2 6.6 1.6 0 0.7 0.08
a Product yields based on the substrate cyclohexene. b Different light intensities, 10 17 photons s -1 cm -2.
It has been mentioned that product yields were higher for white light
irradiation than with the red light (shown in Fig. 5.2). This is because white
light has higher energy than the red (E = hυ) to drive the reaction. Moreover,
this could be attributed to increased amount of radicals in solution due to
occurrence of redox reactions that have been characterized as abstractions of
hydrogen from appropriate hydrogen donors (SH2), by photoexcited MPc
complexes, leading to the formation of Pc radicals258, Scheme 5.2. In
photooxidation reactions, SH2 is more likely to be solvents and substrates. For
1,4-dioxane in particular which is not a proton donor, the substrate will donate
hydrogens.

Chapter 5 Photocatalysis
220
MPc → νh *MPc 5.7
*MPc → 2SH MPc-H• + SH• 5.8
Scheme 5.2. Hydrogen abstraction and formation of M Pc radicals.
Fig. 5.3 compares the yields formed with time for the various products.
The highest yields were obtained for cyclohexenone (Table 5.1). The following
trend in product yield based on the substrate (cyclohexene) was obtained:
Cyclohexenone > cyclohexene hydroperoxide > cyclohexenol > trans-
cyclohexane diol > cyclohexene oxide.
The high yields of cyclohexenone compared to cyclohexenol could be
due to the fact that the latter is known to phototransform to the former218.
Thus, once cyclohexenol has been produced by photolysis, it will be
transformed to cyclohexenone with time. This was investigated by photolyzing
cyclohexenol alone; indeed it was oxidized to cyclohexenone. It is thus
possible that both cyclohexenone and cyclohexenol are generated from the
parent cyclohexene, but in addition, cyclohexenol is converted to
cyclohexenone as photolysis proceeds, hence the much higher yields of the
ketone relative to that of the alcohol.

Chapter 5 Photocatalysis
221
0
1
2
3
4
5
6
0 45 90 135 180
Time (mins)
% y
ield
i
ii
iiiiv
Figure 5.3: Variation of product yield with time fo r i) 2-cyclohexen-1-one ii) 2-
cyclohexen-1-ol iii) trans-cyclohexanediol and iv) cyclohexene oxide under whi te light
irradiation of 0.52 x 10 17 photons/s.cm 2. Starting concentrations in 1,4-dioxane;
cyclohexene = 0.9 mol dm -3 and ZnPc catalyst = 0.3 mg/mL.
It was observed that reactions continued in the dark following
irradiation of solutions containing cyclohexene and ZnPc. It was also observed
that product yields improved with increasing light intensity (Table 5.1) even
though catalyst degradation was enhanced as will be discussed below. These
two observations suggest that once reaction intermediates are formed upon
interaction of singlet oxygen or radicals with the substrate, the reaction can
still proceed in the dark in the presence or absence of the original form of the
catalyst. Cyclohexene did not form products in the dark in the absence of the
catalyst.

Chapter 5 Photocatalysis
222
5.2. Solvent effects
Studies using porphyrin catalysts have shown that the nature and
relative yields of products formed by catalytic photo-oxygenation of
cyclohexene vary depending on the type of catalyst, oxidant, solvent,
irradiation wavelength, irradiation period and light intensity217,220. The products
obtained in this work for the ZnPc photocatalyzed oxidation of cyclohexene in
1,4-dioxane were similar to those obtained in THF and benzene, except lower
yields on average were obtained for benzene (Table 5.1). When the 3:7
solvent mixture of DMF and CH2Cl2 was employed for the photo catalytic
reaction, the yields of cyclohexene oxide, cyclohexenol and cyclohexenone
were generally higher than for benzene and 1,4-dioxane (Table 5.1).
Chlorinated solvents are known to quench triplet states259 of porphyrins
and phthalocyanines according to Scheme 5.3, eq. 5.9260,261, hindering
generation of singlet oxygen. However photo-oxidation still occurred in the
presence of dichloromethane, suggesting that it is not only singlet oxygen
which is involved in the generation of products from cyclohexene, but that the
radical mechanism is also important as will be discussed below.
Pc* + RCl → Pc•+ + R• + Cl 5.9
Pc•+ + R• + Cl + Substrate → Oxidation products 5.10
where RCl is the chlorinated solvent.
Scheme 5.3. Quenching of excited states by chlorina ted solvents.
As mentioned earlier, catalytic activity was lower in benzene,
compared to other solvents, THF and 1,4-dioxane. It would be expected that
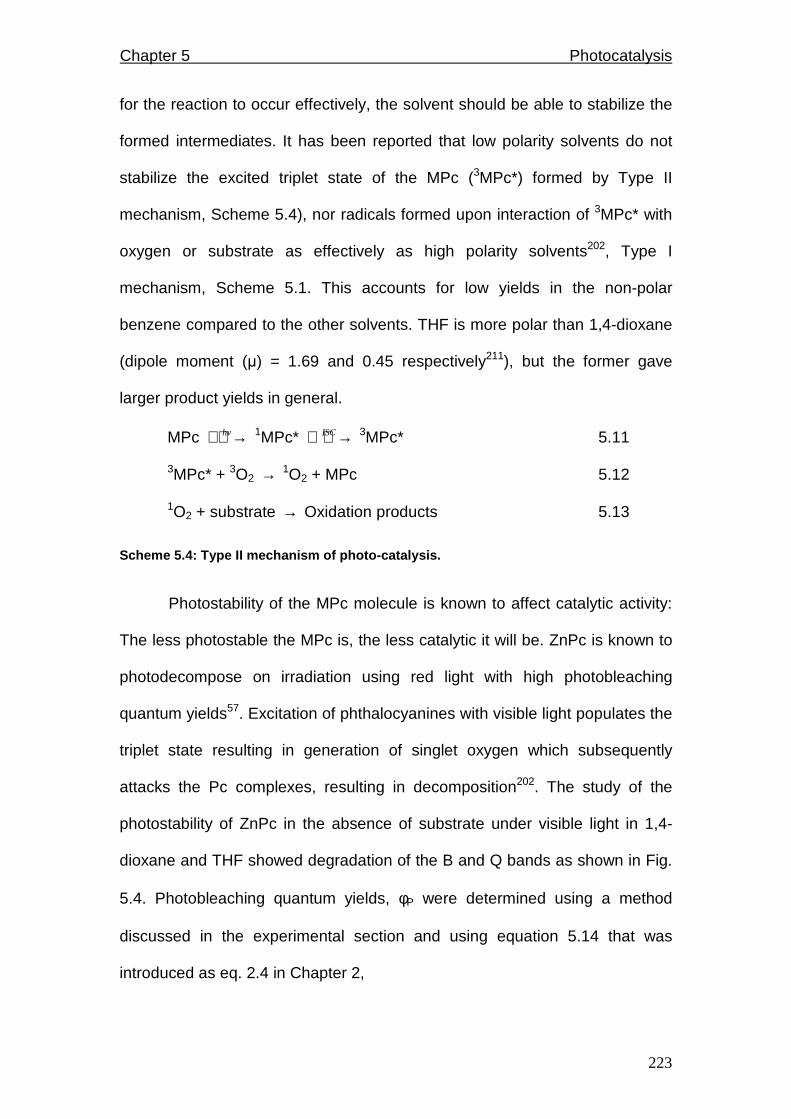
Chapter 5 Photocatalysis
223
for the reaction to occur effectively, the solvent should be able to stabilize the
formed intermediates. It has been reported that low polarity solvents do not
stabilize the excited triplet state of the MPc (3MPc*) formed by Type II
mechanism, Scheme 5.4), nor radicals formed upon interaction of 3MPc* with
oxygen or substrate as effectively as high polarity solvents202, Type I
mechanism, Scheme 5.1. This accounts for low yields in the non-polar
benzene compared to the other solvents. THF is more polar than 1,4-dioxane
(dipole moment (µ) = 1.69 and 0.45 respectively211), but the former gave
larger product yields in general.
MPc →hv 1MPc* →ISC 3MPc* 5.11
3MPc* + 3O2 → 1O2 + MPc 5.12
1O2 + substrate → Oxidation products 5.13
Scheme 5.4: Type II mechanism of photo-catalysis.
Photostability of the MPc molecule is known to affect catalytic activity:
The less photostable the MPc is, the less catalytic it will be. ZnPc is known to
photodecompose on irradiation using red light with high photobleaching
quantum yields57. Excitation of phthalocyanines with visible light populates the
triplet state resulting in generation of singlet oxygen which subsequently
attacks the Pc complexes, resulting in decomposition202. The study of the
photostability of ZnPc in the absence of substrate under visible light in 1,4-
dioxane and THF showed degradation of the B and Q bands as shown in Fig.
5.4. Photobleaching quantum yields, φP were determined using a method
discussed in the experimental section and using equation 5.14 that was
introduced as eq. 2.4 in Chapter 2,
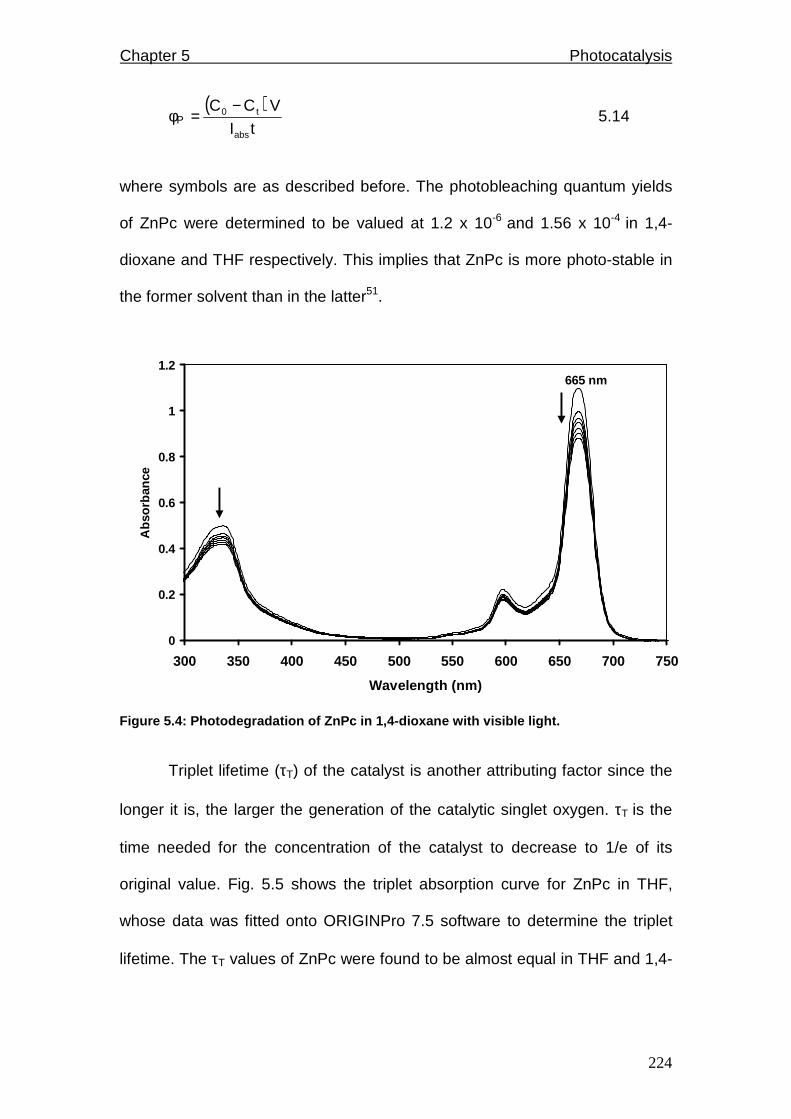
Chapter 5 Photocatalysis
224
φP ( )
tI
VCC
abs
t0 −= 5.14
where symbols are as described before. The photobleaching quantum yields
of ZnPc were determined to be valued at 1.2 x 10⁻⁶ and 1.56 x 10⁻⁴ in 1,4-
dioxane and THF respectively. This implies that ZnPc is more photo-stable in
the former solvent than in the latter51.
0
0.2
0.4
0.6
0.8
1
1.2
300 350 400 450 500 550 600 650 700 750
Wavelength (nm)
Abs
orba
nce
665 nm
Figure 5.4: Photodegradation of ZnPc in 1,4-dioxane with visible light.
Triplet lifetime (τT) of the catalyst is another attributing factor since the
longer it is, the larger the generation of the catalytic singlet oxygen. τT is the
time needed for the concentration of the catalyst to decrease to 1/e of its
original value. Fig. 5.5 shows the triplet absorption curve for ZnPc in THF,
whose data was fitted onto ORIGINPro 7.5 software to determine the triplet
lifetime. The τT values of ZnPc were found to be almost equal in THF and 1,4-

Chapter 5 Photocatalysis
225
dioxane, i.e. 240 µs, hence explaining the almost similar product yields in
some cases in these solvents.
0
0.002
0.004
0.006
0.008
0.01
0 0.0002 0.0004 0.0006 0.0008 0.001 0.0012
Time (s)
Cha
nge
in a
bsor
banc
e
Figure 5.5: A triplet absorption curve of ZnPc in T HF.
5.3. Fate of the ZnPc catalyst
The fate of the ZnPc catalyst during the photocatalysis of cyclohexene
oxidation in 1,4-dioxane was monitored by UV/Vis spectroscopy. The ZnPc
complex tended to decompose as photolysis progressed. This was evidenced
by the decrease in the intensities of both the Q and Soret bands, with both red
and white light irradiation, similar to changes shown in Fig. 5.4. However, the
degradation was more pronounced with white light when compared with red
light.
The rate of decomposition of the catalyst depended on light intensity
as shown by Fig. 5.6. For low light intensity, the decomposition was minimal,
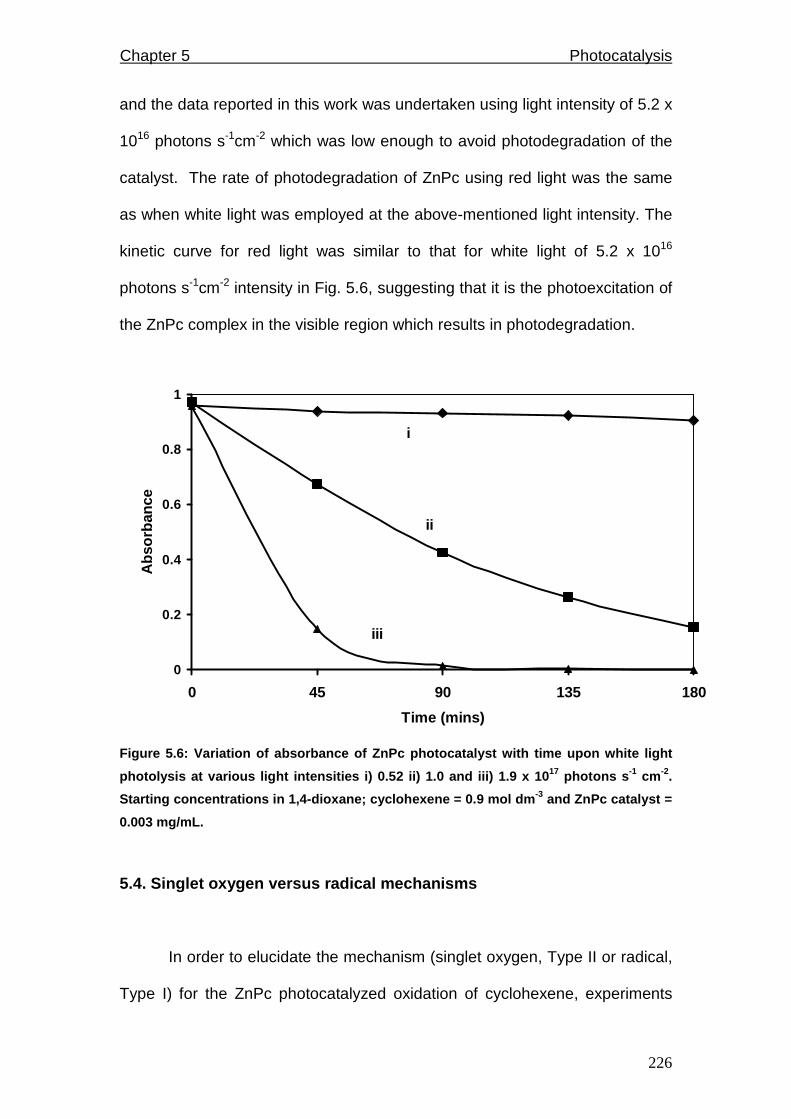
Chapter 5 Photocatalysis
226
and the data reported in this work was undertaken using light intensity of 5.2 x
1016 photons s-1cm-2 which was low enough to avoid photodegradation of the
catalyst. The rate of photodegradation of ZnPc using red light was the same
as when white light was employed at the above-mentioned light intensity. The
kinetic curve for red light was similar to that for white light of 5.2 x 10¹⁶
photons s-1cm-2 intensity in Fig. 5.6, suggesting that it is the photoexcitation of
the ZnPc complex in the visible region which results in photodegradation.
0
0.2
0.4
0.6
0.8
1
0 45 90 135 180
Time (mins)
Abs
orba
nce
i
ii
iii
Figure 5.6: Variation of absorbance of ZnPc photoca talyst with time upon white light
photolysis at various light intensities i) 0.52 ii) 1.0 and iii) 1.9 x 10 17 photons s -1 cm -2.
Starting concentrations in 1,4-dioxane; cyclohexene = 0.9 mol dm -3 and ZnPc catalyst =
0.003 mg/mL.
5.4. Singlet oxygen versus radical mechanisms
In order to elucidate the mechanism (singlet oxygen, Type II or radical,
Type I) for the ZnPc photocatalyzed oxidation of cyclohexene, experiments
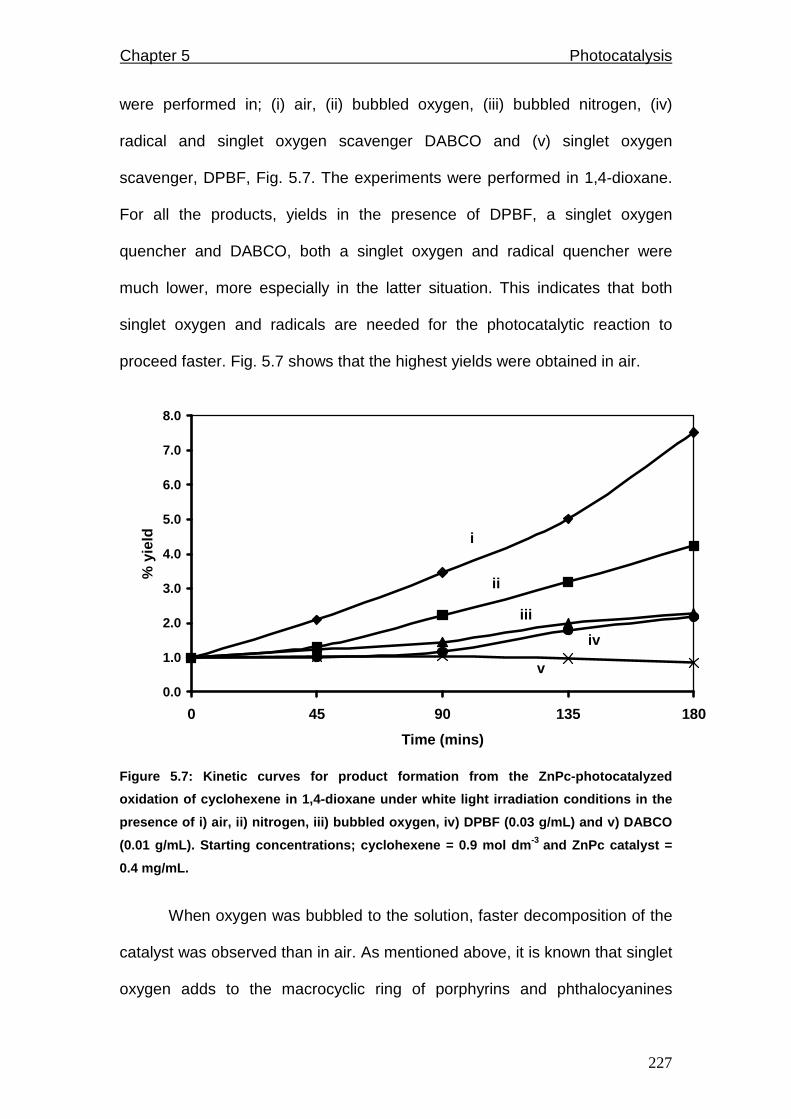
Chapter 5 Photocatalysis
227
were performed in; (i) air, (ii) bubbled oxygen, (iii) bubbled nitrogen, (iv)
radical and singlet oxygen scavenger DABCO and (v) singlet oxygen
scavenger, DPBF, Fig. 5.7. The experiments were performed in 1,4-dioxane.
For all the products, yields in the presence of DPBF, a singlet oxygen
quencher and DABCO, both a singlet oxygen and radical quencher were
much lower, more especially in the latter situation. This indicates that both
singlet oxygen and radicals are needed for the photocatalytic reaction to
proceed faster. Fig. 5.7 shows that the highest yields were obtained in air.
0.0
1.0
2.0
3.0
4.0
5.0
6.0
7.0
8.0
0 45 90 135 180
Time (mins)
% y
ield i
ii
iii
iv
v
Figure 5.7: Kinetic curves for product formation fr om the ZnPc-photocatalyzed
oxidation of cyclohexene in 1,4-dioxane under white light irradiation conditions in the
presence of i) air, ii) nitrogen, iii) bubbled oxyg en, iv) DPBF (0.03 g/mL) and v) DABCO
(0.01 g/mL). Starting concentrations; cyclohexene = 0.9 mol dm -3 and ZnPc catalyst =
0.4 mg/mL.
When oxygen was bubbled to the solution, faster decomposition of the
catalyst was observed than in air. As mentioned above, it is known that singlet
oxygen adds to the macrocyclic ring of porphyrins and phthalocyanines
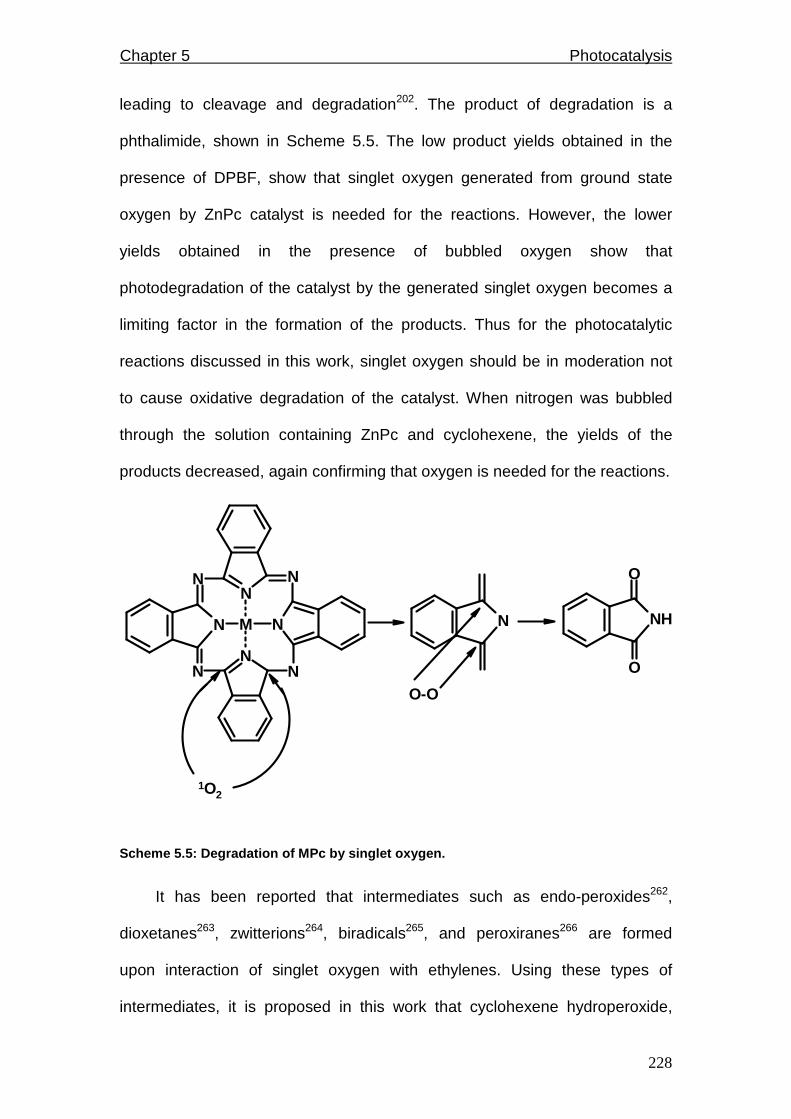
Chapter 5 Photocatalysis
228
leading to cleavage and degradation202. The product of degradation is a
phthalimide, shown in Scheme 5.5. The low product yields obtained in the
presence of DPBF, show that singlet oxygen generated from ground state
oxygen by ZnPc catalyst is needed for the reactions. However, the lower
yields obtained in the presence of bubbled oxygen show that
photodegradation of the catalyst by the generated singlet oxygen becomes a
limiting factor in the formation of the products. Thus for the photocatalytic
reactions discussed in this work, singlet oxygen should be in moderation not
to cause oxidative degradation of the catalyst. When nitrogen was bubbled
through the solution containing ZnPc and cyclohexene, the yields of the
products decreased, again confirming that oxygen is needed for the reactions.
NNN
N
N
N
NN
M N NH
O
O
1O2
O-O
Scheme 5.5: Degradation of MPc by singlet oxygen.
It has been reported that intermediates such as endo-peroxides262,
dioxetanes263, zwitterions264, biradicals265, and peroxiranes266 are formed
upon interaction of singlet oxygen with ethylenes. Using these types of
intermediates, it is proposed in this work that cyclohexene hydroperoxide,
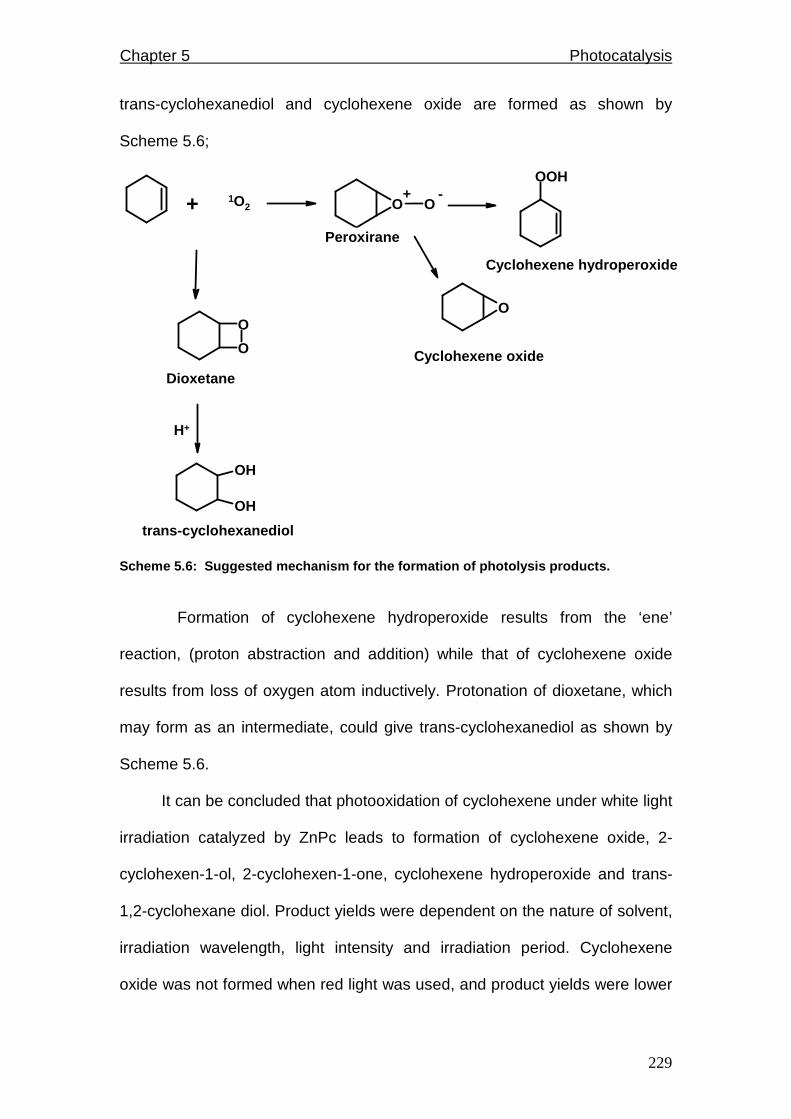
Chapter 5 Photocatalysis
229
trans-cyclohexanediol and cyclohexene oxide are formed as shown by
Scheme 5.6;
O O
OOH
OO
O
OH
OH
+ 1O2+ -
Peroxirane
Cyclohexene hydroperoxide
Cyclohexene oxide
H+
trans-cyclohexanediol
Dioxetane
Scheme 5.6: Suggested mechanism for the formation of photolysis products.
Formation of cyclohexene hydroperoxide results from the ‘ene’
reaction, (proton abstraction and addition) while that of cyclohexene oxide
results from loss of oxygen atom inductively. Protonation of dioxetane, which
may form as an intermediate, could give trans-cyclohexanediol as shown by
Scheme 5.6.
It can be concluded that photooxidation of cyclohexene under white light
irradiation catalyzed by ZnPc leads to formation of cyclohexene oxide, 2-
cyclohexen-1-ol, 2-cyclohexen-1-one, cyclohexene hydroperoxide and trans-
1,2-cyclohexane diol. Product yields were dependent on the nature of solvent,
irradiation wavelength, light intensity and irradiation period. Cyclohexene
oxide was not formed when red light was used, and product yields were lower

Chapter 5 Photocatalysis
230
with red light irradiation. Product yields were observed to increase with light
intensity, though care should be taken that it is not too intense so as not to
degrade the catalyst.

Chapter 6
Conclusions

Chapter 6 Conclusions
232
Conclusions
The main aim of the project was to use metallophthalocyanine
complexes as electrocatalysts towards thiol and thiocyanate oxidation as well
as reduction of oxygen. Electrodes were successfully modified with the MPc
catalysts. Glassy carbon electrode was modified by adsorption,
electrodeposition and electropolymerization of CoTEThPc and CoTPhPyrPc
complexes, and employed in oxidation of 2-mercaptoethanol (2-ME), L-
cysteine (CYS) and reduced glutathione (GSH). Co(II/I) redox couple was
involved in the catalysis. CoTEThPc exhibited higher catalytic activity towards
thiol oxidation than CoTPhPyrPc in terms of peak potentials and current
intensities.
It was also observed that adsorbed complexes showed higher catalytic
activity than their electrodeposited counterparts, indicating that thiols could
interact easily with the metal centre of the catalysts in adsorbed, loosely held
films as opposed to the compact films obtained with electrodeposition.
Concentration of MPc complex on the electrodes was observed not to
increase the catalytic activity which indicated that only the external layers are
active and the analyte does not have access to the bulk of the film. The order
of thiol activation (in terms of potential and current) was found to be 2-ME >
CYS > GSH, for both MPc complexes. Moreover, catalytic activity was found
to be pH dependent and it involved interaction of analyte with the metal centre
in the complex. Thiol oxidation was found to be a first order reaction.
Chapter 6 Conclusions
233
This study offers a new range of cobalt substituted phthalocyanines as
possible electrocatalysts for the highly demanded oxidation of thiols in
aqueous solutions.
Screen printed carbon electrodes incorporated with CoPc
electrocatalyzed oxidation of GSH and 2-ME in neutral and alkaline solutions.
Co(II/I) redox couple was involved in catalysis, but activity was better for 2-ME
oxidation compared to CoTEThPc and CoTPhPyrPc complexes adsorbed
onto glassy carbon electrodes. Lifetime and integrity of CoPc-SPCEs
depended on the solvent in which CoPc was dissolved during fabrication. This
work shows use of SPCEs in thiol oxidation reactions, forming a platform for
application in biological studies.
CoPc adsorbed onto an ordinary pyrolytic graphite electrode detected
oxidized-glutathione (GSSG) formed from decomposition of s-nitroso
glutathione (GSNO). Moreover, oxidation of reduced-glutathione (GSH) was
observed concurrently on the CoPc-OPG electrode. Thus this electrode
achieved indirect detection of thiols as opposed to direct methods where thiols
are detected in solutions in which they are added. Moreover, this approach
provides a new route for analysis of GSNO decomposition, other than
studying the amount of released NO. Although additional experiments are
needed in order to start building a dual electrode system to sense both NO
and GSH/GSSG, these results are very promising.
A self-assembled monolayer of CoTEThPc complex electrocatalyzed
irreversible oxidations of thiocyanate (SCN-), CYS and 2-ME in acidic media.
The oxidation of 2-ME in acid media is not common since it occurs with more
Chapter 6 Conclusions
234
difficulty than in basic media. This work provides a workable electrode for
analysis of this species in acid media. A detection limit of the order of 10-7 M
was obtained for SCN- and 10-8 M for CYS and 2-ME. The oxidation of
thiocyanate involved transfer of two electrons and was catalyzed by CoIII/CoII
and CoIIIPc-1/CoIIIPc-2 redox processes. The oxidation of 2-ME was mediated
by the CoIIIPc-1/CoIIIPc-2 redox process in CoTEThPc and involved transfer of
two electrons. For L-cysteine, both CoIII/CoII and CoIIIPc-1/CoIIIPc-2 redox
processes were involved. For all three analytes, a reaction order of 1 was
obtained.
Moreover, manganese, iron and cobalt phthalocyanine complexes
substituted with different ring ligands were adsorbed on glassy carbon
electrodes and used for oxygen reduction to hydrogen peroxide in acidic or
slightly alkaline media and to water in highly alkaline media. The number of
electrons transferred was calculated to be 2 and 4 for the peroxide and water
respectively. Tafel slopes near 60 and 120 mV/decade were obtained,
implying that a fast electron transfer is followed by a slow chemical step, for
the former, and one electron is transferred during the rate determining step,
for the latter. Oxygen reduction occurs via different mechanisms on MnPc,
CoPc and FePc complexes.The reaction order was found to be one in the pH
range 1 -13.
Metallophthalocyanine complexes were also employed as biomimetic
catalysts for oxidation of cyclohexene. The reaction was conducted using tert-
butylhydroperoxide (TBHP) or chloro-peroxybenzoic acid (CPBA) oxidants in
the presence of FePc(Cl)16, FePc and CoPc catalysts. Formed products were
cyclohexene oxide, 2-cyclohexen-1-ol and 2-cyclohexen-1-one, with adipic
Chapter 6 Conclusions
235
acid formed over a long time. Product selectivity varied with the nature of the
catalyst and the oxidant: FePc(Cl)16 and CoPc showed selectivity towards
cyclohexen-1-one, while FePc favoured formation of cyclohexen-1-ol when
TBHP was employed as an oxidant. Cyclohexene oxide was favoured when
CPBA oxidant was used. Generally, better selectivity was obtained when
TBHP was used as an oxidant other than CBPA.
When FePc(Cl)16 was employed as catalyst and TBHP as oxidant, the
highest yields were obtained for the 2-cyclohexen-1-one, whereas
cyclohexene oxide was the major product when CPBA was used. Product
yields were lower when CPBA was used as an oxidant; this is because it
degraded MPc catalysts faster than TBHP. However, FePc(Cl)16 did not
degrade as fast as the other complexes during the course of the reaction,
confirming that indeed ring substitution with electron-withdrawing ligands
stabilizes MPcs against oxidative degradation. The FePc(Cl)16 catalyst was
transformed to the Cl16PcFeIII-O-IIIFePcCl16 species during the catalytic
process. FeIIIPc and CoIIIPc species were implicated as intermediates when
the FePc and CoPc were employed as catalysts.
When ZnPc was employed as a photocatalyst for oxidation of
cyclohexene, the following products were formed under white light irradiation,
cyclohexene oxide, 2-cyclohexen-1-ol, 2-cyclohexen-1-one, trans-1,2-
cyclohexane diol and cyclohexene hydroperoxide. Product yields were
dependent on the nature of solvent, irradiation wavelength, light intensity and
irradiation period. Reaction mechanism involved both singlet oxygen and
radicals. The range of products formed was larger for the photocatalytic
transformation of cyclohexene in the presence of ZnPc when compared to
Chapter 6 Conclusions
236
biomimetic catalysis. It could be concluded that new products cyclohexene
hydroperoxide and trans-cyclohexanediol were formed via singlet oxygen
mechanism while cyclohexene oxide, cyclohexenol and cyclohexenone were
formed via radical mechanism. Thus the use of photocatalysis could assist the
petroleum industry in achieving a wider variety of useful products.
As a general conclusion, metallophthalocyanine complexes were used
successfully as electrocatalysts for oxidation of thiocyanate, L-cysteine, 2-
mercaptoethanol and reduced glutathione, decomposition of s-nitroso
glutathione as well as reduction of oxygen. They were also employed with
great success as biomimetic and photo-catalysts of cyclohexene oxidation.
Chapter 7 References
237
References
1. M.J. Stillman, in Phthalocyanines: Properties and applications, C.C.
Leznoff and A.B.P. Lever (Ed.s), Vol. 3, VCH Publishers, New York,
1993.
2. P. Erk and H. Hengelsberg, in The Porphyrin Handbook, K.M. Radish,
K.M. Smith and R. Guilard (Ed.s), Vol. 19, Academic Press, San Diego,
2003.
3. J. Simon and T. Toupance, in Comprehensive supra-molecular
chemistry, D.N. Reinhoudt (Ed.), Vol. 10, Pergamon, London, 1996.
4. N.B. McKeown, in The Porphyrin Handbook, K.M. Radish, K.M. Smith
and R. Guilard (Ed.s), Vol. 15, Academic Press, San Diego, 2003.
5. I. Rosenthal, Photochem. Photobiol., 6 (1991) 859.
6. E. Luk’yanets, J. Porphyrins Phthalocyanines, 3 (1999) 424.
7. S.R. Flom, in The Porphyrin Handbook, K.M. Radish, K.M. Smith and R.
Guilard (Ed.s), Vol. 19, Academic Press, San Diego, 2003.
8. N.S. Nalwa and J.S. Shirk, in Phthalocyanines: Properties and
applications, Ed. C.C. Leznoff and A.B.P. Lever, Vol. 4, VCH Publishers,
New York, 1996.
9. S. Griveau, J. Pavez, J. Zagal and F. Bedioui, J. Electroanal. Chem., 497
(2001) 75.
10. C.A. Caro, J.H. Zagal and F. Bedioui, J. Electrochem. Soc., 150 (2003)
E95.
11. M. Kimura and H. Shirai, in The Porphyrin Handbook, K.M. Radish, K.M.
Smith and R. Guilard (Ed.s), Vol. 19, Academic Press, San Diego, 2003.
Chapter 7 References
238
12. K. Kasuga, K. Mori, T. Sugimori and M. Handa, Bull. Chem. Soc. Jpn.,
73 (2000) 939.
13. J.D. Spikes, Photochem. Photobiol. B: Biol., 6 (1990) 259.
14. R. Hagen and T. Bieringer, Adv. Mater., 13 (2001)1805.
15. F.H. Moser and A.L. Thomas, in Phthalocyanine Compounds, Reinhold:
New York, Chapman and Hall, London, 1963.
16. F.H. Moser and A.L. Thomas, in The Phthalocyanines, Vol.s 1&2, CRC,
Boca Raton, 1983.
17. M. Hanack and M. Lang, Adv. Mat., 6 (1994) 819.
18. D. Wohrle, G. Schnurpfeil and G. Knothe, Dyes and Pigments, 18 (1992)
91.
19. P. Yiru, H. Fenghua, L. Zhipeng, C. Naisheng and H. Jinling, Inorg.
Chem. Commun., 7 (2004) 967.
20. A. Lützen, S.D. Starnes, D.M. Rudkevich and J. Rebeck Jr., Tet. Lett., 41
(2000) 3777.
21. F. Yilmaz, D. Atilla and V. Ahsen, Polyhedron, 23 (2004) 1931.
22. N.B. Mckeown, in Phthalocyanine Materials: Synthesis, Structure and
Function, Cambridge University Press, London, 1998.
23. J. Mack and M.J. Stillman, J. Am. Chem. Soc., 116 (1994) 1292.
24. K. Walzer and M. Hietschold, Surf. Sci., 471 (2001) 1.
25. M.J. Stillman and T. Nyokong, in Phthalocyanines: Properties and
applications, C.C. Leznoff and A.B.P. Lever (Ed.s), Vol. 1, VCH
Publishers, New York, 1989.
26. I. Seotsanyana-Mokhosi, N. Kuznetsova and T. Nyokong, Photochem.
Photobiol. A: Chem., 140 (2001) 215.

Chapter 7 References
239
27. G. de la Torre, M.V. Martinez-Diaz and T. Torres, J. Porphyrins
Phthalocyanines, 3 (1999) 560.
28. S. Maree, D. Phillips and T. Nyokong, J. Porphyrins Phthalocyanines, 6
(2002) 17.
29. Z. Zhao, K. Ozoemena, M.D. Maree and T. Nyokong, Dalton Trans.,
(2005) 1241.
30. V.N. Nemykin, V.Y. Chernii, S.V. Volkov, N.I. Bundina, O.L. Kaliya, V.D.
Li and E.A. Luk’yanets, J. Porphyrins Phthalocyanines, 3 (1999) 87.
31. J. Jiang, W. Liu and D.P. Arnold, J. Porphyrins Phthalocyanines, 7
(2003) 459.
32. K. Durr and M. Hanack, J. Porphyrins Phthalocyanines, 3 (1999) 224.
33. N. Kobayashi, A. Muranaka, and V.N. Nemykin, Tet. Lett., 42 (2001) 913.
34. P. Matlaba and T. Nyokong, Polyhedron, 21 (2002) 2463.
35. P.N. Day, Z. Wang and R. Pachter, J. Mol. Struc. (THEO-Chem), 455
(1998) 33.
36. T. Nyokong, Z. Gasyna and M.J. Stillman, Inorg. Chem., 26 (1987) 548.
37. T. Nyokong, Z. Gasyna, and M.J. Stillman, Inorg. Chem., 26 (1987)
1087.
38. E.A. Ough, T. Nyokong, K.A. Creber and M.J. Stillman, Inorg. Chem., 27
(1988) 2724.
39. E.A. Ough, Z. Gasyna and M.J. Stillman, Inorg. Chem., 30 (1991) 2301.
40. E.A. Ough and M.J. Stillman, Inorg. Chem., 33 (1994) 573.
41. M. Gouterman, in The Porphyrins, D. Dolphin (Ed.), Physical Chemistry,
Part A, Vol. 3, Academic Press: New York, 1978.
42. F.R. Fan and L.R. Faulkner, J. Am. Chem. Soc., 101 (1979) 4779.
Chapter 7 References
240
43. K. Kasuga, N. Matsura, K. Inoue, M. Handa, T. Sugimori, K. Isa and M.
Nakata, Chem. Lett., (2002) 352.
44. G.A. Kumar, J. Thomas, N.V. Unnikrishnan, V.P.N. Nampouri and C.P.G.
Vallabhan, J. Porphyrins Phthalocyanines, 5 (2001) 456.
45. M. Stillman, J. Mack and N. Kobayashi, J. Porphyrins Phthalocyanines, 6
(2002) 296.
46. M. Gouterman, J. Mol. Spectrosc., 6 (1961) 138.
47. A. Ogunsipe, J.-Y. Chen and T. Nyokong, New J. Chem., 28 (2004) 822.
48. Z. Zhao, A. Ogunsipe, M.D. Maree and T. Nyokong, J. Porphyrins
Phthalocyanines, 9 (2005) 186.
49. M.D. Maree, N. Kuznetsova and T. Nyokong, Photochem. Photobiol. A:
Chem., 140 (2001) 117.
50. M.J. Cook, Chem. Rec., 4 (2002) 225.
51. A. Ogunsipe and T. Nyokong, J. Mol. Struc., 689 (2004) 89.
52. A. Beeby, S. FitzGerald and C.F. Stanley, J. Chem. Soc. Perkin Trans., 2
(2001) 1978.
53. W.–F. Law, R.C.W. Liu, J. Jiang and D.K.P. Ng., Inorg. Chim. Acta., 256
(1997) 6349.
54. N. Kobayashi and H. Konami, in Phthalocyanines: Properties and
applications, C.C. Leznoff and A.B.P. Lever (Ed.s), Vol. 4, VCH
Publishers, New York, 1999.
55. F.R. Fronczek, R.J. Johnson and R.M. Strongin, Acta Cryst., E57 (2001)
447.
56. J.G. Calvert and J.N. Pitts, in Photochemistry, John Wiley & Sons, Inc.,
New York, 1966.

Chapter 7 References
241
57. A. Ogunsipe, D. Maree and T. Nyokong, J. Mol. Struc., 650 (2003) 131.
58. A.B.P. Lever, E.R. Milaeva and G. Speier, in Phthalocyanines: Properties
and applications, C.C. Leznoff and A.B.P. Lever (Ed.s), Vol. 3, VCH
Publishers, New York, 1989.
59. A.B.P. Lever, M.R. Hempstead, C.C. Leznoff, W. Liu, M. Melnik, W.A.
Nevin and P. Seymour, Pure Appl. Chem., 58 (1986) 1467.
60. M. L’Her and A. Pondaven. in The Porphyrin Handbook, K.M. Kadish,
K.M. Smith and R. Guilard (Ed.s), Vol. 16, Academic Press, San Diego,
2003.
61. A.B.P. Lever, S. Licoccia, K. Magnell, R.C. Minor and B.S. Ramaswamy,
ACS Symp. Ser., 201 (1982) 237.
62. T. Nyokong, S.A. J. Chem., 48 (1995) 23.
63. M.N. Golovin, P. Seymour, K. Jayaraj, Y.S. Fu and A.B.P. Lever, Inorg.
Chem., 29 (1990) 1719.
64. T. Nyokong, Polyhedron, 12 (1993) 375.
65. T. Kuwana, R.K. Darlington and D.W. Leedy, Anal. Chem., 36 (1964)
2023.
66. J. Obirai and T. Nyokong, J. Electroanal. Chem., 573 (2004) 77.
67. D.B. Hibbert, in Introduction to Electrochemistry, Macmillan, London,
1993.
68. L. Gaffo, M.J.S.P. Brasil, F. Cerdeira, C. Giles and W.C. Moreira, J.
Porphyrins Phthalocyanines, 9 (2005) 89.
69. J.W. Dodd and N.S. Hush, J. Chem. Soc., (1964) 4607.
70. L.D. Rollman and R.T. Iwamoto, J. Am. Chem. Soc., 90 (1968) 1455.
71. D.W. Clack and J.R. Yandle, Inorg. Chem., 11 (1972) 1738.
Chapter 7 References
242
72. G. Inzelt, in Electroanalytical methods: Guide to experiments and
applications, F. Scholz (Ed.), Springer 2002.
73. H. Kahlert, in Electroanalytical methods: Guide to experiments and
applications, F. Scholz (Ed.), Springer 2002.
74. W.R. Heineman and P.T. Kissinger, in Laboratory Techniques in
Electroanalytical-chemistry, 2nd ed, P.T. Kissinger and W.R. Heineman
(Ed.s), Marcel Deccer Inc., New York, 1996.
75. A.J. Bard and L.R. Faulkner, in Electrochemical Methods: Fundamentals
and Applications, John Willey & Sons, Toronto, 1996.
76. J. O’M. Bockris and S.U.M. Khan, in Surface electrochemistry: A
molecular level approach, Plenum Press, New York, 1993.
77. V.G. Levich, in Physicochemical hydrodynamics (English translation),
Prentice Hall, New Jersey, 1962.
78. C.M.A. Brett and A.-M.O. Brett, in Electrochemistry, principles, methods
and applications, Oxford University Press, 1993.
79. M.J. Aguirre, M. Isaacs, F. Armijo, L. Basaez and J.H. Zagal,
Electroanalysis, 14 (2002) 356.
80. B. Wermeckers and F. Beck, Electrochim. Acta, 30 (1985) 1491.
81. J.H. Zagal, Coord. Chem. Rev., 119 (1992) 89 and references cited
therein.
82. J.H. Zagal and C. Paez, Electrochim. Acta, 34 (1989) 243.
83. J.-M. Zen, A.S. Kumar and M.-R. Chang, Electrochim. Acta, 45
(2000)1691.
84. J. Zagal, R.K. Sen and E. Yeager, J. Electroanal. Chem., 83 (1977) 207.
85. M. Gulppi, F. Bedioui and J.H. Zagal, Electroanalysis, 13 (2001) 1136.
Chapter 7 References
243
86. N.B. McKeown, Chem. Ind., (1999) 92.
87. J. Oni and T. Nyokong, Anal. Chim. Acta, 434 (2001) 9.
88. J. Zagal, P. Bindra and E. Yeager, J. Electrochem. Soc., 127 (1980)
1506.
89. S. Maree and T. Nyokong, J. Electroanal. Chem., 492 (2000) 120.
90. M. Sekota and T. Nyokong, Polyhedron, 16 (1997) 3279.
91. S. Ledru, N. Ruillé and M. Boujtita, Biosens. Bioelectron., 21 (2006)
1591.
92. C.D. Kuhnline, M.G. Gangel, M.K. Hulvey and R.S. Martin, Analyst, 131
(2006) 202.
93. A. Napier and J.P. Hart, Electroanalysis, 8 (1996) 1006.
94. T.J. Mafatle and T. Nyokong, J. Electroanal. Chem., 408 (1996) 213.
95. M.J. Cook, Pure Appl. Chem., 71 (2002) 2145.
96. X. Lu, K.W. Hipps, X.D. Wang and U. Mazur, J. Am. Chem. Soc., 118
(1996) 7197.
97. M.J. Cook, J. Mater. Chem., 6 (1996) 677.
98. C.A. Caro, F. Bedioui and J.H. Zagal, Electrochim. Acta, 47 (2002) 1489.
99. K.I. Ozoemena, P. Westbroek and T. Nyokong, Electrochem. Commun.,
3 (2001) 529.
100. B.J. Hwang, R. Santhanam and Y.W. Chang, Electroanalysis, 14 (2002)
363.
101. J. Obirai, N. Pereira-Rodrigues, F. Bedioui and T. Nyokong, J.
Porphyrins Phthalocyanines, 7 (2003) 508.
102. S. Griveau and F. Bedioui, Electroanalysis, 13 (2001) 253.
103. M.J. Cook and A. JafariFini, J. Mater. Chem., 7 (1997) 5.
Chapter 7 References
244
104. Z. Li and M.Lieberman, Langmuir, 17 (2001) 4887.
105. X. Li, W. Xu, X. Wang, H. Jia, B. Zhao, B. Li and Y. Ozaki, Thin Solid
Films, 457 (2004) 372.
106. K.I. Ozoemena and T. Nyokong, J. Electroanal. Chem., 579 (2005) 283.
107. Z. Li and M. Lieberman in Fundamental and applied aspects of
chemically modified surfaces, J.P. Blitz and C.B. Little (Eds), Royal
society of chemistry. Lettchworth, UK, 1999.
108. K.I. Ozoemena and T. Nyokong, Talanta, 67 (2005) 162.
109. B. Liedberg and P. Tengvall, Langmuir, 11 (1995) 3821.
110. M.P. Somashekarappa, J. Keshavayya and S. Sampath, Pure Appl.
Chem., 74 (2002) 1609.
111. M. Thamae and T. Nyokong, J. Electroanal. Chem., 579 (1999) 126.
112. J. Obirai and T. Nyokong, Electrochim. Acta, 49 (2004) 1417.
113. S. Griveau, V. Albin, T. Pauporte, J.H. Zagal and F. Bedioui, J. Mater.
Chem.,12 (2002) 225.
114. J. Obirai, F. Bedioui and T. Nyokong, J. Electroanal. Chem., 576 (2005)
323.
115. E. Crouch, D.C. Cowell, S. Hoskins, R.W. Pittson and J.P. Hart, Anal.
Biochem., 347 (2005) 17.
116. J. Wang and P.V.A. Pamidi, Talanta, 42 (1995) 463.
117. S. Miserere, S. Ledru, N. Ruillé, S. Griveau, M. Boujtita and F. Bedioui,
Electrochem. Comm., 8 (2006) 238.
118. J.R. de Sousa, A.A. Batista, I.C.N. Diogenes, G.F.S. Andrade, M.L.A.
Temperini, L.G.F. Lopes and I. D.-S. Moreira, J. Electroanal. Chem., 543
(2003) 93.

Chapter 7 References
245
119. J. Chen, J. Su, W. Wang and M.A. Reed, Physica E, 16 (2003) 17.
120. Y. Naitoh, T. Matsumoto, K.-I. Sugiura, Y. Sakata and T. Kawai, Surf.
Sci., 487 (2001) L534.
121. M.S. El-Deab and T. Ahsaka, Electrochem. Commun., 5 (2003) 214.
122. X. Huang, Y. Liu, S. Wang, S. Zhou and D. Zhu, Chem. Eur. J., 8 (2002)
4179.
123. F. Bedioui, J. Devynck and C. Bied-Charreton, Acc. Chem. Res., 28
(1995) 30 and references cited therein.
124. K. Nishiyama, S.I. Tahara, Y. Uchida, S. Tanoue and I. Taniguchi, J.
Electroanal. Chem., 478 (1999) 83.
125. K.V. Gothelf, J. Electroanal. Chem., 494 (2000) 147.
126. H.O. Finklea in Electroanalytical Chemistry, A.J. Bard, I. Rubenstein
(Eds), Vol 19 (and references therein), Marcel Dekker, New York, 1996.
127. E. Sabatani and I. Rubinstein, J. Phys. Chem., 91 (1987) 6663.
128. M.D. Porter, T.B. Bright, D. Allara and C.E.D. Chidsey, J. Am. Chem.
Soc., 109 (1987) 3559.
129. D. Losic, J.G. Shapter and J.J. Gooding, Langmuir, 17 (2001) 3307.
130. J. Wang, J.L.P. Paz and M. Jiang, Langmuir, 15 (1999) 1884.
131. D.L. Pilloud, X. Chen, P.L. Dutton and C.C. Moser, J. Phys. Chem. B,
104 (2000) 2868.
132. K.I. Ozoemena and T. Nyokong, Electrochim. Acta, 47 (2002) 4035.
133. H. Ohmori and I. Yamamoto, J. Exp. Med., 155 (1982) 1277.
134. W.A. Kleinman and J.P. Richie, Biochem. Pharmacol., 60 (2000) 19.
135. A. Meister, J. Biol. Chem., 263 (1988) 17205.
Chapter 7 References
246
136. I. Chatti, A. Ghorbel, P. Grange and J.M. Colin, Catal. Today, 75 (2002)
113.
137. P.M. Schweizer-Berberich, S. Vaihinger and W.Gopel, Sens. Actuators,
B18-19 (1994) 282.
138. D.L.H. Williams, Chem. Soc. Rev., 14 (1985) 171.
139. C.M. Venturini, R.M. Palmer and S. Moncada, J. Pharmacol. Exp. Ther.,
266 (1993) 1497.
140. M.W. Radomski, D.D. Rees, A. Dutra and S. Moncada, Br. J.
Pharmacol., 107 (1992) 745.
141. E.J. Langford, A.S. Brown, A.J. de Belber, R.E.A. Smith, J.F. Martin, R.J.
Wainwright, M.R. Thomas, M.W. Radomski and S. Moncada, Lancet,
344 (1994) 1458.
142. A.D. Belber, C. Lees, J. Martin, S. Moncada and S. Campbell, Lancet,
345 (1995) 124.
143. S. Modi, S.S. Deodhar, D.V. Behere and S. Mitra, Biochemistry, 30
(1991) 118.
144. D. Gao, J.-Z. Li, and R.-Q. Yu, Anal. Chem., 66 (1994) 2245.
145. M.K. Amini, S. Shahrokhian and S. Tangestaninejad, Anal. Chim. Acta,
402 (1999) 137.
146. N. Phougat and P. Vasudevan, J. Power Sources, 69 (1997) 161.
147. E. Itabashi, Inorg. Chem., 24 (1985) 4024.
148. S. Adak, A. Mazumdar and R.K. Banerjees, J. Biol. Chem., 272 (1997)
11049.
149. T.M. Aune and E.L. Thomas, Eur. J. Biochem., 80 (1977) 209.
150. E.L. Thomas, Biochemistry, 20 (1981) 3273.

Chapter 7 References
247
151. S. Modi, D.V. Behere and S. Mitra, Biochemistry, 28 (1989) 4689.
152. S. Modi, D.V. Behere and S. Mitra, J. Biol. Chem., 264 (1989) 19677.
153. V.K. Sharma, D.B. O’Connor and D. Cabelli, Inorg. Chimica Acta, 357
(2004) 4587.
154. T. Ohta, T. Kamachi, Y. Shiota and K. Yoshizawa, J. Org. Chem., 6
(2001) 4122.
155. T. Nyokong in N4-macrocyclic metal complexes, J.H. Zagal, F. Bedioui
and J-P. Dodelet (Ed.s), Springer, New York, 2006.
156. K.I. Ozoemena, T. Nyokong and P. Westbroek, Electroanalysis, 14
(2003) 1.
157. G.I. Cardenas-Jiron, M.A. Gulppi, C.A. Caro, R. del Rio, M. Paez and
J.H. Zagal, Electrochim. Acta, 46 (2001) 3227.
158. D. Mimica, F. Bedioui and J.H. Zagal, Electrochim. Acta, 48 (2002) 323.
159. X. Qi and R.P. Baldwin, J. Electrochem. Soc., 143 (1996) 1283.
160. M.A. Gulppi, M.A. Paez, J.A. Costamagna, G.I. Cardenas-Jiron, F.
Bedioui and J.H. Zagal, J. Electroanal. Chem., 580 (2005) 50.
161. N. Pereira-Rodrigues, R. Cofré, J.H. Zagal and F. Bedioui,
Bioelectrochem., 2006, in press.
162. D. Giustarini, A. Milzani, R. Colombo, I. Dalle-Donne and R. Rossi, Clin.
Chim. Acta, 330 (2003) 85.
163. M.P. Gordge, J.S. Hothersall, G.H. Neild and A.A.N. Dutra, Br. J.
Pharmacol., 119 (1996) 533.
164. P.D. Wood, B. Mutus and R.W. Redmond, Photochem. Photobiol., 64
(1996) 518.
Chapter 7 References
248
165. R.J. Singh, N. Hogg, J. Joseph and B. Kalyanaraman, J. Biol. Chem.,
271 (1996) 18596.
166. M. David-Dufihlo, A. Brunet and F. Bedioui, Electroanalysis, 18 (2006)
1827.
167. Y. Hou, J. Wang, F. Arias, L. Echegoyen and P. G. Wang, Bioorg. Med.
Chem. Lett., 8 (1998) 3065.
168. S. Pfeiffer, A. Schrammel, K. Schmidt and B. Mayer, Anal. Biochem., 258
(1998) 68.
169. H. Ikezawa, E. Miki, K. Mizumachi, T. Ishimori, T. Nagai and M. Tanaka,
Bull. Chem. Soc. Jpn., 66 (1993) 89.
170. J.H. Zagal, M.A. Gulppi and G. Cardenas-Jiron, Polyhedron, 19 (2000)
2255.
171. J.A.R. van Veen and C. Visser, Electrochim. Acta, 24 (1979) 921.
172. G. Lalande, G. Faubert, R. Cote, D. Guay, J.P. Dodelet, L.T. Weng and
P. Bertrand, J. Power Sources, 61 (1996) 227.
173. S. Baranton, C. Coutanceau, C. Roux, F. Hahn and J.M. Leger, J.
Electroanal. Chem., 577 (2005) 223.
174. F. Beck, J. Appl. Electrochem., 7 (1977) 239.
175. G. Lalande, R. Cote, G. Tamizhmani, D. Guay, J.P. Dodelet, L. Dignard-
Bailey, L.T. Weng and P. Bertrand, Electrochim. Acta, 40 (1995) 2635.
176. K. Kinoshita, in Electrochemical oxygen technology, 1992, Wiley, New
York.
177. S. Popovici, W. Leyffer and R. Holze, J. Porphyrins Phthalocyanines, 2
(1998) 249.

Chapter 7 References
249
178. Y. Tse, P. Janda, H. Lam, J. Zhang, W.J. Pietro and A.B.P. Lever, J.
Porphyrins Phthalocyanines, 1 (1997) 3.
179. C. Coutanceau, P. Crouigneau, J.M. Leger and C. Lamy, J. Electroanal.
Chem., 379 (1994) 389.
180. J.H. Zagal, R.K. Sen and E. Yeager, J. Electroanal. Chem., 83 (1977)
207.
181. K. Oyaizu, A. Haryono, J. Natori and E. Tsuchida, J. Chem. Soc.,
Faraday Trans., 94 (1998) 3737.
182. J.H. Zagal, M. Paez, A.A. Tanaka, J.R. dos Santos and C.A. Linkous, J.
Electroanal. Chem., 339 (1992) 13.
183. J.H. Zagal, M.J. Aguirre, L. Basaez and J. Pavez, in Oxygen
Electrochemistry, The Electrochem. Soc. Symposium Series, R.R. Adzic,
F.C. Anson and K. Kinoshita (Ed.s), Vol. 95(26), 1995.
184. J.H. Zagal and G.I. Cardenas-Jiron, J. Electroanal. Chem., 489 (2000)
96.
185. J.H. Zagal, M.A. Paez and J.F. Silva, in N4-macrocyclic metal complexes,
J.H. Zagal, F. Bedioui and J.-P. Dodelet (Ed.s), Springer, New York,
2006.
186. N. Kobayashi, P. Janda and A.B.P. Lever, Inorg. Chem., 31 (1992) 5172.
187. P. Janda, N. Kobayashi, P.R. Auburn, H. Lam, C.C. Leznoff and A.B.P.
Lever, Can. J. Chem., 67 (1989) 1109.
188. J. Pavez, M. Paez, A. Ringuede, F. Bedioui and J.H. Zagal, J. Solid
State Electrochem., 9 (2005) 21.
189. J.H. Zagal, M. Gulppi, M. Isaacs, G. Cardenas-Jiron and M.J. Aguirre,
Electrochim. Acta, 44 (1998) 1349.

Chapter 7 References
250
190. X.-B. Zhang, C.-C. Guo, J.-B. Xu and R.-Q. Yu, J. Mol. Cat. A: Chem.,
154 (2000) 31.
191. K.T. Moore, I.T. Horváth and M.J. Therien, Inorg. Chem., 39 (2000)
3125.
192. F.G. Doro, J.R.L. Smith, A.G. Ferreira and M.D. Assis, J. Mol. Cat. A:
Chem., 164 (2000) 97.
193. H.C. Sacvo, Y. Iamamoto and J.R.L. Smith, J. Chem. Soc. Perkin Trans.,
2 (2001) 181.
194. Y.-W. Chan and R.B. Wilson Jr., ACS Natl. Meeting, 33 (1988) 453.
195. S. Seelan, M.S. Agashe, D. Srinivas and S. Sivasanker, J. Mol. Catal. A:
Chem., 168 (2001) 61.
196. N. Grootboom and T. Nyokong, J. Mol. Catal. A: Chem., 179 (2002) 113.
197. K.E. Simmons and D.E. van Sickle, J. Am. Chem. Soc., 95 (1973) 7759.
198. R.R. Diaz, K. Selby and D.J. Waddington, J. Chem. Soc. Perkin. Trans.,
2 (1975) 758.
199. W. Nam, Y.M. Goh, Y.J. Lee, M.H. Lim and C. Kim, Inorg. Chem., 38
(1999) 3238.
200. M. Salavati-Niasari, F. Farzaneh and M. Ghandi, J. Mol. Catal. A: Chem.,
186 (2002) 101.
201. M.E. Nino, S.A. Giraldo and E.A. Paez-Mozo, J. Mol. Cat. A: Chem., 175
(2001) 139.
202. J.-W. Huang, W-Z. Huang, W-J. Mei, J. Liu, S-G. Hu and L-N. Ji, J. Mol.
Catal. A: Chem., 156 (2000) 275.
203. N.A. Kuznetsova, N.S. Gretsova, V.M. Derkachera, O.L. Kaliya and E.A.
Luk’yanets, J. Porphyrins Phthalocyanines, 7 (2003) 147.
Chapter 7 References
251
204. M.A. Schiavon, Y. Iamamoto, O.R. Nascimento and M. D. Assis, J. Mol.
Cat. A: Chem., 174 (2001) 213.
205. A.N. de Sousa, M.E.M.D. de Carvalho and Y.M. Idemori, J. Mol. Cat. A:
Chem., 169 (2001) 1.
206. N. Safari and F. Bahadoran, J. Mol. Cat. A: Chem., 171 (2001) 115.
207. K. Kasuga, K. Tsuboi, M. Handa, T. Sugimori and K. Sogabe, Inorg.
Chem. Comm., 2 (1999) 507.
208. A. Jablonski, Nature, 131 (1933) 839.
209. A. Jablonski, Z. Phys., 73 (1931) 460.
210. R. Bonnett, Chem. Soc. Rev., 24 (1995) 19.
211. R. Bonnett, in Chemical Aspects of Photodynamic Therapy: Advanced
Chemistry Texts, D. Phillips, P. O’Brein and S. Roberts (Ed.s), Vol. 1,
Gordon & Breach, Germany, 2000.
212. A.K.Sobbi, D. Wohrle and D. Schlettwein, J. Chem. Soc. Perkin Trans., 2
(1993) 481.
213. I. Rosenthal and E. Ben-Hur, Int. J. Radiat. Biol., 67 (1995) 85.
214. J.A.S. Cavaleiro, M.G.P.S. Neves, M.J.E. Hewlis and A.H. Jackson, J.
Chem. Soc. Perkin Trans., 1 (1990) 1937.
215. W. Spiller, H. Kliesch, D. Wohrle, S. Hackbarth, B. Roder and G.
Schnurpfeil, J. Porphyrins Phthalocyanines, 1 (1997) 159.
216. N.A. Kuznetsova, E. Makarova, S. Dashkevich, N. Gretsova, V.
Negrimovsky, O. Kaliya and E. Luk’yanets, Zh. Obshch. Khim., 70 (2000)
140.
217. T. Shiragami, K. Kubomura, D. Ishibashi and H. Inoue, J. Am. Chem.
Soc., 118 (1996) 6311.
Chapter 7 References
252
218. S. Takagi, T. Okamoto, T. Shiragami and H. Inoue, J. Org. Chem., 59
(1994) 7373.
219. P.E. Esser, B. Drieben-Holscher and W. Keim, J. Mol. Cat. A: Chem.,
140 (1999) 13.
220. A. Maldotti, L. Andreotti, A. Molinari, S. Borisov and V. Vasil’ev, Chem.
Eur. J., 7 (2001) 3564.
221. J. Obirai and T. Nyokong, Electrochim. Acta, 50 (2005) 5427.
222. J. Obirai and T. Nyokong, Electrochim. Acta, 50 (2005) 3296.
223. R. D. Mair and A. J. Graupner, Anal. Chem., 36 (1964) 194.
224. J. Premkumar and R. Ramaraj, J. Mol. Catal A: Chem., 142 (1999) 153.
225. J. Mertz, O. Scheider and M. Hanack, Inorg. Chem., 23 (1984) 1065.
226. H. Tomoda, S. Saito and S. Shiraishi, Chem. Lett., (1983) 313.
227. N. Trobach, O. Hild, D. Schettwein and D. Wöhrle, J. Mat. Chem., 12
(2002) 879.
228. D. Wöhrle, M. Eskes, K. Shigehara, A. Yamada, Synthesis (1993) 194.
229. S. Griveau, M. Gulppi, F. Bedioui and J. Zagal, Solid State Ionics, 169
(2004) 59.
230. J.H. Zagal, M.A. Gulppi, C.A. Caro, and G.I. Cardenas-Jiron,
Electrochem Comm., 1 (1999) 389.
231. R.O. Lezna, S. Juanto, and J.H. Zagal, J. Electroanal. Chem., 452
(1998) 221.
232. D. Martel, N. Sojic and A. Kuhn, J. Chem. Educ., 79 (2002) 349.
233. G. Kalyuzhny, A. Vaskevich, G. Ashkenasy, A. Shanzer and I.
Rubinstein, J. Phys. Chem., B 104 (2000) 8238.
Chapter 7 References
253
234. D.J. Revell, I. Chambrier, M.J. Cook, and D.A. Russell, J. Mater. Chem.,
10 (2000) 31.
235. S.S. Khaloo, M.K. Amini, S. Tangestaninejad, S. Shahrokhian and R.
Kia, J. Iranian Chemical Society, 1 (2004) 128.
236. S.M. Golabi, H.R. Zare, and M. Hamzehloo, Microchem. J., 69 (2001)
111.
237. A. Salimi and K. Abdi, Talanta, 63 (2004) 475.
238. M.E.G. Lyons, C.A. Fitzgerald, and M.R. Smyth, Analyst, 119 (1994)
855.
239. M.K. Halbert and R.P. Baldwin, Anal. Chem., 57 (1985) 591.
240. S. Griveau, M. Gulppi, J. Pavez, J.H. Zagal, and F. Bedioui,
Electroanalysis, 15 (2003) 779.
241. J. Vitecek, J. Petrlova, J. Petrek, V. Adam, D. Potesil, L. Havel, R.
Mikelova, L. Tronkova and R. Kizek, Electrochim. Acta, 51 (2006) 5087.
242. A.C. Gorren, A. Schrammel, K. Schmidt and B. Mayer, Arch. Biochem.
Biophys., 330 (1996) 219.
243. E. Ford, M.N. Hughes and P. Wardman, Free Radic. Biol. Med., 32
(2002) 1314.
244. E. Bald, G. Chwatko, R. Glowacki and K. Kusmierek, J. Chromatogr. A,
1032 (2004) 109.
245. E. Bramanti, C. Vecoli, D. Neglia, M.P. Pellegrini, G. Raspi, and R.
Barsacchi, Clin. Chem., 51 (2005) 1007.
246. K. Ozoemena, T. Nyokong and P. Westbroek, Electroanalysis, 15 (2003)
1762.
247. M. Ebadi, C. Alexiou and A.B.P. Lever, Can. J. Chem., 79 (2001) 992.

Chapter 7 References
254
248. J. Zhang and F. C. Anson, J. Electroanal. Chem., 341 (1992) 323.
249. D. Schlettwein, J.P. Meyer and N.I. Jaeger, J. Porphyrins
Phthalocyanines, 4 (2000) 23.
250. B.E. Williamson, T.C. VanCott, M.E. Boyle, G.C. Misener, M.J.
Stillman and P.N. Schatz, J. Am. Chem. Soc., 114 (1992) 2412.
251. A.B.P. Lever, J.P. Wilshire and S.K. Quan, J. Am. Chem. Soc., 101
(1979) 3668.
252. A.B.P. Lever, J.P. Wilshire and S.K. Quan, Inorg.Chem., 20 (1981) 761.
253. C. Coutanceau, A. Rakotondrainibe, P. Crouigneau, J.M. Leger, and C.
Lamy, J. Electroanal. Chem., 386 (1995) 173.
254. W. Nam, M.H. Lim, S.-Y. Oh, J.H. Lee, H.J. Lee, S.K. Woo, C. Kim, W.
Shin, Angew Chem. Int. Ed., 39 (2000) 3646.
255. W. Nam, H.J. Lee, S-Y. Oh, C. Kim and H.G. Jang, J. Inorg. Biochem.,
80 (2000) 219.
256. Y. Watanabe, J. Biol. Inorg. Chem., 6 (2001) 846.
257. A. Hadasch, A. Sorokin, A. Rabion, L. Fraisse and B. Meunier, New J.
Chem., (1998) 45.
258. G. Ferraudi, in Phthalocyanines: Properties and Applications, C.C.
Leznoff and A.B.P. Lever (Eds.), Vol. 1, VCH Publishers, New
York,1989.
259. I.V. Renge, V.A. Kuz’min, A.F. Mironov and Y.E. Borisevich, Doklady
Akademii Nauk SSSR., 263 (1982) 143.
260. Z. Gasyna, W.R. Browett and M.J. Stillman, Inorg. Chim. Acta, 92 (1984)
37.
261. K. Kasuga, H. Morimoto and M. Ando, Inorg. Chem., 25 (1986) 2478.

Chapter 7 References
255
262. B.M. Monroe, J. Am. Chem. Soc., 82 (1978) 15.
263. P.D. Bartlett and A.P. Schaap, J. Am. Chem. Soc., 92 (1970) 3223.
264. C.S. Foote and J.W. Peters, J. Am. Chem. Soc., 93 (1971) 3795.
265. P.R. Ogilby and C.S. Foote, J. Am. Chem. Soc., 103 (1981) 1220.
266. L.E. Manring and C.S. Foote, J. Am. Chem. Soc., 105 (1983) 4710.
CHAPTER 8
1 M.J. Stillman, in Phthalocyanines: Properties and applications, C.C. Leznoff and
A.B.P. Lever (Ed.s), Vol. 3, VCH Publishers, New York, 1993. 2 P. Erk and H. Hengelsberg, in The Porphyrin Handbook, K.M. Radish, K.M. Smith
and R. Guilard (Ed.s), Vol. 19, Academic Press, San Diego, 2003. 3 J. Simon and T. Toupance, in Comprehensive supra-molecular chemistry, D.N.
Reinhoudt (Ed.), Vol. 10, Pergamon, London, 1996. 4 N.B. McKeown, in The Porphyrin Handbook, K.M. Radish, K.M. Smith and R.
Guilard (Ed.s), Vol. 15, Academic Press, San Diego, 2003. 5 I. Rosenthal, Photochem. Photobiol., 6 (1991) 859. 6 E. Luk’yanets, J. Porphyrins Phthalocyanines, 3 (1999) 424. 7 S.R. Flom, in The Porphyrin Handbook, K.M. Radish, K.M. Smith and R. Guilard
(Ed.s), Vol. 19, Academic Press, San Diego, 2003. 8 N.S. Nalwa and J.S. Shirk, in Phthalocyanines: Properties and applications, Ed.
C.C. Leznoff and A.B.P. Lever, Vol. 4, VCH Publishers, New York, 1996. 9 S. Griveau, J. Pavez, J. Zagal and F. Bedioui, J. Electroanal. Chem., 497 (2001) 75. 10 C.A. Caro, J.H. Zagal and F. Bedioui, J. Electrochem. Soc., 150 (2003) E95. 11 M. Kimura and H. Shirai, in The Porphyrin Handbook, K.M. Radish, K.M. Smith
and R. Guilard (Ed.s), Vol. 19, Academic Press, San Diego, 2003. 12 K. Kasuga, K. Mori, T. Sugimori and M. Handa, Bull. Chem. Soc. Jpn., 73 (2000)
939. 13 J.D. Spikes, Photochem. Photobiol. B: Biol., 6 (1990) 259. 14 R. Hagen and T. Bieringer, Adv. Mater., 13 (2001)1805. 15 F.H. Moser and A.L. Thomas, in Phthalocyanine Compounds, Reinhold: New
York, Chapman and Hall, London, 1963. 16 F.H. Moser and A.L. Thomas, in The Phthalocyanines, Vol.s 1&2, CRC, Boca
Raton, 1983. 17 M. Hanack and M. Lang, Adv. Mat., 6 (1994) 819. 18 D. Wohrle, G. Schnurpfeil and G. Knothe, Dyes and Pigments, 18 (1992) 91. 19 P. Yiru, H. Fenghua, L. Zhipeng, C. Naisheng and H. Jinling, Inorg. Chem.
Commun., 7 (2004) 967. 20 A. Lützen, S.D. Starnes, D.M. Rudkevich and J. Rebeck Jr., Tet. Lett., 41 (2000)
3777.

Chapter 7 References
257
21 F. Yilmaz, D. Atilla and V. Ahsen, Polyhedron, 23 (2004) 1931. 22 N.B. Mckeown, in Phthalocyanine Materials: Synthesis, Structure and Function,
Cambridge University Press, London, 1998. 23 J. Mack and M.J. Stillman, J. Am. Chem. Soc., 116 (1994) 1292. 24 K. Walzer and M. Hietschold, Surf. Sci., 471 (2001) 1. 25 M.J. Stillman and T. Nyokong, in Phthalocyanines: Properties and applications,
C.C. Leznoff and A.B.P. Lever (Ed.s), Vol. 1, VCH Publishers, New York, 1989. 26 I. Seotsanyana-Mokhosi, N. Kuznetsova and T. Nyokong, Photochem. Photobiol.
A: Chem., 140 (2001) 215. 27 G. de la Torre, M.V. Martinez-Diaz and T. Torres, J. Porphyrins Phthalocyanines,
3 (1999) 560. 28 S. Maree, D. Phillips and T. Nyokong, J. Porphyrins Phthalocyanines, 6 (2002) 17. 29 Z. Zhao, K. Ozoemena, M.D. Maree and T. Nyokong, Dalton Trans., (2005) 1241. 30 V.N. Nemykin, V.Y. Chernii, S.V. Volkov, N.I. Bundina, O.L. Kaliya, V.D. Li and
E.A. Luk’yanets, J. Porphyrins Phthalocyanines, 3 (1999) 87. 31 J. Jiang, W. Liu and D.P. Arnold, J. Porphyrins Phthalocyanines, 7 (2003) 459. 32 K. Durr and M. Hanack, J. Porphyrins Phthalocyanines, 3 (1999) 224. 33 N. Kobayashi, A. Muranaka, and V.N. Nemykin, Tet. Lett., 42 (2001) 913. 34 P. Matlaba and T. Nyokong, Polyhedron, 21 (2002) 2463. 35 P.N. Day, Z. Wang and R. Pachter, J. Mol. Struc. (THEO-Chem), 455 (1998) 33. 36 T. Nyokong, Z. Gasyna and M.J. Stillman, Inorg. Chem., 26 (1987) 548. 37 T. Nyokong, Z. Gasyna, and M.J. Stillman, Inorg. Chem., 26 (1987) 1087. 38 E.A. Ough, T. Nyokong, K.A. Creber and M.J. Stillman, Inorg. Chem., 27 (1988)
2724. 39 E.A. Ough, Z. Gasyna and M.J. Stillman, Inorg. Chem., 30 (1991) 2301. 40 E.A. Ough and M.J. Stillman, Inorg. Chem., 33 (1994) 573. 41 M. Gouterman, in The Porphyrins, D. Dolphin (Ed.), Physical Chemistry, Part A,
Vol. 3, Academic Press: New York, 1978. 42 F.R. Fan and L.R. Faulkner, J. Am. Chem. Soc., 101 (1979) 4779. 43 K. Kasuga, N. Matsura, K. Inoue, M. Handa, T. Sugimori, K. Isa and M. Nakata,
Chem. Lett., (2002) 352. 44 G.A. Kumar, J. Thomas, N.V. Unnikrishnan, V.P.N. Nampouri and C.P.G.
Vallabhan, J. Porphyrins Phthalocyanines, 5 (2001) 456.
Chapter 7 References
258
45 M. Stillman, J. Mack and N. Kobayashi, J. Porphyrins Phthalocyanines, 6 (2002)
296. 46 M. Gouterman, J. Mol. Spectrosc., 6 (1961) 138. 47 A. Ogunsipe, J.-Y. Chen and T. Nyokong, New J. Chem., 28 (2004) 822. 48 Z. Zhao, A. Ogunsipe, M.D. Maree and T. Nyokong, J. Porphyrins
Phthalocyanines, 9 (2005) 186. 49M.D. Maree, N. Kuznetsova and T. Nyokong, Photochem. Photobiol. A: Chem., 140
(2001) 117. 50 M.J. Cook, Chem. Rec., 4 (2002) 225. 51A. Ogunsipe and T. Nyokong, J. Mol. Struc., 689 (2004) 89. 52A. Beeby, S. FitzGerald and C.F. Stanley, J. Chem. Soc. Perkin Trans., 2 (2001)
1978. 53 W.–F. Law, R.C.W. Liu, J. Jiang and D.K.P. Ng., Inorg. Chim. Acta., 256 (1997)
6349. 54 N. Kobayashi and H. Konami, in Phthalocyanines: Properties and applications,
C.C. Leznoff and A.B.P. Lever (Ed.s), Vol. 4, VCH Publishers, New York, 1999. 55F.R. Fronczek, R.J. Johnson and R.M. Strongin, Acta Cryst., E57 (2001) 447. 56 J.G. Calvert and J.N. Pitts, in Photochemistry, John Wiley & Sons, Inc., New York,
1966. 57 A. Ogunsipe, D. Maree and T. Nyokong, J. Mol. Struc., 650 (2003) 131. 58 A.B.P. Lever, E.R. Milaeva and G. Speier, in Phthalocyanines: Properties and
applications, C.C. Leznoff and A.B.P. Lever (Ed.s), Vol. 3, VCH Publishers, New
York, 1989. 59 A.B.P. Lever, M.R. Hempstead, C.C. Leznoff, W. Liu, M. Melnik, W.A. Nevin and
P. Seymour, Pure Appl. Chem., 58 (1986) 1467. 60 M. L’Her and A. Pondaven. in The Porphyrin Handbook, K.M. Kadish, K.M. Smith
and R. Guilard (Ed.s), Vol. 16, Academic Press, San Diego, 2003. 61 A.B.P. Lever, S. Licoccia, K. Magnell, R.C. Minor and B.S. Ramaswamy, ACS
Symp. Ser., 201 (1982) 237. 62 T. Nyokong, S.A. J. Chem., 48 (1995) 23. 63 M.N. Golovin, P. Seymour, K. Jayaraj, Y.S. Fu and A.B.P. Lever, Inorg. Chem., 29
(1990) 1719. 64 T. Nyokong, Polyhedron, 12 (1993) 375.

Chapter 7 References
259
65 T. Kuwana, R.K. Darlington and D.W. Leedy, Anal. Chem., 36 (1964) 2023. 66J. Obirai and T. Nyokong, J. Electroanal. Chem., 573 (2004) 77. 67 D.B. Hibbert, in Introduction to Electrochemistry, Macmillan, London, 1993. 68 L. Gaffo, M.J.S.P. Brasil, F. Cerdeira, C. Giles and W.C. Moreira, J. Porphyrins
Phthalocyanines, 9 (2005) 89. 69 J.W. Dodd and N.S. Hush, J. Chem. Soc., (1964) 4607. 70 L.D. Rollman and R.T. Iwamoto, J. Am. Chem. Soc., 90 (1968) 1455. 71 D.W. Clack and J.R. Yandle, Inorg. Chem., 11 (1972) 1738. 72 G. Inzelt, in Electroanalytical methods: Guide to experiments and applications, F.
Scholz (Ed.), Springer 2002. 73 H. Kahlert, in Electroanalytical methods: Guide to experiments and applications, F.
Scholz (Ed.), Springer 2002. 74 W.R. Heineman and P.T. Kissinger, in Laboratory Techniques in Electroanalytical-
chemistry, 2nd ed, P.T. Kissinger and W.R. Heineman (Ed.s), Marcel Deccer Inc.,
New York, 1996. 75A.J. Bard and L.R. Faulkner, in Electrochemical Methods: Fundamentals and
Applications, John Willey & Sons, Toronto, 1996. 76J. O’M. Bockris and S.U.M. Khan, in Surface electrochemistry: A molecular level
approach, Plenum Press, New York, 1993. 77V.G. Levich, in Physicochemical hydrodynamics (English translation), Prentice
Hall, New Jersey, 1962. 78C.M.A. Brett and A.-M.O. Brett, in Electrochemistry, principles, methods and
applications, Oxford University Press, 1993. 79M.J. Aguirre, M. Isaacs, F. Armijo, L. Basaez and J.H. Zagal, Electroanalysis, 14
(2002) 356. 80 B. Wermeckers and F. Beck, Electrochim. Acta, 30 (1985) 1491. 81 J.H. Zagal, Coord. Chem. Rev., 119 (1992) 89 and references cited therein. 82 J.H. Zagal and C. Paez, Electrochim. Acta, 34 (1989) 243. 83J.-M. Zen, A.S. Kumar and M.-R. Chang, Electrochim. Acta, 45 (2000)1691. 84 J. Zagal, R.K. Sen and E. Yeager, J. Electroanal. Chem., 83 (1977) 207. 85M. Gulppi, F. Bedioui and J.H. Zagal, Electroanalysis, 13 (2001) 1136. 86 N.B. McKeown, Chem. Ind., (1999) 92. 87 J. Oni and T. Nyokong, Anal. Chim. Acta, 434 (2001) 9.
Chapter 7 References
260
88 J. Zagal, P. Bindra and E. Yeager, J. Electrochem. Soc., 127 (1980) 1506. 89S. Maree and T. Nyokong, J. Electroanal. Chem., 492 (2000) 120. 90M. Sekota and T. Nyokong, Polyhedron, 16 (1997) 3279. 91S. Ledru, N. Ruillé and M. Boujtita, Biosens. Bioelectron., 21 (2006) 1591. 92C.D. Kuhnline, M.G. Gangel, M.K. Hulvey and R.S. Martin, Analyst, 131 (2006)
202. 93A. Napier and J.P. Hart, Electroanalysis, 8 (1996) 1006. 94 T.J. Mafatle and T. Nyokong, J. Electroanal. Chem., 408 (1996) 213. 95 M.J. Cook, Pure Appl. Chem., 71 (2002) 2145. 96X. Lu, K.W. Hipps, X.D. Wang and U. Mazur, J. Am. Chem. Soc., 118 (1996) 7197. 97 M.J. Cook, J. Mater. Chem., 6 (1996) 677. 98 C.A. Caro, F. Bedioui and J.H. Zagal, Electrochim. Acta, 47 (2002) 1489. 99K.I. Ozoemena, P. Westbroek and T. Nyokong, Electrochem. Commun., 3 (2001)
529. 100 B.J. Hwang, R. Santhanam and Y.W. Chang, Electroanalysis, 14 (2002) 363. 101 J. Obirai, N. Pereira-Rodrigues, F. Bedioui and T. Nyokong, J. Porphyrins
Phthalocyanines, 7 (2003) 508. 102 S. Griveau and F. Bedioui, Electroanalysis, 13 (2001) 253. 103 M.J. Cook and A. JafariFini, J. Mater. Chem., 7 (1997) 5. 104 Z. Li and M.Lieberman, Langmuir, 17 (2001) 4887. 105 X. Li, W. Xu, X. Wang, H. Jia, B. Zhao, B. Li and Y. Ozaki, Thin Solid Films, 457
(2004) 372. 106 K.I. Ozoemena and T. Nyokong, J. Electroanal. Chem., 579 (2005) 283. 107Z. Li and M. Lieberman in Fundamental and applied aspects of chemically
modified surfaces, J.P. Blitz and C.B. Little (Eds), Royal society of chemistry.
Lettchworth, UK, 1999. 108K.I. Ozoemena and T. Nyokong, Talanta, 67 (2005) 162. 109 B. Liedberg and P. Tengvall, Langmuir, 11 (1995) 3821. 110 M.P. Somashekarappa, J. Keshavayya and S. Sampath, Pure Appl. Chem., 74
(2002) 1609. 111 M. Thamae and T. Nyokong, J. Electroanal. Chem., 579 (1999) 126. 112J. Obirai and T. Nyokong, Electrochim. Acta, 49 (2004) 1417.
Chapter 7 References
261
113S. Griveau, V. Albin, T. Pauporte, J.H. Zagal and F. Bedioui, J. Mater. Chem.,12
(2002) 225. 114 J. Obirai, F. Bedioui and T. Nyokong, J. Electroanal. Chem., 576 (2005) 323.
115E. Crouch, D.C. Cowell, S. Hoskins, R.W. Pittson and J.P. Hart, Anal. Biochem.,
347 (2005) 17. 116J. Wang and P.V.A. Pamidi, Talanta, 42 (1995) 463. 117S. Miserere, S. Ledru, N. Ruillé, S. Griveau, M. Boujtita and F. Bedioui,
Electrochem. Comm., 8 (2006) 238. 118J.R. de Sousa, A.A. Batista, I.C.N. Diogenes, G.F.S. Andrade, M.L.A. Temperini,
L.G.F. Lopes and I. D.-S. Moreira, J. Electroanal. Chem., 543 (2003) 93. 119J. Chen, J. Su, W. Wang and M.A. Reed, Physica E, 16 (2003) 17. 120Y. Naitoh, T. Matsumoto, K.-I. Sugiura, Y. Sakata and T. Kawai, Surf. Sci., 487
(2001) L534. 121M.S. El-Deab and T. Ahsaka, Electrochem. Commun., 5 (2003) 214. 122X. Huang, Y. Liu, S. Wang, S. Zhou and D. Zhu, Chem. Eur. J., 8 (2002) 4179. 123F. Bedioui, J. Devynck and C. Bied-Charreton, Acc. Chem. Res., 28 (1995) 30 and
references cited therein. 124K. Nishiyama, S.I. Tahara, Y. Uchida, S. Tanoue and I. Taniguchi, J. Electroanal.
Chem., 478 (1999) 83. 125K.V. Gothelf, J. Electroanal. Chem., 494 (2000) 147. 126H.O. Finklea in Electroanalytical Chemistry, A.J. Bard, I. Rubenstein (Eds), Vol 19
(and references therein), Marcel Dekker, New York, 1996. 127E. Sabatani and I. Rubinstein, J. Phys. Chem., 91 (1987) 6663. 128M.D. Porter, T.B. Bright, D. Allara and C.E.D. Chidsey, J. Am. Chem. Soc., 109
(1987) 3559. 129D. Losic, J.G. Shapter and J.J. Gooding, Langmuir, 17 (2001) 3307. 130J. Wang, J.L.P. Paz and M. Jiang, Langmuir, 15 (1999) 1884. 131D.L. Pilloud, X. Chen, P.L. Dutton and C.C. Moser, J. Phys. Chem. B, 104 (2000)
2868. 132K.I. Ozoemena and T. Nyokong, Electrochim. Acta, 47 (2002) 4035. 133H. Ohmori and I. Yamamoto, J. Exp. Med., 155 (1982) 1277. 134W.A. Kleinman and J.P. Richie, Biochem. Pharmacol., 60 (2000) 19.

Chapter 7 References
262
135A. Meister, J. Biol. Chem., 263 (1988) 17205. 136I. Chatti, A. Ghorbel, P. Grange and J.M. Colin, Catal. Today, 75 (2002) 113. 137P.M. Schweizer-Berberich, S. Vaihinger and W.Gopel, Sens. Actuators, B18-19
(1994) 282. 138D.L.H. Williams, Chem. Soc. Rev., 14 (1985) 171. 139C.M. Venturini, R.M. Palmer and S. Moncada, J. Pharmacol. Exp. Ther., 266
(1993) 1497. 140M.W. Radomski, D.D. Rees, A. Dutra and S. Moncada, Br. J. Pharmacol., 107
(1992) 745. 141E.J. Langford, A.S. Brown, A.J. de Belber, R.E.A. Smith, J.F. Martin, R.J.
Wainwright, M.R. Thomas, M.W. Radomski and S. Moncada, Lancet, 344 (1994)
1458. 142A.D. Belber, C. Lees, J. Martin, S. Moncada and S. Campbell, Lancet, 345 (1995)
124. 143S. Modi, S.S. Deodhar, D.V. Behere and S. Mitra, Biochemistry, 30 (1991) 118. 144D. Gao, J.-Z. Li, and R.-Q. Yu, Anal. Chem., 66 (1994) 2245. 145M.K. Amini, S. Shahrokhian and S. Tangestaninejad, Anal. Chim. Acta, 402 (1999)
137. 146N. Phougat and P. Vasudevan, J. Power Sources, 69 (1997) 161. 147E. Itabashi, Inorg. Chem., 24 (1985) 4024. 148S. Adak, A. Mazumdar and R.K. Banerjees, J. Biol. Chem., 272 (1997) 11049. 149T.M. Aune and E.L. Thomas, Eur. J. Biochem., 80 (1977) 209. 150E.L. Thomas, Biochemistry, 20 (1981) 3273. 151S. Modi, D.V. Behere and S. Mitra, Biochemistry, 28 (1989) 4689. 152S. Modi, D.V. Behere and S. Mitra, J. Biol. Chem., 264 (1989) 19677. 153V.K. Sharma, D.B. O’Connor and D. Cabelli, Inorg. Chimica Acta, 357 (2004)
4587. 154T. Ohta, T. Kamachi, Y. Shiota and K. Yoshizawa, J. Org. Chem., 6 (2001) 4122. 155T. Nyokong in N4-macrocyclic metal complexes, J.H. Zagal, F. Bedioui and J-P.
Dodelet (Ed.s), Springer, New York, 2006. 156K.I. Ozoemena, T. Nyokong and P. Westbroek, Electroanalysis, 14 (2003) 1. 157G.I. Cardenas-Jiron, M.A. Gulppi, C.A. Caro, R. del Rio, M. Paez and J.H. Zagal,
Electrochim. Acta, 46 (2001) 3227.
Chapter 7 References
263
158D. Mimica, F. Bedioui and J.H. Zagal, Electrochim. Acta, 48 (2002) 323. 159X. Qi and R.P. Baldwin, J. Electrochem. Soc., 143 (1996) 1283. 160M.A. Gulppi, M.A. Paez, J.A. Costamagna, G.I. Cardenas-Jiron, F. Bedioui and
J.H. Zagal, J. Electroanal. Chem., 580 (2005) 50. 161N. Pereira-Rodrigues, R. Cofré, J.H. Zagal and F. Bedioui, Bioelectrochem., 2006,
in press. 162D. Giustarini, A. Milzani, R. Colombo, I. Dalle-Donne and R. Rossi, Clin. Chim.
Acta, 330 (2003) 85. 163M.P. Gordge, J.S. Hothersall, G.H. Neild and A.A.N. Dutra, Br. J. Pharmacol., 119
(1996) 533. 164P.D. Wood, B. Mutus and R.W. Redmond, Photochem. Photobiol., 64 (1996) 518. 165R.J. Singh, N. Hogg, J. Joseph and B. Kalyanaraman, J. Biol. Chem., 271 (1996)
18596. 166M. David-Dufihlo, A. Brunet and F. Bedioui, Electroanalysis, 18 (2006) 1827. 167Y. Hou, J. Wang, F. Arias, L. Echegoyen and P. G. Wang, Bioorg. Med. Chem.
Lett., 8 (1998) 3065. 168S. Pfeiffer, A. Schrammel, K. Schmidt and B. Mayer, Anal. Biochem., 258 (1998)
68. 169H. Ikezawa, E. Miki, K. Mizumachi, T. Ishimori, T. Nagai and M. Tanaka, Bull.
Chem. Soc. Jpn., 66 (1993) 89. 170J.H. Zagal, M.A. Gulppi and G. Cardenas-Jiron, Polyhedron, 19 (2000) 2255. 171J.A.R. van Veen and C. Visser, Electrochim. Acta, 24 (1979) 921. 172G. Lalande, G. Faubert, R. Cote, D. Guay, J.P. Dodelet, L.T. Weng and P. Bertrand,
J. Power Sources, 61 (1996) 227. 173S. Baranton, C. Coutanceau, C. Roux, F. Hahn and J.M. Leger, J. Electroanal.
Chem., 577 (2005) 223. 174F. Beck, J. Appl. Electrochem., 7 (1977) 239. 175G. Lalande, R. Cote, G. Tamizhmani, D. Guay, J.P. Dodelet, L. Dignard-Bailey,
L.T. Weng and P. Bertrand, Electrochim. Acta, 40 (1995) 2635. 176K. Kinoshita, in Electrochemical oxygen technology, 1992, Wiley, New York. 177S. Popovici, W. Leyffer and R. Holze, J. Porphyrins Phthalocyanines, 2 (1998)
249.
Chapter 7 References
264
178Y. Tse, P. Janda, H. Lam, J. Zhang, W.J. Pietro and A.B.P. Lever, J. Porphyrins
Phthalocyanines, 1 (1997) 3. 179C. Coutanceau, P. Crouigneau, J.M. Leger and C. Lamy, J. Electroanal. Chem.,
379 (1994) 389. 180J.H. Zagal, R.K. Sen and E. Yeager, J. Electroanal. Chem., 83 (1977) 207. 181K. Oyaizu, A. Haryono, J. Natori and E. Tsuchida, J. Chem. Soc., Faraday Trans.,
94 (1998) 3737. 182J.H. Zagal, M. Paez, A.A. Tanaka, J.R. dos Santos and C.A. Linkous, J.
Electroanal. Chem., 339 (1992) 13. 183J.H. Zagal, M.J. Aguirre, L. Basaez and J. Pavez, in Oxygen Electrochemistry, The
Electrochem. Soc. Symposium Series, R.R. Adzic, F.C. Anson and K. Kinoshita
(Ed.s), Vol. 95(26), 1995. 184J.H. Zagal and G.I. Cardenas-Jiron, J. Electroanal. Chem., 489 (2000) 96. 185J.H. Zagal, M.A. Paez and J.F. Silva, in N4-macrocyclic metal complexes, J.H.
Zagal, F. Bedioui and J.-P. Dodelet (Ed.s), Springer, New York, 2006. 186N. Kobayashi, P. Janda and A.B.P. Lever, Inorg. Chem., 31 (1992) 5172. 187P. Janda, N. Kobayashi, P.R. Auburn, H. Lam, C.C. Leznoff and A.B.P. Lever,
Can. J. Chem., 67 (1989) 1109. 188J. Pavez, M. Paez, A. Ringuede, F. Bedioui and J.H. Zagal, J. Solid State
Electrochem., 9 (2005) 21. 189J.H. Zagal, M. Gulppi, M. Isaacs, G. Cardenas-Jiron and M.J. Aguirre, Electrochim.
Acta, 44 (1998) 1349. 190X.-B. Zhang, C.-C. Guo, J.-B. Xu and R.-Q. Yu, J. Mol. Cat. A: Chem., 154 (2000)
31. 191K.T. Moore, I.T. Horváth and M.J. Therien, Inorg. Chem., 39 (2000) 3125. 192F.G. Doro, J.R.L. Smith, A.G. Ferreira and M.D. Assis, J. Mol. Cat. A: Chem., 164
(2000) 97. 193H.C. Sacvo, Y. Iamamoto and J.R.L. Smith, J. Chem. Soc. Perkin Trans., 2 (2001)
181. 194Y.-W. Chan and R.B. Wilson Jr., ACS Natl. Meeting, 33 (1988) 453. 195S. Seelan, M.S. Agashe, D. Srinivas and S. Sivasanker, J. Mol. Catal. A: Chem.,
168 (2001) 61. 196N. Grootboom and T. Nyokong, J. Mol. Catal. A: Chem., 179 (2002) 113.
Chapter 7 References
265
197K.E. Simmons and D.E. van Sickle, J. Am. Chem. Soc., 95 (1973) 7759. 198R.R. Diaz, K. Selby and D.J. Waddington, J. Chem. Soc. Perkin. Trans., 2 (1975)
758. 199W. Nam, Y.M. Goh, Y.J. Lee, M.H. Lim and C. Kim, Inorg. Chem., 38 (1999)
3238. 200M. Salavati-Niasari, F. Farzaneh and M. Ghandi, J. Mol. Catal. A: Chem., 186
(2002) 101. 201M.E. Nino, S.A. Giraldo and E.A. Paez-Mozo, J. Mol. Cat. A: Chem., 175 (2001)
139. 202J.-W. Huang, W-Z. Huang, W-J. Mei, J. Liu, S-G. Hu and L-N. Ji, J. Mol. Catal. A:
Chem., 156 (2000) 275. 203N.A. Kuznetsova, N.S. Gretsova, V.M. Derkachera, O.L. Kaliya and E.A.
Luk’yanets, J. Porphyrins Phthalocyanines, 7 (2003) 147. 204M.A. Schiavon, Y. Iamamoto, O.R. Nascimento and M. D. Assis, J. Mol. Cat. A:
Chem., 174 (2001) 213.
205 A.N. de Sousa, M.E.M.D. de Carvalho and Y.M. Idemori, J. Mol. Cat. A: Chem.,
169 (2001) 1.
206N. Safari and F. Bahadoran, J. Mol. Cat. A: Chem., 171 (2001) 115. 207K. Kasuga, K. Tsuboi, M. Handa, T. Sugimori and K. Sogabe, Inorg. Chem.
Comm., 2 (1999) 507. 208A. Jablonski, Nature, 131 (1933) 839. 209A. Jablonski, Z. Phys., 73 (1931) 460. 210R. Bonnett, Chem. Soc. Rev., 24 (1995) 19. 211R. Bonnett, in Chemical Aspects of Photodynamic Therapy: Advanced Chemistry
Texts, D. Phillips, P. O’Brein and S. Roberts (Ed.s), Vol. 1, Gordon & Breach,
Germany, 2000. 212A.K.Sobbi, D. Wohrle and D. Schlettwein, J. Chem. Soc. Perkin Trans., 2 (1993)
481. 213 I. Rosenthal and E. Ben-Hur, Int. J. Radiat. Biol., 67 (1995) 85. 214 J.A.S. Cavaleiro, M.G.P.S. Neves, M.J.E. Hewlis and A.H. Jackson, J. Chem. Soc.
Perkin Trans., 1 (1990) 1937.
Chapter 7 References
266
215W. Spiller, H. Kliesch, D. Wohrle, S. Hackbarth, B. Roder and G. Schnurpfeil, J.
Porphyrins Phthalocyanines, 1 (1997) 159. 216N.A. Kuznetsova, E. Makarova, S. Dashkevich, N. Gretsova, V. Negrimovsky, O.
Kaliya and E. Luk’yanets, Zh. Obshch. Khim., 70 (2000) 140. 217T. Shiragami, K. Kubomura, D. Ishibashi and H. Inoue, J. Am. Chem. Soc., 118
(1996) 6311. 218S. Takagi, T. Okamoto, T. Shiragami and H. Inoue, J. Org. Chem., 59 (1994) 7373. 219P.E. Esser, B. Drieben-Holscher and W. Keim, J. Mol. Cat. A: Chem., 140 (1999)
13. 220A. Maldotti, L. Andreotti, A. Molinari, S. Borisov and V. Vasil’ev, Chem. Eur. J.,
7 (2001) 3564. 221J. Obirai and T. Nyokong, Electrochim. Acta, 50 (2005) 5427. 222J. Obirai and T. Nyokong, Electrochim. Acta, 50 (2005) 3296. 223R. D. Mair and A. J. Graupner, Anal. Chem., 36 (1964) 194. 224J. Premkumar and R. Ramaraj, J. Mol. Catal A: Chem., 142 (1999) 153. 225J. Mertz, O. Scheider and M. Hanack, Inorg. Chem., 23 (1984) 1065. 226H. Tomoda, S. Saito and S. Shiraishi, Chem. Lett., (1983) 313. 227N. Trobach, O. Hild, D. Schettwein and D. Wöhrle, J. Mat. Chem., 12 (2002) 879. 228 D. Wöhrle, M. Eskes, K. Shigehara, A. Yamada, Synthesis (1993) 194. 229S. Griveau, M. Gulppi, F. Bedioui and J. Zagal, Solid State Ionics, 169 (2004) 59. 230J. H. Zagal, M. A.Gulppi, C. A. Caro, and G. I. Cardenas-Jiron, Electrochem
Comm., 1 (1999) 389. 231R. O. Lezna, S. Juanto, and J. H. Zagal, J. Electroanal. Chem., 452 (1998) 221. 232D. Martel, N. Sojic and A. Kuhn, J. Chem. Educ., 79 (2002) 349. 233G. Kalyuzhny, A. Vaskevich, G. Ashkenasy, A. Shanzer and I. Rubinstein, J. Phys.
Chem., B 104 (2000) 8238. 234D. J. Revell, I. Chambrier, M. J. Cook, and D. A. Russell, J. Mater. Chem., 10
(2000) 31. 235S. S. Khaloo, M. K. Amini, S. Tangestaninejad, S. Shahrokhian and R. Kia, J.
Iranian Chemical Society, 1 (2004) 128. 236S.M. Golabi, H.R. Zare, and M. Hamzehloo, Microchem. J., 69 (2001) 111. 237A. Salimi and K. Abdi, Talanta, 63 (2004) 475. 238M.E.G. Lyons, C.A. Fitzgerald, and M.R. Smyth, Analyst, 119 (1994) 855.
Chapter 7 References
267
239M.K. Halbert and R.P. Baldwin, Anal. Chem., 57 (1985) 591. 240S. Griveau, M. Gulppi, J. Pavez, J. H. Zagal, and F. Bedioui, Electroanalysis, 15
(2003) 779. 241J. Vitecek, J. Petrlova, J. Petrek, V. Adam, D. Potesil, L. Havel, R. Mikelova, L.
Trnkova and R. Kizek, Electrochim. Acta, 51 (2006) 5087. 242A. C. Gorren, A. Schrammel, K. Schmidt and B. Mayer, Arch. Biochem. Biophys.,
330 (1996) 219. 243E. Ford, M. N. Hughes and P. Wardman, Free Radic. Biol. Med., 32 (2002) 1314. 244E. Bald, G. Chwatko, R. Glowacki and K. Kusmierek, J. Chromatogr. A, 1032
(2004) 109. 245E. Bramanti, C. Vecoli, D. Neglia, M. P. Pellegrini, G. Raspi, and R. Barsacchi,
Clin. Chem., 51 (2005) 1007. 246K. Ozoemena, T. Nyokong and P. Westbroek, Electroanalysis, 15 (2003) 1762. 247M. Ebadi, C. Alexiou and A.B.P. Lever, Can. J. Chem., 79 (2001) 992. 248J. Zhang and F. C. Anson, J. Electroanal. Chem., 341 (1992) 323. 249D. Schlettwein, J.P. Meyer and N.I. Jaeger, J. Porphyrins Phthalocyanines,
4 (2000) 23. 250B.E. Williamson, T.C. VanCott, M.E. Boyle, G.C. Misener, M.J. Stillman
and P. N. Schatz, J. Am. Chem. Soc., 114 (1992) 2412. 251A. B. P. Lever, J. P. Wilshire and S. K. Quan, J. Am. Chem. Soc., 101 (1979)
3668. 252A.B.P. Lever, J.P. Wilshire and S.K. Quan, Inorg.Chem., 20 (1981) 761. 253C. Coutanceau, A. Rakotondrainibe, P. Crouigneau, J.M. Leger, and C. Lamy, J.
Electroanal. Chem., 386 (1995) 173. 254W. Nam, M.H. Lim, S.-Y. Oh, J.H. Lee, H.J. Lee, S.K. Woo, C. Kim, W. Shin,
Angew Chem. Int. Ed., 39 (2000) 3646.
255W. Nam, H.J. Lee, S-Y. Oh, C. Kim and H.G. Jang, J. Inorg. Biochem., 80 (2000)
219.
256Y. Watanabe, J. Biol. Inorg. Chem., 6 (2001) 846. 257A. Hadasch, A. Sorokin, A. Rabion, L. Fraisse and B. Meunier, New J. Chem.,
(1998) 45.
Chapter 7 References
268
258G. Ferraudi, in Phthalocyanines: Properties and Applications, C.C. Leznoff and
A.B.P. Lever (Eds.), Vol. 1, VCH Publishers, New York,1989. 259I.V. Renge, V.A. Kuz’min, A.F. Mironov and Y.E. Borisevich, Doklady Akademii
Nauk SSSR., 263 (1982) 143. 260Z. Gasyna, W.R. Browett and M.J. Stillman, Inorg. Chim. Acta, 92 (1984) 37. 261K. Kasuga, H. Morimoto and M. Ando, Inorg. Chem., 25 (1986) 2478. 262B.M. Monroe, J. Am. Chem. Soc., 82 (1978) 15. 263P.D. Bartlett and A.P. Schaap, J. Am. Chem. Soc., 92 (1970) 3223. 264C.S. Foote and J.W. Peters, J. Am. Chem. Soc., 93 (1971) 3795. 265P.R. Ogilby and C.S. Foote, J. Am. Chem. Soc., 103 (1981) 1220. 266L.E. Manring and C.S. Foote, J. Am. Chem. Soc., 105 (1983) 4710.