photosystem ii-based biosensor for the detection … · detection for explosives, ... his...
TRANSCRIPT

PHOTOSYSTEM II-BASED BIOSENSOR FOR THE
DETECTION OF EXPLOSIVE COMPOUNDS
ZHAO XIN
A THESIS
IN
THE DEPARTMENT
OF
CHEMISTRY AND BIOCHEMISTRY
PRESENTED IN PARTIAL FULFILLMENT OF THE REQUIREMENTS
F O R THE DEGREE OF MASTER OF SCIENCE
CONCORDIA UNIVERSITY
MONTREAL, QUEBEC, CANADA
SEPTEMBER 2010
© ZHAO XIN, 2010

1*1 Library and Archives Canada
Published Heritage Branch
395 Wellington Street Ottawa ON K1A 0N4 Canada
Bibliotheque et Archives Canada
Direction du Patrimoine de I'edition
395, rue Wellington Ottawa ON K1A 0N4 Canada
Your file Votre r6f6rence ISBN: 978-0-494-80153-6 Our file Notre r6f6rence ISBN: 978-0-494-80153-6
NOTICE: AVIS:
The author has granted a nonexclusive license allowing Library and Archives Canada to reproduce, publish, archive, preserve, conserve, communicate to the public by telecommunication or on the Internet, loan, distribute and sell theses worldwide, for commercial or noncommercial purposes, in microform, paper, electronic and/or any other formats.
L'auteur a accorde une licence non exclusive permettant a la Bibliotheque et Archives Canada de reproduire, publier, archiver, sauvegarder, conserver, transmettre au public par telecommunication ou par I'lnternet, preter, distribuer et vendre des theses partout dans le monde, a des fins commerciales ou autres, sur support microforme, papier, electronique et/ou autres formats.
The author retains copyright ownership and moral rights in this thesis. Neither the thesis nor substantial extracts from it may be printed or otherwise reproduced without the author's permission.
L'auteur conserve la propriete du droit d'auteur et des droits moraux qui protege cette these. Ni la these ni des extraits substantiels de celle-ci ne doivent etre imprimes ou autrement reproduits sans son autorisation.
In compliance with the Canadian Privacy Act some supporting forms may have been removed from this thesis.
Conformement a la loi canadienne sur la protection de la vie privee, quelques formulaires secondaires ont ete enleves de cette these.
While these forms may be included in the document page count, their removal does not represent any loss of content from the thesis.
Bien que ces formulaires aient inclus dans la pagination, il n'y aura aucun contenu manquant.
1*1
Canada

Abstract
Photosystem II-Based Biosensor for the Detection of Explosive
Compounds
Zhao Xin
Research on herbicide biosensors based on plant photosystem II (PS II) or on
reaction centers of purple bacteria (BRC) has been on-going for the past decade.
Herbicides inhibit functioning of the PS II by competitively binding to the QB
plastoquinone binding site. The structural similarity between nitric explosives and
nitrophenolic- and atrazine-type herbicides inspired us to explore whether nitric
explosives would inhibit photosynthesis via the same mechanism (involving Q B site)
as the herbicides. The design of the explosives biosensor was similar to that of
the biosensors for herbicides. The detection was achieved by photo-electrochemical
methods, employing PS II immobilized on a screen-printed electrode as a part of
electrical circuit; optical spectroscopy was used as a supplementary method. We have
demonstrated that this electrochemical biosensor is capable of detecting explosives
such as picric acid, TNT and tetryl. The magnitude of the peak current induced
by illumination depends on the concentration of the explosive in the same manner
as in the case of herbicides, which suggests that Q B binding site is indeed involved
in the PS II inhibition of the selected explosive compounds. However, the limits of
detection for explosives, especially for TNT, appear to be higher (i.e. worse) than for
the herbicides. Modeling of photosynthesis inhibitor docking on PS II has also been
performed to determine the reasons for poor TNT detection.
hi

Acknowledgments
This work is dedicated to my parents in China. Without their encouragement and
support it would have been impossible for me to finish this work.
I would like to express my deep and sincere gratitude to my supervisor, Dr. Valter
Zazubovits. His wide knowledge and his logical way of thinking have been of great
value for me. His understanding, encouraging and personal guidance have provided
a good basis for the present thesis.
I also owe my most sincere gratitude to Dr. Vijayender Bhalla, who has started
his new research career in India. His professional knowledge in the field and patient
help was of crucial importance during my whole study.
I am happy to acknowledge my friends in Concordia University: Sasmit Deshmukh,
Zhuo Xuan Yang, Beste Korutlu and Nicoleta Herascu for their helpful discussions
and comments.
Finally, I want to thank the Canada Foundation for Innovation and NSERC for
their financial support.
IV

Contents
List of Figures vii
List of Tables ix
List of Abbrev ia t ions x
1 I n t r o d u c t i o n 1
2 P h o t o s y s t e m I I 6
2.1 Basic principles of photosynthesis 6
2.2 Structure of PS II complex 9
2.3 Isolation of PS II 16
2.4 Electron transfer process in the PS II complex 18
2.5 Quinone binding site in PS II 20
2.6 Binding of the inhibitors at the QB site 23
3 Mate r i a l a n d M e t h o d 28
3.1 Preparation of PS II samples 28
3.1.1 Purification of thylakoid membranes 28
3.1.2 Purification of BBY Membranes 30
3.2 DCPIP assay 31
3.2.1 Photosynthetic activity 32
3.2.2 Effect of PS II inhibitors on DCPIP measurement 33
3.3 Immobilization of PS II particles for the biosensor 33
3.4 Photo-electrochemical measurements 34
3.5 Analysis of inhibitor binding 38
3.6 Components of buffers 39
v

4 Detection of explosives/herbicides with biosensor 40
4.1 Principle of detection using biosensor 40
4.2 Characteristics of the PS II membranes 42
4.3 Optimization of biosensor activity 47
4.4 Results of detection with the biosensor . 50
4.5 Supplemental studies of TNT 55
5 Molecular modeling of inhibitors binding to PS II 60
5.1 Introduction to Autodock 60
5.2 Docking of inhibitors by AutoDock Vina 62
5.2.1 Docking of Plastoquinone 63
5.2.2 Docking of explosive molecules 65
5.2.3 Docking of herbicide molecules 69
5.2.4 Discussion of docking results by AutoDock 71
6 Conclusion 74
Bibliography 76
VI

List of Figures
2.1.1 The Z-scheme of oxygenic photosynthesis 7
2.1.2 The overall reaction of PS II 8
2.2.1 Organization of protein complexes in thylakoid membranes 9
2.2.2 Overall Structure of PS II core complex 14
2.3.1 Thylakoid structures 16
2.3.2 Different chlorophyll containing bands in different components of
thylakoid membrane 17
2.4.1 PS II primary electron transport and oxygen evolution 18
2.5.1 PS II RC cofactors involved in electron transfer 21
2.5.2 Electron acceptors of PS II 22
2.6.1 Schematic figure of the plastoquinone/herbicide binding pocket of the
Dl protein 25
2.6.2 Displacement of Q B by inhibitors 25
2.6.3 Herbicides as PS II inhibitors and explosives as potential inhibitors . 27
3.2.1 The reduction of DCPIP 31
3.4.1 Theoretical cyclic voltammogram 36
3.4.2 Scheme of amprometric readout upon increasing the concentration of
the inhibitors 38
4.1.1 Photocurrent signals of DCMU detection 42
4.2.1 UV-Vis spectra of PS II particles during preparations 43
4.2.2 Photo-current signals of biosensor employing (A) thylakoid membrane
and (B)BBY membrane 45
4.3.1 Wavelength dependence of photocurrent signals of the BBY-based
biosensor 48
4.3.2 Time dependence of stability of the biosensor 49
4.4.1 Binding curves of DCMU and explosives in the presence of 0.2mM DQ 51
Vll

4.5.1 Binding curves of TNT in the presence of ImM FeCy 55
4.5.2 Binding curve of TNT-DCPIP assay 56
4.5.3 Recoverability of biosensor after the detection of TNT 58
5.2.1 Model of binding site of PQ in the QB pocket by Takahashi et al. . . 63
5.2.2 Binding of PQ in the QB pocket of PS II 64
5.2.3 Binding of picric acid in the QB pocket of PS II 66
5.2.4 Two models of binding of TNT on PS II 67
5.2.5 Binding of tetryl in the QB pocket of PS II 68
5.2.6 Two models of binding of DCMU in the QB pocket 69
5.2.7 Binding of atrazine in the QB pocket of PS II 70
vm

List of Tables
2.2.1 The PS II subunits: primary and secondary structure, and function . 10
3.6.1 Components of buffers 39
4.2.1 Chlorophyll content from spectra in Figure 4.2.1 44
4.2.2 Photocurrent signal performance of biosensors immobilized with
thylakoid membrane and BBY membrane 46
4.4.1 Detection results based on binding curves in Figure 4.4.1 . 52
5.2.1 Modeling results of the PS II inhibitors binding to the QB pocket . . 73
IX

List of Abbreviations
ATP
BRC
BSA
Chi
Cyt
DCMU
DCPIP
DQ
EC50
FeCy
LHC
LOD
NADP
OEC
PDB
PQ
PQH2
PS II
RDX
RMS
Adenosine triphosphate
Bacteria reaction center
Bovine serum albumin
Chlorophyll
Cytochrome
3-(3,4-dichlorophenyl)-l,l-dimethylurea
2,6-Dichlorophenolindophenol,
Duroquinone
Half maximum efficient concentration
Ferricyanide
Light harvesting complex
Limit of detection
Nicotinamide adenine dinucleotide phosphate
Oxygen-evolving center
Protein Data Bank
Plastoquinone
Plastoquinol
Photosystem II
Cyclotrimethylenetrinitr amine
Root mean square
X

SNR Signal to noise ratio
TNT Trinitrotoluene

Chapter 1
Introduction
Nitric explosives, e.g. TNT, RDX, and nitrophenols comprise one of the largest
classes of explosives and are frequently used by terrorist organizations around the
world because of their ease of manufacture and because of their relative accessibility
due to the extensive use by the military and commercial enterprises. Various methods
for detection of explosives have been developed or proposed. Unfortunately, the
most sensitive of them, such as liquid or gas chromatography, are relatively slow
and require instrumentation that is too complex and expensive for use in the field.
Various other approaches have been recently proposed. For example, quenching of
the fluorescence of pyrene [1], Nile Red [2] or semiconductor organic polymers [3] by
nitric explosives was described. The last approach is currently being commercialized
[4]. Selective detection of explosives using immunosensors is based on the high
affinity and selectivity of the analyte/antibody interaction that is detected using
either plasmon resonance [5] or changes in the fluorescence or bioluminescence of
the reporter proteins incorporated into the antibody [6]. However, antibodies are
1

difficult to prepare, and are very analyte-specific and have issues of stability in harsh
environments. Summarizing, there is an apparent need to continue the development of
new methods of detection of explosives, with the long-term objective of making them
faster, less expensive, more sensitive and more reliable. One should also note that
for the purposes of reducing the number of the false positives, it would be beneficial
to introduce systems with several "orthogonal" detection technologies (i.e. utilizing
different physical, chemical or biological principles).
In this thesis, we describe development of a droplet biosensor system based on
inhibition of Photosystem II (PS II) to sense trace levels of explosive compounds. The
idea for such a sensor is inspired by recent progress in the development of inexpensive
and sensitive herbicide biosensors based on photosynthetic reaction centers [7, 8]. It
is important to note that the chemical structures of nitric explosives are very similar
to those of the herbicides detectable by these biosensors; moreover, nitric explosives
are known to be strong electron acceptors. Thus, detection of explosives by natural
photosynthetic RC-based sensors seems quite promising. PS II is a transmembrane
protein complex responsible for the water splitting and oxygen evolution; it is a part
of the electron transfer chain in photosynthesis. In PS II optical energy is utilized
to cause charge separation starting with the formation of P680+-Pheo~ pair. The
electron then travels from the pheophytine to immobile quinone QA and then to
mobile quinone QB- The latter accepts two electrons (and two protons from water),
transforms to hydroquinone and carries the electrons away.
The development of the PS II-based herbicide biosensors has been reported in a
2

series of papers [9, 10]. The most recent setup of Koblizek et al. [9] employs screen-
printed graphite electrodes and PS II from thermophilic cyanobacteria immobilized
in a BSA-glutaraldehyde matrix [9]. The mechanism of inhibition of photosynthetic
reaction centers by herbicides involves herbicide molecules attaching to the QB binding
site of the mobile plastoquinone electron acceptor and preventing the latter from
binding. The exposure of the sensor to the inhibitor results in a decrease of the
photoinduced current in an electrical circuit containing the photosynthetic reaction
centers. The photocurrent signal is registered by potential control method so that
the inhibition ability can be quantized.
Detection of TNT, picric acid and tetryl will be considered in this study. Picric
acid, or 2,4,6-trinitrophenol, one of the most acidic phenols, is a yellow crystalline
solid, easily soluble in water. Like other highly nitrated compounds such as TNT,
picric acid is an explosive which was widely employed during the World War I. It
is also used for various laboratory purposes, such as staining biological samples and
preservation of specimens. On exposure to metals picric acid forms picrate salts
which are even more sensitive than the picric acid itself. Some optical sensors for
the detection of picric acid have been reported [11, 12, 13, 14]. Some evidence of
picric acid being an inhibitor of photosynthetic electron transport in PS II has been
reported a while ago [15].
TNT is used in organic synthesis but is best known as an explosive material with
convenient handling properties. Among the commonly used methods for detection of
TNT are spectrophotometric [16, 17], immunoassay [18, 5] and electrochemical [19].
3

TNT is a strong electron acceptor and this very property has been used recently for
detection purposes employing quenching of photoluminescence of polysiloles [20]. The
solubility of TNT in water varies from 100 to 200 mg/L at room temperature [21].
It is readily taken up by plant roots from the soil [22] and it is known to inhibit the
growth of the plants [23].
2,4,6-Trinitrophenylmethylnitramine (commonly referred to as tetryl) is a sensitive
explosive compound used to make detonators and explosive booster charges. Because
of its extreme thermal and base lability as well as its propensity to undergo
photodecomposition in water and soil extracts [24], an appropriate analytical
methodology needs to be developed which is rapid and accurate. HPLC was applied
in analyzing of the metabolism of tetyl in plant by Harvey et al [25]. The early
research reported that nitrite group on tetryl could be eliminated by ferredoxin
NADP oxidoreductase [26]. Hodyss and Beauchamp [27] used a multidimentinal
GC-Pyrolysis-Ultraviolet system to detect nitroorganic explosives and reported a
detection limit of 50 ng for tetryl.
At the beginning of this thesis we will review the background information
on Photosystem II , i.e. the protein structure, the photosynthetic function, the
preparation method and the inhibition on QB binding site by specified compounds.
The experimental methods concerning the fabrication of PS II-based biosensor and the
electrochemistry measurement will be described in the following chapter. The results
of detecting explosive/herbicide compounds will be presented in Chapter 4, where the
performance of the biosensor and the mechanism of inhibition will also be studied.
4

We also attempted molecular modeling with a latest version of AutoDock program
to simulate the conformation of explosive/herbicide binding to the QB pocket. These
modeling studies are discussed in Chapter 5.
5

Chapter 2
Photosystem II
2.1 Basic principles of photosynthesis
Photosynthesis uses light energy to convert C 0 2 into readily usable carbohydrates
with water acting as the source of electrons and protons and O2 forming as by-product.
This process occurs in plants, algae and many species of bacteria. Essentially all life
on Earth depends on photosynthesis, because it simultaneously generates an aerobic
atmosphere, and provides energy either directly or indirectly to all organisms.
Chlorophyll was identified as the major light absorber for driving the process
in 1874 [28]. Robert Emerson and William Arnold [29] demonstrated that several
hundred Chi molecules worked together to produce one 0 2 molecule. This led to the
concept of the 'photosynthetic unit' as a network operating in O2 evolving organisms,
which is known as the photosystem nowadays.
6

\ t
Q* L-* Qt- NM
E to •* V)
o o
^F* 'RAOTH
FD
Light Energy *FTffi
wMH*1 WI^W Mty
HABP*
Z-seheroe diagram
Maw Ca*a>> at t at M A t a
Figure 2.1.1: The Z-scheme of oxygenic photosynthesis The Z-scheme of oxygenic photosynthesis for electron transfer from water to nicotinamide adenine dinucleotide phosphate (NADP) modified from Fig. 4 of Govindjee [30]. From left to right: Mn stands for Mn cluster; Tyr, for tyrosine-161 on the Dl protein; P680, for the primary electron donor of PS II; Pheo, for pheophytin; QA, for the first PQ electron acceptor of PS II; QB, for the second PQ electron acceptor of PS II; PQ, for the plastoquinone pool; Cyt D6L and Cyt D6H, for low and high potential cytochrome b^; Cyt /, for cytochrome / ; FeS, for Rieske iron sulfur; PC, for plastocyanin; P700, for the primary electron donor for PS I; Ao, for a monomer Chi; Ai, for vitamin K; Fx , FA and F B , for iron sulfur centers 'x', 'A' and 'B, ' respectively; and FD, for ferredoxin.
The terms 'Photosystem I' and 'Photosystem II' were first proposed by Duysens
[31] in his research of 'Z-scheme' (Figure 2.1.1) of oxygenic photosynthesis. In this
scheme, PS II is shown as the functional unit transferring electrons from water
to the plastoquinone (PQ), an electron acceptor that in turn donates electrons
via the cytochrome (Cyt) complex to PS I, in which the NADP+ (Nicotinamide
adenine dinucleotide phosphate) is reduced to NADPH. The whole electron transport
generates a proton gradient across the thylakoid membrane. This proton motive force
7

is then used to drive the synthesis of ATP. Hence the role of PS II in the total process
is a water/plastoquinone oxido-reductase (Figure 2.1.2).
In bacterial photosynthesis, BRC is responsible for transferring the electron to
establish a proton gradient across the membrane, which is ultimately used by ATP
synthetase to form ATP. The structure and function of the PS II are evolutionarily
related to BRC, but are more complex and evolved. The homologies between BRC
and PS II have been the foundation of the modeling for the PS II reaction center
complex until structures of PS II from several organisms became available recently
[32].
2H,(> <K
Plastoquinone Plastoquinol
Figure 2.1.2: The overall reaction of PS II
The PS II reaction center uses light energy to oxidize water and to reduce plastoquinone.
8

2.2 Structure of PS II complex
PS II is located in the thylakoid membrane of plants, algae and cyanobacteria. The PS
II complex spans the thylakoid membrane, with an oxygen evolving (water-splitting)
center on the lumenal side, a plastoquinone reduction site on the stromal side, and
the light-harvesting chlorophyll antenna proteins (Figure 2.2.1 [33]). Over 20 subunits
associating with other cofactors and light harvesting proteins are involved in the PS II
complex. These components are named after the genes encoding them. The structure,
cofactor organization, and function of these subunits have been studied in detail and
are summarized in Table 2.2.1 [34].
Figure 2.2.1: Organization of protein complexes in thylakoid membranes
LHC II and LHC I are peripheral light-harvesting chlorophyll proteins of PS II and PS I, respectively. OEC is oxygen-evolving complex.
9

Table 2.2.1: The PS II sub units: primary and secondary
structure, and function
Gene
psbA
psbD
psbE
psbF
psbl
psbB
psbC
psbH
psbK
psbL
psbM
psbN
psbO
Subunit
Dl
D2
a-cyt b559
/3-cyt b559
I protein
CP47
CP43
H protein
K protein
L protein
M protein
N protein
33-kDa ext.
protein
Mass
(kDa)
38.021
39.418
9.255
4.409
4.195
56.278
50.066
7.697
4.283
4.366
3.755
4.722
26.539
No. of
a-helices
5
5
1
1
1
6
6
1
1
1
1
1
0
Function
Yz & binds P680, Pheo, QB
Yd & binds P680, QA
Binds heme, photoprotection
Binds heme, photoprotection
Unknown
Excitation energy transfer,
binds 33 kDa
Excitation energy transfer
binds 33 kDa
Photoprotection
PSII assembly, PSII stability
Involved in QA function
Unknown
Unknown
Stabilizes Mn cluster,
Continued on next page
10

Table 2.2.1 (continued)
Gene
psbP
psbQ
psbR
psbS
psbT
psbV
psbW
psbX
lhcb4
lhcb5
lhcb6
Subunit
23-kDa ext.
protein
16-kDa ext.
protein
R protein
S protein
T protein
V protein
W protein
X protein
CP29
CP26
CP24
Mass
(kDa)
20.21
16.523
10.236
21.705
3.283
15.121
5.928
4.225
29
26
24
No. of
a-helices
0
0
0
4
0
0
1
1
3
3
3
Function
Ca2+ & CI" binding
Ca2 + k CI" binding
Ca2 + & CI- binding
Donor and acceptor
side functions
Chi chaperonin/antenna
component
Unknown
Donor side stability
Unknown
QA function
Excitation energy transfer
& dissipation
Excitation energy transfer
& dissipation
Excitation energy transfer
Continued on next page
11

Table 2.2.1(continued)
Gene
psbJ
psbU
Ihcbl
lhcb2
IhcbS
Subunit
J protein
U protein
Lhcbl
Lhcb2
Lhcb3
Mass
(kDa)
4.116
10
25
25
25
No. of
a-helices
1
Unknown
3
3
3
Function
k, dissipation
PSII assembly
Unknown
Light harvesting
Light harvesting
Light harvesting
12

The core of PS II complex is composed of two subunits-Dl and D2. These two
subunits are almost identical and are highly hydrophobic. They contain P680, the
OEC, two pheophytins, two plastoquinones, and a non-heme iron ion. The overall
structure of PS II is shown in Figure 2.2.2 [32] . Dl and D2 subunits each comprise
five transmembrane helices organized in a manner almost identical to that of the L
and M subunits of the BRC. Nevertheless, the C-terminal domains and the loops
joining the transmembrane helices are more extended in the case of the Dl and D2
subunits compared with BRC, especially on the lumenal side close to the OEC.
P680 stands for the pigments that play the key role in primary charge separation
and are absorbing light at wavelength of 680 nm. It is a chlorophyll a multimer
with outstanding features. Its cationic radical P680+ has one of the highest redox
potentials found in nature, estimated to be 1.3 to 1.4 V, and is thereby capable of
oxidating water through the OEC. On the basis of an X-ray study [32], OEC is a
cubane-like MnsCa04 cluster linked to a fourth Mn ion by a mono-//-oxo bridge.
Specifically, each metal ion in this cluster has three-/i-oxo bridges (the large domain)
connected to another Mn ion by a mono-/i-oxo bridge in the extended region. QA,
non-heme Fe and QB are localized to face the matrix space of the chloroplast. The
binding sites of QA and QB will be discussed later. The non-heme Fe is linked in
between the two plastoquinones by histidine ligand bonds and mediates the electron
transport from QA to QB. Two pheophytins, PheoDi and Pheoo2 are bound to Dl and
D2, respectively. They are involved in the primary electron transfer in association
with other reaction center pigments.
13

Figure 2.2.2: Overall Structure of PS II core complex
(A) View of the PSII dimer perpendicular to the membrane normal. Helices are represented as cylinders with Dl in yellow; D2 in orange; CP47 in red; CP43 in green; cyt b559 in wine red; PsbL, PsbM, and PsbT in medium blue; and PsbH, Psbl, PsbJ, PsbK, PsbX, PsbZ, and the putative PsbN in gray. The extrinsic proteins are PsbO in blue, PsbU in magenta, and PsbV in cyan. Chlorophylls of the D1/D2 reaction center are light green, pheophytins are blue, chlorophylls of the antenna complexes are dark green, -carotenes are in orange, hemes are in red, non-heme Fe is red, QA and Q B are purple. The OEC is shown as the red (oxygen atoms), magenta (Mn ions), and cyan (Ca2+) balls. (B) View of the PSII monomer along the membrane normal from the lumenal side. A part of the other monomer in the dimmer is shown to emphasize the region of monomer/monomer interaction along the dotted line. The pseudo-twofold axis perpendicular to the membrane plane passing through the non-heme Fe relates the transmembrane helices of the D1/D2 heterodimer, the low molecular subunits, Psbl and PsbX, and CP43 and CP47 as emphasized by the black lines encircling these subunits. Coloring is the same as in (A).
14

Flanking the opposite sides of the D1/D2 heterodimer are the CP43 and CP47
subunits which together carry about 30 core 'antenna chlorophylls' and transfer
exitation energy to P680. Each antenna complex possesses six transmembrane helices
that are arranged in pairs to form a trimer of dimers. The two antenna complexes
and the RC heterodimer function together as a pseudo-symmetric CP43/D1-D2/CP47
core complex. The main function of CP43 and CP47 in energy transfer is to provide
a conduit for excitation energy transfer from the exterior antennae (LHC) of the
photosystem (the intrinsic LHC in green algae and higher plants, and the extrinsic
phycobilosomes in most cyanobacteria and red algae) to the reaction center core. In
addition to their roles as proximal antennae proteins for the photosystem, both CP47
and CP43 appear to interact with proteins associated with the site of water oxidation
[35].
Among the other 10 subunits attached outside the core complex, Cyt 1559 is the
largest and the only one whose function is known well. The other low molecular
weight subunits are possibly involved in PS II assembly, stabilization, dimerization,
and photo-protection [36]. Cyt b559 is a heterodimer composed of one ct-subunit
(PsbE), one /3-subunit, and a heme cofactor. It is unlikely to be involved in the
primary electron transfer in PS II due to its very slow photo-oxidation and photo-
reduction kinetics. Instead, it could participate in the secondary electron transfer
that helps protect PS II from photodamage. Cyt b559 is essential for PS II assembly
[37].
15
2.3 Isolation of PS II
In the studies of photosynthesis, the isolation of minimum functional protein
units is usually the first step. A remarkable achievement in this field was made
by Boardman and Anderson [38] who were able to separate digitonin-solubilized
spinach chloroplasts into two fractions that were each enriched in one of the two
Photosystems, i.e., PS I and PS II. Based on the difference of molecular weight, these
two fractions can be separated by centrifugation. PS II activity is associated with
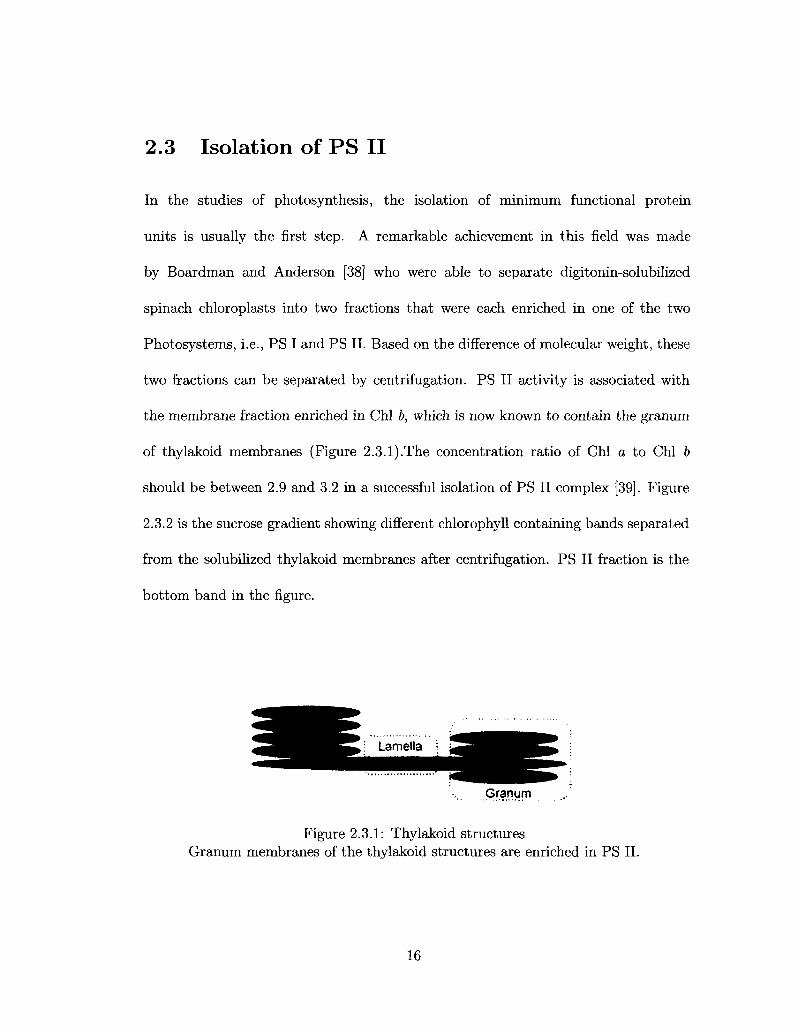
the membrane fraction enriched in Chi b, which is now known to contain the granum
of thylakoid membranes (Figure 2.3.1).The concentration ratio of Chi a to Chi b
should be between 2.9 and 3.2 in a successful isolation of PS II complex [39]. Figure
2.3.2 is the sucrose gradient showing different chlorophyll containing bands separated
from the solubilized thylakoid membranes after centrifugation. PS II fraction is the
bottom band in the figure.
Figure 2.3.1: Thylakoid structures Granum membranes of the thylakoid structures are enriched in PS II.
16

CMa/b Band
1.3-1.5
6.5-7.1
2,9 - 3.2
Figure 2.3.2: Different chlorophyll containing bands in different components of thylakoid membrane
During the early 1980s, a variety of methods using non-ionic detergents, e.g., sugar
based detergents, were found to be effective in isolating protein complexes with PS
II activity from a diverse range of cyanobacteria, green algae and higher plants [40].
The isolated PS II core complex consists of several major components, i.e., CP47
and CP43, Dl and D2 subunits, and Cyt b559. In addition to the major subunits,
some other components such as psbO should be preserved to produce O2. Refined
preparations of this membrane fraction, e.g., the so-called BBY particles, retain full
(^-evolving activity and have been used extensively in the analysis of PS II structure
and function. The name BBY was originated from Berthold, Babcock and Yocum who
first developed the preparation method [41]. Non-ionic detergent Triton X-100 was
used to separate the grana-stacked from the stroma-exposed region of the thylakoids.
PSII-LHCII stipe rcomplex
17

2.4 Electron transfer process in the PS II complex
PS II complexes performing the electron transfer are located in the thylakoid
membranes. Thylakoid membranes are either stacked (referred to as appressed
or grana lamellae) or unstacked (referred to as stroma lamellae), and contain
four membrane-spanning protein complexes involved in charge transfer: the PS
II complex, the cytochrome complex, the PS I complex, and the ATP synthase
complex. The electron transfer reactions in PS II are schemed in Figure 2.4.1
cytltf
2*2H' mollis side
*tiv
POp^zTT"""
Ptoophyiin
2c>des 4 Excitation
lumen side 2H,0 OEC
Figure 2.4.1: PS II primary electron transport and oxygen evolution
The reaction center P680 of PS II reduces QB via pheophytin and QA- Two excitation cycles are needed to reduce QB to the plastoquinol. Protons are taken up from the matrix space. The plastoquinol leaves the binding site on PS II and equilibrates with a larger plastoquinone/plastoquinol pool. Four excitation cycles through P680 are needed to oxidize the M^CaOs complex. The fully oxidized manganese complex oxidizes 2 molecules of water to evolve one O2.
18

The primary electron transfer reactions in PS II consist of the initial charge
separation and subsequent reduction of the primary donor by extracting electrons
from water. Upon illumination, an electron is ejected from the excited primary
electron donor P680, and in 10 picoseconds the electron is passed to the primary
electron acceptor, Pheophytin Pheooi- Once the primary charge separation takes
place, the secondary electron transfer in PS II rapidly stabilizes the electron flow
to reduce a back reaction. After the first charge separation step the oxidized P680
is reduced to its initial state by the OEC. Four consecutive oxidation steps in the
OEC produce one oxygen molecule from water. The pheophytin in turn reduces the
first plastoquinone in the electron transfer system (QA) in about one nanosecond.
QA is reduced only to the semiquinone state (PQH), which remains bound tightly to
the D2 subunit. This radical anion semiquinone reduces the final electron acceptor,
QB, which is bound loosely to the Dl subunit. After a second similar light-driven
excitation cycle, QB accepts a second electron and becomes reduced to plastoquinol
(PQH2). The protonated plastoquinone leaves the quinone binding site and is
replaced by another molecule from the plastoquionone pool within the membrane
and afterwards the overall reaction cycle continues. The protonated plastoquinone
can move freely either in the membrane or across it. It thus becomes the first electron
donor in the PS I electron transport system. Upon illumination the PS I reduces
NADP+ using the electron transferred via the plastocyanin Cyt b6f.
In the first step of the primary electron transfer, the generated P680+ is a long-
lived strong oxidant that can potentially damage the protein unless it is reduced. If
19

reduction of P680+ is blocked, then secondary electron transfer occurs that ultimately
results in the oxidation of Cyt b559 [43]. It has also been found that Cyt b559 can
be reduced by electrons generated within PS II. Buser et al. [44] found that doubly
reduced quinone PQH2 can reduce Cyt b559. Therefore the overall role of Cyt b559
in the PS II electron transfer is to act as an emergency electron donor or acceptor
[45, 46].
The protons split from water are released into the inner lumen side of the thylakoid
membrane, whereas the protons needed to reduce plastoquinone are taken from the
matrix space. As a result a proton concentration gradient is established between the
inner and outer space of the thylakoid membrane, a consequence of vectorial electron
flow across the membrane.
2.5 Quinone binding site in PS II
The architecture of the polypeptides involved in QA, Fe and QB binding in PS II is
quite analogous to that of the bacterial system (Figure 2.5.1 [32]). Even though PS II
and BRCs use different quinone acceptors, the model of PS II based on the study on
BRCs proved very successful. The overall view of the iron-quinone complex is shown
in Figure 2.5.2 [32]. The binding sites for QA and QB are localized in D2 and Dl
subunit, respectively. Helices IV and V of each subunit are of particular relevance of
quinone binding. The non-heme Fe, which mediates electron transfer from QA to QB,
is positioned on a pseudo-twofold axis of the D1/D2 heterodimer.
20

Figure 2.5.1: PS II RC cofactors involved in electron transfer
Electron transfer cofactors shown perpendicular to the internal pseudo-twofold axis. Coloring scheme is the same as in Figure 2.2.2. The phytol tails of the chlorophylls and pheophytins have been removed for clarity. The side chains of Tyrz (Dl Tyrl61) and Dl Hisl90 are shown in yellow, and TyrD (D2 Tyrl60) and D2 Hisl89 are in orange. The four chlorophylls comprising P680 are in direct van der Waals contact, and other electron transfer distances are given in A.
X-ray study [36] proposed that QA is firmly bound to the main-chain amide group
of Phe261 and His214 on the D2 subunit, where the latter also serves as a ligand to
the Fe ion (Figure 2.5.2, A and B). The QA pocket is a hydrophobic cavity composed
of multiple residues on D2 subunit including Ile213, Thr217, Met246, Ala249, Trp253,
Ala260, and Leu267.
21

Figure 2.5.2: Electron acceptors of PS II
(A) Overall view of the nonheme iron, QA and QB- Coloring scheme is as in Figure 2.2.2, with protein main chains depicted in gray and with side-chain bonds and carbon atoms following the coloring of the protein subunit as used in Figure 2.2.2. The bicarbonate that completes the coordination sphere of the nonheme Fe is shown as magenta balls and is probably hydrogen bonded to D2 Lys264 and Dl Tyr246. (B) The QA binding pocket. The hydrophobic residues forming this pocket are shown. The Oi of the plastoquinone head group is likely to be hydrogen bonded to the nonheme Fe ligating D2 His214 by its 5-nitrogen, whereas the O4 atom may hydrogen bond to the backbone amide nitrogen of D2 Phe261. (C) The Q B binding pocket. Q B binds deep into a cavity lined with the hydrophobic residues. Oi is likely to be hydrogen bonded to the 5-nitrogen of Dl His215, which also forms a ligand to the nonheme Fe, whereas O4 may form hydrogen bonds with the amide nitrogen of Dl Phe265 and the side chain 7-0-xygen of Dl Ser264. Dl Ser264 appears to make further hydrogen-bonding contact with Dl His252. Probable hydrogen bonds are shown as dotted lines; solid lines represent ligands.
There are four histidines (Dl His215, Dl His272, D2 His214, and D2 His268)
responsible for the nonheme Fe binding. It has also been suggested that bicarbonate
may serve as the fifth ligand to the nonheme Fe in PS II and that it has a regulatory
function involving electron flow from QA to Q B as well as facilitating the reduction
ofQB [32].
22

The plastoquinone in the QB site is hydrogen bonded to Dl Ser264 and Dl His215,
where the latter one is also a ligand for the nonheme Fe. It is also possible that QB is
bonded to Dl Phe265 on the main-chain. The QB pocket is comprised of Dl residues
Met214, Leu218, Ala251, Phe255 and Leu271 (Figure 2.5.2, C). In addition, because
Dl His252 is within hydrgen-bonding distance of Dl Ser264, this residue could aid
the protonation of QB [8]. Protonatable groups close to the quinone make the QB
site more hydrophilic than the QA site. This property is essential to the conversion
of quinone to PQH2, because the protonation reactions require an aqueous phase.
2.6 Binding of the inhibitors at the QB site
In the primary electron transfer process, QA and QB associate with non-heme Fe to
perform as a two electron gate system. The kinetics of electron transfer involving the
two electron gate has been studied through use of a fluorescence spectroscopy method
[47]. It was suggested that the QB binding constant is relatively small, and a rapid
movement of the quinone in and out of the site occurs. This dynamic association is
required for the quinone to act to couple electron and proton transfer, and it provides
the possibility of inhibition of the transiently unoccupied site by a quinone analogue.
On the other hand, because of the inaccessibility and the lack of exchangeability of
the plastoquinone when bound, the QA site is not a good target for inhibitors.
The plastoquinone in the QB site is reduced in two steps, therefore the QB site is
supposed to bind nonreduced as well as singly reduced plastoquinone. This dual and
23

undemanding binding property of the QB site makes it possible to replace quinone by
diversity of other chemicals. Many photosynthesis inhibitors, such as some herbicides
bind to the QB site on the Dl subunit. It has been well established that treatment of
plants with some herbicides blocks PS II electron transport, and thus also blocks the
transfer of excitation energy from chlorophyll molecules to the PS II reaction center
[33].
Three chemical families, the nitrophenols, nitriles, and pyridazinones, inhibit
photosynthesis by preventing QB binding. The inhibitors bind to the QB site due
to hydrogen bonds, van der Waals forces, and hydrophobic interactions depending on
the chemical structures and properties of the inhibitors.
The binding schemes of plastoquinone and atrazine on the Q B site are shown
in Figure 2.6.1. The protein structure in the scheme is based on the BRC model.
Hydrogen bonds between atrazine and the amino acids Ser264 and Phe265 are
essential for atrazine binding. Phe255 contributes to hydrophobic interactions in
herbicide binding [33]. This competitive binding blocks the access of quinone
molecules to the QB site. Because atrazine cannot uptake proton and electron under
this condition, the electron transport via QB site is disrupted. Trebst [48] proposed
that herbicides of the nitrophenol and nitrile families probably bind to the QB site
due to the interactions with His215 rather than Ser264.
24

Figure 2.6.1: Schematic figure of the plastoquinone/herbicide binding pocket of the Dl protein
Dashed lines represent hydrogen bonds; dotted lines represent hydrophobic interactions. (A) Plastoquinone binds to the Dl protein, accepts two electrons and two protons, and is released as plastohydroquinone. (B) Atrazine binds to the Dl protein and prevents the binding of plastoquinone [33].
Upon illumination, QA is reduced to form a QA~QB state which in turn can evolve
into QAQB~- However, if the QB site is vacant or occupied by the inhibitor the last
step cannot occur and the electron transfer is disrupted as depicted in Figure 2.6.2
[47].
Inhibitor Q A Q B " ^ Q A ' Q B ^ QA"( v a c a n t } ' QA'InMbitor
hv
QAQB
Figure 2.6.2: Displacement of QB by inhibitors
25

Summarizing, the PS II inhibitors interfere with QB function and thus block PS II
electron transport activity in a concentration-dependent manner. Additionally, some
classes of the inhibitors have other modes of action on photosynthetic organisms,
not involving the QB site. For instance, nitrophenols also act on respiratory
phosphorylation as an uncoupling inhibitor [42]. This property enhances their
inhibitory potency. Nitric oxide, cyanide and carboxylate anions are found to
be capable of binding reversibly at the non-heme iron site in competition with
bicarbonate, resulting in most cases in deceleration of the electron transfer.
Advances in the understanding of inhibitory mechanisms naturally gave strong
impetus to detection of herbicide research as well. The PS II-based biosensor
for detection of herbicides [10, 9] has been well developed in the past decade.
Photosynthetic assays can be done in a cell-free system, that is, with isolated
thylakoid membranes, to obtain a direct measurement of its interaction with the
inhibitors without the secondary effects from other components of intact plant tissues.
The inhibitory potency of a herbicide can be evaluated via measuring the inhibitor
concentration at which the photosynthetic activity is reduced by half [49].
Based on the structural similarity between nitric explosives and herbicides (Figure
2.6.3), it is suggested that some nitric explosives may also cause inhibitory effect on
different plant species [50, 51]. Ali et al. [23] observed the inhibition of photosynthetic
electron transport caused by TNT which can be evaluated via the decrease of
chlorophyll a variable fluorescence field. However, it has not been proven that it is
the inhibition of PS II involving the QB site and not some other effect which caused
26

this fluorescence decrease. In this work we are exploring the possibility that at least
some nitric explosives work on PS II, especially on the QB site. The electrochemistry
method will be applied for the detection of nitric explosives possibly involving QB site
binding. The major objective of our research is to produce a sensitive PS Il-based
biosensor for detection of nitric explosives.
CH
K>.
Y Picnc aesd
CM,
% - , /
T K T
o,wv , N O ,
T Tetrvl
0-N
C l ^ -*5s~ - " s . ^ v .
l . ^
XX&fOEteiwri
N '^M i am at
< - " • » . , ^ ^ - . . i ! 5 5 ^ . -
n u u H H
Figure 2.6.3: Herbicides as PS II inhibitors and explosives as potential inhibitors
27
Chapter 3
Material and Method
3.1 Preparat ion of PS II samples
The PS II samples were isolated from supermarket baby spinach leaves. Baby spinach
leaves were kept in the dark at 4°C overnight before use to preserve the PS II activity
as much as possible. All chemicals except TNT were ordered from Sigma-Aldrich.
TNT was purchased from ChemServices, Inc. All preparations were carried out in a
dark room with dim green light and at 4°C.
3.1.1 Purification of thylakoid membranes
Thylakoid membranes were prepared by treatment with sonication as described in
CA patent 2412206 [52]. After washing with ice-cold water, deveined spinach leaves
were crushed in a blender with a homogenizing buffer (Table 3.6.1). The mixture was
cooled in an ice bath for 2 min after 1 min of crushing. The resulting slurry containing
tissues and cells of spinach leaves was cooled again until the foam disappeared.
28

The homogenate was filtered through 16 layers of cheese cloth to remove impurities
and the filtrate was centrifuged for 2 min at 2500 g at 4°C. The collected pellet
was then resuspended in a 20 times diluted homogenizing buffer to a concentration
of 2 mg Chl/mL and gently stirred for 30min. The resulting solution was lysed
with 40 minutes of sonication in lmin intervals using a Mandel Scientific company's
ultrasound processor in an ice bath to avoid excessive temperature. Purified thylakoid
membrane was then collected after a centrifugation at 3500 <?'s at 4°C for 3 min. The
final pellet was stored at -80°C in the dark until use.
UV-Vis spectroscopic method was used to determine the concentration of
chlorophyll in the suspension and the purity of isolated PS II [53]. In order to obtain
a pure PS II sample, the A675/AQi5 ratio should be between 2.9 and 3.2 [39, 54]. The
spectrophotometric measurements were taken in quartz cuvette with a Cary 5000
UV-Vis with the following parameters:
Average time to scan: 0.033 s Data interval: 0.5 nm Scan rate: 909.091 nm/min
Spectral bandwidth: 2nm
The concentration of PS II complex in buffer is defined as the concentration of
chlorophylls. The calculation of concentrations of pigments is as follows:
[Chi o] = (12.7 x A675 - 2.69 x A645)/2g/mL (3.1.1)
[Chi b] = (22.9 x A645 - 4.68 x A675)/ig/mL (3.1.2)
[Total Chi] = (8.02 x A675 + 20.21 x A 6 4 5 ) /^ /mL (3.1.3)
29

where ^675 and A64:5 are the absorbance at wavelengths 675 nm and 645 nm
respectively.
3.1.2 Purification of BBY Membranes
BBY membranes were obtained using treatment with non-ionic detergent Triton X-
100 as described by van Leeuwen et al. [54]. Triton X-100 is able to separate the
granum stacks from the stroma-exposed regions of the thylakoids. More discussion
on the function of Triton X-100 will be presented in Chapter 4.
The leaves were washed, depetiolated and then crushed with a blender in an
isolation buffer following the same steps as described in subsection 3.1.1. After a
filtration the suspension was centrifuged at 10,000 g's at 4°C for 10 minutes. Pellets
were collected and resusp ended in the isolation buffer to a concentration of 2 mg
Chl/ml. With a gentle stirring, Triton X-100 solution was added to the suspension to
a final concentration of 25 mg/mg Chi. This ratio was chosen for the high efficiency of
separation and the maximal conservation of OEC. Low concentration of the detergent
causes incomplete separation of PS II particles. However, overexposure to the
detergent may also remove OEC from the particle and damage the oxygen activity.
The solubilization process lasted with stirring in the ice bath for about 15 min until the
cells were lysed and PS II particles were concentrated through hydrophobic reactions
with the detergent. The other proteins and components in thylakoid membranes
are solubilized in the buffer. At this step the incubated suspension included soluble
proteins, PS II particles surrounded by hydrophobic detergent molecules, and starch,
30

which is the component with the largest density. The PS II particles were isolated
from the suspension by 3 steps of centrifugations. After the first centrifugation at
40,000 g's at 4°C for 25 minutes, the PS II particles containing starch were collected
and resuspended in the isolation buffer supplemented with 0.4 M sucrose, then
centrifuged for 5 min at 2,000 g:s to remove starch. The supernantant containing the
purified membranes was then sedimented once more for 25 min at 40,000 g's. The
purified BBY membranes in the sediment can then be stored at 80°C over periods as
long as six months until use [55].
3.2 D C P I P assay
DCPIP is a chemical compound used as a redox-sensitive dye. Oxidized DCPIP is
blue, reduced form is colorless. DCPIP assay is a conventional method in the study of
rate of photosynthesis. As DCPIP is reduced and becomes colorless, and the resulting
decrease in absorbance at around 600 nm can be measured by a spectrophotometer.
All the procedures of DCPIP assay were carried out in dark except when illumination
was needed.
+ 2H + + It' HO HO
CI CI
Figure 3.2.1: The reduction of DCPIP
31

3.2.1 Photosynthetic activity
The photosynthetic activities of the isolated PS II samples were determined by a
DCPIP assay. With illumination, the photoreduction rate of the PS II sample in the
presence of DCPIP was measured with Gary 5000 UV-Vis spectrophotometer. The
spectrophotometric parameters were the same as described in section 3.1.1. Unfrozen
PS II samples were resuspended in a pH 7.5 measuring buffer to a concentration of
2mg Chl/mL. Vortex was used to help disperse the PS II particles. The resulting
PS II solution was taken for the baseline. In the measurement, the photoreduction
occurred in a solution which contained 20 pg Chl/mL of PS II particles and 0.15mM
of DCPIP. The sample was then illuminated with a halogen lamp light from one side
for 10 seconds. The intensity of the light was 1.5 xlO4 W/m2 . This step was repeated
until the absorbance was below 0.2. The decrease of the absorbance at ~590 nm upon
illumination is proportional to the rate of the photoreduction of DCPIP catalyzed by
PS II complex, so that the photosynthetic activity can be calculated as the rate of
photoreduction as follows:
Photosynthet ic a c t i v i t y = :—— (3.2.1) e x / x V x mPS n x i
here, AAz>CPiP is the decreased peak absorbance of DCPIP after illumination; e is
extinction coefficient of DCPIP (2.1 xlO4 M~l cm - 1 ) , I is the width of the cuvette
(1cm); V is the volume of the solution; mpsii is the mass of the chlorophyll in the
PS II particles used in the measurement and t is illumination time.
32

3.2.2 Effect of PS II inhibitors on D C P I P measurement
To study the effect of herbicides and explosives on photosynthetic activity, the rate
of photoreduction of DCPIP was measured in the presence of explosive molecules.
Explosives were added to the DCPIP-PS II suspension to obtain a series of increasing
concentrations. Each time the absorbance was measured with an illumination of 10
seconds. And the spectrum of PS II suspension was taken for the baseline during
each concentration-dependant measurement respectively. The presence of explosives
affects the photoreduction of DCPIP in the manner of inhibiting PS II activity. In
this case, the residual activity of PS II equals to the ratio of the photoreduction rate
in the presence of explosive to that in the absence of explosive which can be calculated
as follows,
/M. AAnrpTP(in presence of i n h i b i t o r ) „„„— ,„ n „s Residual Act ivi ty(%) = A °CPIP, - x 100% (3.2.2) AADCPIP (in abscence of i n h i b i t o r )
The data were plotted as residual activity vs. concentration of explosive.
3.3 Immobilization of PS II particles for the
biosensor
The DRP-220 gold screen printed electrodes were purchased from DropSens company.
The electrode assembly consists of a gold working electrode with the area of 0.13 cm2,
a graphite counter electrode and an Ag/AgCl reference electrode. The immobilization
33
process should avoid damaging the activity of the PS II protein or affecting its activity
as much as possible and therefore needs to be done in a quick and safe way.
The procedure of BSA-glutaraldehyde matrix based immobilization was similar
to the one described by Loranger and Carpentier [56, 57]. PS II samples were
first dissolved in a pH 6.5 measuring buffer to obtain a PS II suspension at the
concentration of 2mg Chl/mL. A 10% solution of BSA in the measuring buffer
was mixed with equal amount of PS II solution. For cross-linking purpose a
10% glutaraldehyde solution was added to a final concentration of 0.3%. The
glutaraldehyde cross-links the -SH groups of cysteine residues to form a matrix on
the surface of the electrodes. A droplet of 2.5 jA of the mixture was spread over the
working electrode for its selective functionalization and incubated for 30 min at 4°C
in dark for the matrix formation without interference. The electrodes functionalized
with PS II were stored at -20°C in the dark for at least 6 hours before use. The
immobilization of the photosynthetic material is visible as a green deposition on the
electrodes. The electrode is recyclable after washing off the PS II samples with ethanol
and drying it with nitrogen.
3.4 Photo-electrochemical measurements
The measurements with the biosensor were carried out at room temperature in the
dark except for the pulse illumination. The detection of electrochemical signals on
the PS II-functionalized electrodes was performed using the CHI630C electrochemical
34

workstation from CH Instruments, USA. The light source was either a 670 nm 7 mW
laser photodiode or, for measurements at different wavelengths, the Spectra-Physics
/ Sirah Matisse CW dye laser. The optimal illumination wavelength was determined
by measuring the photocurrent signals of PS II-functionalized electrodes with a pulse
illumination at different wavelengths. Electrochemical measurements were performed
by placing a 50 /A droplet of the electrolyte containing analyte onto the working area
to cover the three electrodes.
DQ and FeCy were used as mediators with concentrations of 0.2mM and ImM
respectively The redox potentials of the two mediators were determined by a cyclic-
voltammetry method [58]. A triangular wave form of potential sweep was applied to
a working electrode, and gave rise to a reversible current-potential (i-E) curve during
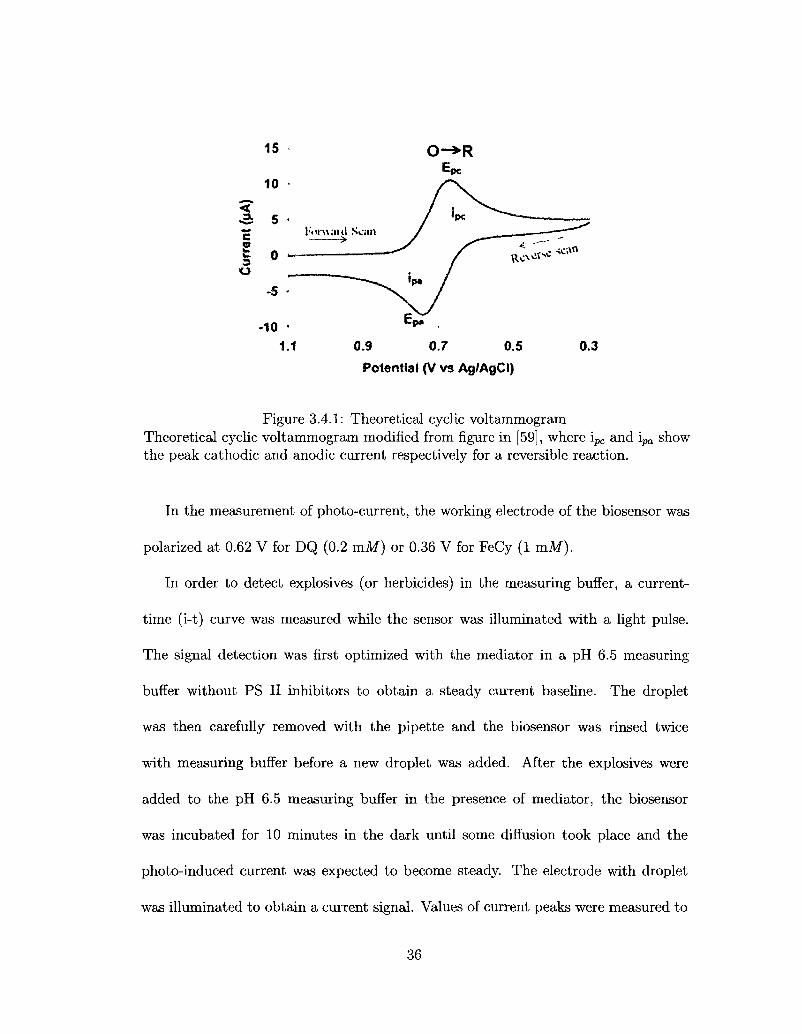
the reversible electron transfer step on the working electrode. Figure 3.4.1 is the curve
of a theoretical cyclic voltammogram. The anodic and cathodic peaks on the curve
present the oxidation potential and reduction potential respectively. The location of
redox potential of the mediator is the midpoint of the two peaks. The measurement
parameters are as followed:
Potential scan rate: 1 mV/s
Potential scan range: -1.0 V to 1.0 V
Current sensitivity: 1 //A
35
15 0 - » R
10
c Iwvwud
I 0 ~ O ,
-S -
-10 • 1.1 0.9 0.7 0.5 0.3
Potential (V vs Ag/AgC!}
Figure 3.4.1: Theoretical cyclic voltammogram Theoretical cyclic voltammogram modified from figure in [59], where ipc and ipa show the peak cathodic and anodic current respectively for a reversible reaction.
In the measurement of photo-current, the working electrode of the biosensor was
polarized at 0.62 V for DQ (0.2 m l ) or 0.36 V for FeCy (1 mAf).
In order to detect explosives (or herbicides) in the measuring buffer, a current-
time (i-t) curve was measured while the sensor was illuminated with a light pulse.
The signal detection was first optimized with the mediator in a pH 6.5 measuring
buffer without PS II inhibitors to obtain a steady current baseline. The droplet
was then carefully removed with the pipette and the biosensor was rinsed twice
with measuring buffer before a new droplet was added. After the explosives were
added to the pH 6.5 measuring buffer in the presence of mediator, the biosensor
was incubated for 10 minutes in the dark until some diffusion took place and the
photo-induced current was expected to become steady. The electrode with droplet
was illuminated to obtain a current signal. Values of current peaks were measured to
36

calculate the relative activities. Upon the measurements of photo-induced current at
different concentrations of analytes, a curve of relative activity versus concentration
was obtained to characterize the inhibition mechanism.
In order to compare the inhibition mechanism of explosives to that of herbicides,
the detection of herbicide was performed as well through the same procedure as
described above.
The detection parameters are as followed:
Sensitivity: 1 nA
Potential with respect to reference electrode: 0.62 V for DQ (0.2 m.M)
0.36 V for FeCy (1 mAf)
Incubation time: 10 min
Illumination wavelength: 670 nm
Illumination intensity: 8 W/cm2
Illumination time: 5 s
In the detection of photosynthesis inhibitors, the current increases as a result
of the light-induced redox reaction and the resulting peak current depends on the
activity of PS II. As shown in Figure 3.4.2 the residual activity of PS II therefore
equals to the ratio of the amplitude in the presence of inhibitors to that in the absence
of inhibitors.
37

/
— <
c 1/
1
a
Uv bi - i b
—>
Time
Figure 3.4.2: Scheme of amprometric readout upon increasing the concentration of the inhibitors. Peak (a) is a light-induced signal in the absence of inhibitors; Peak (b) is a light-induced signal in the presence of inhibitors. Residual activity = I(,/Ia x 100%.
3.5 Analysis of inhibitor binding
The residual activities of PS II vary upon the concentrations of the inhibitors. The
residual activity vs. concentration curves were fitted with logistics equation:
V Vmin i V; max yrmn Vv
1 + (z/EC50)Hl11 sl°Pe (3.5.1)
where,
Ymax'- maximum residual activity
y m m : minimum residual activity
EC50: concentration of inhibitor which causes a 50 % inhibition of the activity
Hill slope: coefficient which describes the cooperativity of the binding.
The EC50 also represents the dissociation constant of the PS II-inhibitor binding.
38

The LOD was determined on the basis of 99 % confidence interval, which, assuming
the normal distribution, corresponds to 2.6 x standard error of the measurement (a)
[60]. Then the LOD was calculated as
r ^ 2 . 6 x a x E C 5 0 LOD = (3.5.2)
100 - 2.6 x a y '
3.6 Components of buffers
The compositions of various buffers used in this study are presented in Table 3.6.1.
Table 3.6.1: Components of buffers
Buffer Components
Homogenizing Buffer 20mM Tricine (pH 7.5), 330mM sorbitol, 5mM MgCl2
Isolation Buffer 20mM MES (pH 6.0), 15mM NaCl and 5mM CaCl2
pH 7.5 Measuring Buffer 20mM Tricine, 0.2mM sucrose, lOmM KC1, 3mM MgCl2
pH 6.5 Measuring Buffer 15mM MES, 0.5 M mannitol, 0.1 M NaCl, 5mAf MgCl2, 5x lO _ 5 M chloramphenicol
39

Chapter 4
Detection of explosives/herbicides
with biosensor
4.1 Principle of detection using biosensor
The presence of explosive/herbicide in a solution is detected as a decrease of
photocurrent signal in the presence of mediator compared to the activity in the
absence of the explosive/herbicide. The photocurrent is generated through the redox
reaction of the mediators in the solution, which indirectly represents the PS II activity
upon illumination.
As discussed in section 2.4, when the light harvesting complexes transfer the
excitation energy to the PS II reaction center, the PS II electron transport takes
place. From pheophytin, the excited electron derived from the splitting of water is
transferred to QA and then QB. QB accepts two electrons from QA and two protons
from the stroma side of the thylakoid membrane, and then leaves its binding site as
plastoquinol. In vivo, plastoquinol as the product of PS II electron transport donates
40

its electrons to the Cyt bef complex to connect the electron transport between PS
II and PS I. The mediators such as FeCy and DQ in this study work as artificial
electron acceptors instead of plastoquinone when reacting with the PS II reaction
center. In the measurement, the working electrode is polarized at the corresponding
redox potential of the mediator so that the reduced electron acceptor is re-oxidized and
a current signal is observed. The mass transfer of the electrons thereby is proportional
the PS II activity. The explosive or herbicide in the solution inhibits the access of
mediator in to the QB pocket. The mediator cannot be reduced by plastoquinol and
consequently no current is generated.
Figure 4.1.1 depicts an example of DCMU detection. The signals from left to right
are due to an increasing concentration of DCMU in the pH 6.5 measuring buffer in the
presence of DQ. The baseline corresponds the background current of the oxidized DQ
in the dark. The first peak is the control signal in the absence of DCMU. Then, DCMU
was loaded into the solution and the signal induced by the light pulse was recorded.
The decrease of the signal magnitude indicates the reduction of PS II activity by
DCMU. The ratio of the signals in the presence and absence of the herbicide was
calculated.
41

14U ;
^ 120 ^* ~-^ = 100-• H >
0m
3 80
= 60 -
-40 ] - .w _._.
20 - - ^ . -
Increasing cencentrsiiofi ol OCMU startms from InM in rmitoptes of 5 • >
„___V_ . J , x
0.2 0.4 0.6 0.8
Time/10000 sec
1. 1.0 1.2
- r -1.4
Figure 4.1.1: Photocurrent signals of DCMU detection The presence of DCMU was detected from a decrease of the photocurrent signal in the presence of DQ.
4.2 Characteristics of the PS II membranes
Stability and sensitivity, which are essentially related to the quality of the prepared
PS II samples, are important parameters of a biosensor. In this section, factors such
as the purity, the activity and the half life of the samples are considered.
The PS II-enriched membranes, i.e. the BBY membranes are thylakoid
membranes solubilized with the non-ionic detergent Triton X-100. The function of
Triton X-100 is to separate the lamella part from the intact thylakoid by hydrophobic
reactions and consequently to concentrate the granum stacks (Figure 2.3.1) through
hydrophobic reactions. The PS II complex is more concentrated in the stack
structure of the thylakoid membrane, whereas the lamella contains more PS I. The
42

spectra of PS II preparations are shown in Figure 4.2.1. Each PS II particle sample
collected after centrifugation was diluted 100 times with the buffer used in the
preparation. The peak absorbance of Chi a has shifted to 675 nm and 436 nm, while
the peak of Chi b has shifted to 645 nm and 471 nm.
j . u •
2.5 •
8 2 . 0 -
CO J Q - 1 . 5 -V)
^1.0 -
0.5 -
0.0 -
/ / / / 7
* / /
436
/ / \ \ n \ 471
" ' " • " i " " ' " ' i " " " " "
A. BBY Membrane — B. Thylakoid Membrane
C. BBY before Triton treatment - - D. Thylakoid before sonication
v 675
v h \ \ 6*5/7 l v
-in n „•••,« l , . — . — M - . T — . , . — , l . . n M — i r . . - » . . . • • • « - r . - . M „ - - , . — . J
400 450 500 550 600 Wavelength (nm)
650 700
Figure 4.2.1: UV-Vis spectra of PS II particles during preparations
The chlorophyll content of each sample in Figure 4.2.1 is calculated (Table 4.2.1).
By comparing the ^675/^645 values it is clear that Triton X-100 treatment is efficient
in separating PS I and PS II. The oxygen activity of BBY membrane is therefore
significantly higher than that of thylakoid membrane. Measured by spectroscopy,
the BBY membranes has an oxygen activity of 100 to 300 /xmol 02/mg Chl/h, and
43

the thylakoid membrane has about 50 /xmol 0 2 /mg Chl/h.It has been reported that
thylakoid membranes were used for BSA-matrix formation on the biosensor electrodes
and a photocurrent signal stable for long time (half life of 16.7h in the presence of
DQ) has been observed [61, 62] . On the other hand, the half life of PS II enriched
membrane-based biosensor is 8h in the presence of DQ, according to Koblizek et al.
[10, 9]. The half lives of both types of the biosensors are shorter than that for the PS
II preparation itself. The lower stability of the sensors compared to protein sample
is probably caused by Ag+ ions released from the reference electrode, which are toxic
for the PS II activity. This could be improved by increasing a spatial separation of
the working and reference electrode. Thus, the Ag+ ions released from the reference
electrode would not come into contact with the PS II particles immobilized on the
working electrode. However, this would make the measurement less practical.
Table 4.2.1: Chlorophyll content from spectra in Figure 4.2.1
BBY
Thylakoid
BBY before Triton treatment
Thylakoid before sonication
[Chi a] /(mg/mL)
2.0
1.9
1.5
1.4
[Chi b] /(mg/mL)
0.9
0.8
1.1
1.5
[Total Chi] /(mg/mL)
2.9
2.7
2.6
2.9
^675/^645
2.9
3.5
2.0
1.4
Figure 4.2.2 compares the photocurrent signals from the biosensor with
44

immobilized thylakoid membrane (A) and BBY membrane (B). The signals are
registered with FeCy used as a mediator to transfer the electrons from the PS II
to the electrodes. The working electrode was polarized at 0.36V to the reference
electrode. Both signals were obtained upon illumination for a period of 20 sec and
with the sensitivity set to 1 nA. The sinal amplitude is calculated by subtracting the
average baseline from the readings.
0 lieiu off
•' (A) <<<"
s -.-a „. <B k .
3 -<•*
<J „, «' J -,l
:
M V W
•«c
light on
~..£) / w ?>. ?•*' ?*>'; :**>'} / *x T>i
Time (sec)
-— fX C •;-0) fc •*•••
<S>
• ; * * :
(B) Q,
lighe on
0 VCO « t - . w i--;3
Time (sec)
Figure 4.2.2: Photo-current signals of biosensor employing (A) thylakoid membrane and (B)BBY membrane The signals are registered with FeCy used as a mediator.
The signal amplitude in Figure 4.2.2(A) is 210 nA, which is twice large as the
amplitude of the BBY signal, despite the fact that the specific oxygen activities of
the two types express the opposite tendency. A possible explanation is, that, because
the concentration of the detergent used is 25 times of Chi in the preparation, in the
presence of high-concentrated non-ionic detergent, the effective concentration of Fe3+
45

in the measuring solution is decreased.
Besides the signal amplitude, the response speed is also crucially important to the
performance of the biosensor. The ideal photo-current signal should be as shown in
Figure 3.4.2. In Figure 4.2.2 (A), the current reaches the peak 20 sec after the light is
switched on, and recovers to the baseline in 30 sec after the end of the illumination;
secondly, it shows that the background is noisy and the signal current fluctuates.
In the case of BBY sample, the signal rises to the peak and recovers to the baseline
within just several seconds after the switching of the light on or off; the signal exhibits
low noise, and better repeatability.
Table 4.2.2 shows the data derived from Figure 4.2.2. Only the peak-signal
generation part was taken into account when calculating the signal RMS amplitude.
The SNR of BBY sample is 10000, which is 23 times larger than for thylakoid
samples.
Table 4.2.2: Photocurrent signal performance of biosensors immobilized with thylakoid membrane and BBY membrane.
Thylakoid
BBY
Peak-signal Generation
(sec)
20
4
Peak-signal Degeneration
(sec)
30
6
Signal RMS Amplitude
(nA)
148.5
70.7
Noise RMS Amplitude
(nA)
7.07
0.7
SNR
441
10000
46
By jointly considering the factors including signal amplitude, signal-respond
ability and SNR, it is thus safe to say that the BBY-based biosensor exhibits better
sensitivity than thylakoid membrane-based biosensor. The differences of sensitivity
and fluctuation between thylakoid and BBY samples are apparently due to the activity
and purity. The existence of other proteins and complexes in thylakoid membrane
limits the effective electron transfer from the PS II comparing to the case of BBY, and
makes the signal to noise ratio poorer as well. Summarizing, BBY sample appears to
be more suitable for the biosensor application.
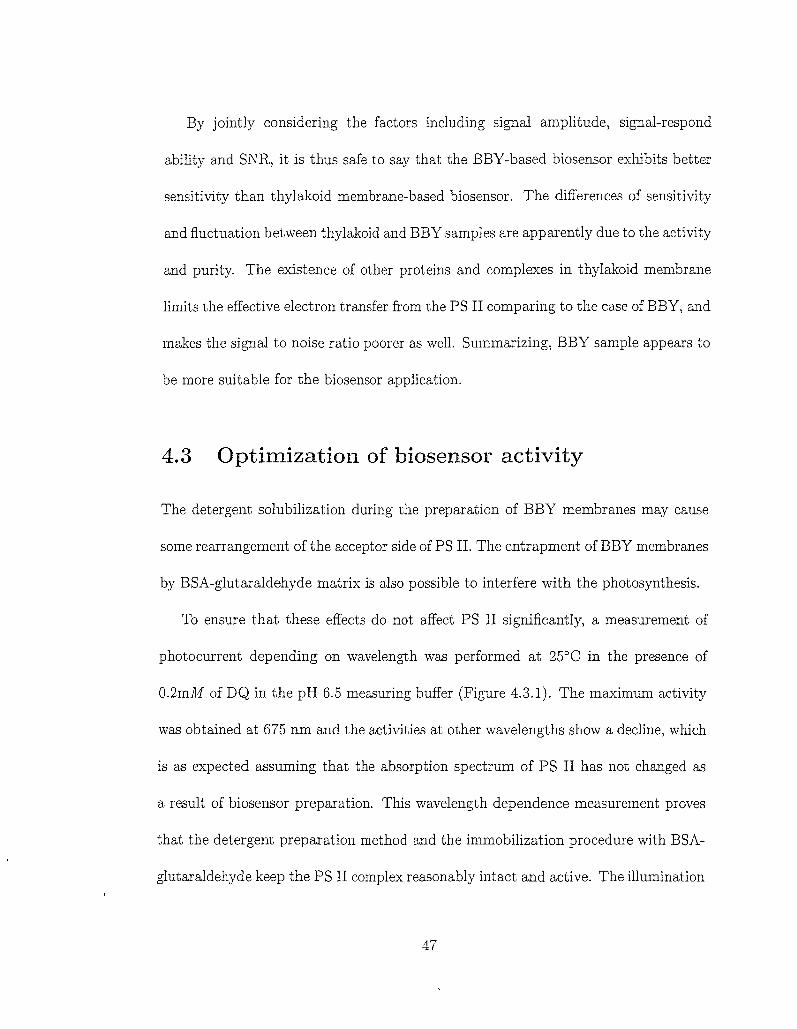
4.3 Optimization of biosensor activity
The detergent solubilization during the preparation of BBY membranes may cause
some rearrangement of the acceptor side of PS II. The entrapment of BBY membranes
by BSA-glutaraldehyde matrix is also possible to interfere with the photosynthesis.
To ensure that these effects do not affect PS II significantly, a measurement of
photocurrent depending on wavelength was performed at 25°C in the presence of
0.2mM of DQ in the pH 6.5 measuring buffer (Figure 4.3.1). The maximum activity
was obtained at 675 nm and the activities at other wavelengths show a decline, which
is as expected assuming that the absorption spectrum of PS II has not changed as
a result of biosensor preparation. This wavelength dependence measurement proves
that the detergent preparation method and the immobilization procedure with BSA-
glutaraldehyde keep the PS II complex reasonably intact and active. The illumination
47

wavelength was set at 670 nm for the electrochemical experiments.
675 687 691
wavelength (nm)
Figure 4.3.1: Wavelength dependence of photocurrent signals of the BBY-based biosensor Photocurrent signals are measured upon illumination by laser at different wavelengths at 25°C in the presence of 0.2mM of DQ in the measuring buffer.
It is also important to select the appropriate mediator for the measurement.
FeCy and DQ were chosen due to their moderate affinity for the QB binding site
on Dl.In other words, they are not expected to displace explosive/herbicide from the
QB binding site [63].
In the presence of FeCy as a mediator, the biosensor exhibits about three times
higher signals as compared to the signals obtained with DQ. This is apparently due
to the higher concentration of electron acceptor in use. However, the relatively high
oxidizability of FeCy may affect the inhibition in two possible ways. First, in the
presence of FeCy, there exists an alternative herbicide-insensitive pathway of PS II
I' T
16 -
15 -< B 14 -
curr
ent
12 -
11 -
10 -
r+n
665
48

reoxidation bypassing the QB pocket and operating at 50% of the rate in the absence
of herbicides. It was found that about 50% of the biosensor activity could not be
blocked when FeCy was used for the detection of herbicide by Koblizek et al [9].
Secondly, nonheme iron can be slowly oxidized by FeCy, resulting in the reduction
of binding affinity of herbicides to the QB site [64, 65]. This negatively affects the
reproducibility and sensitivity of the biosensor. In contrast, DQ can accept electrons
only via the QB pocket [63, 66]; and does not react with other components in the PS
II reaction center. Therefore DQ was considered better suited for the detection of
herbicide/explosive.
_ £1 >> *-* !E +*
a> > CJ 01
IUU
90 -
80 -
70 •
m -
,
V \
\ \
\
V , *+^ ».
• - - _
0 Sxlf f lO^lO5 15x1Q3 30x10s 25x1 D3 30x10^
Time [sec]
Figure 4.3.2: Time dependence of stability of the biosensor Relative activities of BBY membranes immobilized on biosensor are measured at 25°C in the presence of 0.2mM of DQ in the measuring buffer. The 100% value represents the maximal activity obtained in the measurement.
According to the conclusion from the paragraph above, BBY-based biosensor was
used with DQ as mediator in the subsequent measurement. The time dependence of
49
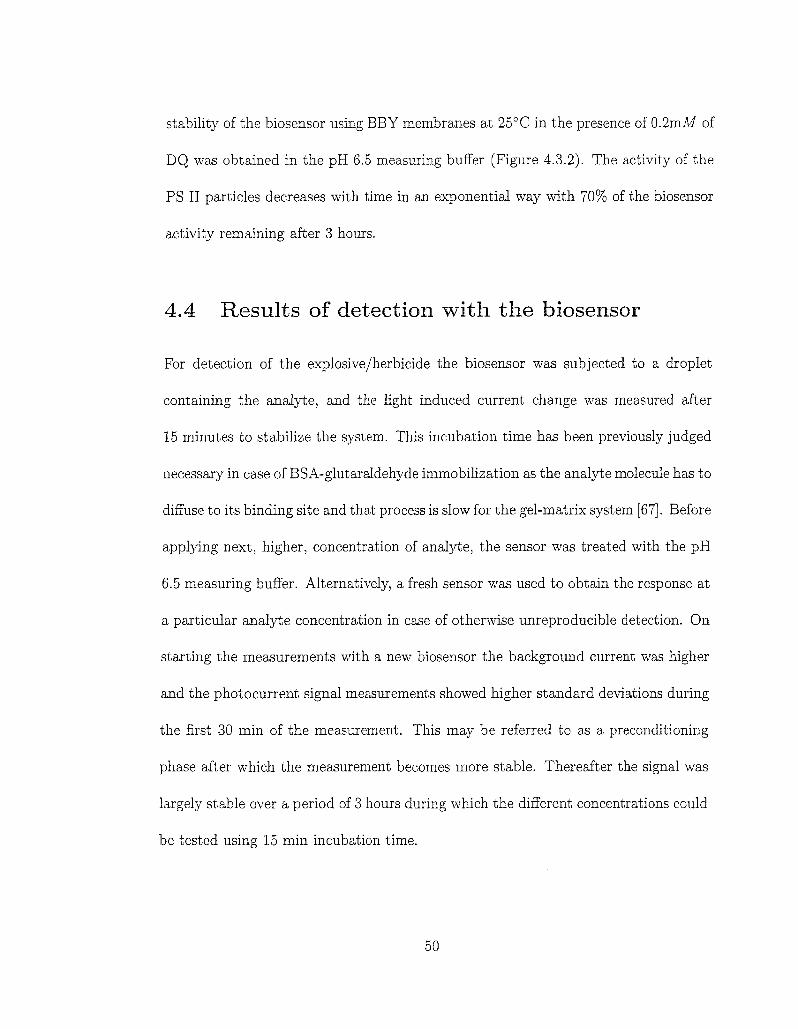
stability of the biosensor using BBY membranes at 25°C in the presence of 0.2mM of
DQ was obtained in the pH 6.5 measuring buffer (Figure 4.3.2). The activity of the
PS II particles decreases with time in an exponential way with 70% of the biosensor
activity remaining after 3 hours.
4.4 Results of detection with the biosensor
For detection of the explosive/herbicide the biosensor was subjected to a droplet
containing the analyte, and the light induced current change was measured after
15 minutes to stabilize the system. This incubation time has been previously judged
necessary in case of BSA-glutaraldehyde immobilization as the analyte molecule has to
diffuse to its binding site and that process is slow for the gel-matrix system [67]. Before
applying next, higher, concentration of analyte, the sensor was treated with the pH
6.5 measuring buffer. Alternatively, a fresh sensor was used to obtain the response at
a particular analyte concentration in case of otherwise unreproducible detection. On
starting the measurements with a new biosensor the background current was higher
and the photocurrent signal measurements showed higher standard deviations during
the first 30 min of the measurement. This may be referred to as a preconditioning
phase after which the measurement becomes more stable. Thereafter the signal was
largely stable over a period of 3 hours during which the different concentrations could
be tested using 15 min incubation time.
50

IUU
SO
60
S 40
.5 20
tS n
— » — = » _
-
) L _ „
* •
_ j L
(A) \
\ \ •
-«
, i i
-»-*-(B)
^ 10-310"210-1 10° 101 102 103 104 10s 10° 101 102 10* 104
10° 101 102 103 104 105 10B 10"1 10° 101 102 103 104
Concentration (nM)
Figure 4.4.1: Binding curves of DCMU and explosives in the presence of 0.2mM DQ (A) DCMU; (B) Picric acid; (C) TNT; (D) tetryl. The residual activity (in %) was calculated as the ratio of signals in the presence/absence of the herbicide. The experimental points were fitted using equation 3.5.1 yielding the EC50 values of 8.8xlO-8M for DCMU (i?2=0.999), of 4 .4xl(T 7M for picric acid (i?2=0.999), of 1.4xlO-5M for TNT (R2=0.997) and of I . l x l 0 - 8 M for tetryl (i?2=0.985).
The ratio of the signals in the presence and absence of analyte was plotted against
analyte concentration (Figure 4.4.1). Binding curves for each analyte were analyzed
using the half-maximal effective concentration (Equation 3.5.1), which was specified
in section 3.5. The LOD was determined on the basis of 99% confidence interval,
51

which, assuming the normal distribution, corresponds to 2.6 x standard error of the
measurement (a). The calculation results are shown in Table 4.4.1.
As can be seen from Figure 4.4.1 the resulting curves follow a sigmoidal tendency.
The biosensor is highly responsive to a classical herbicide such as DCMU and only
slightly less responsive to picric acid and tetryl. Essentially, the sigmoidal curve
shifts towards higher concentration for picric acid and tetryl, and shifts even further
for TNT. The range of recognition for DCMU is from 10~3 nM to 10 fiM, for picric
acid and tetryl is from 1 nM to 1 jiM. The small recognition range of picric acid
is due to the low SNR for concentrations higher than 1/J.M. The standard error is
related to the SNR of the measurement. The high standard error of tetryl can explain
the small recognition range. In the case of TNT the biosensor shows no inhibition
of photocurrent for concentrations up to lOnAf, but the inhibition effect becomes
apparent upon further increasing the TNT concentration.
Table 4.4.1: Detection results based on binding curves in Figure 4.4.1
EC5Q (M) LOP (M) R2 a Hill slope
DCMU 8.8xl0-8 2xl0~ 9 0.999 0.9245 0.631
Picric acid 4.4xl0~7 l x l 0 ~ 8 0.999 1.1254 1.217
tetryl 1.1 xl0~8 2x l0" 9 0.985 5.2936 0.648
TNT 1.4xl0-5 7 x l 0 - 7 0.997 1.8379 0.476
52

The value of EC50 obtained concides with the PS II-inhibitor dissociation constant
according to the Langmuir adsorption isotherm. The high EC50 indicates a weak
binding to the QB site. The EC50 of DCMU obtained is 8.8xl0~8M, which is very
close to the result reported by Koblizek et al [9] using a flow-cell set-up. Tetryl exhibits
EC50 of l . l x l O _ 8 M indicating a high binding affinity. The effective inhibition by
TNT takes place at high concentration only (EC50 is 1.4xlO -4M) suggesting that
TNT binding to the QB is weak.
The Hill slope coefficient is an interesting parameter which is related to the
cooperativity of a ligand binding. The slope factor describes the steepness of a curve.
In most situations, there is no straightforward way to interpret the numerical value
of the Hill slope coefficient in terms of chemistry or biology. Qualitatively, if the Hill
slope coefficient is far from 1.0, the binding does not follow the law of mass action
with a single site. The reasons for the reduced Hill slope coefficient may include the
presence of several clustered binding sites with somewhat different affinities, but since
the value of the Hill slope is very sensitive to experimental and curve fitting problems,
we refrain from making any far-reaching conclusions.
Compared to the detection limit of the biosensor system developed by Koblizek
et al. [9], this droplet biosensor performs quite well. The LOD of picric acid
previously reported using the luminescence quenching method is 2xlO_ 6M [68] and
by fluorescence emission of hexaphenysilole-chitosan film as 21 nM [69]. Thus, the
present detection limit for picric acid of 8x 10_ 9M exhibits a significant improvement
over luminescence quenching, but is comparable to that of the fluorescence detection
53

method. The LOD of DCMU, picric acid and tetryl are at nM range with only TNT
being an exception. In the following we attempt to explore possible reasons for such
a low sensitivity for TNT.
In general, the sensitivity and the detection limit of the biosensor are determined
by the chemical structure of the inhibitor and by the architecture of the QB pocket
[48], but are also related to the design of the biosensor and the characteristics of the
immobilization system especially at low concentrations of inhibitors. Effort has been
made to optimize the latter parameters. First, the PS II particles applied have higher
specific activity compared to thylakoid membranes. Second, the BSA-glutaraldehyde
matrix results in a very stable entrapment of PS II particles on the surface of the
working electrode. This set-up assures a high concentration of active PS II complexes
in the micro-environment around the electrode, which in turn, results in a good, stable
signal. Nevertheless there is a possibility that permeability of the BSA-glutaraldehyde
matrix to TNT is low for some reason and therefore the inhibition effect is decreased.
The logic behind the use of Langmuir adsorption isotherm assumes an excess of the
free compound with respect to the number of binding sites. Thus, the accessibility
of TNT to the electrode surface and to the PS II is critical for detection, especially
when it's at low concentration.
Results derived from other methods such as the DCPIP assay will be discussed in
the following section to further explore the binding of TNT.
54

4.5 Supplemental studies of T N T
Detection of TNT was also explored in the presence of FeCy (instead of DQ) because
of the high SNR and amplified signal currents. Figure 4.5.1 depicts the respective
binding curve. As expected, the binding curve shows an incomplete inhibition at
the saturated concentration of TNT (residual activity 40%) due to the properties of
FeCy as described above. The residual activity in Figure 4.4 (C) at the maximal
concentration is about 20%. The EC50 (5.4xl0~5M) and LOD (4.7xlO~7M) are
similar to the result from the detection in the presence of DQ. So far it proves that
the detection of TNT with both types of mediators has similar sensitivity.
100 «
10° 101 102 103 104 10s
Concentration (nM)
Figure 4.5.1: Binding curves of TNT in the presence of ImM FeCy The experimental points were fitted using equation 3.5.1 yielding the EC50 values of 5.4xlO~6M (i?2=0.990).
55

To clarify the effect of BSA-glutaraldehyde matrix on TNT, a DCPIP assay was
employed as a supplementary method. The rate of photoreduction of DCPIP was
measured depending on the increase of TNT concentration in the pH 7.5 measuring
buffer with DCPIP as the electron acceptor. The residual activity of PS II is equal
to the ratio of the photoreduction rate in the presence of TNT to that in the absence
of TNT. Experimental details have been illustrated in Section 3.2. The binding
curve was fitted by Equation 3.5.1. The resulting EC50 is 3.7xlO~5M and LOD
is 4.4xlO_6M. This sensitivity and binding affinity slightly declined with respect to
those shown in Table 4.4.1 indicating that the choice of a matrix system does not
pose significant limitations to the interaction of TNT with the PS II complex.
103 1Q4 Iff Concentration (nlW)
Figure 4.5.2: Binding curve of TNT-DCPIP assay Photoreduction rate is calculated as the decrease of DCPIP significant absorption peak (~600 nm) over illumination time. Residual activity equals to the ratio of the photoreduction rate in the presence of TNT to that in the absence of TNT.
There are some differences between the two curves for TNT in biosensor detection
56

and in DCPIP assay. The DCPIP assay is not responsive to low concentration of
TNT up to 10~6M, and the inhibition is almost complete for a saturated solution of
TNT (solubility of TNT is 5.7xl(T4M). This is due to the significant difference of
measuring environment. The concentration of PS II in the solution is ~2xlO~7M
(0.5 to 1 fig Chi, ~ 1 0 - 1 1 mol PS II) in DCPIP assay, whereas on the electrode it
is 10_5M. At low concentration of TNT, the photoreduction rate is too low to be
recorded. However, the relatively high ratio of TNT to PS II makes the inhibition
more completed at high TNT concentration. The natural decomposition of PS II
during the spectroscopic measurement may be responsible for the activity loss as
well.
As mentioned in Chapter 1, TNT is known to have an inhibitory effect on plant
growth. High concentration of TNT in soil has been shown to be toxic and increase
non-photochemical energy dissipation [23]. Thus, the question may be posed if the
inhibition shown in Figure 4.4 (C), Figure 4.5.1 and DCPIP assay is a result of
permanent damage caused by TNT to the PS II. Figure 4.5.3 shows the photocurrent
response of BBY-based biosensor in the presence of FeCy, to the saturated TNT
solution, i.e. the maximum concentration possibly achievable in the experiments
on whole plants. The first two peaks were obtained in the absence of TNT for
reference. The photocurrent is reduced to nearly zero when saturated solution of
TNT is added (arrow-pointed small peak). Washing the electrode surface with pH 6.5
buffer completely (although gradually) restores the magnitude of the photocurrent.
57

0.6 0.8 1.0 1.2 1,4
Time 10000 sec
Figure 4.5.3: Recoverability of biosensor after the detection of TNT The photocurrent signals are measured in the presence of FeCy. The first two peaks were obtained in the absence of TNT. Saturated TNT solution was added (small arrow) to observe the recovery of the photocurrent.
The same regeneration experiment for the biosensor employed for tetryl detection
yielded only 50% of photocurrent recovery (data not shown). Although tetryl inhibits
the PS II activity at very low concentrations as shown in Figure 4.4 (D), the ligand-
binding effect is not fully reversible, indicating permanent damage to the PS II.
Therefore the biosensor for the detection of tetryl is of low reproducibility.
The above supplementary experiments on TNT exclude the environmental factors
and prove that TNT binding to PS II is reversible. Thus, the question of low
sensitivity of our biosensor to TNT narrows down to the chemical properties of TNT
and its interaction with the QB pocket. One conceivable explanation is, that, TNT
binds on some site other than QB without interrupting the electron transport of PS II.
58

This extra binding has to be reversible, and exceed the binding affinity for the TNT-
QB binding. It is difficult to predict the potential binding site considering that TNT
is a very small ligand compared to the size of PS II complex. Second, because of the
high hydrophobicity of TNT molecule, it is possible that the hydrophobic components
of the membrane block TNT from contact with the acceptor-side on PS II. Note that
both biosensor and DCPIP assay experiments were performed with PS II particles
still retaining the membrane/detergent environment.
59

Chapter 5
Molecular modeling of inhibitors
binding to PS II
The detection results show a higher inhibition effect for nitric explosives such as tetryl
and classical herbicides such as DCMU, with the effect slightly decreasing for picric
acid and further strongly decreasing for TNT. It would appear that the occurrence of
a -CH3 group in TNT instead of-OH group should pose significant limitations to the
ability of TNT to bind to the QB site, as sufficient number of hydrogen bonds cannot
be formed. To test this hypotheses molecular modeling of binding of the inhibitors
to the QB binding site was performed using Autodock Vina [70].
5.1 Introduction to Autodock
AutoDock is a program designed to predict how small molecules bind to a receptor of
known 3D structure. It is a suite of automated docking programs: AutoTors, which
facilitates the input of ligand coordinates; AutoGrid, which precalculates a three-
dimensional grid of interaction energy based on macromolecular coordinates; and
60

AutoDock, which performs the docking simulation [71]. These programs are linked
by a host of shell scripts to streamline the input of new structures, to launch AutoDock
simulations in parallel on a cluster of machines, and to facilitate the analysis of results.
A simulated annealing algorithm is used for searching conformations, allowing several
torsional degrees of freedom in a flexible ligand to be searched during the docking
experiment, but with the limitation that it may not always find the global minimum
conformation. A grid-based technique is used for energy evaluation at each step of the
simulation, providing a detailed energetic model at reasonable computational cost, but
carrying with it the restriction of a rigid protein target. The computation assumes
that protonation state of and charge distribution in the molecules do not change
between, e.g., their bound and unbound states. The docking results in reproducing
chemical potentials, which determine the bound conformation preference and the free
energy of binding. It combines the consideration not only of the minima in the energy
profile but also-of the shape of the profile and the temperature. The energy profile
includes evaluations of dispersion/repulsion, hydrogen bonding, electrostatics, and
desolvation.
AutoDock Vina is the latest version of Autodock released in 2010. It has
significantly improved speed of computation and the accuracy of the binding mode
predictions. With a command-based operation, AutoDock Vina automatically
calculates the grid maps and clusters the results in a way transparent to the user.
61

5.2 Docking of inhibitors by AutoDock Vina
The receptor used in AutoDock Vina is a modified PS II PDB file downloaded
from RCSB Protein Data Bank (PDB entry: 3bzl [72]). This file contains
the X-ray crystallography data of dimeric PS II obtained from cyanobacterium
Thermosynechococcus elongatus (X-ray structure of PS II of spinach is not available
yet) at 2.9 A resolution, in which Dl subunit is coded as chain A. Plastoquinone
molecule (code: PL9) on chain A was extracted by Pymol manually and saved as a
ligand for future simulations. The PDB files of other ligand molecules are prepared
by online software CORINA (Molecular Networks). For both the receptor and the
ligands, Autodock Tools (ADT) 1.5.4 was used to add hydrogens (polar and non-
polar) and compute Gasteiger charges. Torsions of the ligands were optimized by
ADT automatically, except for the long side chain of plastoquinone whose bonds
were assumed to be non-rotatable bonds to simplify the computation. The center of
the grid box was set at the center of QB pocket, which has been described in detail
in section 2.5. The grid map parameters are as followed:
Grid Box center: X=22.66, Y=62.917, Z=32.6
Grid Box size: X=25, Y=25, Z=25
Grid spacing =1.0 A
62

5.2.1 Docking of Plastoquinone
Modeling proper docking of a plastoquinone to the QB site was not successful in our
case. As a matter of fact, there has not been any report of successful simulation of
plastoquinone-Qe docking so far. Takahashi et al. [73] have performed a structural
optimization of the QB site, including the non-heme iron, Q B , and surrounding
amino acids using molecular mechanics calculations. By cutting down the numbers
of carbons in the side chain, the modified plastoquinone can be simulated as located
at both ends of the QB pocket: either near the imidazole of HIS215 at one end, or
near the -OH group of SER264, the backbone -NH- group of PHE265, and the
backbone -CO group of ALA263 at the other end (see Figure 5.2.1). The binding
affinity wasn't given in Takahashi et al [73].
% S264
2.33 - , y
^ 2 6 5 A 2 6 3 *
F211">. *f274
Figure 5.2.1: Model of binding site of PQ in the Q B pocket by Takahashi et al.
63

The long side chain on plastoquinone makes it very difficult to fit into the
pocket spontaneously. The best-scored docking results by Autodock Vina shows that
plastoquinone molecule with flexible side chain can bind to SER264 and PHE265
outside the Q B pocket with a binding affinity of 148 kcal/mol. Therefore, according
to simulations, the binding of plastoquinone on Q B site in vivo is not spontaneous.
Figure 5.2.2: Binding of PQ in the QB pocket of PS II
Figure 5.2.2 depicts the original conformation of plastoquinone in the pocket
of PS II (PDB entry: 3bzl) analyzed by Pymol plug-ins. Plastoquinone is shown
in green sticks in the center of both Figures 5.2.1 and 5.2.2. Hydrogen bonded
residues are labeled by residue names and shown with hydrogens added. Hydrogen
bonds are shown in dashes with bond lengths labeled in A. Some residues in the
cartoon structures are hidden for the purpose of clarity. As mentioned above, the
64

plastoquinone of chain A (Dl) is coded by PL9 in 3bzl. Only the quinone part (the
head side of the molecule) is located in the pocket. In this pocket, one of the -CO
groups of plastoquinone is hydrogen-bonded to HIS215 and the other -CO group
interacts with the -OH group of SER264 and the backbone -NH- group of PHE265.
The bond-lengths of these polar contacts (2.8 A) from the original X-ray structure
indicate that the binding in vivo are much weaker than the binding from the docking
results done by Takahishi et al.
5.2.2 Docking of explosive molecules
The docking conformations of picric acid, TNT and tetryl are shown in Figure 5.2.3,
Figure 5.2.2 and Figure 5.2.5 respectively. AutoDock Vina outputs results containing
9 ligand conformations in the specified grid scored by binding affinity. The resulting
PDBQT type files were first processed in AutoDock Tools to separate into individual
molecules and to add hydrogen, then analyzed by Pymol. The residues on chain
A within 4.0 A of the ligand were selected. The manually refined selected residues
structure the binding pocket. The color codes for the atoms are: C-green, H-white,
O-red, N-blue, Cl-green.
65

Figure 5.2.3: Binding of picric acid in the QB pocket of PS II
Picric acid binds to the Q B binding site by two hydrogen bonds according to the
docking results. One nitro group of picric acid binds to the backbone -NH- group of
PHE265 with a bond-length of 2.7A; another -NO2 group binds to the imidazole of
HIS215 with a bond-length of 2.7 A. The binding affinity calculated by Autodock Vina
is -6.4 kcal/mol. The binding pocket of picric acid comprises of residues: PHE211,
MET214, HIS215, LEU218, HIS252, PHE255, ILE259, TYR262,ALA263, SER264,
PHE265 and LEU275.
Figure 5.2.4(a) shows that TNT binds on the QB binding site by two hydrogen
bonds. Two of the TNT nitro groups bind to the backbone - N H - group of PHE265
and the <5-N of HIS215, respectively. Both bond-lengths equal to 2.7A. The binding
affinity is -6.8 kcal/mol. The residues in the binding pocket are: PHE211, MET214,
HIS215, LEU218, VAL219, TYR246, ILE248, ALA251, HIS252, PHE255, ILE259,
ALA263, SER264, PHE265, LEU271, PHE274.
66

(a) Binding of TNT in the Q B pocket of PS II
(b) Binding of TNT on chain C of PS II
Figure 5.2.4: Two models of binding of TNT on PS II (a) Binding of TNT in the QB pocket of PS II , (b) Binding of TNT on chain C of
PS II
Another competitive binding site of TNT on PS II was found on Chain C, the
light harvesting subunit CP43 (Figure 5.2.4(b)). The binding affinity of this docking
result is -6.8 kcal/mol. One hydrogen bond (2.2 A) is built between nitro group of
TNT and residue LYS79, while another hydrogen bond (2.7 A) is between another
- N 0 2 group and ASN418.
67

Although the effect of this binding of TNT to the CP43 subunit is not clear so
far, it can possibly consume the TNT molecules in the solution so that the effective
TNT concentration to which the Q B binding site is exposed is decreased. However,
this one site is obviously not enough to explain our observations. In the detection of
TNT and picric acid by biosensors, the EC50 values imply that TNT should have
much lower binding affinity than picric acid. Apparently, the presence of another, yet
undiscovered binding site with higher binding affinity offers a reasonable explanation.
Figure 5.2.5: Binding of tetryl in the Q B pocket of PS II
The best docking result presented in Figure 5.2.5 of Tetryl has a binding affinity
of -5.0 kcal/mol. Two oxygen atoms on the -NO2 of tetryl bind to the backbone
-NH- group of SER264 and PHE265 respectively. Both of the bond-lengths are 2.3
A. The pocket ring of tetryl on PS II contains residues: PHE211, MET214, HIS215,
LEU218, HIS252, PHE255, ILE259, TYR262, ALA263, SER264, PHE265, LEU271,
68

PHE274, LEU275.
5.2.3 Docking of herbicide molecules
(a) Binding of DCMU through -NH- group in the QB pocket of PS II
(b) Binding of DCMU through -CO group in the QB pocket of PS II
Figure 5.2.6: Two models of binding of DCMU in the Q B pocket (a) Binding of DCMU through - N H - in the QB pocket of PS II, (b) Binding of DCMU through -CO in the QB pocket of PS II
69

We also simulated the docking of herbicides, i.e. DCMU and atrazine to compare
with the results obtained above for explosives. DCMU exhibits two ways of binding
to PHE265 on Dl. As shown in Figure 5.2.6(a), the -NH- group of DCMU interacts
with -CO of PHE265 by hydrogen bond. The binding affinity in this case is -7.1
kcal/mol, In Figure 5.2.6(b), -CO group of DCMU binds to the - N H - of PHE265,
resulting in a binding affinity of -6.7 kcal/mol. These two binding have the same
bond-length (2.5 A) and are both located inside the Q B pocket.
Still another possibility is similar to the docking calculated by Takahashi et al.
[73], in which the simulated binding for DCMU was on SER264 through the -CO
group in a trans-amide conformation without any interaction with HIS215. The
residues related to the binding are: PHE211, MET214, HIS215, LEU218, PHE255,
SER264, PHE265, LEU271, PHE274.
Figure 5.2.7: Binding of atrazine in the Q B pocket of PS II
70

The binding affinity of atrazine (-6.5 kcal/mol) is smaller than that of DCMU,
even though two hydrogen bonds are found. The nitrogen atom on the triazine ring
binds to -NH- of PHE265 with a distance of 2.2 A. The other hydrogen bond that
is 2.5 A takes place between the - N H - of atrazine and -CO group of PHE265. The
binding pocket derived from this docking is: PHE211, MET214, HIS215, LEU218,
ALA251, HIS252, PHE255, ALA263, SER264, PHE265, LEU271, PHE274.
5.2.4 Discussion of docking results by AutoDock
The studies of Synechococcus PCC7942 showed that SER264 was essential for
binding of atrazine, DCMU and quinone [74]. Instead of SER264, we found that
PHE265 is playing an important role in the docking. Here we were using the X-ray
crystallography data of PS II isolated from Thermosynechococcus elongatus. This is
due to the difference of protein structures from different strains of cyanobacteria. The
crystal structure of 3bzl shows that the -OH group of SER264 faces to the exterior
side of the QB pocket, so that the backbone - N H - group of PHE265 is more likely to
get involved in the binding of amides in this case.
According to earlier research of herbicide-resistant mutants, most types of
herbicides (i.e., urea type DCMU and triazine type atrazine) lean toward the SER264
side, and phenolic type herbicides toward the HIS215 side of the QB pocket [15, 48].
Since those studies were done before high resolution X-ray structure of PS II became
available, the model was based on the reaction center of purple photosynthetic
bacteria, in which L and M subunits are homologies of Dl and D2 in PS II. In
71

the case of Thermosynechococcus elongatus-b&sed model, atrazine and DCMU bind
at the PHE265 side as shown in Figures 5.2.7 and 5.2.6(b). We also found the similar
preference for binding orientation in the case of explosives. For instance, picric acid,
as a phenolic compound, interacts with HIS215 and PHE265 in Figure 5.2.3.
Binding affinity and dissociation constant are two reciprocal properties of ligand-
protein binding, although they are from different expressions of binding equilibrium.
The dissociation constant is the concentration needed to get half-maximal occupancy
of the binding site. Thus, lower EC50 in our case means it takes less to get the same
amount of binding - this is what one thinks of for higher affinity or stronger binding.
We didn't find any relevant relationship between the binding affinity calculated by
AutoDock Vina and the experimental dissociation constant in Table 5.2.1. This
is most likely due to the limitation of AutoDock in considering the solvent effect.
Nevertheless, it offers a technique to predict the potential conformation of binding.
72

Table 5.2.1: Modeling results of the PS II inhibitors binding to the QB pocket
Binding Pocket Binding Affinity Dissociation
of Docking Results constant (EC50) (kcal/mol) M
PHE211, MET214, HIS215, PQ LEU218, ALA251, HIS252,
PHE255, SER261 PHE265, LEU271
PHE211, MET214, HIS215, Picric acid LEU218, HIS252, PHE255,
ILE259, TYR262,ALA263, SER264, PHE265, LEU275
-6.4 1.5xl0-7
PHE211, MET214, HIS215, LEU218, VAL219, TYR246,
TNT ILE248, ALA251, HIS252, PHE255, ILE259, ALA263, SER264, PHE265, LEU271,
PHE274
PHE211, MET214, HIS215, LEU218, HIS252, PHE255,
Tetryl ILE259, TYR262, ALA263, SER264, PHE265, LEV271,
PHE274, LEU275
-6.8
-5.0
1.4xl0~5
l.lxlCT8
PHE211, MET214, HIS215, DCMU LEU218, PHE255, SER264,
PHE265, LEU271, PHE274 -6.7 8.8xl(r8
PHE211, MET214, HIS215, Atrazine LEU218, ALA251, HIS252,
PHE255, ALA263, SER264, PHE265, LEU271, PHE274
-6.5 3x10 - 7 *
The EC50 of atrazine is from the detection of herbicides by Koblizek et al. [9].
73

Chapter 6
Conclusion
A biosensor based on Photosystem II-enriched particles from spinach leaves and
inexpensive commercially available screen-printed electrodes has been developed. The
biosensor with BBY particles immobilized with BSA-glutaraldehyde is capable of
electrochemical detection of not only herbicides but also some explosives. The present
biosensor also may be employed in environmental protection applications for rapid
screening of picric acid in water samples in a few minutes. While picric acid and
tetryl were detected in concentrations similar to those of the widespread herbicides
(and with similar concentration dependence likely indicating QB site binding), the
limits of detection for TNT were significantly higher (worse). Extensive modeling of
herbicide and explosives binding to the QB binding site of the Photosystem II has
been performed, yielding almost identical binding affinities for all compounds studied
(except original plastoquinone). In other words, there was no meaningful correlation
between the modeling results and measured inhibitory activity. Determination of the
other possible reasons for low sensitivity of the PS II-based biosensor to TNT requires
74

extended research, including that involving isolated bacterial reaction centers as well
as other types of explosives resembling different classes of herbicides (e.g. RDX versus
atrazine).
75

Bibliography
[1] J. V. Goodpaster and V. L. McGuffin. Fluorescence quenching as an indirect
detection method for nitrated explosivs. Analytical Chemistry, 73(9):48824-1322,
2001.
[2] K. J. Albert and D. R. Walt. High-Speed Fluorescence Detection of Explosives-
like Vapors. Analytical Chemistry, 72(9):1947-1955, 2000.
[3] J. S. Yang and T. M. Swager. Fluorescent porous polymer films as TNT
chemosensors: Electronic and structural effects. Journal of the American
Chemical Society, 120(46):11864-11873, 1998.
[4] A. Rose, Z. Zhu, C. F. Madigan, T. M. Swager, and V. Bulovic. Sensitivity gains
in chemosensoing by lasing action in organic polymers. Nature, 434:876-879,
2005.
[5] D. R. Shankaran, K. V. Gobi, T. Sakai, K. Matsumoto, K. Toko, and N. Miura.
Surface plasmon resonance immunosensor for highly sensitive detection of 2,4,6-
trinitrotoluene. Biosensors and Bioelectronics, 20(9):1750-1756, 2005.
[6] R. S. Burlage, D. R. Patek, and K. R. Everman. Method for detection of buried
explosives using a biosensor, 1999.
[7] M. Campas, R. Carpentier, and R. Rouillon. Plant tissue-and photosynthesis-
based biosensors. Biotechnology Advances, 26(4):370-378, 2008.
[8] M. T. Giardi, M. Koblizek, and J. Masojidek. Photosystem Il-based biosensors
for the detection of pollutants. Biosensors and Bioelectronics, 16(9-12):1027-
1033, 2001.
76

[9] M. Koblizek, J. Maly, J. Masojidek, J. Komenda, T. Kucera, M.T. Giardi, A.K.
Mattoo, and R. Pilloton. A biosensor for the detection of triazine and phenylurea
herbicides designed using photosystem II coupled to a screen-printed electrode.
Biotechnology and Bioengineering, 78(1):110—116, 2002.
[10] M. Koblizek, J. Masojidek, J. Komenda, T Kucera, R. Pilloton, A. K. Mattoo,
and M. T. Giardi. A sensitive photosystem Il-based biosensor for detection of a
class of herbicides. Biotechnology and Bioengineering, 60(6):664-669, 1998.
[11] C. Jian and W. R. Seitz. Membrane for in situ optical detection of organic nitro
compounds based on fluorescence quenching. Analytica Chimica Acta, 237:265-
271, 1990.
[12] H. H. Zeng, K. M. Wang, C. L. Liu, and R. Q. Yu. A reversible optode
membrane for picric acid based on the fluorescence quenching of pyrene. Talanta,
40(10):1569-1573, 1993.
[13] C. G. Niu, Z. Z. Li, X. B. Zhang, W. Q. Lin, G. L. Shen, and R. Q. Yu. Covalently
immobilized aminonaphthalimide as fluorescent carrier for the preparation of
optical sensors. Analytical and Bioanalytical Chemistry, 372(4) :519—524, 2002.
[14] X. Yang, C. G. Niu, G. L. Shen, and R. Q. Yu. Picric acid sensitive optode based
on a fluorescence carrier covalently bound to membrane. Analyst, 126:349-352,
2001.
[15] W. Oettmeier and K. Masson. Pier ate as an Inhibitor of Photosystem II
in Photosynthetic Electron Transport. European Journal of Biochemistry,
122(1):163-167, 1982.
[16] E. Ercag, A. Uzer, and Apak R. Selective spectrophotometric detemrination of
trinitrotoluene, trinitrophenol, dinitrojphenol and mononitrophenol. Analytica
Chimica Acta, 505:83-93, 2004.
[17] E. Ercag, A. Uzer, and Apak R. Selective spectrophotometric determination of
TNT using a dicyclohexylamine-based colorimetric sensor. Talanta, 78(3) :772-
780, 2009.
77

[18] J. Wannlund and M. Deluca. A sensitive bioluminescent immunoassay for
dinitrophenol and trinitrotoluene. Analytical Biochemistry, 122(2):385-393,
1982.
[19] J. Wang, R. K. Bhada, J. Lu, and D. Macdonald. Remote electrochemical sensor
for monitoring TNT in natural waters. Analytica Chimica Acta, 361(l-2):85—91,
1998.
[20] H. Sohn, R. M. Calhoun, M. J. Sailor, and W. C. Trogler. Detection of TNT and
Picric Acid on Surfaces and in Seawater by Using Photoluminescent Polysiloles.
Angewandte Chemie, 113(11):2162-2163, 2001.
[21] K. S. Ro, A. Venugopal, D. D. Adrian, D. Constant, K. Qaisi, K. T. Valsaraj,
L. J. Thibodeaux, and D. Roy. Solubility of 2,4,6-Trinitrodoluene(TNT) in water.
Journal of Chemical and Engineering Data, 41(4):758—761, 1996.
[22] Y. Ouyang, C. H. Huang, D. Y. Huang, D. Lin, and L. Cui. Simulating uptake
and transport of TNT by plants using STELLA. Chemosphere, 69(8):1245-1252,
2007.
[23] N. A. Ali, D. Dewez, P. Y. Robidoux, and R. Popovic. Photosynthetic parameters
as indicators of trinitrotoluene (TNT) inhibitory effect: Change in chlorophyll a
fluorescence induction upon exposure of Lactuca sativa to TNT. Ecotoxicology,
15:437-441, 2006.
[24] R. L. Marple and W. R. LaCourse. Application of photoassisted electrochemical
detection to explosive-containing environmental samples. Analytical Chemistry,
77:6709-6714, 2005.
[25] S. D. Harvey, R. J. Fellows, J. A. Campbell, and D. A. Cataldo. Determination of
the explosive 2,4,6-trinitrophenylmethylnitramine (tetryl) and its transformation
products in soil. Journal of Chromatography A, 605(2) :227-240, 1992.
[26] M. M. Shah and J. C. Spain. Biochemical and Biophysical Research
Communications, 220(3) :563, 1996.
[27] R. Hodyss and J. L. Beaucham. Multidimensional Detection of Nitroorganic
Explosives by Gas Chromatography-Pyrolysis-Ultraviolet Detection. Analytical
chemistry, 77(11):3607-3610, 2005.
78

[28] C. A. Timiriazeff. Sur Taction de la lumiere dans la decomposition de l'acide
carbonique par la granule de chlorophylle. In International Botanical Congress,
pages 108-117, Frienze, Italy, 1874.
[29] R. Emerson and Arnold W. A separation of the reactions in photosynthesis by
means of intermittent light. Journal of General Physiology, 15:391-420, 1932a.
[30] S. Gonvindjee. Chlorophyll a fluorescence: A bit of basics and history, pages
1-42. Springer, Dordrecht, 2004.
[31] L. N. M. Duysens, J. Amesz, and B. M. Kamp. Two photochemical systems in
photosynthesis. Nature, 190:510-511, 1961.
[32] K. N. Ferreira, T. M. Iverson, K. Maghlaoui, J. Barber, and S. Iwata.
Architecture of the photosynthetic oxygen-evolving center. Science, 303:1831-
1837, 2004.
[33] E. P. Fuerst and M. A. Norman. Interactions of herbicides with photosynthetic
electron transport. Weed Science, 39:458-464, 1991.
[34] B. Hankamer, J. Barber, and E. J. Boekema. Structure and membrane
organization of Photosystem II in green plants. Annual Review of Plant
Physiology and Plant Molecular Biology, 48:641-671, 1997.
[35] T. M. Bricker and L. K. Frankel. The structure and function of CP47 and CP43
in Photosystem II. Photosynthesis Research, 2002.
[36] W. P. Schroder and L. X. Shi. The low molecular mass subunits of the
photosynthetic supracomplex, photosystem II. Biochimica et Biophysica Acta,
1608(2-3):75-96, 2004.
[37] K. Burda, J. Kruk, R. Borgstadt, J. Stanek, K. StrzaBka, G. H. Schmid, and
O. Kruse. Mossbauer studies of the non-heme iron and cytochrome b559 in
a Chlamydomonas reinhardtii PSI-mutant and their interactions with alpha
tocopherol quinone. FEBS Letters, 535:159-165, 2003.
[38] N. K. Boardman and J. M. Anderson. Isolation from spinach chloroplasts of
particles containing different proportions of chlorophyll a and chlorophyll b and
79

their possible role in the light reactions of photosynthesis. Nature, 293:166-167,
1964.
[39] S. Eshaghi, Andersson B., and Barber J. Isolation of a highly active PSII-
LHCII supercomplex from thylakoid mebranes by a direct method. FEBS Letters,
446:23-26, 1999.
[40] Wydrzynski T. J. and Satoh K. Photosystem II-The light-driven water:
plasotquinone oxidoreductase, volume 22, chapter 8, page 13. Springer, 2005.
[41] D. A. Berthold, G. T. Babcock, and C. F. Yocum. a highly resolved, oxygen-
evolving photosystem II preparation from spinach thylakoid membranes. FEBS
Letters, 134:231-234, 1981.
[42] W. Draber, K. Tietjen, J.F. Kluth, and A. Trebst. Herbicides in photosynthesis
research. Angew. Chem. Int. Ed. Engl, 30:1621-1633, 1991.
[43] C. A. Tracewell and G. W. Brudvig. Characterization of the secondary electron-
transfer pathway intermediates of photosystem II containing low-potential
cytochrome b559. Photosynthesis Research, 98:188-197, 2008.
[44] C. A. Buser, B. A. Diner, and G. W. Brudvig. Photooxidation of cytochrome
1559 in oxygen-evolving photosystem II. Biochemistry, 31:11449-11459, 1992.
[45] D. H. Stewart and G. W. Brudvig. Cytochrome b559 of photosystem II.
Biochimica et Biophysica Acta, 1367:63-87, 1998.
[46] A. Magnuson, M. Rova, F. Mamedov, P. O. Fredriksson, and S. Styring. The
role of cytochrome b559 and tyrosineD in protection against photoinhibition
during in vivo photoactivation of photosystem II. Biochimica et Biophysica Acta,
1411:180-191, 1999.
[47] Wydrzynski T. J. and Satoh K. Photosystem II-The light-driven
water-.plasotquinone oxidoreductase, volume 22, chapter 8, pages 188-193.
Springer, 2005.
[48] A. Trebst. The three-dimensional structure of the herbicide binding niche on
the reaction center polypeptides of photosystem II. Z. Naturforsch, 42c:742-750,
1987.
80

[49] C. Hansen and T. Fujita. A new substituent constant, PI, derived from partition
coefficients. Journal of the American Chemical Society, 86:5175-5180, 1964.
[50] G. Krishnan, Horst G. L., S. Darnell, and W. L. Powers. Growth and
development of smooth bromgrass and tall fescue in TNT-contaminated soil.
Environmental Pollution, 107:109-116, 2000.
[51] P. Y. Robidoux, G. Bardai, L. Paquet, G. Ampleman, S. Thiboutot, J. Hawari,
and G. I. Sunahara. Phytotoxicity of 2,4,6-trnitrotoluene (TNT) and octahydro-
1,3,5,7-tetrazocine (HMX) in spiked arteficial and natural forest soils. Arch
Environ Contam Toxicol, 44:198-209, 2003.
[52] N. Boucher, L. Lorrain, and F. Bellemare. Methode pour tester des activites
photosynthetiques.
[53] D. I. Arnon. Copper enzymes in isolated chloroplasts polyphenoloxidase in beta
vulgaris. Plant Physiology, 24(1):1-15, 1949.
[54] P. J. Leeuwen, M. C. Nieveen, E. J. Meent, J. P. Dekker, and H. J. Gorkom.
Rapid and simple isolation of pure photosystem ii core and reaction center
particles from spinach. Photosynthesis Research, 28(3):149-153, 1991.
[55] J. D. Brewster, A. R. Lightfield, and P. L. Bermel. Storage and immobilization
of photosystem ii reaction centers used in an assay for herbicides. Analytical
Chemistry, 67(7):1296-1299, 1995.
[56] D. Laberge, R. Rouiilon, and Carpentier R. Comparative study of thylakoid
membranes sensitivity for herbicide detection after physical or chemical
immobilization. Enzyme and microbial technology, 26(5-6):332-336, 2000.
[57] C. Loranger and R. Carpentier. A fast bioassay for phytotoxicity
measurement using immobilized photosynthetic membranes. Biotechnology and
Bioengineering, 44(2): 178-183, 1994.
[58] K. Takashi, Usui H., D. Hobara, and Yamamoto M. Voltammetric properties of
the reductive desorption of alkanethiol self-assembled monolayers from a metal
surface. Langmuir, 18(13):5231-5238, 2002.
[59] J. Wang. Analytical electrochemistry, page 29. John Wiley and Sons, 2006.
81

[60] P. C. Meier and R. E. Zund. Statistical methods in analytical chemistry, pages
103-107. 1993.
[61] E. Touloupakis, L. Giannoudi, S. A. Piletsky, L. Guzzella, F. Pozzoni, and
M. T. Giardi. A multi-biosensor based on immobilized Photosystem II on screen-
printed electrodes for the detection of herbicides in river water. Biosensors and
Bioelectronics, 20(10):1984-1992, 2005.
[62] F. Bettazzi, S. Laschi, and M. Mascini. One-shot screen-printed thylakoid
membrane-based biosensor for the detection of photosynthetic inhibitors in
discrete samples. Analytica Chimica Acta, 589(1):14—21, 2007.
[63] K. Satoh, M. Oh-Hashi, Y. Kashino, and H. Koike. Mechanisms of electron flow
through the QB site in photosystem II. Plant Cell Physiology, 36:597-605, 1995.
[64] B. A. Diner and V. Petrouleas. Light-induced oxidation of the acceptor-side
Fe(II) of Photosystem II by endogenous quinones acting through the QB binding
site. II. Blockage by inhibitors and their effects on the Fe(III) EPR spectra.
Biochimica et Biophysica Acta, 893:138-148, 1987.
[65] K. Satoh, H. Koike, T. Ichimura, and S. Katoh. Binding affinities of
benzoquinones to the QB site of Photosystem II in Synechococcus oxygen-
evolving preparation. Biochimica et Biophysica Acta, 1102:45-52, 1992.
[66] Y. Kashino, M. Yamashita, Y. Okamoto, H. Koike, and K. Satoh. Mechanisms of
electron flow through the QB site in Photosystem II. 3. Effects of the presence of
membrane structure on the redox reactions at the Q B site. Plant Cell Physiology,
37:976-982, 1996.
[67] J. Maly, C. Di Meo, M. De Francesco, A. Masci, J. Masojidek, M. Sugiura,
A. Volpe, and R. Pilloton. Reversible immobilization of engineered molecules by
Ni-NTA chelators. Bioelectrochemistry, 63(1-2):271-275, 2004.
[68] J. Lu and Z. Zhang. A reusable optical sensing layer for picric acid based on the
luminescence quenching of the Eu-thenoyltrifluoroacetone complex. Analytica
Chimica Acta, 318:175C179, 1996.
82

[69] G. He, H. Peng, M. Liu, T.and Yang, Y. Zhang, and Y. Fang. A novel picric
acid film sensor via combination of the surface enrichment effect of chitosan
films and the aggregation-induced emission effect of siloles. Journal of Materials
Chemistry, 19(39):7347-7353, 2009.
[70] 0 . Trott and A. J. Olson. Autodock vina: improving the speed and accuracy of
docking with a new scoring function, efficient optimization and multithreading.
Journal of Computational Chemistry, 31:455-461, 2010.
[71] D. S. Goodsell, G. M. Morris, and A. J. Olson. Automated docking of flexible
ligands: Applications of Autodock. Journal of Molecular recognition, 9:1-5, 1996.
[72] A. Guskov, J. Kern, A. Gabdulkhakov, M. Broser, A. Zouni, and W. Saenger.
Cyanobacterial photosystem II at 2.9A resolution and the role of quinones, lipids,
channels and chloride. Nat. Struct. Mol. Biol, 16:334-342, 2009.
[73] R. Takahashi, K. Hasegawa, A. Takano, and T. Noguchi. Structure and Binding
Sites of Phenolic Herbicides in the QB Pocket of Photosystem II. Biochemistry,
49:5445-5454, 2010.
[74] E. Haag, H. M. Gleiter, and G. Renger. Effects of photoinhibition on the PS
II acceptor side including the endogenous high spin Fe2+ in thylakoids, PS
II-membrane fragments and PS II core complexes . Photosynthesis Research,
31:113-126, 1992.
83