photosynthetic efficiency of phototrophic plankton and bio
TRANSCRIPT

Photosynthetic Efficiency of Phototrophic Plankton and Bio-Optical Variability as Influenced by Mesoscale Processes In the Eastern
Caribbean Basin by
Ramón López-Rosado
A dissertation submitted in partial fulfillment of the requirements for the degree of
DOCTOR OF PHILOSOPHY
in
MARINE SCIENCES
(Biological Oceanography)
UNIVERSITY OF PUERTO RICO MAYAGÜEZ CAMPUS
December 2008
Approved by: _______________________________ ___________ Roy A. Armstrong, Ph.D. Date Member, Graduate Committee ___________________________________ ____________ Jorge E. Corredor, Ph.D. Date Member, Graduate Committee ___________________________________ ____________ Fernando Gilbes, Ph.D. Date Member, Graduate Committee ___________________________________ ____________ Julio Morell, M.S. Date Member, Graduate Committee ___________________________________ ____________ José M. López, Ph.D. Date President, Graduate Committee ___________________________________ ____________ Nilda E. Aponte, Ph.D. Date Chairperson of the Department
_______________________ ____________ Edgardo Lorenzo, Ph.D. Date Representative of Graduate Studies

ii
COPYRIGHT In presenting this dissertation in partial fulfillment of the requirements for a Doctor of Philosophy degree at the University of Puerto Rico, I agree that the library shall make its copies freely available for inspection. I therefore authorize the Library of the University of Puerto Rico at Mayaguez to copy my dissertation totally or partially. Each copy must include the title page. I further agree that extensive copying of this dissertation is allowable only for scholarly purposes. It is understood, however, that any copying or publication of this dissertation for commercial purposes, or for financial gain, shall not be allowed without my written permission. Signed: Ramón López Rosado Date: December 12, 2008

iii
ABSTRACT
This study comprises an analysis of photosynthetic potential of phototrophic
plankton in eastern Caribbean Sea near-surface waters as influenced by the action of
mesoscale processes. The massive freshwater plume from the Orinoco River and
mesoscale cyclonic and anti-cyclonic eddies are two common types of features in the
Eastern Caribbean Sea. The physiological state of phototrophic plankton was addressed
by measuring its photosynthetic efficiency using a fast repetition rate fluorometer (FRRF)
throughout the region. The Fv/Fm parameter measures the changes in phototrophic
plankton physiology by a rapid, noninvasive assessment of in vivo fluorescence
signatures. The FRRF provided fast and accurate quantification of changes in
productivity in response to environmental forcing at the ecologically relevant scales of
mesoscale processes. Enhanced biological activity has been associated with these
features which stimulate the input of limiting nutrients into the euphotic zone. FRRF
measurements showed that photosynthetic efficiency varied vertically in areas of upward
pycnocline displacement of isohalines and thermal structures suggesting that nutrient
upwelling is responsible for the higher photosynthetic efficiency observed at surface. The
influence of the Orinoco River plume on the photosynthetic potential demonstrated
increased Fv/Fm close to the surface, decreasing with depth, suggesting a relationship
with river originated material. Independent measurements of photosynthetically
mediated 14C uptake produced a strong linear relationship (r = 0.91) with the FRRF-based
primary productivity estimates for data collected throughout the region. These estimates
covaried with satellite-based estimates of primary production through the environmental
gradients created by the Orinoco River plume. Correlation analysis was used to describe
the relationship between phototrophic plankton physiological state (Fv/Fm) and
independent measurements of bio-optical variables.The beam attenuation to chlorophyll
ratio (cp *) demonstrated inverse correlation with Fv/Fm as a result of the baroclinic
instabilities created by eddies. The phytoplankton specific absorption coefficient (aph)
showed reduced absorption in the region of 442 nm apparently in response to increased
package effect for waters under the influence of the river plume. Variations in the aph
slope were associated to a decrease in the quantum yield for carbon fixation in samples
from oceanic waters far from the direct influence of the Orinoco River plume.

iv
RESUMEN
Este estudio comprende un análisis del potencial fotosintético del plancton
fototrófico en aguas superficiales del Mar Caribe oriental según son definidas por la
acción de procesos a meso-escala. Remolinos a meso-escala ciclónicos y anti-ciclónicos
y las plumas masivas de aguas dulce del Río Orinoco son fenómenos comunes en el Mar
Caribe. El estado fisiológico del plancton fototrófico fue estudiado usando un
fluorόmetro de repetición rápida (FRR), para medir su eficiencia fotosintética (Fv/Fm) a
través de la región. El parámetro Fv/Fm mide los cambios en la fisiología del plancton
fototrófico con una evaluación rápida y no invasiva de las señales de fluorescencia en
vivo. El FRR provee una cuantificación rápida y precisa de los cambios en productividad
en respuesta a presiones ambientales a las escalas ecológicamente relevantes de procesos
a meso-escala. El aumento en actividad biológica ha sido asociada a estos fenomenos, los
cuales estimulan la incursión de nutrientes limitantes en la zona eufótica. Las medidas
del FRR mostraron que la eficiencia fotosintética varió verticalmente en áreas de
desplazamiento de la picnoclina hacia la superficie de estructuras isohalinas y estructuras
termales sugiriendo que el afloramiento de nutrientes es responsable por la alta eficiencia
fotosintética observada en superficie. La influencia del frente del Río Orinoco en el
potencial fotosintético demostró incrementos en Fv/Fm cerca de superficie
disminuyendo con profundidad, sugiriendo una relación con el material originado en el
río. Los estimados de producción primaria basados en el FRR demostraron una relación
lineal robusta (r = 0.91) con medidas independientes por estimados de 14C obtenidos a
través de la región. Estos estimados covariaron con estimados de productividad primaria
realizados con datos de satélite, a través del gradiente ambiental creado por el Río
Orinoco. Medidas bio-ópticas independientes también fueron consideradas en este
estudio y asociadas al estado fisiológico del plancton fototrófico. La razón de atenuación
del haz (cp *) con clorofila-a demostró una relación inversa con Fv/Fm como resultado
de las inestabilidades baroclínicas creadas por los remolinos. El coeficiente de absorción
específica de fitoplancton (aph) demostró una absorción reducida en la región de 442 nm
aparentemente en respuesta al efecto de paquete en las aguas influenciadas por la pluma
del rio. Variaciones en la pendiente de (aph) fueron asociados a una disminución en la

v
taza quántica de fijación de carbono en las muestras de aguas oceánicas lejos de la
influencia directa de la pluma del Río Orinoco.

vi
This work is dedicated to my parents, Ramón and Rosa, and my brothers, Javier and Joel, for their love and unconditional support.

vii
ACKNOWLEDGEMENTS
This journey was only possible because of the people it was share with, consequently I
would like to express my most sincere gratitude to:
• My friends and laboratory mates Marla, Marcos, Milton, Alvaro, Suhey, Dihalia,
Belitza, Jacquelyn, Ana, Helena, Miguel, Dieppa, Patrick, Vilmaliz and Ava,
whom without their help, support and encouragement this research and
manuscript would not have been possible. For believing in me, especially in the
moments when the journey became harsh and the load unbearable.
• The bio-optical laboratory, Yazmin, Debby, Aurora, Maria and Sara whom were
always there to provide help and support.
• My graduate committee, José M. López, Jorge Corredor, Julio Morell, Fernando
Gilbes, Roy Armstrong and Jorge Capella for their support and guidance through
this whole process.
• To the Crew of the R/V Chapman, R/V Sultana, R/V Pelican and R/V Ronald H.
Brown for their assistance and help during the field operations.
This research was supported by the Office of Naval Research (ONR) (Grant number:
N000140310904), Department of Energy (Grant number: DE-FG02-05ER64029 and DE-
FG02-05ER64149), NASA-UPR Tropical Center for Earth and Space Studies (TCESS)
and the NOAA-UPRM Cooperative Remote Sensing Science and Technology Center
(NOAA-CREST) (Grant Number: NA17AE1625).

viii
TABLE OF CONTENTS
LIST OF TABLES........................................................................................................I X LIST OF FIGURES ..................................................................................................... X CHAPTER 1. General Introduction............................................................................1 CHAPTER 2. Fast Repetition Rate Fluorometry and optical indices of phototrophic plankton photosynthetic potential at Eastern Caribbean Mesoscale Processes. 2.1. Abstract ................................................................................................................. 9 2.2. Introduction............................................................................................................11 2.3. Methodology ..........................................................................................................16 2.4. Results ....................................................................................................................20 2.5. Discussion............................................. ............... ................................................66 2.6. Conclusions.............................................................................................................71 CHAPTER 3. Carbon fixation estimates and bio-optical characteristics of phototrophic plankton in eastern Caribbean waters. 3.1. Abstract .............................................................................................................. 72 3.2. Introduction...........................................................................................................74 3.3. Methodology ........................................................................................................78 3.5. Results...................................................................................................................90 3.6. Discussion.............................................................................................................119 3.7. Conclusions...........................................................................................................127 General Conclusion .................................................................................................128 Cited Literature .......................................................................................................130

ix
LIST OF TABLES
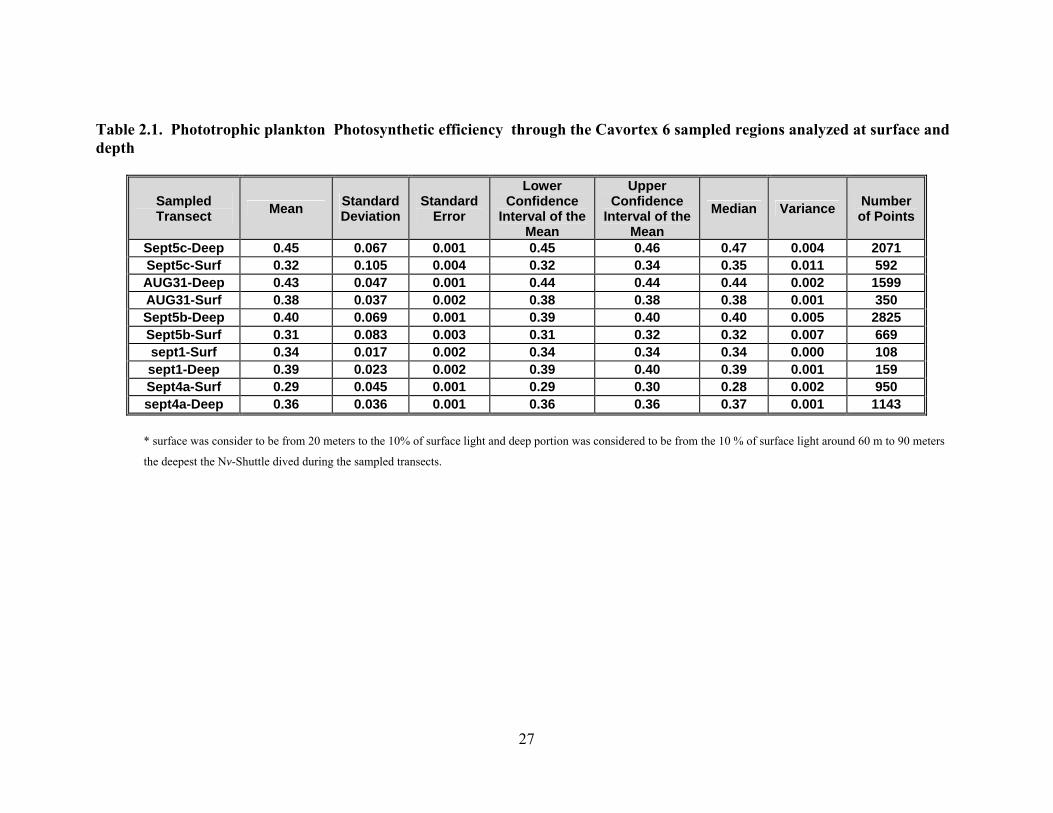
Table 2.1. Phototrophic plankton Photosynthetic efficiency through the Cavortex 6 sampled regions analyzed at surface and depth…………………………. .27
Table 2.2. Phototrophic plankton Photosynthetic efficiency through the Cavortex 6
sampled regions analyzed against isothermal temperature ranges.…….. 28 Table 2.3. Phototrophic plankton Photosynthetic functional absorption cross-
section through the Cavortex 6 sampled regions analyzed against isothermal temperature ranges. ……………………………………………35
Table 2.4. Phototrophic plankton Photosynthetic Efficiency (FvFm) and functional
absorption cross-section of photosystem II (σPSII) statistical analysis against isothermal temperature ranges for the eddy pair sampled during Cavortex 2. ………………………………………………………………… 38
Table 2.5 Summary of phototrophic plankton chlorophyll-specific absorption
coefficients and photosynthetic efficiency for discrete samples during Cavortex 6. …………………………………………………………………. 43
Table 2.6. Fv/Fm statistics of sampled transects during Oripex 8. Partial data
presented as surface (< 40 m) and depth (> 40 m). ……………………….59 Table 3.1a. Summary of primary production estimates for surface samples during
Oripex 7 and 8. ……………………………………………………………..94 Table 3.1b. Production estimates and Monte Carlo Simulation estimates for
sampled stations across the Eastern Caribbean.………………………….95 Table 3.2 Phototrophic plankton bio-optical characteristics and production
estimates summary at the sampled stations. …………………………….98 Table 3.3. Satellite derived Net Primary Production estimates through VGPM and
CbPM models during Oripex 8. ……………………………………........ 107

x
LIST OF FIGURES Figure 1.1 Map of the Caribbean Sea and of the nearby tropical Atlantic showing
the Amazon and Orinoco Rivers (from Cherubin and Richardson, 2007) …………………………………………….………………………………….8
Figure 2.1. Map of the Eastern Caribbean Sea ………...………………………......15 Figure 2.2 Sampled stations and transect during Cavortex 6 over Jason sea surface
anomaly obtained from AVISO live access server (LAS). These altimeter products were produced by Ssalto/Duacs and distributed by Aviso, with support from Cnes. ..................................................................21
Figure 2.3. Sampled stations and transect during Cavortex 2 over Jason sea surface
anomaly obtained from AVISO live access server (LAS). These altimeter products were produced by Ssalto/Duacs and distributed by Aviso, with support from Cnes. ……………………………………………………...... 22
Figure 2.4. Sampled stations and transect during Cavortex 4 over Jason sea surface
anomaly obtained from AVISO live access server (LAS). These altimeter products were produced by Ssalto/Duacs and distributed by Aviso, with support from Cne …………………………………………………………..23
Figure 2.5 Photosaturation of photosystem II apparent as depressed Fv/Fm values
appeared during late afternoon sampling during Cavortex 6 transect of august 31. …………………………………………………………………...24
Figure 2.6. Temperature isotherms at cyclonic eddy edge during transect of August
31 during Cavortex 6. ……………………………………………………25 Figure 2.7. Phototrophic plankton photosynthetic efficiency per temperature
ranges through the sampled areas during Cavortex 6. …………...…..26 Figure 2.8 Sampled parameters at cyclonic eddy center during transect of
September 5 during Cavortex 6. …………………...…………………........29 Figure 2.9. Temperature and phototrophic plankton photosynthetic efficiency
relationship at eddy center (between 60 and 90 meters) during Cavortex 6. ………………………………………………………....…...30
Figure 2.10. Photosynthetic Efficiency and temperature isotherms at cyclonic eddy
during Cavortex 6. ……………………………………………………….31 Figure 2.11. Phototrophic plankton photosynthetic efficiency against Sigma T at
cyclonic eddy center from 40 to 90 meters. ……………………………..32

xi
Figure 2.12. Functional absorption cross-section correlation with photosynthetic efficiency at cyclonic eddy center during Cavortex 6. ………...……..33
Figure 2.13. Phototrophic plankton photosynthetic efficiency against sigma t at
anti-cyclonic area from 40 to 90 meters. ………………..………….....34 Figure 2.14. Phototrophic plankton photosynthetic efficiency, chlorophyll
concentration and photosystem II photoabsorbance cross-section during Cavortex 2.……………………………………………………….37
Figure 2.15. Phototrophic plankton Photosynthetic efficiency at eddy pair during
Cavortex 2. ……………………………………………………...……….39 Figure 2.16. Chlorophyll-specific absorption coefficient of phototrophic plankton
at stations during Cavortex 6. ……………………………….……….. 41 Figure 2.17. Phototrophic plankton photosynthetic efficiency and absorption ratio
676/442 relationship for stations at cyclonic eddy center and edge during Cavortex 6. ……………………………………………………….44
Figure 2.18. Phototrophic plankton photosynthetic efficiency and absorption ratio
676/442 relationship for stations at anti-cyclonic eddy during Cavortex 6…………………………………………………………………………….45
Figure 2.19. Phototrophic plankton photosynthetic efficiency and absorption ratio
676/442 relationship for stations at cyclonic eddy center and edge during Cavortex 2. ……………………………………………………….46
Figure 2.20. Beam attenuation coefficient at 660 (nm) with depth through the
sampled regions during Cavortex 6. ……………………………………47 Figure 2.21. Chlorophyll normalized beam attenuation (660 nm) at cyclonic eddy
center during Cavortex 6. ……………………………………………….48 Figure 2.22. Chlorophyll normalized beam attenuation (660 nm) at cyclonic eddy
center during Cavortex 2. ………………………………………………..49 Figure 2.23. Phototrophic plankton photosynthetic efficiency and beam attenuation
normalized to chlorophyll relationship for stations at cyclonic eddy center and edge during Cavortex 6. ……………………………….........50
Figure 2.24. Phototrophic plankton photosynthetic efficiency and beam attenuation
normalized to chlorophyll relationship for stations at anti-cyclonic eddy during Cavortex 6. …………………………………………………........51

xii
Figure 2.25. Phototrophic plankton photosynthesis efficiency and beam attenuation normalized to chlorophyll relationship during Cavortex 2.……………………………………………………………………………52
Figure 2.26. Phototrophic plankton photosynthesis efficiency and beam attenuation
normalized to chlorophyll relationship during Cavortex 4. ….………53 Figure 2.27. Particle Size distribution slope versus backscatter ratio at 510 nm
during sampled stations of Cavortex 6. ………………………………..54 Figure 2.28. Particle Size distribution slope versus backscatter ratio at 510 nm
during sampled stations of Cavortex 4. ………………………….........55 Figure 2.29. Flow cytometry data for discrete samples during Cavortex 6. ….….56 Figure 2.30. MODIS Aqua chlorophyll-a images during the Oripex expeditions.The
images were capture November 24, 2005 for Oripex 7, and September 20, 2006 for Oripex 8. …………………………………………………...58
Figure 2.31. Fv/Fm and salinity countor maps during Oripex 8 for transect
sampled during Sepetember 20, 2006. The sampled transect denotes the inclusion of low salinity waters over the zone from the Orinoco River front. …………………………………………………………………….. 60
Figure 2.32. Fv/Fm and salinity contour maps during Oripex 8 for transect
sampled during Sepetember 22, 2006. …………………………………...61 Figure 2.33. Fv/Fm and salinity contour maps during Oripex 8 for transect
sampled during Sepetember 18, 2006. …………………………………. 62 Figure. 2.34. Fv/Fm and aximum fluorescence profile casts for sampled stations
during Oripex 8. …………………………………………………. ……. 63 Figure 2.35. Fv/Fm and maximum fluorescence profile casts for sampled stations
during Oripex 7. ………………………………………………………... 64 Figure 3.1. Stations sampled for phototrophic plankton bio-optical characteristics
during Cavortex 6 and Oripex 7 and 8……………………….………. 78 Figure 3.2a. Primary production obtained from 14C incubations and Fast Repetition
rate Fluorometry during Oripex 7. ………………….…………………. 90 Figure 3.2b. Primary production estimates from 14C and FRRF per sampled
latitudes during Oripex 7, Oripex 8 and Cavortex 6. ………………... 91 Figure 3.3. Primary production obtained from of Fast Repetition rate Fluorometry
and Monte Carlo Simulations and 14C incubations. ………………….... 92

xiii
Figure 3.4. Primary production obtained from of Fast Repetition rate Fluorometry
and Monte Carlo Simulations. ……………………………………………96 Figure 3.5. Phototrophic plankton absorption coefficient maxima at sampled
latitudes during Oripex 7, Oripex 8 and Cavortex 6. ………….……….96 Figure 3.6. Chlorophyll-a concentration at sampled latitudes during Oripex 7,
Oripex 8 and Cavortex 6. ……………………………………………...….97 Figure 3.7. The absorption slope at sampled latitudes during Oripex 7, Oripex 8
and Cavortex 6. …………………………………………………….….…100 Figure 3.8 The slope of absorption spectra and chlorophyll relationship through the
sampled areas. ………………………………………………….………..100 Figure 3.9. Phototrophic plankton absorption coefficient slope and its relationship
to phototrophic plankton absorption ratio 674/443...…………………..101 Figure 3.10. Quantum yield for photosynthesis obtained from FRRF and its
relationship to phototrophic plankton absorption slope. ………...…...101 Figure 3.11. Quantum yield for photosynthesis obtained from FRRF and its
relationship to phototrophic plankton absorption maxima. ……...…..102 Figure 3.12. Quantum yield for photosynthesis obtained from FRRF and its
relationship to phototrophic plankton absorption ratio 674/443. ...…..103 Figure 3.13. Quantum yield for photosynthesis obtained from FRRF and its
relationship to chlorophyll concentration during the study. …………..103 Figure 3.14 Fourth derivative analysis of phototrophic plankton absorption
spectra at surface for stations sampled during Oripex 7.………………105 Figure 3.15 Fourth derivative analysis of phototrophic plankton absorption spectra
at surface for stations sampled during Cavortex 6. …………………...106 Figure 3.16 Modeled net primary production from remote sensed data (MODIS)
and in-situ measurements from FRRF. ………………………………..111 Figure 3.17. MODIS aqua Chlorophyll level 2 product for September 20, 2006....111 Figure 3.18 MODIS Aqua SST level 2 product for September 20, 2006. ………. .112 Figure 3.19 Modeled net primary production from remote sensed data (MODIS) at
a 1 km resolution and in-situ measurements from FRRF. ………........112

xiv
Figure 3.20 Carbon based modeled net primary production from MODIS level 3 remote sensed data and in-situ measurements from FRRF. …………113
Figure 3.21 Carbon based modeled net primary production from MODIS level 2
remote sensed data and in-situ measurements from FRRF. …………113 Figure 3.22 Carbon based and VGPM modeled net primary production from
MODIS level 2 remote sensed data . ……………………………………114 Figure 3.23. Carbon based modeled net primary production from MODIS level 2
remote sensed data per latitude. ………………………………………..114 Figure 3.24. MODIS level 2 chlorophyll-a concentration image of September 20,
2006, denoting the extend of the river front. ………………………….115 Figure 3.25. Primary production obtained from of Fast Repetition rate
Fluorometry and its relation to natural fluorescence derived production during Cavortex 2. ………………………………………………………116
Figure 3.26. Modeled net primary production from FRRF-based measurements
during Cavortex 2 through an eddy pair. …………………………….117 Figure 3.27. Sampled stations and transect during Cavortex 2 over Jason sea
surface anomaly obtained from AVISO live access server (LAS). These altimeter products were produced by Ssalto/Duacs and distributed by Aviso, with support from Cnes. ………………………………………....117
Figure 3.28. MODIS Aqua derived diffuse attenuation coefficient at 490 nm
(kd490) for sampled stations from transects during Oripex 8. …….118
CHAPTER 1
1.1 General Introduction
Phototrophic plankton comprised by single-celled organisms , cyanobacteria and
phytoplankton, inhabit three quarters of the earth’s surface yet they account for less than
one percent of the 600 billion metric tons of carbon contained within its photosynthetic
biomass. Recent satellite-based estimates have demonstrated that phototrophic plankton
incorporates approximately 45 billion to 52 billion metric tons of inorganic carbon into
their cells each year (Falkowski, 2002), drawing as much CO2 out of the atmosphere
through photosynthesis as trees on land ecosystems. Consequently, it is of great interest
to understand their role in Earth’s carbon cycle as an integral part of the biological pump,
which is the transport of organic carbon (and N and P) to deep sea by the settling of dead
cells. It is estimated that the biological pump is responsible for seven to eight billion
metric tons, or 15 percent, of the carbon that the phototrophic plankton assimilates every
year (Falkowski, 2002). As the biological pump plays an important role in the Earth's
carbon cycle, significant effort is spent quantifying its strength, especially into the
understanding the biogeophysical dynamics affecting photosynthesis throughout our
planet. This study focuses such efforts to increase understanding of the Eastern
Caribbean Basin, a highly dynamic and complex region.
Caribbean water masses show seasonal cycles with temporal variations in their
vertical structure. These seasonal cycles are influenced by mesoscale events such as
freshwater inputs to the eastern Caribbean and mesoscale eddies that periodically move
through the area. The fresh water impulses are a result of the Orinoco River and Amazon
River plumes as they are transported by the eastern Caribbean inflow between South
America and the Virgin Islands. Peak flow for the Orinoco River occurs between the
months of August-September (Lewis and Saunders, 1989), while the Amazon River
shows it’s highest during May to June (Hedges et al., 1986). The influence of these fresh
water inputs impact North Eastern Caribbean surface water structure throughout the year
presenting a surface salinity below what is typically found at the Tropical Atlantic

2
Surface Water and elevated silicate content, unusual for the region (Corredor and Morell,
2001). The seasonality of these events on is influenced by the seasonal displacement of
the Intertropical Convergence Zone (ITCZ) along a gradient from the Amazon River
across the Orinoco River basin and into the central Caribbean. A dry season centered
during the month of April is observed when the ITCZ is displaced south and strong
easterly winds enhance surface flow through the Caribbean (Morrison Smith, 1990),
inducing upwelling along the southern Caribbean (Corredor, 1979). During this period
the Amazon river has a major effect on Caribbean waters even though part of its flow is
retroflected eastward in the North Equatorial Countercurrent. The remaining flow is
carried north by the North Equatorial Current and into the Caribbean current. The rainy
season appears when the ITCZ is at its northernmost position over the Caribbean and the
Orinoco River basin causing massive freshwater inputs to the Eastern Caribbean and to
Caribbean surface current (Corredor and Morell, 2001).
The Caribbean current inflow , a major route by which riverine waters are
transported through the Caribbean, has two sources; one north and one to the south of 15°
N (Figure 1.1) . The northern inflow is primarily Gulf Stream water returning
southwestward in the North Equatorial Current. These waters pass through the Leeward
Islands of the Lesser Antilles, through the Windward Passage between Cuba and
Hispaniola and through the Mona Passage between the Hispaniola and Puerto Rico
(Johns et al., 2002). The southern inflow originates in the South Atlantic and crosses the
equator through the North Brazil Current (NBC), which is part of the northward flowing
western current. The NBC curls to the east and south near 6° N into what is known as a
retroflection to feed the North Equatorial Countercurrent (NECC) (Figure 1.1). This
retroflection is seasonal with episodes occurring from June through March. Otherwise
this current continues and becomes part of the Guyana current along the coast of northern
Brazil. During the retroflection period the NBC closes into itself forming eddies that
dislodge continuing northwestward at around 15cm/sec (Johns et al., 2002). These
mesoscale formations then collide with the Antilles and are advected through the
passages along with the Guyana current and enter the Caribbean mostly through the
Grenada, St. Vincent, and St. Lucia Passages in the southeast. This inflow that crosses the
Caribbean westward transports about 28 Sv (1 Sv = 106 m³/sec), 10 Sv of which enters

3
the Caribbean through the southern or Windward Islands passages, 8 Sv enters through
the northern or Leeward Islands passages, and 10 Sv enters through the Greater Antilles
Islands passages (Johns et al., 2002).
The inflow advection through the Antilles passages into the Caribbean region
described above creates baroclinic instabilities, resulting in the formation of cyclonic and
anticyclonic eddies. Murphy and Hurlburt (1999) suggest that most mesoscale eddies
associated with the Caribbean current are primarily anticyclonic derived from the
anticyclonic vorticity of the North Brazil Current rings and transit through a narrow
corridor across the Caribbean basin along an axis at 14° to 15° N with average speeds of
0.15 m/s. Canals-Silander (2005) describes an anticyclonic eddy advected into the
Caribbean area around 14° N and moved westward along the Jamaica Ridge. Using
satellite-tracked surface drifters Richardson (2005) followed the trajectories of these
drifters to analyze and describe the mean currents and eddies in the Caribbean Sea, he
also describes anticyclones moving near the southeastern corner of the Caribbean
westward up to the Jamaica Ridge near 80ºW. This eddy had a diameter of 167 km and
moved westward at 11 cm/sec. The fastest swirl velocities measured in this area were
around 70 cm/sec at a diameter of 200 km. Differently cyclonic eddies are suggested to
be often formed by current flows through the Antilles passages, rather than being caused
by instabilities of the North Brazil Current rings. Richardson (2005) established that
some of these eddies can be formed from the cyclonic shear on the southern side of the
main Caribbean Current where it flows along the boundary along the Venezuelan Basin.
Canals-Silander (2005) describes one formed by entering through the Anegada Passage in
the eastern Caribbean, in other occasion he describes a cyclone that as suggested by
Cherubin and Richardson (2007) forms by cyclonic shear when an anticyclonic eddy
develops while entering the Caribbean through the Lesser Antilles. Satellite imagery
revealed that this eddy later advected the Orinoco River Plume (Corredor et. al., 2004)
giving clues of the role played by these events in the biogeochemical structure of the
Eastern Caribbean surface waters.
The intensification of the Caribbean current has been demonstrated to be
associated to the Orinoco River Plume (Hernandez-Guerra and Joyce, 2000; Cherubin
and Richardson, 2007). The arrival of freshwater coinciding with an increase of the sea
4
surface temperature (Ffield, 2005) and the combination of relative low salinity and warm
temperatures contributes to a sharpening of the density front which intensifies the
Caribbean current at 14° N. This intensification of the current is followed by an increase
of the presence of anticyclones south of Puerto Rico and Hispaniola (Baums et al., 2006),
as expected by the role of the current in the formation of this events.
Dust storms frequently affect the Caribbean region. Along with them arrive
nitrogen, phosphorus and iron amongst other nutrients that perhaps act as a fertilizer to
stimulate the production in the region affecting the structure of Caribbean plankton
communities. Recent calculations suggest that the total deposition of aeolian iron to the
global ocean ranges from 0.5 to 4 x 10¹² g yr-1, with the distribution varying strongly with
season and from one ocean region to another (Gao et al., 2001). Latest models of aeolian
iron transport suggest a direct positive relation between iron flux deposition and
chlorophyll concentrations at the sea surface ( Hernandez et al., 2001). These patterns
show seasonal cycles with greatest iron deposition and chlorophyll maxima occurring
from July to September in the eastern Caribbean and Atlantic Ocean. Zhu et al.(1997)
noted during monitoring studies of mineral aerosols carried by trade winds in Barbados,
that Fe constituted on average 3.4% of the mineral dust mass. The impact of aeolian Fe
on the productivity of surface waters was observed in Mediterranean oligotrophic waters
on the chlorophyll concentrations. Carbon fixation by a water column is proportional to
its integrated Chl-a content, which varies approximately as the square root of surface Chl-
a of surface waters. The presence of aeolian Fe lead to over estimates by a factor of two
which in turns leads to an over estimate of 40% of carbon fixation (Claustre et al., 2002).
In order for these algorithms to estimate water column chlorophyll concentration they
consider the concentration to be proportional to its integrated content, which varies
approximately as the square root of surface, therefore an increase in surface chlorophyll
due to aeolian Fe over estimate the entire column estimate.
The events described above are important factors shaping the structure of
Caribbean water masses. Therefore to better understand the biological, physical, and
chemical structure of the Caribbean water masses, wider spatial and temporal
measurements are needed. The study of structure of Eastern Caribbean water masses has
relied mainly on studies done by taking discrete samples at several stations through the

5
area. None of these studies has addressed the possible relationship of the events
described above and their impact on the biological spatial structure of these waters using
data gathered continuously through transects. The use of towed profiling vehicles
provides the means to effectively measure oceanic water mass properties at higher spatial
scales. These vehicles and the growing use of active fluorescence techniques such as the
fast repetition-rate fluorometer (FRRF) extend the range of the scales at which
phototrophic plankton physiology can be observed in situ (Kolber et al., 1990; Behrenfeld
et al., 1996; Suggettet al., 2001). This combination of a towed profiling vehicle and a
FRRF proved to be successful during the IRONEX 2 cruise in the Equatorial Pacific
south of the Galapagos Islands, where the first ever deployment of a fast repetition rate
fluorimeter (FRRF) in an Nv-shuttle (towed profiling vehicle) was featured (Martin et al.,
1994), and Southern Ocean Iron Release Experiment (SOIRE) in the polar waters of the
Australasian Pacific sector of the Southern Ocean (Boyd and Abraham, 2001). In both
experiments this assemblage enabled measurements of photosynthetic parameters through
the surface, iron-fertilized layer, down to the deep chlorophyll maximum at 70-80m,
proving the potential that spatial distribution studies posses in quantifying rapid changes
in productivity in response to environmental changes at the ecologically important scales
of fronts and other mesoscale phenomena (Sharples et al.,2001).
In the Caribbean area, daily integrated variations of phototrophic plankton
productivity have been made based on natural fluorescence and radiolabelled carbon
uptake methods using discretely gathered samples at several stations (Alfonso-Sosa,
2000). These approaches are useful when determining the structure of water masses of
local waters caused by the Orinoco River and Amazon River combined with specific
astronomical conditions that facilitates the generation of internal tides (Alfonso et al.,
2004). Recently basic models of primary productivity derived from fast repetition rate
fluorometry have been used to estimate carbon fixation, suggesting in some cases a 1:1
relationship with 14C studies ( Kolber and Falkowski, 1993; Suggett et al., 2001)
The fast repetition rate fluorometer (FRRF) provides measurements of the
progressive closure of photosystem II (PSII) reaction centers (Sakshaug et al., 1997) in
response to flashes of excitation energy and is a technological development from the
earlier pump and probe (PP) technique (e.g., Kolber et al., 1998). Both methods are based

6
on similar principles. However, the FRRF is a more flexible instrument which gives
relatively instantaneous measurements of certain physiological parameters, thus
shortening the overall protocol (Sakshaug et al., 1997). It provides measurements of the
functional absorption cross section of PSII, which is a measure of the efficiency of
energy transfer from the antennae pigments to the photosystem II reaction center,
therefore the ability to promote a photochemical reaction (Falkowski and Raven, 1994).
The normalized variable fluorescence measured with FRR fluorometry is used as a
function of the functional reaction centers and it has been spatially correlated with
nutrients distribution, indicating a close coupling between them and photosynthetic
viability and growth rate of phytoplankton (Vaillancourt et al., 2003). In addition, the
FRRF provides a better signal-to noise ratio and allows more robust measurements in low
chlorophyll regions. The FRRF has the potential to provide more rapid and accurate
measurements of productivity by allowing the coupling of phototrophic plankton
productivity to physical forcing to be examined on the scales of transient phenomena
such as mesoscale events.
Phototrophic plankton fluorescence is the emission by chlorophyll-a of the energy
absorbed by the photosynthetic pigments that the plant failed to use in photosynthesis.
When the reaction centers in the thylacoid membrane of the chloroplast are open, the
photon energy can be trapped and passed to a quinone acceptor (Qa) that ultimately
transfers this energy and is used to drive photochemistry providing the chemical energy
(in the form of ATP and NADPH) for CO2 fixation in the Calvin cycle. PSII extracts
electrons from water releasing oxygen in the process. If Qa is already used by a previous
excitation (considered to be closed) and cannot accept new electrons, the probability that
the absorbed energy will be fluoresced increases. Because some energy is lost in this
process the fluorescent light has a longer wavelength (it is redder). The intensity of the
light emitted as fluorescence depends on how much energy was absorbed and how fast it
can be passed through the photosynthetic system. The quantum efficiency of
photosynthesis varies inversely to the quantum efficiency of fluorescence (Falkowski and
Kolber, 1995). Therefore the primary use of fluorescence has been for the estimation of
chlorophyll concentration and recent research has focused on the use of sun-stimulated
fluorescence to estimate primary productivity (Morrison, 2003; Abbott et al., 1995), and

7
on actively induce methods such as pump and probe and fast repetition rate fluorescence
fluorometry (Kolber et al., 1998; Vaillancourt et al., 2003). Based on this principle,
remotely sensed acquired data of primary production has also been used recently to study
large scale water masses and mesoscale events (Moore et al., 2002; Vaillancourt et al.,
2003; Maritorena et al., 2000). Consequently, the use of airborne and satellite
hyperspectral remote sensors such as NASA’s Moderate Resolution Imaging
Spectroradiometer (MODIS) capable of resolving fluorescence peaks, measurements of
chlorophyll concentration and the derivation of primary productivity are possible (Dey
and Singh, 2003; Beherenfeld and Falkowski, 1997).
The main purpose of this study is to investigate the spatial distribution of
photosynthetic efficiency, and subsequently gross primary production as the phototrophic
plankton communities are affected by mesoscale events that influence the three-
dimensional structure of the water masses through the Eastern Caribbean region. It is
hypothesized that the events described above deviate the eastern Caribbean surface
waters from typically tropical oligotrophic waters to ones with phototrophic plankton
communities rather more efficient in photosynthesis due to mesosocale forcing. In order
to reach these goals the following objectives were proposed:
• Describe the spatial distribution and dynamics of phototrophic plankton
photosynthetic efficiency through the northeastern Caribbean Sea.
• Determine the photosynthetic parameters derived from fast repetition rate fluorometry and its relationship traditional methods such as 14C assimilation and derived production from natural fluorescence of phototrophic plankton.
And
• Compare remotely sensed derived primary production estimates to the modeled from data acquired in situ.

8
Figure 1.1 Map of the Caribbean Sea and of the nearby tropical Atlantic showing the Amazon and Orinoco Rivers (from Cherubin and Richardson, 2007)

9
CHAPTER 2
Fast Repetition Rate Fluorometry and optical indices of phototrophic plankton photosynthetic potential at Eastern Caribbean Mesoscale
Processes 2.1 Abstract
The role of Caribbean mesoscale processes as agents enhancing the photosynthetic
potential of phototrophic plankton populations was addressed in this study. Mesoscale (100-
400 km) cyclonic and anti-cyclonic eddies and the massive freshwaters plumes from the
Orinoco River are common features in the Caribbean Sea. These Caribbean eddies
result from vorticity advected through passages into the Caribbean area as inferred from
satellite Sea surface height Anomaly (SSHA). The Caribbean Vorticity Experiments
(CaVortEx II and VI) undertaken from June 22-27, 2004 and August 28, 2006 to
September 8, 2006 were intended to characterize the physical, biogeochemical, and
optical structure of the eddies and to assess their influence on biological productivity of
the Eastern Caribbean Region. The physiological state of phototrophic plankton was
addressed using fast repetition rate fluorometry (FRRF) and the acquired photosynthetic
efficiency (Fv/Fm) parameter. This parameter measures the changes in phototrophic
plankton physiology by a rapid, noninvasive assessment of in vivo fluorescence
signatures. FRRF measurements showed that photosynthetic efficiency varied vertically
in areas of upward pycnocline displacement. This displacement suggests that nutrient
upwelling is responsible for the higher photosynthetic efficiency observed between the
surface to 90 meters. Another optical variable considered in the study and previously
linked to phototrophic plankton physiological state is the beam attenuation to chlorophyll
ratio (cp *). Enhanced Fv/Fm observed as a result of the baroclinic instabilities created
by eddies denoted an inverse correlation with cp* at cyclonic regions, for other regions
the parameters were directly correlated. This result suggests that the baroclinic
instabilities promote influx of material from depth with a lower cp* ratio that enhance the
photosynthetic potential of the cells possibly due to higher concentration of refractive
materials.

10
The expeditions ORIPEX 7 and 8 cruises were carried out during November 19-
24, 2005 and September 18-23, 2006, respectively, to analyze effects of the Orinoco
River on the biogeochemical properties of the Eastern Caribbean Sea. The influence of
the Orinoco River front on the photosynthetic potential of the eastern Caribbean
phototrophic plankton populations demonstrated increased Fv/Fm close to surface
decreasing with depth suggests a relation with river originated material. This increase in
Fv/Fm coincided with a shift upward of the deep chlorophyll maxima.

11
2.2 Introduction
Fast repetition rate fluorometry provides rapid, noninvasive assessment of
phototrophic plankton in vivo fluorescence signatures and increased sampling resolution
of phototrophic plankton physiological state when undergoing environmental adaptations
to dynamical biogeochemical processes influenced by physical forcing. (Moore et al.,
2003; Vaillancourt et al., 2003; Falkowski et al., 1991) Fast repetition rate fluormetry
provides the user with photosynthetic parameters including Fv/Fm, σPSII, τQa, and p
(Kolber et al., 1998). It is based on the principle that when dark-adapted phototrophic
plankton cells are illuminated, all of the functional reaction centers are “open” and ready
to receive an exciton, thus their fluorescence yield is low (Fo) since maximal excitation
energy can be efficiently used for photosynthesis. When a given reaction center has
received an exciton, it is closed consequently associated fluorescence yield increases.
When all the reaction centers are closed (or non-functional), the observed fluorescence is
maximal (Fm). For a phototrophic plankton cell in which all the reaction centers are
functional, the maximum change in fluorescence yield is about 3-fold, while a cell with
no functional reaction centers shows no change in florescence since its fluorescence yield
is high from the beginning of the measurement. Variable fluorescence (Fv = Fm - Fo),
when normalized to Fm, is thus an indicator of the proportion of photosystem II (PS2)
reaction centers that are functional; Fv/Fm has been empirically determined to be about
0.65 for cultures of phototrophic plankton growing under optimal conditions (e.g.,
Kolber et al., 1988). ). The absorption cross section of PSII (σPSII) changes in response to
cellular pigment concentrations and the efficiency of energy transfer from pigments to
PSII reaction centers, thus making it subject to both nutrient and light availability (Kolber
et al., 1988; Moore et al., 2006). σPSII is typically lower in nutrient replete cells relative to
unhealthy cells (Kolber et al., 1988).
In recent years the FRRF technique has proven to be invaluable tool when the
close to real time assessment of phototrophic plankton physiological state is needed.
During experiments of iron as a limiting micronutrient the fast repetition rate fluorometer
helped to address the changes in the photosynthetic potential of cells in hours after the

12
waters were enriched with Iron (Boyd and Abraham, 2001; Boyd, 2002). Iron limitation
has been shown to cause structural changes in PS2 reaction centers, becoming non
functional and slow in the photosynthetic electron transport rate ( Falkowski et al., 1992,
Falkowski and kolber, 1995). In these experiments, areas of the Pacific southern ocean,
described as waters of high nutrient and low chlorophyll, the addition of iron increased
the photosynthetic potential , ultimately increasing the biological production of the zone
(Olson et al., 2000;Suggett et al., 2001; Sosik and Olson, 2002).
When an assessment in short time scales is needed the FRRF has been used
successfully to monitor the enhancement of phototrophic plankton biomass or new
production (the biological production associated with the rate at which new nutrients are
incorporated into the euphotic zone) as it occur when the area under study is subject to a
mesoscale event (fronts, eddies and river plumes). Events such as the new production
may result from the addition of growth limiting nutrients to the euphotic zone when the
passage of a mesoscale cyclonic eddy raises the isopycnals (Falkowski et al., 1991;
Vaillancourt et al., 2003). Eddies influence biogeochemical processes by enhancing
horizontal advection and lateral stirring of water masses, with the lifting of isopycnals
surfaces that enables vertical transport by isoppycnal mixing, and the uplifting of
nutrient-rich isopycnal surfaces into the euphotic zone. This zone is typically dominated
by photosynthetic bacteria and micro algae, both of high surface to volume ratios, with
increased efficiency of nutrient uptake and light harvesting (Andersen et al., 1996).
The uplifting of the isopycnals reveals a footprint at the ocean surface that can be
perceived from satellite observations. Sea surface height observations provided by
satellites are often used to detect the presence of these features (Siegel et al., 1999). In a
cyclonic eddy the water column is denser than normal, which result in a lower than
average sea level height or a negative sea level anomaly (SLA). Anticyclonic eddies high
SLA will depress isopycnals out of the euphotic zone, transporting nutrient depleted
waters downward. Satellite remotely sensed ocean color data also is a valuable tool when
tracking these events, the input of colder water from depth into surface waters can be
observed by using sea surface temperature (SST), obtained from (for instance) the
Geostationary Operational Environmental Satellite (GOES) (Vaillancourt et al., 2003)
and the Moderate Resolution Imaging Spectroradiometer (MODIS) (Benitez-Nelson et

13
al., 2007). Eddies create divergence and convergence zones when they collide with
adjacent eddies that may cause upwelling and down-welling zones, promoting biological
production that could also enhance biomass accumulation at depth in the down-welling
portion (Lima et al., 2002).
Recent studies have addressed the relationship of inherent optical properties and
biogeochemical variables on phototrophic plankton physiology , biomass, size
distribution and refraction indices ( Behrenfeld and Boss, 2003 and 206; Boss et. al.,
2007, ) . Some researchers specifically have addressed the relationship of beam
attenuation and chlorophyll concentration as alternative optical indices of phototrophic
plankton physiology and biomass. Beam attenuation at 660nm is a measure of light
scattering by suspended particles and since attenuation by dissolved material is
negligible at this wavelength, when the pure water contribution is subtracted, the
remaining variability is then termed particulate beam attenuation coefficient (cp).
Because particles in the 0.5 and 20 μm size class dominate cp in the open ocean type size
distributions, this range includes the lower portion and the dominant component of the
phototrophic plankton domain leading to a direct dependence of cp on phototrophic
plankton biomass (Boss et al, 2001;Beherenfeld and Boss, 2006). This is true in the
absence of significant changes in inorganic, detrital and heterotrophic particles.
Behrenfeld and Boss (2003) results suggest that cp may provide a better estimate of algal
carbon biomass than chlorophyll concentration in Case I waters and when cp is
normalized to chlorophyll concentration it highly correlates with independent
measurements of phototrophic plankton physiology (Ek and Pb opt), providing a proxy of
spatiotemporal variability of cellular chlorophyll, incident light and growth rate.
Consequently the study of the dynamics of eddies in the eastern Caribbean region
(Figure 2.1) may provide an insight of these optical indices and phototrophic plankton
photosynthetic efficiency as it varies with eddy pumping potential of materials to the
ocean surface.
In this study the roll of Caribbean mesoscale processes as agents enhancing the
photosynthetic potential of phototrophic plankton populations is addressed. To date few,
if any, studies have attempted to comprehensively study the potential for Caribbean

14
eddies and the Orinoco River Plume to influence surface waters productivity at the spatial
resolution provided by the FRRF and other optical sensors used during this study.

15
-75 -73 -71 -69 -67 -65 -63 -61 -59
Longitude
10
12
14
16
18
20
Latit
ude
Figure 2.1. Map of the Eastern Caribbean Region sampled during ORIPEX and
Cavortex expeditions..

16
2.2 Methodology
2.2.1 Field Work Data was collected during four oceanographic cruises as part of the scientific
expeditions of the Caribbean Vorticity Experiment (Cavortex) and the Orinoco river
plume experiment (Oripex) on board the UPRM R/V Chapman and the LUMCON R/V
Pelican. The Caribbean Vorticity Experiment (Cavortex II and VI) undertaken from
June 22-27, 2004 and August 28, 2006 to September 8, 2006 respectively, were intended
to characterize the physical, biogeochemical, and optical structure of the eddies and to
assess their influence on biological productivity of the Eastern Caribbean Region.
ORIPEX 7 and 8 cruises were carried out during November 19-24, 2005 and September
18-23, 2006, respectively, to analyze effects of the Orinoco River on the biogeochemical
properties of the Eastern Caribbean Sea.
In order to identify, localize and to determine the trajectory of the eddies satellite
acquired altimetry was used. JASON-1 Sea Surface Height Anomaly (J1SSHA) Product
dataset, which is produced by Ssalto/Duacs and distributed by Aviso, with support from
CNES were used. The use of ocean color products in the region was limited due to the
high frequency of clouds, because the expeditions were performed during the period of
influence of the Intertropical Convergence Zone (ITCZ).
In situ measurements were collected with a towed profiling vehicle (Nv-Shuttle)
manufactured by Chelsea Instruments Ltd, this maximized the spatial resolution and
efficiency of the sampling. This vehicle is fitted with a Fast Repetition Rate Fluorimeter
(FRRF) to measure the physiological state of phototrophic plankton, MINIpack (with a
CTD-F and 24 channel integrated data logger capable of real time data acquisition), and a
photosynthetically available radiation (PAR) irradiance meter. The Nv-Shuttle was
operated with continuous oscillations from surface to a maximum of 90 meters when
possible. Diffuse attenuation coefficients were calculated over the depth of the euphotic
zone according to Kd = ln[E (0-)/E(Z1%)] /Z. The depth interval was chosen to extend
from near the surface (Z = 0- , i.e., ca 5 m) to the bottom of the euphotic zone
(Z=1%E(0)). The euphotic zone was defined as the depth at which irradiance is

17
diminished to 1% of the surface values, equivalent to an optical depth (ξ= Kd Z ) of 4.6
(Kirk, 1994).
2.2.2 Variable Fluorescence
Variable fluorescence (Fv = Fm – Fo), photosynthetic efficiency (Fv/Fm, unit
less), and functional absorption cross-section at photosystem II (σPSII, units Ǻ2 quantum -
1) were logged to an internal flash card in the FRRF and downloaded to a PC after each
transect. The FRRF measures these parameters for seawater that is exposed to ambient
irradiance, and also simultaneously on seawater passed through a ‘dark chamber’ placed
in front of one of the photomultiplier tubes (PMT) window. Only the dark adapted data
was analyzed, and most of the data presented in the analysis was gathered at night except
when only day transects where possible. Data gathered during the day in the top 20
meters were considered unusable owing to saturation of the PMT from high surface
irradiances and were removed. The instrument flash protocol was set for 100 saturation
flashes per sequence with a saturating flash duration of 1.10 μs and an interflash delay of
51.6 μs. This was followed by 20 decay flashes each of 1.10 μs duration with an
interflash delay of 51.6 μs. The raw data was processed using Chelsea’s FRS processing
software. Depth was provided by an internally logging, calibrated pressure sensor of the
MINIpack throughout Nv-Shuttle deployments. During some of the stations occupied the
FRRF was mounted on a rossete sampler with an adjacent SeaBird SBE 19 SEACAT
CTD profiler. CTD data was then processed, filtered, binned, and parameters derived
using the SeaBird Data Processing software version 7.16a. Discrete depth water samples
were also collected on all surveys using Niskin bottles mounted on the rosette sampler
during upcasts. These water samples were processed for phototrophic plankton specific
absorption data, chlorophyll-a, and nutrients. Concentration of chlorophyll-a was
obtained from samples filtered through 0.7 µm glass fiber filters (Whatman GF/F) using
the standard fluorometric method (Yentsch and Menzel, 1963) measured in a Turner AU-
10 Fluorometer.

18
2.2.3 Bio-optical data
Chlorophyll-specific absorption coefficient of phototrophic plankton
Particulate absorption samples were collected on 0.7 µm GF/F filters and the
absorption of the total particulate ap(λ) (relative to a blank filter saturated with distilled
water) was measured with Perkin Elmer Lambda 18 UV/VIS Spectrometer fitted with an
integrating sphere. Methanol extractable pigments were removed by slowly passing hot
methanol through the filter pad (Roesler et al., 1989). The absorption spectrum of this
pad was measured to determine the detritus absorption coefficient, ad(λ). Optical density
measurements were divided by the geometrical path length (volume filtered divided by
clearance area of the filter) and multiplied by a factor of 2.3 (conversion factor for
transforming decimal logarithm to natural logarithm) to obtain the absorption coefficient.
The value of the absorption coefficient at 750 nm was subtracted from the values at all
other wavelengths, as a rudimentary correction for errors arising from cell scattering. The
measurements were corrected for path-length amplification, β factor, using the method of
Bricaud and Stramski (1990). The difference between the particulate and detritus spectra,
before and after the methanol extraction, is considered the in vivo phototrophic plankton
absorption, aph(λ). The pigment specific absorption coefficient aph*(λ) was calculated by
dividing absorption by the chlorophyll-a concentration obtained fluorometrically.
Bio-optical Rossette
The bio-optical rosette package deployed, include a ac-9 attenuation and
absorption meter, Hydroscat-6 backscatter meter and a SeaBird SBE 19 SEACAT CTD.
The ac-9 is designed to measure absorption, a, and beam attenuation, c, in 9 spectral
bands (412, 440, 488, 510, 532, 555, 650, 676, and 715). Temperature and salinity along
with scattering corrections were performed to the ac-9 data according to Pegau et al.
(2001). Beam attenuation at 660 nanometers (nm) was measured by interpolation of ac-9
attenuation measurements at 650 nm and 676 nm. Hydroscat-6 measures volume
scattering function at six spectral bands (442, 470, 510,589, 620, and 671) at a nominal
19
angle of 140 ° , β (140°) and backscatter bb is estimated assuming a constant proportional
between β (140°) and bb [=2π (1.08) β (140°)] (Maffione and Dana, 1997).
The particle size distribution (PSD) slope was addressed for Cavortex 6 and 4
data by fitting a hyperbolic function to the particulate attenuation spectrum (Boss et al.,
2001; Twardowski et al. 2001), this method provides an estimate of the spatial changes in
the mean particle size. A factor of 3 was added to the slope, since, according to Boss et
al. (2001) the attenuation spectral slope (γ) is related to the PSD slope (ξ) by ξ= γ + 3, in
oceanic observations.
2.2.4 Flow cytometry during Cavortex 6
Flow cytometry analysis was performed on picoplankton samples gathered during
the Cavortex 6 expedition. The samples were preserved and stored at -80 °C until
analysis at the Flow Cytometry Facility , Department of Oceanography, Texas A&M
University. Prochlorococcus, Synechococcus and pico-eucaryotic algal populations were
then quantified using a Becton Dickinson FACSCalibur flow cytometer equipped with a
488 nm, 15 mW argon laser (Campbell, 2001).

20
2.4 Results
2.4.1 Variable Fluorescence during the Cavortex campaign
Variable fluorescence parameters (Fv/Fm and σPSII) across various mesoscale
eddies was considered according to possible provinces (inside the cyclonic eddy, eddy
edge, and anti-cyclonic eddy). Determined as areas within the observed satellite
altimetry (Jason sea surface anomalies). For instance, the samples used for the analysis
were consider to be in a cyclonic region when positioned at the lowest observed sea
surface anomaly, and the opposite for the anticyclonic portion (e.g. Figure 2.2). Figure
2.2 shows the provinces determined during the Cavortex 6 analysis. During Cavortex 2
one transect was sampled extending from a cyclonic region to an anticyclonic region
(Figure 2.3). For Cavortex 4 only data of the edge of the eddy was sampled with the
FRRF therefore it is not analyzed in this section (Figure 2.4).

21
-28-26-24-22-20-18-16-14-12-10-8-6-4-202468101214
-75 -73 -71 -69 -67 -65
Longitude
Cavortex 6
10
12
14
16
18
Latit
ude
Samples:
Transect Sept 5c
Transect Aug, 31Transect Sept 4a
Transect Sept 5bTransect Sept 1a
cm
ST4 ST10 ST11ST12
ST13
ST14
ST2
ST1
ST16
ST17
ST18
ST20ST19
ST15ST21
ST22 ST23ST9
ST8ST7
ST6ST5
ST3
Figure 2.2 Sampled stations and transect during Cavortex 6 over Jason sea surface
anomaly obtained from AVISO live access server (LAS). These altimeter products were produced by Ssalto/Duacs and distributed by Aviso, with support from Cnes.

22
-75 -73 -71 -69 -67 -65 -63 -61 -59 -57 -55Longitude
Cavortex 2
10
12
14
16
18
20
Latit
ude
-24-22-20-18-16-14-12-10-8-6-4-2024681012141618
ST1 ST3
ST2ST5
ST4ST6
ST7
Figure 2.3. Sampled stations and transect during Cavortex 2 over Jason sea surface
anomaly obtained from AVISO live access server (LAS). These altimeter products
were produced by Ssalto/Duacs and distributed by Aviso, with support from Cnes.

23
-80 -78 -76 -74 -72 -70 -68 -66Longitude
12131415161718
Latit
ude
-32-30-28-26-24-22-20-18-16-14-12-10-8-6-4-2024681012141618
Cavortex 4
ST8
ST9
ST7ST6
ST5ST4
ST3ST2
ST10
ST1
FRRF Sampled Transect
cm
Figure 2.4. Sampled stations and transect during Cavortex 4 over Jason sea surface
anomaly obtained from AVISO live access server (LAS). These altimeter products
were produced by Ssalto/Duacs and distributed by Aviso, with support from Cnes.
24
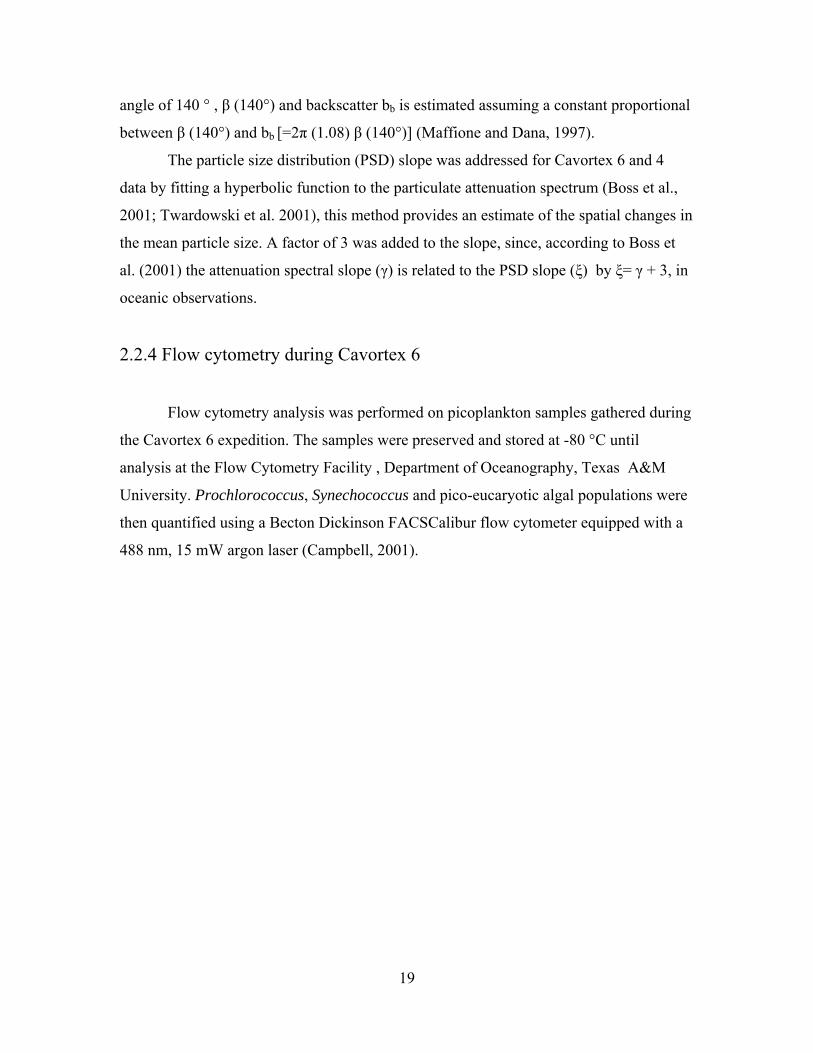
Cavortex 6
The eddy edge of Cavortex 6 cyclonic eddy was sampled from east to west during
the transect of August 31, and on September 5 (transect September 5b) from south to
north (Figure 2. 2). During the transect of August 31, depressed Fv/Fm was apparent as a
result from distinctive afternoon photo saturation of the photosystem II (photoinhibition)
(Figure 2.5). According to Beherenfeld (et al., 1998) the diurnal pattern in variable
fluorescence is a feedback interaction between changes in light intensity and PSII repair,
specifically repair of photodamaged reaction centers through turnover of D1 proteins,
inhibited when photosynthetic electron transport is saturated and stimulated when
subsaturated (Gong and Ohad, 1991; Prasil et al., 1992). Nevertheless it can be observed
that the effect was not enough to draw down the Fv/Fm to values below 0.30 (no units) as
expected. The observed Fv/Fm during the afternoon ranged between to 0.30 and 0.37 (for
the whole water column). Later into the night the Fv/Fm rose to values from 0.37 to 0.45
at surface, with increase in the value through the entire water column indicating a
prevalence of higher photosynthetic potential through the water column. Evidence of a
fast recovery of the photo-damaged centers is shown in Figure 2.5.
Figure 2.5 Photosaturation of photosystem II appeared depressed Fv/Fm values during late afternoon sampling but subsequent nighttime recovery denotes capacity for rapid photosytem repair during Cavortex 6 transect of august 31. Fv/Fm in red and PAR in black.
02:24 PM 04:48 PM 07:12 PM 09:36 PM 12:00 AM
0
50
100
150
200
250
300
PAR
(PA
R u
Eins
tein
s-1
m-1
)
Time (hr)
Fv/F
m
0.2
0.3
0.4
0.5
0.6

25
-71.2 -71 -70.8 -70.6 -70.4 -70.2
Longitude
Temperature
-90
-80
-70
-60
-50
-40
-30
-20
Dep
th (m
)
25
25.4
25.8
26.2
26.6
27
27.4
27.8
28.2
28.6
29
°C
Considering the observed diurnal pattern on the Fv/Fm, only night sampled data was
subsequently used for comparisons between provinces.
Surface Fv/Fm for this province ranged from 0.28 to 0.46 while in the deep
portion Fv/Fm ranged from 0.31 to 0.53 (Table 2.1). The deep portion was considered to
be from the 10 % of surface light around 60 to 90 meters, the greatest depth reached by
the Nv-Shuttle during the sampled transects. Surface was considered to be from 20 meters
to the 10% of surface light.
Upwelling of cold water towards the surface appears to be the result of eddy edge
shear against an anticyclone neighbor figure 2.6. When the samples were analyzed
against transect isotherms, the coldest water temperature range was observed from 25.4 to
26.4 ° C (Table 2.2 and Figure 2.7) and showed an Fv/Fm that ranged from 0.29 to 0.53.
The intermediate temperature range was considered to be from 26.8 to 28.2 ° C and
Fv/Fm ranged from 0.34 to 0.53. Surface isotherms from 28.2 and up showed values from
0.30 to 0.52, suggesting the flow of material to surface as a result of the eddy-eddy
interaction.
Figure 2.6. Temperature isotherms at cyclonic eddy edge during transect of August 31 during Cavortex 6 .
The center of the cyclonic eddy was sampled during the transect of September 5
through 8, 2006. The transect of September 5c started during the afternoon in a zonal

26
transect across the eddy. Temperature and salinity contour maps of the cyclonic eddy
zone illustrate the upwelling of saltier colder water (Figure 2.8).
During the afternoon sampling the observed Fv/Fm showed depressed values
(ranged from 0.28 to 0.40) due to light saturation of photosystem II, through the whole
water column to the maximum sampled depth of 90 meters. These portions were analyzed
against isotherm and Fv/Fm ranged from 0.40 to 0.51 at the coldest observed water mass
25.4 to 26.4 ° C. The intermediate temperatures ranges (26.8 to 28.2 ° C) showed Fv/Fm
that ranged from 0.34 to 0.51, and at surface (above 28.2 ° C) ranged from 0.22 to 0.47.
The incursion of cold water from depth reached up to 65 meters in some portions
of the eddy center (Figure 2.6) a negative relationship was observed when Fv/Fm against
temperature was analyzed (Figure 2.9), denoting increase in Fv/Fm with colder
Figure 2.7. Phototrophic plankton photosynthetic efficiency per temperature ranges (Temperature Ranges 1 (25.4 – 26.4 ˚C ) 2 (26.8 – 28.2 ˚C) 3 (28.2 – 29˚C)) through the sampled areas during Cavortex 6. (Example 5c1 corresponds to sample September 5c at temperature range 1).
0.0
0.1
0.2
0.3
0.4
0.5
0.6
FvFm
Samples
5c1 5c2 5c3 311 312 313 4a1 4a2 4a3 5b2 5b3 1b1 1b2 1b3
27
Table 2.1. Phototrophic plankton Photosynthetic efficiency through the Cavortex 6 sampled regions analyzed at surface and depth
Sampled Transect Mean Standard
Deviation Standard
Error
Lower Confidence
Interval of the Mean
Upper Confidence
Interval of the Mean
Median Variance Number of Points
Sept5c-Deep 0.45 0.067 0.001 0.45 0.46 0.47 0.004 2071 Sept5c-Surf 0.32 0.105 0.004 0.32 0.34 0.35 0.011 592 AUG31-Deep 0.43 0.047 0.001 0.44 0.44 0.44 0.002 1599 AUG31-Surf 0.38 0.037 0.002 0.38 0.38 0.38 0.001 350 Sept5b-Deep 0.40 0.069 0.001 0.39 0.40 0.40 0.005 2825 Sept5b-Surf 0.31 0.083 0.003 0.31 0.32 0.32 0.007 669 sept1-Surf 0.34 0.017 0.002 0.34 0.34 0.34 0.000 108 sept1-Deep 0.39 0.023 0.002 0.39 0.40 0.39 0.001 159 Sept4a-Surf 0.29 0.045 0.001 0.29 0.30 0.28 0.002 950 sept4a-Deep 0.36 0.036 0.001 0.36 0.36 0.37 0.001 1143
* surface was consider to be from 20 meters to the 10% of surface light and deep portion was considered to be from the 10 % of surface light around 60 m to 90 meters
the deepest the Nv-Shuttle dived during the sampled transects.

28
Table 2.2. Phototrophic plankton Photosynthetic efficiency through the Cavortex 6 sampled regions analyzed against isothermal temperature ranges
Sampled Transect Mean Standard
Deviation Standard
Error
Lower Confidence
Interval of the Mean
Upper Confidence
Interval of the Mean
Minimum Value
Maximum Value Median Variance
Variation
Coefficient N
Sept 5c_1* 0.50 0.02 0.001 0.50 0.50 0.41 0.54 0.51 0.001 4.00 278
Sept 5c_2 0.46 0.02 0.001 0.46 0.47 0.34 0.51 0.47 0.001 4.35 394
Sept 5c_3 0.33 0.05 0.001 0.33 0.34 0.23 0.47 0.33 0.003 15.15 1276
Aug 31_1 0.42 0.05 0.001 0.43 0.43 0.29 0.53 0.43 0.003 11.90 1952
Aug 31_2 0.46 0.03 0.003 0.46 0.47 0.34 0.53 0.47 0.002 6.52 139
Aug 31_3 0.44 0.04 0.001 0.44 0.45 0.30 0.53 0.44 0.002 9.09 699
Sept 4a_1 0.43 0.08 0.023 0.39 0.49 0.19 0.55 0.45 0.008 18.60 14
Sept 4a_2 0.45 0.05 0.003 0.45 0.46 0.25 0.63 0.46 0.003 11.11 288
Sept 4a_3 0.37 0.07 0.004 0.37 0.39 0.04 0.52 0.39 0.005 18.92 335
Sept 5b_2 0.34 0.08 0.002 0.34 0.35 0.03 0.51 0.37 0.007 23.53 1155
Sept 5b_3 0.34 0.08 0.002 0.34 0.35 0.03 0.51 0.37 0.007 23.53 1155
Sept 7_1 0.50 0.01 0.002 0.50 0.51 0.46 0.53 0.50 0.000 2.00 74
Sept 7_2 0.46 0.02 0.002 0.46 0.47 0.41 0.51 0.47 0.001 4.35 69
Sept 7_3 0.42 0.02 0.002 0.42 0.43 0.34 0.49 0.43 0.001 4.76 120
Sept 1b_1 0.27 0.06 0.014 0.24 0.30 0.20 0.38 0.26 0.004 22.22 19
Sept 1b_2 0.37 0.05 0.002 0.37 0.38 0.25 0.52 0.35 0.003 13.51 416
Sept 1b_3 0.35 0.04 0.002 0.35 0.36 0.20 0.50 0.34 0.002 11.43 501
Legend: *Temperature Ranges 1 25.4 – 26.4 2 26.8 – 28.2 3 28.2 - 29

29
-71.2 -71 -70.8 -70.6 -70.4 -70.2Longitude
Temperature
-90
-80
-70
-60
-50
-40
-30
-20D
epth
(m)
25.425.625.82626.226.426.626.82727.227.427.627.82828.228.428.628.829
°C
-71.2 -71 -70.8 -70.6 -70.4 -70.2Longitude
Salinity
-90
-80
-70
-60
-50
-40
-30
-20
Dep
th (m
)
33.233.333.433.533.633.733.833.93434.134.234.334.434.534.634.734.834.93535.135.235.335.435.5
(Pra
ctic
al u
nits
)
-71 -70.5 -70 -69.5Longitude
Chlorophyll
-90
-80
-70
-60
-50
-40
-30
-20
Dep
th (m
)
0.12
0.16
0.2
0.24
0.28
0.32
0.36
0.4
0.44
0.48
0.52
0.56
0.6
0.64
0.68
0.72
(ug/l)
-71.2 -71 -70.8 -70.6 -70.4 -70.2
Longitude
Chl-a Fluorescence
-90
-80
-70
-60
-50
-40
-30
-20
Dep
th (m
)
0
0.5
1
1.5
2
2.5
3
3.5
4
4.5
5
5.5
6
6.5
7
Figure 2.8 Sampled parameters at cyclonic eddy center during transect of September 5 during Cavortex 6.

30
water (at eddy center, between 60 and 90 meters) which suggest input of materials to the
euphotic zone of the cyclonic eddy. The contour plot in figure 2.10 demonstrates this
relationship between Fv/Fm and temperature. Fv/Fm was analyzed against Sigma -t at
stations 18 and 20 (Figure 2.11) and showed a high positive correlation between the
parameters (r= 0.97 and 0.86 respectively), indicating also higher photosynthetic
potential possibly due to advection of nutrients into the euphotic zone.
Figure 2.9. Temperature and photosynthetic efficiency relationship at eddy center (between 60 and 90 meters) during Cavortex 6. The correlation coefficient r was -0.80, n=764.
The σPSII varied inversely with Fv/Fm with higher correlation at the surface
temperature range (above 28.2 ° C) R = 0.8 (Figure 2.12); at the lowest temperature range
no apparent relationship was observed. The coldest temperature range showed σPSII
values that ranged between 319 to 614 (A2 / quanta) the intermediate range from 361 to
691 (A2 / quanta), and near-surface 165 to 947 (A2 / quanta) (Table 2.3).
0.25 0.30 0.35 0.40 0.45 0.5025.0
25.5
26.0
26.5
27.0
27.5
28.0
28.5
29.0
Tem
pera
ture
Fv/Fm

31
-71 -70.5 -70 -69.5Longitude
FvFm and Isotherms
-90
-80
-70
-60
-50
-40
-30
-20
Dep
th (m
)
0.18
0.2
0.22
0.24
0.26
0.28
0.3
0.32
0.34
0.36
0.38
0.4
0.42
0.44
0.46
Figure 2.10. Photosynthetic Efficiency and temperature isotherms at cyclonic eddy during
Cavortex 6 .
A single factor ANOVA province-specific analysis (including cyclonic,
anticyclonic eddy edge and waters outside the eddy influence) showed significant
differences between provinces (a= 0.05 P < 0.001) with a marked increase in the
photosynthetic potential for waters inside the cyclonic zone.
The September 1, 2006 transect over an anti cyclonic zone showed a decrease on
the Fv/Fm from values around 0.49 to 0.31. When the water temperature ranges were
examined for this area (Table 2.2) the deepest colder water regime demonstrated an
Fv/Fm that varied from 0.20 to 0.38 with a mean value of 0.27. The surface and
intermediate water temperature ranges showed values that ranged from 0.25 to 0.49. The
relationship of Fv/Fm and Sigma T in this area was also addressed for stations 11. This
relationship for station 11 and a portion of transect of September 1b showed lower
correlation (r= 0.52 and 0.75 respectively) (Figure 2.13). The σPSII at the coldest
temperature range showed values that ranged between 352 to 948(A2 / quanta), the

32
intermediate range was 388 to 882 (A2 / quanta) and near-surface 790 to 1240 (A2 /
quanta) (Table 2.3).
Figure 2.11. Phototrophic plankton photosynthetic efficiency against Sigma-t at cyclonic eddy center from 40 to 90 meters. The observed correlation coefficients for the station 18 and 20 was of 0.97 and 0.86 respectively.
0.36 0.38 0.40 0.42 0.44 0.46 0.48 0.50 0.52 0.54 0.56
22.6
22.8
23.0
23.2
23.4
23.6
23.8
24.0
24.2
24.4
24.6
Sigm
a T
Fv/Fm
St 20
0.42 0.44 0.46 0.48 0.50 0.52 0.54 0.56 0.58 0.60
22.6
22.8
23.0
23.2
23.4
23.6
23.8
24.0
Sigm
a T
Fv/Fm
St 18

33
Figure 2.12. Functional absorption cross-section correlation with photosynthetic efficiency at cyclonic eddy center during Cavortex 6. The observed correlation coefficient was r = -0.5.
On September 4, 2006 a portion of the transect was analyzed in an area that by
satellite altimetry showed no sea surface anomaly (Figure 2.2). For this portion of the
expedition mean surface Fv/Fm were around 0.38 at surface, and the deepest coldest
water range ( 25.4-26.4) showed a mean value of 0.44 ( Table 2.2 and Figure 2.7). The
σPSII at the coldest temperature range showed values that ranged between 425 to 700 (A2
/ quanta), the intermediate range was 370 to 700 (A2 / quanta) and at surface 1240 to 790
(A2 / quanta) (Table 2.3).
0.20 0.25 0.30 0.35 0.40 0.45 0.50 0.55400
450
500
550
600
Sigm
a PS
II (A
2 qu
anta
-1)
Fv/Fm

34
Figure 2.13. Phototrophic plankton photosynthetic efficiency against sigma-t at anti-cyclonic area from 40 to 90 meters. The observed correlation coefficients for the station 11 and transect Sept 1b was of 0.51 and 0.75 respectively.
0.34 0.35 0.36 0.37 0.38 0.3921.8
22.0
22.2
22.4
22.6
22.8
23.0
23.2
23.4
23.6
23.8
Sigm
a T
Fv/Fm
St 11
0.36 0.38 0.40 0.42 0.44 0.46 0.48 0.50
20.8
21.0
21.2
21.4
21.6
21.8
22.0
22.2
22.4
22.6
22.8
Sigm
a T
Fv/Fm
Transect sept 1b

35
Table 2.3. Phototrophic plankton photosynthetic functional absorption cross-section through the Cavortex 6 sampled regions analyzed against isothermal temperature ranges
Legend: *Temperature Ranges 1 25.4 – 26.4 2 26.8 – 28.2 3 28.2 - 29
Sampled Transect Mean Standard
Deviation Standard
Error
Lower Confidence Interval of the Mean
Upper Confidence Interval of the Mean
Minimum Value
Maximum Value Median Variance
Variation coefficient
N
Sept 5c_1* 481.47 50.77 4.42 472.72 490.21 319.21 614.29 472.84 2577.97 10.54 132 Sept 5c_2 465.16 41.13 2.07 461.08 469.23 361.43 691.12 462.06 1691.55 8.84 393 Sept 5c_3 483.80 100.76 2.30 479.29 488.32 165.01 947.76 475.04 10152.47 20.83 1916 Aug 31_1 501.54 66.44 5.64 490.39 512.68 234.94 700 491.66 4414.24 13.25 139 Aug 31_2 509.90 63.77 2.41 505.16 514.64 296.73 813.36 501.13 4067.00 12.51 699 Aug 31_3 515.97 72.56 2.39 511.27 520.66 329 911.57 507.26 5265.24 14.06 920 Sept 4a_1 563.39 73.94 13.28 536.26 590.51 424.99 700 568.16 5467.15 13.12 31 Sept 4a_2 526.44 57.33 3.72 519.11 533.78 369.84 700 523.16 3286.98 10.89 237 Sept 4a_3 524.14 88.75 4.65 515.00 533.28 213.9 784.12 525.85 7877.03 16.93 365 Sept 7_1 480.52 51.70 4.48 471.65 489.39 324 700 478.37 2672.90 10.76 133 Sept 7_2 492.21 46.89 6.00 480.20 504.22 389.52 636.67 492.05 2199.12 9.53 61 Sept 7_3 514.40 78.63 5.05 504.44 524.36 313.1 886.81 506.06 6183.15 15.29 242
Sept 1b_1 580.17 143.68 33.87 508.72 651.62 351.77 948.06 559.45 20644.65 24.77 18 Sept 1b_2 599.33 81.61 3.75 591.97 606.70 387.78 882.26 591.34 6660.12 13.62 474 Sept 1b_3 545.21 96.87 3.61 538.13 552.28 239.75 790.44 548.90 9383.65 17.77 722 Sept 5b_2 513.94 55.81 2.10 509.82 518.07 331.84 701.53 510.88 3114.36 10.86 706 Sept 5b_3 507.74 91.41 2.65 502.54 512.95 226.13 959.67 507.65 8356.52 18.00 1189

36
Cavortex 2
During Cavortex 2 the interaction of a cyclonic eddy with and anti cyclonic eddy
was sampled. Increased photosynthetic potential was observed through the sampled
transect in correspondence with the input of colder water from depth at the cyclonic
portion. This is an observation consistent with dynamics of this parameter during
Cavortex 6 (Figure 2.14). Fv/Fm at the coldest sampled temperature range was around
0.53. The shallower depth where this temperature regime was sampled was 55 meters.
The cyclonic and the anti cyclonic portions at depths from 40 to 70 meters showed
elevated Fv/Fm (0.51 and 0.49 respectively). A single factor ANOVA (a= 0.05 P< 0.001)
demonstrated that are significantly different photophysiological capacity in two these
areas. The statistical analysis summary of the area is presented in table 2.4 and figure
2.15. The σPSII varied inversely with Fv/Fm along the transect, the coldest temperature
range showed the strongest inverse relationship (r = 0.83). The anti cyclonic eddy portion
showed a minor relationship between the parameters at the same temperature range (r =
0.2).
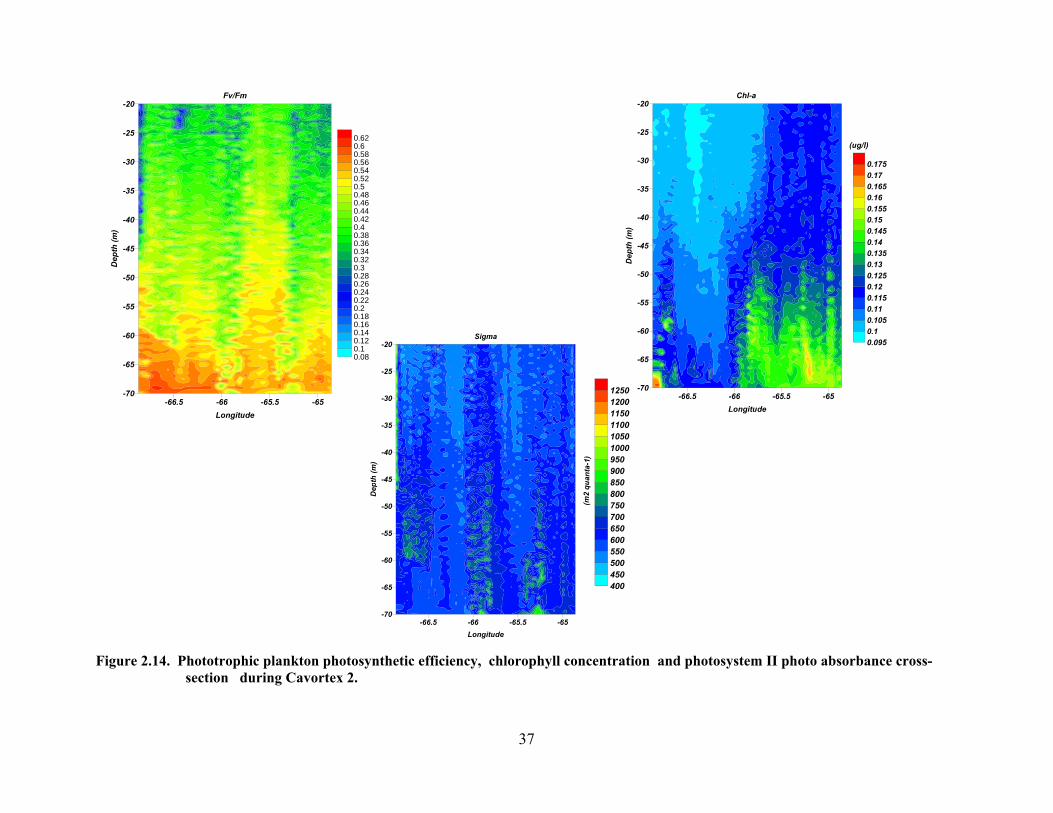
37
-66.5 -66 -65.5 -65Longitude
Sigma
-70
-65
-60
-55
-50
-45
-40
-35
-30
-25
-20
Dep
th (m
)
400450500550600650700750800850900950100010501100115012001250
(m2
quan
ta-1
)
-66.5 -66 -65.5 -65Longitude
Fv/Fm
-70
-65
-60
-55
-50
-45
-40
-35
-30
-25
-20D
epth
(m)
0.080.10.120.140.160.180.20.220.240.260.280.30.320.340.360.380.40.420.440.460.480.50.520.540.560.580.60.62
-66.5 -66 -65.5 -65Longitude
Chl-a
-70
-65
-60
-55
-50
-45
-40
-35
-30
-25
-20
Dep
th (m
)
0.0950.10.1050.110.1150.120.1250.130.1350.140.1450.150.1550.160.1650.170.175
(ug/l)
Figure 2.14. Phototrophic plankton photosynthetic efficiency, chlorophyll concentration and photosystem II photo absorbance cross-
section during Cavortex 2.

38
Table 2.4. Phototrophic plankton Photosynthetic Efficiency (FvFm) and functional absorption cross-section of photosystem II (σPSII) statistical analysis against isothermal temperature ranges for the eddy pair sampled during Cavortex 2.
Region Mean Standard Deviation
Standard Error
Lower Confidence Interval of the Mean
Upper Confidence Interval of the Mean
Minimum Value
Maximum Value Median Variance
Variation
Coefficient N
FvFm
Cyclon 1* 0.53 0.05 0.002 0.52 0.53 0.39 0.62 0.55 0.002 9.43 551
Cyclon 2 0.48 0.05 0.002 0.47 0.48 0.26 0.59 0.47 0.003 10.42 723
Cyclon 3 0.35 0.09 0.002 0.34 0.35 0.07 0.54 0.35 0.008 25.71 1806
Ant 1 0.55 0.02 0.002 0.54 0.55 0.48 0.59 0.54 0.000 3.64 118
Ant 2 0.49 0.04 0.001 0.49 0.49 0.26 0.57 0.49 0.002 8.16 1189
Ant 3 0.38 0.06 0.001 0.385 0.39 0.18 0.55 0.38 0.003 15.79 2166
σPSII
Cyclon 1 642.16 79.25 3.37 635.53 648.80 543.49 818.29 606.45 6280.59 12.34 551
Cyclon 2 637.55 69.92 2.60 632.44 642.65 477.11 977.23 619.08 4889.05 10.97 723
Cyclon 3 620.76 183.48 4.31 612.29 629.23 368.44 1676.19 571.49 33665.1 29.56 1806
Ant 1 669.69 32.49 2.99 663.76 675.61 605.19 752.05 669.68 1055.95 4.85 118
Ant 2 678.89 86.12 2.49 673.99 683.79 530.20 895.30 649.28 7417.58 12.69 1189
Ant 3 587.81 45.89 0.98 585.87 589.74 483.46 777.44 586.03 2106.46 7.81
2166
Cyclon = Cyclonic Eddy Ant = Anti Cyclonic Eddy *Temperature Ranges 1 25.4 – 26.4 2 26.8 – 27.6 3 27.6 - 29

39
Figure 2.15. Phototrophic plankton photosynthetic efficiency at eddy pair during Cavortex 2.
2.4.2 Bio-Optical data
Chlorophyll-specific absorption coefficient of phototrophic plankton
During Cavortex 6 the specific absorption coefficient of phototrophic plankton
showed consistent peaks (Figure 2.16) between the zones (surface and Deep chlorophyll
maximum) for the majority of the samples. Surface absorption curves denoted uniformity
in the spectra, indicating the prevalence of similar pigments comprising the total spectra.
The shape and magnitude of the absorption spectra for phototrophic plankton are
reflections of the pigment composition and concentration. Each group has its own
pigment signature, and the combination of the pigments that compose this signature
determines the shape of the absorption spectra (Lohrenz et al., 2003). The magnitude of
the absorption was observed to be higher for stations 4, 15, and 17. The last two were
sample within the center of the cyclonic area and station 4 at the edge of this area. The

40
magnitude of the absorption is influenced by pigment composition and packaging.
Pigment packaging is a function of two properties of the cell: its size and its intracellular
pigment concentration (Platt and Jasby, 1976). An increase in cell size or intracellular
pigment concentration will result in a corresponding decrease in pigment absorption
efficiency (Platt and Jasby, 1976; Sathyendranath et al., 1987). This decrease in the in
vivo specific absorption of aggregated pigments, compared with that of the same quantity
of pigment evenly dispersed in solution, is referred to as the packaging or flattening
effect (Kirk, 1994). Deep chlorophyll maximum (DCM) samples demonstrated a
similarly distributed spectrum. All the sampled spectra denote a typical accessory
shoulder in the area between 470-480 nm, this region of the spectra is one where the
accessory chlorophylls and carotenoids have their maximum absorptions. These
shoulders have been related to marked increases in the concentration of divinyl
chlorophyll-b within and below the DCM (Bouman et al., 2000) and are characteristic of
samples taken in deeper layers of blue subtropical waters (Bricaud and Stramski, 1990;
Sathyendranath, 1992; Hoepffner and Sathyendranath, 1992; Lee- Borges, 2003). This
shoulder is notably in the samples of the DCM where the peak of absorption of
chlorophyll–a at 442 nm has a lower magnitude, that is comparable with the accessory
shoulder creating a flattening of the spectra between 440 to 550 nm. Phototrophic
plankton cells at the DCM may show and increase in the packaging within the cell due to
increase in the amount of pigments as an adaptation to a lower light regime; therefore a
decrease in the magnitude of the absorption is expected. In summary, there are two main
sources of variation in the magnitude and shape of the absorption coefficient: changes in
pigment composition and changes in pigment packaging (Bricaud et al., 1988; Lee-
Borges, 2003).
For these samples no apparent differences are observed in the spectra apart from
differences in the magnitude of the absorption. The spectra for all stations also showed
similar magnitudes within the areas indicating consistency in the pigments and in the
populations sampled through this region of the eastern Caribbean. Surface samples
presented higher absorption coefficients specially at stations, 15, and 17 (Figure 2.16),
that coincidently were associated to the cyclonic event. Smaller cells have lower pigment

41
packaging than larger cells of the same intracellular pigment concentration, leading to a
higher absorptive efficiency per unit pigment (Platt and Jassby, 1976).
Figure 2.16. Chlorophyll-specific absorption coefficient of phototrophic plankton at stations during Cavortex 6.
A summary of discrete samples for surface and DCM is presented in table 2.5, in
it a significant positive relationship between the phototrophic plankton specific
absorption ratios 674/442 and 676/490 and Fv/FM was found (r = 0.53 and r = 0.48
400 450 500 550 600 650 700
0.00
0.02
0.04
0.06
0.08
0.10
0.12
0.14
0.16
0.18a
ph* (
1/m
)
Wavelenght (nm)
ST2 ST3 ST4 ST5 ST8 ST12 ST15 ST16 ST17
Surface
400 450 500 550 600 650 700
0.00
0.02
0.04
0.06
0.08
0.10
0.12
0.14
0.16
0.18
a ph* (
1/m
)
Wavelenght (nm)
ST2 ST4 ST5 ST6 ST8 ST9 ST13 ST15 ST16 ST17
DCM

42
respectively at P< 0.05). The study of Aiken et al.(2004) in the western English Channel
demonstrated that the optical ratio a674/a443 and Chla/Tpig significantly correlated
with Fv/Fm through changes in an annual cycle indicating optical signatures for these
parameters. In this study chlorophyll concentration (sampled along with the absorption
samples) also showed a significant relationship with Fv/Fm (r = 0.76 P< 0.05). Data from
the iron enrichment experiments, IronEx II (Behrenfeld et al., 1996) and SOIREE (Boyd
et al., 2000; Boyd & Abraham, 2001) showed significant linear correlations between
Chla/Tpig and Fv/Fm (at night). Aiken et al.(2004) established that the relationship of
Fv/Fm, Chla/Tpig and the optical ratio a674/a443 is greater when plants are actively
growing. During periods of nutrient sufficiency all of these parameters are linear
functions of mean total photon flux.

43
Table 2.5 Summary of phototrophic plankton chlorophyll-specific absorption coefficients and photosynthetic efficiency for discrete samples during Cavortex 6.
Station Mean aph * a674/442 a674/490 Chl-a (mg/l) Fv/Fm σ
(A2/quanta) aph * 442 aph * 676
2 DCM 0.09 0.54 0.70 0.10 0.344 605 0.029 0.112 3 DCM N/A 0.28 0.48 0.18 0.507 520 0.016 0.023 4 DCM 0.05 0.49 0.59 0.21 0.528 586 0.023 0.053 5 DCM 0.04 0.48 0.61 0.19 0.541 509 0.017 0.040 6 DCM 0.03 0.54 0.71 0.19 0.445 566 0.015 0.039 7 DCM N/A 0.15 0.39 0.28 0.433 609 0.030 0.011 8 DCM 0.03 0.71 0.89 0.32 0.530 597 0.020 0.044 15 DCM 0.04 0.60 0.72 0.21 0.478 637 0.018 0.046 16 DCM 0.04 0.59 0.68 0.28 0.613 453 0.021 0.043 17 DCM 0.05 0.54 0.68 0.27 0.587 467 0.027 0.053 21 DCM 0.06 0.36 0.65 0.25 0.541 510 0.039 0.052
2 s 0.06 0.36 0.55 0.09 0.340 671 0.012 0.046 3 S 0.03 0.34 0.60 0.07 0.422 280 0.007 0.029 4 S 0.05 0.29 0.48 0.09 0.317 497 0.013 0.042 5 S 0.05 0.37 0.55 0.14 0.338 562 0.014 0.040 7 S 0.04 0.17 0.33 0.14 0.331 573 0.021 0.025 8 S 0.03 0.26 0.37 0.12 0.297 607 0.011 0.021
15 S 0.05 0.34 0.55 0.09 0.463 556 0.012 0.048 16 S 0.03 0.45 0.74 0.11 0.381 528 0.010 0.036 17 S 0.05 0.32 0.56 0.15 0.410 443 0.023 0.043

44
Figure 2.17. Phototrophic plankton photosynthetic efficiency and absorption ratio 676/442 relationship for stations at cyclonic eddy center and edge during Cavortex 6. The observed correlation coefficient was r = -0.60.
For Cavortex 6, the ac-9 cast profiles (from 40 to 90 meters) of the a676/a442
ratio analyzed against Fv/Fm showed a significant negative relationship (R = -0.60 P<
0.001), for the stations at the eddy center and edge (Figure 2.17). The stations at the anti-
cyclonic region showed a significant positive relationship (R = 0.71 P< 0.001) (Figure
2.18). This apparent discrepancy in the regions probably is related to differences in the
physiological state of the cells between the provinces; as previously stated the samples at
the eddy center and edge are exposed to new environmental conditions as water from
depth surface, which promotes higher Fv/Fm. This increase in Fv/Fm occurs in a matter
of hours as observed by the observations in iron enrichment experiments in the Southern
Ocean (Boyd & Abraham, 2001), possibly leading to an increase in chlorophyll
absorption at a different time scales. The samples of the anti-cyclonic portion are in a
stratified and stable environment where the variations in Fv/Fm are not related to the
availability of new nutrients but to recycling of materials. In the steady nutrient
conditions Fv/Fm may remain high even while phototrophic plankton growth remains
low (Parkhill et al., 2001). During Cavortex 2 stations 3 and 6 showed the same
0.3 0.4 0.5 0.6 0.7 0.8 0.9
0.10
0.15
0.20
0.25
0.30
0.35
0.40
0.45
0.50
0.55
0.60
FvFm
a676/a442
ST18 ST20 St21 ST4

45
negative correlation, (R = -0.76 P< 0.001) (Figure 2.19); station 3 was sampled close to
the center of the cyclonic eddy and station 6 at the edge with an anti-cyclonic area.
Figure 2.18. Phototrophic plankton photosynthetic efficiency and absorption ratio 676/442 relationship for stations at anti-cyclonic eddy during Cavortex 6. The observed correlation coefficient was r = 0.71.
The beam attenuation at 660 nm showed a positive relationship with chlorophyll
concentration through all the samples implying that changes in chlorophyll were related
to changes in phototrophic plankton abundance through the sample areas, and not to
intracellular changes in chlorophyll concentration which is indicative of
photoacclimation. It is important to note that the samples used in the analysis are from
40 to 90 meters, therefore their degree in photoacclimation should be similar.
0.2 0.3 0.4 0.5 0.6 0.7
0.35
0.36
0.37
0.38
0.39
0.40
Fv/F
m
a676/a442
ST11ST12

46
Figure 2.19. Phototrophic plankton photosynthetic efficiency and absorption ratio 676/442 relationship for stations at cyclonic eddy center and edge during Cavortex 2. The observed correlation coefficient was r = -0.76.
The beam attenuation (cp) cast profiles (Figure 2.20) for the stations during
Cavortex 6 showed higher beam attenuation near surface declining at around 80 meters.
The chlorophyll normalized beam attenuation at 660 nm (cp*) was observed to vary
accordingly to eddy features during Cavortex 2 and 6 (Figure 2.21 and 2.22). Cavortex 6
stations inside the cyclonic eddy showed lower attenuation than stations outside (st 11
and 12) or at the edge (st 3 and 4) (Figure 2.20). Cyclonic eddies are characterized by the
uplifting of isopycnals and the creation of a concave depression at surface as water is
moved out of the center, consequently this lower attenuation may be attributed to fewer
particles as this waters emerge from depths below the euphotic zone.
0.2 0.3 0.4 0.5 0.6 0.70.15
0.20
0.25
0.30
0.35
0.40
0.45
0.50
0.55
0.60
FvFm
a676/a442
ST3 ST6

47
Figure 2.20. Beam attenuation coefficient at 660 (nm) with depth through the sampled
regions during Cavortex 6. Higher beam attenuation is observed at stations outside of the
cyclonic eddy. Stations 18,19,20 were sampled inside the cyclonic eddy, stations 3 and 4
were sampled at the eddy edge, and stations 11 and 12 at a portion with anti-cyclonic
altimetry.
When the cp* was related to Fv/Fm an inverse relationship (Figure 23) (R = -0.94,
P= 0.0001) was observed at stations in the cyclonic eddy center and edge during
Cavortex 6. The stations at the anti-cyclonic portion showed a direct relationship,
stations 11 and 12 ( R= 0.81 and 0.54 respectively P= 0.0001) (Figure 2.24). During
Cavortex 2 a significant negative relationship was observed for stations at the center and
edge of the cyclonic eddy (Figure 2.25) (R= 0.70, P= 0.0001). For Cavortex 4 a station
(station seven) in the cyclonic area also showed a negative relationship (Figure 2.26) (R=
-0.86 P= 0.0001) and a positive relationship for stations 4and 6 (R= 0.66 and 0.51 P
0.001). Behrenfeld and Boss (2003) using field data from five oceanographic studies
found consistency between spatio-temporal changes in cp* an two indices of
photoacclimation (Pb opt and Ek), stating that these parameters were not casually linked
but that they simply covary under certain environmental conditions. In our case the
-140
-120
-100
-80
-60
-40
-20
0
0.00 0.05 0.10 0.15 0.20 0.25
c 660 (m-1)
Dep
th (m
) St18 St19 St20 St12 St11 St3 St4

48
-71 -70.5 -70 -69.5Longitude
C660/Chl
-90
-80
-70
-60
-50
-40
-30
-20D
epth
(m
)
0.06
0.07
0.08
0.09
0.1
0.11
0.12
0.13
0.14
0.15
0.16
0.17
0.18
0.19
0.2
relationship is observed between cp* and Fv/Fm an index of physiological state of the cell
which reflects changes in the photosynthetic machinery to environmental conditions.
Figure 2.21. Chlorophyll normalized beam attenuation (660 nm) at cyclonic eddy center during Cavortex 6. The ratio varies accordingly with eddy influenced changes in environmental conditions.

49
-67 -66.5 -66 -65.5 -65Longitude
c660/chl
-90
-80
-70
-60
-50
-40D
epth
(m
)
0.1
0.2
0.3
0.4
0.5
0.6
0.7
0.8
0.9
1
Figure 2.22. Chlorophyll normalized beam attenuation (660 nm) at cyclonic eddy center during Cavortex 2. The ratio varies accordingly with eddy influenced changes in environmental conditions.

50
Figure 2.23. Phototrophic plankton photosynthetic efficiency and beam attenuation normalized to chlorophyll relationship for stations at cyclonic eddy center and edge during Cavortex 6. The observed correlation coefficient (r) was – 0.94.
0.05 0.10 0.15 0.20 0.25 0.30
0.10
0.15
0.20
0.25
0.30
0.35
0.40
0.45
0.50
0.55
0.60
Fv/F
m
c660/chla
ST17 ST18 ST20 ST21 ST3 ST4

51
Figure 2.24. Phototrophic plankton photosynthetic efficiency and beam attenuation normalized to chlorophyll relationship for stations at anti-cyclonic eddy during Cavortex 6. The observed correlation coefficient (r) was 0.81 (st11) and 0.54 (st 12).
0.08 0.10 0.12 0.14 0.16 0.18 0.20 0.22 0.24
0.45
0.46
0.47
0.48
0.49
0.50
Fv/F
m
c660/chl
ST11
0.08 0.10 0.12 0.14 0.16 0.18 0.20 0.22 0.240.366
0.368
0.370
0.372
0.374
0.376
0.378
0.380
0.382
c660/chl
Fv/F
m
ST12

52
Figure 2.25. Phototrophic plankton photosynthesis efficiency and beam attenuation normalized to chlorophyll relationship during Cavortex 2. The correlation coefficient (r) was -0.69.
0.5 1.0 1.5 2.0 2.50.15
0.20
0.25
0.30
0.35
0.40
0.45
0.50
0.55
0.60
Fv/F
m
c660/chl
ST2 ST3 ST6

53
Figure 2.26. Phototrophic plankton photosynthesis efficiency and beam attenuation normalized to chlorophyll relationship during
Cavortex 4. The observed correlation coefficient (r) was -0.87 (st7), 0.62 (st6) and 0.86 (st4)
1.45 1.50 1.55 1.60 1.65 1.700.25
0.30
0.35
0.40
0.45
0.50
0.55Fv
/Fm
c660/chl
ST 4
1.75 1.80 1.85 1.90 1.95 2.000.268
0.270
0.272
0.274
0.276
0.278
0.280
0.282
0.284
0.286
0.288Fv
/Fm
c660/chl
ST7
1.80 1.82 1.84 1.86 1.88 1.90
0.20
0.22
0.24
0.26
0.28
0.30
0.32
Fv/F
m
c660/chl
ST6

54
The particle size distribution (PSD) slope was addressed against the backscatter
ratio at 510 nm bbp/bp (the ratio of particulate backscatter to particulate scattering)
(Twardowski et al. 2001) for Cavortex 6 and Cavortex 4 data (Figure 2.27 and 2.28). The
PSD slope varied for all the data around 4 to 5.4, a range within the observed by
previous works (Boss and Collier, 2007; Boss et al., 2004). The observed bbp/bp (510nm)
for all the samples during Cavortex 6 ranged around 0.005 typical values for phototrophic
plankton and organic materials (Boss et al., 2004), for Cavortex 4 the values were below
and around 0.001.
Figure 2.27. Particle Size distribution slope versus backscatter ratio at 510 nm during sampled stations of Cavortex 6. The particle distribution slope shows lower values at stations in the anti-cyclonic region (ST 3 and 4) and centered values at the cyclonic eddy center (ST 18and 20).
3.4 3.6 3.8 4.0 4.2 4.4 4.6 4.8 5.0 5.2 5.4 5.6
0.000
0.005
0.010
Bac
ksca
tterin
g R
atio
at 5
10 n
m
Particle Size Distribution Slope (3 + c Slope)
St 18 St 20 St 12 St 11 St 4 St 3

55
Figure 2.28. Particle Size distribution slope versus backscatter ratio at 510 nm during sampled stations of Cavortex 4.
2.4.3 Flow cytometry during Cavortex 6
The flow cytometry data demonstrated that the samples for Cavortex 6 were
dominated by picoplankton ( Prochlorococcus spp and Synechococcus spp ), at surface
no apparent differences were observed except for station 23 that showed a lower count
(Figure 2.29). Prochlorococcus dominates Synechococcus in all samples by one order of
magnitude, ranging from 700 to 25,000 and 34 to 1700 cells per milliliter respectively.
Picoeukaryotes were minimum reaching a maximum cell count per milliliter, around 84
cells/ml.
3.8 4.0 4.2 4.4 4.6 4.80.0000
0.0005
0.0010
0.0015
0.0020
0.0025
0.0030
Bac
ksca
tterin
g R
atio
at 5
10 n
m
Particle Size Distribution Slope (3 + c Slope)
st2 st3 st5 st6 st7 st9 st10

56
Figure 2.29. Flow cytometry data for discrete samples during Cavortex 6
ST3 ST4 ST17 ST18 ST21 ST230
5000
10000
15000
20000
25000
Deep
Pico
plan
kton
cel
ls/m
l
Sampled Station
Prochlorococcus spp. Synechococcus spp.
ST3 ST4 ST5 ST17 ST18 ST20 ST230
5000
10000
15000
20000
Prochlorococcus spp. Synechococcus spp.
Pico
plan
kton
cel
ls/m
l
Sampled Station
Surface
ST3 ST4 ST5 ST17 ST18 ST20 ST230
20
40
60
80
100
Pico
plan
kton
cel
ls/m
l
Sampled Station
Picoeukaryotes
Surface
ST3 ST4 ST17 ST18 ST21 ST230
20
40
60
80
Deep
Picoeukaryotes
Pico
plan
kton
cel
ls/m
l
Sampled Station

57
2.4.4 Variable Fluorescence during the Oripex campaign
The effect of the Orinoco River plume on the photosynthetic efficiency was
addressed during Oripex 7 and 8. Higher Fv/Fm was observed throughout the river-
influenced zone. The Orinoco river plume during Oripex 7 was observed to have its
direct influence in Eastern Caribbean waters as far north to latitude 13 and during Oripex
8 the influence of the front reached latitude 16 (Figure 2.30). The statistic summary of
the sampled regions during Oripex 8 is presented in Table 6. Fv/Fm in the zones directly
impacted by the river plume showed median values above 0.40 for most of the water
column (Table 2.6) (Figure 2.31 and 2.32). The areas sampled include an area west of
Saint Lucia and Martinique visited on the transect of September 20, 2008. Fv/Fm for the
zone presented higher than expected values, with maxima around 0.67. These values
persisted both at surface and depth, denoting a generalized effect through the water
column. Surface salinity around 31 practical units, suggested waters influenced by the
river plume ( Figure 2.31). The area visited on September 22, 2006 east of the island of
Grenada, appeared to be out of the direct effect of the river plume as interpreted by the
observed surface salinity (Figure 2.32). Only a small portion of the transect showed a
decrease in the surface salinity around longitude 61.2. Oceanic waters south of Puerto
Rico sampled during the same campaigns denoted typical Fv/Fm distributions through
the water column (Figure 2.33). Median values for the zone were around 0.31, and the
observed maximum reached .043. Surface salinity remained within the expected range
for oceanic waters.
Maximum fluorescence depth profiles of selected portions within the Oripex 8
transects are presented in Figure 2.34. The deep chlorophyll maxima (DCM) for stations
south of Puerto Rico show appears at depths around 80 to 90 meters for station CaTS,
typical for oceanic waters. The same was observed for stations southeast of Grenada
during transect Sept 22. The DCM is observed close to surface for samples of transect
sept 18(around 55 m), and for the region visited on transect Sept 20 the maxima appears
around 30 m. Fv/Fm increased with depth for all the samples; sample Sept 20 was the
more conservative, with almost constant values (Figure 2.34).

58
-71 -69 -67 -65 -63 -61 -59Longitude
Oripex 8
9
11
13
15
17
19
Latit
ude
-71 -69 -67 -65 -63 -61 -59Longitude
Oripex 7
9
11
13
15
17
19
Latit
ude
Figure 2.30. MODIS Aqua chlorophyll-a images during the Oripex expeditions. The images were capture November 24, 2005 for Oripex 7, and September 20, 2006 for Oripex 8. Red crosses mark the stations analyzed. During Oripex 8 the sampled transects appear in red (transect south of Puerto Rico), orange (transect west of Saint Lucia) and yellow (transect east of Granada).

59
Table 2.6. Fv/Fm statistics of sampled transects during Oripex 8. Partial data presented as surface (< 40 m) and depth (> 40 m).
Sample
N total
Mean
Standard Deviation
Sum
Minimum
Median
Maximum
Variation
Coefficient
Surface Sept 18 545
0.31
0.040
169.14
0.18
0.31
0.41 12.90
Depth Sept 18 863
0.34
0.03
301.88
0.23
0.35
0.43 8.82
Surface Sept 22 561
0.31
0.08
177.36
0.11
0.32
0.55 25.81
Depth Sept 22 1174
0.42
0.07
503.57
0.11
0.43
0.60 16.67
Surface sept 20 1494
0.44
0.07
664.83
0.20
0.46
0.61 15.91
Depth sept 20 605
0.51
0.04
310.22
0.26
0.51
0.67 7.84
All Sept 18
1408
0.33
0.04
471.02
0.18
0.33
0.43 12.12
All Sept 22 1735
0.39
0.09
680.93
0.11
0.40
0.60 23.08
All sept 20 1495
0.48
0.05
732.07
0.22
0.49
0.67 10.42

60
-62.6 -62.5 -62.4 -62.3 -62.2Longitude
Fv/Fm
-70
-65
-60
-55
-50
-45
-40
-35
-30
-25
-20
-15
Dep
th (
m)
0.2
0.22
0.24
0.26
0.28
0.3
0.32
0.34
0.36
0.38
0.4
0.42
0.44
0.46
0.48
-61.24 -61.23 -61.22 -61.21 -61.2 -61.19
Longitude
Salinity
-80
-70
-60
-50
-40
-30
-20
Dep
th (
m)
31.231.431.631.83232.232.432.632.83333.233.433.633.83434.234.434.634.83535.235.4
Figure 2.31. Fv/Fm and salinity countor maps during Oripex 8 for transect sampled during September 20, 2006. The sampled transect denotes the inclusion of low salinity waters over the zone from the Orinoco River front. . The transect was mostly sampled over river influenced west of St Lucia.

61
-61.15 -61.1 -61.05
Longitude
Fv/Fm
-80
-70
-60
-50
-40
-30
-20
Dept
h
0.2
0.22
0.24
0.26
0.28
0.3
0.32
0.34
0.36
0.38
0.4
0.42
0.44
0.46
0.48
0.5
-61.2 -61.15 -61.1 -61.05
Longitude
Salinity
-80
-70
-60
-50
-40
-30
-20
Dep
th31.431.631.83232.232.432.632.83333.233.433.633.83434.234.434.634.83535.235.4
Figure 2.32. Fv/Fm and salinity contour maps during Oripex 8 for transect sampled during September 22, 2006. The sampled transect denotes some of the inclusion of low salinity waters over the zone from the Orinoco River front. The transect was mostly sampled over blue waters east of the coast of Granada.

62
-66.98 -66.88 -66.78 -66.68 -66.58Longitude
Salinity
-90
-80
-70
-60
-50
-40
-30
-20
Dep
th (m
)3333.133.233.333.433.533.633.733.833.93434.134.234.334.434.534.634.734.834.93535.135.235.335.435.5
-66.98 -66.88 -66.78 -66.68 -66.58Longitude
Fv/Fm
-90
-80
-70
-60
-50
-40
-30
-20
Dep
th (m
)
0.2
0.22
0.24
0.26
0.28
0.3
0.32
0.34
0.36
0.38
0.4
0.42
0.44
0.46
0.48
0.5
Figure 2.33. Fv/Fm and salinity contour maps during Oripex 8 for transect sampled during September 18, 2006. The transect was sampled over blue waters south of the island of Puerto Rico.

63
Figure. 2.34. Fv/Fm and maximum fluorescence profile casts for sampled stations during Oripex 8. The sampled stations were localized at the sampled transects west of Saint Lucia (St Tran Sept 20) influenced by the river front; South East Granada (St Tran Sept 22) in waters close to the river plume and south of Puerto Rico (St Tran Sept 18) in oceanic waters.
-90
-80
-70
-60
-50
-40
-30
-20
0.0 0.5 1.0 1.5 2.0 2.5 3.0
St Tran sept 20 St Tran sept 22 St Tran sept 22 St Tran sept 18 CaTS St Tran sept 18 St Tran sept 18
Maximum Fluorescence
Dep
th (m
)
-90
-80
-70
-60
-50
-40
-30
-20
0.20 0.25 0.30 0.35 0.40 0.45 0.50 0.55 0.60 0.65
St Tran sept 20 St Tran sept 22 St Tran sept 22 St Tran sept 18 CaTS St Tran sept 18 St Tran sept 18
Fv/FmD
epth
(m)

64
Figure 2.35. Fv/Fm and maximum fluorescence profile casts for sampled stations during Oripex 7 The sampled stations were localized from the Dragon’s Mouth (St 7 and St 8) toward waters West of Granada (St 9) and South East Granada (St 10).
-100
-90
-80
-70
-60
-50
-40
-30
-20
0.0 0.5 1.0 1.5 2.0 2.5 3.0 3.5 4.0
Orip 7 st7 Orip 7 st8 Orip 7 st9 Orip 7 st10
Maximum Fluorescence
Dep
th (m
)
-70
-60
-50
-40
-30
-20
0.20 0.25 0.30 0.35 0.40 0.45 0.50 0.55 0.60
Orip St 7 Orip St 8 Orip St 9 Orip St10
Fv/FmD
epth
(m)

65
Maximum fluorescence profiles during Oripex 7 are presented in Figure 2.35.
These samples were collected close to the river origin between the islands of Trinidad
and Grenada. Stations 7 and 8 were collected at the Dragon’s Mouth between Trinidad
and Venezuela. These stations denoted chlorophyll maxima close to surface. Station 10
east of Grenada presented a maximum around 55 m. Fv/Fm for all stations decreased
with depth, apparently responding to river-originated materials close to the surface. For
station 7 the observed surface salinity was 25, for station 8 the surface salinity was 28. At
both stations the salinity increased to normal values around 3 m. Stations 9 and 10
exhibited a normal range of surface salinity values.

66
2.5 Discussion
Photosynthetic efficiency at Caribbean mesoscale eddies
Our investigations of mesoscale processes shed some light into the processes
occurring through the basin while these perturbations move across the Caribbean. The
perturbation caused by the passage of cyclonic eddies uplifted materials towards the
surface while exposing the phototrophic plankton to nutrient rich waters. Photosynthetic
efficiency (Fv/Fm) exhibited vertical and horizontal variations that are consistent with
control by recent light history and nutrient status. Decreased daytime Fv/Fm denoted the
photoinhibitory processes occurring through the zone. Photosynthetic efficiency of dark
acclimated populations is substantially reduced under nutrient limitations or at high
surface irradiances owing to the inactivation or damage to PSII reaction centers pigment-
protein complexes (Falkowski and Kolber, 1995). Photoinhibition has been shown to be
exacerbated by nutrient limitation if sufficient nutrient resources are not available to
provide the substrate to repair damaged photosynthetic reaction centers (Falkowski and
Raven, 1994). Suppression of photosynthetic efficiency was evident during the daytime
transects with the Nv-Shuttle, but this suppression although registered in samples up to 90
meters did not lower Fv/Fm below the normal expected values for oligotrophic waters
(around 0.3). Consequently we consider that the passage of the cyclonic eddy supplied
the entire area the materials needed to rebuild the affected photosynthetic centers. The
observed fast recovery of the phototrophic plankton from daytime Fv/Fm suppression
evidently suggests that the cells were suffering some degree of non-photochemical
quenching that did not involved structural damage to the PSII photosynthetic centers.
Non photochemical quenching in the pigments of PSII relaxes on the time scale of 5- 60
minutes (Olaizola and Yamamoto, 1994). Coincidently, our sampled transect showed
recovery at this time range. However the available data provides only a snap-shot of this
process and no experiment was specifically performed to address this issue.
The nutrient data was limited to depths below the 80 m due to the delectability of
the method at the concentrations found in our samples. But there is well documented

67
positive co-variation between the maximum carbon based photosynthetic quantum yield,
Fv/Fm and nitrate concentration in a wide range of ocean waters (Babin et al., 1996;
Kolber et al., 1990). Falkowski et al. (1991) measured nitrate concentrations and variable
fluorescence in a cyclonic eddy near Hawaii showing high values of Fv/Fm (around
0.56); close to those observed at the coldest temperature ranges registered here. The
maximal theoretical value for this parameter is 0.65. The observed negative relationship
of Fv/Fm with temperature and a positive one with density at the eddy center during
Cavortex 6 strongly support the hypothesis of nutrient uplifting by eddy pumping
potential.
Despite the fact that higher Fv/Fm was observed in the cyclonic eddy compared to
the other provinces sampled, the inverse relationship observed with σPSII (at depths 60 to
90 m) suggests that the cells were recently relieved from nutrient stress. As stated before,
when phototrophic plankton growth is slowed due to inadequate supply of nitrogen or
iron, the efficiency of photochemistry at PSII is submaximal due non-functional pigment-
protein complexes, iron-containing cytochromes, and enzymes in PSII reaction centers
(Falkowski, 1992). On the other hand, the PSII absorption cross section (σPSII) will
increase under nitrogen or iron limitation owing to preferential synthesis under nitrate
stress of nuclear-encoded antennae pigment protein complexes over the chloroplast
genome–encoded pigment-protein complexes of the photosynthetic reaction centers
(Kolber et al., 1988; Falkowski et al., 1989) . Compared to nutrient replete cell, there are
relatively fewer reaction centers serving a given-sized antenna under nutrient depletion,
and therefore electron flow and charge separation at PSII is increased relative to light
absorption (Vaillancourt et al., 2003b). In other words, the fewer functional PSII reaction
centers per cell are served by a large complement of antennae pigments assuring efficient
transfer of photochemical energy to PSII and higher values of σPSII .
The inverse relationship of Fv/Fm and the specific absorption ratios suggest an apparent
increase in the chlorophyll absorption that is not synchronized with an increase in
photosynthetic efficiency. The increase in chlorophyll-a (Chl-a) absorption is probably
due to an increase in Chl-a relative to other pigments. Preferential Chl-a synthesis is
observed for healthy algae and vice versa when nutrient-starved, consistent with the high
energetic requirements of Chl-a (Heath et al., 1990). The increase in Fv/Fm could be

68
considered to occur at shorter timescales than Chl-a synthesis. Therefore as phototrophic
plankton cells become exposed to the new nutrients and limiting micronutrients like iron,
the rate of transfer of electrons increases but with not enough time to reconstruct the
damaged chloroplast structures to increase the Chl-a concentration accordingly to Fv/Fm
increments. In iron fertilization experiments the phototrophic plankton bloom was
apparent days after the addition of iron even though the changes in Fv/Fm were observed
within hours (Boyd & Abraham, 2001). Consequently, the resulting inverse relationship
of Fv/Fm and absorption ratios becomes apparent at the eddy’s center and edge, in
contrast, the anti-cyclonic portion has a positive relationship due to stable stratification as
would be expected.
Chlorophyll normalized particle beam attenuation in Caribbean mesoscale eddies
Chlorophyll normalized particle beam attenuation (cp*) at 660 nm has previously
suggested as another optical estimate of phototrophic plankton physiology. Behrenfeld
and Boss [2003] suggested that cp should likewise be well correlated with phototrophic
plankton carbon biomass, particularly since the particle size domain dominating cp more
closely matches that of phototrophic plankton than particulate organic carbon.
Consequently, they proposed the cp* ratio as an index of phototrophic plankton C:Chla
and subsequently demonstrated a first-order correspondence between cp* ratio and
independent 14C-tracer measures of physiological condition (Behrenfeld and Boss,
2003). Our observations also suggest such relationships with Fv/Fm, and, as previously
observed for the absorption ratios, it varied inversely with the cp* ratio at stations
influenced by the cyclonic eddy. High cp* ratio is indicative of high concentration of
phototrophic plankton and is consistent with low refractive material (relatively low
contribution from inorganic particles) a low cp* ratio is indicative of relative low
concentration of phototrophic plankton and is consistent with high refractive material
(large contribution from inorganic particles). The dynamics of the cyclonic eddy appears
to increase the amount of refractive material through the water column which supports
higher Fv/Fm through this zone. The anti-cyclonic portion relies on the recycling of
phototrophic plankton originated materials and the changes of the cp* ratio are related to

69
changes in phototrophic plankton abundance (as was observed by the strong relationship
of cp and Chl-a through all the samples). Its relationship to Fv/Fm indicates higher
photosynthetic efficiency related to particles of phototrophic planktonic origin, thus the
increased Fv/Fm responds to recycling of phototrophic plankton materials not to new
inorganic particles, as observed in cyclonic regions.
The nature of cp as a robust index of particle variability is determined by particles
in the ~ 0.5 and 20 μm range for the typical open ocean (Boss et al., 2001) Therefore, in
the open ocean only a fraction (but often dominant) of cp can be attributed to
phototrophic plankton (Fennel and Boss, 2003); and its variability is more influenced by
the fractions of ultraplankton and nanoplankton and less by the picoplankton (Durand and
Olson, 1996). Thus, notice that the cp* ratio showed sensitivity to particle distribution at
the eddy center even in a region dominated by the picoplankton Prochlorococcus and
Synechococcus spp. In fact, generally all the Cavortex 6 regions were dominated by
similar phototrophic planktonic communities widely homogenous as suggested by the
correspondence in the chlorophyll specific absorption coefficient spectra within regions.
Further support of these observations is the relatively low backscattering ratio (centered
on 0.005) and a similar particle size distribution slope.
In summary, the passage of these mesoscale events across the eastern Caribbean
region appears to have an impact on the photosynthetic potential of the phototrophic
planktonic communities. Increased Fv/Fm potential could be associate to the effect of
cyclonic eddies and, although further evidence is needed, it seems that their impact did
not originate the expected changes in the phototrophic planktonic community structure
observed by Vaillancourt et al. (2003) in the Hawaiian cyclonic eddies. They observed
an increase in abundance of the pico eukaryote community while our flow cytometry
observations do not suggest a change in taxonomic composition through the sampled
regions. The abundance of these cells appears to remain constant through the samples,
but due to the limited information no conclusion could be derived.
Additionally, the correlations of Fv/Fm with independent optical indices of
phototrophic plankton physiological condition provides further evidence for the potential
of cp* ratio as an independent probe of phototrophic plankton responses to changing
70
environmental conditions. Fv/Fm together with cp* is suggested here to some degree
shed some information on the factors influencing photosynthetic potential and its origins.
Photosynthetic efficiency in the Orinoco River Plume
The influence of the Orinoco River plume on the photosynthetic potential of
eastern Caribbean phototrophic plankton populations is demonstrated by the previous
analysis. Increased Fv/Fm close to the surface decreasing with depth suggests a relation
with river originated material. Samples during Oripex 7 close to the river origin denote
this phenomenon. The observed chlorophyll maxima close to surface probably originated
in relation to the river water haline interface, the effect of fresh water was observed to
reach depths of 3 meters. Del Castillo et al. (1999) documented the observed vertical
displacement of Chl-a along the latitudinal gradient, where the maxima was closer to
surface at lower latitudes and gradually displaced to greater depths towards the north,
reaching depths of 50 to 100 m close to the south of Puerto Rico. In this region of the
water column a density gradient occurs apparently leading to accumulation and microbial
degradation, and the consequent increase of Fv/Fm. However the observed increase in
Fv/Fm through the water column was higher at stations farther from the Gulf of Paria
(Oripex 7 St10 Figure 2.35). It has been suggested that dissolved inorganic nitrogen in
the plume is depleted before it exits the Gulf of Paria (Bonilla et al., 1993). Then the
enhanced photosynthetic potential is probably results of riverine material degradation,
that could be the result of both microbial remineralization and dissolved organic nitrogen
photomineralization as suggested by Morell and Corredor (2001). The areas sampled
during Oripex 8 farther from the river origin registered also the increase in the Fv/Fm
through the water column suggesting a similar influence by the river plume .
The entrainment of the river plume by a cyclonic eddy (Corredor et al., 2004)
evidentiated the complex dynamics of the eastern Caribbean waters. The observed eddy
potential for increasing available materials in surface waters and the experimental
evidence of photomineralization of dissolved organic matter (Morell and Corredor,
2001) denotes the variety of fertilization mechanisms occurring in the region. The role
of these factors in shaping the photosynthetic potential of Caribbean surface waters was
evidentiated with the correlated variability of Fv/Fm through the areas sampled. The

71
resolution of the FRRF-acquired data with the use of a towed vehicle during these
oceanographic expeditions provided high assurance of the validity of the evidence
presented here. The use of the Nv-Shuttle permitted the acquisition of data at 5 second
resolution over shuttle oscillations of about a kilometer. This was advantageous and
facilitated the interpretation of the changing biogeochemical features from the surface
down to 90 meters while the zones were impacted by the mesosocale phenomena.
Conclusion
In conclusion phototrophic planktonic communities in eastern Caribbean waters
are constantly changing as a result of these mesoscale processes. This as consequence
results in higher photosynthetic potential for the region determined by the gradient
created by the Orinoco River plume part of the year and the disruption in the surface
waters by mesoscale eddies. We should then expect higher potential decreasing with
increasing latitude from the Orinoco River origin to waters north deep in to the
Caribbean. This potential should then correlate with the increasing degradation of the
dissolve organic matter through the zone, as it liberates the phototrophic planktonic
communities from nutrient starvation. Thus at least in some period of the year these
waters then deviate from the expected oligotrophic state to a mesotrophic one with higher
potential for primary production.

72
CHAPTER 3 Carbon fixation estimates and bio-optical characteristics of
phototrophic plankton in eastern Caribbean waters
3.1 Abstract The structure of Eastern Caribbean surface waters is defined by the action of
several mesoscale processes including the continental forcing created by the Orinoco
river as it deliver the effluents into this waters. This river creates a seasonal front that
covers part of the eastern Caribbean, having direct effects as far as the islands of Puerto
Rico. Consequently the occurrence of this seasonal surface front imparts distinctive bio-
optical properties to these waters, creating unique light and nutrient regimes to the
phototrophic plankton cells across the region. These environmental changes then impart
these phototrophic plankton ic cells photo-physiological characteristics that remain as
record of phototrophic plankton recent life history. Ultimately these adaptations are then
reflected into the phototrophic plankton efficiency for primary production.
The Caribbean Vorticity experiment (Cavortex 2 and 6) from June 22-27, 2004
and August 28, 2006 to September 8, 2006, and the Orinoco River plume experiment
(ORIPEX 7 and 8) November 19-24, 2005 and September 18-23, 2006, were intended to
characterize the physical, biogeochemical, and optical structure of the Eastern Caribbean
Region as mesoscale processes (eddies and the Orinoco River plume) influence the
biological productivity of the Easter Caribbean.
The FRRF-based productivity estimates produced a strong linear relationship
(r=0.91) with independent measurements of 14C for data collected throughout the Eastern
Caribbean Sea. The chlorophyll specific absorption coefficient (aph) showed reduced
absorption in the region of 442 nm apparently in response to increased package effect for
waters under the influence of the river plume. This observed packaging suggest lesser
action by chlorophyll and probably an increase in photoprotective carotenoids as
interpreted by the variations of the aph slope around the region of 488 to 532 nm. These
variations in the aph slope were then correlated to a decrease in the quantum yield for
carbon fixation at samples in oceanic far from the direct influence of the Orinoco River

73
plume. Satellite based estimates of primary production varied accordingly with in-situ
measurements and the gradients created by the river plume.

74
3.2 Introduction The structure of Eastern Caribbean surface waters is defined by the action of
several mesoscale processes including the continental forcing created by Amazon and
Orinoco rivers as they deliver their effluents into these waters. These rivers create
seasonal plumes that cover part of the eastern Caribbean having direct effects as far as
the islands of Puerto Rico. The impact of these fresh water inputs on the coast of Puerto
Rico are marked by a shift upward of the deep chlorophyll maxima (DCM) and apparent
seasonal increase in the chlorophyll through the region as interpreted from remote sensed
data (Corredor and Morell, 2001). This increase in the chlorophyll at surface waters is
consequence of the residence of these waters above the pycnocline and the nutrient
recycling within the buoyant river plume (Corredor et al., 2003). Consequently the
occurrence of this seasonal surface front should impart distinctive bio-optical properties
to these waters, creating unique light and nutrient regimes to the phototrophic plankton
cells across the region. These environmental changes then impart to these cells photo-
physiological characteristics that remain as record of recent life history. Ultimately these
adaptations then should be reflected in the efficiency for primary production.
One property related and relevant to analysis of water column primary production
is the absorption coefficient of phototrophic plankton. Absorption by photosynthetic
pigments and accessory pigments serves to assess the physiological condition of
phototrophic plankton, species identities, and biomass in marine environments
(Falkowski and Raven, 1997). The absorbed energy by phototrophic plankton once
absorbed follows three possible pathways: (1) is used in photosynthesis, (2) is liberated as
fluorescence or (3) is converted to heat energy. Accessory pigments are subdivided into
photosynthetic carotenoids involved in the transfer of energy in the reaction centers
during photosynthesis, and photoprotective carotenoids involved in the protection of the
chloroplast from excess irradiances. Variations in the composition of photoprotective
and photosynthetic pigments as well as pigment packaging reveal changes in the total
absorption spectra of phototrophic plankton. These changes in consequence affect the
productivity by decreasing efficiency of energy transfer. When the proportion of
photoprotective carotenoids increases, the rate of electron transfer for photosynthesis
diminishes (Prieto et al., 2008). Owing to the fact that their purpose is to help prevent

75
damage to chloroplast from excess light by reducing the efficiency of energy transfer
among photosynthetically active pigments through the modification of chlorophyll-
chlorophyll interactions (Frank et al., 2001), consequently photoprotective carotenoids
have the lowest transfer efficiencies with minimum values of 20 % (Rabinowitch and
Govindjee, 1969). The slope of the absorption spectra from 488 to 533 nm (normalized to
676 nm) has been found to be steeper in high-light compared to low-light adapted
cultures (Johnson et al. 1994 cited in Eisner et al., 2003). Such spectral variations are due
to physiological changes in cellular pigment ratios and pigment packaging, under high
light, increases in photoprotective carotenoids, decreases in photosynthetic carotenoids,
and a reduction in pigment packaging may cause the absorption spectral slopes to become
steeper, while the reverse is true for low-light conditions.
The efficiency in energy conversion by phototrophic plankton is measured
through estimates of variable fluorescence which provide the means to study their
physiology as it respond to nutrient limitation (Sosik and Olson, 2002), algal
photoinhibition and photoprotection due to excessive visible and UV radiation
(Beherenfeld et al., 1998), and changing nutrient and light fields (Babin et al., 1996).
Variable fluorescence(Fv = Fo - Fm) is measured by analyzing the difference between
the initial fluorescence (Fo), obtained from the original fluorometer flash sequence when
all the reaction centers are open , and the maximal fluorescence (Fm), obtained once all
the reactions centers are transporting electrons and temporally closed to further
excitation. When variable fluorescence is normalized to the maximal fluorescence the
photochemical conversion efficiency of photosystem II (Fv/Fm) is obtained.
Estimates of primary production from variable fluorescence measurements have
been available in recent years through the use of active fluorescence techniques, such as
pump and probe fluorescence (PPF), Pulse amplitude modulation (PAM) and fast
repetition rate fluorometry (FRRF). FRRF fluorometry has become the dominant
methodology in recent years; it is a technology that provides measurements of
phototrophic plankton physiology using a progressive closure of photosystem II (PSII)
reaction centers in responses to flashes of excitation energy. This methodology makes
possible estimates of primary productivity with a resolution of seconds (Kolber and
Falkowski, 1993; Sugget et al., 2001; Smyth et al., 2004 Cermeño et al., 2005), and

76
without the need for time consuming incubations providing an advantage over other
traditional approaches, the oxygen evolution method (Strickland and Parsons, 1972) and
the radioactive 14C tracer for carbon assimilation method (Steeman-Nielsen 1952).
Kolber and Falkowski (1993) developed a model of primary production based on
the relationship between PSII fluorescence and electron transport using Fv/Fm. Since
PSII is the site where oxygen evolution occurs, there is a relationship between variable
fluorescence and oxygen production and although carbon fixation occurs at later stages of
the process during photosynthesis dark reactions, a fraction of the electrons passed from
PSII to PSI are used for this purpose. Consequently carbon fixation has some degree of
relation with to PSII fluorescence by the photosynthetic quotient, the ratio of moles of
oxygen released to moles of carbon fixed. Kolber and Falkowski (1993) applied the
model using the PPF technique and compared them to estimates of 14C uptake. This
productivity estimates indicted a 1:1 relationship with a slope of 1.06 (r2 = 0.86). Sugget
et al., (2003) applied a variation of this model using the FRRF technique and obtained a
slope 2.116 with a lower r2 (0.56) . Recently, Melrose et al. (2006) found better results
with a regression slope that ranged between 0.23 and 1.04 and their r2 was usually high
above 0.9. They also suggested that due to the variability between the FRRF productivity
and 14C estimates, FRRF field measurements should be calibrated against other
productivity measurements techniques.
The advent of ocean color measurements from satellites has recently facilitated
the effort to measure net primary production (NPP) on global scales. These estimates has
traditionally primarily based their NPP approximations on the biomass estimated through
chlorophyll concentration, incident light and a scaling parameter that accounts for
variations in plant physiology (Behrenfeld and Falkowski, 1997a). These estimates
perform poorly when compared to in-situ estimates due to their inefficiency in tracking
physiological changes that are not displayed on chlorophyll concentrations alone. Most
changes in chlorophyll concentration reflects intracellular changes in response to
photoacclimation and not necessarily phototrophic plankton growth (Behrenfeld et al.,
2005). Based on these observations Behrenfeld et al. (2005) developed estimates of NPP
based on the information of particle backscatter (bbp) of the ocean color reflectance. This
information was then directly related to phototrophic plankton biomass, the Chl:C ratio

77
reflects photoacclimation and nutrient stress and has been shown to track phototrophic
plankton physiology both in the laboratory and in the field (Behrenfeld and Boss, 2003;
Behrenfeld et al., 2005). Based on this parameter the community growth rate can be
estimated more precisely resulting in the ability to calculate fully resolved vertical
profiles of phototrophic plankton NPP (Westberry et al, 2008).
Our goals in this work are first to determine the extent to which the variable
conditions of surface eastern Caribbean waters affect the spatial variations in surface
water production estimates by fluorometry. This is addressed by examining the
photosynthetic efficiencies and related quantum yield of carbon fixation as they vary with
light adaptations, interpreted by the spectral slope of normalized absorptions curves.
Second to evaluate the satellite estimates of NPP and their relationships with the in-situ
acquired data. The presence of river originated materials across the region should impart
unique adaptations to the phototrophic plankton through a gradient from those waters
closed to origin of the plume to waters deep into the center of the eastern Caribbean.

78
-75 -72 -69 -66 -63 -60Longitude
10
13
16
19
Latit
ude
3.3 Methodology 3.3.1 Field Work
The data used in this analysis was collected during oceanographic cruises part of
the Caribbean Vorticity experiment (Cavortex 2 and 6), and the Orinoco River plume
experiment (ORIPEX 7 and 8); aboard the UPRM R/V Chapman and the LUMCOM R/V
Pelican (Figure 3.1). The Caribbean Vorticity Experiment (Cavortex II and VI)
undertaken from June 22-27, 2004 and August 28, 2006 to September 8, 2006 were
intended to characterize the physical, biogeochemical, and optical structure of the eddies
and to assess their influence on biological productivity of the Eastern Caribbean Region.
ORIPEX 7 and 8 cruises were carried out during November 19-24, 2005 and September
18-23, 2006 to analyze effects of the Orinoco River on the biogeochemical properties of
the Eastern Caribbean.
Figure 3.1. Stations sampled for phototrophic plankton bio-optical characteristics during Cavortex 6 (Red) and Oripex 7 (black) and 8 (orange).

79
In situ measurements were collected with a towed profiling vehicle (Nv-Shuttle)
manufactured by Chelsea Instruments Ltd, which maximized the spatial resolution and
efficiency of the sampling. This vehicle is fitted with a Fast Repetition Rate Fluorometer
(FRRF) to measure the physiological state of the phototrophic plankton, MINIpack (with
a CTD-F and 24 channel data logger integrated capable of real time data acquisition), and
a photosynthetically available radiation (PAR) irradiance meter. The Nv-Shuttle was
operated with continuous oscillations from surface to a maximum of 90 meters when
possible. Diffuse attenuation coefficients were calculated over the depth of the euphotic
zone according to Kd = ln[E (0-)/E(Z1%)] /Z. The depth interval was chosen to extend
from near the surface (Z = 0- , i.e., ca 5 m) to the bottom of the euphotic zone
(Z=1%E(0)). The euphotic zone was define as the depth at which irradiance is diminished
to 1% of the surface values, equivalent to an optical depth (ξ= Kd Z) of 4.6 (kirk 1994).
In addition the FRRF was deployed on oceanographic rosette cast at some of the
sampled stations during the experiments. The rosette was fitted with 24 Niskin bottles
which were used to obtained discrete water samples for phototrophic plankton specific
absorption data, phototrophic plankton chlorophyll-a, nutrients and 14C assimilation
experiments. A SeaBird SBE 19 SEACAT CTD profiler was also fitted in the rosette and
its data was processed, filter, binned, and parameters derived using the SeaBird Data
Processing software version 7.16a. The concentration of phototrophic plankton
chlorophyll-a was obtained from samples filtered through 0.7 µm glass fiber filters
(Whatman GF/F) using the standard fluorometric method (Yentsch and Menzel, 1963)
measured in a Turner AU-10 Fluorometer.

80
3.3.2 Variable Fluorescence
Variable fluorescence (Fv/Fm, unit less) and functional absorption cross-section at
photosystem 2 (σPSII, units Ǻ2 quanta -1) were logged on an internal flash card and downloaded to
a PC after each transect. The FRRF measures these parameters for seawater that is exposed to
ambient irradiance, and also simultaneously on seawater passed through a ‘dark chamber’ placed
in front of one of the photomultiplier tube (PMT) window. Only the dark adapted data was
analyzed, and most of the data presented in the analysis was gathered at night except when only
day transects were possible. Data gathered during the day in the first 20 meters were consider
unusable owing to saturation of the PMT from high surfaces irradiances and was removed. The
instrument flash protocol was set for 100 saturation flashes per sequence with a saturating flash
duration of 1.10 μs and an interflash delay of 51.6 μs. This was followed by 20 decay flashes
each of 1.10 μs duration with an interflash delay of 51.6 μs. The raw data was processed using
Chelsea’s FRS processing software. Depth was provided by an internal logging calibrated sensor
of the MINIpack throughout Nv-Shuttle deployments.
The variable fluorescence is determined when dark-adapted cells are illuminated, all of
the functional reaction centers are “open” and ready to receive an exciton, thus their fluorescence
yield is low (Fo) ( since maximal excitation energy can be efficiently used for photosynthesis).
When a given reaction center has received an exciton it is closed, consequently associated
fluorescence yield increases. When all the reaction centers are closed (or non-functional), the
observed fluorescence is maximal (Fm). Variable fluorescence (Fv = Fm - Fo)is then obtained
when normalized to Fm, and it is an indicator of the proportion of photosystem II (PS2) reaction
centers that are functional; Fv/Fm has been empirically determined to be about 0.65 for cultures
of phototrophic plankton growing under optimal conditions (e.g., Kolber et al., 1988). ). The
absorption cross section of PSII (σPSII) changes in response to cellular pigment concentrations
and the efficiency of energy transfer from pigments to PSII reaction centers, thus making it
subject to both nutrient and light availability (Kolber et al., 1988; Moore et al., 2006). σPSII is
typically lower in nutrient replete cells relative to unhealthy cells (Kolber et al., 1988).
Blanks were collected from waters samples gathered at depths from 250 to 300 meters.
Sea water from these depths then was placed and dark adapted for 30 minutes and then measured

81
in the FRRF dark chamber. In some of the cruises water above the 200m was collected and
filtered through a 0.2μm filter and used as a blank. The resulting fluorescence transients from
these samples were then used as blanks. This methodology represents a practical solution
correcting low in-situ fluorescence signals as demonstrated by Cullen and Davis (2003). The
FRRF maximum fluorescence signal of every cast or transect acquired was also compared with
the SeaBird fluorometer mounted on the rosette in the cast profiles and with the Chelsea
MiniPack CTD-F mounted on the Nv-Shuttle to monitor the fluorometer sensitivity to changes in
chlorophyll concentration.
The FRRF parameters were filtered for noise using the low pass signal filter function
Butterworth in the Matlab signal processing tool box.
3.3.3 Maximum quantum yield of carbon fixation
The maximum quantum yield of carbon fixation was calculated from FRRF parameters
and it is related to PSII characteristics according to the following relationship (Kolber and
Falkowski, 1993):
ϕmax = ηPSII σPSII ϕe f (a*ph R)-1 (1)
where σPSII is the effective absorption cross section of PSII (10-20m2 quanta-1); ϕe is the
maximum quantum yield of electron transport for O2 evolution in PSII (mol O2 (mol electron )-1);
R is the photosynthetic quotient (mol O2 (mol C)-1); ηPSII is the total number of PSII per unit of
chlorophyll (mol electron (mg Chl-a)-1); a*ph is the phototrophic plankton absorption
coefficient normalized to Chl-a (m2 (mg Chl-a)-1); f is the proportion of functional PSII reaction
centers, calculated as (Fv/Fm)/ 0.65. Equation 1 represent the different stages occurring during
photosynthesis light capture by the photosynthetic apparatus: the total number of photosynthetic
units and its absorption cross section, charge separation at the reaction center represented by the
proportion of active reaction centers and finally CO2 reduction by the electrons reduced during
light reactions represented by the maximum quantum yield of electron transport for O2 evolution
and the photosynthetic quotient. The ϕc is considered to be 0.25 O2 (electron)-1 for data at

82
irradiances lower than Ek (umol quanta m-2 s-1) (Kolber and Falkowski, 1993). R varies
depending to irradiances and on the type of nitrogen assimilated, being close to 1.4 in eutrophic
environments were nitrate is the principal nitrogen source, and close to 1 where ammonia is N
source. In this study most of the waters are consider to be based on N from ammonia as by the
evidence observed by Morell and Corredor (2001) on the photomineralization of dissolved
organic matter originated from the river plume.
3.3.4 FRRF based Primary Production
FRRF measurements of quantum yield were calculated according to the following
equation using the model developed by Kolber & Falkowski (1993) and adjusted by Melrose et
al. (2006):
PcB = I σPSII qp φe ƒ ηPSII / PQ (2)
PcB is the rate of carbon fixation normalized to chlorophyll a (Chl a) at irradiance I (μmol quanta
m–2 s–1). PQ is the photosynthetic quotient, and a typical value of 1.2 mol oxygen mol–1 carbon
was assumed. The functional absorption cross section of PSII is σPSII (Å2 quanta–1). A
conversion factor of 0.291409 was applied to the results of Eq. (2) to give the final productivity
results (in mg C mg–1 Chl-a h–1). This factor includes conversions for micromoles quanta to
moles quanta, moles Chl a to milligrams Chl a, quanta to moles quanta, square ångströms to
square meters, seconds to hours, and moles C to milligrams C. The ηPSII term in Eq. (2) is the
ratio of PSII reaction centers to Chl a (mol electrons mol–1 Chl a). This term cannot be measured
by the FRRF (Kolber et al., 1998, Suggett et al., 2001), nor can it easily be determined by other
means. This limitation also applied to the PPF technique used by Kolber & Falkowski (1993).
Their solution was to estimate the value of ηPSII by assuming a typical value for the western
North Atlantic of 0.002 mol electrons mol–1 Chl a (Kolber and Falkowski, 1993). The use of a
constant value for ηPSII introduces a potential source of error to the calculations of productivity.
Kolber and Falkowski (1993) suggest this value may vary by a factor of 3 in the oceans.
The qp term in Eq. (1) describes photochemical quenching, and can be expanded to:
qp = (Fm’ – F’) / (Fm – Fo) (3)
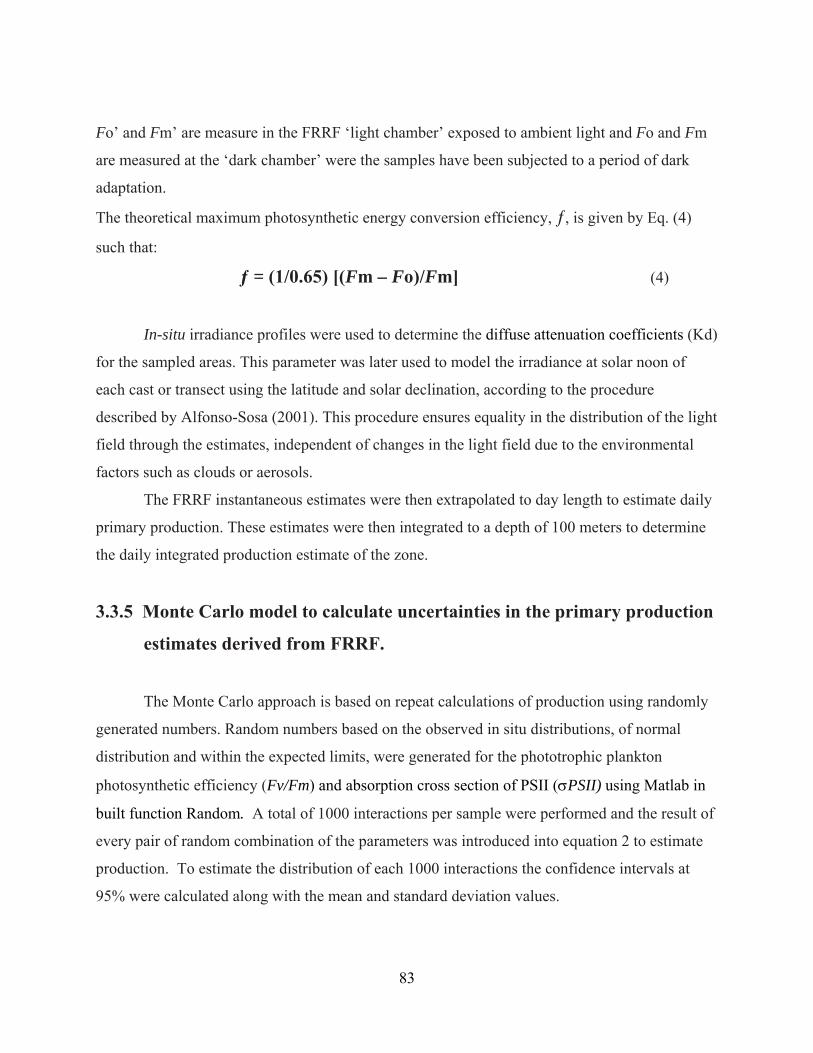
83
Fo’ and Fm’ are measure in the FRRF ‘light chamber’ exposed to ambient light and Fo and Fm
are measured at the ‘dark chamber’ were the samples have been subjected to a period of dark
adaptation.
The theoretical maximum photosynthetic energy conversion efficiency, ƒ, is given by Eq. (4)
such that:
ƒ = (1/0.65) [(Fm – Fo)/Fm] (4)
In-situ irradiance profiles were used to determine the diffuse attenuation coefficients (Kd)
for the sampled areas. This parameter was later used to model the irradiance at solar noon of
each cast or transect using the latitude and solar declination, according to the procedure
described by Alfonso-Sosa (2001). This procedure ensures equality in the distribution of the light
field through the estimates, independent of changes in the light field due to the environmental
factors such as clouds or aerosols.
The FRRF instantaneous estimates were then extrapolated to day length to estimate daily
primary production. These estimates were then integrated to a depth of 100 meters to determine
the daily integrated production estimate of the zone.
3.3.5 Monte Carlo model to calculate uncertainties in the primary production
estimates derived from FRRF.
The Monte Carlo approach is based on repeat calculations of production using randomly
generated numbers. Random numbers based on the observed in situ distributions, of normal
distribution and within the expected limits, were generated for the phototrophic plankton
photosynthetic efficiency (Fv/Fm) and absorption cross section of PSII (σPSII) using Matlab in
built function Random. A total of 1000 interactions per sample were performed and the result of
every pair of random combination of the parameters was introduced into equation 2 to estimate
production. To estimate the distribution of each 1000 interactions the confidence intervals at
95% were calculated along with the mean and standard deviation values.

84
3.3.6 Natural Fluorescence based Primary Production Optical data were acquired by a PRR-600 profiler spectroradiometer (Biospherical
Instruments Inc., San Diego) which can collect data at a maximum rate of 3 Hz. The instrument
can measure downwelling irradiance, Ed(λ,z), and upwelling radiance, Lu(λ,z), at six bands: 412,
443, 490, 510, 555, and 665 nm. In addition, it measures the downwelling photosynthetically
available radiation, Ed(PAR,z) and the upwelling radiance at 683 nm, Lu(683,z). The instrument
was equipped with temperature, pressure and tilt-roll sensors. A similar radiometer with identical
irradiance bands, the PRR-610, was located above sea surface at the highest point at the vessels,
to avoid shadows. The downwelling irradiance measurements were normalized to the surface
irradiance measurements on deck taken by a PRR-610 radiometer. This reduces the effect of
cloud interference during a cast. The data were binned to 1m intervals. From these data we
obtain the PAR diffuse attenuation coefficient profile, Kd(PAR,z).
The upwelling radiance measurements centered at 683 nm (10 nm bandwidth), Lu(683,z),
were used to estimate the natural fluorescence flux, Fƒ(z). The PAR downwelling irradiance
was converted to scalar irradiance multiplying it by a factor g = 1.3 (Morel, 1991). The Lu(683,z)
readings above the 6 m depth level were discarded due to a contribution by direct light and
elastic backscattering light. The equation used to estimate the natural fluorescence profile, Fƒ(z),
from the nadir radiance at 683 nm, Lu(683,z) and PAR comes from (Kiefer and Chamberlin,
1989)
Ff (z) = 4p 27Lu (683, z)× [k(PAR, z) + a(683, z)] (5)
where a(683,z) is the 683 nm absorption coefficient profile and Kd (PAR,z) is the attenuation
coefficient profile of the scalar irradiance, E0(PAR,z). The absorption coefficient for clear water
is 0.47 m-1 (Pope and Fry, 1997). The factor 27 in equation 5 comes from the fact that the total
fluorescence in the far red is 27 times higher than the emitted at the band centered at 683 nm.
To obtain the photosynthetic rate from natural fluorescence we use the
equation developed by Chamberlin et al. (1990),
Fc = Ff ___ kcf ϕrmax ___ (6) kcf Eo (PAR)

85
where kcf and ϕrmax are empirical constant and are the maximum value of the ratio of the
quantum yields of photosynthesis to fluorescence and irradiance at which this ratio is one–half
the maximum. A value of 4.0 carbon atoms per photon has been assigned to ϕrmax and for kcf
a value of 133 (mEm-2sec-1).
3.3.7 14C assimilation experiments
Measurements of photosynthetic parameters (PB max and αB) from the 14C method were
made during the cruise Oripex 7 in the P/E parameters were determined on water samples
collected from the surface mixed layer and deep chlorophyll maximum at dawn and incubated
with H14CO3 for 1 to 2 h in a light gradient cooled incubator. Carbon fixation rates were
normalized to chlorophyll concentration and P/E curves were fitted to the equations of Platt et al.
(1980)
3.3.8 Satellite Based Net Primary Production Estimates
3.2.8.1 Eppley-VGPM Net Primary Production (NPP) calculations
MODIS remotely acquired chlorophyll and temperature data were used to calculate the
Vertically Generalized Production Model (VGPM) (Behrenfeld and Falkowski, 1997a). The
VGPM is a "chlorophyll-based" model that estimates net primary production from chlorophyll
using a temperature-dependent description of chlorophyll-specific photosynthetic efficiency. The
Eppley-VGPM is a hybrid model that employs the basic model structure and parameterization of
the standard VGPM but replaces the polynomial description of Pb_opt with the exponential
relationship described by Morel (1991) and based on the curvature of the temperature-dependent
growth function described by Eppley (1972). The foundation of the Eppley-VGPM is that NPP
varies in a predictable manner with chlorophyll concentration (Chl a):
NPP = Chl-a Pb opt day length [0.66125 * par / ( par + 4.1 )] * zeu (7)

86
where Pb opt is the Maximum C fixation rate within a water column, mgC (mg Chl)-1 h-l; Chl-a is
the satellite estimated chlorophyll concentration; day length is the number of hours of day light
at the location of interest; [0.66125 * par / ( par + 4.1 )] is the light dependent term determined
empirically using thousands of field productivity measurements; and zeu is the euphotic depth
and is calculated using the Morel and Berthon (1989) Case I model. This model estimates zeu
from surface chlorophyll concentrations and is based on empirical equations to fit field data.
Pbopt reflects a correlation between sea surface temperature (SST) and photoacclimation; warmer
waters generally have shallower physiological surface mixing depths and higher incident PAR.
These conditions favor high-light acclimated phototrophic plankton, which requires less
chlorophyll to support photosynthetic requirements for growth. This lower chlorophyll
concentration gives rise to high chlorophyll-specific photosynthetic rates. In other words,
increasing Pb opt with increasing SST. The empirical model developed by Behrenfeld and
Falkowski (1997a) is parameterized from the observed relationship between median Pbopt and
temperature and is presented in eq. 7.
(8)
Pb opt = -3.27 X IO-8 T7 + 3.4132 X lO-6 T6 - 1.348 X 10⁻⁴ T5
+ 2.462 X 1 0 -3 T4 -0.0205 T3 + 0.0617 T2 + 0.2749 T + 1.2956.
MODIS level 1A products were downloaded from the NASA ocean color web portal
http://oceancolor.gsfc.nasa.gov/. These products were then process to level 2 to obtain Chl-a and
SST products. The images were processed using SeaWiFS Data Analysis System (SeaDAS)
version 5.1.

87
3.3.8.1 CbPM Net Primary Production (NPP) calculations
MODIS remotely acquire particle backscatter at 443 nm, chlorophyll and the vertical
attenuation coefficient at 490 nm data were used to obtain the Carbon-based Productivity Model
(CbPM) NPP calculations. The CbPM concept uses carbon biomass (C phyto) and growth rate (u)
instead of chlorophyll and Pbopt as previously used by the VGPM to estimate NPP. This is
based on the observation that that total particulate carbon concentration and Cphyto covary with
light scattering properties (Behrenfeld and Boss, 2003 and 2006b). With the above information
on surface phototrophic plankton carbon and growth rates, water column integrated NPP for the
currently employed CbPM is simply:
NPP = C u irradfunction zeu (9)
where C is the carbon biomass, and is obtained through the following relationship.
C = 13000 * (bbp - 0.00035) (10)
The C relationship was described by Behrenfeld 2005 et al. ( 2005) and comes from a regression
of monthly mean satellite-retrieved values of bbp(443) and Chl. The phototrophic plankton
growth rate (u) is obtained from the following relationship.
U = u(max) f(N,T) g(Ig) (11)
where the factor for the suppression of growth rate by nutrient and temperature stress is
f(N,T) = (Chl : C) observed / (Chl : C) max (12)
and the light limitation factor is calculated as follows from the
g(Ig) = 1 – exp(-3Ig) (13)
median mixed layer light level parameter.
Ig = irradiance / day lenght exp(-k490 * mix layer depth / 2.0) (14)
The chl to Carbon maxima is obtained through the following relationship,
(Chl : C) max = 0.022 + (0.045-0.022) * exp(-3.0 * Ig) (15)

88
and finally the euphotic depth at 1% light level is zeu is calculated using the Morel and Berthon
(1989) Case I model. This model estimates zeu from surface chlorophyll concentrations and is
based on empirical equations to fit field data.
3.3.9 Bio-optical data
3.3.9.1 Chlorophyll-specific absorption coefficient of phototrophic plankton
Particulate absorption samples were collected on 0.7 µm GF/F filters, which were
placed on a drop of distilled water and the absorption of the total particulate ap(λ)
(relative to a blank filter saturated with distilled water) was measured with Perkin Elmer Lambda
18 UV/VIS Spectrometer fitted with an integrating sphere. Methanol extractable pigments were
removed by slowly passing hot methanol through the filter pad (Roesler et al., 1989). The
absorption spectrum of this pad was measured to determine the detritus absorption coefficient,
ad(λ). Optical density measurements were divided by the geometrical path length (volume
filtered divided by clearance area of the filter) and multiplied by a factor of 2.3 (conversion
factor for transforming decimal logarithms to natural logarithms) to obtain the absorption
coefficient. The value of the absorption coefficient at 750 nm was subtracted from the values at
all other wavelengths, as a rudimentary correction for errors arising from scattering by the
phototrophic plankton cells. The measurements were corrected for path-length amplification, β
factor, using the method of Bricaud and Stramski (1990). The difference between the particulate
and detritus spectra, before and after the methanol extraction, is considered the in vivo
phototrophic plankton absorption, aph(λ). The pigment specific absorption coefficient of
phototrophic plankton , aph*(λ) was calculated by dividing absorption by the chlorophyll-a
concentration obtained fluorometrically.

89
3.3.9.1 Slope of normalized absorption curves
To evaluate changes in the shape of the aph spectra from 488 to 532 nm, we normalized
the absorption data to 676 nm. The slopes of the normalized absorption curves from 488 to 532
nm (Eisner et al., 2003) were computed as:
aph slope = (aph 488 - aph 532) (16)
(aph 676(488 - 532 nm))
The slope of the aph spectra from 490 to 530 nm (normalized to 676 nm) has been found
to be steeper in high-light compared to low-light adapted cultures (Johnsen et al., 1994). Such aph
spectral variations are due to physiological changes in cellular pigment ratios and pigment
packaging. Under high light, increases in photoprotective carotenoids, decreases in
photosynthetic carotenoids, and a reduction in pigment packaging may cause the aph spectral
slopes to become steeper, while the reverse is true for low-light conditions.
3.3.9.1 The 4th derivative analysis of absorption curves
Analysis of the absorption spectra of phototrophic plankton included a derivative analysis
to detect and determine quantitatively the position and intensity of weak absorption bands. The
derivative of a curve, simply its slope at a given point, provides information regarding the
convexity and concavity of a given absorption curve. It is useful for separating the secondary
absorption peaks and shoulders produced by algal pigments in regions of overlapping absorption.
The minima of the 2nd and the maxima of the 4th derivative occur close to or at wavelengths
where there are absorption peaks attributable to pigments. Bidigare et al. (1989) found that while
the spectrum for the 2nd derivative is very useful for qualitative identification of pigments, its
magnitude does not provide a reliable measure of the concentration of photosynthetic pigments.
This problem arises from the overlapping of pigments, that with a 4th derivative analysis was
found to be resolved providing better information on pigment peaks and concentration. For the
analysis herein a 4th derivative was performed following a Savitzky-Golay smoothing of 20
points.

90
3.4 Results
The FRRF based carbon fixation and 14 C estimates significantly correlated (r = 0.91, n=
9) with a the slope of 0.82 ( Figure 3.2a) . A series of field measurements performed during
Oripex 7 and Oripex 8 were used for this correlation. These measurements correspond to surface
samples obtained through a gradient from the area of the Gulf of Paria to samples close to the
island of Puerto Rico at station CaTS. Statistically the distribution of the estimates between the
methods showed FRRF values to be higher than the observed estimates for 14C. The minimum
and maximum observed estimates by 14C were 1.256 and 4.58 mg C/(mg chla hr ) for these
samples, FRRF estimates showed values that ranged from 1.33 to 4.70 mg C/(mg chla hr ). The
observed medians are 3.07 and 3.17 mg C/ (mg chla hr ) respectively. When analyzed by
geographical location (Figure 3.2b) the production estimates increased at latitudes close to the
origin of the Orinoco River plume. The correlation between 14C and its position against the
gradient from the plume origin showed a low negative relationship (r = -0.46), when compared to
latitude the FRRF estimates showed a lower relationship (r = 0.38).
Figure 3.2a. Primary production obtained from 14C incubations and Fast Repetition rate Fluorometry during Oripex 7. The correlation showed an r of 0.91.
1 2 3 4 5
1
2
3
4
5
14C
PbM
ax (m
gC/m
gChl
a/hr
)
FRRF Inst Prod (mgC/mgChla/hr)

91
Figure 3.2b. Primary production estimates from 14C and FRRF per sampled latitudes during Oripex 7, Oripex 8 and Cavortex 6. The correlation between 14C and sampled latitude showed an inverse relationship and a r of - 0.46.
The uncertainties of FRRF primary production estimates were tested using Monte Carlo
(MC) approximations (Figure 3.3, Table 3.1a, 3.1b). The variability in the estimates is rooted on
the complexity of the models and the different variables involved, in order to generate a level of
confidence in these production estimates, some estimate of error is needed. The estimates based
on FRRF and 14C were within the 95 % confidence intervals (CI) widths. The MC estimates
(Table 3.1a, 3.1b) based on 1000 interactions per sample displayed that the means of the FRRF
estimate and the MC approximation means varied from 1 % to 32% ; when correlated the means
showed a r = 0.85 at a P-value of 0.05 (n = 32) (Figure 3.4). The lowest error was observed for
the estimate was for the stations sampled during Oripex 7 at waters close to the Orinoco River
plume. Higher error was observed at stations sampled in blue waters. The highest confidence
interval difference was observed for the samples of CaTS and an inshore sample taken at the
dock of Magueyes Island on the south coast of Puerto Rico (CI ranged 0.835 to 12.402 and 2.89
and 12.32 respectively).
10 11 12 13 14 15 160
1
2
3
4
5
FRRF Inst Prod 14C PbMax
Prim
ary
Prod
uctio
n Es
timat
es [m
g C
(mg
chla
-1 h
r-1
)]
Latitude

92
Figure 3.3. Primary production obtained from of the Fast Repetition rate Fluorometry and Monte Carlo Simulations and 14C incubations. Confidence intervals show the extend of data distribution for Monte Carlo Simulations.
Phototrophic plankton bio-optical characteristics are summarized on Table 3.2. The
chlorophyll specific absorption coefficient increased from lower latitudes to higher latitudes
(Figure 3.5) but this relationship was moderately loose (r = 0.64). The highest chlorophyll
specific absorption coefficient in the data set was 0.166 m-1 and the lowest 0.022 m-1 with an
average of 0.089 m-1 The chlorophyll specific absorption coefficient at 440 showed values that
ranged 0.022 - 0.163 with a mean value of 0.09 m-1 . Waters closed to the river plume displayed
lower values of the absorption coefficient maxima than those at higher latitudes far from the
river influence. The highest chlorophyll concentration was observed at the lowest latitudes close
to the river plume also (Figure 3.6). An exponential relationship was observed between the
parameters (r= 0.64). The ratio of absorption coefficient at 676 to 440 also showed values higher
7s8c
2m 9 3m
9b 3m
9c 3m
10b 3
m10
c 3m
st3 s
muelle
0
2
4
6
8
10
12
Mean Production from Monte Carlo Simulations Lower Confidence Interval at 95% Higher Confidence Interval at 95% FRRF Inst Production 14C PbMax
Prim
ary
Prod
uctio
n (m
gC/m
gChl
a/hr
)
Sample

93
at the lowest latitudes with the highest 0.831 close to the river plume origin0.41) between the
parameters. The ratio of absorption coefficient at 676 to 440 also showed values higher at the
lowest latitudes with the highest 0.831 close to the river plume origin (Dragon’s Mouth between
Trinidad and Venezuela) the lowest (0.17) was observed in oceanic samples during Cavortex 6.

94
Table 3.1a. Summary of primary production estimates for surface samples during Oripex 7 and 8.
Station
Long
Lat
Kd PAR
Pmin from Monte
Carlo Simulations
Pmax from Monte
Carlo Simulations
Mean Production from Monte
Carlo Simulations
Standard Deviation
from Monte Carlo
Simulations
Variance from Monte
Carlo Simulations
Lower Confidence Interval at
95%
Higher Confidence Interval
at 95%
FRRF Estimated
Production
[mgC(mgChla)-1 hr1]
14C PbMax
[mgC(mgCh
la)-1 hr1]
Ori7 st7s
-61.68 10.80 0.31 2.57 5.26 3.85 0.63 0.39 2.60 5.08 3.17 3.87
Ori 7 st8c 2m
-61.66 10.83 0.36 1.98 3.86 2.87 0.43 0.18 2.03 3.71 2.03 2.91
Ori 7 9 3m
-61.88 12.03 0.10 0.77 2.22 1.422 0.32 0.11 0.78 2.06 1.86 2.09
Ori 7 9b 3m
-61.90 12.03 0.10 1.35 8.05 4.12 1.53 2.34 1.12 7.11 4.70 4.57
Ori 7 9c 3m
-61.90 12.03 0.10 2.09 8.06 4.89 1.57 2.47 1.80 7.96 3.51 3.07
Ori 7 10b 3m
-61.48 11.83 0.09 2.14 9.53 5.15 1.56 2.45 2.08 8.21 3.73 3.43
Ori 7 10c 3m
-61.50 11.81 0.09 0.23 5.38 2.32 1.26 1.58 0.14 4.78 1.38 1.78
Ori 8 st3 s
-62 14.10 0.18 1.50 3.93 2.58 0.56 0.32 1.47 3.68 1.32 1.25
Dock -67.04 17.96 0.11 2.90 12.32 6.87 2.12 4.49 2.71 11.02 3.46 3.32

95
Table 3.1b. Production estimates and Monte Carlo Simulation estimates for sampled stations across the Eastern Caribbean.
Station
&
Expedition
Pmin from Monte
Carlo Simulations
Pmax from Monte
Carlo Simulations
Mean Production from Monte
Carlo Simulations
Standard Deviation
from Monte Carlo
Simulations
Variance from Monte
Carlo Simulations
Lower Confidence Interval at
95%
Higher Confidence Interval at
95%
Quantum yield of Carbon Fixation
mol C (mol quanta)-1
FRRF Estimated
Production
mgC(mgChla)-
1 hr1
14C PbMax
mgC(mgChla)-
1 hr1
Oripex 7 7s 2.57 5.27 3.85 0.63 0.40 2.61 5.09 1.58 3.17 3.88
7 13m 0.05 0.09 0.07 0.01 0.00 0.05 0.09 1.38 0.04 -- 7 50m 0.01 0.02 0.02 0.00 0.00 0.01 0.02 0.75 0.02 -- 8 2m 2.92 6.23 4.49 0.74 0.55 3.03 5.94 1.98 2.89 --
8 48 m 0.28 0.53 0.40 0.07 0.00 0.27 0.53 1.72 0.23 -- 8b 2m 4.40 8.59 6.42 1.05 1.09 4.37 8.47 2.27 3.58 -- 8b 9m 2.82 4.79 3.78 0.51 0.26 2.77 4.78 2.01 3.14
8b 15 m 4.64 8.52 6.54 0.95 0.90 4.68 8.39 2.58 3.91 -- 8c 2m 1.98 3.86 2.87 0.43 0.18 2.03 3.71 -- 2.03 2.91 9 3m 0.77 2.22 1.42 0.33 0.11 0.78 2.06 0.48 1.87 2.09 9 40m 1.89 3.88 2.84 0.51 0.26 1.83 3.85 1.91 2.14 -- 9 70 m 0.48 0.70 0.59 0.05 0.00 0.49 0.69 1.59 0.44 -- 9b 3m 1.35 8.05 4.12 1.53 2.34 1.12 7.12 1.16 4.70 4.58
9b 25m 2.48 4.25 3.33 0.44 0.20 2.46 4.20 2.12 2.51 -- 9b 80m 0.08 0.15 0.11 0.02 0.00 0.08 0.14 1.28 0.09 -- 9c 3m 2.10 8.06 4.89 1.57 2.47 1.81 7.96 1.29 3.52 3.07 9c 30m 3.61 6.98 5.22 0.86 0.74 3.53 6.91 2.14 3.52 -- 9c 47 1.65 3.39 2.47 0.43 0.18 1.64 3.31 1.64 1.64 --
10b 3m 2.14 9.54 5.15 1.56 2.45 2.08 8.21 1.67 3.74 3.44 10 b dcm 2.46 4.16 3.30 0.47 0.22 2.38 4.22 2.29 2.26 -- 10c 3m 0.24 5.38 2.32 1.26 1.58 -0.14 4.79 1.09 1.38 1.79
10 c dcm 0.90 2.10 1.49 0.29 0.09 0.92 2.07 2.12 0.92 -- 0ripex 8
st3 s 1.50 3.93 2.58 0.56 0.32 1.48 3.68 -- 1.33 1.26 CaTS 0.84 12.40 5.07 2.60 6.73 0.01 10.16 -- 3.50 --
Magueyes Dock Muelle 12.32 6.87 2.12 4.49 2.72 11.03 -- 3.47 3.33 12.32
Cavortex 6 st3bs 2.65 1.37 0.45 0.20 0.48 2.25 1.33 2.23 -- 2.65 st4s 3.65 2.05 0.63 0.40 0.82 3.29 1.21 2.24 -- 3.65 st5s 3.28 2.13 0.52 0.27 1.11 3.15 1.45 2.96 -- 3.28 st6s 4.48 2.55 0.74 0.54 1.11 4.00 1.51 2.76 -- 4.48
ST16S 4.93 3.40 0.62 0.39 2.18 4.62 1.64 3.49 -- 4.93 ST17S 4.25 3.16 0.45 0.20 2.28 4.04 -- 3.51 -- 4.25 st21s 4.46 3.36 0.49 0.24 2.39 4.33 -- 2.82 -- 4.46

96
Figure 3.4. Primary production obtained from of the Fast Repetition rate Fluorometry and Monte Carlo Simulations. The correlation showed an r of 0.85 and n = 32.
Figure 3.5. Phototrophic plankton absorption coefficient maxima at sampled latitudes during Oripex 7, Oripex 8 and Cavortex 6. The correlation showed a direct relationship (r = 0.64).
0 2 4 6 8
0
2
4
6
FRR
F In
st P
rod
(mgC
/mgC
hla/
hr)
Mean Production from Monte Carlo Simulation (mgC/mgChla/hr)
10 12 14 160.00
0.05
0.10
0.15
0.20
aph
max
(m-1)
Latitude

97
Figure 3.6. Chlorophyll-a concentration at sampled latitudes during Oripex 7, Oripex 8 and Cavortex 6. The correlation showed an exponential relationship (r =0.83).
The slope of the specific absorption spectra displayed values that ranged from - 0.016 to
-0.0007 (Table 3.2). The highest slopes were observed at stations far from the influence of the
river plume, sampled during Cavortex 6 (Figure 3.7), indicating less packaging. When compared
to chlorophyll concentration the absorption slope demonstrated an exponential (r= 0.72)
relationship (Figure 3.8) with higher slopes observed at low chlorophyll concentrations. The
relationship of the slope with the absorption coefficient ratio 676/440 displayed an inverse
relationship (r= 0.83). The slope decreased with increasing ratio (Figure 3.9). An increase in the
ratio implies higher chlorophyll concentration. Similarly, the slopes also have the same
relationship with the quantum yield for carbon fixation. Although a low relationship was
observed (r= 0.48) the quantum yield was favorably affected when the absorption slopes
decreased (Figure 3.10). Lower slopes due to packaging are indicative of photosynthetically
active carotenoids (Eisner et. al., 2003), that in our case maybe favoring the quantum yield for
carbon fixation.
10 12 14 160.0
0.2
0.4
0.6
0.8
Chl
-a (m
g/l)
Latitude

98
Table 3.2 Phototrophic plankton Bio-optical characteristics and production estimates summary at the sampled stations.
Station
A674/443 A674/490 Average abs
Abs 412 Abs 440 Chl-a Fv/Fm σ PSII aph Slope aph max Quantum yield
FRRF Inst Prod
mgC(mgChla)-1
hr1
14C PbMax
mgC(mgChla)-1 hr1
Oripex 7 7s 0.60 0.98 0.03 0.06 0.07 0.34 0.45 501.63 -0.01 0.07 1.58 3.17 3.88
7 13m 0.45 0.55 0.04 0.07 0.08 0.37 0.50 435.81 -0.02 0.08 1.38 0.04 -- 7 50m 0.39 0.52 0.06 0.12 0.11 0.15 0.41 613.70 -0.02 0.12 0.75 0.02 -- 8 2m 0.59 0.89 0.03 0.06 0.06 0.29 0.47 501.64 -0.01 0.07 1.98 2.89 --
8 48 m 0.51 0.68 0.03 0.06 0.07 0.31 0.48 577.92 -0.02 0.07 1.72 0.23 -- 8b 2m 0.56 0.85 0.02 0.05 0.05 0.63 0.58 608.18 -0.01 0.05 2.27 3.58 -- 8b 9m 0.54 0.68 0.03 0.06 0.06 0.47 0.49 437.23 -0.02 0.07 2.01 3.14
8b 15 m 0.51 0.74 0.03 0.05 0.06 0.54 0.40 502.85 -0.02 0.06 2.58 3.91 -- 8c 2m -- -- -- -- -- -- 0.40 400.00 -- -- -- 2.03 2.91 9 3m 0.33 0.59 0.04 0.09 0.10 0.14 0.35 606.69 -0.03 0.10 0.48 1.87 2.09 9 40m 0.46 0.75 0.03 0.06 0.07 0.30 0.44 612.97 -0.02 0.07 1.91 2.14 -- 9 70 m 0.52 0.72 0.04 0.07 0.08 0.26 0.45 571.82 -0.02 0.08 1.59 0.44 -- 9b 3m 0.25 0.46 0.04 0.09 0.10 0.11 0.41 742.56 -0.04 0.10 1.16 4.70 4.58 9b 25m 0.51 0.72 0.03 0.07 0.07 0.28 0.53 483.77 -0.02 0.08 2.12 2.51 -- 9b 80m 0.38 0.46 0.06 0.10 0.13 0.06 0.55 775.79 -0.04 0.14 1.28 0.09 -- 9c 3m 0.27 0.52 0.04 0.10 0.11 0.11 0.41 571.37 -0.04 0.11 1.29 3.52 3.07
9c 30m 0.57 0.89 0.03 0.05 0.06 0.40 0.44 554.09 -0.02 0.07 2.14 3.52 -- 9c 47 0.44 0.61 0.03 0.07 0.09 0.33 0.46 656.43 -0.03 0.09 1.64 1.64 --
10b 3m 0.44 0.63 0.03 0.06 0.07 0.16 0.40 406.59 -0.02 0.07 1.67 3.74 3.44 10 b dcm
0.46 0.63 0.03 0.05 0.07 0.40 0.42 604.72 -0.03 0.07 2.29 2.26 --
10c 3m 0.38 0.65 0.05 0.11 0.11 0.07 0.47 570.91 -0.03 0.12 1.09 1.38 1.79 10 c dcm 0.43 0.60 0.03 0.06 0.08 0.32 0.45 612.96 -0.03 0.08 2.12 0.92 -- 11 surf 0.19 0.36 0.05 0.14 0.16 0.05 0.32 588.57 -0.05 0.17 0.78 -- -- 11 dcm 0.49 0.69 0.03 0.05 0.07 0.14 0.41 599.05 -0.03 0.07 2.12 -- --
Oripex 8 st 2 s 0.34 0.51 0.04 0.09 0.10 0.08 -- -- -0.04 0.10 -- -- --
St2 dcm 0.60 0.75 0.03 0.05 0.07 0.33 -- -- -0.02 0.07 -- -- -- st3 s 0.46 0.73 0.03 0.06 0.06 0.19 -- -- -0.02 0.07 -- 1.33 1.26 St6 s 0.42 0.58 0.03 0.06 0.07 0.25 -- -- -0.02 0.07 -- -- --
St6 dcm 0.48 0.59 0.03 0.06 0.07 0.16 -- -- -0.03 0.07 -- -- -- St 10 dcm
0.77 1.01 0.02 0.03 0.03 0.60 -- -- -0.01 0.03 -- -- --
St 13 s 0.75 1.04 0.01 0.02 0.03 0.42 -- -- -0.01 0.03 -- -- -- st4 -- -- -- -- -- -- -- -- -- -- -- 1.01 -- st8s 0.83 1.10 0.01 0.02 0.02 0.65 0.30 836.17 0.00 0.02 -- 2.38 --
CaTS -- -- -- -- -- -- -- -- -- -- -- 3.50 -- Muelle -- -- -- -- -- -- -- -- -- -- -- 3.47 3.33

99
Table 3.2 Continued
Station
&
Expedition
A674/443 A674/490 Average abs
Abs 412 Abs 440
Chl-a Fv/Fm σ PSII aph Slope aph max Quantum yield
FRRF Inst Prod mgC(mgCh
la)-1 hr1
14C PbMax
mgC(mgChla)-1 hr1
Cavortex 6 st2s 0.36 0.55 0.05 0.11 0.14 0.09 0.34 670.55 -0.03 0.14 -- -- --
st2dcm 0.49 0.60 0.05 0.08 0.10 0.27 0.34 604.94 -0.03 0.10 -- -- -- st3bs 0.34 0.60 0.03 0.07 0.09 0.07 0.42 280.47 -0.04 0.09 1.33 2.23 -- st4s 0.29 0.48 0.05 0.11 0.14 0.09 0.32 496.82 -0.04 0.15 1.21 2.24 --
st4dcm 0.49 0.59 0.05 0.09 0.11 0.21 0.53 586.14 -0.03 0.11 -- -- -- st5s 0.37 0.55 0.05 0.09 0.11 0.14 0.34 562.41 -0.03 0.11 1.45 2.96 --
st5dcm 0.48 0.61 0.04 0.06 0.09 0.19 0.54 509.03 -0.03 0.09 -- -- -- st6s -- -- -- -- -- -- -- -- -- -- 1.51 2.76 --
st6dcm 0.54 0.71 0.03 0.05 0.08 0.19 0.44 566.42 -0.02 0.08 -- -- -- st7s 0.17 0.33 0.04 0.07 0.13 0.14 0.33 573.24 -0.04 0.13 -- -- -- st8s 0.26 0.37 0.03 0.07 0.10 0.12 0.30 607.34 -0.06 0.10 -- -- --
st8bdcm 0.63 0.87 0.04 0.06 0.08 0.28 0.53 597.18 -0.02 0.08 -- -- -- st10s 0.47 0.64 0.03 0.06 0.08 0.13 -- -- -0.03 0.08 -- -- -- st12s 0.37 0.50 0.04 0.08 0.10 0.16 -- -- -0.03 0.10 -- -- -- st13d 0.53 0.72 0.05 0.08 0.10 0.30 -- -- -0.02 0.10 -- -- -- st15s 0.34 0.55 0.05 0.11 0.14 0.09 0.46 555.60 -0.03 0.14 -- -- -- st15d 0.60 0.72 0.04 0.05 0.08 0.21 0.48 636.74 -0.03 0.08 -- -- --
ST16S 0.45 0.74 0.03 0.07 0.09 0.11 0.38 527.63 -0.03 0.09 1.64 3.49 -- ST16D 0.59 0.68 0.04 0.05 0.07 0.28 0.61 453.29 -0.03 0.08 -- -- -- ST17S 0.32 0.56 0.05 0.11 0.15 0.15 0.41 442.88 -0.03 0.15 -- 3.51 -- ST17D 0.54 0.68 0.05 0.08 0.10 0.27 0.59 466.72 -0.03 0.11 -- -- -- st21s -- -- -- -- -- -- -- -- -- -- -- 2.82 --
ST21D 0.36 0.65 0.06 0.12 0.16 0.25 0.54 509.57 -0.03 0.16 -- -- -- ST23S 0.32 0.50 0.03 0.05 0.10 0.09 -- -- -0.04 0.10 -- -- -- ST23D 0.54 0.64 0.04 0.07 0.09 0.27 -0.03 0.09 -- -- --

100
Figure 3.7. The absorption slope at sampled latitudes during Oripex 7, Oripex 8 and Cavortex 6. The correlation showed an inverse relationship (r =-0.66).
Figure 3.8 The slope of absorption spectra and chlorophyll relationship through the sampled areas.
The slope denotes the physiological changes in cellular pigment ratios and pigment packaging. The
correlation between both parameters showed a r of 0.72.
10 12 14 16
-0.04
-0.02
0.00ap
h Sl
ope
(m-1)
Latitude
0.0 0.2 0.4 0.6-0.07
-0.06
-0.05
-0.04
-0.03
-0.02
-0.01
0.00
aph
Slop
e (m
-1)
Chl-a (mg/l)
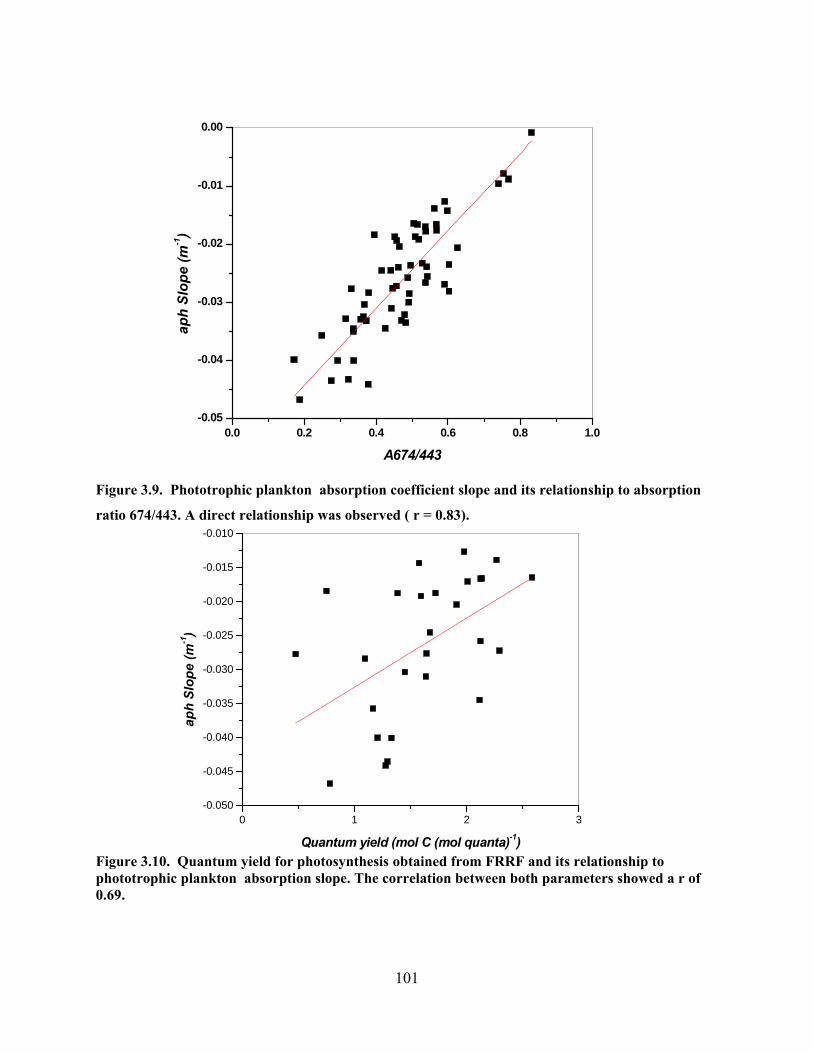
101
Figure 3.9. Phototrophic plankton absorption coefficient slope and its relationship to absorption
ratio 674/443. A direct relationship was observed ( r = 0.83).
Figure 3.10. Quantum yield for photosynthesis obtained from FRRF and its relationship to phototrophic plankton absorption slope. The correlation between both parameters showed a r of 0.69.
0.0 0.2 0.4 0.6 0.8 1.0-0.05
-0.04
-0.03
-0.02
-0.01
0.00
aph
Slop
e (m
-1)
A674/443
0 1 2 3-0.050
-0.045
-0.040
-0.035
-0.030
-0.025
-0.020
-0.015
-0.010
aph
Slop
e (m
-1)
Quantum yield (mol C (mol quanta)-1)

102
The quantum yield for carbon fixation based on FRRF measurements, also covaried
inversely with the specific absorption maxima, decreasing as the absorption increased (r= 0.77)
(Figure 3.11). On the contrary, when related to the absorption coefficient ratio 676/440, it
displayed a positive correlation increasing with the ratio (r = 0.70) (Figure 3.12). It also
increased with chlorophyll concentration resulting in a similar positive correlation (r= 0.71)
(Figure 3.13).
Figure 3.11. Quantum yield for photosynthesis obtained from FRRF and its relationship to phototrophic plankton absorption maxima. The correlation between both parameters showed a r of 0.77.
A fourth derivative analysis of sea surface samples denoted the absorption peaks for
chlorophyll-a and accessory pigments (Figures 3.14 and 3.15). In general the samples show
consistent peaks around the areas typical for chlorophyll absorption, around 440 nm and 676 nm.
Accessory pigments regions denoted pigments peaks at around 467, 490,536, 585 and 636
among others. The region of 467 has been previously related to the pigment chlorophyll-c,
fucoxanthin and other xanthophylls (Aguirre-Gomez et al, 2001; Bidigare et al, 1988;
0 1 2 30.00
0.05
0.10
0.15
0.20
aph
max
(m-1)
Quantum yield (mol C (mol quanta)-1)

103
Figure 3.12. Quantum yield for photosynthesis obtained from FRRF and its relationship to
phototrophic plankton absorption ratio 674/443. The correlation between both parameters showed
a r of 0.70.
Figure 3.13. Quantum yield for photosynthesis obtained from FRRF and its relationship to chlorophyll concentration during the study. The correlation between both parameters showed a r2 of 0.51.
0 1 2 30.0
0.2
0.4
0.6
A67
4/44
3
Quantum yield (mol C (mol quanta)-1)
0.0 0.5 1.0 1.5 2.0 2.5 3.00.0
0.2
0.4
0.6
Chl
-a (m
g/l)
Quantum yield (mol C (mol quanta)-1)

104
Millie et al. 1997). The 490 nm peak is related to areas of absorption by carotenoids. Hoepffner
and Sathyendranath (1991) concluded that the peaks found at 489 and 536 may correspond to a
mixture of carotenes and xanthophylls rather than to separate groups. The region between 530-
555 may be attributed also to fucoxanthin (Aguirre-Gomez et al, 2001). The region of 636 nm
has been related with chlorophyll c and b (Bidigare, 1990). In general different regions show
distinct derivative absorption peaks, those close to the river front (the Dragon’s Mouth) differing
from those far into the Caribbean (Figures 3.14 and 3.15) These spectra comprise the sum of the
spectra of all natural phototrophic plankton populations present thus making it difficult to
attribute the observed spectra to a single taxonomic group. Flow cytometry analysis of Cavortex
6 samples showed oceanic populations to be comprised mainly by Prochlorococcus spp. These
populations are characterized by the presence of the chemotaxonomic markers divinyl
chlorophyll-a (Chl-a2) and divinyl chlorophyll-b (Chl-b2 (Goerike and Repettla, 1993). The
absorption peaks of these pigments in acetone are 442, 622 and 668 for Chl-a2, and 478, 602 and
658 for Chl-b2 (Goerike and Repetta, 1993). In our case absorption by Chl-a2 is part of the total
Chl-a absorption peak, Absorption peaks close to 622 are observed in the Cavortex 6 samples.
the 668 peak is probably expressed with the observed 670 nm peaks. The 602 nm peak of Chl-b2
is observed in some of these samples. Analysis of pigments through HPLC performed by Helena
Antoun (personal communication) for of the samples stations confirm the presence of divinyl
chlorophyll-a during Cavortex 6. She also reports the presence of the photoprotective carotenoid
(PPC) diadinoxanthin in some of the stations (for Cavortex 6 and Oripex 8) both at surface and
at deep chlorophyll maximum denoting stress due to high irradiances. The pigments zeaxanthin
and B-Carotene were also present at all stations. These pigments along with violaxanthin and
alloxanthin, comprise the pigments associated with the xanthophylls cycle that protects the
photosynthetic apparatus during exposure and high irradiances. The photosynthetic carotenoids
(PSC) involved in the assimilation of energy for photosynthesis are peridinin, fucoxanthin, 19'-
hexanoyloxyfucoxanthin and19'-butanoyloxyfucoxanthin.She reports a gradual increase in the
PSC fucoxanthin from open ocean waters toward the highest concentrations close to the Gulf of
Paria.

105
400 450 500 550 600 650 700-0.0000003
-0.0000002
-0.0000001
0.0000000
0.0000001
0.0000002
0.0000003
514 570 593640
Wavelenght (nm)
4th
deriv
ativ
e of
nor
mal
ized
phy
topl
akto
n ab
sorp
tion
spec
tra
West Grenada
440
463492 540
672
400 450 500 550 600 650 700
-0.0000002
-0.0000001
0.0000000
0.0000001
0.0000002
0.0000003
582 605
674
634
565
536
514
487
460
4th
deriv
ativ
e of
nor
mal
ized
phy
topl
akto
n ab
sorp
tion
spec
tra
Wavelenght (nm)
South East Grenada
432
400 450 500 550 600 650 700
-0.0000005
0.0000000
0.0000005
0.0000010
Chl-c Chl-c and b
Chla
fucoxanthin, xanthophylls,B-carotene
chl-c, carotenoids (fucoxanthin, xanthophylls)
555 614512
674
636
585534490
465
Dragons Mouth
4th
deriv
ativ
e of
nor
mal
ized
phy
topl
akto
n ab
sorp
tion
spec
tra
Wavelenght (nm)
437
Chla
Figure 3.14 Fourth derivative analysis of phototrophic plankton absorption spectra at surface for stations sampled during Oripex 7.

106
400 450 500 550 600 650 700-0.0000006
-0.0000004
-0.0000002
0.0000000
0.0000002
0.0000004
0.0000006
0.0000008
590
670
505 612578 628 642
551525488
467
Wavelenght (nm)
4th
deriv
ativ
e of
nor
mal
ized
phy
topl
akto
n ab
sorp
tion
spec
tra
Station 17s
440
400 450 500 550 600 650 700-0.000004
-0.000003
-0.000002
-0.000001
0.000000
0.000001
0.000002
0.000003
0.000004
0.000005
Wavelenght (nm)
4th
deriv
ativ
e of
nor
mal
ized
phy
topl
akto
n ab
sorp
tion
spec
tra
604540 625580
672
642520465
448
492
430
Station 21s
400 450 500 550 600 650 700-0.0000004
-0.0000002
0.0000000
0.0000002
0.0000004
0.0000006
626
Wavelenght (nm)
4th
deriv
ativ
e of
nor
mal
ized
phy
topl
akto
n ab
sorp
tion
spec
tra
602
490
671
641580552518
467
Station 12s
440
400 450 500 550 600 650 700-0.0000003
-0.0000002
-0.0000001
0.0000000
0.0000001
0.0000002
0.0000003
0.0000004
594 617567
670
542 637520
490
Wavelenght (nm)
4th
deriv
ativ
e of
nor
mal
ized
phy
topl
akto
n ab
sorp
tion
spec
tra average Stations 3-4
447
Figure 3.15. Fourth derivative analysis of phototrophic plankton absorption spectra at surface for stations sampled during Cavortex 6.

107
Table 3.3. Satellite derived Net Primary Production estimates through VGPM and CbPM models during Oripex 8.
Longitude Latitude MODIS VGPM
(Mg C m-2 d-1)
Log Transformed
MODIS VGPM (1km)
(Mg C m-2 d-1)
FRRF Modeled
NPP (Mg C m-3 d-1)
Log Transformed FRRF NPP
(Mg C m-2 d-1)
MODIS CbMP NPP
(Mg C m-2 d-1)
Log Tansformed CbPM npp
(Mg C m-2 d-1)
1 -67.01 17.61 175.98 2.25 186.94 2.27 75.21 1.88 2 -66.96 17.58 182.26 2.26 146.82 2.17 79.50 1.90 3 -66.93 17.57 181.54 2.26 169.01 2.23 77.96 1.89 4 -66.92 17.56 182.81 2.26 183.32 2.26 79.47 1.90 5 -66.90 17.54 185.40 2.27 227.61 2.36 79.73 1.90 6 -66.89 17.54 185.40 2.27 190.03 2.28 79.73 1.90 7 -66.83 17.51 192.19 2.28 138.42 2.14 83.22 1.92 8 -66.80 17.49 201.87 2.31 200.78 2.30 82.23 1.92 9 -66.76 17.47 204.52 2.31 211.65 2.33 83.31 1.92
10 -66.67 17.42 260.66 2.42 236.39 2.37 96.23 1.98 11 -66.57 17.37 234.84 2.37 192.15 2.28 93.21 1.97 12 -66.51 17.33 249.63 2.40 186.60 2.27 95.17 1.98 13 -66.40 17.27 232.27 2.37 187.18 2.27 96.10 1.98 14 -66.36 17.25 243.55 2.39 222.85 2.35 101.51 2.01 15 -66.32 17.23 252.29 2.40 187.77 2.27 105.38 2.02 16 -66.30 17.22 251.72 2.40 250.34 2.40 108.42 2.04 17 -66.26 17.20 250.02 2.40 166.46 2.22 104.86 2.02 18 -66.25 17.19 237.95 2.38 231.63 2.36 95.86 1.98 19 -66.23 17.18 218.94 2.34 252.87 2.40 91.61 1.96 20 -66.22 17.17 218.94 2.34 308.16 2.49 91.61 1.96 21 -62.60 14.85 585.16 2.77 570.09 2.76 268.29 2.43 22 -62.59 14.84 585.16 2.77 268.57 2.43 268.29 2.43 23 -62.58 14.82 586.64 2.77 250.07 2.40 276.24 2.44 24 -62.57 14.81 608.71 2.78 305.85 2.49 271.84 2.43

108
Longitude Latitude MODIS VGPM
(Mg C m-2 d-1)
Log Transformed
MODIS VGPM (1km)
(Mg C m-2 d-1)
FRRF Modeled
NPP (Mg C m-3 d-1)
Log Transformed FRRF NPP
(Mg C m-2 d-1)
MODIS CbMP NPP
(Mg C m-2 d-1)
Log Tansformed CbPM npp
(Mg C m-2 d-1)
25 -62.56 14.80 604.34 2.78 317.94 2.50 261.45 2.42 26 -62.56 14.79 604.34 2.78 377.60 2.58 261.45 2.42 27 -62.55 14.78 613.48 2.79 465.16 2.67 285.64 2.46 28 -62.54 14.77 601.64 2.78 499.36 2.70 291.89 2.47 29 -62.53 14.76 601.16 2.78 493.86 2.69 270.11 2.43 30 -62.52 14.75 601.16 2.78 540.11 2.73 270.11 2.43 31 -62.51 14.74 580.26 2.76 544.89 2.74 260.87 2.42 32 -62.50 14.72 544.66 2.74 469.55 2.67 234.31 2.37 33 -62.36 14.55 528.05 2.72 440.72 2.64 295.47 2.47 34 -62.34 14.53 470.57 2.67 488.79 2.69 277.18 2.44 35 -62.25 14.41 219.32 2.34 236.70 2.37 215.20 2.33 36 -62.24 14.39 187.86 2.27 243.50 2.39 205.07 2.31 37 -62.19 14.34 191.22 2.28 230.70 2.36 199.52 2.30 38 -62.15 14.29 295.91 2.47 217.59 2.34 218.84 2.34 39 -62.12 14.25 418.68 2.62 218.20 2.34 255.61 2.41 40 -62.09 14.22 513.69 2.71 245.66 2.39 255.61 2.41 41 -62.08 14.19 821.70 2.91 280.72 2.45 255.61 2.41 42 -62.05 14.16 1404.66 3.15 241.28 2.38 255.62 2.41 43 -62.03 14.14 1500.01 3.18 344.82 2.54 422.21 2.63 44 -62.00 14.14 -- -- 506.68 2.70 210.90 2.32 45 -61.99 14.14 -- -- 311.44 2.49 210.90 2.32 46 -61.97 14.14 -- -- 175.47 2.24 208.97 2.32 47 -61.92 14.14 -- -- 324.78 2.51 208.47 2.32 48 -61.90 14.15 562.08 2.32 195.84 2.29 208.47 2.32 49 -61.85 14.15 483.22 2.34 205.91 2.31 208.47 2.32 50 -61.79 14.16 531.62 2.37 212.28 2.33 213.95 2.33

109
Table 3.3. Continued.
Samples
Longitude Latitude MODIS VGPM
(Mg C m-2 d-
1)
Log Transformed
MODIS VGPM (1km) (Mg C m-2 d-1)
FRRF Modeled NPP (Mg C m-3 d-1)
Log Transformed FRRF NPP
(Mg C m-2 d-1)
MODIS CbMP NPP
(Mg C m-2 d-1)
Log Tansformed CbPM npp
(Mg C m-2 d-1)
51 -61.75 14.16 534.63 2.38 218.39 2.34 218.02 2.34 52 -61.73 14.16 509.14 2.37 286.96 2.46 223.14 2.35 53 -61.71 14.16 509.14 2.37 108.37 2.03 223.14 2.35 54 -61.67 14.17 506.28 2.39 227.60 2.36 220.34 2.34 55 -61.63 14.17 563.85 2.42 308.94 2.49 245.74 2.39 56 -61.59 14.17 665.37 2.49 495.17 2.69 307.51 2.49 57 -61.57 14.18 713.64 2.51 290.70 2.46 328.82 2.52 58 -61.54 14.18 818.31 2.54 623.26 2.79 327.79 2.52 59 -61.51 14.18 798.13 2.52 430.77 2.63 403.02 2.61 60 -61.48 14.19 603.72 2.41 201.47 2.30 246.23 2.39 61 -61.45 14.19 445.51 2.28 117.36 2.07 158.51 2.20 62 -61.00 12.74 214.71 2.33 362.63 2.56 83.28 1.92 63 -61.01 12.73 214.71 2.33 188.98 2.28 83.28 1.92 64 -61.01 12.72 210.15 2.32 416.38 2.62 83.20 1.92 65 -61.01 12.71 210.15 2.32 193.22 2.29 83.20 1.92 66 -61.01 12.70 210.15 2.32 189.19 2.28 83.20 1.92 67 -61.02 12.69 202.21 2.31 127.38 2.11 79.68 1.90 68 -61.02 12.68 193.58 2.29 312.25 2.49 79.85 1.90 69 -61.02 12.67 191.64 2.28 235.41 2.37 79.86 1.90 70 -61.02 12.66 193.42 2.29 291.50 2.46 79.06 1.90 71 -61.03 12.64 193.42 2.29 212.36 2.33 79.06 1.90 72 -61.03 12.63 193.63 2.29 379.66 2.58 83.53 1.92 73 -61.03 12.62 193.63 2.29 179.86 2.25 83.53 1.92 74 -61.04 12.61 195.24 2.29 257.12 2.41 87.74 1.94 75 -61.04 12.60 195.24 2.29 266.59 2.43 87.74 1.94 76 -61.04 12.59 194.70 2.29 234.61 2.37 92.01 1.96 77 -61.04 12.58 194.70 2.29 152.12 2.18 92.01 1.96 78 -61.05 12.57 190.66 2.28 260.52 2.42 91.03 1.96 79 -61.05 12.55 190.66 2.28 231.91 2.37 91.03 1.96 80 -61.05 12.54 189.88 2.28 300.58 2.48 92.05 1.96 81 -61.15 12.16 220.40 2.34 149.41 2.17 171.96 2.24 82 -61.15 12.16 220.40 2.34 226.23 2.35 171.96 2.24 83 -61.15 12.14 220.50 2.34 256.74 2.41 174.21 2.24

110
Satellite derived primary production estimates
Satellite derived production estimates based on the vertically generalized
production model (VGPM) from MODIS level 3 products resulted in estimates that
displayed some degree of correlation (r= 0.51, n = 18) (Figure 3.16) with FRRF daily
integrated estimates obtained from transects sampled during Oripex 8. MODIS level 2
products of temperature and chlorophyll concentration (Figures 3.17 and 3.18
respectively) were then used to create higher resolution VGPM estimates at a 1 km
resolution. These new estimates when analyzed against FRRF measurements also showed
low correlations (r= 0.46, n= 83) ( Figure 3.19). Carbon based production (CbMP)
estimates were performed from MODIS level 3 data, these estimates also demonstrated
low correlation with in situ FRRF estimates (r= 0.40, n= 18) (Figure 3.20). When
MODIS level 2 data (bbp 553, Chlorophyll concentration and K 490) was used the
estimates correlation increased (Figure 3.21) (r= 0.55, n= 83). The VGPM and CbPM
estimates showed a high degree of correlation (r= 0.84, n= 83) (Figure 3.22) ,
demonstrating a 30 % error between these estimates. Lower estimates were observed for
CbPM (a minimum value 75 mg C m-2 d-1) than the other estimates (Table 3.3).
Observed average NPP was 173 mg C m-2 d-1 compared to 279 mg C m-2 d-1 and 378 mg
C m-2 d-1 for FRRF based and VGPM respectively. The observed standard deviation was
greater for the VGPM ( 250 mg C m-2 d-1) and lower for CbPM (90 mg C m-2 d-1); 123
mg C m-2 d-1 for FRRF. These satellite estimates when analyzed against geographical
position (Figure 3.23, eg. CbPM) were observed to vary accordingly with the river
plume front, lower production estimates for all the models agree with waters out of the
influence of the river front (Figure 24). The highest values are observed for data sampled
around the latitude 14˚ close to the islands of St Lucia and Martinique. Lower values
were observed for the transect close to the island of Puerto Rico at latitude 17˚, and those
of clear blue waters off the eastern coast of the island Grenada at latitude 12˚( Table 3.3).

111
Figure 3.16 Modeled net primary production from remote sensed data (MODIS) and in-situ measurements from FRRF. The correlation between both parameters showed a r2 of 0.51. Figure 3.17. MODIS aqua Chlorophyll level 2 product for September 20, 2006.
2.0 2.2 2.4 2.6 2.8 3.0
2.4
2.6
2.8
3.0
Log
10 T
rans
form
ed M
OD
IS N
PP (V
GPM
Mod
el) (
mg
C m
-2 d
-1)
Log 10 Transformed FRRF NPP (mg C m-3 d-1)

112
Figure 3.18 MODIS Aqua SST level 2 product for September 20, 2006.
Figure 3.19 Modeled net primary production from remote sensed data (MODIS) at a 1 km resolution and in-situ measurements from FRRF. The correlation between both parameters showed a r of 0.46 with an n= 83.
2.0 2.5 3.02.0
2.5
3.0
3.5
Log
10 T
rans
form
ed M
OD
IS V
GPM
(1km
) (m
g C
m-2 d
-1)
Log 10 Transformed FRRF NPP (mg C m-3 d-1)

113
Figure 3.20 Carbon based modeled net primary production from MODIS level 3 remote sensed data and in-situ measurements from FRRF. The correlation between both parameters showed a r of 0.40, n= 18.
Figure 3.21 Carbon based modeled net primary production from MODIS level 2 remote sensed data and in-situ measurements from FRRF. The correlation between both parameters showed a r of 0.55, n= 83. The correlation for the observed low values is r = 0.32 and for the observed higher values is r = 0.51.
2.0 2.2 2.4 2.6 2.8 3.0
2.6
2.7
2.8
Log
Tran
sfor
med
MO
DIS
CbP
M (m
g C
m-2 d
-1)
Log 10 Transformed FRRF NPP (mg C m-3 d-1)
100 200 300 400 500 600 700
50
100
150
200
250
300
350
400
450
MO
DIS
CbM
P np
p (m
g C
m-2 d
-1)
FRRF Modeled NPP (mg C m-3 d-1)

114
Figure 3.22 Carbon based and VGPM modeled net primary production from MODIS level 2 remote sensed data . The correlation between both parameters showed a r2 of 0.84, n=83.
Figure 3.23. Carbon based modeled net primary production from MODIS level 2 remote sensed data per latitude.
0 200 400 600 800 1000 1200 1400 1600
50
100
150
200
250
300
350
400
450
MO
DIS
CbM
P np
p (m
g C
m-2 d
-1)
MODIS VGPM (mg C m-2 d-1)
50
100
150
200
250
300
350
400
450
12 14 16 18
Latitude
MO
DIS
CbM
P np
p (m
g C
m-2 d
-1)
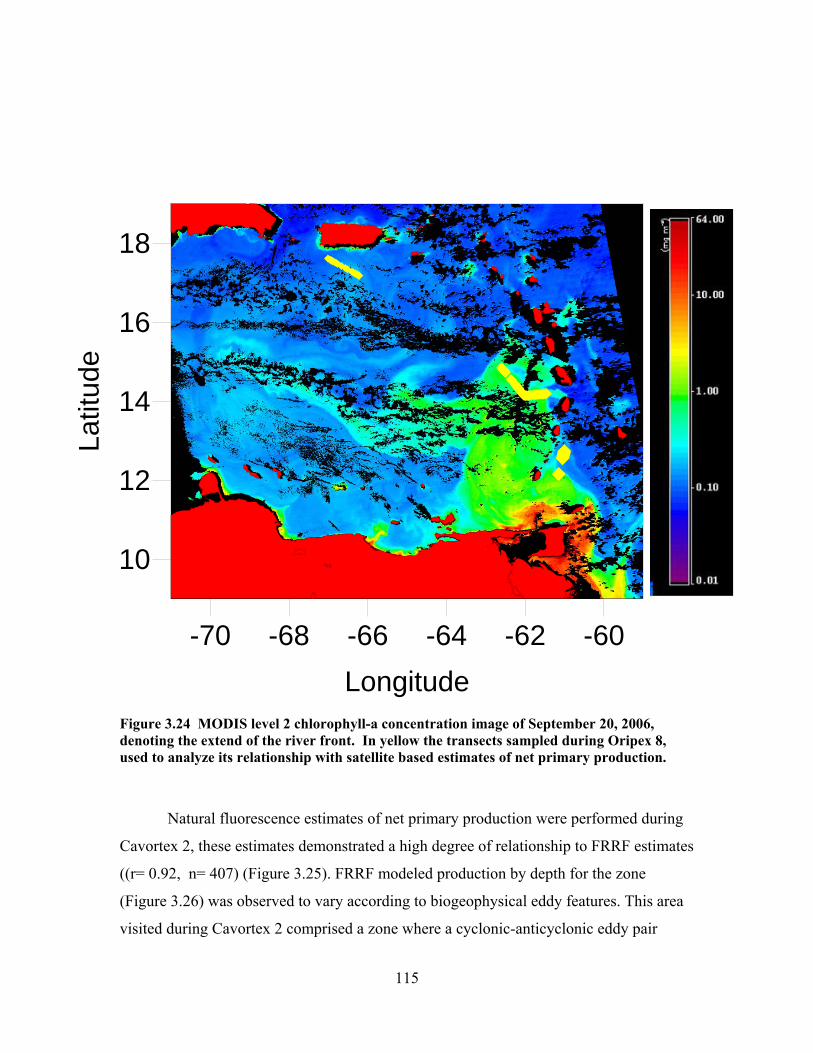
115
-70 -68 -66 -64 -62 -60Longitude
10
12
14
16
18
Latit
ude
Figure 3.24 MODIS level 2 chlorophyll-a concentration image of September 20, 2006, denoting the extend of the river front. In yellow the transects sampled during Oripex 8, used to analyze its relationship with satellite based estimates of net primary production.
Natural fluorescence estimates of net primary production were performed during
Cavortex 2, these estimates demonstrated a high degree of relationship to FRRF estimates
((r= 0.92, n= 407) (Figure 3.25). FRRF modeled production by depth for the zone
(Figure 3.26) was observed to vary according to biogeophysical eddy features. This area
visited during Cavortex 2 comprised a zone where a cyclonic-anticyclonic eddy pair

116
interacted. The cyclonic portion had a center ( Figure 3.27) close to longitude 66.38 W
and was sampled at station 3. This portion showed the highest FRRF net integrated
primary production estimated at 426 mg C m-3 d-1 while the natural fluorescence based
integrated modeled production reported 60 mg C m-3 d-1. Comparable net primary
production was observed at the center of the anti-cyclonic area sampled during station 6.
with FRRF based NPP of 413 mg C m-3 d-1 and natural fluorescence based NPP of 68 mg
C m-3 d-1. The lowest integrated production in the region was observed for station 5
localized in the area of interaction between eddies with FRRF based integrated NPP of
165 mg C m-3 d-1 and 47 mg C m-3 d-1 for natural fluorescence.
Satellite acquired diffuse attenuation coefficient at 490nm (K490) obtained from
MODIS Aqua (Figure 3.28) denotes higher attenuation in waters under the influence of
the river plume during Oripex 8. Higher attenuation is observed for stations sampled
during the transect of September 20. In-situ attenuations coefficients for the station
sampled during Oripex 7 ( Table 1) show higher light attenuation for stations closer to the
Dragon’s Mouth.
Figure 3.25. Primary production obtained from of Fast Repetition rate Fluorometry and its relation to natural fluorescence derived production during Cavortex 2. The correlation showed an r of 0.92.
0.0 0.2 0.4 0.6 0.8 1.0 1.2
0.00
0.02
0.04
0.06
0.08
0.10
0.12
0.14
FRRF based Carbon fixation ( mg C mg-1 chl-a h-1)
Nat
ural
Flu
ores
cenc
e
base
d c
arbo
n Fi
xatio
n (m
g C
m-3
hr-1
)

117
-75 -73 -71 -69 -67 -65 -63 -61 -59 -57 -55Longitude
Cavortex 2
10
12
14
16
18
20
Latit
ude
-24-22-20-18-16-14-12-10-8-6-4-2024681012141618
ST1 ST3
ST2ST5
ST4ST6
ST7
Figure 3.26. Modeled net primary production from FRRF-based measurements during Cavortex 2 through an eddy pair.
Figure 3.27. Sampled stations and transect during Cavortex 2 over Jason sea surface anomaly obtained from AVISO live access server (LAS). These altimeter products were produced by Ssalto/Duacs and distributed by Aviso, with support from Cnes.

118
Figure 3.28. MODIS Aqua derived diffuse attenuation coefficient at 490 nm (kd490) for sampled stations from transects during Oripex 8.
12 14 16 180.00
0.05
0.10
0.15
k490
Latitude

119
3.5 Discussion FRRF-based Productivity estimates vs 14C
FRRF-based productivity estimates produced a strong linear relationship with
independent measurements of 14C for data collected throughout the Eastern Caribbean
Sea. The observed slope (0.82) ranged within those reported by Melrose et al. (2006)
ranging between 0.23 and 1.04. The squared correlation coefficient (r= 0.91) for our data
set compares favorably to those observed elsewhere. It is comparable to the ones
reported by Kolber and Falkowski (1993)( r= 0.93) and Melrose et al. (2006)( r > 0.95);
and better than that observed by Sugget et al. (2003)( r= 0.77). These observations are
considerably close, even within the sources of uncertainties associated with estimates by
FRRF owing to the biogeochemical variability throughout the areas sampled. The sources
of uncertainties in FRRF measurements include the taxon-related variability in the
photosynthetic efficiency (Fv/Fm) parameter as it changes with species assemblages
(Corno et al., 2008; Koblizˇek et al. 2001). The Fv/Fm ratio has been used to diagnose
nutrient limitation in natural waters but it has been found not to be a robust diagnostic
indicator in culture experiments (Parkhill et al., 2001). In steady, low nutrient conditions,
cells adapted and exhibited a high Fv/Fm ratio while growth remained low. In cultures,
the Fv/Fm was low only when the cells were subject to short term nutrient starvation.
This would cause the Kolber & Falkowski (1993) model to detect changes in the growth
rates of cells acclimated to low nutrient zones. Furthermore, another problem present is
the signal originated by phaeophytin. Phaeophytin is produced when Chl-a is digested by
grazers, such as zooplankton. If the quantity of phaeophytin accounts for more than 30%
of the total pigment present in a sample, it will lead to a reduction in the measured Fv/Fm
ratio, and an underestimation of primary productivity (Fuchs et al., 2002). Similarly to
Fv/Fm, the absorption cross section of photosystem II (σPSII) also exhibits intrinsic
variations as a function of light, nutrients, temperature and species composition that
ultimately will affect the production estimates. The rate of PSII reaction centers closure
per absorbed photon of light, as determined by σPSII, is a measure of the ‘‘functional
size’’ of the pigment antenna or an index of its ability to close the functional reaction
centers. While a large σPSII value means large antenna relative to a small number of PSII

120
reaction centers (such as under nutrient depletion), a small σPSII value corresponds to a
small antenna relative to a large number of PSII reaction centers (typical of high nutrient
availability; Kolber and Falkowski 1993). Despite these uncertainties, our estimates are
similar to those observed by the 14C method. This method, although considered here as
reference value for production estimates, is itself subject to errors. Some potential
sources of error, for instance, are the contamination of samples with trace metals or
nutrients; and the nature of the process for short term incubations under artificial light
leading to uncertainties in whether the resulting estimates account for net or gross
primary production (Carpenter and Lively, 1980). However, these shortcomings are well
known and, because of the widespread distribution of the 14C technique data, these are
considered here as reference values of primary production. Our analysis with Montecarlo
approximations was intended to constrain the uncertainties in the FRRF estimates that
arose from the variability described above. Less error in the estimates was observed for
those stations in the river side of the front in the area of the Gulf of Paria. Apparently,
the relatively homogeneous conditions (nutrient and light availability) favor less
variability in the FRRF-based estimates than in oligotrophic zones. One technical
limitation of the FRRF technique that must be considered is the poor sensitivity of this
instrument at low chlorophyll-a concentrations (decrease in the signal to noise ratio,
which makes it difficult to interpret the fluorescence signal). However, Corno et al.
(2006) highlighted the positive potential for this instrument to detect changes in
productivity in Hawaiian oligotrophic waters. Our estimates, both FRRF and 14C for
these waters, despite the high variability foreseen by Montecarlo approximations,
demonstrated close affinity thus validating the observations of Corno et al. (2006).
Chlorophyll-specific absorption coefficient
Variability in the magnitude and shape of chlorophyll specific absorption (aph)
coefficients is caused by variations in the package effect and in the relative abundance of
Chl-a and accessory pigments (Sathyendranath et al., 1987; Fujiki and Taguchi, 2002).
Peak absorption values for aph are located at about 400 and 675 nm. In the case of
aph(675), the variability due to pigment composition is minimal as absorption in this
region is primarily from Chl-a. In contrast, the portion around 440 nm is influenced by

121
accessory pigments; pigments other than chlorophyll that capture light photons either for
photosynthesis or photoprotection. Thus, variations in aph (440) may result from the
combined influences of packaging effect of total cellular pigment content as well as cell
pigment composition (Bricaud et al., 1995). Our data shows higher absorption values in
samples gathered in eastern Caribbean blue waters (low Chl-a) in contrast to those from
high Chl-a waters close to the Orinoco river source. This higher aph (440) at higher
latitudes in clear waters with Kd approximately 0.05 m-1(Figure 28) is probably due to an
increase of photoprotective accessory carotenoids (PPC) in cells acclimated to higher
irradiance. Waters close to the river plume source, should contain more river originated
dissolved materials and therefore, decreased irradiance. In effect, observed kd were
mostly below 0.1 m-1 (Figure 3.28 and Table 3.1a). As cells become shade-adapted, the
cellular concentration of absorbing pigments increases (Falkowski and LaRoche, 1991).
The increase in intracellular pigment concentration could in turn lead to an increase in the
flattening effect and a corresponding decrease in specific absorption (Geider et al., 1986).
The flattening effect or flattening of the peaks occurs when the increase of pigments
within the discrete packages in chloroplasts lessens the effectiveness with which they
collect light, hence lowering the specific absorption (Kirk, 2004).
The ratio a676/a440, indicative of the proportion of the variability due to
chlorophyll, suggests a lesser contribution of chlorophyll to the 440 nm peak at the
Cavortex 6 oceanic samples ( the observed Kd was approximately 0.05). Thus, the
observed high absorption coefficients in the 440 nm region are probably the action of
increased PPC, in adaptation to higher irradiances. While in samples influenced by the
river plume, the ratio indicated higher chlorophyll contribution to aph(440), and possibly
increased photosynthetic accessory carotenoids (PSC), reducing the specific absorption.
The ratio of photoprotective carotenoids to photosynthetic carotenoids (PPC:PSC)
represented in this study by the slope of aph , suggests that less packaging is associated
with a lesser action of chlorophyll and probably an increase in the action of PPC. Under
high irradiances the increase in PPC and the decrease of PSC causes the aph spectral slope
to become steeper. The decrease in packaging then causes an increase in the absorption in
the 440 nm region. Our data suggests that this increase in absorption does not contribute
to higher efficiency in the quantum yield of carbon fixation. The lowest value for

122
maximum quantum yield of carbon fixation (ϕmax) was observed in samples with the
higher aph slope,which as previously discussed, had the highest aph (440). and reflects
energy that as absorbed but not used for carbon fixation. This energy is then dissipated
by PPC as a mechanism for photoprotection. PPCs help prevent damage to chloroplasts
from excess light energy by modifying chlorophyll –chlorophyll interactions and
reducing the efficiency of energy transfer among photosynthetically active pigments
(Frank et al. 2001) as has been observed in the northeast tropical Atlantic (Babin et al.,
1996), in the Arabian Sea (Marra et al., 2000) and in the Southern Ocean (Vaillancourt et
al., 2003). Prieto et al. (2008) also demonstrated in a study near the continental shelf
break in the NW Atlantic Ocean that when the proportion of photoprotective carotenoids
increases, photosynthetic efficiency decreases. The role of pigment concentration and
PSC pigments in transferring energy to the chlorophyll pigment protein complexes of the
reaction center was addressed by Sugget et al. (2004). They questioned the traditional
assumption that the photosynthetically active pigments transfer absorbed light with 100%
efficiency and are completely associated to PSII. PPCs have the lowest transfer
efficiencies, with minimum values of 20% (Rabinowitch and Govindjee, 1969).
Another aspect to consider is that the changes in aph slope can reflect
physiological changes at the cellular level or indicate a shift in species composition with
different light tolerance or nutrient requirements. At low species diversity, changes in the
shape of the aph spectrum indicate physiological acclimation rather than taxonomic
diversity. Variations in nutrient concentration can also promote changes in physiology
(Geider et al., 1993) and species successions that influence the relative pigment
concentrations of the assemblage. The effect of the Orinoco river plume should maintain
the available surface N, otherwise considered as a limiting factor for these oligotrophic
waters thus having an effect on species assemblages. Observations by Corredor et al.
(2003) and Muller –Karger et al. (1989) establish that within the Orinoco River plume “N
is recycled many times before being exported”. The analysis of the aph spectra through
fourth derivative methods yielded absorption peaks that could be associated with
distinctive pigments, but no conclusive differences were found that could be attributed to
taxonomic variations. Fuentes-Figueroa (2007) during the Oripex 7 and 8 observed a
decrease in the microphytoplankton biomass (also in the nano and picoplankton class

123
sizes) from areas close to the river source to areas close to the island of Puerto Rico. This
reduction was suggested to be associated with reduction in dissolved organic carbon (Del
Castillo et al. 1999) and the rate of photomineralization (Morell & Corredor 2001) or
biomineralization of nutrients as waters become diluted. Mendez-Silvagnoli (2008)
observed, for the same sampled regions in this study, higher CDOM slopes indicated
photodegradation of the material originated from Amazon River plume waters in summer
followed by the intrusion of Orinoco River plume water in the fall. Observations by
Helena Antoun (personal communication) of HPLC pigments throughout the region
report a gradual increase in the PSC fucoxanthin from open ocean waters toward the
highest concentrations close to the Gulf of Paria. This increase suggests the expected
increase in diatoms populations and the shift in phototrophic plankton species
assemblages close to the river origin. Fucoxanthin is a PSC pigment therefore its
increase indicates adaptations to lower irradiances, and validates the observation of lower
aph slopes throughout the zone.
Fujiki and Taguchi (2002) noted that under high irradiances the cell size
dependence of aph (440) was weakened due to the effect of photoprotective pigments.
They argue that, at all irradiances, cellular Chl-a per unit of volume of larger species was
lower than that of small species, agreeing with Augusti, (1991 cited in Fujiki and
Taguchi, 2002) who stated that large cell with longer path lengths, have reduced package
effect which in turn prevents the lowering of specific absorption. Therefore size
dependence of absorption is a robust characteristic of marine phototrophic plankton under
low light. Fujiki and Taguchi (2002) demonstrated that at low irradiances the
relationship between spectra and cell volume was statistically significant, but at high
irradiances the relationship becomes weakened apparently due to increased PPC. Barlow
et al (2002) studied pigment absorption characteristics along a meridional transect in the
Atlantic Ocean and across a range of a range of oceanic provinces. Their data suggest that
the effect of pigments on the variability of aph is due primarily to variations in absorption
by PPC. The samples analyzed in this study were collected near the surface
(approximately 3 m) therefore all samples could be considered within the same irradiance
regime and the variations in the irradiance field could then be related to the effect of the
in-situ inherent optical properties. The observed increase in the quantum yield of carbon

124
fixation could then be associated to a decrease in the proportion of PPC to PSC, and this
probably constitutes an important factor molding the net primary production estimates of
the zone. This factor should then be considered with equal contribution to productivity
estimates as the traditional parameters of Chl-a concentration and the availability of
nutrients through the zone, especially when considering satellite based estimates.
Satellite derived primary production estimates
Current models for determining primary production incorporate chlorophyll
concentration as one of the parameters ( e.g. Behrenfeld and Falkowski, 1997) with the
intention to be used as satellite-retrievable pigment data at large geographical scales. The
reality is that chlorophyll is a poor proxy for primary production and it only accounts for
about 50% of the total pigment in most marine environments. As our analysis shows.PPC
account for a significant proportion of pigment absorption in the eastern Caribbean,
particularly in oligotrophic regions, making accurate chlorophyll concentration based
determination of primary production difficult. The MODIS OC3M Chl-a algorithm
incorporates the reflectance at the 443 and 488 nm bands within the area we have
described as affected by the flattening effect. Consequently, the low correlation of
MODIS derived VGPM net primary production estimates and in situ FRRF-based
estimates is not surprising. The FRRF-based estimates, although normalized to biomass
using chlorophyll-a concentrations, are performed considering the effective rate of light
absorption or, as previously described here, as functional absorption cross-section of PSII
(σPSII) which bringd these estimates closer to the reality of the active phototrophic
plankton absorption spectra. σPSII is reduced at high irradiances by photoprotective
mechanisms operating at multiple time scales, ranging from minute with action by the
xanthophylls cycle (Olaizola et al. 1994) to hours with xanthophyll acclimation (Babin et
al., 1996). Sugget et al. (2004) established that the ratio of absorption by photosynthetic
to non photosynthetic pigments could be the strongest predictor of σPSII although it also
can be affected by the taxonomy and physiological state of the algal community. MODIS carbon based production estimates (CbPM) showed better correlation to
the FRRF based estimates through the areas sampled. This C-based approach allows for

125
the separation of biomass and physiological changes in Chl-a. Behrenfeld et al. (2005)
developed this methodology in which information contained in ocean color reflectance
spectra on particulate backscattering is transformed to direct estimates of carbon. This
assumption is based on evidence of a relationship between Chl-a and the particulate beam
attenuation coefficient, cp, (Behrenfeld and Boss, 2003), which is most sensitive to
particles with diameters of 0.5–20 mm in size (Stramski and Kiefer, 1991). This range
commonly overlaps the size distribution of phototrophic plankton in the ocean. When
combined with measurements of Chl-a, the Chl-a:cp ratio can closely track changes in
photosynthetic competency (Behrenfeld and Boss, 2003, 2006). Consequently, CbPM
estimates and FRRF-based ones must fluctuate in accordance, and in relation to changing
biogeochemical conditions. Note here that these satellite based estimates both the VGPM
and CbPM are based on MODIS satellite information with a resolution of 1 km and the
FRRF estimates consider a small portion of the spatial area sampled by the satellite. Each
cast profile used to model the FRRF production estimates corresponds to a half
oscillation of the towed vehicle within a range of about 0.4 to 0.6 km. Therefore the
differences in these estimates compared to those based on the absorption spectra also
should consider the uncertainties caused by the spatial resolution sampled, and the
variability in the inherent optical properties due to the impact of the river plume. Another
consideration is that the model uses a scattering (bbp) to carbon relationship that is based
in an invariant particle size spectrum. This assumption holds over much of the ocean
(Stramski and Kiefer, 1991) but is not always true; large diatom or coccolitophorids with
silica and calcium carbonate exoskeletons contribute disproportionally to backscattering
(Balch et al. 1999) which is a factor to consider throughout the Orinoco River plume. In
addition, these organisms incorporate organic carbon through photosynthesis and
particulate inorganic carbon into their calcareous plates further confusing the relationship
between bbp and C (Westberry et al., 2008). Nevertheless our estimates with both
satellite methods and FRRF estimates co-varied and both reflected the extent of features
characteristic of the Orinoco River Plume, measured in situ and remotely observed.

126
The production estimates derived from natural fluorescence varied closely with
those modeled through FRRF at the stations visited during Cavortex 2, a relationship is
comparable to other studies where 14C was used (Garcia-Mendoza and Maske, 1996; ).
These estimates analyzed with data gathered on the interaction of an eddy pair, showed
agreement with the expected higher production due to the flux of material to the surface
in the cyclonic eddy portion and the apparent accumulation of material in the anti-
cyclonic portion (as described in chapter 2 of this dissertation) . Even though the
estimates covaried (r= 0.91) accordingly to the in-situ biogeochemical features, the
difference between these estimates was large, the production estimates based on natural
fluorescence underestimated that observed with the FRRF methodology.
Fluorescence and photosynthesis are only two of three possible outcomes of the
absorbed energy; it is use for carbon fixation, is emitted as fluorescence or its lost as heat.
Energy once absorbed normally goes through the process of PSII light reactions where it
is transformed into the chemical energy necessary for the dark reactions and carbon
fixation. Consequently, if an inverse relationship exists between the first two, the loss by
heat must be negligible. Nevertheless, according to the observed PPC to PSC
relationships, in most of eastern Caribbean beyond the influence of the river plume,
absorption is largely influenced by PPC. Here, most of the absorbed energy must in fact
be dissipated and not used for carbon fixation. This energy must considered to be lost in
the form of heat, a process called thermal deactivation or non-radiative dissipation
channeled through the xanthophyll cycle. Our estimates from oligotrophic waters thus
should reflect lower fluorescence as their photosystems adapt to higher irradiances
throughout the water column. The estimates based of FRRF fluorometry are based on the
maximum potential for these photosystems to fluorescence, natural fluorescence only
accounts for that minimal fluorescence as stimulated by the sun. Considering also that
most of the FRRF measurements were performed at night, the photosynthetic potential of
these cells should reflect a relaxed state. The bias between these measurements could be
explained by this difference in the state of the photosynthetic potential. The FRRF
fluorometry was developed to improve the variable fluorescence yield estimates by
considering photochemical quenching, non-photochemical quenching, and the redox
state of the acceptor and donor side of PS II.

127
Conclusions
The variable bio-optical and biophysical (FRRF) characteristics of phototrophic
plankton populations in the eastern Caribbean Sea discussed here denote the complexity
of biogeochemical processes of the zone. The periodic intrusion of the Orinoco River
plume and, to lesser extent by the Amazon River, causes variablility of the bio-optical
environment in these surface waters. The mechanisms suggested for fertilization derived
from river originated materials such as photomineralization and biomineralization
(Morell and Corredor, 2001), and the resulting inherent optical conditions, must account
for higher carbon export through the zone. Our observations suggest such relationship as
increased quantum yield of carbon fixation with changing environmental conditions.
These conditions can be summarized first by nutrient release from the river originated
materials, promoting an increase in the phototrophic plankton photosynthetic efficiency
of surface waters. Second, the variability in irradiance regimes through the zone for
surface waters prompting changes in absorption spectra, pigment composition and
efficiency in the transfer of absorbed energy.
Hence considering that the ultimate goal is to properly quantify the rates of
carbon assimilations and transport at global scales, our journey is far from over. Our
current understanding of the parameters affecting photosynthesis is limited to small
regions of the planet in which we are beginning to grasp the factors involved. The eastern
Caribbean is one of these regions and we are only starting to understand its complexity.

128
General Conclusion
From this study it can be concluded that eastern Caribbean surface waters in
general maintain conditions for increased phototrophic plankton photosynthetic
efficiency (Fv/Fm) at least during the months of continental riverine influence. The
dispersion of riverine material across the region delivers the necessary materials to
liberate surface populations from micronutrient starvation influencing their
photosynthetic potential. Satellite and in-situ primary production estimates confirm that
primary production responds to the gradient generated by the Orinoco River plume.
Advection of the river plumes by Caribbean mesoscale eddies may contribute to the
diffusion and mixing of the materials through the zone and within the water column.
Eddy pumping potential of cyclonic eddies also promotes baroclinic instabilities that
favor the flux of refractive materials and with it micronutrients to relieve surface
populations from starvation, as apparent from the relationship of Fv/Fm and the
chlorophyll normalized particle beam attenuation. The optical conditions of surface
waters through the region respond to continental runoff as evidentiated by the gradient in
satellite surface attenuation coefficients at 490 nm (K490). These prevalent optical
conditions then influence the photosynthetic potential for surface phototrophic plankton
populations. Lower quantum yield for carbon fixation prevail in the clearest oceanic
waters ( Kd PAR= 0.05), even in the presence of higher specific absorption coefficients
(aph). The increased aph slopes (488-532 nm) in these clear waters suggests the presence
of photoprotective carotenoids responsible for the absorption of the energy not used for
carbon fixation. On the contrary, waters influenced by the Orinoco River present lower
aph at surface, consistent with increased packaging effect due to lower irradiances. These
riverine influenced waters present lower aph slopes denoting increased influence of
photosynthetic carotenoids that consequently favor higher quantum yield for carbon
fixation. This in fact suggest that the region under the influence of continental runoff not
only presents increased photosynthetic potential due to increased micronutrients (higher
Fv/Fm), but is favored by higher efficiency in light absorption by the action of
photosynthetic carotenoids. In summary our hypothesis, that the effect of the Caribbean
mesoscale phenomena differentiates eastern Caribbean surface waters from the typical

129
oceanic oligotrophic environment towards one with phototrophic plankton communities
rather more efficient in photosynthesis, is supported.

130
Cited Literature Abbott, M.R., K.H. Brink, C.R. Booth, D. Blasco, M.S. Swenson, C.O. Davis, and L.A. Codispoti. 1995. Scales of variability of bio-optical processes as observed from near-surface drifters, J. Geophys. Res., 100, 13,345-13,367. Abbott M. R. and Letelier R.M. 1999. Algorithm Theoretical Basis Document Chlorophyll Fluorescence (MODIS Product Number 20). 44 pp Aiken, J., J. Fishwick, G. Moore & K. Pemberton. 2004. The annual cycle of phytoplankton photosynthetic quantum efficiency, pigment composition and optical properties in the western English Channel. J. Mar. Biol. Ass. UK. 84: 301-303. Alfonso-Sosa, E. 2000. Variabilidad temporal de la producción primaria fitoplanctónica en la estación CaTS (Caribbean Time Series Station): Con énfasis en el impacto de la marea interna semidiurna sobre la producción. Disertación Ph.D. Universidad de Puerto Rico, Mayaguez, P.R. Alfonso, E., López, J. M., Capella, J., Dieppa, A. y J. M. Morell. (submitted). Internal tide induced variations in primary productivity and optical properties in the Mona Passage, Puerto Rico. Deep-Sea Research. Andersen R.A., Bidigare R.R., Keller M.D., Latasa M. 1996, A comparison of HPLC pigment signatures and electron microscopic observations for oligotrophic waters of the North Atlantic and Pacific Oceans, Deep Sea Res. II, 43 (2)–(3), 517–537. Antoine, D., and A. Morel. 1996. Oceanic primary production. 2. Estimation at global scale from satellite (coastal zone color scanner) chlorophyll, Global Biogeochem. Cycles, 10, 57–69 Babin, M., A. Morel, H. Claustre, C. Bricaud, Z. Kolber, and P. G. Falkowski, 1996. Nitrogen- and irradiance-dependent variations of the maximum quantum yield of carbon fixation in eutrophic, mesotrophic and oligotrophic marine systems. Deep Sea Res. 43(8):1241-1272. Babin, M., Morel, A., Falkowski, P.G., Claustre, H., Bricaud, A. and Z. Kobler, 1996. Nutrient- and light-dependent variations of the maximum quantum yield of carbon fixation in eutrophic, mesotrophic and oligotrophic systems. Deep Sea Research, 43, 1241-1272. Balch, W. M., D. T. Drapeau, T. L. Cucci, R. D. Vaillancourt, K. A. Kilpatrick, and J. J. Fritz .1999. Optical backscattering by calcifying algae – Separating the contribution by particulate inorganic and organic carbon fractions, J. Geophys. Res., 104, 1541 – 1558.

131
Baums, I.B., Paris, C., Che´rubin, L.M. 2006. A dynamical filter in larval dispersal in a reef building coral. Limnology and Oceanography 51 (5), 1969–1981. Behrenfeld, M.J., Bale, A.J., Kolber, Z.S., Aiken, J. and Falkowski, P.G. 1996. Confirmation of iron limitation of phytoplankton photosynthesis in the equatorial Pacific Ocean, Nature, 383, 508-511. Behrenfeld, M. J., and E. Boss. 2006. Beam attenuation to chlorophyll concentration as alternative indices of phytoplankton biomass, J. Mar. Res., 64, 431– 451. Behrenfeld, M. J., E. Boss, D. A. Siegel, and D. M. Shea, 2005. Carbonbased ocean productivity and phytoplankton physiology from space, Global Biogeochem. Cycles, 19, GB1006, doi:10.1029/2004GB002299. Behrenfeld, M. J., and E. Boss. 2003. The beam attenuation to chlorophyll ratio: an optical index of phytoplankton photoacclimation in the surface ocean. Deep Sea Res., Part I, 50, 1537 – 1549 Behrenfeld, M.J., Falkowski, P.G. 1997. Photosynthetic rates derived from satellite-based chlorophyll concentration. Limnology andOceanograp hy 42, 1–20. Behrenfeld, M.J. and Kolber, Z., 1998. Widespread iron limitation of phytoplankton in the south Pacific Ocean. Science 283, 840-843. Behrenfeld, M.J., Prasil, O., Kolber, Z., Babin, M., Falkowski, P. 1998. Compensatory changes in Photosystem II electron turnover rates protect photosynthesis from photoinhibition. Photosynthesis Research, 58: 259-268. Benitez-Nelson, C. R., R. Bidigare, T. D. Dickey, M.R. Landry,C. L. Leonard, S.L., Brown, F. Nencioli, Y. M. Rii, Kanchan, J.W. Becker, T.S. Bibby,W.Black, W. Cai, C.A. Carlson, F. Chen, V. S. Kuwahara, C.Mahaffey, P. M. McAndrew, P. McAndrew, M. S. Rappé, K.E. Selph, M.P. Simmons, Eun Jin Yang.2007. Mesoscale Eddies Drive Increased Silica Export in the Subtropical Pacific Ocean Science 316, 1017 (2007) Bidigare, R. R. 1989. Photosynthetic pigment composition of the brown tide alga: Unique chlorophyll and carotenoid derivatives, p. 57-75. In E. Cosper et al. [eds.], Novel phytoplankton blooms. Springer. Bidigare, R. and others. 1990. Evidence for phytoplankton succession and chromatic adaptation in the Sargasso Sea during spring 1985. Mar. Ecol. Prog. Se Bonilla, J., Senior W., Jugden, J., Zafiriou, O. y Jones, R. 1993. Seasonal distribution of nutrients and primary productivity on the Eastern continental shelf of Venezuela as influenced by the Orinoco river. J Geophys. Res., 98(2C): 2245-2257.

132
Boss, E., R. Collier, G. Larson, K. Fennel, and W.S. Pegau, 2007. Measurements of spectral optical properties and their relation to biogeochemical variables and processes in Crater Lake National Park, OR. Hydrobiologia (2007), 574:149-159. Boss, E. & W. S. Pegau, 2001. The relationship of light scattering at an angle in the backward direction to the backscattering coefficient. Applied Optics 40: 5503–5507 Boss, E., W. S. Pegau, W. D. Gardner, J. R. V. Zaneveld, A. H. Barnard, M. S. Twardowski, G. C. Chang & T. D. Dickey, 2001a. The spectral particulate attenuation and particle size distribution in the bottom boundary layer of a continental shelf. Journal of Geophysical Research 106: 9509–9516. Boss, E., W. S. Pegau, M. Lee, M. S. Twardowski, E. Shybanov, G. Korotaev & F. Baratange, 2004. The particulate backscattering ratio at LEO 15 and its use to study particles composition and distribution. Journal of Geophysical Research 109, C0101410.1029/ 2002JC001514. Boyd, P.W. and Abraham, E. 2001 Iron-mediated changes in phytoplankton photosynthetic competence during SOIREE Deep Sea Research II 48 2529 – 2550. Boyd, P.W. (2002) The role of iron in the biogeochemistry of the Southern Ocean and equatorial Pacific: a comparison of in situ iron enrichments. Deep Sea Research II . 49:1803-1821 Bricaud, A., Babin, M., Morel, A. and H. Claustre, 1995. Variability in the chlorophyll-specific absorption coefficient of natural phytoplankton : analysis and parameterization. Journal of Geophysical Research, 100, C7, 13321-13332 Bricaud, A., A.L. Bedhomme, and A. Morel. 1988. Optical properties of diverse phytoplanktonic species: Environmental results and theoretical interpretation. Journal of Plankton Research. 10:851-873. Bricaud, A., and D. Stramski. 1990. Spectral absorption coefficients of living phytoplankton and non-algal biogenous matter: a comparison between the Peru upwelling area and Sargasso Sea. Limnology and Oceanography, 35, 562-582. Campbell L 2001. Flow cytometric analysis of autotrophic picoplankton. In Paul JH ed, Marine Microbiology: Methods in Microbiology, 30. Academic Press, San Diego: 317-343. Canals-Silander, Miguel F.. 2005. On the Three-Dimensional Structure of Caribbean Mesoscale Eddies. Master of Science Thesis. University of Puerto Rico, Mayaguez, P.R. Carpenter EJ, Lively JS, 1980. Review of estimates of algal growth using 14C tracer techniques. In: Falkowski PG (ed) Primary productivity in the sea. Plenum Press, New York, p 161–178

133
Chamberlin, W. S., Booth C.R., Kiefer D. A., Morrow J. H., Murphy, R.C. 1990. Evidence for a simple relationship between natural fluorescence, photosynthesis, and chlorophyll-a in the sea. Deep-Sea Research 37, 951-973. Chamberlin, S., Marra, J.. 1992. Estimation of photosynthetic rate from measurements of natural fluorescence: analysis of the effects of light and temperature. Deep-Sea Research. 39 (10), 1695-1706. Chérubin L.M. and P. Richardson, 2007. Caribbean current variability and the influence of the Amazon and Orinoco fresh water plumes. Deep-Sea Res. I 54 1451–1473. Claustre H., A. Morel, S. B. Hooker, M. Babin, D. Antoine, K. Oubelkheir, Bricaud A., K. Leblanc, B. Que´guiner, and S. Maritorena. 2002. Is desert dust making oligotrophic waters greener? Geophys. Res. Let., VOL. 29, NO. 10, 10.1029. Corno, G., R. M. Letelier, M. R. Abbott, and D. M. Karl. 2006. Assessing the temporal variability of primary production in the North Pacific Subtropical Gyre: A comparison of fast repetition rate fluorometry and 14C measurements. J. Phycol. 42: 51–60. Corredor JE, 1979. Phytoplankton response to low-level nutrient enrichment through upwelling in the Colombia Caribbean Basin. Deep-Sea Research 26A: 731–741 Corredor J.E. and Morell J. M. 2001. Seasonal variation of physical and biogeochemical features in eastern Caribbean surface Water. J. of Geophysical Research. 106, 4517-4525. Cullen, J. J., and R. E. Davis. 2003. The blank can make a big difference in oceanographic measurements. Limnol. Oceanogr. Bull. 12: 29–35. Dey S. and R.P. Singh, 2003 Comparison of chlorophyll distributions in the northeastern Arabian sea and southern Bay of Bengal using IRS-P4 Ocean Color Monitor Data. Remote Sensing of the environment 85, 424-428. DuRand, M.D. and R.J. Olson. 1996. Contributions of phytoplankton light scattering and cell concentration changes to diel variations in beam attenuation in the equatorial Pacific from flow cytometric measurements of pico, ultra, and nanoplankton. Deep-Sea Research II, 43:891-906 Eisner, L., M.S. Twardowski, T.J. Cowles, and M.J. Perry. 2003. Resolving phytoplankton photoprotective: photosynthetic carotenoid ratios on fine scales using in situ spectral absorption measurements. Limnol. Oceanogr., 48:632–646. Falkowski, P.G. 2002. The ocean's invisible forest. Scientific American 287:22, 38-45 Falkowski, P.G., Greene, R.M., Geider, R.J. 1992. Physiological limitations on phytoplankton productivity in the ocean. Oceanography 5, 84}91.

134
Falkowski PG, LaRoche J. 1991. Acclimation to spectral irradiance in algae. J. Phycol. 27:8-14. Falkowski, P.G., and Z. Kolber. 1995. Variations in chlorophyll fluorescence yields in the phytoplankton in the world oceans, Aust. J. Plant Physiol., 22, 341-355. Falkowski, P G. A. Sukenik, and R. Herzig. 1989. Nitrogen limitation in Isochrysis galbana (Haptophyceae). II. Relative abundance of chloroplast proteins. J. Phycol. 25: 471-478. Falkowski, P.G., D. Ziemann, Z. Kolber, P.K. Bienfang, 1991b Nutrient pumping and phytoplankton response in a subtropical mesoscale eddy. Nature. 352: 544-551. Ffield, A., 2005. North Brazil current rings viewed by TRMM Microwave Imager SST and the influence of the AmazonPlume. Deep-Sea Research I 52, 137–160.
Frank H. A., Somes Kumar Das, J. A. Bautista, D. Bruce, S. Vasil'ev, M. Crimi, R. Croce and R. Bassi, 2001. The photochemical behavior of xanthophylls in the recombinant photosystem II antenna complex, CP26. Biochemistry 40 1220-1225.
Fuchs E, Zimmerman RC, Jaffe JS, 2002. The effect of elevated levels of phaeophytin in natural waters on variable fluorescence measured from phytoplankton. J Plankton Res. 24:1221–1229. Fujiki T, Taguchi S., 2002. Variability in chlorophyll a specific absorption coefficient in marine phytoplankton as a function of cell size and irradiance. J Plankton Res 24(9):859–874.
Gao Y., Song-Miao Fan, and J. L. Sarmiento. 2001 Aeolian iron input to the ocean through precipitation scavenging: A modeling perspective and its implication for natural iron fertilization in the ocean. J. Geophys. Res., VOL. 108, NO. D7, 4221. García-Mendoza E., and H. Maske, 1996. The relationship of solar-stimulated natural fluorescence and primary productivity in Mexicam Pacific waters. Limnology and Oceanography, 41(8):1697-1710 Geider, R. J., T. Plait, and J. A. Raven, 1986. Size dependence of growth and photosynthesis in diatoms: A synthesis. Mar. Ecol. Prog. Ser. 30: 93-109. Gong and Ohad, 1991. The PQ/PQH2 Ratio and Occupancy of Photosystem-II-QB Site by Plastoquinone Control the Degradation of D1 Protein During Photoinhibition Invivo. Journal of Biological Chemistry 266(31):21293-21299. Heath, M., K. Richardson, T. Kiørboe. 1990. Optical assessment of phytoplankton nutrient depletion. J. Plank. Res. 12: 381-396.

135
Hedges, J. I., W. A. Clark, P. D. Quay, J. E. Richey, A. H. Devol, and U. D. M. Santos. 1986. Compositions and fluxes of particulate organic material in the Amazon River. Limnol. Oceanogr., 31: 717-738. Hernández J. L., D. Erickson III and P. Ginoux, 2001. Atmospheric Iron Flux and Surface Chlorophyll in the North-Western Tropical Atlantic (paper), IX COLACMAR Congress, September/16/2001, San Andres, Colombia Hernandez-Guerra, A., Joyce, T.M., 2000. Water masses and circulation in the surface layers of the Caribbean at 661W. Geophysical Research Letters 27 (21), 3497–3500. Hoepffner N, Sathyendranath S. 1992. Bio-optical characteristics of coastal waters: absorption spectra of phytoplankton and pigment distribution in the western North Atlantic. Limnology and Oceanography 37:1660-1679 Johnsen, G., O. Samset, L. Granskog, and E. Sakshaug, 1994. In vivo absorption characteristics in 10 classes of bloom-forming phytoplankton: Taxonomic characteristics and responses to photoadaptation by means of discriminate and HPLC analysis. Mar. Ecol. Prog. Ser. 105: 149–157. Joint Global Ocean Flux Study, (1991) JGOFS Core Measurements Protocols, JGFOS Report No. 6, Scientific Committee on Oceanic Research, 40pp Kiefer, D.A., Chamberlin, W.S., 1989. Natural fluorescence of chlorophyll-a: Relationship to photosynthesis and chlorophyll-a concentration in the western South Pacific Gyr e. Limnology and Oceanography. 34 (5), 868-881. Kirk, J. T. O. 1994. Light & Photosynthesis in Aquatic Ecosystems. Cambridge University Press, New York, New York, 509 pp. Koblizek, M., D. Kaftan, and L. Nedbal. 2001. On the relationship between the non-photochemical quenching of the chlorophyll fluorescence and the photosystem II light harvesting efficiency. A repetitive flash fluorescence induction study. Photosynth. Res. 68: 141–156. Kolber, Z. S, and P. G. Falkowski. 1993. Use of active fluorescence to estimate phytoplankton photosynthesis in situ. Limnol. Oceanogr. 38: 1646–1665. Kolber, Z. S, O. Prasil, and P. G. Falkowski. 1998. Measurements of variable chlorophyll fluorescence using fast repetition rate techniques: defining methodology and experimental protocols. Biochim. Biophys. Acta 1367: 88–106. Kolber, Z. S, J. Zehr, and P. Falkowski. 1988. Effects of growth irradiance and nitrogen limitation on photosynthetic energy conversion in photosystem II. Plant Physiol. 88: 923-929.

136
Kolber, Z. S, K. D. Wyman, and P. G. Falkowski. 1990. Natural variability in photosynthetic energy conversion efficiency: a field study in the Gulf of Maine. Limnol. Oceanogr. 35, 72-79. Lee-Borges, Jesús. 2003. Contribution of Picoplankton to Phytoplankton Dynamics and Bio-optics of the Eastern Caribbean Sea. PhD Dissertation. University of Puerto Rico, Mayaguez, P.R. Lewis, W. M., and J. F. Saunders . 1989. Concentration and transport of dissolved and suspended substances in the Orinoco River, Biogeochemistry, 7 203-240. Lima, I.D., Olson, D.B. and Dooney, S. 2002. Biological Response to Frontal Dynamics and Mesoscale Variability in Oligotrophic Environments: A numerical modeling study. J. Geophy. Res., 10.1029/2000JC000393,1-21. Lohrenz, S.E., A.D. Weidemann, and M. Tuel. 2003. Phytoplankton spectral absorption as influenced by community size structure and pigment composition. Journal of Plankton Research. 25:35-61. Maffione R. A. and D. R. Dana.1997. Instruments and methods for measuring the backward-scattering coefficient of ocean waters. Appl. Opt. 36, 6057-6067 Maritorena, S., A. Morel, AND B. Gentili. 2000. Determination of the fluorescence quantum yield by oceanic phytoplankton in their natural habitat. Appl. Opt. 39: 6725–6737. Martin, J. H., K. H. Coale, K. S. Johnson, S. E. Fitzwater, R. M. Gordon, S. J. Tanner, C. N. Hunter, V. A. Elrod, J. L. Nowicki, T. L. Coley, R. T. Barber, S. Lindley, A. J. Watson, K. Van Scoy, C. S. Law, M. I. Liddicoat, R. Ling, T. Stanton, J. Stockel, C. Collins, A. Anderson, R. Bidigare, M. Ondrusek, M. Latasa, F. J. Millero, K. Lee, W. Yao, J. Z. Zhang, G. Friederich, C. Sakamoto, F. Chavez, K. Buck, Z. Kolber, R. Greene, P. Falkowski, S. W. Chisholm, F. Hoge, R. Swift, J. Yungel, S. Turner, P. Nightingale, A. Hatton, P. Liss and N. W. Tindale. 1994. Testing the iron hypothesis in ecosystems of the equatorial Pacific Ocean. Nature 371: 123-129. Marra, J., Trees, C.C., Bidigare, R.R., Barber, R.T. 2000. Pigment absorption and quantum yields in the Arabian Sea. Deep-Sea Research II 47, 1279–1299. Moore, C.M., M.I. Lucas, J.T. Allen, R.J. Davidson, D.A. Smeed, and A.T. Mustard, 2002. Mesoscale controls on phytoplankton community structure, physiology and production within a eutrophic open ocean frontal region (Poster Abstract), in Challenger Centenary Conference: Marine Science 2002, Plymouth.

137
Moore, C.M., Suggett, D., Holligan, P.M., Sharples, J., Abraham, E.R., Lucas, M.I., Rippeth, T.P., Fisher, N.R., Simpson, J.H. and Hydes, D.J. 2003. Physical controls on phytoplankton physiology and production at a shelf sea front: a fast repetition-rate fluorometer based field study. Marine Ecology - Progress Series, 259, 29-45. Moore, C. M., and others. 2006. Phytoplankton photoacclimation and photoadaptation in response to environmental gradients in a shelf sea. Limnology and Oceanography. 51: 936–949. Morel, A. 1991. Light and marine photosynthesis: a spectral model with geochemical and climatological implications. Progress in Oceanography, 26:263-306. Morrison J. R., 2003. In situ determination of the quantum yield of phytoplankton chlorophyll a fluorescence: A simple algorithm, observations, and a model. Limnology and Oceanography. 48(2) 618-631. Morrison, J., and Smith, O., January 1990, "Geostrophic Transport Variability along the Aves Ridge in the Eastern Caribbean Sea, 1985-1986", J., Geophys. Res., 95(C1), pp. 699-710. Murphy S., H. Hulburt and J. O’Brien. 1999. The connectivity of the eddie variability in the Caribbean Sea, the Gulf of Mexico, and the Atlantic Ocean. J Geophysical Res. 104, 1431-1453. Müller-Karger, F. E., C. R. McClain, T. R. Fisher, W. E. Esaias, and R. Varela, 1989. Pigment distribution in the Caribbean Sea: Observations from Space. Progress in Oceanography. 23. 23-69. Olaizola, M., J. La Roche, Z. Kolber, and P. G. Falkowski, 1994. Non-photochemical fluorescence quenching and the diadinoxanthin cycle in a marine diatom. Photosynth. Res. 41: 357-370 Olaizola, M., Yamamoto, H.Y., 1993. Short-term response of the diadinoxanthin cycle and fluorescence yield to high irradiance in Chaetocerus muelleri (Bacillariophyceae). Journal of Phycology 30, 606–612. Olson R.J., H.M. Sosik, A.M. Chekalyuk and A. Shalapyonok. 2000. Effects of Iron enrichment on phytoplankton in the Southern Ocean during late summer: Active fluorescence and Flow Cytometric analyses. Deep-Sea Research I 47, 3181–3200 Parkhill J, Maillet G, Cullen JJ, 2001. Fluorescence based maximal quantum yield for PSII as a diagnostic of nutrient stress. J Phycol 37:517–529 Platt T, C.L. Gallegos and W.G. Harrison,1980. Photoinhibition of photosynthesis in natural assemblages of marine phytoplankton. J Mar Res 38:687–701

138
Platt, T. and A.D. Jassby. 1976. The relationship between photosynthesis and light for natural assemblages of coastal marine phytoplankton. Journal of Phycology. 12:421-430. Prasil, O., Adir, N., & Ohad, I. 1992. Dynamics of photosystem II: mechanism of photoinhibition and recovery processes. In: The Photosystems: Structure, Function and Molecular Biology. Topics in Photosynthesis, vol. 11 (Barber, J. ed.), pp.295-348, Elsevier publ., Amsterdam, London, New York, Tokyo. Rabinowitch, E. and Govindjee, 1969. Photosynthesis. John Wiley and sons, New York, 274 pp Roesler, C. S., M. J. Perry, and K. L. Carder. 1989. Modeling in situ phytoplankton absorption from total absorption spectra. Limnol. Oceanogr. 34: 1512-1525. Sakshaug E, Bricaud A, Dandonneau Y, Falkowski PG and 5 others. 1997. Parameters of photosynthesis: definitions, theory and interpretation of results. J Plankton Res 19: 1637–1670. Sathyendranath, S., L. Lazzara, and L. Prieur, 1987. Variations in the spectral values of specific absorption of phytoplankton. Limnol. Oceanogr. 32: 403-415. Sharples J., Moore C.M., Rippeth T.R., Holligan P.M., Hydes D.J., Fisher N.R., and Simpson H. 2001. Phytoplankton distribution and survival in the thermocline. Limnol. Oceanogr., 46(3):486-496. Sosik H. M. and R. J. Olson. 2002. Phytoplankton and iron limitation of Photosynthetic effiency in the Southern Ocean during late summer. Deep-Sea Research I 49, 1195–1216. Suggett D., G. Kraay, P. Holligan, M.t Davey, and J. Aiken, 2001.Assessment of photosynthesis in a spring cyanobacterial bloom by use of a fast repetition rate fluorometer Limnol. Oceanogr., 46(4), 802–810. Stramski, D., and D. Kiefer 1991. Light scattering by microorganisms in the open ocean, Prog. Oceanogr., 28, 343 – 383. Twardowski, M. S., E. Boss, J. B. Macdonald, W. S. Pegau, A. H. Barnard & J. R. V. Zaneveld. 2001. A model for estimating bulk refractive index from the optical backscattering ratio and the implications for understanding particle composition in Case I and Case II waters. Journal of Geophysical Research 106: 14129–14142 Vaillancourt, R. D., J Marra, M. P. Seki, M. L. Parsons and R. R. Bidigare.2003. Impact of a cyclonic eddy field on phytoplankton community structure and photosynthetic competency in the subtropical North Pacific Ocean. Deep-Sea Res. I 50 829-847. Vaillancourt, R. D., J. Marra, R. T. Barber and W. O. Smith, Jr. 2003. Primary productivity and in situ quantum yields in the Ross Sea and Pacific Sector of the Antarctic Circumpolar Current, Deep-Sea Research II, vol. 50 , pp. 559-578 .

139
Vassiliev, I. R., Z. Kolber, K. D. Wyman, D. Mauzerall, V. K. Shukla, AND P. G. Falkowski. 1995. Effects of iron limitation on photosystem-II composition and light utilization in Dunaliella tertiolecta. Plant Physiol. 109: 963–972. Yentsch, C. S., and D. W. Menzel. 1963. A method for determination of chlorophyll and phaeophytin by fluorescence. Deep-Sea Res. 10: 22 l-23 1 Zhu, X. R., J. M. Prospero, and F. J. Millero. 1997. Diel variability of soluble Fe (II) and soluble total Fe in North African dust in the trade winds at Barbados, J. Geophys. Res., 102:21297-21305.