photonic multiple microwave frequency measurement based on ...€¦ · ieee photonics journal...
TRANSCRIPT

Open Access
Photonic Multiple Microwave FrequencyMeasurement Based on Frequency-to-TimeMappingVolume 10, Number 2, April 2018
Feng ZhouHao ChenXu WangLinjie ZhouJianji DongXinliang Zhang
DOI: 10.1109/JPHOT.2018.28079191943-0655 © 2018 IEEE

IEEE Photonics Journal Photonic Multiple Microwave Frequency Measurement
Photonic Multiple Microwave FrequencyMeasurement Based on
Frequency-to-Time MappingFeng Zhou,1 Hao Chen,1 Xu Wang,1 Linjie Zhou ,2 Jianji Dong ,1
and Xinliang Zhang 1
1Wuhan National Laboratory for Optoelectronics, School of Optical and ElectronicInformation, Huazhong University of Science and Technology, Wuhan 430074, China2State Key Laboratory of Advanced Optical Communication Systems and Networks,
Department of Electronic Engineering, Shanghai Jiao Tong University, Shanghai430074, China
DOI:10.1109/JPHOT.2018.28079191943-0655 C© 2018 IEEE. Translations and content mining are permitted for academic research only.
Personal use is also permitted, but republication/redistribution requires IEEE permission.See http://www.ieee.org/publications_standards/publications/rights/index.html for more information.
Manuscript received January 6, 2018; revised February 12, 2018; accepted February 15, 2018. Date ofpublication February 20, 2018; date of current version March 6, 2018. This work was supported in partby the National Natural Science Foundation of China under Grant 61475052 and Grant 61622502 andin part by the Opened Fund of the State Key Laboratory on Advanced Optical Communication Systemand Network under Grant 2015GZKF03004. Feng Zhou and Hao Chen contributed equally to this work.Corresponding author: J. Dong (e-mail: [email protected]).
Abstract: A photonic multiple microwave frequency measurement system is presented anddemonstrated based on a swept frequency silicon microring resonator (MRR). The drop-port of a high-Q MRR is employed as a periodic narrowband scanning filter driven by asawtooth voltage signal. The unknown frequency can be mapped to time interval betweenpulse appearances when scanning the modulated signal and the frequency-to-time mappingis established. In the experiments, we obtain a measurement range of 25 GHz with an errorof ±510 MHz. Meanwhile, the measurement resolution for multi-frequency measurement isabout 5 GHz. Our scheme offers a simple structure, low-cost solution, capability of multiplefrequency measurement, and potential of chip-integration.
Index Terms: Microwave frequency measurement, microwave photonics.
1. IntroductionRecently, microwave frequency measurement (MFM) technique has aroused lots of research in-terests for its application on electronic warfare, radar warning and electronic intelligence systems.Due to the explosive growth of data traffic, critical challenges are bringing urgent demands tomeasurements in terms of large instantaneous bandwidth greater than 10 GHz, which may not beachievable using purely electronic solutions or the systems are extremely complicated and costly[1]. Compared with electronics solutions, photonic MFM systems offer advantages including largeinstantaneous bandwidth, electromagnetic immunity, potential for multi-frequency measurement,light weight and so on [2].
The basic principle of photonic MFM systems is to map the frequency of an unknown microwavesignal to a more easily measurable parameter, such as power and time delay. Systems based onfrequency-to-power mapping [2]–[11] were the most common scheme and often offered advantagesof low cost and simple structure. However, most frequency-to-power mapping systems could not
Vol. 10, No. 2, April 2018 5500807

IEEE Photonics Journal Photonic Multiple Microwave Frequency Measurement
Fig. 1. (a) The schematic of the proposed MFM system. (b) The scanning filtering principle of the MRR.(c) The process of frequency-to-time mapping.
measure multi-frequency simultaneously [2]–[7], [9]–[11], making them less practical in the spec-trally cluttered environment; or the input power needed to remain constant to match the amplitudecomparison function (ACF) [4], [9]–[11]. By contrast, systems relying on frequency-to-time mapping[12]–[15] were usually qualified for multi-frequency measurements and the measurement accuracywas independent on the input power. In [12], time delay was generated by utilizing dispersion effect.However, its accuracy and resolution was unsatisfactory and the use of high-speed photodetectormade the system expensive. In [13], a scanning receiver based on frequency shifting recirculatingdelay line and stimulated Brillouin scattering was proposed. However, the system latency was de-pendent on the number of circulation and the use of long single-mode fiber made system bulky. In[15], the laser should be continuously and linearly tuned and the performance was limited by thesweeping rate of the laser.
In this letter, a simplified photonic MFM system with a wide measurement range and a multi-frequency measurement ability is presented. A high-Q MRR, driven by a sawtooth voltage signal,serves as a periodic bandpass scanning filter. By scanning filtering, unknown frequency informationis mapped into time interval and unknown frequencies can be derived using the frequency-to-timemapping function. A measurement range of 25 GHz, with an error of ±510 MHz is achieved. Thecapability of multi-frequency measurement has been verified, with a resolution of 5 GHz. Meanwhile,the measurement does not rely on input power (both optical carrier and RF signal). Thus, the systemcan survive in cluttered microwave environment.
2. Principle and StructureFig. 1(a) shows the schematic diagram of the proposed MFM system based on MRR. Thecontinuous-wave (CW) light carrier generated by a tunable laser (TLS) is launched into an in-tensity modulator (IM), modulated by the unknown microwave signal. Assuming that the unknownmicrowave signal has a single tone. After modulation (i.e., linear modulation), there are three fre-quency components in the signal, i.e., f0 and f0 ± f1. Here, f0 is the frequency of CW light and f1is the frequency of input microwave signal. Two polarization controllers (PC1, 2) are placed beforethe IM and the MRR to optimize the polarization state of the incident light. Two erbium doped fiberamplifiers (EDFA1, 2) are placed before and after the MRR to compensate the link loss, respec-tively. The output from the drop-port of MRR is detected by a low-speed PD (BW: 200 MHz) andthe photocurrent is observed with an oscilloscope.
We select one of the resonant peaks of the MRR, with a relatively narrow 3 dB bandwidth anda high extinction ratio as the narrowband filter. When a sawtooth voltage signal is applied on the
Vol. 10, No. 2, April 2018 5500807
IEEE Photonics Journal Photonic Multiple Microwave Frequency Measurement
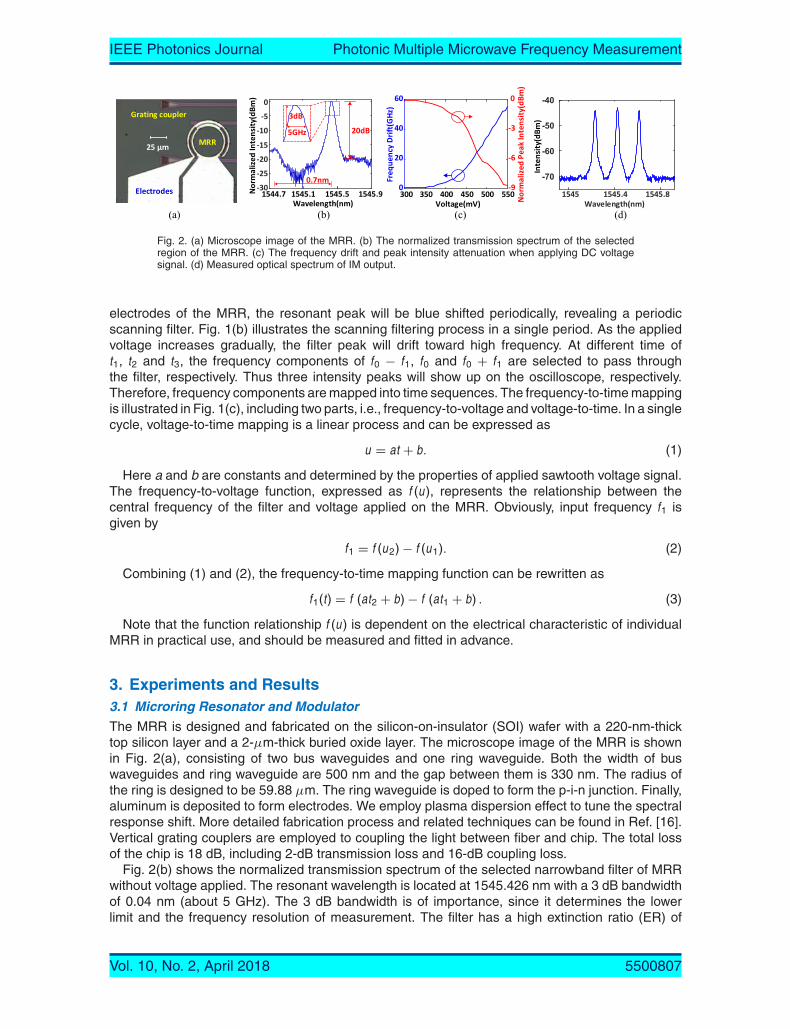
Fig. 2. (a) Microscope image of the MRR. (b) The normalized transmission spectrum of the selectedregion of the MRR. (c) The frequency drift and peak intensity attenuation when applying DC voltagesignal. (d) Measured optical spectrum of IM output.
electrodes of the MRR, the resonant peak will be blue shifted periodically, revealing a periodicscanning filter. Fig. 1(b) illustrates the scanning filtering process in a single period. As the appliedvoltage increases gradually, the filter peak will drift toward high frequency. At different time oft1, t2 and t3, the frequency components of f0 − f1, f0 and f0 + f1 are selected to pass throughthe filter, respectively. Thus three intensity peaks will show up on the oscilloscope, respectively.Therefore, frequency components are mapped into time sequences. The frequency-to-time mappingis illustrated in Fig. 1(c), including two parts, i.e., frequency-to-voltage and voltage-to-time. In a singlecycle, voltage-to-time mapping is a linear process and can be expressed as
u = at + b. (1)
Here a and b are constants and determined by the properties of applied sawtooth voltage signal.The frequency-to-voltage function, expressed as f (u), represents the relationship between thecentral frequency of the filter and voltage applied on the MRR. Obviously, input frequency f1 isgiven by
f1 = f (u2) − f (u1). (2)
Combining (1) and (2), the frequency-to-time mapping function can be rewritten as
f1(t) = f (at2 + b) − f (at1 + b) . (3)
Note that the function relationship f (u) is dependent on the electrical characteristic of individualMRR in practical use, and should be measured and fitted in advance.
3. Experiments and Results3.1 Microring Resonator and Modulator
The MRR is designed and fabricated on the silicon-on-insulator (SOI) wafer with a 220-nm-thicktop silicon layer and a 2-µm-thick buried oxide layer. The microscope image of the MRR is shownin Fig. 2(a), consisting of two bus waveguides and one ring waveguide. Both the width of buswaveguides and ring waveguide are 500 nm and the gap between them is 330 nm. The radius ofthe ring is designed to be 59.88 µm. The ring waveguide is doped to form the p-i-n junction. Finally,aluminum is deposited to form electrodes. We employ plasma dispersion effect to tune the spectralresponse shift. More detailed fabrication process and related techniques can be found in Ref. [16].Vertical grating couplers are employed to coupling the light between fiber and chip. The total lossof the chip is 18 dB, including 2-dB transmission loss and 16-dB coupling loss.
Fig. 2(b) shows the normalized transmission spectrum of the selected narrowband filter of MRRwithout voltage applied. The resonant wavelength is located at 1545.426 nm with a 3 dB bandwidthof 0.04 nm (about 5 GHz). The 3 dB bandwidth is of importance, since it determines the lowerlimit and the frequency resolution of measurement. The filter has a high extinction ratio (ER) of
Vol. 10, No. 2, April 2018 5500807

IEEE Photonics Journal Photonic Multiple Microwave Frequency Measurement
Fig. 3. (a) The expected filtering process and oscilloscope waveform due to filter peak attenuation.(b) The typical single frequency measurement waveform (blue curve, 25 GHz) and correspondingsawtooth voltage signal (red curve). (c) Measured waveforms on the oscilloscope of different singlefrequency signals.
20 dB. The suppression band in the lower wavelength side is more than 0.64 nm (about 80 GHz),indicating that the system is potential to achieve MFM up to 40 GHz.
Fig. 2(c) shows the filter response variation when different DC voltage signal is applied on theMRR. The blue curve shows the relationship between resonant frequency and voltage, apparentlya nonlinear and monotonic process. The resonant frequency changes obviously only when thevoltage is more than 300 mV. f (u) is obtained by fitting the curve with high order polynomial. Thered curve shows the filter peak decreases significantly when the voltage is higher than 400 mV.The decline may make the high frequency sideband high loss, resulting in failure of distinguishingthe effective intensity from the noise. We have also tested the performance of the IM, as shown inFig. 2(d). Here, the optical carrier is set at 1545.426 nm and input microwave frequency is set at25 GHz. There are obviously three frequency components, i.e., carrier and first-order sidebands.
3.2 Microwave Frequency Measurement
Proof-of-concept experiments have been carried out based on the set up shown in Fig. 1(a).Preliminary experiment shows that only two intensity peaks can be observed on the oscilloscopein a single scanning cycle, corresponding to lower sideband and carrier, as illustrated in Fig. 3(a).Since the peak of the filter will experience significant attenuation when driven by a high voltage (i.e.,at high frequency region), the high frequency sideband could not be measured effectively with theoscilloscope. Even so, two observed intensity peaks offer us enough information to estimate andretrieve the unknown frequency.
Based on the preliminary experiment, we optimize the parameters of all experiment setup, i.e.,sawtooth voltage range, repetition rate of sawtooth signal and optical carrier wavelength. The TLSgenerates a CW with an output power of 10 dBm at the wavelength of 1545.1 nm, about 40.75 GHz(i.e., 0.326 nm) away from the selected resonant peak. The sawtooth voltage, generated by a low-speed arbitrary waveform generator (AWG), is set with a repetition rate of 1 MHz and a voltagerange from 415 mV to 530 mV, shown in Fig. 3(b) (red curve). In this voltage range, the filter has adistinct frequency shift and only the lower sideband and carrier are scanned so that the scanningperiod is fully utilized, thus increasing the resolution of waveform.
Vol. 10, No. 2, April 2018 5500807
IEEE Photonics Journal Photonic Multiple Microwave Frequency Measurement
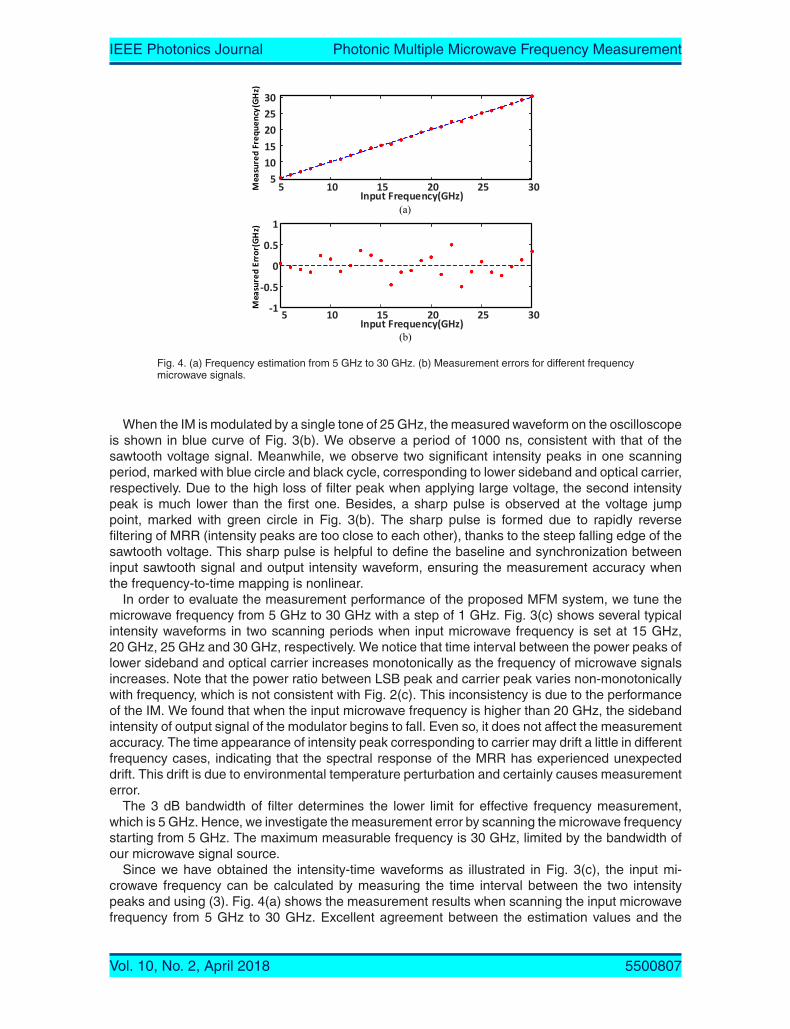
Fig. 4. (a) Frequency estimation from 5 GHz to 30 GHz. (b) Measurement errors for different frequencymicrowave signals.
When the IM is modulated by a single tone of 25 GHz, the measured waveform on the oscilloscopeis shown in blue curve of Fig. 3(b). We observe a period of 1000 ns, consistent with that of thesawtooth voltage signal. Meanwhile, we observe two significant intensity peaks in one scanningperiod, marked with blue circle and black cycle, corresponding to lower sideband and optical carrier,respectively. Due to the high loss of filter peak when applying large voltage, the second intensitypeak is much lower than the first one. Besides, a sharp pulse is observed at the voltage jumppoint, marked with green circle in Fig. 3(b). The sharp pulse is formed due to rapidly reversefiltering of MRR (intensity peaks are too close to each other), thanks to the steep falling edge of thesawtooth voltage. This sharp pulse is helpful to define the baseline and synchronization betweeninput sawtooth signal and output intensity waveform, ensuring the measurement accuracy whenthe frequency-to-time mapping is nonlinear.
In order to evaluate the measurement performance of the proposed MFM system, we tune themicrowave frequency from 5 GHz to 30 GHz with a step of 1 GHz. Fig. 3(c) shows several typicalintensity waveforms in two scanning periods when input microwave frequency is set at 15 GHz,20 GHz, 25 GHz and 30 GHz, respectively. We notice that time interval between the power peaks oflower sideband and optical carrier increases monotonically as the frequency of microwave signalsincreases. Note that the power ratio between LSB peak and carrier peak varies non-monotonicallywith frequency, which is not consistent with Fig. 2(c). This inconsistency is due to the performanceof the IM. We found that when the input microwave frequency is higher than 20 GHz, the sidebandintensity of output signal of the modulator begins to fall. Even so, it does not affect the measurementaccuracy. The time appearance of intensity peak corresponding to carrier may drift a little in differentfrequency cases, indicating that the spectral response of the MRR has experienced unexpecteddrift. This drift is due to environmental temperature perturbation and certainly causes measurementerror.
The 3 dB bandwidth of filter determines the lower limit for effective frequency measurement,which is 5 GHz. Hence, we investigate the measurement error by scanning the microwave frequencystarting from 5 GHz. The maximum measurable frequency is 30 GHz, limited by the bandwidth ofour microwave signal source.
Since we have obtained the intensity-time waveforms as illustrated in Fig. 3(c), the input mi-crowave frequency can be calculated by measuring the time interval between the two intensitypeaks and using (3). Fig. 4(a) shows the measurement results when scanning the input microwavefrequency from 5 GHz to 30 GHz. Excellent agreement between the estimation values and the
Vol. 10, No. 2, April 2018 5500807

IEEE Photonics Journal Photonic Multiple Microwave Frequency Measurement
Fig. 5. Intensity-time waveforms on the oscilloscope of multi-frequency signals.
Table 1
Performance Comparison of Microwave Multi-Frequency Measurement Systems
Solutions Range (GHz) Error (MHz) Resolution (GHz) Integration Nonlinear Optics
[8] 9–38 ±1 0.05 Yes Yes
[12] 15–45 ±1560 12.5 No No
[13] 0.1–20 200 0.25 No Yes
[15] 1–15 90 0.2 No No
This work 5–30 ±510 5 Yes No
input values can be seen. The measurement error is within ±510 MHz for different frequency mi-crowave signals, as illustrated in Fig. 4(b). As mentioned above, the measurement error is inducedby the 3 dB bandwidth of the filter, the nonlinearity of frequency-to-time mapping function andenvironmental temperature perturbation.
To verify the capability of multiple frequency measurement, two microwave signals with differentfrequencies are mixed (RF combiner, GTPD-COMB50G from Jitaitech) and loaded into the IM si-multaneously. Meanwhile, to make the intensity peak corresponding to carrier more distinguishable,the wavelength of TLS is adjusted to 1545.181 nm, about 30.625 GHz shifted from the resonantwavelength of filter. In addition, the sawtooth voltage is set from 424 mV to 507 mV. Fig. 5 showsthe measured results for the mixed frequency cases of 8 GHz and 12 GHz, 8 GHz and 13 GHz,8 GHz and 16 GHz, as well as 8 GHz and 20 GHz. The central and right peaks represent inputmicrowave of 8 GHz and optical carrier respectively and their appearance time is stable. One cansee the multiple frequencies can be distinguished easily for cases of 8 GHz mixed with 20 GHz,8 GHz mixed with 16 GHz, and 8 GHz mixed with 13 GHz. However, when the frequency differencebetween two signals is lower than 5 GHz, i.e., for the case of 8 GHz and 12 GHz, the measuredintensity peaks are hardly to be distinguished from each other. This indicates that the multiplefrequency resolution is about 5 GHz, limited by the 3 dB bandwidth of the selected filter.
Table 1 shows the performance comparison of existing microwave multi-frequency measurementsystems. It can be seen that the proposed MFM system has a compact size thanks to the useof silicon photonics chip and a relatively wide measurement range. Meanwhile, our scheme offers
Vol. 10, No. 2, April 2018 5500807
IEEE Photonics Journal Photonic Multiple Microwave Frequency Measurement
a simple structure and low cost solution, since no high-speed device is needed in the measure-ment process expect the intensity modulator. Besides, the avoidance of nonlinear effect such asstimulated Brillouin scattering makes the system more energy-efficient. The system can be furtherimproved by using an MRR with better performance. MRRs with higher quality factor [17] and highertuning speed [18] have been reported. The higher Q-factor guarantees improved accuracy, lowermeasurement limit and multi-frequency resolution, while high tuning speed reduces system latency.Meanwhile, the implementation of monolithic integrated microwave photonics (MWP) systems [19],[20] has been reported, which manifests that the proposed MFM system has potential to achievemonolithic integration thanks to its simple structure.
4. ConclusionIn conclusion, we have presented a frequency-to-time mapping MFM system that enables mea-surement of multiple frequency signals in a relatively wideband. Frequency estimation in a range of5–30 GHz with a measurement error under ±510 MHz is achieved. Besides, the resolution is about5 GHz for multi-frequency measurement. Our scheme offers a simple structure, low cost solution,capability of multiple frequency measurement and potential of chip-integration.
References[1] X. Zou, B. Lu, W. Pan, L. Yan, A. Stohr, and J. Yao, “Photonics for microwave measurements,” Laser Photon. Rev.,
vol. 10, no. 5, pp. 711–734, 2016.[2] J. Jiang et al., “Photonic-assisted microwave frequency measurement system based on a silicon ORR,” Opt. Commun.,
vol. 382, pp. 366–370, 2017.[3] D. Marpaung, “On-chip photonic-assisted instantaneous microwave frequency measurement system,” IEEE Photon.
Technol. Lett., vol. 25, no. 9, pp. 837–840, May 2013.[4] N. Sarkhosh, H. Emami, L. Bui, and A. Mitchell, “Reduced cost photonic instantaneous frequency measurement
system,” IEEE Photon. Technol. Lett., vol. 20, no. 18, pp. 1521–1523, Sep. 2008.[5] M. Burla, X. Wang, M. Li, L. Chrostowski, and J. Azana, “Wideband dynamic microwave frequency identification system
using a low-power ultracompact silicon photonic chip,” Nature Commun., vol. 7, Sep. 2016, Art. no. 13004.[6] L. A. Bui and A. Mitchell, “Amplitude independent instantaneous frequency measurement using all optical technique,”
Opt. Exp., vol. 21, no. 24, pp. 29601–29611, Dec. 2013.[7] J. S. Fandino and P. Munoz, “Photonics-based microwave frequency measurement using a double-sideband
suppressed-carrier modulation and an InP integrated ring-assisted Mach-Zehnder interferometer filter,” Opt. Lett.,vol. 38, no. 21, pp. 4316–4319, Nov. 2013.
[8] H. Jiang et al., “Wide-range, high-precision multiple microwave frequency measurement using a chip-based photonicBrillouin filter,” Optica, vol. 3, no. 1, pp. 30–34, 2016.
[9] M. Pagani et al., “Low-error and broadband microwave frequency measurement in a silicon chip,” Optica, vol. 2, no. 8,pp. 751–756, 2015.
[10] L. Liu et al., “Photonic measurement of microwave frequency using a silicon microdisk resonator,” Opt. Commun.,vol. 335, pp. 266–270, 2015.
[11] M. Pagani, K. Vu, D.-Y. Choi, S. J. Madden, B. J. Eggleton, and D. Marpaung, “Instantaneous microwave frequencymeasurement using four-wave mixing in a chalcogenide chip,” Opt. Commun., vol. 373, pp. 100–104, 2016.
[12] L. Nguyen, “Microwave photonic technique for frequency measurement of simultaneous signals,” IEEE Photon. Technol.Lett., vol. 21, no. 10, pp. 642–644, 2009.
[13] T. A. Nguyen, E. H. Chan, and R. A. Minasian, “Instantaneous high-resolution multiple-frequency measurement systembased on frequency-to-time mapping technique,” Opt. Lett., vol. 39, no. 8, pp. 2419–2422, Apr. 2014.
[14] S. T. Winnall and A. C. Lindsay, “A Fabry-Perot scanning receiver for microwave signal processing,” IEEE Trans. Microw.Theory Tech., vol. 47, no. 7, pp. 1385–1390, Jul. 1999.
[15] C. Ye, H. Fu, K. Zhu, and S. He, “All-optical approach to microwave frequency measurement with large spectral rangeand high accuracy,” IEEE Photon. Technol. Lett., vol. 24, no. 7, pp. 614–616, Apr. 2012.
[16] L. Liu, M. He, and J. Dong, “Compact continuously tunable microwave photonic filters based on cascaded siliconmicroring resonators,” Opt. Commun., vol. 363, pp. 128–133, 2016.
[17] M.-C. Tien, J. F. Bauters, M. J. R. Heck, D. T. Spencer, D. J. Blumenthal, and J. E. Bowers, “Ultra-high quality factorplanar Si3N4 ring resonators on Si substrates,” Opt. Exp., vol. 19, no. 14, pp. 13551–13556, Jul. 2011.
[18] X. Xiao et al., “44-Gb/s silicon microring modulators based on zigzag PN junctions,” IEEE Photon. Technol. Lett.,vol. 24, no. 19, pp. 1712–1714, Oct. 2012.
[19] J. S. Fandino, P. Munoz, D. Domenech, and J. Capmany, “A monolithic integrated photonic microwave filter,” NaturePhoton., vol. 11, no. 2, pp. 124–129, 2016.
[20] W. Zhang and J. Yao, “A silicon photonic integrated frequency-tunable microwave photonic bandpass filter,” in Proc.2017 Int. Top. Meeting Microw. Photon., 2017, pp. 1–4.
Vol. 10, No. 2, April 2018 5500807