photochemical delivery of bleomycin in malignant glioma cells
TRANSCRIPT

UNLV Theses, Dissertations, Professional Papers, and Capstones
5-2009
Photochemical delivery of bleomycin in malignant glioma cells Photochemical delivery of bleomycin in malignant glioma cells
Joseph William Blickenstaff III University of Nevada, Las Vegas
Follow this and additional works at: https://digitalscholarship.unlv.edu/thesesdissertations
Part of the Chemicals and Drugs Commons, and the Oncology Commons
Repository Citation Repository Citation Blickenstaff, Joseph William III, "Photochemical delivery of bleomycin in malignant glioma cells" (2009). UNLV Theses, Dissertations, Professional Papers, and Capstones. 1134. http://dx.doi.org/10.34917/2508291
This Thesis is protected by copyright and/or related rights. It has been brought to you by Digital Scholarship@UNLV with permission from the rights-holder(s). You are free to use this Thesis in any way that is permitted by the copyright and related rights legislation that applies to your use. For other uses you need to obtain permission from the rights-holder(s) directly, unless additional rights are indicated by a Creative Commons license in the record and/or on the work itself. This Thesis has been accepted for inclusion in UNLV Theses, Dissertations, Professional Papers, and Capstones by an authorized administrator of Digital Scholarship@UNLV. For more information, please contact [email protected].

PHOTOCHEMICAL DELIVERY OF BLEOMYCIN
IN MALIGNANT GLIOMA CELLS
by
Joseph William Blickenstaff III
Bachelor of Science in Physics Carnegie Mellon University
Pittsburgh, PA 2003
A thesis submitted in partial fulfillment of the requirements for the
Master of Science Degree in Health Physics Department of Health Physics
Division of Health Sciences
Graduate College University of Nevada, Las Vegas
May 2009

UMI Number: 1472399
INFORMATION TO USERS
The quality of this reproduction is dependent upon the quality of the copy
submitted. Broken or indistinct print, colored or poor quality illustrations
and photographs, print bleed-through, substandard margins, and improper
alignment can adversely affect reproduction.
In the unlikely event that the author did not send a complete manuscript
and there are missing pages, these will be noted. Also, if unauthorized
copyright material had to be removed, a note will indicate the deletion.
®
UMI UMI Microform 1472399
Copyright 2009 by ProQuest LLC All rights reserved. This microform edition is protected against
unauthorized copying under Title 17, United States Code.
ProQuest LLC 789 East Eisenhower Parkway
P.O. Box 1346 Ann Arbor, Ml 48106-1346

KJ i_ . •IUIL'JJ:MH'l.UJI^.mUt'JJAU
Thesis Approval The Graduate College
University of Nevada, Las Vegas
APRIL 29 , 20 09
The Thesis prepared by
JOSEPH BLICKENSTAFF
Entitled
PHOTOCHEMICAL DELIVERY OF BLEOMYCIN IN MALIGNANT GLIOMA CELLS
is approved in partial fulfillment of the requirements for the degree of
MASTER OF SCIENCE IN HEALTH PHYSICS
Ex
Graduate College Faculty Representative
Examination Committee Chair
Dean of the Graduate College
1017-53 11

ABSTRACT
Photochemical Delivery of Bleomycin in Malignant Glioma Cells
by
Joseph William Blickenstaff III
Dr. Steen Madsen, Examination Committee Chair Professor of Health Physics
University of Nevada, Las Vegas
Despite continued efforts, glioblastoma multiforme (GBM) remains an incurable form
of primary brain cancer. Surgical resection followed by radiation treatment and
chemotherapy have been the most effective modalities in prolonging median survival
time to 14 months. This research aims to study the response of two different cell culture
models to a novel drug delivery method termed photochemical internalization (PCI). PCI
is a technique to improve the utilization of macromolecules (e.g. the chemotherapeutic
drug bleomycin) in site-specific cancer therapy. This concept is based on the use of
specially designed photosensitizers (e.g. aluminum phthalocyanine disulfonate; AlPcS2a)
which preferentially localize in the membranes of endocytic vesicles.
The utility of PCI for treating malignant gliomas was investigated in vitro using: (1)
F98 rat glioma monolayer cells, and (2) biopsy-derived human glioma spheroids. For
both in vitro systems, PCI was found to interact in a synergistic manner resulting in
significant toxicity. For example, the combination of 1.5 J/cm2 photodynamic therapy
(PDT) and 0.25 (xg/mL bleomycin resulted in approximately 25% survival in F98 rat
glioma cells while only 35% of human glioma spheroids were observed to be growing
iii

two weeks post treatment. Overall, the degree of synergism was found to be less
pronounced in the spheroid model. Collectively, the results show that AlPcS2a-mediated
PCI can be used to enhance the efficacy of chemotherapeutic agents such as bleomycin in
malignant gliomas.
IV

TABLE OF CONTENTS
ABSTRACT iii
LIST OF FIGURES vii
ACKNOWLEDGMENTS viii
CHAPTER 1 INTRODUCTION: 1 1.1 Malignant glioma 1 1.2 F98 monolayer 6 1.3 Multicellular tumor spheroids 8 1.4 Bleomycin 16 1.5 Aluminum phthalocyanine disulfonate 20 1.6 Photodynamic therapy (PDT) 23 1.7 Photochemical internalization (PCI) 31 1.8 Scope of study r 33
CHAPTER 2 MATERIALS AND METHODS 34 2.1 Cell lines 34 2.2 Monolayer survival plating 36 2.3 Spheroid growth analysis 37 2.4 Bleomycin toxicity 38 2.5 PDT toxicity 38 2.6 PCI toxicity 39 2.7 Flow cytometry 39 2.8 Two-photon fluorescence microscopy (TPFM) , 40 2.9 Statistical analysis 41
CHAPTER 3 RESULTS 43 3.1 AlPcS2a and bleomycin toxicity in F98 monolayer 43 3.2 PDT toxicity in F98 monolayer 45 3.3 PCI toxicity in F98 monolayer 46 3.4 ACBT spheroid growth assays 49 3.5 Determination of spheroid cell viability by flow cytometry 54 3.6 Two-photon fluorescence microscopy 55
CHAPTER 4 CONCLUSIONS 57
APPENDICES 60
v

APPENDIX I ACBT spheroid growth assay p-values 60
APPENDIX II Flow cytometry raw data 61
REFERENCES 74
VITA 80
VI

LIST OF FIGURES
Figure 1 Primary brain tumor distribution by histology 1 Figure 2 Primary brain and CNS glioma distribution by histology 3 Figure 3 Monolayer of normal glial cells 7 Figure 4 Monolayer of F98 rat glioma cells 8 Figure 5 Human colon adenocarcinoma spheroid 11 Figure 6 Solid tumor and MTS growth curve 12 Figure 7 Structure of bleomycin and its analogues 16 Figure 8 Structure of AlPcS2a 21 Figure 9 PDT action mechanism 28 Figure 10 Jablonski diagram for photoactivation of singlet oxygen 28 Figure 11 Optical window in tissue 29 Figure 12 PCI diagram 32 Figure 13 Percent survival vs. AlPcS2a concentration for F98 monolayers 44 Figure 14 Percent survival vs. bleomycin concentration for F98 monolayers 44 Figure 15 Percent survival vs. PDT treatments 46 Figure 16 Percent survival vs. various treatments 48 Figure 17 Average spheroid diameter vs. days post-treatment 51 Figure 18 Average spheroid diameter vs. days post-treatment (first 8 days) 52 Figure 19 Percentage of spheroids viable for weeks 1 through 4 53 Figure 20 Flow cytometry results for percent composition 55 Figure 21 TPFM images of ACBT spheroids 48 hours post-treatment 56
vii

ACKNOWLEDGMENTS
This research project would not have been realized without the gracious support of so
many people. I would first like to thank my advisor, Dr. Steen Madsen, his assiduous
support and exceptional guidance throughout have been invaluable.
I wish to extend my thanks to the thesis committee members Dr. Phillip Patton, Dr.
Ralf Sudowe, and Dr. Mack Rubley whose knowledge and excellent assistance ensured
the success of this project.
Special thanks are also in order for the wonderful support of Van Vo, Mary Turner,
and Doris Coomes during the course of my research and studies at UNLV.
I would finally like to express my gratitude to all my friends and family. Thank you,
Emily, for all your encouragement and support over the years. I dedicate this work to my
mother and father, for showing me the right paths and never letting me doubt that I could
take them.
vm

CHAPTER 1
INTRODUCTION
1.1 Malignant glioma
While primary malignant brain tumors account for only 2% of all cancer cases in the
United States, their prognoses are among the worst as they also account for 2% of all
cancer related deaths each year (Chandana et al. 2008; Newton 2008). Brain tumors are
classified, according to the World Health Organization (WHO), by cellular origin and
histologic appearance. For all primary brain tumors, the Central Brain Tumor Registry of
the United States (CBTRUS) compiles incidence statistics by histology (Fig. 1).
AU Other
Lymphoma 2.8%
Nerve Sheath 9.0%
Cra niopha ry ngio ma 0.7%
Glioblastoma 18.5%
Gliomas account for 36% of all tumors and 81% of malignant tumors
Astrocytomas 8.5%
Ependymomas 2.1%
Oligode ndrogliomas 3.0%
Embryonal, including Mcdulloblastoma
1.5%
Pituitary
8.4% . , , , , , . , . , , . ,
Meningioma 32.1%
Figure 1. Primary brain and CNS tumor distribution by histology; collected 2000-2004 (n=73,583). (Adapted from CBTRUS 2008)
1

All primary brain tumors present with similar symptoms, regardless of histology. Some
of these symptoms include (in decreasing occurrence rate): headache, memory loss,
seizures, personality change, visual problems, nausea or vomiting (Chananda et al. 2008).
The locations of headaches and severity of other symptoms can aid in diagnosis. A
cranial magnetic resonance imaging (MRI) scan with gadolinium contrast is typically all
that is necessary to diagnose a primary brain tumor. However, computed tomography
(CT) can also be used to better localize and measure the tumor's dimensions. CBTRUS
reports an age-adjusted incidence for primary brain tumors to be 6.45 in 100,000 people
per year (CBTRUS 2008). This figure has increased in recent years, yet numerous
studies have failed to connect most environmental factors to an increased risk of brain
tumor development. Factors such as electromagnetic fields, pesticides, cellular phones,
head trauma, and N-nitroso compounds have all been studied with inconclusive results.
Increased exposure to ionizing radiation is the only proven factor to increase risk. Even
low doses have been shown to increase incidence of meningiomas by a factor of 10 and
glial tumors by a factor of 3-7. The latency period for such occurrences is 10-20 years
after being exposed (DeAngelis 2001). The median survival depends significantly on the
histology and malignancy of the tumor, but there are factors that show a favorable
prognosis for patients. These factors include: patients younger than 60 years, patients
presenting with seizures, tumor located in the frontal lobe, absence of tumor necrosis, and
total or near-total bulk resection (Chandana et al. 2008). Primary brain tumors rarely
metastasize outside the central nervous system (CNS) leading to no real standard of
staging.
2

Gliomas comprise the vast majority of malignant brain tumors, and still remain
incurable. Gliomas account for 36% all primary brain tumors and 81% of malignant
tumors (CBTRUS 2008). Symptoms are similar to those of other primary brain tumors
with headaches occurring in 50% of patients. In malignant gliomas, seizures are less
prevalent occurring in only 15-25%, while mental-state abnormalities in general occur in
40-60% of all patients. Gliomas can be pathologically graded according to the presence
or absence of nuclear atypia, mitosis, microvascular proliferation and necrosis
(DeAngelis 2001). Grades I and II tumors are both low-grade (i.e. and grades III and IV
are high-grade. Of all malignant gliomas, glioblastoma multiforme (GBM) is the most
malignant and common comprising (along with other astrocytomas) 75% of all gliomas
(Fig. 2, CBTRUS 2008).
All Other Gliomas 11.1%
Astrocytomas and glioblastomas account for 75% of all gliomas Ependymomas
5.8%
Oligode ndrogliomas
8.4% B - ™ ™ — — — - ^
Glioblastoma 51 2% Pilocytic Astrocytoma > ^ ^ ^ '
5.8%
Diffuse Astrocytoma 1.5%
Anaplastic Astrocytoma-
7.5% All Other Astrocytomas
8.7%
Figure 2. Primary brain and CNS glioma distribution by histology subtypes; collected 2000-2004 (n=26,630). (Adapted from CBTRUS 2008)
3
GBM is the most common brain tumor in adults and accounts for approximately 40%
of primary tumors and 80% of high-grade primary CNS neoplasms and is classified as a
grade IV astrocytoma (Newton 2008). GBM comprises 18.5% of all reported brain
tumors and affects 3 in every 100,000 people per year with a median age at diagnosis of
64 years (CBRTUS 2008). GBM growth is characterized as having a high cellular
motility and a resistance to apoptosis. As with other gliomas, GBMs are heterogeneous
both histologically and genetically. These factors result in extreme difficulties when
treating GBMs. Gross GBM tumor pathology is characterized by a central core of
necrosis surrounded by pseudopalisading cells along with angiogenesis. Typically these
cells will infiltrate several centimeters or more away from the bulk tumor into the
surrounding brain (DeAngelis 2001). This infiltration, along with the production of
glutamate which acts to kill surrounding brain cells, facilitates rapid tumor expansion.
Furthermore, glioma cells have demonstrated the ability to quickly change shape and
volume as they move further into surrounding parenchyma (Lefranc 2009). All of this
leads to GBM being an extremely aggressive and difficult cancer to treat. The median
survival rate remains only 14.6 months when utilizing the current treatment standard of
maximum tumor bulk resection followed by radiotherapy and chemotherapy with
temozolomide (TMZ) (Newton 2008; Lefranc 2009).
While there have been recent advancements in the treatment of GBM, relative
survival rates have increased very little. The one, three, five, and ten-year relative
survival rates for GBM are 29.6, 5.2, 3.4, and 2.4 respectively (CBTRUS 2008). These
values have improved only slightly compared with data collected over a decade prior.
The current standard treatment once a patient is diagnosed with GBM begins with a
4

surgical resection of the tumor. This resection, or de-bulking, is performed by
aggressively removing as much tissue as possible without adversely affecting the patient's
quality of life. Resection not only removes tumor tissue, but will reduce intracranial
pressure that leads to many of the common symptoms.
Following surgery, the patient is typically administered radiotherapy and
chemotherapy in combination. Radiotherapy is generally given in the form of external
beam, administered in 2 Gy fractions daily for 30 fractions. A total dose of 60 Gy is
often followed by a subsequent boost dose. Several chemotherapy options exist, with the
most recent standard being TMZ. This is typically given in 75 mg/m2 per day for the 6
weeks during radiotherapy treatment. This is followed by at least 6 cycles of 150-200
mg/m2 per day for 5 days given every 28 days (Newton 2008). This protocol was shown
to improve the median survival rate of patients from 12.1 to 14.6 months when compared
to radiotherapy alone (Chandana et al. 2008; Newton 2008). An increase in two-year
survival rate from 10.4% to 26.5% was also seen when compared to traditional
radiotherapy alone. Even more impressive increases in the three and four-year survival
rates were also observed. The three-year survival rate increased from 4.3% to 16.7% and
the four-year went from 3.8% to 12.9% (Newton 2008). The survival rates given here by
Newton (2008) are slightly different than those found in the CBTRUS 2008 Report as
their pool of data was collected over different time scales.
Beyond the standard treatment protocol, several alternative medicines are being
studied. Some of these alternative medicine treatments include: methyl guanine and
methyl transferase (MGMT) promoter methylation, epidermal growth factor receptor
(EGFR) inhibitors, antiangiogenics, as well as other growth factor and signal transduction
5

targeted drugs. MGMT has shown some promise, but it, along with the other drugs, is
still in clinical trials (Chandana 2008; Fadul et al. 2008; Newton 2008).
The most likely reason for chemotherapy's poor results lies in poor drug transmission
across the blood-brain barrier. The difficult delivery of some drugs to the CNS as well as
the genetic differences from one tumor to another has led some to propose genotyping
each tumor and custom fitting treatments, in order to fit each individual patient's needs.
This type of individual treatment will unfortunately take many years to develop. It can be
agreed that while recent advancements have made incremental steps forward, there is a
dire need to develop new and more effective therapies for GBM (DeAngelis 2001; Fadul
et al. 2008).
1.2 F98 monolayer
F98 is an undifferentiated rat glioma cell line that shares many characteristics with
human GBMs, and is used in this study to examine all therapeutic effects on monolayer
configurations. The F98 cell line is morphologically different from normal glial cells,
which typically form a monolayered configuration similar to that of epithelial cells. Glial
cells have a polygonal cell body with profuse cytoplasm and a flat nucleus (Fig. 3). The
nucleus often contains multiple nucleoli, but the amount of cytoplasm present in the cell
grants it a low nuclear-cytoplasmic ratio. Glial cells typically have long processes that
are thin and interdigitated with other glial cells at confluence. Normal glial cells have a
low mitotic index. Ko et al. (1980) measured average glial cell body diameters to be 39.8
± 5.0 urn Also measured by Ko et al. were the average number of processes (2.6 ± 0.2)
and process length (114.1 ±11.2 um). Glioma cells are distinctive in the criss-crossed
6
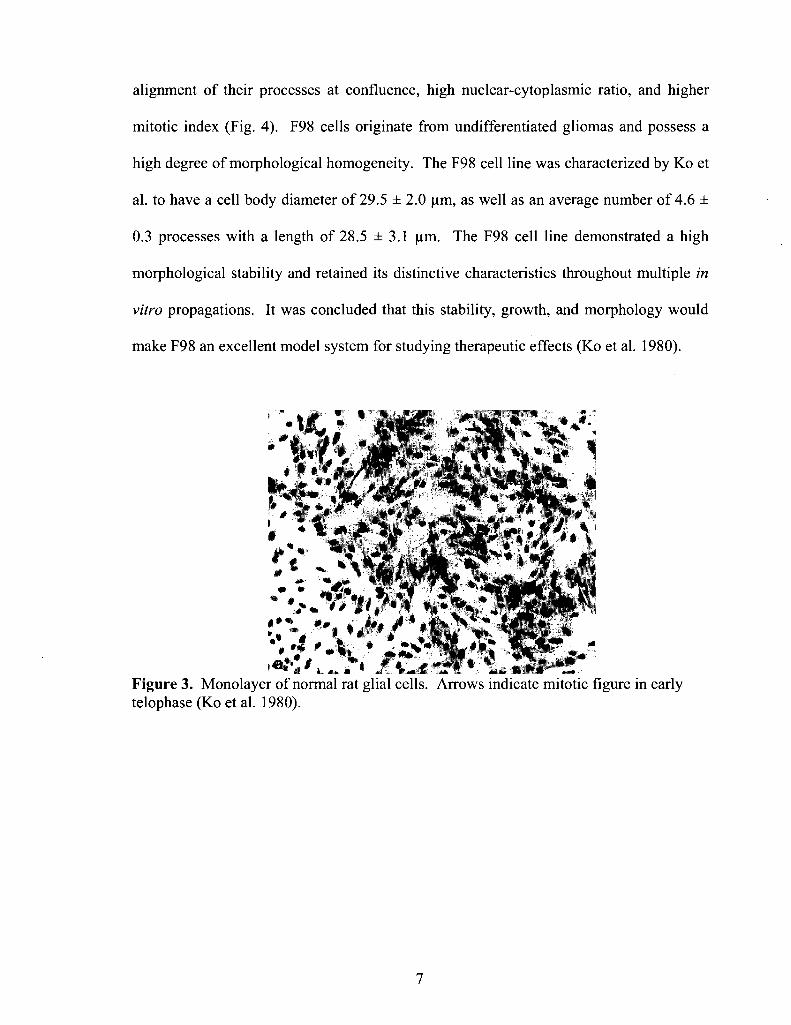
alignment of their processes at confluence, high nuclear-cytoplasmic ratio, and higher
mitotic index (Fig. 4). F98 cells originate from undifferentiated gliomas and possess a
high degree of morphological homogeneity. The F98 cell line was characterized by Ko et
al. to have a cell body diameter of 29.5 ± 2.0 jam, as well as an average number of 4.6 ±
0.3 processes with a length of 28.5 ± 3.1 urn. The F98 cell line demonstrated a high
morphological stability and retained its distinctive characteristics throughout multiple in
vitro propagations. It was concluded that this stability, growth, and morphology would
make F98 an excellent model system for studying therapeutic effects (Ko et al. 1980).
Figure 3. Monolayer of normal rat glial cells. Arrows indicate mitotic figure in early telophase (Koetal. 1980).
7

Figure 4. Monolayer of F98 rat glioma cells. Arrows indicate mitoses (Ko et al. 1980).
F98 glioma cells are specifically applicable for this study, because they share many
characteristics of in vivo growth with human GBM cells (Madsen et al. 2007). When
used to induce tumors in Fisher rats, F98 tumors exhibit rapid growth, infiltrative
behavior, extensive neovascularization, and absence of encapsulation (Barth RF 1998).
F98 cell cultures will be used to study several therapeutic effects in a monolayer cell
model.
1.3 Multicellular tumor spheroids
While monolayer cell cultures such as F98 have proven to be well established for use
in biomedical experiments, there are limitations in utilizing these two-dimensional in
vitro models. Monolayer cell cultures allow for a well-controlled cellular environment
that is easy to analyze in comparison to in vivo studies. Experiments performed in vivo
better replicate the cellular environment, but are much more complex, costly, and
unpredictable. Thus arose the need for a middle ground between control and complexity.
8

Multicellular tumor spheroids (MTS) are not new to the field of biomedical research.
They have been in use since the 1940s and 1950s when Holtfreder and Moscona
separately worked on using these spheroidal aggregates of cells to study embryonic and
malignant cells (Mueller-Klieser 2000). It was, however, Robert M. Sutherland and
others that pioneered the use of MTS in cancer research beginning in the 1970s. The
bulk of Sutherland's research revolved around the response of MTS to therapy. Most of
the initial work focused on ionizing radiation therapies. Since then, MTS have been
widely used to investigate various biological mechanisms and specific cellular responses
to a broad range of therapeutic techniques. Their well organized morphology
incorporates cell-cell interactions including gene and growth factor expressions, as well
as oxygen and nutrient gradients (Kim 2005). Not all cell lines are able to form MTS, but
several techniques have made it possible for many cell types to bridge that experimental
gap between two-dimensional cell cultures in vitro and tumors in vivo.
MTS are meant to simulate the characteristics of avascular tumor nodules and
microregions in vivo. They take advantage of homotypic aggregation, a common
characteristic of malignant cells. Their natural tendency towards cell-cell adhesion
allows for this self-propelled growth in vitro. As the spheroids grow in diameter, they
begin to develop a complex cellular environment, directly applicable to what is found in
human tumors. Three classes of cells are commonly found in human tumors. The first
class being that of proliferating cells found on the tumor's perimeter and always near
ready sources of nutrients and oxygen. These proliferating cells are characterized by
rapid growth and a high mitotic index. The second class of cells is in a quiescent state
and these cells are located further away from capillaries and other sources of nutrients
9

that limit growth and division. These cells are still provided sufficient nutrients to
survive, but have stopped cycling. Further separated from any nutrient and or oxygen
sources is the third class, the necrotic cells (Venkatasubramanian et al. 2006).
MTS are ideally suited to mimic this type of cellular organization within tumors.
MTS are characterized by a viable ring (100-220 um; Sutherland 1988) of proliferating
cells followed by quiescent cells. The proliferating cells compose the outermost 3-5 cell
layers (75 um; Sutherland 1988). Once an MTS is of sufficient size (100-600 (xm in
diameter; Kunz-Schughart 1999) a necrotic core will begin to develop. The size at which
an MTS will develop this necrotic core varies greatly between cell types. These
variations are the result of differences in substrate consumption rates, cell packing
densities, and concentrations of substrate within the medium (Sutherland 1988).
MTS growth is very similar to that of solid tumors. Tumors begin at the microscopic
level and undergo avascular growth followed by angiogenesis (Guiot et al. 2003). This
ensures the tumor's continued expansion and infiltration into the local tissue. The tumor
can progress to metastasize depending on the type of cancer. In much the same fashion,
MTS growth can be described to occur in three phases. First, the spheroid will undergo
an initial exponential growth period (typically up to 200 um in diameter). In this phase,
several cells have loosely aggregated and all are highly proliferative. Slowly,
intercellular links, such as gap junctions, form and a more compact spheroid begins to
appear (Fig. 5). At this point the second phase of MTS growth begins. This phase is
marked by an increasing accumulation of a second cell layer in which cells are no longer
proliferating. These quiescent cells act to retard the growth process. The MTS is now
10

increasing linearly and a necrotic core has begun to emerge. This linear growth will
continue until the MTS asymptotically approaches a maximum size.
Figure 5. 1400x magnification of a human colon adenocarcinoma spheroid depicting the compact shape while still showing individual cells (Santini et al. 1999).
Proliferative cells still remain on the surface, but only act to replace cells lost through
necrosis and shedding (Folkman and Hochberg 1973; Mueller-Klieser 1987; Dubessy et
al. 2000). No matter how preferable the environmental conditions are, the MTS will act
to self-regulate its size without the addition of angiogenesis that allows human tumors to
continue to grow (Folkman and Hochberg 1973). The growth curve is illustrated in
Figure 6. Mathematical analysis by Chignola et al. (2000) was able to forecast the
growth of both rat and human glioblastoma MTS using a modified Gompertz growth
equation. Their work showed that MTS growth exhibits both variability and saturation.
11

Variability refers to MTSs of identical cell lines whose kinetics at any time during growth
will demonstrate different volumes. The same spheroidal volumes will eventually both
saturate in growth and equal each other (Chignola et al. 2000). This demonstrates that
given different initial conditions, MTS of identical cell lines should reach similar
maximum volumes.
TUMOR
Figure 6. Illustration of solid tumor and MTS growth curve (Mueller-Klieser 1987).
One could conclude that while many experiments, both in vitro and in vivo, end
before maximum volume is attained, this finding would allow the prediction of when that
maximum volume would have been achieved. This would facilitate the direct
comparison of growth delays caused by therapeutic effects. MTS maximum growth is
directly regulated by cell death at the spheroid center. Cell death is believed to be
12

primarily caused by necrosis inside the MTS. The development of this necrotic core is
poorly understood and most likely depends on a complex set of factors that include
hypoxia (Mueller-Klieser 2000). It has been shown that maximum volume is positively
correlated with the thickness of the MTSs viable rim, while not being correlated to:
species, cell type, monolayer or spheroid growth rates, clonogenic capacity, cell packing
density (Freyer 1988). Those MTS studied exhibited 50-70% of their maximum volume
to be central necrosis. The conclusion was that certain products generated during the
necrotic process acted as cell proliferation inhibitors. It is interesting to note that the
doubling time of some spheroids has been shown to correlate with the growth rates of
those tumors from which the MTS are generated and this doubling time is longer than
that of a monolayer culture from that same tumor (Dubessy et al. 2000). This suggests
that MTS more closely mimic the heterogeneous environment in human tumors when
compared to monolayer experiments.
MTS have several advantages and limitations for use in studying the efficacy of
therapeutic techniques when compared to monolayer cell cultures. These differences
manifest primarily through the cell-cell and cell-matrix interactions that an MTS model
provides. In fact MTS and monolayer should be regarded as two distinct models. The
different phenotypes of cells within an MTS are arranged in an orderly fashion making
the correlation between structure and function possible. Cellular organization is possible
through multiple intercellular membrane contacts such as microprojections, tight
junctions, and desmosomes. Intercellular communication through gap junctions and the
production of extracellular matrix are made possible by these contacts (Dubessy et al.
2000). The very structure of the MTS changes the cells' shapes and cellular environment
13

which affects gene expression and therefore biological behavior (Mueller-Klieser 2000).
This leads to the primary difference between a two-dimensional and three-dimensional
cell culture. In MTS, an extensive extracellular matrix (ECM) comprised of proteins and
polysaccharides is formed. In addition to many proteins and growth factors, the ECM
contains fibronectin, collagen, laminin, hyaluronate, heparan sulfate, and elastin, all in a
proteoglycan gel (Carlsson and Nederman 1989; Santini et al. 2000). The ECM and
proteins responsible for cell adhesion, such as integrin, play a vital role in cell survival,
growth, and death (Santini et al. 2000). Cell adhesion actually acts to inhibit apoptosis.
Apoptosis is a complex phenomenon whose role in tumor growth is still being studied.
Recent findings have shown that contrary to common belief, tumor growth is not solely
the result of the tumor cell's higher proliferative capacity. It is not simply that tumor
cells grow and divide quicker than normal cells. In fact, tumor growth is the result of an
imbalance between the production and loss of cells throughout their cell cycle (Santini et
al. 2000). Through the loss of apoptotic regulation, tumor cells will proliferate in an
uncontrolled manner.
All of these complex interactions are what make MTS ideal for studying tumor
response to a multitude of treatments. MTS have been show to exhibit a multicellular-
mediated resistance to various chemotherapeutics that was lost when the same cells were
disaggregated and treated in a monolayer (Mueller-Klieser 2000). Their three-
dimensional structure creates oxygen, nutrient, and pH gradients that result in quiescent
cells which are more resistant to chemotherapy, ionizing radiation, and photodynamic
therapy. Quiescent cells possess the ability to repair both potentially lethal damage and
sublethal damage (Dubessy et al. 2000). For all these reasons, MTS have been suggested
14

as mandatory test models in cancer research (Mueller-Klieser 2000). There are, however,
several limitations to the use of MTS in modeling treatment efficacies. One of the very
fundamental issues is that many of the unique properties that allow MTS to replicate
characteristics of solid tumors are poorly understood. These properties include the
formation of a necrotic core, apoptotic suppression, in addition to the effects of cell
adhesion, ECM, and epidermal growth factors affect cell viability. The ECM in MTS is
actually different from that of tumors in vivo since it is of tumor cell origin as opposed to
being produced from the surrounding tissue stroma. This will change the gene
expressions within the ECM (Kim 2005).
All of these are important distinctions from monolayer cell cultures; which are easier,
more inexpensive, and faster to work with. Monolayer cells are also grown in conditions
of optimal growth and re-oxygenation which can be useful in describing a cell line's
specific characteristics. Monolayer cell cultures do lack gradients and are not very
representative of actual tumor response to treatment. Normal epithelial cells grown as
monolayer have demonstrated highly plastic characteristics and actually mimicked
certain traits of tumor cells in vivo (Kim 2005). The final limitation of MTS is their
variability with respect to growth which results from a sensitivity to environmental
conditions. MTS of identical genotype within the same culture have demonstrated a
coefficient of variance of up to 10% despite efforts to normalize all spheroids to the same
size (Mueller-Klieser 2000). Freyer and Sutherland also found that fluctuations in
oxygen or glucose concentrations within their culture medium caused large changes in
the MTS growth rates and extent of central necrosis (Freyer and Sutherland 1986).
Human glioma spheroids have shown a large variance in hypoxic markers bound next to
15

the necrotic core suggesting that oxygen levels are not necessarily static and predictable
once necrosis has formed (Mueller-Klieser 2000). It can become very difficult to monitor
all these parameters and thus growth rate variations should be expected.
While the MTS model does have its limitations, the ability to better mimic the tumor
microenvironment far outweighs these disadvantages. MTS have been shown to be a
crucial link between monolayer in vitro culturing and tumor work in vivo. MTS are
particularly useful when studying resistance to ionizing radiation, photodynamic, and
drug therapies.
1.4 Bleomycin
The drug under investigation for this research is a chemotherapeutic called bleomycin
(BLM) (Fig. 7). Bleomycin is a glycopeptic antibiotic whose molecular weight is 1.5
kDa. It was discovered by Umezawa et al. in 1966 and is cytotoxic to eukaryotic cells
due to its ability to bind to and degrade DNA (Stubbe and Kozarich 1987).
CONM, NH,
MO o
docerbamoyl - * O ^ ^ N H ,
Figure 7. The structure of bleomycin (Stubbe and Kozarich 1987).
16

The bleomycin molecule has a large hydrophilic structure comprised of four parts: a
terminal amine, bithiazole, pseudopeptidic, and glycannic (Mir et al. 1996). The terminal
amine group interacts with nucleic acids. The bithiazole part binds to DNA and interacts
with the DNA minor groove. Binding to transition metals and DNA sequence
recognition are performed by the pseudopeptidic part. The final, glycannic, part's
function is still unknown. Bleomycin forms metal oxide complexes by both binding to
__ O-J- 0-4- _~ 0-4- 0-f- 0 I
oxygen as well as redox-active transition metal ions Fe , Co , Zn , Ni , and CuZT
(Stubbe and Kozarich 1987). Bleomycin requires the presence of oxygen in order to
initiate DNA breaks. Bleomycin has limited ability to penetrate the cell membrane and is
found to accumulate in endocytic vesicles. Therefore, bleomycin typically enters the cell
through receptor-mediated endocytosis by binding to a 250 kDa receptor on the
membrane (Berg et al. 2005). Once inside the cytosol, bleomycin is a very potent drug,
however, it must diffuse to the nucleus in order to interact with DNA.
Bleomycin is typically used as a chemotherapeutic for the treatment of squamous cell
carcinomas of the head and neck, esophagus, bronchus, and skin, as well as testicular
cancer and Hodgkin's and non-Hodgkin's lymphoma (Mir et al. 1996; Berg et al. 2005).
Side effects include pneumonitis (occurs in 46% of patients) and lung fibrosis (occurs in
3%) which can present after a total cumulative dose of 300 mg BLM/m2 (Mir et al. 1996).
Patients are typically treated two to three times per week or given a continuous low dose
for several days. The drug has a biological half-life in blood of 2-4 hours after
intravenous injection, with 70% excreted after the first 24 hours (Mir et al. 1996). Renal
excretion is the primary mode of clearance from the body. Wolff et al. (1999) performed
a meta-analysis on over a thousand articles in order to summarize LC50 (drug
17

concentration required to kill 50% of the cells treated) values for several
chemotherapeutic drugs. All the data were taken for the treatment of glioma cells and
bleomycin was found to have an LC50 value of 18.6 mg/L.
Once bleomycin has entered the cell through an endosome, it faces several barriers to
its final target, the nucleus. The first barrier is degradation by hydrolytic enzymes, of late
endosomes and lysosomes. The protein, bleomycin hydrolase, is believed to inactivate
bleomycin by catalytically deaminating the molecule. The exact location and role of
bleomycin hydrolase is not well understood, but its function has been demonstrated (Mir
et al. 1996). Furthermore, bleomycin resistance proteins (BRP) have been shown to
inactivate bleomycin by forming a stable complex with it and preventing the molecule
from reaching DNA. BRP are a group of binding proteins with a high specificity for
bleomycin. These proteins are found in the microorganisms that produce bleomycin and
bleomycin derivatives. It is no surprise that with all these barriers only 0.1% of the
bleomycin added to a medium will make it inside the cells (Roy and Horwitz 1984). If
bleomycin were able to therapeutically bypass these barriers, then its true potency could
be realized.
Bleomycin cytotoxicity lies in its ability to create single- and double-strand breaks in
DNA and other nucleic acids. In this way, bleomycin has a very similar effect to that of
ionizing radiation damage. Bleomycin's cytotoxic effect does vary between different
tumor genotypes and is affected by interactions with the cellular membrane, the cell's
ability for DNA repair, bleomycin hydrolase activity, the cellular uptake mechanisms,
and the rate of bleomycin efflux (Berg et al. 2005). DNA cleavage occurs at the GC base
pairs. Bleomycin is secured onto the DNA by the bithiazole and terminal amine parts and
18

often produces two breaks, one each on opposite strands of the DNA. Bleomycin could
be considered a miniendonuclease because one molecule can produce 8-10 DNA breaks.
There's also one double-strand break for every 6-8 single-strand breaks on average
(Povirk et al. 1977). Bleomycin is known to cleave the DNA linker between two
consecutive nucleosomes, telomere synthetic sequences, and RNAs. This extensive
chromosome fragmentation does lead to some genotoxic effects. Chromosome
aberrations such as deletions, dicentrics, multicentrics, rings, exchanges, breaks, and gaps
are all induced (Mir et al. 1996). Bleomycin does not however induce sister-chromatid
exchanges. There is no limit to the number of targets that bleomycin can attack once
inside the cell. These attacks occur less than 30 seconds after the cell's membrane has
been breached (Tounekti et al. 1993). Selective electropermeabilization has
demonstrated that as little as a few hundred internalized bleomycin molecules are
sufficient to induce cell death.
There are a number of different types of cell death including necrosis and apoptosis.
Necrosis is characterized by cell swelling, membrane ruptures, and the dissolution of
organized structures, while apoptosis is marked by the shrinkage of cells and chromatin
condensation (Tounekti et al. 1993). Necrosis is a far slower process in which the DNA
is finally degraded by lysosomal enzymes and apoptosis, also referred to as programmed
cell death, is a far swifter process where internal endonuclease is activated which then
digests the DNA. A third type of cell death is observed following exposure to ionizing
radiation. This is termed mitotic death in which the cell will complete one mitotic cycle
before simply disintegrating. This is generally caused by exposure to low-dose ionizing
radiation in which the cell remains viable, just no longer able to reproduce. Tounekti et
19

al. (1993) demonstrated that bleomycin acted in an identical fashion to ionizing radiation
in how it attacked and killed cells. They were able to relate the number of bleomycin
molecules internalized with the type of cell death produced. At low bleomycin
concentrations, cells arrested in the G2/M phase and died a certain amount of time later.
This period was equal to that of three cell doubling times and correlated well with mitotic
cell death. For high concentrations of bleomycin, cell death occurred in an identical
fashion to apoptosis. Tounekti et al. (1993) were also able to rule out several other
possible contributors, such as free radical species and endonuclease in order to determine
that cell death was a direct result of the bleomycin. This report concluded that
approximately 3000 bleomycin molecules resulted in mitotic death, just as seen with low
dose ionizing radiation and that 3 million internalized bleomycin molecules caused cell
apoptosis, which is seen with high doses of ionizing radiation (Tounekti et al. 1993).
There is no doubt as to the powerful cytotoxicity of bleomycin. Relatively few molecules
can create severe damage once they have passed the cell membrane. These
characteristics of bleomycin makes it ideally suited for use in photochemical
internalization, where drugs are selectively released into the cell cytosol. The next
requirement is the use of an appropriate membrane localizing photosensitizer.
1.5 Aluminum phthalocyanine disulfonate (AlPcS2a)
The photosensitizer chosen for this study is a metal-based phthalocyanine which
belongs to a group of second-generation photosensitizers characterized by their high-
efficiency in the red visible wavelength.
20

The chemical structure of AlPcS2a gives this photosensitizer unique properties useful
for PCI applications. Phthalocyanines are traditionally water insoluble, but the
sulfonation of these molecules allows them to become biologically active (Berg et al.
1989). Thus, AlPcS2a, which is sulfonated on two of its adjacent isoindole units, is water
soluble and has an asymmetrical distribution of its polar groups (Edrei et al. 1998;
Bonneau et al. 2004) (Fig. 8). The amphiphilic nature of AlPcS2a allows it to favorably
interact with cell membrane structures. The photosensitizer alone possesses no local or
systemic toxicity and is resistant to dimerization and aggregation once incorporated into
the cell (Edrei et al. 1998; Maman et al. 1999). The primary advantage of AlPcS2a and
other metallated phthalocyanines is their absorbance spectrum.
SOi Figure 8. The structure of AlPcS2a-
In addition to its chemical properties, AlPcS2a's light absorbance and fluorescence
characteristics are well suited for administration in biological tissue. AlPcS2a's peak
absorbance in aqueous solution is 675 nm (Kunz et al. 2007). The optimum range of
wavelengths for light penetration into tissue is between 650 - 680 nm (Edrei et al. 1998).
Earlier, first-generation photosensitizers such as Photofrin, had peak absorbance around
21

630 nm, which resulted in about half the penetration depth (Chan et al. 1997). In
addition to light absorbance in a favorable wavelength range, AlPcS2a has the benefit of
low absorption in other parts of the visible spectrum (Chan et al. 1997). This reduces the
risk to cutaneous photosensitization post-treatment. Compared to Photofrin, patients do
not have to wait as long for the drug to clear their system. These absorption benefits only
occur in the photosensitizer's monomer form, further supporting the need for low
aggregation. The optimum absorption wavelengths for AlPcS2a in PBS are 672 nm and
640 nm in the monomer and aggregate bands respectively (Edrei et al. 1998).
Aggregation is a result of both chemical structure and localization of the photosensitizer
within the cell. Changes in fluorescence localization are easily measured and can be used
to determine changes in photosensitizer distribution.
AlPcS2a primarily localizes in lipid membranes which favors cellular uptake by
endocytosis (Edrei et al. 1998; Maman et al. 1999; Bonneau et al. 2004; Kunz et al.
2007). The photosensitizer's amphiphilic chemical structure allows lipid bilayer
penetration. The charged sulfonate group is oriented in the outer aqueous phase, where it
is hydrated, and the neutral hydrophobic functional group becomes buried in the lipid
structure (Maman et al. 1999). Transport across the lipid bilayer has been studied and
found to be an extremely slow process (on the order of hours). Due to this slow nature of
cellular uptake, passive diffusion of this molecule is highly unlikely (Maman et al. 1999;
Bonneau et al. 2004). The primary mechanism for cellular uptake is the incorporation of
AlPcS2a into endosomes and lysosomes. These endocytic vesicles are disrupted by
photosensitizer-mediated production of singlet molecular oxygen which leads to the
diffusion of AlPcS2a into the cytosol. The exact mechanism of this disruption will be
22

detailed in the following section. Uptake concentrations are highly dependent on
environmental factors such as cell line, incubation conditions and time, medium pH, and
the photosensitizer's lipophilicity (Edrei et al. 1998). Optimum incorporation occurs at a
pH of 7.3, which correlates with typical physiological pH's (Maman et al. 1999). Berg et
al. found that phthalocyanine photosensitizers' lipophilicity increased with decreasing pH
which correlates with increased uptake (Berg et al. 1989). This would suggest a
mechanism for selective uptake into tumor tissue which is often characterized by
relatively lower pH levels compared to surrounding tissue due to hypoxia and waste
product accumulation. Macrophages have also been shown to exhibit the highest uptake
of AlPcS2a in several in vitro and in vivo studies (Kunz et al. 2007). Since macrophages
constitute significant portions of the tumor matrix, this could also be another factor in
AlPcS2a's preferential localization in tumor tissue. The tumor to peritumoral tissue ratio
was measured by Chan et al. (1990) to be approximately 17, although such measurements
are highly dependent on variables such as delivery method and time after administration.
A mixture of various sulfonated phthalocyanines known as Photosens® has been used in
Russian diagnostic and clinical phototherapy studies of various cancers since 1994 (Edrei
et al. 1998). AlPcS2a is the most cytotoxic and thus most promising of the sulfonated
phthalocyanines for use in phototherapy due to its high lipophilicity, low aggregation,
optimal wavelength absorbance, and high selectivity for tumor tissue.
1.6 Photodynamic therapy (PDT)
PDT can be defined as the activation of a photosensitizer (PS) by an appropriately
chosen light source that, in the presence of oxygen, produces destructive reactive oxygen
23

species (ROS) causing sufficient cellular damage and leading to cell death (Castano et al.
2005a; Bonneau et al. 2004). PDT is an inherently selective treatment. Photosensitizers
are chosen based on their ability to localize in targeted tissues, and light is selectively
administered only to those regions of interest (Castano et al. 2004). The very short
lifetime and range of ROS further contributes to PDT's high degree of localization.
PDT has a long history in medicine, but only the most recent developments in cancer
therapy will be discussed here. While PDT has been the subject of much research for
several decades, clinical applications for a variety of cancers have only occurred over the
past 30 years (Stylli and Kaye 2006a). PDT has been approved by the U.S. Food and
Drug Administration for the treatment of microinvasive lung cancer, obstructing lung
cancer, obstructing esophageal cancer, premalignant actinic keratosis, and age-related
macular degeneration (Zhu and Finlay 2008). In addition, several studies have shown
effective treatment of head and neck cancer, mesothelioma, Barrett's esophagus, prostate,
and brain tumors (Zhu and Finlay 2008). PDT has been implemented in the treatment of
brain tumors since Perria et al. treated human gliomas in 1980 (Madsen et al. 2002; Stylli
and Kaye 2006a). PDT is generally used as an adjunct to traditional therapies of maximal
tumor resection, ionizing radiation, and chemotherapy. Several groups have utilized PDT
in this way, primarily with GBM and anaplastic astrocytoma, to better control infiltrative
tumor cells in the vicinity of the resection margin (Dougherty et al. 1998; Madsen et al.
2002). PDT is mostly used for the treatment of localized solid tumors that are easily
accessible on the skin surface, in organs that can be accessed endoscopically, or deep-
seated lesions within organs treated by interstitial delivery of light (often directly after
surgical resection) (Wilson 2002).
24

Light delivery is typically performed utilizing recently developed diode lasers. These
lasers are reliable, compact, user friendly and relatively inexpensive which make them
ideally suited for clinical use (Huang 2005). Laser light is focused using optical fibers
that can treat both external and internal tumors with typical treatment times of 5-20
minutes (Brown et al 2004). Muller and Wilson were the first to develop a cavitary
illumination technique for the treatment of malignant gliomas in the 1990's that utilizes a
balloon-like device filled with diffusing medium to evenly distribute the light (Huang
2005; Stylli and Kaye 2005b). PDT still remains an inherently complex technology
which is highly dependent on the tissue being treated as well as the characteristics of the
photosensitizer used.
Although it is not agreed upon what constitute the most important qualities of a PS,
several chemical and structural characteristics can be identified as ideal for use in PDT.
Characteristics of an ideal PS include: high tumor selectivity, strong phototoxicity, low
dark toxicity, high singlet oxygen quantum yield, high intersystem crossing (ISC) yield,
triplet-state energy greater than the energy required to excite oxygen (i.e. 94 kJ/mol),
long wavelength absorption (600-800 nm), low light absorption at shorter wavelengths
(400-600 nm), high tumor tissue retention, rapid clearance from surrounding normal
tissue, high water solubility, low aggregation in biological environments, short interval
between PS injection and illumination, and a commercially available pure chemical that
is easily synthesized and highly stable (Almeida et al. 2004; Castano et al. 2004; Nyman
and Hynninen 2004; Huang 2005; Stylli and Kaye 2006; Zhu and Finlay 2008). As with
many biological systems, it is the balance of several characteristics that makes a PS
suitable for PDT. While it is advantageous for a PS to have strong light absorption in
25

order to minimize its concentration, too strong an absorption leads to a self-shielding
effect that reduces the treatment depth. Similarly, the PS must be stable enough to avoid
rapid degradation (photobleaching), but not so stable that it significantly extends the
patient's photosensitivity after the treatment is finished. Another important characteristic
is chemical amphiphilicity. Amphiphilic PS have both hydrophobic and hydrophilic
regions and are thus more photodynamically active since they tend to localize in
hydrophobic-hydrophilic membrane interfaces and protein surfaces, as well as exhibit
lower aggregation (MacDonald and Dougherty 2001). These qualities are important
since they determine how and where a PS will localize within tumor cells.
There are a large number of photosensitizers which target a variety of sub-cellular
organelles. These targets include the plasma membrane, lysosomes, mitochondria, Golgi
apparatus, and endoplasmic reticulum (Buytaert et al. 2007). Since PS do not generally
localize in cell nuclei, PDT does not primarily cause DNA damage which lead to
mutations and carcinogenesis as with other treatments like ionizing radiation and
chemotherapy (Buytaert et al. 2007).
As stated earlier, structure dictates localization, but there are a number of other
qualities that govern PS localization. Molecular weight, ionic charge, PS concentration,
incubation time, and target cell phenotype all factor into how a PS will distribute and
localize (Castano et al. 2004). Thus the efficacy of any PDT treatment depends on many
factors including the type of PS, its concentration, and localization.
In addition to the type of PS, light dose (fluence), dose rate (fluence rate), and oxygen
availability are critical determinants of PDT efficacy (Triesscheijn et al. 2006). As is the
case with ionizing radiation, PDT is an oxygen-dependent therapy and therefore has
26

limited efficacy in hypoxic regions. Optimization requires judicious choice of
parameters. In particular, oxygen levels are sensitively dependent on light fluence rates:
high fluence rates result in rapid oxygen depletion and diminished PDT efficacy.
PDT is a complex treatment modality requiring the presence of light, PS, and oxygen.
Upon photoactivation, the PS is excited from its singlet ground state to a short-lived
(nanoseconds) excited singlet state (Fig. 9). The excited PS can decay through three
different transitions: (1) fluorescence, (2) internal conversion into heat, or (3)
intersystem crossing (ISC) in which the excited electron's spin is inverted and the PS is
converted to a triplet state (Nyman and Hynninen 2004; Castano et al. 2004). This first
triplet state is longer-lived (microseconds) allowing it to interact through chemical
reactions. The triplet state can decay through three different transitions as well: (1)
phosphorescence and subsequent return to the ground state, (2) internal conversion into
heat, and (3) non-radiative transfer of energy to molecular oxygen (MacDonald and
Dougherty 2001). Oxygen has a unique triplet ground state and low excitation states
which make this transfer possible. This transfer of energy takes form in two types of
reactions. Type I reactions occur directly between the triplet state PS and the cellular
substrate. This electron or proton-exchange produces reactive intermediates such as
superoxide, hydroperoxyl, hydroxyl radicals, and hydrogen peroxide. Type I reactions
typically occur only under anoxic conditions. If the cellular environment is sufficiently
oxygenated, Type II reactions occur between the triplet state PS and ground state
molecular oxygen. This process involves an electron spin exchange to convert triplet
ground state oxygen into excited singlet state oxygen. The excited triplet state PS is
converted back to the ground state. Thi,s entire process is illustrated in Figures 9 and 10.
27

Irradiation Intracellular p j
Accumulation r ^
( 3 & Selective ^ ^ Uptake
Extracellular Intracellular
Oxidative stress Cellular Damage
Repair/Survival
Cell Death
Figure 9. PDT action mechanism. Once the ground state photosensitizer (PTS) is activated and excited (PTS ), deactivation occurs through fluorescence or intersystem crossing to the excited triplet state (3PTS). Energy is then lost via Type I or II reactions producing free radicals and ROS (Buytaert et al. 2007).
Singlet exdted state Triplet
excited
E
A
T \ C state
G! D
- 1 0 2 +S. /
\ 3 o 5
Ground state
Figure 10. Jablonski diagram showing excitation and relaxation of a PS: (A) photo-excitation, (B) fluorescence, (C) intersystem crossing, (D) phosphorescence, (E) non-radiative transfer of energy to singlet oxygen, (F) substrate oxidation by singlet oxygen, (G) internal conversion (MacDonald and Dougherty 2001).
28

The photogenerated singlet state oxygen is the fundamental contributor to PDTs
cytotoxicity. Singlet oxygen is a highly reactive oxidizer with a short half-life of less
than 40 ns in biological systems which means its effective radius of action is less than
0.02 urn (Castano et al. 2004; Stylli and Kaye 2005; Buytaert et al. 2007). The short
lifetime of singlet oxygen limits biological damage to the immediate vicinity of the PS
and therefore the organelle(s) affected. The type of cell death, therefore, is selectively
dependent on intracellular PS distributions.
As stated earlier, an ideal PS will have maximal light activation at a wavelength
between 600-1300 nm - the so-called optical window (Castano et al. 2004) where light
has significant penetration in biological tissues due to relatively low absorption and
scattering of major tissue constituents (Fig. 11).
100
u c (0 ft v.
o 09
<
0.01 400 €00 800 1000 1200 1400 1300 1000 2000
wavelength (nm)
Figure 11. 'Optical window' in tissue. Absorption spectra for water, oxy- and deoxyhemoglobin, and melanin (Castano et al. 2004).
29

The mode of cell death caused by PDT is determined by cell type, PS localization,
and light fluence (Castano et al. 2005a). It has generally been found that low-fluence
PDT leads to apoptosis while higher fluences will produce proportionately more necrosis.
Both modes of cellular death lead to tumor destruction through a direct cellular toxic
effect, vascular damage, or an immune reaction (Castano et al. 2005; Stylli and Kaye
2005). All three mechanisms of tumor destruction begin with the production of ROS by
activation of a PS. The first mechanism is the result of ROS-induced necrosis or
apoptosis of a significant proportion of cells within the tumor. The second mechanism
occurs indirectly when PDT-induced damage of the tumor vasculature restricts the supply
of nutrients and oxygen, which ultimately leads to tumor infarction. PDT has also been
shown to cause primary vascular leakage further restricting the tumor's ability to sustain
itself. PDT has been found to require a functioning immune system to illicit complete
tumor response. An immune response to cancer, induced by PDT, is explained by the
induction of inflammation which initiates anti-tumor activity within the tissue followed
by a long-term immunological response (Castano et al. 2005b).
While many of the tumor responses to PDT are not well understood, the net cytotoxic
effect still demonstrates PDTs ability to act as a potent adjunct therapy with many
advantages over those currently employed. PDT is not limited by cumulative or
maximum dose considerations (except for heat generation which can be controlled
through fractionation), allowing repeated applications that can be combined with other
therapies. There are few significant side effects and PDT is not known to cause
mutations or be carcinogenic. In fact, normal tissue readily heals after treatment. The
primary drawback of PDT is the poor penetration depth of light in tissues which limits
30

the treatment to relatively small tumors easily accessible by intracavitary light delivery
methods.
1.7 Photochemical internalization (PCI)
PCI is a technique which utilizes the photochemical properties of PDT for the
enhanced delivery of macromolecules into the cell cytosol. These macromolecules lack
the ability to naturally permeate intracellular barriers such as the plasma and endocytic
membranes (Berg et al. 2007). Due to this inability, they are expected to be internalized
through endocytosis, localized in late endosomes and lysosomes until they are degraded
by hydrolytic enzymes. PCI relies on specific PS that preferentially localize in vesicular
membranes. Upon light activation, the ROS produced act to permeabilize the endocytic
membrane allowing the release of its contents. In this way, the macromolecules are
delivered into the cytosol in a biologically active form (Berg et al. 2006). The precise
molecular nature of membrane permeabilization is still not fully understood, with some
reports identifying membrane protein damage as being more important than the oxidation
of membrane lipids (Hogset et al. 2004). However, this technique can be applied to
various molecules and is not inhibited by their size or charge. Ideally, molecules chosen
for this technique would have no ability to adversely affect non-targeted cells (Hogset et
al. 2004). This would restrict the macromolecular activities to those inside
photoactivated cells, sparing all others.
Only specialized PS can be used in PCI. Most importantly, the PS must demonstrate
preferential localization in endocytic membranes and exhibit low aggregation (Hogset et
al. 2004). The PS should localize specifically in the membrane structure itself and not
31
simply the endocytic lumen. This is important in order for the short-lived ROS to cause
membrane damage. In addition, if the PS is also present inside the compartment near the
molecules to be delivered, there is an increased chance of the ROS oxidizing the
molecules. Obviously, no PCI effect can be achieved if the molecules are destroyed prior
to their release into the cytosol. The aggregation state of the PS is also of importance. A
highly aggregated PS will undergo endocytosis, not incorporation into the membrane
structure. Highly aggregated PS are also inhibited in their transfer of energy to molecular
oxygen. For these reasons, amphiphilic PS are ideally suited for PCI due to their
hydrophobic and hydrophilic parts resulting in membrane localization with little risk of
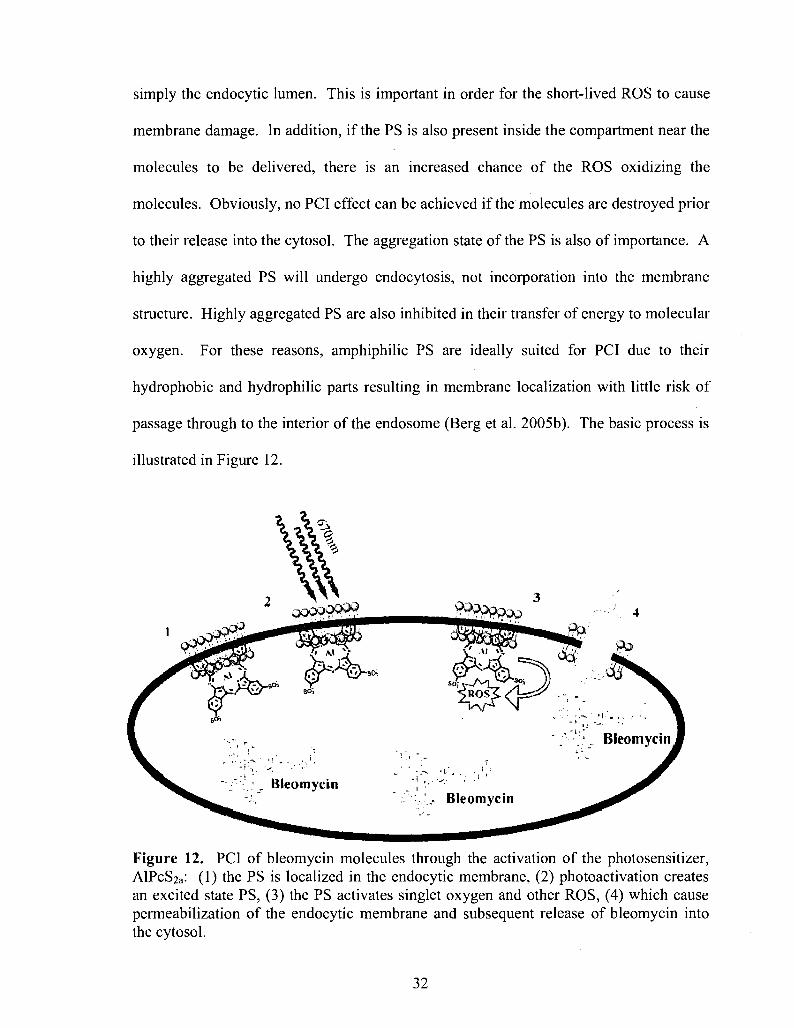
passage through to the interior of the endosome (Berg et al. 2005b). The basic process is
illustrated in Figure 12.
Figure 12. PCI of bleomycin molecules through the activation of the photosensitizer, AlPcS2a: (1) the PS is localized in the endocytic membrane, (2) photoactivation creates an excited state PS, (3) the PS activates singlet oxygen and other ROS, (4) which cause permeabilization of the endocytic membrane and subsequent release of bleomycin into the cytosol.
32

AlPcS2a and bleomycin were both chosen for this study due to their ideal qualities for
use in PCI. AlPcS2a is an amphiphilic PS known to localize in endocytic vesicle
membranes and absorb in the far-red (670 nm) region (Castano et al. 2004; Hogset et al.
2004; Berg et al. 2006, 2007; Kunz et al. 2007). As for bleomycin, this chemotherapeutic
is known to have poor cellular uptake resulting in its accumulation in endocytic vesicles
(Hogset et al. 2004; Berg et al. 2007). It has also been determined by several studies that
AlPcS2a-mediated PCI of bleomycin results in synergistic inhibition of tumor growth in
several in vivo and in vitro applications (Hogset et al. 2004; Berg et al. 2005, 2007).
These reports are encouraging for this study and its application to the PCI of bleomycin
in glioma cells.
1.8 Scope of study
The primary objective of this thesis is to examine the ability of PCI to enhance the
efficacy of the chemotherapeutic drug, bleomycin, in both rat glioma monolayers and
human glioma spheroids. In both cases, the plasma membrane localizing photosensitizer,
aluminum phthalocyanine disulfonate (AlPcS2a), will be used. It is hypothesized that:
(1) AlPcS2a is an effective photosensitizer for PDT on both F98 monolayers and ACBT
spheroids, (2) high concentrations of the chemotherapeutic agent, bleomycin, are capable
of producing significant toxicity in both in vitro glioma systems, and (3) the combination
of AlPcS2a-PDT and bleomycin, i.e. PCI, exhibits a synergistic toxic effect on both
glioma cell lines compared to either treatment modality alone.
33

CHAPTER 2
MATERIALS AND METHODS
2.1 Cell Lines
All experiments were performed in vitro utilizing two cell lines, F98 and ACBT. All
work was done inside a Labconco Class II Biohazard Cabinet (Labconco Corp., Kansas
City, MO) at the University of Nevada, Las Vegas (UNLV) unless otherwise specified.
Cells were incubated at 37°C, 5.0% C02, and 95% humidity inside a VWR incubator
(VWR International, LLC. West Chester, PA). Both cell lines were continually kept in
Gibco Dulbecco's Modified Eagle Medium (DMEM) High Glucose IX (Invitrogen
Corp., Carlsbad, CA) with 10% heat-inactivated fetal bovine serum (FBS), 25mM
HEPES buffer (pH 7.4), penicillin (100 U/ml), and streptomycin (100 ug/ml). All
monolayer cells were passed using the same technique. After the confluency was
checked, the flask was carefully emptied of all media and washed with 5mL of Gibco
phosphate buffered saline (PBS) with pH of 7.2 (Invitrogen Corp., Carlsbad, CA). Next
lmL of Gibco 0.25% Trypsin-EDTA (Invitrogen Corp., Carlsbad, CA) was added and
left in contact for 5 minutes. Trypsin is a proteolytic enzyme, which acts to detach the
cells from the flask surface. After this, while holding the flask horizontal, it was tapped
briskly against a solid surface in order to dislodge the cells. Next, 4 mL of DMEM was
added to the flask. The contents were then pipetted up and down several times and
transferred to a 15 mL centrifuge tube. After vortexing for approximately 10 seconds,
34

200 uL of this solution was added to 4.8 mL of DMEM inside a new flask. Two flasks
were seeded in this manner, which resulted in approximately 100,000 cells passed to each
new flask. This ensured a consistent supply of cells for all the experiments.
F98 is a rat glioma cell line, maintained as a monolayer and established from gliomas
induced in CDF (Fischer) rats. These gliomas were induced through exposure to ethyl-
nitrosourea and established by surgically removing the tumor, mincing the tissue,
trypsinizing, and cultivating in Eagle medium (Ko et al. 1980). The F98 monolayer cells
were maintained in 25 cm2 BD Falcon tissue culture flasks with 0.2 um vented caps (T25,
Beckton, Dickson and Company, Franklin Lakes, NJ). Monolayer cells were passed
twice per week, in order to maintain confluences between 40 and 80%. The confluency
is a subjective measurement of the percentage of the flask's area covered by the cells. As
this is a subjective measurement, the figure is always recorded with a 10% range.
ACBT cells were derived from a human grade IV GBM (G. Granger, University of
California, Irvine) and were analyzed both as monolayers and spheroids. ACBT
monolayers were kept in T25 flasks and passed once per week. Spheroids were formed
by liquid overlay in Fisherbrand 100 xlOO xl5 mm square dishes (Fisher Scientific,
Pittsburgh, PA) that were coated with 10 mL of 2% agarose (BioWhittaker Molecular
Applications, Rockland, ME). A solution of cells was extracted as when passing cells.
For spheroid formation, as many cells as possible are desired, therefore, the entire
solution was added to the Petri dish along with 20 mL of DMEM. Spheroids began
forming after one week of incubation. Stocks of four to eight Petri dishes containing
spheroids were kept to maintain a sufficient supply. The DMEM in each dish was
changed twice per week, removing and replacing 10 to 15 mL.
35

2.2 Monolayer survival plating
Treatment toxicity for all monolayers was determined through clonogenic assay
techniques. Following the treatments, cells were extracted from the T25 flasks just as
with passing and pipetted into 15 mL tubes. After vortexing for approximately 10
seconds, 100 uL was pipetted into a Coulter cup containing 9.9 mL of IsoFlow Sheath
fluid (Beckman Coulter Inc., Fullerton, CA). Each cup was counted in a Beckman
Coulter Particle Count and Size Analyzer Model Z2 (Beckman Coulter Inc., Fullerton,
CA). The contents of each cup were gently stirred followed by two consecutive counts,
stirred again, and counted two more times. The average of these four counts was
calculated to yield the total cells per milliliter in each solution. Once the concentration
was found, 500 uL from each tube was taken and added to 4.5 mL of DMEM in order to
create a 10% dilution. This was performed in order to attain the desired concentration of
cells in medium, so that between 100 and 800 uL of cells were added to 4 mL of DMEM
in a 60 x 15 mm Petri dish (Corning Inc., Corning, NY). Each survival group has a
specific number of cells to be plated. Some survival groups have two or three different
cell count numbers to be plated. To calculate the exact volume of cells needed for plating
in each dish, the number of cells desired was divided by the measured cell concentration.
After the cells were pipetted into each Petri dish, the contents were gently swished back
and forth then side to side in order to maintain even cell coverage within the dish. All the
dishes were then incubated for 7 days. After this time, the media was decanted and the
dishes stained with crystal violet. Using a light microscope, any colonies that formed in
the dishes were counted. A colony was considered any grouping of 50 or more cells. All
colonies were scored and survival rate was calculated by normalizing to the control.
36

Therefore, all control survival rates reported here are exactly 100% and some treatment
survival rates may be greater than 100% due to statistical uncertainty.
2.3 Spheroid growth analysis
The effect of treatment on the spheroids was determined by following spheroid
growth post-treatment. This was accomplished by pre-selecting spheroids, whose
average cross-sectional diameters were between 400 and 500 um. Spheroid diameter was
measured using a microscope with a calibrated eyepiece micrometer. Two perpendicular
diameter measurements were made to the nearest 50 jam, and the average was recorded.
For each treatment group, 20 to 30 spheroids were placed in a 35 x 10 mm Petri dish
(Beckton, Dickson and Company, Franklin Lakes, NJ) with 2 mL of DMEM. After
treatment, 20 spheroids from each dish were extracted and placed into separate wells of a
Costar 48 well cell culture cluster (Corning Inc., Corning, NY). Each well was coated
with 250 uL of agarose and filled with 750 uL of DMEM. In this way, each individual
spheroid's growth could be monitored.
Spheroid growth was monitored over a 28 day period, beginning 24 hours after
treatment. The initial diameter measurement was taken 24 hours after treatment, and
subsequent measurements were taken twice per week for a total of nine measurements.
Following each measurement, approximately 500 uL of DMEM was removed from each
well and replaced with fresh DMEM to ensure the spheroids were given adequate
nutrients. Spheroids demonstrating a diameter increase in excess of 50 urn between
weekly measurement intervals were scored viable.
37

2.4 Bleomycin toxicity
Bleomycin (Sigma, St. Louis, MO) toxicity was investigated in F98 monolayers and
ACBT spheroids. In both cases, the drug was added to DMEM to yield concentrations
from 0.1-10 ug/mL. In all cases, cells were incubated in bleomycin and DMEM for four
hours. Following incubation, all monolayer cells were harvested and plated for
clonogenic survival as previously described. ACBT spheroids were placed in individual
wells filled with DMEM and monitored for growth as previously described.
2.5 PDT toxicity
The effects of PDT on both the F98 and ACBT cell lines were determined using
similar protocols. First, a photosensitizer was administered, and then a light dose was
given. Cells (or spheroids) were incubated for 18 hours with 1 |ig/mL of AlPcS2a
(Frontier Scientific, Inc., Logan, UT) and DMEM. Following incubation, the media was
removed and the cells (or spheroids) were placed in DMEM only. Next, the cells (or
spheroids) were irradiated using a Class 4 photodiode laser (High Power Devices, Inc.,
North Brunswick, NJ) coupled to a 200 um diameter optical fiber containing a micro-
lens. The diode laser was calibrated to emit light at a wavelength of 670 nm. All cells
(or spheroids) were exposed to an irradiance of 5 mW/cm . The total radiant exposure
was determined by exposure time and ranged from 0.75 to 6 J/cm2. The effects of PDT
on cells and spheroids were determined using clonogenic survival and growth kinetics,
respectively (as previously described).
38

2.6 PCI toxicity
In order to test for a PCI effect, cells (or spheroids) were first incubated in 1 jig/mL
of AlPcS2a for 18 hours, just as with PDT. After this, cells (or spheroids) were incubated
with either 0.1 or 0.25 ug/mL of bleomycin in DMEM for four hours. Next, the cells (or
spheroids) were irradiated with 670 nm light (irradiance of 5 mW/cm and radiant
exposure of 1.5J/cm ) as described in section 2.4. The effects of PCI on cells and
spheroids were determined using clonogenic survival and growth kinetics, respectively
(as previously described).
2.7 Flow cytometry
Flow cytometry was used to determine the fraction of viable, apoptotic, and necrotic
cells. The two different fluorescent labels used were Annexin V-FITC (Beckton,
Dickson and Company, Franklin Lakes, NJ) to distinguish apoptotic cells, and propidium
iodide (PI, Sigma, St. Louis, MO) to label necrosis. Unlabeled cells were assumed to be
viable. The procedure to prepare both monolayer and spheroid cells was identical, except
for how the cells were brought into solution.
All monolayer cells were first harvested into a DMEM solution, while spheroids were
incubated in 15 mL tubes for 20 minutes in 500 uL of a one-to-one mixture of 1%
collagenase (Invitrogen Corp., Carlsbad, CA) in Hanks' Balanced Salt Solution lx
(HBSS with Ca2+ and Mg2+, Invitrogen Corp., Carlsbad, CA) to dispase (Beckton,
Dickson and Company, Franklin Lakes, NJ). After incubation, the spheroids were
vortexed for 5 seconds and 5 mL of PBS was added. The tubes were then centrifuged in
a Beckman GS-6 centrifuge (Beckman Coulter Inc., Fullerton, CA) for five minutes at
39

1000 rpm. The PBS was then decanted, 5 mL of PBS was added and the tube was
vortexed for 5 seconds. The rubes were centrifuged again, the PBS decanted, and 500 uL
of PBS was added. For a final time the tubes were centrifuged, the PBS decanted, and lx
binding buffer (Beckton, Dickson and Company, Franklin Lakes, NJ) was added to
achieve a final concentration of 10 cells/mL. Next, 100 uL of the solution was
transferred along with 400 uL of lx binding buffer to a 5 mL BD Falcon tube. The two
labels were then added with 5 uL of Annexin V-FITG and 10 uL of 100 ng/mL
concentration PI. The solutions were gently agitated, and then incubated for 15 minutes
at room temperature in the dark.
For each experiment, a set of control solutions was also prepared. One control
remained unlabeled, the next labeled only with Annexin V-FITC, and the third labeled
only with PI. Finally, after 15 minutes of incubating in the dark, each tube was analyzed
in a Beckton Dickson FACSCalibur (Beckton, Dickson and Company, Franklin Lakes,
NJ) flow cytometer along with CellQuest software.
2.8 Two-photon fluorescence microscopy (TPFM)
All TPFM experiments were performed at the Beckman Laser Institute, University of
California, Irvine (UC, Irvine). Two-photon fluorescence images were taken of ACBT
spheroids of various diameters and subjected to various treatments. The spheroids were
co-stained with Hoechst 33342 (Invitrogen, Carlsbad, CA) and Ethidium Homodimer 1
(El 169, Invitrogen, Carlsbad, CA) 48 hours after treatment. The stains were
administered in 5 and 1 (j.g/mL concentrations in 2 mL of medium for Hoechst and
Ethidium Homodimer respectively. Spheroids were incubated for 1 hour and then
40
washed three times with HBSS before being transferred to new 35 x 10 mm Petri dishes.
The spheroids were then fixed by adding 2 mL of 5% formaldehyde in ultrapure water to
each dish. After 1 hour, five spheroids from each treatment group were pipetted into
separate wells of a Costar 96 well cell culture cluster (Corning Inc., Corning, NY) which
were each filled with 250 uL of PBS. The spheroids were imaged using an inverted laser
scanning microscope (LSM 510 META, Zeiss, Oberkochen, Germany) with a 20x /0.5
NA lens (EC Plan-Neofluar, Zeiss, Oberkochen, Germany). The blue Hoechst
fluorescence from all cell nuclei was imaged using 800 nm two-photon excitation and
390-465 nm detection. The red Ethidium Homodimer fluorescence from necrotic nuclei
was imaged confocally with 488 nm excitation and 576-640 nm detection. Scans were
made at planes 30-50 um into each spheroid with simultaneous excitation of the two
dyes, and the images were pseudo-colored blue and red.
2.9 Statistical analysis
All data was analyzed and graphed using Microsoft Excel. The arithmetic mean and
standard deviation were used throughout to calculate averages and errors. Statistical
significances were calculated using the Student's t-test as well as the Welch's t-test. Two
values were considered distinct when their p-values were below 0.05.
Synergism was calculated when analyzing PCI treatments. Equation 2.1 was used to
determine if the PCI effect was synergistic, antagonistic, or additive.
SF°xSFh . . . a = SFa„ (Eq-2.1)
In this scheme SF' represents the survival fraction for a specific treatment. If two
treatments are to be compared, the survival fractions of each separate treatment are
41

multiplied together and then divided by the survival fraction when both treatments were
applied together. The resulting number (a) describes the cumulative effect. If a > 1, the
result is synergistic. If a < 1, the result is antagonistic, and if a = 1 the result is simply
additive.
42

CHAPTER 3
RESULTS
3.1 AlPcS2a and bleomycin toxicity in F98 monolayers
The first priority was to determine the relative drug toxicities of the photosensitizer,
AlPcS2a, and bleomycin in the F98 rat glioma cell line. F98 monolayer cells were
incubated for 18 hours in DMEM with increasing concentrations of AlPcS2a-
Photosensitizer concentrations of 0 (control), 0.5, 1, 2, 4, 8, 16, 24, 32, and 64 ng/mL
were administered. All experiments were performed in the dark with minimal light, and
the data demonstrated no correlation between photosensitizer concentration and percent
survival (Fig. 13).
The relative toxicity of bleomycin was also measured after a four hour incubation
period. The concentrations of bleomycin tested were: 0.1, 0.25, 0.5, 0.75, 1, 5, and 10
|j.g/mL. As expected, there was a noticeable decrease in survival fraction directly
correlated to increasing concentration of bleomycin. The LC50 was shown to occur at
approximately 0.5 ng/mL. Concentrations of 0.1 and 0.25 ug/mL resulted in survival
rates of approximately 80 and 60%, respectively (Fig. 14).
43

3
^
130 -
120 -
110 -
100 -
90 -
80
70
60 -
50
40
30 -
20 -
10
0
F98 Monolayer AlPcS2a Dark Survival - • - - - • - •
r : - • • - -
j
—r-
_
-
.
-
- L
- -
y
- -
—
- -
-
1 " X
—
—
T - -
•*-
._
--
. . . . . . . . .
- ----- - - - - — -
— • - - 1
--
- -
- -
— - -
—
1 — i — '
-._.
—-
-- -
- -- v
- -
-
—
-----
" - L
J -
T
—
' — i '
1 -
0.5 2 4 8 16 Concentration of AlPcS2a (ug/mL)
24 32 64
Figure 13. Percent survival vs. AlPcS2a concentration for F98 monolayers.
no
100
90
80 -b-
70 "3 • | 60 -f-
*> 50
40
30 - :
20 - - -
10
F98 Monolayer Bleomycin Survival
0.1 0.25 0.5 0.75 1
Concentration of Bleomycin (ug/mL) 10
Figure 14. Percent survival vs. bleomycin concentration for F98 monolayers.
44

3.2 PDT toxicity in F98 monolayers
The F98 monolayer cells were incubated for 18 hours in a concentration of 1 ug/mL
of AlPcS2a. Six different groups were analyzed. The first group was a control containing
no photosensitizer. The second group, known as the dark control, was incubated in
AlPcS2a and no light was administered. This was used to ensure that the effects seen
were those solely of the photosensitizer activated by the laser light. Therefore, the dark
control group should exhibit 100% survival. The remaining four groups were incubated
in AlPcS2a, and subjected to increasing light exposures. The results showed a clear
correlation between increasing light exposure and decrease in survival fraction with an
LD50 of approximately 2.5 J/cm2. An exposure of 1.5 J/cm2 resulted in a survival rate of
approximately 80% (Fig. 15). The p-values (Table 3.1) show no distinction between the
control and the dark control groups. There is also no statistical distinction between the
dark control and the first PDT treatment with 0.75 J/cm2 of light.
Table 3.1: P-values for F98 PDT toxicity Two Groups Being Compared
Control / Dark Control Dark Control / AlPcS2a + 0.75J
AlPcS2a + 0.75J / AlPcS2a + 1.5J AlPcS2a+1.5J/AlPcS2a + 3J AlPcS2a + 3J / AlPcS2a + 6J
p-value 0.9209 0.6929 0.0106 0.0000 0.0098
45

F98 PDT Survival with 18h 1 ug/mL AlPcS2a 11U
100 -
90 -
80 -
- 70 ->
'> 60 -
<» 50-
40 -
30
20 -
10 0 H
; L T 1
- 1 -
1 k
Control AlPcS2a (dark) AlPcS2a+ 0.75J AlPcS2a+1.5J AlPcS2a + 3J AlPcS2a + 6J
Figure 15. Percent survival vs. PDT treatments with increasing radiant exposures.
3.3 PCI toxicity in F98 monolayers
The final step in evaluating toxicities in the F98 monolayer was to determine the
effect of PCI treatment and to compare with previous results of bleomycin alone and
PDT. All PCI survivals included nine separate treatment groups. These groups included
previously studied parameters such as a control, AlPcS2a dark control, 0.1 ug/mL
bleomycin, 0.25 ug/mL bleomycin, and 1.5 J/cm2 PDT with 1 ug/mL AlPcS2a- The
inclusion of these five groups allowed for direct comparison to PCI, as well as
confirmatory comparisons to previous experiments. The remaining four treatment groups
were used to both eliminate possible unwanted drug interactions, as well as illustrate the
desired PCI effect. The first unwanted interaction was between AlPcS2a and bleomycin
alone. For this group, the photosensitizer and bleomycin were incubated as with the other
experiments, however no light was administered. Since the PCI effect should only be
46

present when the photosensitizer is activated, this group should show identical toxicity to
that of bleomycin alone. The other unwanted interaction investigated was that of
bleomycin and the laser light. No photosensitizer was added to this group. Bleomycin
was not expected to be activated or degraded in the presence of light; therefore, this
group should also behave identical to that of bleomycin alone.
For the two PCI effect groups, identical concentrations of AlPcS2a, as well as radiant
exposures were used. One group was incubated in 0.1 ug/mL and the other in 0.25
|ag/mL of bleomycin. Both PCI treatment groups should therefore be comparable to the
two concentrations of bleomycin alone and PDT treatment (Fig. 16). The p-values shown
in Table 3.2 show statistically significant differences in survival between monolayers
subjected to both PCI regimens and either PDT-only or BLM-only treatments.
Table 3.2: P-values for various F98 PCI toxicity groups Two Groups Being Compared p-value
Control / AlPcS2a (Dark) 0.9193 0.1 BLM/ 0.25 BLM 0.1325 0.25 BLM / AlPcS2a + 0.25 BLM 0.7226 0.25 BLM 7 0.25 BLM+1.5J 0.9586 0.1 BLM / AlPcS2a + 1.5J (PDT) 0.4651 0.25 BLM / AlPcS2a + 1.5J (PDT) 0.2469 AlPcS2a + 1.5J (PDT) / AlPcS2a + 0.1 BLM + 1.5J (PCI) 0.0183 AlPcS2a + 1.5J (PDT) / AlPcS2a + 0.25 BLM + 1.5J (PCI) 0.0013 0.1 BLM / AlPcS2a + 0.1 BLM + 1.5J (PCI) 0.0116 0.25 BLM / AlPcS2a + 0.25 BLM + 1.5J (PCI) 0.0205 AlPcS2a + 0.1 BLM + 1.5J (PCI) / AlPcS2a + 0.25 BLM + 1.5J (PCI) 0.0257
47

F98 PCI Survival w/ AIPcS2a & Bleomycin
no
100
90
80
70
.Z 60 t
*> 50
40
30
20
10
Control AlPcS2a 0.1 BLM 0.25 BLM AlPcffla + 0.25 BLM + AlPcS2a + AlPcS2a + AlPcS2a +
(Dark) 0.25 BLM 1.5J 1.5J(PDT) 0.1 BLM + 0.25 BLM +
! 1.5J(PCI) 1.5J (PCI)
Figure 16. Percent survival vs. various treatments including bleomycin, PDT, and PCI for F98 monolayers.
-r
T
pfn ~t
T
1
- £ - |
Since PCI is a technique which relies on the combination of drug and photosensitizer,
the resultant toxicities should show more than an additive effect between bleomycin and
AlPcS2a-PDT. The degree of synergism was calculated by comparing the survival
fractions of bleomycin and PDT alone with that of the PCI treatment (Table 3.3). As
evidenced from equation 2.1, the higher the a value, the greater the degree of synergism.
Table 3.3: Degree of potentiation between PDT and bleomycin for F98 monolayers. PCI Survival a +/-
AlPcS2, + 0.1BLM+1.5J(PCI) 1.454 0.1433 AlPcS2a + 0.25 BLM + 1.5J (PCI) 2.432 0.2286
48

3.4 ACBT Spheroid Growth Assays
The monolayer results clearly demonstrated a PCI effect in the F98 rat glioma cell
line. The next step was to determine whether such an effect could be elicited in a more
complex model. This was done by performing growth assays on spheroids of the human
glioma cell line, ACBT.
A total of seven groups were followed simultaneously in order to better compare the
various toxicities. The seven groups included: a control, AlPcS2a dark control, 0.1
fig/mL bleomycin, 0.25 jig/mL bleomycin, 1.5 J/cm PDT with 1 (xg/mL AlPcS2a, and
PCI groups with 0.1 and 0.25 ug/mL bleomycin. Each PCI group was incubated in 1
Ug/mL AlPcS2a and irradiated with 1.5 J/cm . Based on the monolayer results (Figures
3.1 and 3.2), sub-optimal bleomycin and light doses were chosen in order to optimize the
PCI effect. The exclusion of two groups (AlPcS2a + bleomycin and bleomycin + 1.5
J/cm2) was made since no effect was observed in the F98 experiments.
The p-values (Appendix I) are illustrative in showing how many days post-treatment
that the spheroids' diameters have measurable statistical differences in growth. In many
cases, the spheroid diameter growth difference was evident after the fifth day. For others,
the difference did not appear until the 12th day. For example, the 0.25 ug/mL bleomycin
and the PCI with 0.25 ug/mL bleomycin groups demonstrated similar growth patterns
until the 12th day. After this point, a clear distinction was discernible, showing a
reduction in growth of the latter. A line graph of the average spheroid diameter over time
after treatment (Fig. 17) clearly shows a growth delay in the PCI treatment groups. All
spheroids in the seven different groups began with an average diameter of approximately
49

450 urn and grew to a final diameter between 900 and 1300 um by the final measurement
on the 29th day.
The control group showed the most accelerated growth rate over this time, while both
PCI treatment groups demonstrated the slowest growth. The growth pattern illustrated in
Figure 17 was consistent with Gomperzian growth (initial exponential growth followed
by a linear phase and finally reaching an asymptotic limit). It is easier to see the initial
differences in diameter, if only the first eight days post-treatment are shown (Fig. 18).
Already after five days, a difference in the growth rates was discernible.
50

Sphe
roid
Dia
met
er v
s. T
ime
Aft
er T
reat
men
t
Hi—
CN
T
-B—
Dar
k C
NT
—
*—
0.1
BLM
—
A—
0.2
5 B
LM
- -X
- -A
lPcS
2a+
1.5J
(PD
T)
- -•
- -
0.1B
LM
+ A
lPcS
2a +
1.5
J (P
CI)
-
-O-
- 0.
25B
LM
+ A
lPcS
2a +
1.5J
(PC
I) 10
15
20
Day
s Po
st T
reat
men
t 25
30

800
400
Spheroid Diameter vs. Time After Treatment
4 5
Days Post Treatment
Figure 18. Average spheroid diameter vs. days post-treatment through the first 8 days.
It is also instructive to look at the viability of the ACBT spheroids from the
perspective of percent growing versus time (Fig. 19). This is illustrated by plotting the
percentage of spheroids showing growth, thus still viable, between weekly measurement
periods. Weeks 1, 2, 3, and 4 correspond to those measurements taken on days 8, 15, 22,
and 29 respectively.
52

1 Hi
a <£ e .e a. sc H 09 U
a n
a> a)
D D
o O O — i O
o O OO
o r- o SO
o O o O O
3iqB!AsP!OJ3qdsjo %
o +
<
03
©
+ c-) oo o
Sa <
03
U a.
"1 +
OO CU <_> —
<
s 03
03
^ e
Figure 19. Percentage of spheroids viable for weeks 1 through 4 (measured at days 8, 15, 22, 29 respectively). Error bars denote standard deviation of the means.
53

The degree of potentiation between PDT and bleomycin is shown in Table 3.4. The
data suggest an additive effect for the combination of 0.1 jig/mL bleomycin and PDT,
while a synergistic effect is observed during the first two weeks post-treatment for the
0.25 ug/mL bleomycin and PDT group. Subsequent proliferation of cells not damaged
by the treatments resulted in MTS regrowth, as indicated by the loss of synergism in
weeks 3 and 4.
Table 3.4. Degree of potentiation between PDT and bleomycin for ACBT spheroids
AlPcS2a + 0.1 BLM + 1.5J (PCI)
AlPcSza + 0.25 BLM + 1.5J (PCI)
Week 1 a
1.346
1.657
+/-
0.3203
0.3970
Week 2 a
1.284
1.983
+/-
0.3056
0.4748
Week 3 a
1.128
1.395
+/-
0.2684
0.3339
Week 4 a
1.104
1.284
+/-
0.3060
0.3720
3.5 Determination of spheroid cell viability by flow cytometry
Flow cytometry was utilized to examine the effects of treatment on cellular viability.
This was performed by examining the percentage of viable, necrotic, and apoptotic cells
as a function of treatment for each of the seven groups considered in section 3.4 (Fig. 20).
All spheroids were between 450 and 550 um in diameter. The percentage of viable cells
was slightly lower in the PCI groups, while a small increase in the apoptotic fraction was
noted in these two groups.
54

100%
90%
80%
70% - -
O
•55 60% O a. E O 50% - -
U
| 40'
o-
30% - -
20% - -
10%
0%
Percent Composition vs. Treatment for ACBT Spheroids
• Viable Cells
• Necrotic Cells
• Apoptotic Cells
0.1 BLM + I.5J 0.25 BLM + 1.5J PCI PCI
Figure 20. Flow cytometry results for percent composition (viable, necrotic, apoptotic) following various spheroid treatments.
3.6 Two-photon fluorescence microscopy
The results of two-photon fluorescence images demonstrated a qualitative
enhancement in the toxicity of PCI compared to bleomycin or PDT-only treatments
alone. This was inferred from the high proportion of red fluorescing cells (suggestive of
necrosis) observed from the PCI-treated spheroids (Fig. 2Id). By comparison, a smaller
number of red fluorescing cells was observed from PDT-only spheroids (Fig. 21c). As
illustrated in Figs. 21a and b, virtually no necrotic cells were observed in control and
bleomycin-only spheroids.
55

Figure 21. Two-photon fluorescence microscopy images of ACBT spheroids stained with Hoechst 33342 (grey) and Ethidium Homodimer (white, necrosis). Images a and b were taken at a depth of 20 urn and images c and d at 30 and 40 um, respectively. Spheroids were fixed 48 hours after treatment: (a) control, (b) 0.1 ng/mL bleomycin, (c) 1.5 J/cm2 PDT, (d) PCI with 0.1 ng/mL bleomycin + 1.5 J/cm2. Field of view for all images was 400 x 400 urn.
56

CHAPTER 4
CONCLUSIONS
The results of this study lead to several conclusions about the responses of two
different cell culture models to PCI, a novel drug delivery technique. F98 monolayer
colony formation assays revealed the ability of both bleomycin and AlPcS2a-PDT to elicit
significant cytotoxic effects. They also showed the synergistic nature of PCI treatment
over both bleomycin and PDT alone. The results of these experiments also served to
eliminate the possibility of extrinsic effects between bleomycin and AlPcS2a or
bleomycin and light. ACBT spheroid growth kinetics demonstrated that bleomycin and
PDT were both inefficient treatments of MTS at low doses, but that together a synergistic
effect caused significant growth retardation. The growth curves also supported the
modeling of ACBT spheroids according to Gompertzian growth characteristics.
Flow cytometry and two-photon fluorescence microscopy both aided in qualifying the
internal composition of spheroids after various treatments. Flow cytometry data showed
that PCI treatment caused a decrease in the percentage of viable cells and an increase in
the apoptotic fraction. The TPFM images illustrated the increased formation of necrotic
cells in both PDT and PCI treated spheroids. The significant increase in PCI-induced
necrosis would suggest a synergistic interaction for the PCI compared to PDT and
57

bleomycin alone due to the smaller number of necrotic cells observed in bleomycin-only
and PDT-only treated spheroids.
All these findings can be generalized to describe a major difference between the two
cell culture models. For each of the experiments, monolayer cells demonstrated higher
sensitivity to the various treatment modalities. This can be attributed to the fundamental
differences between the two models. Monolayers lack intercellular communication and
are actively proliferating in optimal growth and re-oxygenation conditions. In particular,
a readily available supply of oxygen plays a major role in both PDT and PCI cytotoxicity.
Monolayer cells have high morphological homogeneity exhibiting identical growth
within the model. In contrast, MTS have developed significant amounts of extracellular
matrix and present three distinct phases of cell growth (proliferating, quiescent, and
necrotic) within each spheroid. MTS also exhibit nutrient, pH, and oxygen gradients.
While many of the specific interactions are not fully understood, these differences
clearly confer an increased resistance of MTS to various chemotherapeutic and ionizing
radiation treatments. This is often attributed to MTS resistance to apoptosis and the
ability for quiescent cells to better repair sublethal and potentially lethal damage which
are characteristic of low-dose ionizing radiation. Since bleomycin is known for inducing
apoptosis and has cytotoxic similarities to ionizing radiation, these key differences
between monolayers and MTS are especially important for this study.
While the synergistic effect was less pronounced in MTS, these findings bode well
for possible clinical applications of PCI in the treatment of GBM. The current regimen of
surgical resection followed by external beam radiation and chemotherapy could be
augmented to include PCI therapy. Post surgical applications could selectively target
58

glioma cells that were unresectable as well as infiltrative cells two or more centimeters
from the resection cavity. As this treatment is not limited by cumulative dose
restrictions, it could be easily incorporated into the treatment regime.
It would be instructive to further investigate several aspects of the findings in this
study. It was demonstrated that PCI can be effectively used to enhance the delivery of
bleomycin into glioma cells. The next step is to optimize the observed effects in the
ACBT spheroid model. This would include optimal concentrations of bleomycin, light
doses for AlPcS2a-PDT, and their combination in PCI. Better characterization of the
ACBT spheroid model would also present a clearer picture with regard to spheroid
response to treatment. Utilizing theoretical Gompertz growth equations based on
experimental data could better illustrate expected values such as diameter at onset of
necrosis formation, viable rim thickness, and maximum attainable volume. These values
would aid in the analysis of spheroid growth kinetics. The final step would be in vivo
studies to test the optimizations and growth predictions.
In conclusion, the results of these experiments clearly demonstrate the synergistic
effects of PCI in two different in vitro glioma cell models. Sub-optimal doses of
bleomycin and PDT in monolayers demonstrated a decreased efficiency in MTS. Even at
these sub-optimal levels, PCI was very effective, resulting in 35% spheroid viability two
weeks post-treatment. This result is extremely encouraging considering the low doses of
bleomycin and PDT administered. PCI can clearly be used to substantially enhance the
delivery of bleomycin in malignant glioma cells resulting in a significant reduction in cell
survival. Additional animal studies will be required in order to fully understand the
implications of these results.
59

APPENDIX I
ACBT SPHEROID GROWTH ASSAY P-VALUES
P-values for spheroid diameter measurements versus days post treatment are given in
the table below. For simplicity, the experimental groups are labeled A through G as
follows: control (A), AlPcS2a dark control (B), 0.1 [ig/mL bleomycin (C), 0.25 ug/mL
bleomycin (D), 1.5J PDT with 1 ug/mL AlPcS2a (E), PCI with 0.1 ug/mL bleomycin (F),
PCI with 0.25 ug/mL bleomycin (G). Therefore, column AB signifies p-values between
the measurements of groups A and B for days 1 - 29.
Table Al. P-values for ACBT spheroid diameter growth assay. Two Groups Being Compared AB AC AD AE AF AG BC BD BE BF BG
Dayl 0.254 0.843 0.030 0.175 0.116 0.101 0.172 0.259 0.662 0.608 0.513 Day 5 0.073 0.001 0.000 0.002 0.000 0.000 0.131 0.000 0.120 0.000 0.000 Day 8 0.122 0.000 0.000 0.008 0.000 0.000 0.000 0.000 0.207 0.000 0.000 Day 12 0.113 0.000 0.000 0.071 0.000 0.000 0.000 0.000 0.756 0.000 0.000 Day 15 0.090 0.000 0.000 0.081 0.000 0.000 0.000 0.000 0.874 0.000 0.000 Day 19 0.215 0.000 0.000 0.352 0.000 0.000 0.000 0.000 0.756 0.000 0.000 Day 22 0.342 0.000 0.000 0.997 0.000 0.000 0.000 0.000 0.325 0.000 0.000 Day 26 0.195 0.000 0.000 0.906 0.000 0.000 0.012 0.000 0.158 0.000 0.000 Day 29 0.051 0.000 0.000 0.903 0.000 0.000 0.681 0.003 0.043 0.010 0.000
CD CE CF CG DE DF DG EF EG FG Dayl 0.017 0.124 0.074 0.065 0.606 0.561 0.703 0.995 0.878 0.868 Day 5 0.000 0.772 0.006 0.000 0.004 0.293 0.552 0.039 0.001 0.109 Day 8 0.000 0.018 0.000 0.000 0.000 0.299 0.066 0.000 0.000 0.005 Day 12 0.000 0.000 0.000 0.000 0.000 0.279 0.008 0.000 0.000 0.000 Day 15 0.000 0.000 0.000 0.000 0.000 0.177 0.000 0.000 0.000 0.000 Day 19 0.000 0.000 0.000 0.000 0.000 0.225 0.000 0.000 0.000 0.000 Day 22 0.000 0.000 0.000 0.000 0.000 0.497 0.000 0.000 0.000 0.000 Day 26 0.000 0.000 0.000 0.000 0.000 0.656 0.000 0.000 0.000 0.000 Day 29 0.002 0.000 0.008 0.000 0.000 0.750 0.065 0.000 0.000 0.036
60

APPENDIX II
FLOW CYTOMETRY RAW DATA
All data presented here are quadrant and histogram readouts from CellQuest software
used to analyze output from the Beckton Dickson FACSCalibur flow cytometer. Sample
ID's represent the size or treatment group. Each data set begins with 'Unstained', 'PI
only', and 'AnnexinV only'. These represent initial calibration samples that were either
given no stain, or stained only with PI or Annexin V respectively. All other samples
were stained with both dyes and histograms are given for both separately. All treatment
samples were labeled by a letter: control (A), AlPcS2a dark control (B), 0.1 (J.g/mL
bleomycin (C), 0.25 [ig/mL bleomycin (D), 1.5 J/cm2 PDT with 1 ^ig/mL AlPcS2a (E),
PCI with 1.5 J/cm2 PDT and 0.1 ng/mL bleomycin (F), PCI with 1.5 J/cm2 PDT and
0.25 ng/mL (G), PCI with 2.0 J/cm2 PDT and 0.25 ng/mL bleomycin (H), PDT with 2.0
J/cm2 (I).
61

UN
LV
Genom
ics
Cor
e
Flo
w C
ytom
etr
y La
b
Joe0
3250
9.00
1
10u
10
1
10^
10
J 10
H
Ann
exin
V
^r
Joe0
3250
9.00
2
o •
,1
I M
l II
I
I II
'"
If
j
10"
10
' 10
2
10
3
10
4
Ann
exin
V
Joe0
3250
9.00
3
i ,
, i
f
10°
10
1
10
2
10
3
10n
Ann
exin
V
Ann
exin
V/P
I as
say,
032
509
Joe
Sam
ple
ID:
unst
aine
d
Acq
uisi
tion
Dat
e
Qua
d E
vent
s
UL
833
UR
151
LL
9007
LR
9
25-M
ar-0
9
% T
otal
8.33
1.51
90.0
7
0.09
Sam
ple
ID:
PI o
nly
Acq
uisi
tion
Dat
e
Qua
d
UL
UR
LL
LR
Eve
nts
314 61
9599
26
25-M
ar-0
9
% T
otal
3.14
0.61
95.9
9
0.26
Sam
ple
ID
: Ann
exin
V o
nly
Acq
uisi
tion
Dat
e: 2
5-M
ar-0
9
Qua
d
Eve
nts
% T
otal
UL
UR
LL
LR
241
103
8020
1636
2.41
1.03
80.2
0
16.3
6
o
c 1
3
J
<J
j 1(
o
3 <->
Joe0
3250
9.00
1
M1
M2
0 1
01
10
2
10
3
10
Ann
exin
V
Joe0
3250
9.00
2
M1
M2
10°
10
1
10
2
10
3
Ann
exin
V
O
••
- :
Irt 3
J
o ! 1(
Joe0
3250
9.00
3
M1
10
M2
j/
V
"*^
-l^
^^
^~-^
^_
r IO
1
10
2
10
3
Ann
exin
V
Sam
ple
ID:
unst
aine
d
Acq
uisi
tion
Dat
e: 2
5-M
ar-0
9
Mar
ker
Eve
nts
% T
otal
All
1000
0 10
0.00
M1
9852
98
.52
4 M
2
150
1.5
0
Sam
ple
ID: P
I onl
y
Acq
uisi
tion
Dat
e: 2
5-M
ar-0
9
Mar
ker
Eve
nts
% T
otal
All
1000
0 10
0.00
M1
99
18
9
9.1
8
4 M
2
83
0.8
3
Sam
ple
ID: A
nnex
inV
onl
y
Acq
uisi
tion
Dat
e: 2
5-M
ar-0
9
Mar
ker
Eve
nts
% T
otal
All
1000
0 10
0.00
M1
8297
82
.97
10^
M2
1716
17.1
6

Joe0
3250
9.00
<1
! j
( —
I I
1111
111*
I I
llll
lf
"~1
0°
10
1 1
02
10
3 10
""
Ann
exin
V
Sam
ple
ID: A
Acq
uisi
tion
Dat
e: 2
5-M
ar-0
9
Qua
d E
vent
s %
Tot
al
UL
101
1.01
UR
40
4 4.
04
LL
8834
88
.34
LR
661
6.61
Joe0
3250
9.00
5
—
I j
1 .-
i 11
mi |
•
I r
iFn
nf
~1
0°
10
1 1
02
10
3 1
04
Ann
exin
V
Joe0
3250
9.00
6
- 1 | ;
M[I
t
t .I
...J
10°
10
1 1
02
10
3 10
"1
Ann
exin
V
Sam
ple
ID: B
A
cqui
sitio
n D
ate:
25-
Mar
-09
Qua
d E
vent
s %
Tot
al
UL
867
8.67
UR
21
3 2.
13
LL
7508
75
.08
LR
1412
14
.12
Sam
ple
ID: C
Acq
uisi
tion
Dat
e: 2
5-M
ar-0
9
Qua
d E
vent
s %
Tot
al
UL
379
3.79
UR
90
4 9.
04
LL
7806
78
.06
LR
911
9.11
Joe0
3250
9.00
7
_ i n
i,
,
' "
""
'i-
' <
ii««t
.
iou
IO1
i<r
ioJ
ioH
Ann
exin
Y
Sam
ple
ID: D
Acq
uisi
tion
Dat
e: 2
5-M
ar-0
9
Qua
d E
vent
s %
Tot
al
UL
372
3.72
UR
98
3 9.
83
LL
7966
79
.66
LR
679
6.79
Joe0
3250
9.00
4
10
' 1
0'
10
J
Ann
exin
V
Sam
ple
ID: A
Acq
uisi
tion
Dat
e: 2
5-M
ar-0
9
Mar
ker
Eve
nts
% T
otal
All
1000
0 10
0.00
M1
8968
89
.68
M2
1045
10
.45
Joe0
3250
9.00
5
10
' 1
0£
10
J
Ann
exin
Y
Sam
ple
ID: B
Acq
uisi
tion
Dat
e: 2
5-M
ar-0
9
Mar
ker
Eve
nts
% T
otal
All
1000
0 10
0.00
M1
8401
84
.01
M2
1610
16
.10
Joe0
3250
9.00
6
Ann
exin
Y
Sam
ple
ID: C
Acq
uisi
tion
Dat
e: 2
5-M
ar-0
9
Mar
ker
Eve
nts
% T
otal
All
1000
0 10
0.00
M1
8229
82
.29
M2
1786
17
.86
Joe0
3250
9.00
7
..r
rn
imm
r-r
m.,
..
....
. 10
° 1
0'
10^
10
J 10
H
Ann
exin
Y
Sam
ple
ID: D
Acq
uisi
tion
Dat
e: 2
5-M
ar-0
9
Mar
ker
Eve
nts
% T
otal
All
1000
0 10
0.00
M1
8391
83
.91
M2
1624
16
.24

^ Jo
e032
509.
008
o -
I II
M
ill |
' I
III
Mlf
10u
10
' 1
02
10
3 10
^ A
nnex
in V
Sam
ple
ID: E
A
cqui
sitio
n D
ate:
Qua
d E
vent
s
UL
1079
U
R
1457
LL
6811
LR
653
25-M
ar-0
9
% T
otal
10.7
9 14
.57
68.1
1
6.53
ON
rr
Joe0
3250
9.00
9
10
' 1
0'
10°
1CT
A
nnex
in V
Sam
ple
ID: F
A
cqui
sitio
n D
ate:
Qua
d E
vent
s U
L 10
63
UR
14
25
LL
6823
LR
689
25-M
ar-0
9
% T
otal
10
.63
14.2
5 68
.23
6.89
^r
Joe0
3250
9.01
0 <=
>i
10"
101
10^
10
J 10
A
nnex
in V
Sam
ple
ID: G
A
cqui
sitio
n D
ate:
Qua
d E
vent
s
UL
1067
U
R
1222
LL
6490
LR
12
21
25-M
ar-0
9
% T
otal
10
.67
12.2
2
64.9
0 12
.21
Joe0
3250
9.00
8
Ann
exin
V
Sam
ple
ID: E
Acq
uisi
tion
Dat
e: 2
5-M
ar-0
9
Mar
ker
Eve
nts
% T
otal
All
1000
0 10
0.00
M1
7943
79
.43
M2
2073
20
.73
Joe0
3250
9.00
9 S
ampl
e ID
:F
Acq
uisi
tion
Dat
e: 2
5-M
ar-0
9
Mar
ker
All
M1
M2
Eve
nts
1000
0 79
33
2079
% T
otal
100.
00
79.3
3
20.7
9 A
nnex
in V
Joe0
3250
9.01
0
10"
10"
Ann
exin
V
Sam
ple
ID: G
Acq
uisi
tion
Dat
e: 2
5-M
ar-0
9
Mar
ker
Eve
nts
% T
otal
A
ll 10
000
100.
00
M1
7615
76
.15
M2
2405
24
.05

Joe032509.004
ON
i.
i
i ' i i mini
•
10°
101
102
103
10
Anne>dn V
Joe032509.005
, ,
,1
1 ii
nii
| *
I I
if I
I
~1
0°
101
10Z
10
3 1<
T
Artn
e>dn
V
v Jo
e032
509.
006
o-S
l iou
io'
10̂
ioJ
i<r
Ann
e>dn
V
Sam
ple :
ID: A
A
cqui
sitio
n D
ate:
25-
Mar
-09
Qua
d UL
UR
LL
LR
Eve
nts 101
404
8834
66
1
% T
otal
1.01
4.
04
88.3
4 6.
61
Sam
ple
ID: B
A
cqui
sitio
n D
ate:
25-
Mar
-09
Qua
d E
vent
s %
Tot
al
UL
UR
LL
867
213
7508
8.67
2.
13
75.0
8
LR
1412
14
.12
Sam
ple
ID: C
A
cqui
sitio
n D
ate:
25-
Mar
-09
Qua
d E
vent
s %
Tot
al
UL
379
3.79
U
R
904
9.04
LL
78
06
78.0
6 LR
91
1 9.
11
Joe0
3250
9.00
7
10U
101
10^
10
J 1
0q
Ann
e>4n
V
Sam
ple
ID: D
A
cqui
sitio
n D
ate:
25-
Mar
-09
Quad Events % Total
UL
372
3.72
UR
983
9.83
LL
7966
79.66
LR
679
6.79
Joe032509.004
'0'""'1
2
3
n4
10u
10'
10^
10J
10
PI
Sample ID: A
Acq
uisi
tion
Dat
e: 2
5-M
ar-0
9
Mar
ker
Eve
nts
% T
otal
A
ll 10
000
100.
00
M1
9486
94
.86
M2
515
5.15
Joe0
3250
9.00
5
10
101
10^
10
J 10
* P
I
Sam
ple
ID: B
A
cqui
sitio
n D
ate:
25-
Mar
-09
Mar
ker
Eve
nts
% T
otal
A
ll 10
000
100.
00
M1
8877
88
.77
M2
1133
11
.33
Joe0
3250
9.00
6 S
ampl
e ID
: C
Acq
uisi
tion
Dat
e: 2
5-M
ar-0
9
Mar
ker
Eve
nts
% T
otal
A
ll M
1 M
2
1000
0 86
87
1323
100.
00
86.8
7 13
.23
Joe0
3250
9.00
7
i n-
•'"
•l1
*in
"""\i
1 a
10u
10
' 10
^ 1
0J
10
q
PI
Sam
ple
ID:D
A
cqui
sitio
n D
ate:
25-
Mar
-09
Mar
ker
All
M1
M2
Eve
nts
1000
0 86
27
1377
% T
otal
10
0.00
86
.27
13.7
7

^
Joe032509.008
<=>T
10u
10' 102 103 104
Annexin V
Sam
ple
ID:
E
Acq
uisi
tion
Dat
e: 2
5-M
ar-0
9
Quad
Events % Total
UL
1079 10.79
UR
1457 14.57
LL
6811 68.11
LR
653 6.53
ON
„•
Joe0
3250
9.00
9 o
- 10"
10
' 1(T
1
0J
10
n
Ann
exin
V
Sam
ple
ID:
F
Acq
uisi
tion
Dat
e: 2
5-M
ar-0
9
Quad
Events % Total
UL
1063 10.63
UR
1425 14.25
LL
6823
68.23
LR
689 6.89
^T
2"!
CO
CM
^ °1
O
-J
o
Joe0
3250
9.01
0
••••
'yg
li''.
*.'
I'.h
-sS
sS
SX
rj
°10
0'
101
10
2
10
3
Ann
exin
V
1( <
Sam
ple
ID: G
A
cqui
sitio
n D
ate:
25-
Mar
-09
Qua
d E
vent
s %
Tot
al
UL
1067 1
0.6
7
UR
1222 12.2
2
LL
6490
64
.90
LR
1221 1
2.2
1
o Joe032509.008
o -
o
^ 1
r,' "
""I
j1 ""
"IV
"
""
IV
'^^
n A
10°
10
1
10
2
10
3
10^
PI
Sam
ple
ID:
E
Acq
uisi
tion
Dat
e: 2
5-M
ar-0
9
Mar
ker
Eve
nts
% T
otal
A
ll 10
000
100.
00
M1
7409
74
.09
M2
2614 2
6.1
4
o Jo
e032
509.
009
o
Sam
ple
ID:
F
Acq
uisi
tion
Dat
e: 2
5-M
ar-0
9
Mar
ker
Eve
nts
% T
otal
A
ll M
1 M
2
1000
0 74
45
2583
100.
00
74.4
5 25
.83
Joe0
3250
9.01
0
^ 1
...i
i im
il ,
i II
IIT
II_
r 1
1m
ii_
, _.
n
1
?
^ d
10u
10
1
lO^
10
J
10^
PI
Sam
ple
ID:G
A
cqui
sitio
n D
ate:
25-
Mar
-09
Mar
ker
All
M1
M2
Eve
nts
1000
0 76
57
2364
% T
otal
10
0.00
76
.57
23.6
4

UN
LV
Ge
no
mic
s C
ore
Flo
w C
ytom
etry
La
b
TT
Joe0
4080
9.00
1 o-
s-
, i
i in
•• |
i
ii
lin
y
10
" 1
0'
10
2 1
03
\fT
Ann
exin
V
-J
<r
Joe0
4080
9.00
2
I -
I •
1II
•• I
•
II
llll
f
10
" 1
0'
10
2 1
03
\QT
A
nnex
in V
TT
Joe0
4030
9.00
3 o
• 10
" 1
0'
10
' 1
0J
10n
Ann
exin
V
Ann
exin
V/P
I as
say,
040
809
Joe
Sam
ple
ID:
Uns
tain
ed
Acq
uisi
tion
Dat
e:
Qua
d
UL
UR
LL
LR
Eve
nts 0 6
9979
15
08-A
pr-0
9
% T
otal
0.00
0.06
99.7
9
0.15
o Jo
e040
809.
001
o
• 10u
10
1 10
^ 1
0J
10H
Ann
exin
Y
Sam
ple
ID:
Uns
tain
ed
Acq
uisi
tion
Dat
e: 0
8-A
pr-0
9
Mar
ker
Eve
nts
% T
otal
All
1000
0 10
0.00
M1
9981
99
.81
M2
20
0.20
Sam
ple
ID:
PI
only
Acq
uisi
tion
Dat
e: 0
8-A
pr-0
9
Qua
d E
vent
s %
Tot
al
UL
UR
LL
LR
331 20
9627
22
3.31
0.20
96.2
7
0.22
o Jo
e040
809.
002
o-
r
C
3 O
1 i
11 m
il
i 11
mil
_.
_
.
ft 1
? 1
4 1
0u
10
1 10
^ 1
0J
10H
Ann
exin
V
Sam
ple
ID:
PI
only
Acq
uisi
tion
Dat
e: 0
8-A
pr-0
9
Mar
ker
Eve
nts
% T
otal
All
1000
0 10
0.00
M1
9960
99
.60
M2
40
0.40
Sam
ple
ID: A
nnex
in V
onl
y
Acq
uisi
tion
Dat
e: 0
8-A
pr-0
9
Qua
d E
vent
s %
Tot
al
UL
UR
LL
LR
67
88
8359
1486
0.67
0.88
83.5
9
14.8
6
o Jo
e040
809.
003
2T
io°
io1
102
103
vr
Ann
exin
V
Sam
ple
ID: A
nnex
in V
onl
y
Acq
uisi
tion
Dat
e: 0
8-A
pr-0
9
Mar
ker
Eve
nts
% T
otal
All
1000
0 10
0.00
M1
8480
84
.80
M2
1540
15
.40

Joe0
4080
9.00
4
Ann
exin
Y
Sam
ple
ID: A
Acq
uisi
tion
Dat
e: 0
8-A
pr-0
9
Qua
d
UL
UR
LL
LR
Eve
nts 89
89
9279
543
% T
otal
0.89
0.89
92.7
9
5.43
Joe0
4.08
09.0
05
0\
10'
10
' 10"
Ann
exin
V
Sam
ple >
ID:B
Acq
uisi
tion
Dat
e: 0
8-A
pr-0
9
Qua
d
UL
UR
LL
LR
Eve
nts
411
232
8546
811
% T
otal
4.11
2.32
85.4
6
8.11
Joe0
4080
9.00
6
Ann
exin
V
Sam
ple
ID:
C
Acq
uisi
tion
Dat
e
Qua
d E
vent
s
UL
124
UR
141
LL
91
34
LR
60
1
08-A
pr-0
9
% T
otal
1.24
1.41
91.3
4
6.01
Joe0
4080
9.00
4
Ann
exin
V
Sam
ple
ID:
A
Acq
uisi
tion
Dat
e: 0
8-A
pr-0
9
Mar
ker
Eve
nts
% T
otal
A
ll 10
000
100.
00
M1
9392
93
.92
M2
620
6.2
0
o
W
:
Count
iiiiiiniiiiiii,
Joe0
4080
9.00
5
M1
M2
10°
10
1
10
2
10
3 1C
A
nnex
in V
<
Sam
ple
ID:
B
Acq
uisi
tion
Dat
e: 0
8-A
pr-0
9
Mar
ker
Eve
nts
% T
otal
All
1000
0 10
0.00
M1
8987
89
.87
M2
1023 1
0.2
3
o Jo
e022
409A
nnrP
I.006
•I
I n
ull
I
mil
l I
11 l
lq
101
10
2
10
3 1
0^
Ann
exin
Y
Sam
ple
ID: 2
00 A
A
cqui
sitio
n D
ate:
24-
Feb-
09
Mar
ker
Eve
nts
% T
otal
A
ll 10
000
100.
00
M1
9001 9
0.0
1
M2
1002 1
0.0
2

Joe0
4.08
09.0
07 ....,„
, ,„
, 10
^ 1
0J
10
q
Ann
exin
V
Sam
ple
ID: D
Acq
uisi
tion
Dat
e: 0
8-A
pr-0
9
Qua
d E
vent
s %
Tot
al
UL
138
1.38
UR
15
2 1.
52
LL
8999
89
.99
LR
711
7.11
TT
Joe0
4080
9.00
8
Ann
exin
V
Sam
ple
ID: E
Acq
uisi
tion
Dat
e
Qua
d E
vent
s
UL
314
UR
41
3
LL
8709
08-A
pr-0
9
% T
otal
3.14
4.13
87.0
9
LR
564
5.64
TT
0060
4080
9.00
9 o
-j-
°-^l
Sam
ple
ID:F
Acq
uisi
tion
Dat
e: 0
8-A
pr-0
9
Qua
d
UL
UR
LL
LR
Eve
nts
316
560
7717
1407
% T
otal
3.16
5.60
77.1
7
14.0
7
Ann
exin
V
Joe0
4080
9.00
7
...•i
II
III.
I II
IH.|
- .
....
10
' 10
^ 1
0J
10H
Ann
exin
V
Sam
ple
ID: D
Acq
uisi
tion
Dat
e: 0
8-A
pr-0
9
Mar
ker
Eve
nts
% T
otal
All
1000
0 10
0.00
M1
9174
91
.74
M2
836
8.36
o
c O
. (J
:
Joe0
408C
M1
10°'
9.00
8
M2
101
10
2 1
03
1C
Ann
exin
V
<
Sam
ple
ID: E
Acq
uisi
tion
Dat
e: 0
8-A
pr-0
9
Mar
ker
Eve
nts
% T
otal
All
1000
0 10
0.00
M1
9076
90
.76
M2
941
9.41
Joe0
4080
9.00
9 S
ampl
e ID
: F
Acq
uisi
tion
Dat
e: 0
8-A
pr-0
9
Mar
ker
Eve
nts
% T
otal
All
1000
0 10
0.00
M1
8087
80
.87
M2
1934
19
.34
Ann
exin
V

QL
PI 10° 101 102 103 104
PI 10° 101 102 103 104
PI 10° 101 102 103 104
^ °.B
o - 9
i- M>". < :
o -i
j&£;
*" y ?
^.•4
£'•
£Y.
Wsg-*\.-
;-. "
r- i - C 7J r- 73
* - co * . ->• U J O) (O O N | M ->
II
a £
I -
M
co
*. ro
CO 4* N)
I -
r -
no <T> to
00
O) co
c_ M
Ol
en
en
en
r i -
N) •̂ 1
*. N)
--J
*.
o r 0) Q.
ll)
-> m
??
n 1
~ w
> o • " jisition
u CD te:0
oo > r-09
CO <u =1 pie ID
r
c i- c < = J r J r
en en en N> 4^ co -J oo O B N Ol
en en en N) * . CD ^-J bo O O S 1«
> Co
i* w m O
a £
Counts Counts
0 100 Counts
T^
o
o -> "*: 3 3 . :
O -i
. . . J . . . J . . . . 1
^
V ^ f
g
0 ^ O
o - i
> "*: 3 3 _ i ; S o - ! 2S. r\> 3 < O -
O -"
10
V ^
l\)
s s > M -^ =
-» 00 O 00 - ^ O U CO O 00 *>• O
> CO a co •9 3
•g. * 2. S-
I
s ro
_̂ no o eo
00 o CO
•S —̂ 00 IV) N) CO
00 N) M CO
>
o o o o
_v o o o o
5"
3 6 T
m § -> tii
s« Tot
> o -" !=-sit on
o
o 00
> o CO
CO fl) 3 <D
D
I
<: ro
N) o a> ^ i
N> O CD •̂ 1
^
- J CO en CO
- j CO Ol CO
All
o o c> o _ k
o o o o
5" ?! ker
m
< CD
v O
—1 O
> o • " uisit
uo
s? " i m o 00
£ 7
s
CO fl) m
ple
a a

rr
Joe0
4080
9.00
4 o
-
10
" 1
0J
10n
Ann
exin
Y
Sam
ple
ID: A
A
cqui
sitio
n D
ate:
Qua
d E
vent
s
UL
89
UR
89
LL
9279
LR
543
08-A
pr-0
9
% T
otal
0.
89
0.89
92.7
9
5.43
^ Jo
e04.
0809
.005
o
•
^2
' 10
^ 10
* A
nnex
in V
1<T
Sam
ple
ID:B
Acq
uisi
tion
Dat
e: 0
8-A
pr-0
9
Qua
d
UL
UR
LL
LR
Eve
nts
411
232
8546
811
% T
otal
4.11
2.32
85
.46
8.11
,r
Joe0
4080
9.00
6
2f
10
" 10
° A
nnex
in V
Sam
ple
ID: C
Acq
uisi
tion
Dat
e:
Qua
d E
vent
s U
L 12
4
UR
14
1
LL
9134
LR
601
08-A
pr-0
9
% T
otal
1.24
1.41
91.3
4
6.01
Joe0
4080
9.00
4
i,
ly'"
"U
i
A 10
1 1C
T
10
J 10
^ P
I
Sam
ple
Acq
uisi
ti
Mar
ker
All
M1
M2
ID: A
on D
ate:
(
Eve
nts
1000
0
9792
20
9
D8-
Apr
-09
% T
otal
100.
00
97.9
2
2.09
Joe0
4080
9.00
5 S
ampl
e ID
: B
Acq
uisi
tion
Dat
e: 0
8-A
pr-0
9
Mar
ker
Eve
nts
% T
otal
All
1000
0 10
0.00
M1
9086
90
.86
M2
929
9.29
o Jo
e022
4.09
Ann
rPI.0
Q6
o -
Sam
ple
ID: 2
00 A
Acq
uisi
tion
Dat
e: 2
4-F
eb-0
9
Mar
ker
Eve
nts
% T
otal
All
1000
0 10
0.00
M1
9476
94
.76
M2
524
5.24

CO
1
a- S
i
Joe040S09.007
10'
10'
Annexin V
Sam
ple
ID: D
A
cqui
sitio
n D
ate:
08-
Apr
-09
Qua
d U
L
UR
LL
Eve
nts 138
152
8999
% T
otal
1.38
1.
52
89.9
9
LR
711
7.11
Joe040809.008
. .
. f•
•••
| I
I ll
lllf
102
10
3 V
T
Ann
e>dn
V
Sam
ple
ID: E
A
cqui
sitio
n D
ate:
08-
Apr
-09
Qua
d E
vent
s %
Tot
al
UL
314
3.14
UR
41
3 4.
13
LL
8709
87
.09
LR
564
5.64
Joe0
4080
9.00
9 S
ampl
e ID
: F
Acq
uisi
tion
Dat
e: 0
8-A
pr-0
9
Qua
d E
vent
s %
Tot
al
UL
316
3.16
UR
56
0 5.
60
LL
7717
77
.17
LR
1407
14
.07
Ann
exdn
V
o Jo
e040
809.
007
o -
^ 1
-1
• ••
••!
J •
llll
|.l
I ll
l>|
I I
llfl
.,
10°
101
10
2 1
03
lO4
PI
Sam
ple
ID: D
A
cqui
sitio
n D
ate:
08-
Apr
-09
Mar
ker
Eve
nts
% T
otal
All
1000
0 10
0.00
M1
9655
96
.55
M2
346
3.46
Joe0
4080
9.00
8
Sam
ple
ID: E
Acq
uisi
tion
Dat
e: 0
8-A
pr-0
9
Mar
ker
Eve
nts
% T
otal
All
1000
0 10
0.00
M1
8935
89
.35
M2
1074
10
.74
Joe0
4080
9.00
9 S
ampl
e ID
: F
Acq
uisi
tion
Dat
e: 0
8-A
pr-0
9
Mar
ker
Eve
nts
% T
otal
All
1000
0 10
0.00
M1
8690
86
.90
M2
1330
13
.30

^ Jo
e040
809.
010
ST
S
ampl
e ID
: G
Acq
uisi
tion
Dat
e
Qua
d E
vent
s U
L 28
5 U
R
577
LL
7598
LR
15
40
08-A
pr-0
9
% T
otal
2.85
5.
77
75.9
8 15
.40
Ann
exin
Y
TT
Joe0
4080
9.01
1 2
T
10'
10
" 10
J
Ann
exin
V
Sam
ple
ID: H
A
cqui
sitio
n D
ate
Qua
d E
vent
s
UL
274
UR
51
5 LL
78
69
LR
1342
08-A
pr-0
9
% T
otal
2.
74
5.15
78
.69
13.4
2
TT
21
CO
•
2]
^ 2
]
"21
0
Joe0
4080
9.01
2
^
'io
°"
',.,
i l>
i:M
.
•
101
1 A
nne D
2 1
03
xin
V
10
Sam
ple
ID:
1 A
cqui
sitio
n D
ate
Qua
d E
vent
s
UL
191
UR
46
2 LL
79
17
LR
1430
08-A
pr-0
9
% T
otal
1.
91
4.62
79
.17
14.3
0
Joe0
4080
9.01
0
o ^
1 _
i II
IIII
| .1
• •
•••
•!
.
10°
101
10
2
Sam
ple
ID: G
A
cqui
sitio
n D
ate:
08-
Apr
-09
Mar
ker
Eve
nts
% T
otal
All
1000
0 10
0.00
M
1 86
60
86.6
0 M
2 13
57
13.5
7
Joe0
4080
9.01
1
TTTI
WI—
1 ii
tur
i'
r ii
iiii
i'
r ii
n._
J
1 ?
T
d
10
1 10
^ 1
0J
10H
PI
Sam
ple
ID: H
A
cqui
sitio
n D
ate:
08-
Apr
-09
Mar
ker
Eve
nts
% T
otal
All
1000
0 10
0.00
M
1 88
36
88.3
6 M
2 11
79
11.7
9
Joe0
4080
9.01
2 S
ampl
e ID
: I
Acq
uisi
tion
Dat
e: 0
8-A
pr-0
9
Mar
ker
Eve
nts
% T
otal
A
ll 10
000
100.
00
M1
9058
90
.58
M2
954
9.54
P
I

REFERENCES
Almeida RD, Manadas BJ, Carvalho AP, Duarte CB. Intracellular signaling mechanisms in photodynamic therapy. Biochimica et Biophysica Acta 1704:59-86; 2004.
Barth RF. Rat brain tumor models in experimental neuro-oncology: the 9L, C6, T9, F98, RG2 (D74), RT-2 and CNS-1 gliomas. Journal of Neurooncology 36:91-102; 1998.
Bates RC, Edwards NS, Yates JD. Spheroids and cell survival. Critical Reviews in Oncology/Hematology 36:61-74; 2000.
Berg K, Bommer JC, Moan J. Evaluation of sulfonated aluminum phthalocyanines for use in photochemotherapy. Cellular uptake studies. Cancer Letters 44:7-15; 1989.
Berg K, Selbo PK, Prasmickaite L, Tjelle TE, Sandvig K, Moan J, Gaudernack G, Fodstad 0, Kjolsrud S, Anholt H, Rodal GH, Rodal SK, Hogset A. Photochemical internalization: a novel technology for delivery of macromolecules into cytosol. Cancer Research 59:1180-1183; 1999.
Berg K, Dietze A, Kaalhus O, Hegset A. Site-specific drug delivery by photochemical internalization enhances the antitumor effect of bleomycin. Clin Cancer Res ll(23):8476-8485; 2005a.
Berg K, Selbo PK, Weyergang A, Dietze A, Prasmickaite L, Bonsted A, Engesaeter BO, Angell-Petersen E, Frandsen N, Hogset A. Porphyrin-related photosensitizers for cancer imaging and therapeutic applications. Journal of Microscopy 218(2): 133-147; 2005b.
Berg K, Hogset A, Prasmickaite L, Weyergang A, Bonsted A, Dietze A, Lou PJ, Bown S, Norum OJ, Mollergard HMT, Selbo PK. Photochemical internalization: A novel technology for activation of endocytosed therapeutic agents. Medical Laser Application 21:239-250; 2006.
Berg K, Folini M, Prasmickaite L, Selbo PK, Bonsted A, Engesaeter B0, Zaffaroni N, Weyergang A, Dietze A, Maelandsmo GM, Wagner E, Norum OJ, Hogset A. Photochemical internalization: a novel tool for drug delivery. Current Pharmaceutical Biotechnology 8:362-372; 2007.
74

Bonneau S, Morliere P, Brault D. Dynamics of interactions of photosensitizers with lipoproteins and membrane-models: correlation with cellular incorporation and subcellular distribution. Biochemical Pharmacology 68:1443-1452; 2004.
Brown JM, Wilson WR. Exploiting tumour hypoxia in cancer treatment. Nature Reviews Cancer 4:437-447; 2004.
Brown SB, Brown EA, Walker I. The present and future role of photodynamic therapy in cancer treatment. The Lancet Oncology 5:497-508; 2004.
Carlsson J, Nederman T. Tumor spheroid technology in cancer therapy research. Eur J Cancer Clin Oncol 25(8): 1127-1133; 1989.
Castano AP, Demidova TN, Hamblin MR. Mechanisms in photodynamic therapy: Part one - Photosensitizers, photochemistry and cellular localization. Photodiagnosis and Photodynamic Therapy 1:279-293; 2004.
Castano AP, Demidova TN, Hamblin MR. Mechanisms in photodynamic therapy: Part two - Cellular signaling, cell metabolism and modes of cell death. Photodiagnosis and Photodynamic Therapy 2:1-23; 2005a.
Castano AP, Demidova TN, Hamblin MR. Mechanisms in photodynamic therapy: Part three - Photosensitizer pharmacokinetics, biodistribution, tumor localization and modes of tumor destruction. Photodiagnosis and Photodynamic Therapy 2:91-106; 2005b.
CBTRUS. Statistical Report: Primary Brain Tumors in the United States, 2000-2004. Published by the Central Brain Tumor Registry of the United States; 2008.
Chan WS, Marshall JF, Svensen R, Bedwell J, Hart IR. Effect of sulfonation on the cell and tissue distribution of the photosensitizer aluminum phthalocyanine. Cancer Research 50:4533-4538; 1990.
Chan WS, Brasseur N, La Madeleine C, Ouellet R, van Lier JE. Efficacy and mechanism of aluminium phthalocyanine and its sulphonated derivatives mediated photodynamic therapy on murine tumours. Eur J Cancer 33(11): 1855-1859; 1997.
Chandana SR, Movva S, Arora M, Singh T. Primary brain tumors in adults. American Family Physician 77(10): 1423-1430; 2008.
Chignola R, Schenetti A, Andrighetto G, Chiesa E, Foroni R, Sartoris S, Tridente G, Liberati D. Forecasting the growth of multicell tumour spheroids: implications for the dynamic growth of solid tumours. Cell Prolf 33:219-229; 2000.
DeAngelis LM. Brain tumors. N Engl J Med 344(2): 114-123; 2001.
75

Dougherty TJ, Gomer CJ, Henderson BW, Jori G, Kessel D, Korbelik M, Moan J, Peng Q. Review: Photodynamic therapy. Journal of the National Cancer Institute 90(12):889-905; 1998.
Edrei R, Gottfried V, van Lier JE, Kimel S. Sulfonated phthalocyanines: photophysical properties, in vitro cell uptake and structure-activity relationships. J Porphyrins Phthalocyanines 2:191-199; 1998.
Fadul CE, Wen PY, Kim L, Olson JJ. Cytotoxic chemotherapeutic management of newly diagnosed glioblastoma multiforme. J Neurooncol 89:339-357; 2008.
Folkman J, Hochberg M. Self-regulation of growth in three dimensions. The Journal of Experimental Medicine 138:745-753; 1973.
Fracasso G, Colombatti M. Effect of therapeutic macromolecules in spheroids. Critical Reviews in Oncology/Hematology 36:159-178; 2000.
Freyer JP. Role of necrosis in regulating the growth saturation of multicellular spheroids. Cancer Research 48:2432-2439; 1988.
Freyer JP, Sutherland RM. Regulation of growth saturation and development of necrosis in EMT6/R0 multicellular spheroids by the glucose and oxygen supply. Cancer Research 46:3504-3512; 1986.
Guiot C, Degiorgis PG, Delsanto PP, Gabriele P, Deisboeck TS. Does tumor growth follow a "universal law"? Journal of Theoretical Biology 225:147-151; 2003.
Hogset A, Prasmickaite L, Selbo PK, Helium M, Engesaeter BO, Bonsted A, Berg K. Photochemical internalization in drug and gene delivery. Advanced Drug Delivery Reviews 56:95-115; 2004.
Huang Z. A review of progress in clinical photodynamic therapy. Technol Cancer Res Treat 4(3):283-293; 2005.
Kim JB. Three-dimensional tissue culture models in cancer biology. Seminars in Cancer Biology 15:365-377; 2005.
Ko L, Koestner A, Wechsler W. Morphological characterization of nitrosourea-induced glioma cell lines and clones. Acta Neuropathologica (Berl) 51:23-31; 1980.
Koopman G, Reutelingsperger CP, Kuijten GA, Keehnen RM, Pals ST, van Oers MH. Annexin V for flow cytometric detection of phosphatidylserine expression on B cells undergoing apoptosis. Blood 84:1415-1420; 1994.
76

Kunz L, Connelly JP, Woodhams JH, MacRobert AJ. Photodynamic modification of disulfonated aluminium phthalocyanine fluorescence in a macrophage cell line. Photochem Photobiol Sci 6:940-948; 2007.
Kunz-Schughart LA. Multicellular tumor spheroids: intermediates between monolayer culture and in vivo tumor. Cell Biology International 23(3): 157-161; 1999.
Lefranc F. Editorial: on the road to multi-modal and pluri-disciplinary treatment of glioblastomas. Acta Neurochir 151:109-112; 2009.
MacDonald IJ, Dougherty TJ. Basic principles of photodynamic therapy. Journal of Porphyrins and Phthalocyanines 5:105-129; 2001.
Madsen SJ, Sun CH, Tromberg BJ, Yeh AT, Sanchez R, Hirschberg H. Effects of combined photodynamic therapy and ionizing radiation on human glioma spheroids. Photochemistry and Photobiology 76(4):411-416; 2002.
Madsen SJ, Angell-Petersen E, Spetalen S, Carper SW, Ziegler SA, Hirschberg H. Photodynamic therapy of newly implanted glioma cells in the rat brain. Lasers in Surgery and Medicine 38:540-548; 2006a.
Madsen SJ, Sun CH, Tromber BJ, Cristini V, Magalhaes ND, Hirschberg H. Multicell tumor spheroids in photodynamic therapy. Lasers in Surgery and Medicine 38:555-564;2006b.
Madsen SJ, Kharkhuu K, Hirschberg H. Utility of the F98 rat glioma model for photodynamic therapy. Journal of Environmental Pathology, Toxicology, and Oncology 26(2): 1-7; 2007.
Maman N, Dhami S, Phillips D, Brault D. Kinetic and equilibrium of incorporation of disulfonated aluminum phthalocyanine into unilamellar vesicles. Biochimica et Biophysica Acta 1420:168-178; 1999.
Mir LM, Tounekti O, Orlowski S. Bleomycin: Revival of an old drug. Gen Pharmac 27(5):745-748; 1996.
Mueller-Klieser W. Multicellular spheroids: a review on cellular aggregates in cancer research. J Cancer Res Clin Oncol 113:101-122; 1987.
Newton HB. Glioblastoma multiforme. Current Treatment Options in Neurology 10:285-294; 2008.
Nyman ES, Hynninen PH. Research advances in the use of tetrapyrrolic photosensitizers for photodynamic therapy. Journal of Photochemistry and Photobiology B: Biology 73:1-28; 2004.
77

Perria C, Capuzzo T, Cavagnaro G, et al. First attempts at the photodynamic treatment of human gliomas. Journal of Neurosurgical Sciences 17:119-129; 1980.
Povirk LF, Wubker W, Kohnlein W, Hutchinson F. DNA double-strand breaks and alkali-labile bonds produced by bleomycin. Nucleic Acids Res 4:3573-3580; 1977.
Prasmickaite L, Hegset A, Selbo PK, Engesaster B0, Helium M, Berg K. Photochemical disruption of endocytic vesicles before delivery of drugs: a new strategy for cancer therapy. British Journal of Cancer 86:652-657; 2002.
Roy SN, Horwitz SB. Characterization of the association of radiolabeled bleomycin A2 with HeLa cells. Cancer Research 44:1541-1546; 1984.
Santini MT, Rainaldi G, Indovina PL. Apoptosis, cell adhesion and the extracellular matrix in the three-dimensional growth of multicellular tumor spheroids. Critical Reviews in Oncology/Hematology 36:61-74; 2000.
Selbo PK, Sivam G, Fodstad 0, Sandvig K, Berg K. In vivo documentation of photochemical internalization, a novel approach to site specific cancer therapy. Int J Cancer 92:761-766; 2001.
Selbo PK, Weyergang A, Bonsted A, Bown SG, Berg K. Photochemical internalization of therapeutic macromolecular agents: a novel strategy to kill multidrug-resistant cancer cells. The Journal of Pharmacology and Experimental Therapeutics 319(2):604-612;2006.
Snyder JW, Greco WR, Bellnier DA, Vaughan L, Henderson BW. Photodynamic therapy: a means to enhanced drug delivery to tumors. Cancer Research 63:8126-8131;2003.
Stubbe J, Kozarich JW. Mechanisms of bleomycin-induced DNA degradation. Chem Rev 87(5): 1107-1136; 1987.
Stylli SS, Kaye AH. Photodynamic therapy of cerebral glioma - A review: Part I - A biological basis. Journal of Clinical Neuroscience 13:615-625; 2005a.
Stylli SS, Kaye AH. Photodynamic therapy of cerebral glioma - A review: Part II -Clinical studies. Journal of Clinical Neuroscience 13:709-717; 2005b.
Sutherland RM. Cell and environment interactions in tumor microregions: the multicell spheroid model. Science 240(4849): 177-184; 1988.
Tounekti O, Pron G, Belehradek J Jr, Mir LM. Bleomycin, an apoptosis-mimetic drug that induces two types of cell death depending on the number of molecules internalized. Cancer Research 53:5462-5469; 1993.
78

Triesscheijn M, Baas P, Schellens JHM, Stewart FA. Photodynamic therapy in oncology. The Oncologist 11:1034-1044; 2006.
Venkatasubramanian R, Henson MA, Forbes NS. Incorporating energy metabolism into a growth model of multicellular tumor spheroids. Journal of Theoretical Biology 242:440-453; 2006.
Vermes I, Haanen C, Steffens-Nakken H, Reutelingsperger C. A novel assay for apoptosis: flow cytometric detection of phosphatidylserine expression on early apoptotic cells using fluorescein labeled Annexin V. Journal of Immunological Methods 184:39-51; 1995.
Wilson BC. Photodynamic therapy: Clinical applications. In: Bertino JR. Encyclopedia of Cancer. St. Louis, MO: Academic Press; 2002:453-462.
Wolff JE, Trilling T, Molenkamp G, Egeler RM, Jiirgens H. Chemosensitivity of glioma cells in vitro: a meta analysis. J Cancer Res Clin Oncol 125:481-486; 1999.
Zhu TC, Finlay JC. The role of photodynamic therapy physics. Medical Physics 35(7):3127-3136;2008.
79

VITA
Graduate College University of Nevada, Las Vegas
Joseph William Blickenstaff III
Local Address: 1800 N. Green Valley Pkwy Apt. 1324 Henderson, NV 89074
Home Address: 2026 Herbert Ave. Westminster, MD 21157
Degrees: Bachelor of Science, Physics, 2003 Carnegie Mellon University
Publications: Tristram-Nagle S, Lewis RN, Blickenstaff JW, DiPrima M, Marques BF, McElhaney RN, Nagle JF, Schneider JW. Thermodynamic and structural characterization of amino acid-linked dialkyl lipids. Chemistry and Physics of Lipids 134:29-39; 2005.
Thesis Title: Photochemical Delivery of Bleomycin in Malignant Glioma Cells
Thesis Examination Committee: Chairperson, Dr. Steen J. Madsen, Ph. D. Committee Member, Dr. Phillip W. Patton, Ph. D., CHP Committee Member, Dr. Ralf Sudowe, Ph. D. Graduate Faculty Representative, Dr. Mack D. Rubley, Ph. D., ATC
80