phosphorus in agriculture and in relation to water quality
TRANSCRIPT


Phosphorus in Agriculture
and in Relation to Water Quality
A E Johnston C J Dawson
November 2005

2
Acknowledgements. This report was prepared at the request of the Agriculture and Environment Committee of the Fertiliser Sector of the Agricultural Industries Confederation in the UK. The co-operation of many people is acknowledged, with particular thanks to Phil Haygarth, IGER, North Wyke and Paul Withers, ADAS, who both supplied much published data, and to Ingrid Steén, Kemira GrowHow Oy, Finland, and to the Environment Agency: Helen Wakeham, Hannah Bartram, Rachael Dils, Simon Leaf and Rob Robinson, for helpful comment.
Copies available from:
Mrs J L Salter AIC Confederation House East of England Showground Peterborough PE2 6XE United Kingdom
Tel: +44 (0)1733 385272
E-mail: <[email protected]>
©2005 Agricultural Industries Confederation.
ISBN 0 85310 199 X ISBN 978 0 85310 199 4
UK £25.00
About the authors:
A E (Johnny) Johnston is a Lawes Trust Senior Fellow at Rothamsted Research, Harpenden, AL5 2JQ, UK.
C J Dawson is a private consultant in the fertiliser and related fields, Ox Carr Lane, Strensall, York YO32 5TD, UK.
3
FOREWORD. The Agricultural Industries Confederation (AIC), with its involvement in the supply of fertiliser and feedstuffs to UK agriculture, is committed to a policy of responsible care for its products and services. In the context of discussions concerning levels of phosphorus in surface waters, the AIC considers that a clear understanding of the science behind the potential for transfer of the proportion of phosphorus derived from farmed land to water is essential. To this end the AIC has commissioned this scientific review of phosphorus in agriculture and in relation to water quality, to provide the technical background against which policies and guidelines at the national and catchment level can be developed as necessary. The review is in support of the Defra review of diffuse water pollution from agriculture. The objective for this review was therefore to produce a scientific summary of the best available knowledge and techniques for managing agricultural phosphorus, which can be applied both generally to support the principles of Integrated Farming and to determine site specific actions in catchments where improvements in the control of agriculturally derived phosphate is a priority. Although the work was initiated by the Fertiliser sector of AIC, consultations with the Feed sector have ensured that this review complements the accepted science of animal nutrition. This review discusses current understanding of the chemistry of phosphorus in soil and its essential role in crop and animal nutrition. Having listed the pathways by which phosphorus can be transported from soil to water, the review gives recent experimental measurements of the amounts of phosphorus that have been transported from soil and the soil surface to water under a range of agricultural management systems. Although the amounts of phosphorus are insignificant agronomically they can have undesirable effects in the aquatic environment. The review suggests that most of the phosphorus transported from soil to water comes from specific fields or as a result of specific actions by farmers, and that not all fields within a catchment contribute to the phosphorus load in a river. In consequence, there is sufficient evidence to believe that these fields should be considered as specific sources for the purposes of any necessary remedial action. This is a useful approach for the farmer and adviser because it allows defined and targeted action plans to be developed to address a specific situation or practice once it has been identified. In the context of increasing evidence of ecological problems associated with elevated nutrient levels (i.e. eutrophication) in water bodies, any outdated attitudes towards the issue need to be revised. As key influencers of behavioural change in farming practice, AIC and the advisers and agronomists of member companies are well equipped to contribute towards finding and encouraging the implementation of flexible, effective technical solutions to environmental concerns. We shall use this written resource to develop our own advice in refining nutrient management practices and hope that others, designing and or implementing packages of measures to manage diffuse pollution, will do the same. It is intended that the review will be of value and be used in Scotland, Wales and Northern Ireland. It is also relevant to the development of any Integrated Farming system such as developed by LEAF and others in the UK, and by EISA – European Initiative for Sustainable Development in Agriculture.
David Caffall, Chief Executive AIC, November 2005
4
CONTENTS Overview 6
1. Introduction 12
2. Risk assessment and management 13 2.1. Risk assessment 13 2.2. Risk management 13
3. Phosphorus, essential nutrient for plants and animals 13
4. Phosphorus in agriculture 13
5. Phosphorus in the aquatic environment 16
6. The behaviour of phosphorus in soil 18 6.1. Effects of soil organic matter on phosphorus availability 19 6.2. Phosphorus saturation of soil 19
7. Critical levels of soil phosphorus for agriculture 20 7.1. Effect of soil phosphorus status on other inputs required for crop production 21 7.2. Relationship between P demand by crops and water-soluble P lost in
drainage water 21
8. Phosphorus use efficiency 23
9. Phosphorus inputs to agriculture in fertilisers and manures 24
10. Transport of phosphorus from agricultural soils 28 10.1. Water movement at the soil profile scale 28 10.2. Water movement at the slope/field scale 29 10.3. Possible causes for an increase in the phosphorus concentration in
water leaving soil 30 10.4. Transport of phosphorus from soil at the catchment scale 31
11. Some experimental measurements of phosphorus loss from soil to water 32 11.1. Arable soils 32 11.2. Grassland soils 33
12. Organic manures and phosphorus loss from soil 37 12.1. Poultry litter 37 12.2. Cattle slurry and farmyard manure 38 12.3. Cattle slurry, liquid digested sludge and dewatered sludge cake 38 12.4. Organic manures and forage crops 40
13. Phosphorus availability in stream and lake sediments 42 13. 1. Organic phosphates 42 13. 2. Inorganic phosphates 42

5
14. Some approaches to managing phosphorus inputs to minimise the risk of phosphorus transport from soil to water 43
14.1. The amounts and timing of phosphorus inputs 43 14.2. The type of phosphorus fertiliser used 43 14.3. The water solubility of the form of phosphorus in fertilisers and
organic manures 43 14.4. The use of additives in animal feeding stuffs 44 14.5. Controlling the risk of phosphorus transfer from soil to water 44
15. Recommendations 45
Annex A1. Phosphorus essential nutrient for plants and animals 48
A1.1. Phosphorus and plants 48 A1.2. Phosphorus and animals 49
A2. Phosphorus in the aquatic environment 50
A3. The behaviour of phosphorus in soil 52 A3.1. Organic matter and soil phosphorus availability 55 A3.2. Phosphorus saturation of soil 57
A4. Soil phosphorus and nitrogen use efficiency 58
A5. Methods for determining phosphorus use efficiency 60 A5.1. Using the radioisotope 32P 60 A5.2. The difference method 60 A5.3. The balance method 60
A6. Categorising the phosphorus transported from soil 60
A7. Pathways of water movement in agricultural soils 62 A7.1. Soil profile scale 62 A7.2. Slope/field scale 63
References 64
Bibliography 69
Glossary 71
6
OVERVIEW. Phosphorus (P) is an essential, irreplaceable element in the functioning of all life forms on this planet, not least of the crops grown on land on which our food supply depends. Nutrient enrichment (eutrophication) of water bodies, on which their own biological productivity depends, relies on the transfer of nutrients from the land, which may be both undisturbed and man-managed, and from industrial effluents discharged to water, for example from sewage treatment works. In recent decades there has been an increase in the level of nutrients in some fresh water bodies that has caused undesirable changes in their ecology, the balance of species of plants, fish and other aquatic life (the biological balance). In many cases these changes in fresh waters can be related to an increase in the concentration of bioavailable phosphorus although other elements may limit the productivity of some species.
Past effort and expenditure in the UK to tackle phosphorus pollution in rivers and lakes has been directed at decreasing the phosphorus loadings from sewage treatment works (STWs). Although further controls on STWs will be required to meet future objectives in some catchments, attention is now being directed towards the transfer of phosphorus from agriculturally managed soils and livestock enterprises to the aquatic environment. However, any attempt to control such transfers must be set against the essential need for phosphorus in food production. Seeking acceptable remedies for situations where there are issues about the phosphorus load in water bodies requires an awareness of and accurate data on four major topics.
i) The level of readily plant-available phosphorus in soil required to achieve acceptable crop yields. At such levels very little water-soluble phosphorus moves through and is lost from the soil profile.
ii) The source of phosphorus that is in water as it leaves the land, the pathways by which the water moves and their relative importance. Inputs of phosphorus to arable soils have not increased in recent years, those to grassland probably have.
iii) The relative contribution of different areas within a river catchment to the phosphorus load in a river as it leaves the catchment. Phosphorus transport is predominantly from discrete source areas rather than from all parts of a catchment.
iv) The amount, sources and phosphorus load in rivers, including that which is recycled from the sediments, which will allow an accurate assessment of the contribution from land.
Such information is vital because managing any risk associated with the transfer of phosphorus from soil to water should be targeted accurately and with least detriment or cost to achieving its objective. The processes involved in eutrophication are complex but current levels of understanding are sufficient to assess the range of actions that could decrease the risk of eutrophication and its impact. There are legal and policy requirements (see Bibliography) that necessitate appropriate actions and ongoing research will progressively allow the Environment Agency to refine its assessments, targets and control measures.
This review, which is mainly directed to the use of phosphorus in agriculture, discusses the need for phosphorus in crop production, current concepts about the behaviour of phosphorus in soil and the essential need to maintain appropriate critical levels in soil, some experimental results on phosphorus transfer from soil to water in different farming systems and approaches to managing phosphorus inputs to minimising the risk of phosphorus transfers. The more important points are summarised here.
7
The essential need for phosphorus in agriculture.
Phosphorus is an essential and major nutrient for both plants and animals. Thus as food is grown on agricultural land and transferred from there to be consumed by animals and people, so the large quantities of phosphorus taken up from the soil by the crops are removed from the field. This phosphorus must be replaced if soils are not to become depleted and infertile. For example, winter wheat is the major arable crop in the UK and will remove about 30 kg P/ha/year in an average 8 t/ha harvest, and this phosphorus must be taken up from the soil in water-soluble form. This quantity compares with an amount of phosphorus almost 1000 times smaller of only 0.035 kg P/ha/year which, if lost in the average 100 mm of drainage water leaving a typical eastern England wheat field would be sufficient to raise its phosphorus concentration to a potentially eutrophic 35 μg P/L, (35 parts per billion).
Such a disparity between the annual phosphorus flux1 in the field and the drainage concentration would be likely even in unfarmed situations. It implies that attempts to reduce the entry of phosphorus into watercourses by simple movement in drainage water, which may be referred to as 'diffuse' or even 'ubiquitous', are unlikely to be feasible. Thus the extremely small losses which occur in this way must be distinguished from those which can occur following direct applications of manures or fertilisers if spread on dry cracked soils or prior to significant rainfall events.
Current use of phosphorus fertilisers in agriculture.
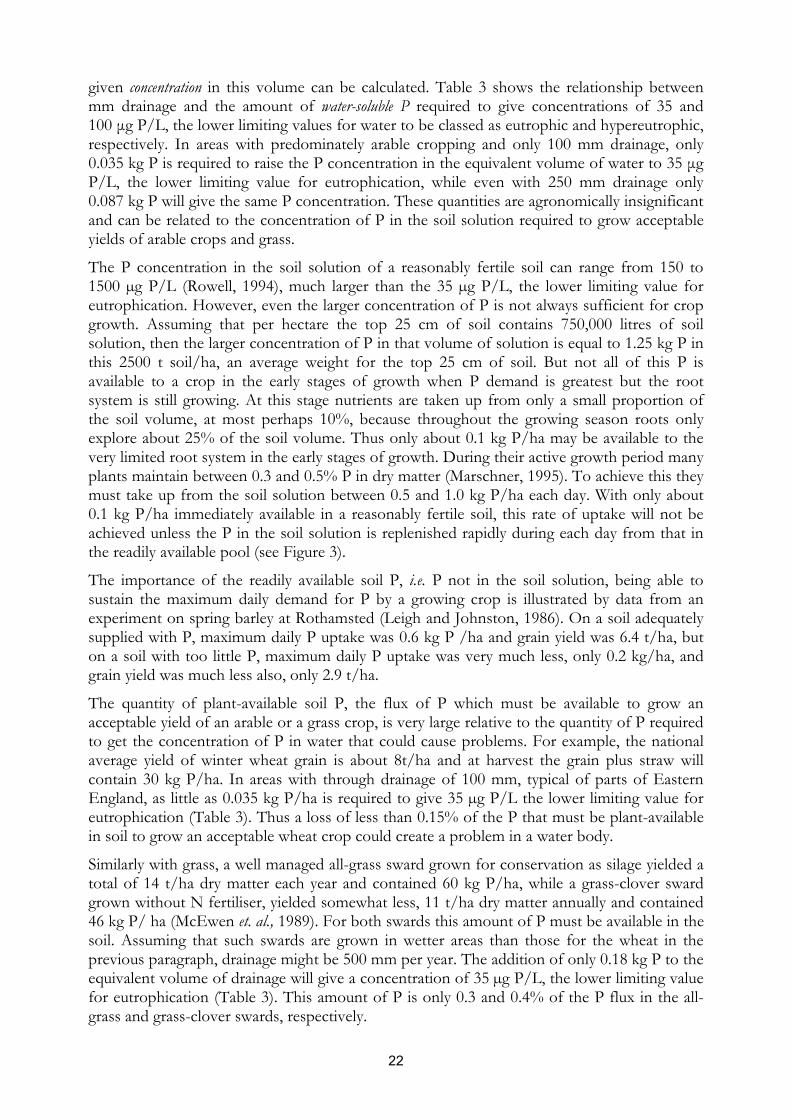
Neither the total amount of phosphorus fertiliser used in the UK nor the amount per hectare to the more important arable crops is greater now than 30 years ago. Consequently the recent enrichment of rivers and lakes with phosphorus is not due to an increase in the use of phosphatic fertilisers. However, the relative importance of agricultural sources in some catchments is increasing as phosphorus from other sources like STWs declines. Very importantly, current evidence for the “The National Farm” in England and Wales shows that the phosphorus balance (phosphorus applied minus phosphorus removed in the harvested crop) has been negative for the last 10 years for cereals, oilseed rape, potatoes and sugar beet crops grown without addition of animal manures. As only 16% of all tillage crops are given an application of organic manure the emerging picture is applicable to the large area, more than 80%, of the land growing these arable crops. There was a significant positive phosphorus balance for some 20 years from 1973 to the mid 1990s, and phosphorus residues accumulated in soil and built up soil fertility. But during the last 10 years, the annual negative phosphorus balance has used up about half of these estimated phosphorus residues and all the accumulated residues will have gone by 2010 if the rate of use continues as in the last two or three years. In the light of these data there must be some concern that the phosphorus fertility of these soils is at risk, not only because soils containing insufficient phosphorus produce less but also other inputs, notably nitrogen fertilisers, are used less efficiently.
Similar “national” data do not exist for changes in the phosphorus balance in grassland systems because there is not sufficient information on phosphorus offtakes in conserved grass and inputs in organic manures in animal husbandry systems. Yet it is in the area of livestock manure management where such data would be invaluable. However, positive phosphorus balances are probable given the increase in animal production and the increased use of animal feedstuffs imported onto the farm. With livestock manures the situation is as much about how they are used as about the amounts that are produced. Existing evidence suggests that, 1 The flux defined here is the quantity of phosphorus found in the harvested materials and which will have been
taken up from the soil solution by the growing crop. It does not include the additional flux of phosphorus taken up and incorporated into the roots and other non-harvested crop parts, nor the phosphorus taken up and released by the soil microbial biomass.

8
regrettably, many farmers make little allowance for the phosphorus in the organic manures they have available to them when deciding how much phosphorus fertiliser to apply. Current regulations, that restrict by the quantity of nitrogen that will be applied by the amount of manure that can be spread, invariably lead to an application of phosphorus that exceeds the amount required to achieve maximum yield.
The transport of phosphorus from soil to water. The transport of phosphorus from agriculturally managed soils is often described as a “diffuse” loss. Initially “diffuse” was used to contrast with inputs to rivers from “point” sources, like sewage treatment works. But diffuse, meaning spread out, not concentrated, has perhaps given the impression that phosphorus is lost from all agriculturally managed soils, but this is not so. It is now recognised that individual fields, such as those containing unnecessarily large amounts of soil phosphorus, or actions, such as the inappropriate application of animal slurry to a field, may under the right conditions of topography and climate be major contributors to the phosphorus load in rivers and lakes. There is also evidence that not all fields in a catchment contribute equally to the phosphorus load in the river leaving that catchment. Consequently, to lessen the phosphorus load in rivers every effort should be made to identify those fields that contribute most phosphorus due to soil enriched with phosphorus being liable to erosion or because the animal husbandry and manure management system being practiced is inappropriate.
Much work has been done on evaluating the forms and mechanisms by which phosphorus is transported from land to water. Other than in a very few circumstances, phosphorus is transported in water so the movement of water over and through the soil is important. Water movement has to be considered at the field/slope scale and the soil profile scale. At the slope/field scale significant amounts of water can move to ditches and streams by overland/surface flow or by interflow/through flow, e.g. at the interface of permeable soil and an impermeable layer like rock. At the soil profile scale, water can move through the soil by preferential flow down cracks, fissures and channels especially in heavy textured, clayey soils. Where such soils have artificial drainage systems water moves swiftly to ditches. On coarse textured, sandy soils, water moves almost uniformly down through the soil profile, piston flow.
Water moving by these pathways can transport both particulate and soluble phosphorus by two distinct processes:
i) Incidental phosphorus transfers. These occur when large amounts of manure, especially slurry, or fertiliser are applied to land and this coincides with significant rainfall events that lead to overland flow. This is a major problem in high rainfall, hillier parts of Britain with heavy textured soils where cattle based farming predominates. This pathway has the greatest potential to transport phosphorus from land to water. Incidental transfers can also occur if excess rainfall leads to a rapid increase in subsurface water flow through artificial drains.
ii) With eroded soil. When high intensity rainfall detaches soil particles with their associated phosphorus from the main soil body they can be transported to ditches and streams in overland flow or in water moving down cracks and fissures. Soil erosion can be a problem on arable soils without adequate vegetative cover, on poached grassland soils or on heavy textured soils subject to severe cracking on drying. To minimise the risk of phosphorus transport in eroded soil it is important that soils should not contain more phosphorus than is required to achieve optimum yields of crops.
9
Four other sources of phosphorus in water can be important locally: a) Although only likely to occur in limited areas with sandy soils, wind can erode and carry
soil particles and their associated phosphorus, to field ditches, streams and rivers from which phosphorus may be transported to lakes.
b) Animal husbandry systems where cattle are given free access to streams and rivers for drinking water. Phosphorus entering the water will be increased directly through defecation, when overland flow carries phosphorus from faeces into the water, and when phosphorus enriched soil is eroded into the water at the access points used by the animals. Additionally cattle in streams can also disturb the stream sediment and this can lead to the release of stored phosphorus.
c) Phosphorus in the water discharged from smaller sewage treatment works to rivers. Some 50 years ago much of the bioavailable phosphorus added to rivers, and hence to lakes, was in the water discharged from sewage treatment works. This led to steps being taken to lessen the amounts of phosphorus discharged but these measures were only applied to the larger works so that losses from many smaller works, especially in rural areas, could still be a significant source of the phosphorus load in lakes.
d) Release of phosphorus from lake and river sediments and river banks. Any disturbance of a lake sediment e.g. by thermal convection, can result in the release of bioavailable phosphorus and any adverse effects of eutrophication will continue even in the absence of further additions of phosphorus to the water body. Fast and/or turbulent river flow can erode the banks and disturb the sediment, with both there is the risk of phosphorus being brought into solution.
It is important to distinguish between the amount of phosphorus transferred from soil to water and its bioavailability i.e. its immediate availability for use by living organisms. Only phosphorus in solution in a water body is immediately available for use by aquatic organisms. Very little water-soluble phosphorus is lost from soil in drainage water because water-soluble phosphorus is only a very, very small fraction of the total phosphorus in soil. There may be more in overland flow, but still only very small amounts, depending on the concentration of water-soluble phosphorus in recently applied manures and fertilizers. Thus because little of the total phosphorus reaching a river or lake is likely to be immediately available to organisms living there the initial effects of the total transported phosphorus may be small. However there can be changes over time. In the anaerobic conditions existing in sediments in rivers and lakes, inorganic phosphorus compounds can become water-soluble while organic phosphorus molecules can be degraded to water-soluble forms. In the longer term, phosphorus carried to water bodies attached to eroded soil particles or organic material in overland flow may become bioavailable so it is these losses and their magnitude that are important. Much experimental evidence from research on both arable and grassland soils reviewed here indicates that agronomically insignificant amounts of phosphorus are transported from soil to water by incidental phosphorus transfers and with eroded soil, yet there are adverse effects on the biological balance in some water bodies but not all. This suggests that looking at agricultural activities in isolation will never explain river phosphorus concentrations and the ecological consequences. For example, it has been observed that the greater phosphorus surplus on farms in the west of England compared to those in the east has not led to a greater phosphorus concentration in river water in the west. This may be related to differences in the amount of rainfall and the volume of water in the rivers. Equally puzzling is the apparent maintenance of the phosphorus concentration in rivers in Eastern England in summer when there is no drainage from agricultural land. Whatever the reason, such differences need to be both appreciated and explained because it suggests that it will be very difficult to find simple solutions for managing a problem that is not universal.

10
Improving the efficiency of phosphorus use in agriculture. The improving understanding of the behaviour of phosphorus in soil will enable phosphorus to be used more efficiently in agriculture and, therefore, help minimise its transport from soil to water. Early ideas about the irreversible fixation in soil of phosphorus added to soil in fertilisers and manures have been discarded, and conceptually soil phosphorus is now envisaged as existing as “pools” of differing plant availability and size. For example, there are very small amounts of phosphorus in the soil solution, from which it is taken up by plant roots, but this pool is in reversible equilibrium with phosphorus in a readily plant-available pool, from which phosphorus is transferred to the soil solution pool.
In many UK soils, plant-available phosphorus accumulates in the readily available pool, and in another less readily available pool, as a result of applying phosphorus in fertilisers and organic manures. The phosphorus in the readily available pool is that measured by routine soil analysis and, by relating the values to yield response, critical levels of plant-available phosphorus can be estimated for different crops and farming systems. When soils are at a level that is below the critical value, smaller yields than optimum are a financial loss to the farmer, and other inputs are used inefficiently, especially nitrogen whose loss from the soil also has environmental implications. Raising and maintaining soil phosphorus significantly above the critical value does not increase yield and is both a financial cost to the farmer and an inefficient use of a limited resource.
Setting levels of plant-available phosphorus in soil is the basis of the recommendations for the application of phosphorus in fertilisers and manures in the 7th edition of RB 209, “Fertiliser Recommendations for Agricultural and Horticultural Crops”, published in 2000 by the then Ministry of Agriculture, Fisheries and Food. In England, Wales and Northern Ireland, readily plant-available phosphorus in soil is estimated using the Olsen method to give Olsen P in soil. RB 209 sets a target value for Olsen P of 15-25 mg P/L (P Index 2) for the major arable crops and grass. For soils at P Index 2, the phosphorus recommendation for each crop is to replace the phosphorus removed from the field in the harvested crop (the maintenance application, M). Applying more phosphorus than that removed is recommended when the soil is below Index 2 and less when it is above. Farmers can calculate more precisely the amount of the maintenance application knowing the weight of crop removed and using data on the amount of phosphorus in each tonne of produce provided in RB 209.
Minimising the risk of phosphorus transport from soil.
Minimising the risk of phosphorus enrichment of surface water bodies with phosphorus transported from agricultural soils will require specific attention to a number of factors and recommendations.
i) Most important amongst these are preventing soil erosion and not applying manures, especially slurry, and fertilisers to water logged or very dry soil when rain is imminent. This is especially important in hilly terrain and high rainfall areas where cattle are kept in large numbers because transport of phosphorus in water flowing over the soil surface, especially of grassland, can carry particulate and water soluble phosphorus with it.
ii) Raising soil to and then maintaining it at or only marginally above the critical level of readily plant-available soil phosphorus (Olsen P) for the crop production system and soil type, in general P Index 2. This level of soil phosphorus is adequate for the majority of arable crops and grass. At this level, UK soils are not so enriched with phosphorus that there is any risk of other than very small amounts of water-soluble phosphorus being lost from soil in drainage water.

11
iii) Adjusting the application of phosphorus fertilisers to allow for the phosphorus in organic manures where these are also applied so that soils are maintained at the appropriate critical level.
iv) Keeping records of the phosphorus balance for each field and checking whether a near neutral balance is maintaining the appropriate Olsen P level by sampling and analysing soil every 4/5 years. This is a prerequisite for this approach to improving phosphorus use efficiency.
v) Not considering animal manures as a disposal problem and dumping them on sacrificial areas of land.
vi) Encouraging the animal feed industry to continue to reduce the addition of inorganic feed phosphates to livestock diets
vii) Acquiring a better understanding of the dominant factors controlling the movement of water over and through soil if the transport of phosphorus from soil to water is to be controlled on British farmlands. This understanding must be at the river catchment level because the relative importance of the different pathways by which phosphorus is transported will vary spatially and with time both within and between catchments. Phosphorus losses may only be generated from few or limited areas within a catchment. Thus there is a need to develop further the concept of: a. critical source areas - permanent features within a catchment from which
phosphorus may be lost readily, and: b. variable source areas - temporary features that are found near streams and which
lead to saturated overland flow. Developing these concepts is important because there are some major implications to be considered. Under a risk-based approach to phosphorus input management for agricultural soils, there would be no benefit from inflexible restrictions on the amount of phosphorus that can be applied, whether as fertiliser or manure, within a catchment and certainly not within a region made up of many catchments.
viii) Deceasing nutrient pollution from both agriculture and other sources is likely to require widespread and comprehensive measures to meet the objectives of the Water Framework Directive. Initiatives by Defra and the Welsh Assembly Government (WAG) on Catchment Sensitive Farming (CSF) to reduce nutrient transfers from agriculture will be important elements of the future management framework in this area, although the precise mix of measures and their implication for CSF are not yet known. However, nutrient management planning and avoidance of nutrient losses are likely to be important aspects. One such aspect must be to encourage farmers to accept responsibility for the appropriate phosphorus management of the individual fields on their farm in relation to the risk of phosphorus being transported from a field to a receiving water body. This is important if blanket restrictions on phosphorus applications are to be avoided. It would require farmers to consider the level of plant-available phosphorus in the soil (Olsen P), the use of any organic source of phosphorus available on the farm, the phosphorus balance resulting from the cropping and fertilisation practised and its effect on Olsen P, field topography and rainfall and only apply phosphorus when necessary and then in accordance with Codes of Good Agricultural Practice and using the Best Available Techniques as discussed in this publication.

12
1. INTRODUCTION. 'Upon this handful of soil our survival depends. Husband it and it will grow our food, our fuel and our shelter and surround us with beauty. Abuse it and the soil will collapse and die taking man with it.'
(from Sanskrit literature, 2000-1500 BC).
In recent years there have been many definitions of sustainability applicable to many spheres of human activity but this very old one indicates that ancient civilisations had a depth of understanding about the importance of soil that is perhaps not so widely appreciated today. Interestingly within this ancient quotation the phrase “and surround us with beauty” encapsulates the concept of a pleasant environment intrinsically linked to the husbandry of the land.
Although today we are becoming more aware of environmental issues and needs in all aspects of living, it is only in more recent times that environmental priorities have come to the fore in developed, affluent countries. But it wasn’t always so. In the UK following the Second World War, the Rt. Hon. Tom Williams, MP, the British Minister of Agriculture and Fisheries, addressed the House of Commons on Agricultural Policy on 15th November 1954. The objective he said was, “to promote a healthy and efficient agriculture capable of producing that part of the nation’s food which is required from home sources at the lowest possible price consistent with the provision of adequate remuneration and decent living conditions for farmers and workers with a reasonable return on capital invested”. A clear mandate for the development of agriculture in the post war period but there was no mention of sustainability or of environmental interests at a time when all people still recalled wartime food shortages.
In 1974 Cooke (1976) wrote, “In the second half of the 1960s public interest in possible pollution of the environment by modern methods of (agricultural) production was aroused by accounts on radio, television and in the press.” Since then it has been recognised that there is a strong relationship between agriculture and other components of the environment. But there is an important, fundamental distinction between valuing the environment extrinsically and valuing it for its contribution to the welfare not only of humans but all other animals and plants that live on this planet. Therefore, seeking sustainable practices for the managed use of land must include all physical, environmental and socio-economic aspects. No agricultural system, including its appropriate inputs and outputs, will be sustainable if it is not economically viable for both farmers and the society of which they are a part. But economic sustainability cannot be bought at the cost of environmental damage that is ecologically, socially or legally unacceptable, or physical damage that leads to irreversible soil degradation, including lack of fertility, or uncontrollable outbreaks of pests, diseases and weeds.
Amongst these wide ranging issues, this paper is concerned with phosphorus (P), essential element for all living organisms, its occurrence in surface fresh water and its irreplaceable role in food production. In Western Europe, some 79% of all the P used is as fertilisers while 11% is used as feed grade additives for animal feeding stuffs. While the use of P is essential in all agricultural systems its inappropriate use can lead to adverse impacts in the aquatic environment. This review seeks to address the challenge of today; to reconcile criteria related to water quality with those related to securing adequate supplies of wholesome, affordable food. In doing this it considers both the assessment and management of the risk of P transfer from soil to water in the light of current understanding of the behaviour of P in soil, the importance of soil P reserves in crop production, the sources of P available for crop production, pathways for the movement of P from soil to water and possible strategies and best appropriate techniques for minimising transfers.

13
2. RISK ASSESSMENT AND MANAGEMENT. Before considering the P issue in some detail it is important to understand the processes of risk assessment and management.
2.1. Risk assessment. Risk assessment is a scientific/statistical process that can involve many steps. A risk assessment estimates the probability of an adverse effect occurring under a certain set of circumstances. Risk assessment of a chemical compound in the environment quantifies its hazardous properties, exposure and dose, and its effects with special emphasis on critical receptors and significant endpoints. Risk assessment can be multi-chemical, multi-media and multi-pathway taking into consideration the additive contribution from all possible sources. Applied to P in the soil-crop-animal environment, then P is not hazardous but it does exist in many inorganic and organic forms and it can be transferred from soil to water by a number of pathways, in a number of forms and from a number of sources. In the aquatic environment changes in the balance of species (biological balance) can occur with very small changes in the concentration of P in solution. Reconciling the large flux of P cycling in agricultural soils with the relatively very small concentrations that pose a risk to water quality in the aquatic environment will never be easy and may not always be possible.
2.2. Risk management. Risk management for P involves considering and ranking those options for interventions to minimise the movement of P from soil to water. However, introducing agricultural practices that might decrease the possibility or magnitude of this transfer of P must be balanced against associated direct and indirect costs, not least the financial viability of individual farm enterprises and the rural economy they help support. Thus potential options must be prioritised and their associated costs determined. Then initially it should be possible to introduce those options that are likely to have the widest applicability, be easy to implement and have least cost both to the farming community and public funds.
3. PHOSPHORUS, ESSENTIAL NUTRIENT FOR PLANTS AND ANIMALS.
Phosphorus is an essential, irreplaceable element in the nutrition of both aquatic and terrestrial species of plants and animals. However, for plants and animals to flourish in the aquatic environment the water does not have to be enriched with nutrients to the same extent as for soil-based agricultural production. This is partly because the nutrients in the aqueous phase are readily plant-available and the total living biomass in the aquatic environment may be less than that on land used for agriculture. The role of P in plant and animal nutrition is discussed in Annex Section 1.
4. PHOSPHORUS IN AGRICULTURE. Field experimental evidence for the essential role of P in crop production came first from the experiments started by Lawes and Gilbert at Rothamsted in the 1840s and 1850s (Johnston, 1994). At that time and almost without exception, soils contained too little plant-available P to produce adequate yields for financially viable agriculture. Lawes patent in 1842 for making superphosphate and his starting commercial production of it in London in 1843 paved the way for farmers to supplement the soil’s native supply of plant-available P and any additions of P in the limited amounts of farmyard manure (FYM) that were available.
14
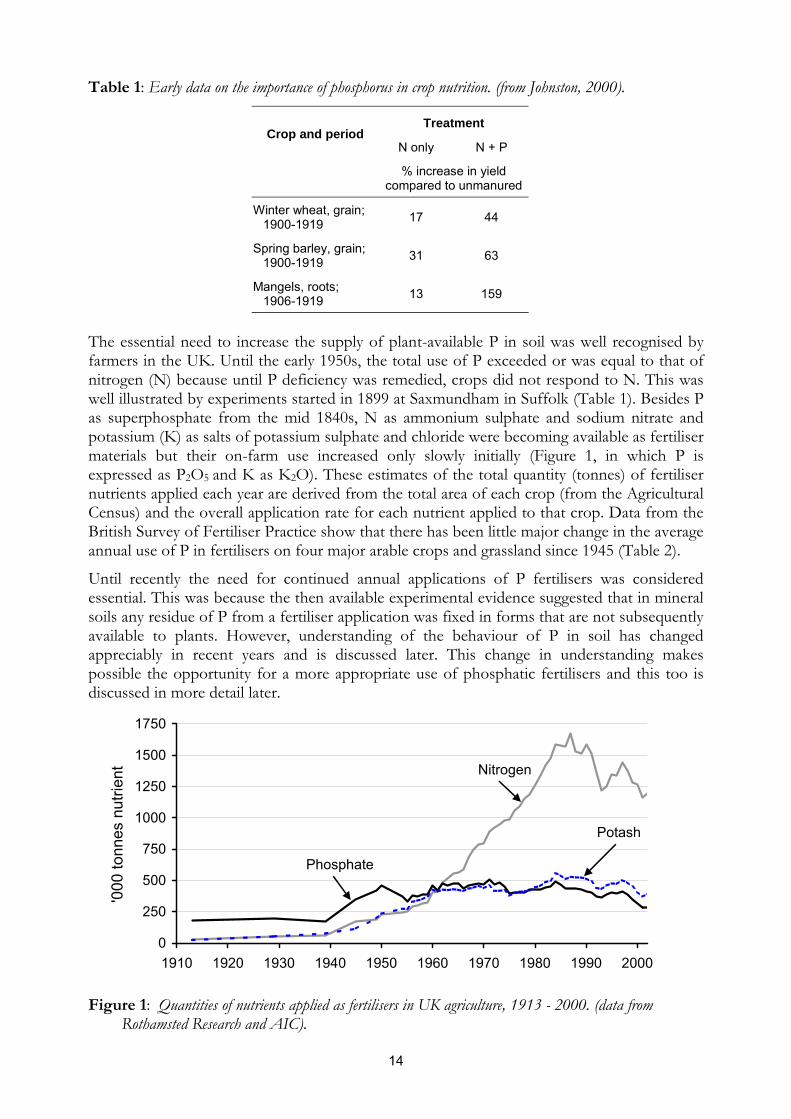
Table 1: Early data on the importance of phosphorus in crop nutrition. (from Johnston, 2000).
The essential need to increase the supply of plant-available P in soil was well recognised by farmers in the UK. Until the early 1950s, the total use of P exceeded or was equal to that of nitrogen (N) because until P deficiency was remedied, crops did not respond to N. This was well illustrated by experiments started in 1899 at Saxmundham in Suffolk (Table 1). Besides P as superphosphate from the mid 1840s, N as ammonium sulphate and sodium nitrate and potassium (K) as salts of potassium sulphate and chloride were becoming available as fertiliser materials but their on-farm use increased only slowly initially (Figure 1, in which P is expressed as P2O5 and K as K2O). These estimates of the total quantity (tonnes) of fertiliser nutrients applied each year are derived from the total area of each crop (from the Agricultural Census) and the overall application rate for each nutrient applied to that crop. Data from the British Survey of Fertiliser Practice show that there has been little major change in the average annual use of P in fertilisers on four major arable crops and grassland since 1945 (Table 2).
Until recently the need for continued annual applications of P fertilisers was considered essential. This was because the then available experimental evidence suggested that in mineral soils any residue of P from a fertiliser application was fixed in forms that are not subsequently available to plants. However, understanding of the behaviour of P in soil has changed appreciably in recent years and is discussed later. This change in understanding makes possible the opportunity for a more appropriate use of phosphatic fertilisers and this too is discussed in more detail later.
Figure 1: Quantities of nutrients applied as fertilisers in UK agriculture, 1913 - 2000. (data from Rothamsted Research and AIC).
Treatment Crop and period
N only N + P
% increase in yield compared to unmanured
Winter wheat, grain; 1900-1919 17 44
Spring barley, grain; 1900-1919 31 63
Mangels, roots; 1906-1919 13 159
0
250
500
750
1000
1250
1500
1750
1910 1920 1930 1940 1950 1960 1970 1980 1990 2000
'000
tonn
es n
utrie
nt . Nitrogen
Phosphate
Potash

15
Table 2: Overall phosphatic fertiliser use (kg P2O5/ha) on selected major crops and grassland, in England and Wales 1945-2002. (sources: MAFF Statistics; Goodlass and Allin, 2004).
The well documented need to apply phosphatic fertiliser led to a positive P balance (P applied minus P removed in the harvested crop) in many soils and the accumulation of plant-available P reserves in these soils. However in recent years there has been a major change. The overall use of P fertilisers has been steady or declining during the last 40 years in the UK (Figure 1) and its use on some of the more important crops grown here has not increased (Table 2). In fact, current evidence for the “The National Farm” in England and Wales shows that the P balance has been negative for the last 10 years for cereals, oilseed rape, potatoes and sugar beet crops grown without addition of animal manures (Figure 2, overleaf). As only 16% of all tillage crops are given an application of organic manure the emerging picture is applicable to the large area, more than 80%, of the land growing these arable crops. There was a significant positive P balance for some 20 years from 1973 to the mid 1990s, and P residues accumulated in soil and built up soil fertility. But during the last 10 years, the annual negative P balance has used up about half of these estimated P residues and all the accumulated residues will have gone by 2010 if the rate of use continues as in the last two or three years. In the light of these data there must be some concern that the P fertility of these soils is at risk, not only because soils containing insufficient P produce less but also other inputs, notably N fertilisers, are used less efficiently.
Similar “national” data do not exist for changes in the P balance in grassland systems because there is not sufficient information on P offtakes in conserved grass and inputs in organic manures in animal husbandry systems. Yet it is in the area of livestock manure management
Year Winter wheat
Spring barley
Maincrop potatoes
Sugar beet
Temp. grass*
Perm. grass*
1945 30 36 92 88 11 11
1952 28 30 124 115 35 24
1957 30 34 126 119 34 20
1962 36 36 141 118 43 28
1966 44 40 173 115 50 29
1970 41 40 181 117 44 28
1974 45 39 184 92 36 21
1978 44 38 193 76 34 23
1982 51 38 199 67 24
1986 56 37 203 61 22
1990 49 35 206 61 24
1994 50 32 196 57 23
1998 47 29 185 49 20
2002 41 27 128 43 18
* Temp. grass = Temporary grass < 5 yrs old. Perm. grass = Permanent grass. All grass from 1982.

16
where such data would be invaluable. However positive P balances are probable, given the increase in animal production and the increased use of animal feedstuffs imported onto the farm. With livestock manures the situation is as much about how they are used as about the amounts that are produced. Existing evidence suggests that, regrettably, many farmers make little allowance for the P in the organic manures they have available to them when deciding how much P fertiliser to apply. Current regulations that restrict, by the quantity of N that will be applied, the amount of manure that can be spread, invariably lead to an application of P that exceeds the amount required to achieve maximum yield.
Figure 2: Cumulative phosphate balance of non-manured arable soils in England & Wales, 1974-2004. 5. PHOSPHORUS IN THE AQUATIC ENVIRONMENT. Although P is essential to sustain all life in the aquatic environment, increasing concentrations can cause problems of eutrophication. Strictly, the term eutrophication is the enrichment of a surface water body with nutrients causing accelerated algal or plant growth that leads to undesirable changes in water quality and disturbance of the ecology within the water body. Frequently however, the word eutrophication is used simply to describe the effects caused by such nutrient enrichment. As early as the 1940s, there was an awareness that the nutrient load in some fresh water lakes in North America, Scandinavia and Western Europe was increasing and that this was leading to undesirable changes in the ecology (the biological balance) in these lakes. Increases in the P concentration were identified as the main cause of these changes. For a more detailed discussion on the effects of eutrophication see Annex A 2.
As early as 1974, Lund (1974) cautioned when he wrote: “The eutrophication problem is not the same everywhere. It is doubtful whether the best remedy for one lake or lake region is the best for all. Phosphate enrichment may produce unwanted changes in one lake but will not do so in other lakes. …… It seems reasonable that each lake or lake area should be considered separately, bearing in mind the general, though still imperfect, knowledge of eutrophication. Then it can be decided whether remedial measures are necessary, what they might be, whether they are acceptable on economic or other grounds and whether legislation is necessary to implement them.”
Responding to the increasing concerns about water quality in some rivers and lakes in the UK, the Agricultural Development and Advisory Service (ADAS) and the Agricultural
0
50
100
150
200
1974
197
5
1976
1977
197
8
197
9
1980
198
1
198
2
1983
198
4
198
5
1986
198
7
198
8
1989
199
0
199
1
1992
199
3
199
4
1995
199
6
199
7
1998
1999
200
0
2001
2002
200
3
2004
Surp
lus
ove
r 197
3, k
g P
2O5/
ha
Sources: Defra Statistics and British Survey of Fertiliser Practice
Cumulative balance between inputs from mineralfertilisers and harvested offtakes, for cereals,OSR, potatoes and sugar beet.

17
Research Council (ARC) jointly arranged a conference on “Agriculture and Water Quality” in 1974 (MAFF, 1976). Recognising that a multidisciplinary approach was essential, the invitees were from wide ranging agricultural and water quality interests. Nitrogen and P were selected for discussion because of their importance to agricultural productivity on the one hand and to water quality on the other. The outcome of the conference was that P was identified as the nutrient of most concern in freshwater eutrophication although N could play a role in some situations.
At the conference detailed studies were presented on specific lakes in Scotland, Northern Ireland and England and these mostly implicated the effluent from STWs as the source of water soluble and hence bioavailable P. This agreed with much earlier work by Jenkins and Lockett (1943) who estimated that at that time as much as 40-60% of the total P in crude sewage entering STWs was discharged in the effluent to rivers.
Although steps were taken to limit P discharges to rivers from larger STWs and there was improvement in some lakes, water quality was not improved in others. As a result the risks and impacts of eutrophication in fresh waters have been highlighted as a major water quality issue/challenge by UK and more widely by EU regulatory authorities (see Bibliography). These risks are based on assessments by bodies such as the Royal Commission on Environmental Pollution, the Environment Agency (EA) and Natural England (formally English Nature). In consequence, a large amount of research has been carried out into river and lake eutrophication including the contribution from sewage effluents and the transfer of P from agriculturally managed soils.
Recent studies on the transport of P from agricultural soils to rivers and lakes have concentrated on identifying the different sources of P and the pathways by which it may be transported to water. Such studies are important because it is unlikely that there will be one best remedy that is applicable everywhere to control the P concentration in river and lake water.
As the amount of P lost from non-agricultural point sources has decreased, e.g. as discharges from larger sewage treatment works have declined, the proportion of the total P load in rivers and lakes attributable to agriculture has increased. This does not necessarily imply that the amount of P lost from agricultural soils has increased but it has become a significant issue. Even if there has been no increase, the source of the P that is transported to water needs to be identified, reasons for its loss sought and measures taken to minimise the quantities involved. Initially discussions about the P load in waters discussed the inputs from agricultural soils as diffuse sources as distinct from point sources like sewage treatment works. However, observation and monitoring P transport from soils suggest that most of the P comes from individual fields or actions like manure spreading. In consequence, these are best considered as point sources that require specific attention if the movement of P from them is to be decreased. Additionally the P load in surface water can come from at least two other significant sources. One is the internal recycling of P from river and lake sediments; this would be both difficult to control and it would continue to adversely affect water quality even in the absence of any further P inputs. The other is the discharge of P to rivers from smaller sewage treatment works not subject to control.

18
6. THE BEHAVIOUR OF PHOSPHORUS IN SOIL. To address criteria for the efficient use of P in agriculture, and hence the opportunity to minimise the risk of loss of P to water, it is essential to understand the behaviour of P in soil. This is discussed in detail in Annex Section 3, but it can be conceptualised and expressed diagrammatically as in Figure 3.
Phosphorus is considered to be in the four different pools shown in Figure 3 simply on the basis of its availability to the plant. In the soil solution, P is immediately available for uptake by plant roots. Then there is a pool of readily available P held on sites from which it is easily transferred to the soil solution as the P concentration there is lowered by root uptake. The P in the third pool is less readily available and is the P that is more strongly bonded to soil constituents. The P in the fourth pool is only very slowly available (often only over periods of many years) and is P that is very strongly bonded to soil constituents, has been precipitated as compounds insoluble in water, or is part of the soil mineral complex. Soil analysis measures the P in the readily available pool together with that in the soil solution. In England and Wales the method of analysis used is the Olsen method (MAFF 2000) and throughout this paper this will be called Olsen P. According to the analytical value a soil is classified according to an Index system that goes from Index 0 to Index 9 for P. Most agricultural soils will be in Index 0 to 4 but most evidence suggests that the P status should not be higher than Index 2.
The most important feature illustrated in Figure 3 is the reversible transfer of P between the first three pools. Thus when water soluble P is added to soil it goes into the soil solution and then distributes itself between the readily and less readily available pools. Then as P is removed from the soil solution by root uptake it is replaced by P from the readily available pool and this, in turn, is replenished from the less readily available pool. Much data from long-term experiments support this conceptual model of the transfer of P between the different pools of P within the soil (see for example, Table 5 in Johnston, 2000 and Figure 4 and Table 13 in Johnston, 2001). Additional evidence comes from the experience of farmers and their advisors. They often report that quite large amounts of P can be removed in harvested crops with little change in Olsen P, and equally that large additions of P do not have the anticipated effect in increasing Olsen P. Data from the long term experiments at Rothamsted, Woburn and Saxmundham show that of the increase in total soil P, i.e. all pools of soil P, only about 13% is seen as an increase in Olsen P, the measure of plant-available soil P used in England and Wales.
Figure 3: A simple schematic representation of the phosphorus cycle in the plant-soil system. Soil analysis to estimate the readily available pool includes the small amount of P in the soil solution.
Water-soluble nutrients in
manures and fertilisers
Removed in harvested produce
Crop uptake
Soil solution
Loss in drainage
Readily available pool
Less readily available pool
Very slowly available pool
19
6.1. Effect of soil organic matter on phosphorus availability. There is much interest in the effects of soil organic matter (SOM, humus) in relation to soil fertility and the longer-term sustainability of cropping systems. Humus plays an important role in the availability of P to plants, which is not related to the mineralisation of organic P molecules. Soil organic matter improves soil structure and hence roots explore the soil more effectively in their search for nutrients. It also provides sites with low bonding energies for P including P applied in fertilisers. Data from many experiments suggest that SOM developed in situ from organic additions like FYM, has these low energy bonding sites. Analytically the P held on these sites is estimated as part of the readily plant-available soil P pool but it is probably more readily released into the soil solution than is most of the P determined as Olsen P. Added inert organic matter, like digested sewage sludge, appears to have far fewer such low energy bonding sites for P. For further discussion of both aspects of the effects of SOM on soil P availability see Annex Section 3.
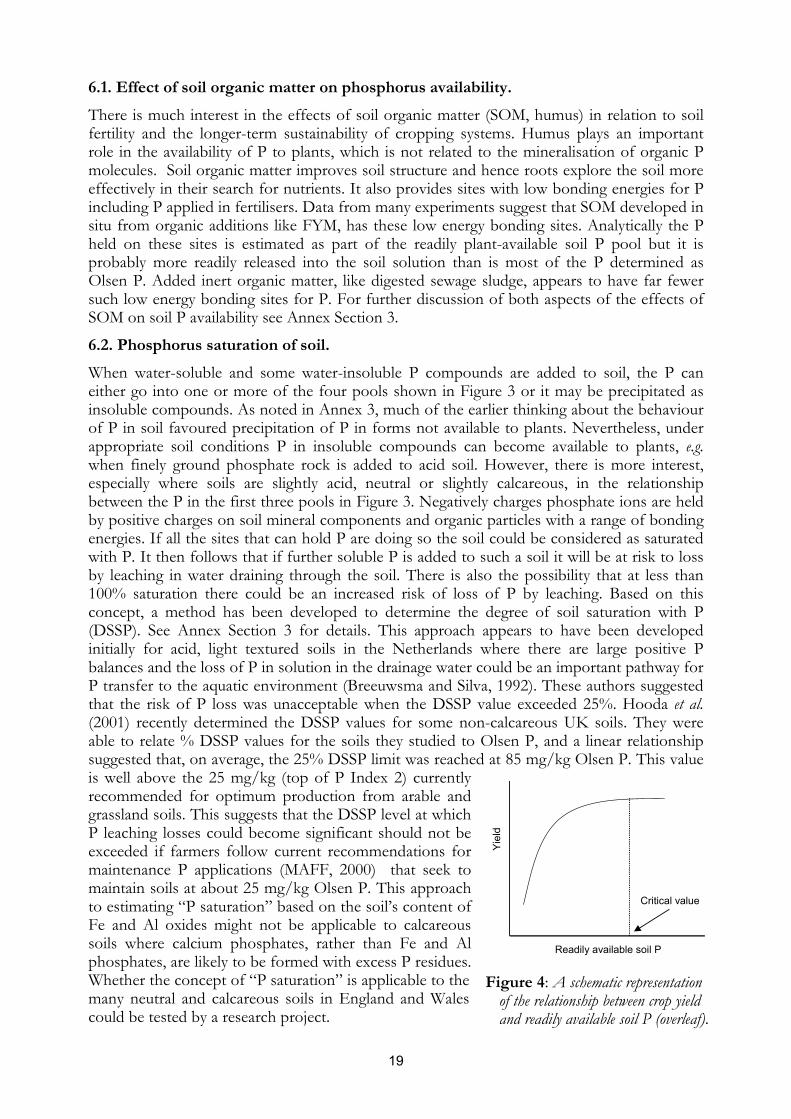
6.2. Phosphorus saturation of soil. When water-soluble and some water-insoluble P compounds are added to soil, the P can either go into one or more of the four pools shown in Figure 3 or it may be precipitated as insoluble compounds. As noted in Annex 3, much of the earlier thinking about the behaviour of P in soil favoured precipitation of P in forms not available to plants. Nevertheless, under appropriate soil conditions P in insoluble compounds can become available to plants, e.g. when finely ground phosphate rock is added to acid soil. However, there is more interest, especially where soils are slightly acid, neutral or slightly calcareous, in the relationship between the P in the first three pools in Figure 3. Negatively charges phosphate ions are held by positive charges on soil mineral components and organic particles with a range of bonding energies. If all the sites that can hold P are doing so the soil could be considered as saturated with P. It then follows that if further soluble P is added to such a soil it will be at risk to loss by leaching in water draining through the soil. There is also the possibility that at less than 100% saturation there could be an increased risk of loss of P by leaching. Based on this concept, a method has been developed to determine the degree of soil saturation with P (DSSP). See Annex Section 3 for details. This approach appears to have been developed initially for acid, light textured soils in the Netherlands where there are large positive P balances and the loss of P in solution in the drainage water could be an important pathway for P transfer to the aquatic environment (Breeuwsma and Silva, 1992). These authors suggested that the risk of P loss was unacceptable when the DSSP value exceeded 25%. Hooda et al. (2001) recently determined the DSSP values for some non-calcareous UK soils. They were able to relate % DSSP values for the soils they studied to Olsen P, and a linear relationship suggested that, on average, the 25% DSSP limit was reached at 85 mg/kg Olsen P. This value is well above the 25 mg/kg (top of P Index 2) currently recommended for optimum production from arable and grassland soils. This suggests that the DSSP level at which P leaching losses could become significant should not be exceeded if farmers follow current recommendations for maintenance P applications (MAFF, 2000) that seek to maintain soils at about 25 mg/kg Olsen P. This approach to estimating “P saturation” based on the soil’s content of Fe and Al oxides might not be applicable to calcareous soils where calcium phosphates, rather than Fe and Al phosphates, are likely to be formed with excess P residues. Whether the concept of “P saturation” is applicable to the many neutral and calcareous soils in England and Wales could be tested by a research project.
Critical value
Readily available soil P
Yiel
d
Figure 4: A schematic representation of the relationship between crop yield and readily available soil P (overleaf).

20
7. CRITICAL LEVELS OF SOIL PHOSPHORUS FOR AGRICULTURE. It is now generally accepted that for slightly acid, neutral and slightly calcareous soils, plant-available P reserves will accumulate in the readily- and less readily-available pools of soil P (Figure 3). These reserves of P benefit crops ensuring that there is no loss of yield due to a lack of plant-available P throughout the soil profile explored by actively growing plant roots. Such reserves accumulate from the addition of both soluble phosphatic fertilisers and organic manures. As noted in Annex Section 3, it is P in the readily available pool that is determined by soil analysis to estimate the P supplying capacity of a soil. If all other factors controlling crop growth are optimum then the relationship between yield and readily soluble P has an exponential, Mitscherlich form (Figure 4). The concentration of readily soluble P at which the yield levels out, i.e. reaches the asymptote, can be considered the critical level. Below this level yield decreases rapidly, a financial loss to the farmer, and there is also a decrease in the efficiency with which other inputs, e.g. N, are used. Above the critical value there is no justification to further increase readily available P; doing so can be can be an unnecessary financial cost to the farmer, and may increase the potential for larger transfers of P to water.
Experimental data confirm this exponential type response to plant-available P (Figure 5).
0
1
2
3
4
5
6
7
8
0 10 20 30 40 50Olsen P - mg/kg
Bar
ley
grai
n - t
/ha
1988
1987
1989
B
0
1
2
3
4
5
6
7
8
9
0 10 20 30 40 50Olsen P - mg/kg
Sug
ar -
t/ha
1969, 1971
1970, 1974
1972
A
6
7
8
9
10
11
0 10 20 30 40 50Olsen P - mg/kg
Whe
at g
rain
- t/h
a
160 kg N/ha
80 kg N/ha
C
0
2
4
6
8
10
12
0 10 20 30 40 50 60 70 80 90Olsen P - mg/kg
Gra
ss y
ield
- t D
M/h
a
1965-1967 Mean (a)
1965-1967 Mean (b)
1968-1969 Mean
D
Figure 5: Relationship between Olsen P and the yield of three arable crops and of grass. (Johnston, 2001; Johnston et al., 2001a).
21
The examples in Figure 5 show that the critical level did not change even when the yields changed appreciably due to differences in weather between growing seasons (Figure 5a, 5b) or N supply (Figure 5c). A very similar yield/Olsen P relationship is found for grassland (Figure 5d). However, differences in yield mean differences in the offtake of P in the harvested crops and to maintain the soil at the critical level, the amount of P to be returned will differ between years.
On soils adequately supplied with P, the yields of some arable crops, e.g. cereals, are not increased by applying further amounts of P either in fertiliser or manures, while others, like potatoes, may show a small increase in yield. For grassland it is often considered that applying soluble P in spring even on P Index 2 soils encourages early growth. While experiments often tend to show consistent effects year on year, the increases in yield are rarely statistically significant and the extra grass yield may not justify the increased risk of P loss from well-enriched soils (P Index 3 and above). It would, however, be justified to apply a maintenance dressing of P in spring once the water content of the soils was below field capacity and further rainfall would not lead to overland flow or to losses of P in drainage.
Currently it is accepted that when the soil is at or about the critical P level for the soil and farming system then the amount of P to be applied should equal the offtake. When soils are below the critical level it is justified to apply more P than taken off in the harvested crops to increase the soil P to nearer the critical level. When soils are much above the critical level, farmers should be advised and encouraged to decrease P inputs until soil P falls to nearer the critical level. The policy of replacement applications can be considered as maintenance dressings as indicated in RB 209 (MAFF, 2000). Defining critical soil P levels should ensure that soils are not over-enriched with P. To check that the maintenance dressings are in fact maintaining the required Olsen P value, the soil can be sampled and analysed every 4/5 years.
7.1. Effect of soil phosphorus status on other inputs required for crop production. With current concerns about the financial viability of their farm enterprise, many farmers are seeking ways to decrease costs. One approach is to decrease or even stop applying P and K fertilisers. While this is totally justified for soils at P Index 3 and above, caution needs to be exercised that Olsen P values do not fall to below the critical value. Below this value yields are less than optimum and so when the same amount of N is applied, the smaller yield on the soil with less than adequate P will leave a larger residue of unused nitrate in soil at harvest. Buying and applying N fertiliser not used by the crop represents an unnecessary financial cost to the farmer and an environmental risk because the nitrate left in the soil in autumn will be lost by leaching or denitrification. Examples of the interrelationship between Olsen P in soil and N use efficiency are in Annex Section 4.
7.2. Relationship between P demand by crops and water-soluble P lost in drainage water.
The evidence presented elsewhere in this review very definitely indicates that the assumption that it is the P that is leached from soil in drainage water that is the principal source of the P that creates problems in surface water bodies is not correct. Losses of P as phosphate in solution in drainage water are very, very small and contribute little to the total quantity of P transported from soil to water. If such losses were significant they would have to be considered relative to the concentration of P in the soil solution that is required to achieve acceptable yields of crops. It is only when rainfall exceeds evapotranspiration that drainage occurs and certainly in Eastern England this is only during the winter. Drainage is usually expressed as mm per year and this can be converted to a volume per hectare, and the amount of P needed to reach a
22
given concentration in this volume can be calculated. Table 3 shows the relationship between mm drainage and the amount of water-soluble P required to give concentrations of 35 and 100 μg P/L, the lower limiting values for water to be classed as eutrophic and hypereutrophic, respectively. In areas with predominately arable cropping and only 100 mm drainage, only 0.035 kg P is required to raise the P concentration in the equivalent volume of water to 35 μg P/L, the lower limiting value for eutrophication, while even with 250 mm drainage only 0.087 kg P will give the same P concentration. These quantities are agronomically insignificant and can be related to the concentration of P in the soil solution required to grow acceptable yields of arable crops and grass.
The P concentration in the soil solution of a reasonably fertile soil can range from 150 to 1500 µg P/L (Rowell, 1994), much larger than the 35 µg P/L, the lower limiting value for eutrophication. However, even the larger concentration of P is not always sufficient for crop growth. Assuming that per hectare the top 25 cm of soil contains 750,000 litres of soil solution, then the larger concentration of P in that volume of solution is equal to 1.25 kg P in this 2500 t soil/ha, an average weight for the top 25 cm of soil. But not all of this P is available to a crop in the early stages of growth when P demand is greatest but the root system is still growing. At this stage nutrients are taken up from only a small proportion of the soil volume, at most perhaps 10%, because throughout the growing season roots only explore about 25% of the soil volume. Thus only about 0.1 kg P/ha may be available to the very limited root system in the early stages of growth. During their active growth period many plants maintain between 0.3 and 0.5% P in dry matter (Marschner, 1995). To achieve this they must take up from the soil solution between 0.5 and 1.0 kg P/ha each day. With only about 0.1 kg P/ha immediately available in a reasonably fertile soil, this rate of uptake will not be achieved unless the P in the soil solution is replenished rapidly during each day from that in the readily available pool (see Figure 3).
The importance of the readily available soil P, i.e. P not in the soil solution, being able to sustain the maximum daily demand for P by a growing crop is illustrated by data from an experiment on spring barley at Rothamsted (Leigh and Johnston, 1986). On a soil adequately supplied with P, maximum daily P uptake was 0.6 kg P /ha and grain yield was 6.4 t/ha, but on a soil with too little P, maximum daily P uptake was very much less, only 0.2 kg/ha, and grain yield was much less also, only 2.9 t/ha.
The quantity of plant-available soil P, the flux of P which must be available to grow an acceptable yield of an arable or a grass crop, is very large relative to the quantity of P required to get the concentration of P in water that could cause problems. For example, the national average yield of winter wheat grain is about 8t/ha and at harvest the grain plus straw will contain 30 kg P/ha. In areas with through drainage of 100 mm, typical of parts of Eastern England, as little as 0.035 kg P/ha is required to give 35 µg P/L the lower limiting value for eutrophication (Table 3). Thus a loss of less than 0.15% of the P that must be plant-available in soil to grow an acceptable wheat crop could create a problem in a water body.
Similarly with grass, a well managed all-grass sward grown for conservation as silage yielded a total of 14 t/ha dry matter each year and contained 60 kg P/ha, while a grass-clover sward grown without N fertiliser, yielded somewhat less, 11 t/ha dry matter annually and contained 46 kg P/ ha (McEwen et. al., 1989). For both swards this amount of P must be available in the soil. Assuming that such swards are grown in wetter areas than those for the wheat in the previous paragraph, drainage might be 500 mm per year. The addition of only 0.18 kg P to the equivalent volume of drainage will give a concentration of 35 µg P/L, the lower limiting value for eutrophication (Table 3). This amount of P is only 0.3 and 0.4% of the P flux in the all-grass and grass-clover swards, respectively.

23
In natural grassland and assuming an input of about 40 kg N/ha, typical of atmospheric deposition, a standing crop of herbage may amount to 1.6 t/ha dry matter containing 2.2 kg P/ha. In an area with 1000 mm drainage, 0.35 kg P/ha will increase the P concentration in the equivalent volume of water to 35 µg P/L. This quantity of P is about 16% of that in the herbage and could easily be lost mainly in overland flow as the standing herbage decomposes during the winter months.
In both arable cropping and grassland any losses of water-soluble P from the soil matrix are quantitatively very small. However, perhaps more significantly they are extremely small relative to the active annual P flux involved in growing the crop, and also on uncropped land. Any management changes designed to reduce such almost ubiquitous loss would probably have no measurable effect on P loss, but would have a major impact on UK agriculture.
Table 3: The amounts of water-soluble phosphorus needed to raise the phosphorus concentration in different volumes of drainage water.
mm drainage/ha/year
100 250 500 1000 Concentration of P in water kg P/ha/year
35 μg P/L1 0.035 0.087 0.175 0.350
100 μg P/L2 0.10 0.25 0.50 1.00 1 35 μg P/L is the lower limiting value for eutrophication. 2 100 μg P/L is the lower limiting value for hypereutrophication.
8. PHOSPHORUS USE EFFICIENCY. A topic that has had a major bearing on perceptions of P use, and perhaps indirectly on ideas about the loss of P from soil, is the efficiency with which P in fertilisers and manures is used in crop production. Phosphorus use efficiency can be measured in a number of ways of which the following are three (i) using the radioisotope 32P, (ii) the difference method, often expressed as the % recovery of added P, and (iii) the balance method. (See Annex Section 5 for details). Table 4: Increase in the yield of winter wheat grown continuously on Broadbalk, the amount of phosphorus
removed in the grain and straw and the percentage recovery/efficiency of P use by the difference and balance methods. (Personal communication, Poulton and Johnston, 2004).
Grain yield* P offtake Percent P recovery Period
- P + P - P + P
t/ha kg P/ha Difference
method Balance method
1852-1871 1.73 2.51 6.5 11.3 14% 34%
1966-1967 2.30 2.79 4.8 12.8 24% 39%
1970-1975** 3.07 4.48 9.0 18.1 26% 52%
1985-2000 2.46 5.32 5.0 17.4 35% 50%
* winter wheat given 96 kg N/ha and 35 kg P/ha. ** yields since the 1970s were restricted due to lack of N.

24
Estimates of P use efficiency measured by both the difference and balance methods have increased in recent years. Table 4 shows how the % recovery of fertiliser P added to winter wheat grown continuously has changed with time on the Broadbalk experiment at Rothamsted. As yield has increased, especially since the 1980s, P efficiency estimated by both methods has increased. It should be noted that as soil K reserves have declined, applying K in addition to P in the period 1985-2000 has increased yields and thus recovery of added P.
The data in Table 4 are for wheat grown continuously and given 96 kg N/ha each year because these treatments have been consistent throughout the whole period of the experiment. However, this amount of N is too small for current high-yielding cultivars and more N is now tested in the Broadbalk experiment. Also since 1968 wheat grown continuously has been compared with that grown in rotation where wheat follows two crops not susceptible to take all, (break crops), which minimises the effect of this soil borne pathogen on root growth and thus water and nutrient uptake. Since 1985, the amounts of N tested have been increased and the maximum amount is now 288 kg/ha. The extra N has increased yields, especially those of wheat grown in rotation, and thus the percent recovery of applied P has increased in the period 1985-2000:, as shown in the Table:
The smaller percent recovery of applied P by the difference method where wheat is grown in rotation compared to that for wheat grown continuously, can be explained by the method of calculation (see Annex Section 5). On the control plot without P, the grain and straw yield, and hence P offtake, of wheat grown in rotation is larger than for wheat grown continuously and proportionally larger than where P was applied. Hence by the difference method, percent recovery of the applied P is less than for wheat grown continuously. This probably reflects better root growth, and hence acquisition of P, where the damaging effects of take all are minimised, especially on soils with too little plant-available P.
Irrespective of the amount of P taken up from an application of fertiliser or manure (as determined by the difference method), the rest of the P in the crop must have come from soil P reserves and this P must be replaced if the reserves are not to be depleted and jeopardise this important aspect of maintaining soil fertility. To maintain the critical level of plant-available soil P it is better to estimate the P balance and for soils at the critical level of soil P ensure that the P balance is zero or only slightly positive. It is absolutely inappropriate to base discussions of the possible risk of a loss of P from applying fertiliser on the small % recovery often found for applications of P fertiliser.
9. PHOSPHORUS INPUTS TO AGRICULTURE IN FERTILISERS AND MANURES.
The essential need for P and the general observation that many soils contained too little plant-available P led, in the 1940s and 1950s, to a primary focus on building up soil P reserves to ensure both sustainable and economically viable farming systems, whether based on arable cropping or animal production on grassland. For many arable crops the increasing yield potential of newly introduced cultivars, and the ability to protect that potential yield from the adverse effects of weeds, pests and diseases, ensured larger yields, and an intensification of production was needed to ensure the profitability of many grass-based systems. Both required an improvement in soil fertility.
Wheat grown % P recovery by the:
continuously in rotation
difference method 51 41
balance method 65 79

25
Thus there was every justification for the increased use of inorganic fertilisers to supplement soil nutrient supplies and the benefits, not only those from fertilisers, have been considerable. For example, in the UK the average annual yield of winter wheat increased from about 2.5 t grain/ha in the 1940s to exceed 7.5 t/ha annually from 1995. Now, while there is a continuing need to apply fertilisers to support production, they must be used judiciously, recognising that for P, readily plant-available reserves can accumulate in soil and that applications of P, whether in fertilisers or manures, are only needed to first achieve and then to maintain the critical level of plant-available P. In all arable cropping systems there is little opportunity for recycling P unless organic manures are purchased. In animal husbandry systems there is the opportunity for recycling P but also the risk of large applications of manure increasing soil P levels much above the critical level.
In recent years the financial viability of many farm enterprises has been severely threatened. In consequence, farmers have been forced to reconsider production costs, including fertilisers and cropping patterns. Chalmers et al. (1999) discussed the cause of some of these changes and noted that the EU Common Agriculture Policy review and economic/market factors have led to major changes in cropping. These changes have caused previous patterns of fertiliser use to be reconsidered and, in consequence, there has been an overall decrease in fertiliser use as seen in Figure 1. In this respect it is important to recognise that the amount of fertiliser used on each crop can be expressed in two ways; the amount applied per hectare to a crop and the total use on that crop. The total fertiliser used on each crop is derived from the area grown and the average amount of fertiliser applied to it. Summing the amount of fertiliser applied to the individual crops gives the overall quantity of fertiliser used on all crops Thus the combined effects of annual changes in the area and nutrient application rate to individual crops determine the trends in fertiliser use on tillage crops (i.e. all crops except grass, forestry and glasshouse crops). Similarly, the relative areas of intensively managed grass (<5 years old) and older grassland will, together with farm type (dairying or beef production), affect the level of fertiliser use on all grassland (i.e. all forms of grass that may be grazed, conserved or grown for seed, but excluding rough grazing).
Figure 6 (overleaf) shows changes in the total tillage crop and total grassland areas in Britain since 1983. The effect of set-aside on the area of tillage crops in the early 1990s and the gradual decline in the area of intensively managed grass are both evident. It is such major changes in cropping that are the primary drivers that affect the use of all fertilisers. In 2003, the total agricultural area in Britain was some 18.388 Mha of which arable land and grass <5 years old was some 5.835 Mha; all grass over 5 years was about 5.422 Mha; rough grazing with sole grazing rights was approximately 4.484 Mha; set-aside about 0.611 Mha and all other land about 0.802 Mha; common rough grazing accounts for 1.234 Mha (TSO, 2003).
Table 2 shows fertiliser P inputs to four major arable crops and grassland but in the case of animal husbandry systems there can be large additional inputs of mineral P in purchased concentrated feedstuffs and bedding. Prior to the Second World War, Crowther (1945) estimated that Britain imported three times as much N, about the same amount of K and about two thirds as much P in feedstuffs as was used in fertilisers. He did, however, query how much of the N, P and K reached the land in animal manure. While the return in manure might not be very efficient for N and K, much of the P could have been applied to land but it could have been very unevenly distributed.

26
Figure 6: Total crop areas for (upper) all tillage crops, all grass and grass <5yrs old and (lower) major cereal crops, oilseed rape, potatoes and sugar beet, UK 1985-2004. (Goodlass and Welch, 2005).
Recently, Watson and Foy (2001) calculated that for intensive pasture systems in Northern Ireland, which may not be typical of the rest of the UK, P imports in animal feedstuffs now amount to some 8,500 t annually compared to 10,000 t P as fertilisers. In another recent study, Haygarth et al. (1998a) compared P budgets for two hypothetical animal husbandry scenarios based on 1993 data. One was for an intensive dairy farm in south west England, the other a hill farm with sheep managed extensively in Scotland. Dairy farms in England and Wales then occupied approximately 1.6 Mha (Burnhill et. al., 1993) out of about 4.2 Mha of total grassland.
The P budget for an intensive dairy farm was calculated for a typical 57 ha farm and was based on data derived from that for 316 herds that participated in the ADAS “Milk Cheque” consultancy scheme (Kelly, 1995). Annual inputs of P per farm as fertiliser were 0.91 t but those as concentrates and bedding were 1.55 t. Total atmospheric input at 0.22 kg P/ha made only a small contribution to the total input budget because of the small farm size. The total P input was 2.48 t and the positive annual P balance was 1.50 t for the average farm.
0
500
1000
1500
2000
1985
1986
1987
1988
1989
1990
1991
1992
1993
1994
1995
1996
1997
1998
1999
2000
2001
2002
2003
2004
Are
a - k
ha
Wheat Barley Oilseed rape Sugar Beet Potatoes
0
1000
2000
3000
4000
5000
6000
7000
1985
1986
1987
1988
1989
1990
1991
1992
1993
1994
1995
1996
1997
1998
1999
2000
2001
2002
2003
2004
Are
a - k
ha
Tillage crops Total grassland Grass <5 yrs
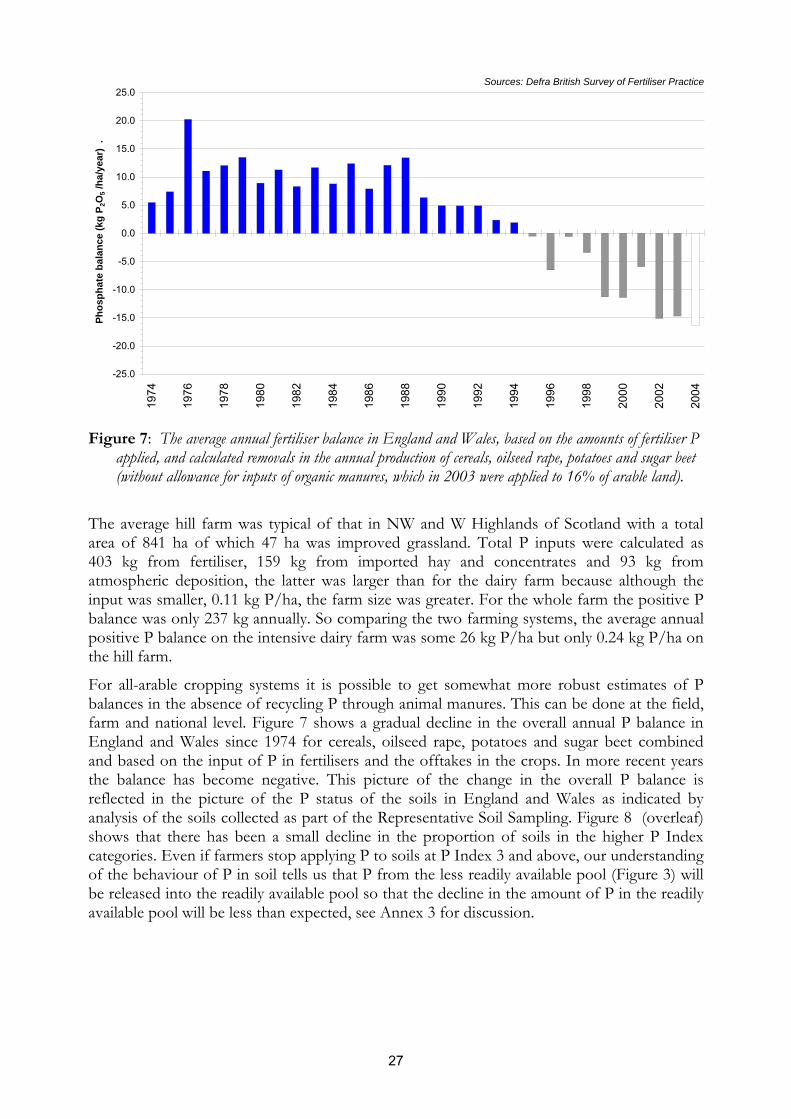
27
Figure 7: The average annual fertiliser balance in England and Wales, based on the amounts of fertiliser P applied, and calculated removals in the annual production of cereals, oilseed rape, potatoes and sugar beet (without allowance for inputs of organic manures, which in 2003 were applied to 16% of arable land).
The average hill farm was typical of that in NW and W Highlands of Scotland with a total area of 841 ha of which 47 ha was improved grassland. Total P inputs were calculated as 403 kg from fertiliser, 159 kg from imported hay and concentrates and 93 kg from atmospheric deposition, the latter was larger than for the dairy farm because although the input was smaller, 0.11 kg P/ha, the farm size was greater. For the whole farm the positive P balance was only 237 kg annually. So comparing the two farming systems, the average annual positive P balance on the intensive dairy farm was some 26 kg P/ha but only 0.24 kg P/ha on the hill farm.
For all-arable cropping systems it is possible to get somewhat more robust estimates of P balances in the absence of recycling P through animal manures. This can be done at the field, farm and national level. Figure 7 shows a gradual decline in the overall annual P balance in England and Wales since 1974 for cereals, oilseed rape, potatoes and sugar beet combined and based on the input of P in fertilisers and the offtakes in the crops. In more recent years the balance has become negative. This picture of the change in the overall P balance is reflected in the picture of the P status of the soils in England and Wales as indicated by analysis of the soils collected as part of the Representative Soil Sampling. Figure 8 (overleaf) shows that there has been a small decline in the proportion of soils in the higher P Index categories. Even if farmers stop applying P to soils at P Index 3 and above, our understanding of the behaviour of P in soil tells us that P from the less readily available pool (Figure 3) will be released into the readily available pool so that the decline in the amount of P in the readily available pool will be less than expected, see Annex 3 for discussion.
-25.0
-20.0
-15.0
-10.0
-5.0
0.0
5.0
10.0
15.0
20.0
25.0
1974
1976
1978
1980
1982
1984
1986
1988
1990
1992
1994
1996
1998
2000
2002
2004
Phos
phat
e ba
lanc
e (k
g P 2
O5 /
ha/y
ear)
.Sources: Defra British Survey of Fertiliser Practice

28
10. TRANSPORT OF PHOSPHORUS FROM AGRICULTURAL SOILS. As studies on the transport of P from soil to water have developed in the last two decades or so, some “confusion” has arisen because of variations in the nomenclature used to describe the different forms of P involved in the transport process. See Annex Section 6 for a discussion; the definitions of the descriptors used here are given in Annex Table A7.
When considering the loss of P from managed agricultural soils it is important to remember that P is transported from soil by either water or wind in a number of different forms. Soil particles can be detached by strong winds from exposed soil surfaces and transported over quite long distances. However, wind erosion is important only in areas where soil texture, landscape features and cropping leave soil vulnerable to movement by wind. In the UK, wind erosion is less widespread than water erosion and it is associated mainly with sandy and peaty soils. Not all the soil eroded from a field will be deposited in a stream, river or lake and as with any other eroded soil, not all the associated P will necessarily be bioavailable.
Water flowing from land is that part of precipitation that falls on land and ultimately appears in streams, rivers and lakes. Water flow can be partitioned between: (i) surface runoff, (ii) subsurface runoff or storm seepage and (iii) ground water runoff or base runoff (see Annex 7 for a more detailed discussion). Water passing from soil by all three of these hydrological pathways has the potential to entrain and retain soil and organic matter particles, and any P they contain, and transport them from the soil at the soil profile scale and/or the slope/field scale.
Figure 8: The proportion of arable soils in England and Wales in each P Index in 9 periods from 1969 to 1995 based on Olsen P values. Figure based on data from the Representative Soil Sampling Scheme (Skinner and Todd, 1998).
10.1. Water movement at the soil profile scale. There are two modes of flow at the soil profile scale. i) Preferential, bypass or macropore flow is the rapid transfer of water through larger,
continuous pores or fissures and through root channels and animal burrows, macropores. Preferential flow tends to be a feature of heavy textured soils and these in turn are often soils where artificial drainage systems are installed. Thus, preferential flow can be very effective in the movement of water from the surface of the soil and if this water contains soil particles or organic material, then these soil particles and organic material will be transported quickly to ditches and hence rivers and streams. Preferential
0.0
5.0
10.0
15.0
20.0
25.0
30.0
35.0
40.0
0-9 10-15 16-25 26-45 46-70 > 70
Per
cent
age
of s
oils
1969-711972-741975-761977-791980-821983-861987-891990-921993-95
Olsen P, mg/L
Index No. 0 1 2 3 4 ≧5

29
flow from the surface can occur on both grassland and arable land to artificial drainage systems installed to remove excess water. Any transport of P can occur associated with soil particles or organic material especially if an application of manure or fertiliser is made inappropriately when there is ready access for water to the fissures, e.g. on cracking soils whilst the cracks remain open. Water moving rapidly along fissures and permanent channels can erode soil at the surface and transport it, together with any P in contains, in the water flow. On the other hand, there is evidence that if the rate of water flow is slow enough, P can be adsorbed onto sites in the subsoil (Johnston and Poulton, 1992), thus decreasing the potential for onward transport of P to a water course.
ii) Matrix flow or saturated/piston flow refers to the uniform movement of water through the soil; it usually occurs in sandy soils. Depending on the rate of flow, P may be re-adsorbed onto soil particles in the subsoil, decreasing the loss from the soil profile. Phosphorus enrichment of subsoils has occurred in long-term experiments at Woburn (Johnston, 1975). It was also reported by Mattingly (1970) in a long-term experiment on a very coarse textured soil; in this case the P that had moved down the profile had been adsorbed onto clay particles in the deeper subsoil.
10.2. Water movement at the slope/field scale. The pathways at this scale are the link between the soil profile scale and the catchment/watershed scale via ditches and streams. Water can move to a ditch by overland or surface flow or by interflow or “through flow”, e.g. at the interface of the plough layer and subsoil, or at an impermeable layer, such as bedrock. Significant amounts of P can be transported by overland flow, especially in eroded material.
Some parts of a watershed are more likely to contribute water flow than others (Gburek and Sharpley, 1998) depending on hill slope morphology in controlling water flow pathways. Such critical source areas for P (Pionke et al., 1997) are related to land use (Gburek et al., 1996), e.g. fields to which large amounts of manure have been applied or with greatly enriched soil P concentrations. In addition to the slope of the land, overland flow depends on soil moisture status, related to the interval between rainfall events, rainfall duration, magnitude and intensity.
The transport of P from soil involves three distinct processes. i) Incidental P transfers can occur when large amounts of manure or fertiliser are applied
and these are combined with large, preferential water flows across the surface of the landscape. Frequent rainfall in parts of the UK increases the potential for such rapid, direct (incidental) transfers of P, especially when rainfall interacts directly with animal manures, animal excreta or fertilisers soon after their application to the soil surface. Although the amounts (kg/ha) of P lost may be agronomically insignificant, the concentration of P (mg/L) in the water can be sufficient to be of concern relative to its potential to disturb the biological balance within the water body. When such incidental P transfers occur they often make a dominant (50-98 %) contribution to the measured total P load in surface and sub-surface runoff from field plots. Transfers of P are temporally and spatially very variable (<1 to 25 % of the total P applied) depending on the amount applied, the P release characteristics of the materials applied (e.g. percent P extractability in water), the timing and amount of storm events relative to the time of application of the P source and the volume of runoff generated (see for example, Preedy et al., 2001; Withers et al., 2003). Any loss of P by this pathway is field specific and, in consequence, this must be considered as a point source that may contribute less P to a river than a small sewage treatment works. As a point source any remedial measures must be applied to that field.

30
ii) Soil erosion is the detachment of soil particles from the main mass of soil when intense rainfall or the flow of water over the soil surface provides sufficient energy to do this. This is a physical process that can occur on both arable and grassland. Soil particles can be transported over the soil surface or down through the soil profile depending on the direction in which the water flows. Erosion can be minimised by maintaining as complete a vegetative cover as possible on arable land, even if this means sowing a short period cover crop, and preventing poaching by animals or vehicular traffic on grassland when the soil is very wet. From both arable and grassland, the amount of P lost will increase with increasing P enrichment of the exposed soil surface. Again fields at risk to loss of P in eroded material should be considered as point sources and remedial measures applied to them specifically.
iii) Irrespective of the source, transport of P in solution occurs only if the P is soluble in water, i.e. the soil solution or surface water. This is a biochemical process and the water with its entrained P can move laterally as surface runoff or vertically down the soil profile. As noted above, when moving down the profile, P is likely to be adsorbed onto sites in the subsoil (Johnston, 1975; Johnston and Poulton, 1992). It is unlikely that this will be more than a very minor pathway for the movement of P from soil to a water body because the solubility of most P compounds in water is so small. Even in fertilisers with a large percent of water soluble P, all of the P is rapidly adsorbed onto soil particles from which it must go into the soil solution before there is any risk to movement in drainage water. This is perhaps the only method of P transport from soil that might be considered as a diffuse loss but the contribution to the total P load in a water body is very small.
Examples of losses by these pathways are given in more detail in the sections that follow.
10.3. Possible causes for an increase in the phosphorus concentration in water leaving soil.
It has been assumed that where there has been an increase in the P concentration in a water body then this is due to an increase in the use of phosphatic fertilisers. But this linkage is erroneous because neither the total amount of P fertiliser used (Figure 1) nor the amount applied per ha to the more important arable crops (Table 2) has increased over the last 40 years. For grassland the situation is somewhat more complex. The amount of P fertiliser used on both temporary and permanent grass has not increased (Table 2) but there is little information on the amount of P available in animal manures and its distribution on the farm. It would not be unreasonable to suggest that there may have been increases in the total amount of P available in animal manures with the increasing intensity of animal production and the associated use of feedstuffs imported on to the farm from external sources.
There are three possible reasons for the increasing P enrichment of surface waters. i) Increases in the amount of bioavailable P in soil. Where there have been appreciable
positive P balances over many years, this would increase the amount of P in any soil that was eroded and transported to water. In field experiments significant positive relationships between the level of soil P and the P content of drain flow have been found for grassland (Smith et al., 1995) and arable land (Heckrath et al., 1995). This is likely to be P occluded on soil particles. As noted above, transport of P in solution in drainage water, analogous to that of nitrate, is likely to be very small both in real terms and as a proportion of the total P transported.

31
ii) Incidental transport of P from surface applied fertilisers and manures, especially to grassland either by erosion or before the water soluble P has been adsorbed on to soil particles.
iii) Release of bioavailable P from lake sediments where P has been added in times past (see discussion later).
10.4. Transport of phosphorus from soil at the catchment scale. It appears that the simple relationships between the amount of plant-available P in soil and P in drain flow seen in experiments don’t apply at the larger catchment scale. For example, Foy and Withers (1995) estimated P surpluses in Somerset and Cambridgeshire to be about 1,540 and 580 kg P/ha, respectively, most probably related to the dominance of dairying in the first county and arable farming in the second. Importantly, however, they also noted that the average river P concentrations, mg/L, for three regions of England and Wales were: ~0.5 in the eastern lowlands, 0.35 in the western lowlands and <0.1 in the uplands. Thus the greater P surplus in the west, 95% of the total on dairy farms, than in the east, 98% of the total on cropped land, did not lead to an appreciably greater P concentration in river water in the west.
A number of authors (see for example, Edwards and Withers, 1998; Heathwaite et al., 2000; Watson and Foy, 2001) have pointed out that predicting total P losses at the catchment scale requires knowledge of a wide range of geographical, hydrological and land use factors that will include detailed information on site specific characteristics. Gburek et al. (2002), discussing the complexities of estimating the risk of P export within a catchment, showed that the P concentration decreased by 50% downstream from the headwaters to the watershed outlet. Interestingly they found that the P concentration was more closely related to the near stream (within 60 m) distribution of soils with more P than was required for crop production than to the overall P status of the soils within the whole watershed. This suggested that near stream surface runoff and soil P status were controlling P export from the watershed. In consequence they modified the Phosphorus Index (PI), a tool developed by NTCS/USDA and used in the USA to identify critical source areas controlling P export from agricultural watersheds, to be able to evaluate P source and transport factors separately.
Haygarth et al. (2000) identified the need to focus on both “hydrological factors” (Heathwaite, 1995) and “soil factors” to understand phosphorus transfer (PT) from soil to water. Soil factors include the amount and forms of P in soil, hydrological conditions determine whether or not P is transported on eroded material or goes into solution and by which pathway it is lost. Haygarth et al. (2000) also considered the need to understand both the spatial and temporal controls on P transfer from agricultural soils by the various hydrological pathways. Spatial variation must be considered at two scales, the soil profile and the slope/field, as discussed above. Temporal controls are related to rainfall intensity and duration. For example, little rainfall for a large proportion of the time is likely to have less effect in transporting P than is less frequent, short periods of intense rainfall with energy characteristics capable of detaching and transporting soil particles (Haygarth and Jarvis, 1999). It is also necessary to consider the time lapse between rainfall events in relation to changes in soil moisture content and water infiltration characteristics. The latter are related to the soil’s hydrological properties (Boorman, et al., 1995), which cause different responses to rainfall and land use practices. Haygarth et al. (2000) tabulate some of the differences in pedological and hydrological properties for just two soil series in the UK that show how large the differences can be. Soils with different properties can occur within close proximity even within a field, let alone a catchment, making it difficult to predict water discharge and P load.

32
Considering all the aspects discussed in this section it is obvious that the loss of P from agriculturally managed soils to water is extremely complex. It becomes ever more apparent that individual fields, rather than all the fields within a catchment, are the major contributors to the total P transported to the river within a catchment. Individual fields responsible for the greater part of any P loss must be identified and hopefully managed in such a way as to minimise the loss of P from them. The idea of diffuse P losses from all agriculturally managed soils is no longer tenable and, in consequence, no one solution seeking to minimise losses will be applicable to all situations.
11. SOME EXPERIMENTAL MEASUREMENTS OF PHOSPHORUS TRANSFER FROM SOIL TO WATER.
11.1. Arable soils. Catt et al. (1998) summarised data on P losses from arable land measured at: (i) Brimstone Farm (Oxfordshire), a drainage experiment on a very heavy clay soil, (ii) ADAS Boxworth (Cambridgeshire), a drainage experiment on chalky boulder clay soil, (iii) ADAS Rosemaund (Herefordshire), two surface water catchments and a drainage field on medium silt soil, and (iv) The Woburn Erosion Reference experiment on a sandy soil, not under-drained, at Woburn Experimental Farm (Bedfordshire).
The phosphate that is likely to be most bioavailable, RP<0.45 (previously MRP, see Annex 6 and Annex Table A7) was determined on water samples passing a 45 μm membrane and TPunf in water and sediment samples. Annual loadings of RP<0.45 and TPunf were calculated for Brimstone, Boxworth and Rosemaund. At Brimstone it was also possible to determine mean daily concentrations and loadings during periods of drain flow. For Woburn the loadings were based on the average concentration in the total volume of water or sediment transported during each erosion event. As the drain flow volumes from different plots at Brimstone and Boxworth often differed considerably, the annual and daily loadings were normalised to 100 mm of drain flow to give fairer comparisons between treatments.
It was only for the winter of 1994/1995 that there were comparable data for all four sites. Annual RP<0.45 loadings were 37 g/ha at Boxworth, 122 g/ha at Rosemaund while at Brimstone they ranged from 47-240 g/ha depending on treatment. TPunf loadings were 280 g/ha at Boxworth, 103 g/ha at Rosemaund and ranged from 370-910 g/ha at Brimstone. Catt et al. (1998) suggested that these differences between the sites reflected soil properties other than the total and Olsen P content of the three soils because these differed little between sites. They suggested that the three soils probably differed in their structural stability due to differences in calcium carbonate content, which was abundant throughout the soil profile at Boxworth but not at Rosemaund or Brimstone, and thus the soil’s ability to disaggregate and lose fine P-enriched soil particles to percolating water.
At Brimstone it was possible to restrict drain flow by altering the height at which the main out-flow pipe from the plot entered the measuring weir. Restricting drain flow tended to increase the amount of water flowing through the cultivated soil layer and, therefore, also the losses of RP<0.45 and TPunf in this component of the water loss, as a percentage of the total P loss. In absolute terms, RP<0.45 losses in the total drain flow were decreased by 75% and TPunf losses by 80%. Restricting the drain flow and having a greater proportion of the water moving through the cultivated soil layer did not limit the growth and yield of winter wheat (Catt et al., 1995). These results led Catt et al. (1998) to suggest that many arable fields on clay soils may be over drained and they suggested that minimising drain flow in areas with significant eutrophication risk could be considered. This could perhaps be achieved by decreasing the efficiency of the mole drainage system. However, this suggestion arising from plot

33
experiments may not always be applicable to larger scale farming with a limited labour force where farmers like to have the longest possible “window of opportunity” for soil cultivations and drilling, which requires the soil to remain drier for longer periods of time.
Surface runoff was monitored at Woburn and in the cultivated layer flow at Brimstone and the concentrations and loadings of RP<0.45 and TPunf were greater than in most drain flows. At Brimstone, on an unmanured, direct-drilled plot the annual loading of RP<0.45 and TPunf was 1200 and 3100 g/ha, respectively. At Woburn, soil erosion is a problem and the reference experiment was sited on a field with a 5o slope. During the first six years the total amount of soil lost ranged from 0.8-18.7 t/ha depending on treatment. In six years, the total amount of RP<0.45 in runoff was small, equivalent to 0.21-0.72 kg P/ha, but the sum of the TPunf in runoff and total P in sediment, i.e. in eroded soil, was much larger, equivalent to 2.42 to 32.76 kg P/ha, depending on treatment.
On the basis of these results, Catt et al. (1998) suggested that overland flow, which almost always involves the transport of some fine sediment, is likely to be the main route of P loss from arable land in Britain. The greater risk is on structurally unstable sandy soils on slopes like those at Woburn when the soil is at field capacity in winter or has developed a hard dry surface crust in summer. Minimising tillage, retention of crop residues on the soil surface and cross slope drilling/planting are all likely to decrease RP<0.45 losses in runoff and TP losses in transported soil.
Applying 60 kg P/ha to a wet soil at Boxworth in November 1994 had no detectable effect on RP<0.45 or TPunf concentrations in drain flow. In contrast, applying 33 kg P/ha to a wet soil at Brimstone on 2nd December 1994 increased RP<0.45 and TPunf losses per unit volume of drain flow over winter by 40-86% and 19-41%, respectively, compared to a lower rate of P, 16.5 kg/ha. Greatly increased concentrations of RP<0.45 were measured in the drain flow until early January. Presumably by that time the concentration of P in the soil solution had decreased as a result of P being adsorbed onto soil particles. The comparison between the Boxworth and Brimstone results suggest that the P in freshly added fertiliser may be at greater risk to loss on dispersible soils with no free CaCO3.
Additional cultivations were done at Brimstone to produce a finer than normal seedbed. Although there was some indication that RP<0.45 losses were less with the fine seedbed, TPunf losses were increased. This was perhaps due to the extra cultivations producing many very small particles that were carried downwards in percolating water.
11.2. Grassland soils.
Large amounts of animal manures are usually available on animal husbandry farms for application either to grassland or arable land. The average use of P fertiliser on grassland is relatively modest, about 20 kg P2O5/ha, and a large proportion (40%) of grassland soils are below P Index 2, the target level recommended for production (MAFF, 2000). Current recommendations suggest that farmers could consider increasing soil P levels to P Index 2 and then maintaining them at that level by replacing the P removed in the harvested crop (maintenance dressings) either as fertiliser or as animal manure. The amounts of P removed in successive cuts of grass harvested for silage can be considerable, for example, up to 90 kg P2O5/ha in four harvests. Estimating P requirements for grazed swards is more difficult. Recent data from the MIDAS study at ADAS Bridgets suggest that 20 kg P2O5/ ha is required annually (Withers, 2003).
Phosphate fertilisation of permanent grassland soils poses very different issues related to both P enrichment of the soil and the possible risk of P loss compared to arable soils. Regular ploughing of the latter incorporates P added in both fertilisers and manures throughout the

34
plough layer to uniformly enrich it and the pathways of P loss from such soils have been discussed in the previous section. However, it should be noted that the practice of regular soil inversion by ploughing could change with the current interest in minimum cultivation (however defined), as it did briefly with direct drilling of cereals some years ago. In this case soil P profiles will almost certainly begin to develop in arable soils with the danger of increased P losses from P enriched soils at the surface.
Grassland tends to be unploughed, especially in the wetter areas and where topography makes ploughing difficult, except when ploughed occasionally to grow arable crops like forage maize and fodder turnips. Animal excreta, slurry, farmyard manure (FYM) and P fertilisers all remain on the surface and because P only moves extremely slowly downwards through the soil profile, a profile of soil P enrichment exists from the surface downwards. Although nominally the surface is not disturbed it can suffer disturbance due to poaching, especially when soils are wet, stocking densities are large and in areas around gates and feeding/watering points. Poaching can lead to serious soil erosion and the loss of P with eroded soil.
The Rowden Drainage Experiment at IGER North Wyke, Devon in south-west England was started in 1982 (Scholefield et al., 1993) and together with other studies on field plots and lysimeters at the same site has proved a very valuable resource for studies on P losses from intensively managed grassland. The soil, a clayey non-calcareous pelostagnogley overlying clay shales, is representative of the most common hydrological soil type used for grassland in England and Wales (Boorman et al., 1995).
The drainage experiment was sited on an old unimproved pasture on poorly drained sloping land (5-10o) that initially had only 5 mg/kg Olsen P in the top 20 cm of soil. Each plot is about 1 ha and is hydrologically isolated from its neighbours. Half of the plots are artificially drained using pipes at 85 cm with permeable backfill and mole channels drawn over them, the remaining plots are not drained. On the latter, Haygarth et al. (1998b) considered that surface runoff and interflow to 30 cm were a single hydrological pathway, because on this site water does not drain vertically below 30 cm due to the impermeable clay at this depth. Water leaving by this pathway was collected on these plots. Water leaving by two hydrological pathways was collected on the drained plots, that leaving as on the un-drained plots and that leaving via the mole and pipe system.
The sward on the plots was dominated by Lolium perenne and from April to October four young beef cattle (steers) grazed the grass. There were three P treatments, no P (4 plots), 25 kg P/ha as triple superphosphate (TSP) (4 plots), and 16 kg P/ha as TSP and 16 kg P/ha as cattle slurry (8 plots). The fertiliser and slurry were applied in May.
After 12 years, a substantial profile in Olsen P had developed. For example, on the drained plots Olsen P was ~18, ~12 and 7 mg/kg at 0-0.5, 0.5-1.0 and 1-2 cm, respectively, while at the 5-7.5 and 25-30 cm depths it was about 6 and 1 mg P/kg, respectively. Below 30 cm, Olsen P was 1 mg/kg or less. Analysis of a bulk sample of soil to 7.5 cm, standard practice for grassland soils (MAFF, 2000), gave Olsen P values of 6.6 and 8.4 mg/kg for the drained and un-drained plots. Thus the standard method of sampling did not identify the greatly P enriched surface layer, from which most P is probably lost, and thus this method may be inappropriate to identify grassland soils at risk to loss of P.
Soil water was sampled on 10 occasions between 5th January and 31st October in 1994 and RP<0.45 was estimated in all samples, TPunf on eight samples and all P fractions (Appendix Table 7) on five occasions. The concentration, μg P/L, of all seven forms of P ranged widely and mean and range of values for three of these forms of P are in Table 5.
35
Table 5: The mean and range of values for three forms of phosphorus in water leaving a drained and un-drained permanent grassland soil (adapted from Haygarth et al., 1998b).
The largest concentrations of TPunf, 1773 μg/L, and TP<0.45, 1743 μg/L (not shown) were on the un-drained soil i.e. in the flow to 30 cm. These large concentrations followed the application of TSP and slurry on 10th May, which was then followed by 25 mm rain during the 24-hour period before sampling on 17th May. This demonstrates the major effect of intense rain shortly after applying fertilisers and manures to grassland.
On the drained plots, the largest mean concentration of TPunf in water from the 30 cm and 85 cm pathway was 232 and 132 μg P/L, respectively. The larger loss from the surface pathway was consistent with the greater P status of the surface soil, particularly in the top 2 cm. This is consistent with the results from 32P studies (Ahuja et al., 1981).
The ratio of particulate to dissolved P was the same for the surface pathway of both the drained and un-drained soils with the dissolved fraction being 69% of the total P. The amount of P lost from this gently sloping grassland was about 3 kg P/ha annually.
Another set of much smaller, 10x3 m, hydrologically isolated field lysimeters were established in 1996 on very similar sloping permanent grassland on the same soil type (Preedy et al., 2001) and surface and subsurface lateral flow to 27 cm was collected. The 0-27 cm topsoil had, on average, 7 mg/kg Olsen P with 13 mg/kg in the top 2 cm. There were four treatments, no P and 29 kg P/ha as: (i) TSP, (ii) cattle slurry, and (iii) a mix of TSP and cattle slurry each supplying about half the total P; all were applied to wet soil. In the following 7 days, 48.8 mm rainfall resulted in 48 mm discharge from the plots. Where P had been applied the TPunf
exported from the plots ranged from 1.8-2.3 kg /ha, and 33-46% of this total was lost in a single 4-hour period with overland flow. The TPunf concentration in the flow from the TSP and TSP + slurry treatments peaked at 11,000 μg/L between 24 and 32 hours after the treatments were applied and of this 61-64% was RP<0.45 suggesting that the TSP granules at the soil surface were directly entrained or rapidly solubilised in the overland flow. The TPunf concentration in the flow from the slurry treatment peaked at 7,000 μg/L of which 20% was RP<0.45 and 66% as TP>0.45. Even in periods of small flows, assumed to be largely subsurface flow, the concentration of TPunf often exceeded 3,000 μg/L.
This set of results indicated that P can be lost from both fertiliser and cattle slurry applied to the surface of grassland when the soil is at or near field capacity and that the concentration of P in the water leaving the site depends on the amount of rainfall and the discharge created.
A further study (Turner and Haygarth, 2000) monitored, over two drainage seasons, P in the leachate draining through four monolith lysimeters (135 cm deep and 80 cm in diameter). The lysimeters were installed in a field so that the soil surface was level with that of the surrounding soil. The soils, representative of four grassland soil types, ranged in texture from silty clay to sand and Olsen P from 15 to 75 mg/kg. The lysimeters were sown with Lolium
RP<0.45 RP>0.45 TPunf
Un-drained soil Mean μg/L 60 23 152
to 30 cm Range μg/L 10-1296 10-63 26-1773
Drained soil Mean μg/L 116 39 232
to 30 cm Range μg/L 10-597 10-130 10-892
Drained soil Mean μg/L 41 26 132
to 85 cm Range μg/L 10-304 10-145 10-605

36
perenne and managed as typical cut grassland with annual fertiliser inputs of 40 kg P, 340 kg N and 220 kg K/ha. Mean annual rainfall was about 1100 mm in both years of which 332 to 350 mm appeared in the drainage in the first drainage season and 451-491 mm in the second. The amount of drainage was similar for three of the soil types but was about 50% less with the silty clay soil because the large amount of rainfall caused water logging at the surface of this soil and the excess water spilt over the side of the lysimeter. Presumably this water would have been lost as overland flow in farming practice. The leachate draining under gravity was collected at the base of the lysimeter, i.e. at 135 cm, in 25L vessels. The drainage in each vessel was sampled weekly or more frequently and analysed for RP<0.45 in the first season, September 1993 – June 1994, and monthly but analysed for all P fractions (Table 6) in the second season, October 1994 – May 1995.
Table 6: Concentrations, μg/L, of different phosphorus fractions lost in drainage during 1994-95 from four grassland soil types. (adapted from Turner and Haygarth, 2000).
On these four soil types the annual export of total P was < 0.5 kg/ha, i.e. less than 1% of the 40 kg/ha P applied as fertiliser. But in the drainage the concentration of P routinely exceeded 100 μg/L and remained relatively stable throughout the drainage season except during late spring when the maximum concentration exceeded 200 μg/L. The leachate from all four soil types was dominated by RP<0.45, 62-71%, with the balance in un-reactive organic forms, 29-38%, mainly in the >0.45 μm fraction. This latter fraction was largest in April – May probably reflecting increased microbiological turnover and release of P in the soil. These results are consistent with those of the field-based lysimeters and suggest that much of the P lost from grassland is lost in overland and subsurface lateral flow (to perhaps 30 cm).
Total P, μg/L Reactive P, μg/L
Total <0.45 μm >0.45 μm Total <0.45 μm >0.45 μm
Silty clay
Mean 179 130 49 132 117 16
Range 136-247 85-210 10-107 90-223 81-210 19480
Flow weighted mean 163 109 54 107 97 10
Clay loam
Mean 162 117 45 105 95 10
Range 72-446 62-261 5-184 33-234 29-191 16072
Flow weighted mean 94 73 20 66 59 6
Sandy loam
Mean 65 39 26 39 25 14
Range 33-109 10-91 10-53 12-108 7-56 3-52
Flow weighted mean 53 28 25 34 20 14
Sand
Mean 240 71 169 97 63 34
Range 56-1145 36-161 10-984 33-359 29-157 4-202
Flow weighted mean 88 48 39 52 43 9
37
12. ORGANIC MANURES AND PHOSPHORUS TRANSPORT FROM SOIL.
It has been estimated that some 80 million tonnes of livestock excreta, containing about 119,000 t P, are collected annually within UK farm buildings (Smith et al., 1998). This quantity of P compares with some 170,300 t P applied as fertiliser in the mid 1990s (FMA, 1994). Thus animal manures represent a considerable P resource. However, The British Survey of Fertiliser Practice shows that, on average, farmers make only a small allowance for the P in the organic manure they apply to their land when deciding the amount of P fertiliser to use. In part, this may be because farmers are uncertain about the immediate availability of the P in the manure. Although they are a valuable P resource, animal manures represent an important potential source of P at risk to transport to surface and ground water, not least because they tend to be applied in large quantities and at inappropriate times to minimal areas of land. Currently the rate at which manures are applied is determined by the amount of N they contain, and because the ratio of N to P tends to be narrow, large amounts of P are often applied. In recent years, a number of studies have tested the availability of P in organic manures and the risk of transfer of P from soils where such manures are used.
12.1. Poultry litter. On a loamy sand soil at ADAS Gleadthorpe an experiment lasting four years compared six amounts of poultry litter, which supplied a total of 0-1,119 kg P/ha, and three amounts of TSP (applied only in the first two years) supplying a total of 200-800 kg P/ha (Shephard and Withers, 1999). The treatments were applied in autumn and spring barley was grown in the first two years, winter rye in year 3 and the site was fallowed in the fourth year. Average annual rainfall was 625 mm. There was a highly significant linear relationship between the accumulating P balance over the four years for all treatments and Olsen P, water soluble P and total P in the top 30 cm soil. The relationship for total P suggested that almost 100% of the P balance was found in the top 30 cm soil. For the relationship between P balance and Olsen P, the data points for both poultry litter and TSP fell on the same line strongly suggesting that the P in poultry litter was as plant-available as that in TSP. This agrees with very similar data from much longer term experiments where there was a common linear relationship between P balance for FYM, sewage sludge and superphosphate treated soils and their Olsen P content (Johnston, 1989).
Over the four years there was no conclusive evidence of P movement and retention below 50 cm perhaps because the soil pH was maintained and/or perhaps the time period was too short. Over a longer period, 25 years, there was appreciable P enrichment of a similar textured sandy loam soil to 40 cm where P had been applied as superphosphate (Johnston and Poulton, 1992).
Transport of P from this coarse textured sandy soil could be in through drainage and water samples were collected in Teflon samplers at 45, 100 and 150 cm at the end of the fourth winter. There were larger concentrations of RP<0.45 at 45 cm where most poultry litter had been applied but at the two deeper depths the P concentrations were close to the limit of analytical detection, suggesting that there had been little loss in through drainage. This is perhaps not surprising if on this well limed soil most of the P balance was found as an increase in total soil P.
Shepherd and Withers (1999) make an important point. The UK Code of Good Agricultural Practice (COGAP: MAFF, 1994) recommends a maximum N application of 250 kg/ha in manures. If, as in their experiment, poultry litter has an N: P ratio of 3.4: 1 then an application to supply 250 kg N/ha would add about 75 kg P/ha, sufficient for 2-3 average-yielding cereal

38
crops. Thus to avoid an unnecessary build up of P in the soil, such manures should be applied on a rotational basis to maintain the critical level of plant-available soil P for the farming system practiced.
12.2. Cattle slurry and farmyard manure. Different amounts and times of application of these two sources of P were compared in an experiment during 1993-1997 on a silty clay loam soil on a 5o slope under arable cropping at ADAS Rosemaund (Smith et al., 2001). Only in one year was P fertiliser applied and then to plots previously without P and this summary excludes consideration of this treatment. Three P fractions, TPunf, RP<0.45 and TP<0.45 were determined in surface runoff water and interflow at 30 cm; all three P fractions were consistently much less in the interflow at 30 cm and were unaffected by treatment. Increasing the amount of slurry applied, increased P lost in surface runoff. During the 4-year period, even with the largest amount of slurry P, 146 kg/ha, the total amount of P lost was only 2 kg/ha but the average flow weighted P concentration was 7,200 μg/L with a peak at 30,000 μg/L.
Visual observation identified surface capping of the soil and decreased water infiltration, especially where most slurry was applied. In consequence, rainfall soon after slurry application led to increased surface runoff. This suggests that strategies to control surface runoff where slurry is applied should include: (i) limiting slurry application rates to those consistent with good agronomic practice, (ii) avoid applying slurry to soils at field capacity and during or when heavy rainfall is expected, (iii) soil cultural practices aimed to improve and maintain a good soil structure, especially at the soil surface.
Although the study did not allow an evaluation of a critical threshold for a slurry loading that might lead to an increased risk of P loss, Smith et al. (2001) suggested that above about 2.5-3.0 t/ha slurry dry solids, P loss could greatly increase. This threshold approaches the 50m3/ha limit suggested for slurry within the Code of Good Agricultural Practice for the Protection of Water (MAFF, 1998) when cattle slurry contains 5-6% solids (MAFF, 1994).
12.3. Cattle slurry, liquid digested sludge and dewatered sludge. This experiment with cereal cropping was also at ADAS Rosemaund; the soil and site topography were similar to that of the experiment described in section 12.2. Four sources of P were compared, liquid cattle slurry, LCS; liquid digested sludge, LDS; dewatered sludge cake, DSC and fertiliser P applied as triple superphosphate, TSP. The sewage sludges were chosen as being those most likely to be recycled to agricultural land in the UK as other disposal routes become restricted (Withers et al., 2001). This 2-year experiment was complicated in that the treatments were applied cumulatively twice in both growing seasons; in spring they were applied on the surface but in the first autumn they were incorporated into the soil while in the second they were applied on the surface. In both years only surface runoff was monitored either in the period May to August (1st and 3rd periods in the first and second years, respectively) or November to April (2nd and 4th periods in the first and second years, respectively). The number of storm events monitored were 4, 8, 2 and 7 in Periods 1, 2, 3 and 4, respectively.
In the 1st monitoring period, May-August 1995, the treatments had been surface applied on 28th April to an established crop of winter wheat, the TSP, LCS, LDS and DSC supplied 60, 60, 54 and 35 kg P/ha, respectively. After harvest the plots were ploughed and the treatments applied again. This time the TSP, LCS, LDS and DSC supplied 90, 40, 35 and 144 kg P/ha, but this time they were incorporated into the soil prior to sowing winter wheat in December 1995. In the second monitoring period, December 1995 to April 1996, there were eight storm events. The treatments were repeated as a surface top dressing in late May to the established

39
wheat crop to supply 90, 37, 33 and 58 kg P/ha with TSP, LCS, LDS and DSC, respectively. There were just 2 storm events in the third monitoring period, May to August 1996, and the authors gave no data for this period. Following the harvest of the second wheat crop the plots were ploughed, a seedbed prepared and winter barley sown and the soil consolidated by rolling before the treatments were applied to the surface in November to supply 90, 49, 28 and 92 kg P/ha with TSP, LCS, LDS and DSC, respectively. Seven storm events were monitored between November 1996 and February 1997 and the amounts and concentrations of TPunf in periods 1, 2 and 4 are in Table 7.
Table 7: The amounts and concentrations of total phosphorus in un-filtered drainage water from soils to which three organic manures and triple superphosphate were applied for arable crops. (adapted from Withers et al., 2001).
In the first period, the first storm event occurred 21 days after the treatments were applied to the surface and the TPunf lost from the TSP and LCS plots was significantly greater than that lost from the control, LDS and DSC plots, due mainly to an increase in TP<0.45. The cumulative runoff was similar (c. 40 L/plot) for all treatments other than the TSP (c. 27 L/plot). In the second monitoring period (November to April) following ploughing after harvest and then incorporation of all the treatments before sowing the next crop, the loss of P in the eight storm events during this winter period was similar for all treatments including the control. Cumulative runoff was also similar ranging from approximately 150 to 175 L/plot. In the fourth monitoring period much smaller amounts of rainfall were needed to generate surface runoff than previously because the soil surface had been consolidated after sowing the crop and before the treatments were applied. Also runoff differed significantly between treatments being least with DSC and greatest with LCS, but there is no ready explanation for this difference. Consolidating the soil before the treatments were applied appreciably increased both cumulative runoff and P losses.
The average total P, % P in dry solids (DS), in the three organic amendments were within the range 1.06-1.65 % but the solubility of this total P varied greatly (Table 8, overleaf). Water- and NaHCO3-soluble P were a larger percentage of the total P for the LCS than for the sludges while HCl-soluble P was a larger proportion of the total P for both liquid manures than for the dewatered sludge cake, DSC. The larger percent NaHCO3- and HCl-soluble P in the LCS suggests that much of the P was as inorganic P compounds and with 60% water solubility, this also suggests the possibility of an increased risk of P loss in surface runoff. Although the LDS had a similar HCl-soluble P to the LCS, it had a much smaller percent of NaHCO3- and water-soluble P than the LCS suggesting that there was a much smaller risk of reactive P loss in storm water after applying a liquid digested sludge than after applying cattle
Period 1 May - August
Period 2 December - April
Period 4 November - February
Treatment Surface applied to
established winter wheatIncorporated before
sowing Surface applied to
rolled seedbed
mg P/plot mg P/L* mg P/plot mg P/L* mg P/plot mg P/L*
Control 24 0.89 102 0.60 332 3.41
TSP 82 4.79 113 0.70 4017 4.37
LCS 88 3.99 133 0.84 7622 4.29
LDS 24 0.87 115 0.69 1852 3.96
DSC 33 1.19 115 0.77 110 3.16
* Flow weighted concentration

40
slurry. The much smaller concentration of both water- and NaHCO3-soluble P in the dewatered sludge cake probably reflects removal of soluble P in the dewatering process. These differences in the solubility of P in the different reagents must reflect differences in both the type and quantity of the P compounds in these organic manures. Johnston (1975) found similar differences in solubility of the soil P derived from applications of sewage sludge, FYM and fertilisers.
Table 8: The relationship for three organic manures between total phosphorus and phosphorus soluble in different extractants. (adapted from Withers et al., 2001).
The P in TSP has about 95% water solubility and, therefore, it might be expected that the relative difference in the potential to release P to runoff would be in the order of water solubility, namely: TSP>LCS>LDS>DSC. However, the measured losses given above do not show such a simple relationship and the method of application, surface applied or incorporated, had a much greater effect on P losses than just water solubility.
12.4. Organic manures and forage crops. Withers et al. (2003) noted that silage produced from forage maize is both very palatable and is a high-energy source for dairy cattle; it is now grown on over 105,000 ha each year in England (Defra, 2005). Much of this maize is grown as an arable crop on dairy farms in high rainfall areas with undulating topography. It also receives large amounts of slurry so that soil P levels build up quickly, for example, 30% of the forage maize crop is grown on soils with P Index >3. In consequence there is an issue around the possible environmental impact of P loss from these soils to which large amounts of slurry are applied in autumn and winter when the soils are water-saturated and rainfall quickly leads to surface runoff. This surface runoff from soil without vegetative cover and with compaction and loss of structure from traffic applying the slurry can erode large amounts of soil. Problems associated with these maize growing soils are to some extent exacerbated by the incorporation of fertiliser P or slurry at planting.
In recent experiments at ADAS Bridgets with forage maize grown on soils with 38 mg/L Olsen P (P Index 3), there were early visual benefits from placed fertiliser P (32 kg P2O5/ha) or slurry (22 kg P2O5/ha) but ultimately only small, non-statistically significant increases in yield. Fertiliser P at 32 kg P2O5/ha is less than the average amount often applied to many maize crops according to The British Survey of Fertiliser Practice, and these results suggest that even this amount of P is too large and it could be questioned whether any P need be applied on soils with a P Index above 2.
On a dairy farm in Devon on a field continuously cropped with maize since 1996, runoff (overland) flow was measured from field plots established on a new in-field site each year in three successive winters starting in 1998/99 (Withers and Bailey, 2003). The field had received annual applications of slurry over a long period and the average Olsen P was 50 mg/L
LCS LDS DSC
Total P, % in DS: 1.28 1.65 1.06
Soluble in: % of total
Water 60 8 0.8
NaHCO3 91 35 12
NaOH 46 30 37
HCl 100 94 66

41
(P Index 4, MAFF, 2000). The soil was a non-calcareous, free draining very stony sandy loam, but winter rainfall, 600 mm out of an annual total of 1000 mm, causes the soil to slake and cap. This leads to runoff and erosion on the steeper slopes, especially when they are cultivated up and down slope, which is often the only safe way to do so. Runoff was collected at the down slope end of each plot and was sampled after 10-15 mm or more rain had fallen in a 48-hour period. Suspended sediment and P were determined in the runoff.
A single application of cattle slurry, 50 m3/ha, applied to maize stubble that was either left uncultivated, tine cultivated (initially to 7-10 cm but to 20-25 cm in the last year) or ploughed to 20 cm was compared to an uncultivated treatment without slurry. The slurry was applied before ploughing or after tine cultivation. In an additional treatment in the first two years, the slurry application was divided between three equal monthly applications applied cumulatively to uncultivated stubble. The total P applied was c. 30 kg/ha in the first two years and 13 kg/ha in the third year.
The export of suspended solids was largely dependent on the effect of treatment on runoff volume with significantly smaller amounts collected from cultivated plots except during very intense storm events. For example, in 1999/2000, cumulative suspended solids amounted to 0.65 t/ha on uncultivated control plots and this was decreased to 0.32 t/ha on the cultivated plots with slurry due to a 50% decrease in runoff volume. On the uncultivated plots with the single application of slurry, 0.42 t/ha solids were lost, less than on the control plot, because the slurry solids slightly decreased both runoff volume and the solids content.
The overall effect of applying slurry to both uncultivated and cultivated plots on TPunf was negligible in 1998/99 (0.02 kg P/ha) when there was least rainfall and runoff in the monitoring period. In the following two years with the single application of slurry to uncultivated soil, P losses increased to about 2 and 5 kg P/ha, respectively. Ploughing in the slurry or applying it to tined land considerably decreased the amount of P lost each year. In each year, TPunf losses from cultivated soil with slurry were similar to those from the uncultivated control without slurry, i.e. there was little additional loss from the freshly applied slurry.
There were also considerable differences in the mean flow-weighted concentration of the different P fractions (for definitions see Annex 6, Annex Table A7) in the runoff from the various treatments when averaged over the 3-year period (Table 9).
Table 9: The loss of different forms of phosphorus from soils with different tillage treatments and to which slurry was applied. (adapted from Withers and Bailey, 2003).
TPunf RP<0.45 UP<0.45 TP>0.45
mg P/L as % of TPunf
Control 2.69 12 2 86
Uncultivated stubble
- single slurry application 6.63 43 7 50
- split slurry application 5.09 42 9 49
Cultivated stubble
-ploughed 3.64 28 4 68
- tined 4.03 20 3 77
* Two years only

42
Not only was less P lost after the slurry was either ploughed in or surface applied after the soil was tine cultivated, but the RP<0.45, probably the most bioavailable P fraction, was also an appreciably smaller proportion of TPunf. Thus soil cultivation offers considerable benefits in decreasing P losses where slurry is applied. Applying the slurry in three equal amounts to the uncultivated soil decreased the initial large soluble P concentration in the first runoff event and the total P export in 1999/2000 was decreased by 25% when there were no further storm events after the subsequent slurry applications. At other times the P loss was in direct proportion to the amount of P applied. Thus any benefit from splitting slurry applications will depend on the intensity and amount of rainfall after each slurry application.
An important observation was made in the third year of this experiment when there was heavy rainfall on the day the treatments were being applied. On the ploughed treatment where the slurry had just been applied before ploughing, the runoff moved the slurry down and along the furrow slices until it entered the gutters collecting the runoff. The total P export, 4.22 kg/ha, was just a little less than that, 5.05 kg/ha, where slurry was applied to the uncultivated surface, and the RP<0.45 in the flow weighted runoff was 40% of TPunf more than that, 34%, where slurry was applied to the surface. Even where it is to be incorporated, slurry application should cease if heavy rainfall is imminent or starts during application.
13. PHOSPHORUS AVAILABILITY IN STREAM AND LAKE SEDIMENTS.
13.1. Organic phosphates. In soils organic P must be mineralised by microbial action to convert it to inorganic ions that can be taken up by plant roots. However, when suspended in water the P in organic matter may be released more quickly. Berman (1969) showed that phosphatases released much soluble inorganic P from the total stock of P suspended in Lake Kinnerett in northern Israel and the release was associated with the appearance of algal blooms. Possibly organic P in eroded soil suspended in the water or in near surface sediments could be released in the same way.
13.2. Inorganic phosphates. In many soils some inorganic P is associated with ferric iron compounds. Under anaerobic reducing conditions in mud and stream sediments ferrous phosphates are produced and these are more soluble in water than ferric phosphates. Thus eroded soil that has sufficient P for agricultural use may have the availability of the P for algae and plants increased in the anaerobic conditions in river sediments (Thomas, 1970). In 1972, Cooke (1976) analysed a number of mud samples taken in 1970 from below streams/rivers in the Great Ouse River system in England and the supernatant water at each sampling point at the time of taking the sediment samples. Soils in the area from which the samples were taken can contain between 500 and 900 mg/kg total P; while the total P in the sediment samples ranged from 768 to 1,375 mg/kg. On this basis none of the mud samples were “poor” in total P and some were richer than normal agricultural soils. The Olsen P in the sediment samples ranged from 41 to 176 mg/kg, much more than the 25 mg/kg Olsen P that would be adequate for the optimum yield of arable crops. Not surprisingly the concentration of P in the water flowing over where the mud samples were taken was not related to their total- or Olsen-P and at the time of sampling there was no algal growth suggesting that the conditions were aerobic and no P was being released from the sediment. Cooke (1976) also reported that the most P enriched of the sediments he sampled was mud from the Grand Union Canal but the water above it in 1970 was apparently devoid of inorganic P at the level of analytical detection then available. However, in spring 1971 he observed that “thick” algal blooms were produced, which
43
suggests that there was sufficient P to aid algal growth that spring, probably because the sediment became anaerobic. This evidence and much further work in that period (Ryden et al., 1973; Rigler, 1973; Hesse, 1973; Thomas, 1973) supports the view that although there can be large amounts of total P in river and lake sediments, its availability to support plant growth varies and can be enhanced in the anaerobic conditions in river and lake sediments and that this P plays an important role in eutrophication.
14. SOME APPROACHES TO MANAGING PHOSPHORUS INPUTS TO MINIMISE THE RISK OF PHOSPHORUS TRANSFER FROM SOIL TO WATER.
14.1. The amount and timing of phosphorus inputs. The amount of P applied either as fertiliser or manure and the timing of the application are important. It is probable that more P will be lost, whether by erosion in water moving over the soil surface or transported in water moving down large cracks or voids in the soil, the larger the amount of P added. If this is correct then it suggests that rotational manuring with large applications of P added periodically should not be practised. Rotational manuring may be justified on agronomic criteria but probably not on environmental grounds. Comments on the timing of P inputs have been made in the previous sections.
14.2. The type of fertiliser used. The merit of applying plant nutrients as complex compound fertilisers containing more than one nutrient or as a blend of straight fertilisers each supplying only one nutrient is a subject of discussion. The latter can be used to apply amounts of P and K adjusted on the basis of soil analysis. The former have the advantage that the same proportion of each nutrient is in each granule and no one granule is a single source of P. If inputs of only P and K are being considered then it is justifiable to ask whether the widely available compound fertilisers have appropriate ratios of P and K. This question needs to be asked in relation to meeting both soil fertility requirements and environmental issues. For soils that have reasonable amounts of plant-available P but are being deplete of K because there is a negative K balance, then it may be appropriate to use a compound fertiliser that contains more K than P.
14.3. The water solubility of the form of phosphorus in fertilisers and organic manures. Any possible effect of percent water solubility of the phosphate in a fertiliser or manure on P loss is not easy to determine and, in any case, it is only relevant to the very small amount of P lost in solution in drainage. Nevertheless, it has been suggested that it could be beneficial to use phosphate fertilisers with less water-soluble P, i.e. a lower percent water solubility, than currently required by EU regulations for single- and triple-superphosphates (SSP and TSP) and mono- and di-ammonium phosphates (MAP and DAP). However, achieving this for SSP and TSP by only partially acidulating phosphate rock and leaving un-reacted rock, would produce a fertiliser unsuitable for neutral and calcareous soils because the P in the unreacted rock would not be plant-available. It would not be possible to decrease the water solubility of the P in MAP and DAP.
There are other fertilisers with lower percent water solubility than TSP, MAP and DAP, for example nitrophosphates and dicalcium phosphate. Annual and short-term experiments on many soils, including slightly calcareous soils, have shown that when nitrophosphates and superphosphate were compared, both gave the same yield of many crops even though the nitrophosphates tested contained less water-soluble phosphate than did the superphosphate (see summary in Johnston, 1993). All fertilisers are equally subject to transport as particulate material either over the soil surface or by preferential movement down cracks in the soil.

44
Once in the water body little is known about the bioavailability of the P they contain and there is thus little justification to favour one such fertiliser or another on the basis of their water solubility.
14.4. Additives in animal feed stuffs. In terms of incidental P transfers from soil to water it is possible to manage more effectively the application of P fertilisers and dry solid organic manures than the spreading of liquid manures, especially slurry. In inclement weather, bags of fertiliser or dry manures can remain in the barn but action has to be taken quickly once a slurry store is full. Thus as noted previously, with organic, liquid manures the central issue is about how and when they are used and the availability of land on which to spread them. But there is also an issue around the P content of the manure that relates to the intake of P in the diet and the efficient use of that P by the animal.
Improving the P use efficiency by animals is being tackled on two fronts: (i) Increasing the effective use of phytate (the naturally occurring organic P content) in the feed by the addition of microbially-derived phytase, especially in feeds for monogastric animals, (ii) increasing the digestibility of inorganic feed phosphates added to supplement the native P supply in the basic components of the feed. This topic is discussed in more detail in Annex 1.2.
14.5. Controlling the risk of phosphorus transfer from soil to water. While there must be a discussion on P use in farming in relation to environmental issues, it is crucial to this discussion that it should not be considered by analogy with that of nitrate loss. Annual applications of excess N to cropland or grassland on any soil rarely lead to the excess N being incorporated into soil organic matter in either the short- or longer-term. For example, on the Broadbalk experiment at Rothamsted, one plot has received 144 kg N/ha annually since 1843. In 1987, after 135 years a total of 19,440 kg N/ha had been applied. Assuming that over the whole period of this experiment the N was used with 50% efficiency then some 10,000 kg N has to be accounted for. The increase in total soil N, however, amounted to only 570 kg N/ha in the surface 23 cm soil. (Glendinning et al., 1996). Thus, almost all of the N balance has been lost because most, if not all the excess nitrate at harvest is at risk to loss by leaching or denitrification and if leached the bioavailability of nitrate in the leachate will not change. Thus in principle, the concept of designating comparatively large areas of land as nitrate vulnerable zones (NVZs) can be justified and N applications within the zone can be restricted.
The same is not true for P. For example, in the Exhaustion Land experiment at Rothamsted where single superphosphate was applied between 1876 and 1901, the positive P balance was 1,217 kg P/ha and of this 1,085 kg P/ha was found as an increase in total P in the top 23 cm soil in 1903 (Johnston and Poulton, 1977). Similarly on the sandy loam soil at Woburn, P was applied as superphosphate between 1877 and 1927 and the P balance was 1,197 kg P/ha of which 1,154 kg P/ha was found as an increase in total soil P. In both cases most of the P balance had been retained in the soil. It is for this reason that P must not be thought of as analogous to N when its loss from soil is considered. Other reasons why each catchment and each field within a catchment must be considered as a separate entity include the following. The greatest risk of P loss appears to be in hilly terrain when large amounts of slurry are applied on limited areas of land, usually grassland and often when the soil is not readily permeable because it is either very wet or dry. Subsequent rain leads to rapid surface runoff directly to watercourses. Such terrain and associated farming systems will vary appreciably between river catchments. The extent of surface runoff, and hence the amount of particulate soil and organic manure in the water, in hilly country will depend on the steepness of slope,

45
intensity of rainfall and number of intense rainfall events and the area of bare soil within the catchment. The amount of P transported in the soil and organic manure will depend on their P content. But not only the amount of P is important, of greater importance is the bioavailability of the P when it reaches the aquatic environment.
A better understanding of the factors controlling the movement of water over and through the soil profile is essential if loss of P by surface and subsurface runoff is to be better controlled. This understanding must be at the level of each river catchment because the relative importance of the different pathways of loss will vary spatially and with time both between and within catchments. The concept of variable source areas within a catchment needs to be developed because surface runoff may only be generated from limited areas within a catchment.
Thus there are a number of reasons why it would be unreasonable to impose an overall (blanket) restriction on P use, whether as fertiliser or manure, even within a catchment never mind within a region made up of many catchments. Individual fields, and perhaps only parts of a field, are possible point sources. Because the husbandry system on each field, the level of plant-available soil P and topography can vary widely, the risk of surface runoff, soil erosion and movement of P down and out of the soil profile is field specific. Thus the field would have to be the unit for imposing control on the amount of P used.
15. RECOMMENDATIONS. The following is a list of recommendations relating to the use of P in agriculture that are applicable to both the use of fertilisers and organic manures. Of the major plant nutrients, the World’s resources of P are least and on a global scale P should, therefore, be used as efficiently as possible to maintain and increase agricultural productivity where appropriate. In England and Wales there is evidence that on “The National Farm”, the P balance (P applied minus P removed in the harvested crop) is negative for the most important arable crops where animal manures are not applied. As only 16% of the total tillage area gets organic manure annually this implies that a negative P balance exists for most soils growing arable crops. This cannot continue indefinitely without risk to the fertility of these soils with respect to P. Soils containing insufficient P not only produce less yield but other inputs, notably N, are used less efficiently. Highlighting the risk associated with incidental P transfers and targeting short-term decision-making is perhaps the most immediately viable method for mitigating P transport from soil to water. The recommendations that follow should be considered as approaches to limit any transport of P from agriculturally managed soils to water. • Identify the critical level of plant-available P for each soil and farming system. In the
absence of field specific data, current advice in RB 209 to increase the P in the topsoil to P Index 2 for intensive grassland and most arable crops and Index 3 for potatoes and vegetables is an acceptable starting point. Deep, well-structured soils with good seedbeds will have lower critical values than shallow or stony soils because the former have more fine soil particles on which plant-available P is held and roots are better able to produce a good root system in well structured soils.
• Maintain soils at the critical level of plant-available P appropriate to the soil and farming system by replacing the P removed in the harvested crop, maintenance applications as indicated in RB 209. The soil should be sampled every 4/5 years to check that this approach to P fertilising is maintaining the critical soil P value. Current evidence suggests that the critical value is independent of the yield but with larger yields the P offtake, and thus the maintenance application will be larger. Average values for P offtakes per tonne of produce removed from the field are in RB 209 (MAFF, 2000).

46
• Always take soil samples at the same time of year, to the same depth and take not less than 16 cores to provide a bulk sample. Unless fields are known to be very uniform it is preferable to take separate samples from restricted areas representative of known differences in soil conditions. In normal farming systems, soil P values rarely change rapidly or erratically, if large changes are reported they should be queried, and if necessary fresh samples taken for analysis. Large changes in soil P values do not occur quickly with either positive or negative P balances. When P balances are positive, much of the excess P moves quickly to absorbed forms that are not measured by routine methods of soil analysis. When P balances are negative, P from the less readily available pool replenishes that in the readily available pool (see Figure 3).
• Do not allow plant-available soil P values to increase much above the critical value. When soils with P values much above the critical value are transported to a surface water body there is an increased risk of adverse effects from eutrophication. In grassland farming systems where the soil is rarely ploughed, the surface few centimetres of soil become greatly enriched with P, especially where slurry is added frequently. In such situations and in relation to assessing environmental risk, it may perhaps be necessary to consider the depth from which soil samples are taken.
• When assessing the field specific requirement for P fertiliser, farmers should consider not only the existing soil P level but calculate possible contributions from other sources of P, like organic manures and sewage sludge that are available and could be applied. Final adjustments to the amount of P fertiliser to apply are based on the actual application from other P sources.
• Improve the recycling of P within the soil – plant – animal system because P is a finite resource. There are major opportunities for recycling P in animal husbandry systems. RB 209 gives data on the “immediate” availability of P in different manures. But for fields at the critical level of P it is more important to check that, as with fertiliser P, any organic P input is maintaining the critical soil P level.
• Use all organic manures in accordance with Codes of Good Agricultural Practice, especially in relation to the time of application and amount applied. Do not apply slurry when soils are saturated with water, i.e. are at field capacity. Where slurry is to be applied maintain a good soil structure, especially at the surface, to allow rapid penetration of the slurry. On arable land tine cultivate the soil prior to slurry application or plough it in soon after application. Do not apply slurry when it is raining or rain is forecast. Avoid an unnecessary build of P in soil by applying organic manures on a rotational basis.
• Identify and quantify P transport processes and the factors that control them in both spatial and hydrological terms within a catchment to decide appropriate control methods to minimise P transfers. Soils with different properties can occur within small areas even within a field, let alone a whole catchment, making it difficult to predict water discharge and P load. It is essential to recognise that the transport of P will not be uniform over a whole catchment and that the most vulnerable areas must be identified and remedial measures concentrated in those areas.
• Do not apply P, either as fertilisers and manures, to cracking soils while the fissures remain open.
• Do not apply P, either as fertilisers or manures, to soils that are dry and hard or saturated with water when there is risk of heavy rainfall, especially in undulating terrain.

47
• Maintain a surface cover of vegetation for as much of the year as possible. The movement of soil by water is related to both the intensity of rainfall and the number of intense rainfall events, especially on bare ground.
• Maintain the structural stability of a soil by timely cultivations and by minimising traffic over the soil surface and poaching by livestock when the soil is wet. Structural stability is related to soil texture and to the calcium carbonate and organic matter content. Experimentally restricting the flow of drainage from under-drained soils has lessened the P concentration in the drain flow without decreasing yields in field experiments. Minimising drain flow from soils in areas with significant eutrophication problems might be considered. This could perhaps be done by mole draining less frequently. But before such an approach could be recommended much further work needs to be done to identify the window of opportunity for soil cultivations and drilling.
• Minimising soil erosion by water and wind is an essential step to minimising the transport of P to water. Minimising tillage operations, improving the timeliness of cultivations, maintaining soil structural stability and retaining soil surface cover by leaving crop residues on the surface are potentially useful actions to minimise the transport of P from soil. Introducing riparian zones is another approach. However, cultivations across slope rather than up and down slope to minimise soil erosion can have safety implications for those operating machinery and un-decomposed crop residues on the soil surface can interfere with subsequent drilling.
• A better understanding of the relation between forage maize yield and its requirement for P is essential. The land on which maize is grown usually receives large applications of slurry and additional amounts of P fertiliser. The rationalisation for this pattern of manuring must be understood because experimental evidence suggests that large amounts of P can be lost from soils treated in this way.
• On non-calcareous soils (i.e. soils with a pH less than 7) maintain the pH of arable soils at pH 6.5 and grassland soils at pH 6.0 to help maintain soil structural stability and yield.
• Consider the advantages/disadvantages of placing P fertilisers below the soil surface, especially on light textured arable soils. This has the possibility of improving P fertiliser use efficiency but it is not yet known whether placing P fertiliser to the side and below the crop row would allow soil to be maintained at a lower critical value than presently recommended. It would still be essential to replace the amount of P removed in the harvested crop. There could be disadvantages on heavier textured soils where, as the soil dried, invariably cracks would open up along the line that the placement tines had travelled. These cracks would allow the ingress of eroded soil and organic manures and could increase their transport to depth.
• The application of both slurry and P fertilisers should aim to maintain the appropriate level of plant-available P for the farming system and soil type. Fertilisers with their larger concentration of P and physical properties can be stored and then applied at more appropriate times than slurry.

48
ANNEX.
A1. PHOSPHORUS, ESSENTIAL NUTRIENT FOR PLANTS AND ANIMALS.
A1.1. Phosphorus and plants. Plant roots take up P from the soil solution as ortho-phosphate ions, H2PO4- and HPO42-. However, the concentration of these two ions in the soil solution is usually very small 0.01 to 0.3 mg P/L (Ozanne, 1980). This concentration is invariably too small for the roots to access sufficient P to meet the plant’s requirement to maintain its optimum growth rate when it is growing vigorously. During active growth many plants maintain between 0.3 and 0.5 % P in dry matter. To achieve this concentration the plant needs to take up from the soil solution between 0.5 and 1.0 kg P, as phosphate ions, per ha each day. But at any one time even on soils well supplied with P, the total quantity of P in the soil solution may be only between 0.3 and 3.0 kg/ha and only a small fraction of this P is available to the crop. This is because the roots are only in contact with a limited volume of soil solution, perhaps less than 25%, and the diffusive flow of P to the root is very slow. Estimates suggest that the diffusive movement of H2PO4- ions may be only 0.13 mm per day. Such estimates of the short distance that P can move in a day indicate why it is essential to have sufficient readily plant-available P throughout the soil mass explored by the roots. This ensures that the P in the soil solution near the root can be replenished frequently, often several times each day during the period of maximum P uptake.
Figure A1: Daily phosphorus uptake rate, kg P/ha, by spring barley grown on a soil with adequate P reserves (circles) and too little readily available soil P (squares). (Johnston, 2000).
Figure A1 shows the daily rate of P uptake throughout the growth of two crops of spring barley grown in an experiment where there were soils with two levels of Olsen P, the measure of readily available plant P in soil used in the UK (MAFF, 2000). These values were 100 and 5 mg P/kg, respectively, the larger concentration being much more than sufficient for all arable crops. The maximum daily rate of P uptake was 0.6 kg/ha on the soil well supplied with P but only 0.2 kg/ha on the soil with only 5 mg/kg Olsen P. This difference in the availability of soil P and its effect on P uptake was reflected in the grain yields at harvest, 6.4 and 2.9 t/ha with and without an adequate supply of P. To ensure optimum economic yields and the efficient use of P and other nutrients, the soil must contain sufficient readily available P to allow a crop to achieve the optimum daily uptake rate appropriate to the stage of growth.
49
A1.2. Phosphorus and animals. All animals require an adequate supply of P to meet their energy needs and for normal growth, especially bone formation, developing and maintaining muscles and milk supply. The more rapid the rate of growth or the larger the production of milk, the greater the requirement for P and thus the need to retain P taken in from the diet. Grazing animals tend to use P inefficiently, often more than 70% of the P intake is excreted, mainly in the dung. Where animals are housed and production needs to be optimised, as with pigs, poultry and dairy cattle brought in for milking, feeds have to be supplemented with P. These supplements are inorganic feed phosphates (IFP) or microbially derived phytases. The use of IFP, especially dicalcium phosphate (DCP), is a long established practice. The addition of phytase, usually to grain-based feedstuffs, is much more recent. In the last two decades there has been extensive research on the benefits of adding phytase, a practice that is more common with maize-based diets than with those based on wheat because wheat naturally contains endogenous phytase. Phytase is added to feedstuffs for monogastric animals to hydrolyse phytates, the naturally occurring P compounds that account for 60-80% of the P in many cereal grains. Monogastric animals themselves do not produce phytase, but bacteria in the rumen of ruminants produce this enzyme naturally and this normally completely hydrolyses phytate to inorganic phosphates and inositol.
In consequence in the UK, some 90% of pig diets, 90% of poultry layer feeds and 40% of broiler rations supplied as proprietary feeds now contain phytase. However, there is conflicting evidence as to whether phytase addition can make available all the phytate and whether the addition is as effective as adding IFP, especially readily digestible feed phosphates. There is also an issue as to the form in which phytates are used and the stage in the formulation process they are added because phytase activity decreases with increasing temperature that can arise during pelleting.
There is also an issue about inorganic feed phosphates because they can vary appreciably in their digestibility, dicalcium phosphate being less digestibly than monocalcium phosphate, which is less digestible than monosodium phosphate. A very simple scenario for West Europe illustrates the importance of the digestibility of different IFPs. At the beginning of this century in West Europe, of the total P consumption of some 4.40 Mt P2O5, about 11% was used as feed additives (Johnston and Steén, 2000). Thus very approximately some 200,000 t P was used as IFPs. Assuming 60% digestibility and retention, 80,000 t P will be excreted, but with 90% digestibility and retention only 20,000 t P would be excreted. Currently there is a cost penalty attached to using more digestible IFPs but if the increased retention and decreased environmental cost from less excreted P are considered also then there could be a good case for using the more digestible IFPs. It has also been estimated that in the EU 15 the total P in livestock manure is very approximately 1,380,000 t P of which perhaps only 50,000 t P is from IFPs, i.e. less than 4% (I. Steén, personal communication), which leads perhaps to the question whether this is worth worrying about. However, whatever small decrease in the current level of excreted P can be achieved then this must be of benefit.
In recent years, the feed supply industry has increasingly offered feedstuffs on the basis of their digestible P, rather than total P content and farmers should be encouraged to purchase the former. However, there may remain the problem of farmers who mix their own feeds. It can be argued that, in part, this is recycling P on the farm if the manure is distributed evenly around the farm, but fertiliser bought in to grow crops or non-proprietary feeds bought in will increase the amount of soil P when the manure is added to soil. In this case the build of plant-available soil P should not exceed the critical value.

50
A2. PHOSPHORUS IN THE AQUATIC ENVIRONMENT. When it is seen, the initial and most visual effect of nutrient enrichment of a surface water body is frequently the occurrence of algal blooms due to a very rapid increase in the number of algae. Such blooms decrease the clarity of the water (its transparency) and occasionally, changes in the species composition of an algal bloom can lead to the production of toxins in the water. Although nutrient enrichment can accelerate the growth of aquatic plants, shading due to decreased water transparency can both alter species diversity and lead to some plant death. Decaying algae and plants create a large oxygen demand that can lead to acute oxygen deficiency (anoxic conditions) in the water that effect both plants and fish. Fish generally benefit from nutrient enrichment but there can be undesirable changes in species composition. The presence of nitrate in water draining from agricultural soils usually increases the concentration in fresh water to levels in excess of those required by aquatic plants and animals. Under these conditions it is P that frequently becomes the limiting nutrient for growth in the aquatic, fresh water environment provided that all other nutrients are in adequate supply.
Eutrophic conditions occur worldwide and are not necessarily confined to agriculturally dominated water catchments. Catchment studies in the mid-west USA showed that P losses from unfertilised natural grasslands resulted in eutrophic conditions (Sharpley et al., 1989), while Mitchell and Prepas (1990) gave other examples of lake eutrophication in regions with undisturbed grasslands. However, many lakes fed by drainage from agricultural and/or urban environments have become nutrient enriched during the past 100 years or so. Minimising P inputs is perceived to be the easiest way to improve the quality of water adversely affected by nutrient enrichment (Anderson, 1995; Johnes et al., 1996). However, other approaches can be considered such as manipulating the numbers of fish species so that other species further down the food chain are able to control algal numbers. Where nutrient levels are maintained by the release of P from the sediment at the lake bottom it might be necessary to remove the greatly P enriched layer of sediment.
Initially the source of the P entering rivers and lakes was considered to be the effluent discharged from sewage treatment works (STWs) and this is still the case in many rural areas with smaller STWs not subject to the controls applied to larger STWs on the discharge of P in the effluent. However, even where controls were applied to larger STWs water quality was not always improved as much as was expected and attention was directed to the transfer of P from agricultural soils to rivers and lakes. As the amount of P lost from STWs has decreased, the proportion of the total P load in rivers and lakes attributable to other point sources and agriculture has increased. This does not necessarily imply that the amount of P lost from agricultural soils has increased but that it has become a significant issue and much field-based research has been done to estimate likely losses. Based on the data abstracted from a wide range of papers, and given in sections 11 and 12 of this report, the authors invariably concluded that the concentration of total P measured in the water leaving their experimental plots was large enough to cause (serious) eutrophication. Nationally the Environment Agency has recorded some 3000 lakes and reservoirs that have been affected by toxic/nuisance algal blooms (mainly blue green algae). In addition some 8% of the classified river length has been identified as affected by eutrophication.
However, the relationship between P losses in experimental plots and what happens in the larger landscape is not always clear. For example, Foy and Withers (1995) related estimates of P surpluses in Somerset and Cambridge of about 1540 and 580 kg P/ha, respectively, to the dominance of dairying in the first county and arable farming in the second. They also noted that the average P concentrations in the rivers in three regions of England and Wales
51
were: ~0.5 mg P/L in the eastern lowlands, 0.35 mg P/L in the western lowlands and < 0.1 mg P/L in the highlands. Thus the greater P surplus in the west, 95% of the total on dairy farms, than in the east, 98% of the total on cropped land, did not lead to a greater P concentration in the river water in the west. This may be due to the larger rainfall in the west and therefore greater dilution. Similarly, Cooke (1976, Table 22) gave data for the P concentration in river water in the River Ouzel (Lovat) at Caldecote, and lower downstream in the Great Ouse at Olney. Concentrations of P during the winter were less at both sampling points than during the summer when there was less water flow. Interestingly, the concentration of P in the flow declined between Caldecote and Olney, from 0.33 to 0.20 mg P/L in winter and from 1.8 to 0.5 mg P/L in summer. No reasons were given but this is an observation, which if confirmed, requires much further study.
There is an urgent need to understand better what happens to P that leaves a field in the water moving from that field so that the amount of P can be better related to the concentration in the receiving water body. It is essential to know if there is a simple dilution effect with increasing water volume in a river and then in a lake. Or if there are processes, like plant uptake or chemical reactions, which remove P as the water moves through a river system. Or if the complexity of the interacting geographical, hydrological and land use factors within a catchment still require much greater understanding. Again as already noted, Gburek et al. (2002), discussing the complexities of estimating the risk of P transfers within a catchment, showed that in the catchments they studied, the P concentration decreased by 50% downstream from the headwaters to the watershed outlet. Interestingly they found that the P concentration was more closely related to the near stream (within 60 m) distribution of highly P enriched soils than to the overall P status of the soils within the whole watershed. This suggests that near stream surface runoff and soil P status were controlling P export from the watershed.
There is no internationally agreed standard for the total P (TP) concentration in water and its trophic state, i.e. nutrient status, although those of OECD (1982) and Nurnberg (1996) are in reasonably close agreement. Nutrient-poor, oligotrophic waters contain less than 10 μg P/L, mesotrophic waters have 10-35 μg P/L, eutrophic waters have 35-100 μg P/L while hypertrophic (most P enriched) lakes have in excess of 100 μg P/L.
In surface fresh waters algal growth can begin to accelerate at 20 μg P/L and the maximum probability of a lake displaying the adverse effects of eutrophication is at about 90 μg P/L. These are very small P concentrations relative to the European Union quality standards for drinking water as set out in the Drinking Water Directive 80/778 EEC. The suggested value for P is 400 μg P2O5/L (175 μg P/L) with an upper limit of 5000 μg P2O5/L (2200 μg P/L). Whilst large amounts of P would have to be lost from soil to exceed the drinking water standard, the loss of agronomically insignificant amounts of P from soil to water will increase the P concentration to levels at which algae start to grow vigorously. For example, to reach a concentration of 90 μg P/L in the total volume of water leaving 1 ha of land in 250 mm drainage equates to a loss of only 0.22 kg P/ha. In relation to the amount of P that must be available to achieve an acceptable yield of arable crops this amount of P is miniscule. For example, 6.5 t cereal grain/ha will remove ~22 kg P/ha, i.e. 100 times more than the amount of P in 250 mm drainage that could trigger eutrophication. The 0.22 kg P/ha is also very small in relation to the amount of P being cycled annually through the soil microbial biomass. In arable soils this may be as much as 5-10 kg P/ha, in grassland soils ~25 kg P/ha.
Models have been developed, and continue to be developed, to describe the loss of P from agricultural soils (see for example McGechan, 2003). Watson and Foy (2001) note that models

52
to relate the concentration of TP in a lake to the inflow of TP, i.e. the export of P from a catchment, usually start from a relationship defined by the equation:
Plake = Pinflow/(1+√rw)
where Plake and Pinflow are the TP concentrations in μg P/L and rw is the lake water retention time, i.e. the loss of P from the aqueous phase to the sediment, in years. Watson and Foy (2001) showed the effect of having the square root of “rw” in the equation. For example, taking an inflow concentration of 100 μg TP/L, if the water retention time was 1 year this would result in a lake TP of 50 μg TP/L, but the concentration of TP in the lake only decreases to half this value, i.e. 24 μg/L, after a water retention time of 10 years.
Watson and Foy (2001) also related inflow TP concentration to the loss of P from a catchment. To do this requires knowledge of the water yield from the catchment, i.e. the difference between rainfall and water loss by evapotranspiration. They showed that for a water yield of 500 mm, a TP concentration of 100 μg/L would equate to a loss of only 0.5 kg P/ha. To maintain an oligotrophic lake (< 10 μg P/L) with the same water yield would require a TP of 20 μg/L and a catchment P export of only 0.1 kg P/ha. Again this approach shows that the P losses required to trigger eutrophication are very small relative to the amounts of P used/recycled in practical agriculture.
A3. THE BEHAVIOUR OF PHOSPHORUS IN SOIL. The chemistry of soil P is complex because it exists both as inorganic P compounds and as P within organic molecules in soil organic matter. However, in many soils, even grassland soils given mineral P fertilisers, most of the P, often more than 70%, is as inorganic P. Much data from both field and laboratory experiments even up until the 1950s-1960s appeared to support earlier views that when water-soluble phosphate in fertilisers was added to soil it was rapidly and irreversibly fixed in the upper soil horizons. This led to the belief that P could not be lost from soil in drainage water. For a number of reasons the concept of irreversible P fixation is no longer tenable for many soils. This is supported by the widespread observation that in many soils, especially those in developed countries where there has been a history of P applications, the readily plant-available P reserves have increased appreciably over time. This is so for many UK soils where plant-available P reserves are measured as Olsen P (MAFF, 2000).
Current concepts of the behaviour of P in soil envisage that added inorganic P is initially sorbed either weakly (physisorption, electrostatic forces) or strongly (chemisorption) on to charged surfaces associated with aluminium, iron or calcium complexes in soil, the extent of these different complexes depending on soil type and pH. After these initial adsorption reactions there is a further gradual absorption of the adsorbed P on sites where the P is held more strongly, i.e. with greater bonding energies. In consequence this newly adsorbed P becomes less available for uptake by plant roots at least in the short term; there is much evidence, however, that this fraction of soil P does become available again to plants as soil P reserves are depleted. These concepts of electrostatic and chemical adsorption followed by absorption involving the solid phase of the soil, make it easier to understand the time scale of P reactions in soil and why different reagents used in routine methods of soil analysis extract different amounts of P. It also explains why reserves of P in the less readily available pool of P become plant-available when there is sufficient energy to break the bonds holding the P to soil constituents.
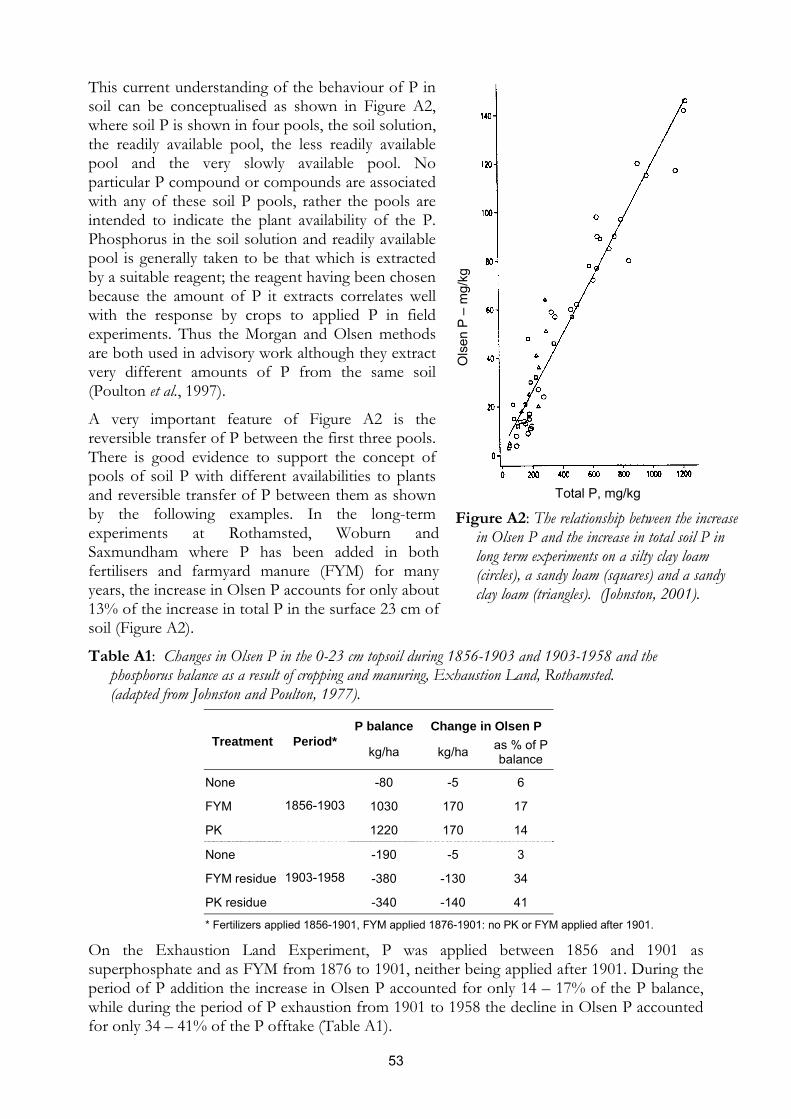
53
This current understanding of the behaviour of P in soil can be conceptualised as shown in Figure A2, where soil P is shown in four pools, the soil solution, the readily available pool, the less readily available pool and the very slowly available pool. No particular P compound or compounds are associated with any of these soil P pools, rather the pools are intended to indicate the plant availability of the P. Phosphorus in the soil solution and readily available pool is generally taken to be that which is extracted by a suitable reagent; the reagent having been chosen because the amount of P it extracts correlates well with the response by crops to applied P in field experiments. Thus the Morgan and Olsen methods are both used in advisory work although they extract very different amounts of P from the same soil (Poulton et al., 1997).
A very important feature of Figure A2 is the reversible transfer of P between the first three pools. There is good evidence to support the concept of pools of soil P with different availabilities to plants and reversible transfer of P between them as shown by the following examples. In the long-term experiments at Rothamsted, Woburn and Saxmundham where P has been added in both fertilisers and farmyard manure (FYM) for many years, the increase in Olsen P accounts for only about 13% of the increase in total P in the surface 23 cm of soil (Figure A2).
Table A1: Changes in Olsen P in the 0-23 cm topsoil during 1856-1903 and 1903-1958 and the phosphorus balance as a result of cropping and manuring, Exhaustion Land, Rothamsted. (adapted from Johnston and Poulton, 1977).
On the Exhaustion Land Experiment, P was applied between 1856 and 1901 as superphosphate and as FYM from 1876 to 1901, neither being applied after 1901. During the period of P addition the increase in Olsen P accounted for only 14 – 17% of the P balance, while during the period of P exhaustion from 1901 to 1958 the decline in Olsen P accounted for only 34 – 41% of the P offtake (Table A1).
Ols
en P
–m
g/kg
Total P, mg/kg
Figure A2: The relationship between the increase in Olsen P and the increase in total soil P in long term experiments on a silty clay loam (circles), a sandy loam (squares) and a sandy clay loam (triangles). (Johnston, 2001).
P balance Change in Olsen P Treatment Period*
kg/ha kg/ha as % of P balance
None -80 -5 6
FYM 1030 170 17
PK
1856-1903
1220 170 14
None -190 -5 3
FYM residue -380 -130 34
PK residue
1903-1958
-340 -140 41
* Fertilizers applied 1856-1901, FYM applied 1876-1901: no PK or FYM applied after 1901.

54
Table A2: Relationship between phosphorus balance and the decline in Olsen P in a sandy clay loam soil, Saxmundham. 1962-1982. (adapted from Johnston et al., 2001b).
In an experiment on the sandy clay loam soil at Saxmundham, Suffolk, soils with Olsen P ranging from 3 to 67 mg P/kg had been established on eight plots by spring 1969. During the next 16 years potatoes, sugar beet, spring barley, winter wheat and field beans were grown without any addition of P but with adequate nitrogen (N) and potassium (K). For each plot the P offtake in the harvested crop was determined annually while the Olsen P in the surface 25 cm of soil was measured in alternate years. On the most P enriched soils, the decline in Olsen P accounted for only 26-46% of the P offtake (Table A2). On soils with 21 and 28 mg/kg Olsen P, the decline in Olsen P accounted for only 12 and 21%, respectively, of the P offtake, whilst on soils with least Olsen P, the change in Olsen P was less than 10% of the P offtake.
Figure A3: The decline in Olsen P with time on a sandy clay loam growing arable crops to which no fertiliser P was applied; exponential decay curves on eight individual treatments can be brought into coincidence by appropriate horizontal shifts (Johnston, 2001).
Ols
en P
–m
g/kg
Olsen P in 1969
P removed in crops
Decrease in Olsen P
Change in Olsen P as % of crop P
mg/kg kg/ha %
3 94 8 8
7 153 12 8
21 217 27 12
28 237 50 21
39 253 65 26
44 256 78 30
54 263 87 33
67 263 120 46
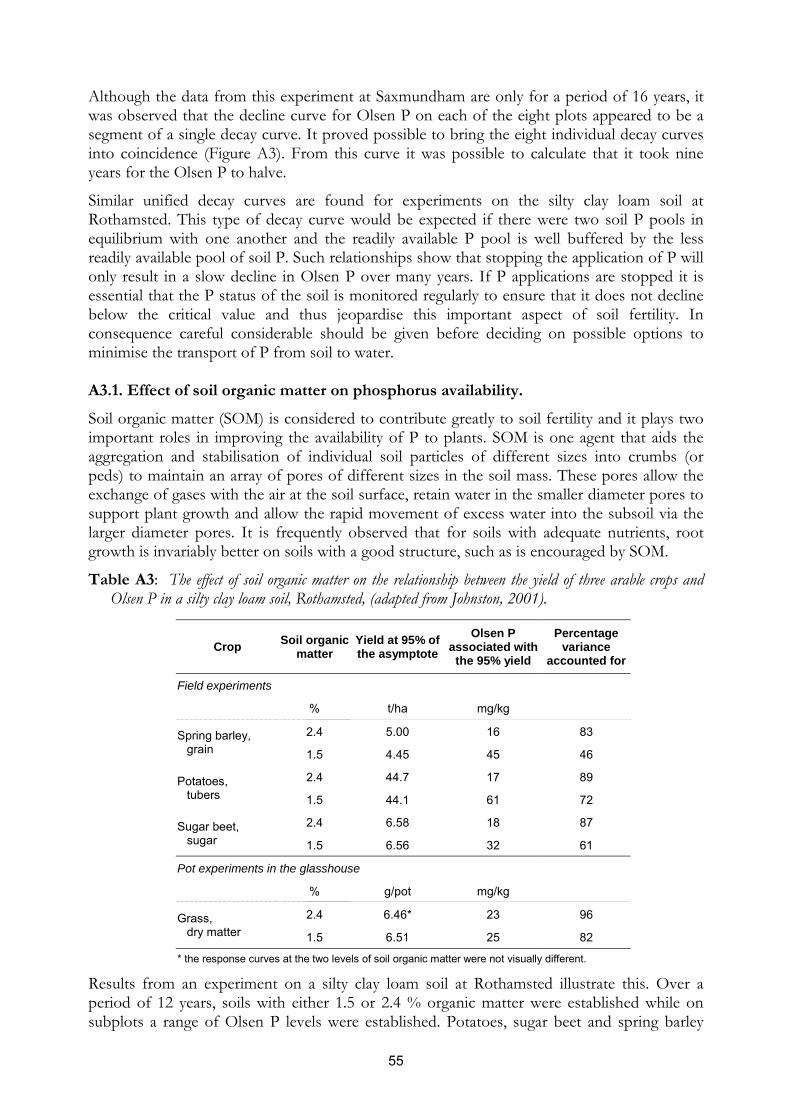
55
Although the data from this experiment at Saxmundham are only for a period of 16 years, it was observed that the decline curve for Olsen P on each of the eight plots appeared to be a segment of a single decay curve. It proved possible to bring the eight individual decay curves into coincidence (Figure A3). From this curve it was possible to calculate that it took nine years for the Olsen P to halve.
Similar unified decay curves are found for experiments on the silty clay loam soil at Rothamsted. This type of decay curve would be expected if there were two soil P pools in equilibrium with one another and the readily available P pool is well buffered by the less readily available pool of soil P. Such relationships show that stopping the application of P will only result in a slow decline in Olsen P over many years. If P applications are stopped it is essential that the P status of the soil is monitored regularly to ensure that it does not decline below the critical value and thus jeopardise this important aspect of soil fertility. In consequence careful considerable should be given before deciding on possible options to minimise the transport of P from soil to water. A3.1. Effect of soil organic matter on phosphorus availability. Soil organic matter (SOM) is considered to contribute greatly to soil fertility and it plays two important roles in improving the availability of P to plants. SOM is one agent that aids the aggregation and stabilisation of individual soil particles of different sizes into crumbs (or peds) to maintain an array of pores of different sizes in the soil mass. These pores allow the exchange of gases with the air at the soil surface, retain water in the smaller diameter pores to support plant growth and allow the rapid movement of excess water into the subsoil via the larger diameter pores. It is frequently observed that for soils with adequate nutrients, root growth is invariably better on soils with a good structure, such as is encouraged by SOM.
Table A3: The effect of soil organic matter on the relationship between the yield of three arable crops and Olsen P in a silty clay loam soil, Rothamsted, (adapted from Johnston, 2001).
Results from an experiment on a silty clay loam soil at Rothamsted illustrate this. Over a period of 12 years, soils with either 1.5 or 2.4 % organic matter were established while on subplots a range of Olsen P levels were established. Potatoes, sugar beet and spring barley
Crop Soil organic matter
Yield at 95% of the asymptote
Olsen P associated with the 95% yield
Percentage variance
accounted for
Field experiments
% t/ha mg/kg
2.4 5.00 16 83 Spring barley, grain 1.5 4.45 45 46
2.4 44.7 17 89 Potatoes, tubers 1.5 44.1 61 72
2.4 6.58 18 87 Sugar beet, sugar 1.5 6.56 32 61
Pot experiments in the glasshouse
% g/pot mg/kg
2.4 6.46* 23 96 Grass, dry matter 1.5 6.51 25 82
* the response curves at the two levels of soil organic matter were not visually different.

56
were grown in rotation and given adequate N and K. Yields were plotted against Olsen P and the yield at 95% of the asymptote and its associated Olsen P value were estimated (Table A3). Although the asymptotic yields were sometimes similar the Olsen P value associated with the asymptotic yield was always appreciably smaller on the soil with more organic matter. That this benefit was due to the effect of SOM on soil structure was shown when all 48 soils were sampled, sieved through a 2 mm sieve and then cropped with ryegrass in pots in the glasshouse. Table A3 shows that for both soils the asymptotic yield and its associated Olsen P value was the same, i.e. in the field experiment the poorer structure of the soil with the smaller amount of SOM impaired root growth and thus P uptake where there was less Olsen P. However, it should be noted that there may be a “conflict of interest” in the organic matter story. Although improved soil structure aids better root growth, it is mineralisation of SOM in autumn that produces much of the nitrate in soil at that time, when nitrate is most at risk to loss from soil by various pathways.
Soil organic matter also provides sites with low bonding energies for P, including P applied in fertilisers. Table A4 shows total, Olsen and CaCl2 P in soils from long-term experiments with different amounts of SOM due to the addition of fertilisers and farmyard manure (FYM). The CaCl2 solution was 0.01 M, which is about the ionic strength of the soil solution in soils with pH about 7. Thus 0.01 M CaCl2 will extract from the soil both the P that is in the soil solution and about the amount of P that will be released to the soil solution in the short-term from the readily available pool of P. Thus 0.01 M CaCl2 P is a measure of very readily available P and the amount is always much less than the amount of Olsen P.
Table A4 shows that the increase in both the total and Olsen P were very similar where both superphosphate and FYM had been added. The increase in CaCl2 P was, however, proportionally much larger on FYM treated soils, with more SOM, than on superphosphate treated soils. Interestingly only one experiment (Barnfield) had a plot that received both superphosphate and FYM. For this combined treatment the increase in total and Olsen P was equal to the sum of the separate increases; but the increase in CaCl2 P was greater than the sum of the individual increases suggesting that some of the P applied in superphosphate was being held on low energy bonding sites on the extra SOM derived from FYM.
The Exhaustion Land and Woburn experiments (Table A4) provide additional evidence of the effect of SOM on CaCl2 P. In the Exhaustion Land experiment, on plots that had superphosphate applied from 1856 to 1901, the top 23 cm soil contained 0.80% carbon (C) in 1903. The soil on plots that had FYM annually (35 t/ha) from 1876 to 1901 contained 1.45% C in 1903, appreciably more SOM than in the superphosphate treated soils. In 1903, the increases in total and Olsen P were very similar in both soils and, as on Barnfield, Broadbalk and Hoosfield, there was more CaCl2 P in the FYM treated soil (not shown). No more superphosphate or FYM were applied after 1901 and by 1974 much of the extra SOM in the ex-FYM treated soil had mineralised. In consequence, the previously superphosphate and FYM treated soils now contained 0.88 and 1.10% C, respectively. Table A4 shows that in 1974 there was very little difference in the CaCl2 P content of these two soils now that they had a similar SOM content and presumably about the same number of low energy bonding sites.
In the Woburn Market Garden experiment started in 1942, all the plots received the same small amount of superphosphate in addition to the organic manure being tested. The sewage sludge treatment added much more organic matter and P (Table A4) than did the FYM so the increase in total P in the soil was larger but the increase in Olsen and CaCl2 P was less than on the FYM plot (Table A4). The raw sewage had been anaerobically digested leaving very little
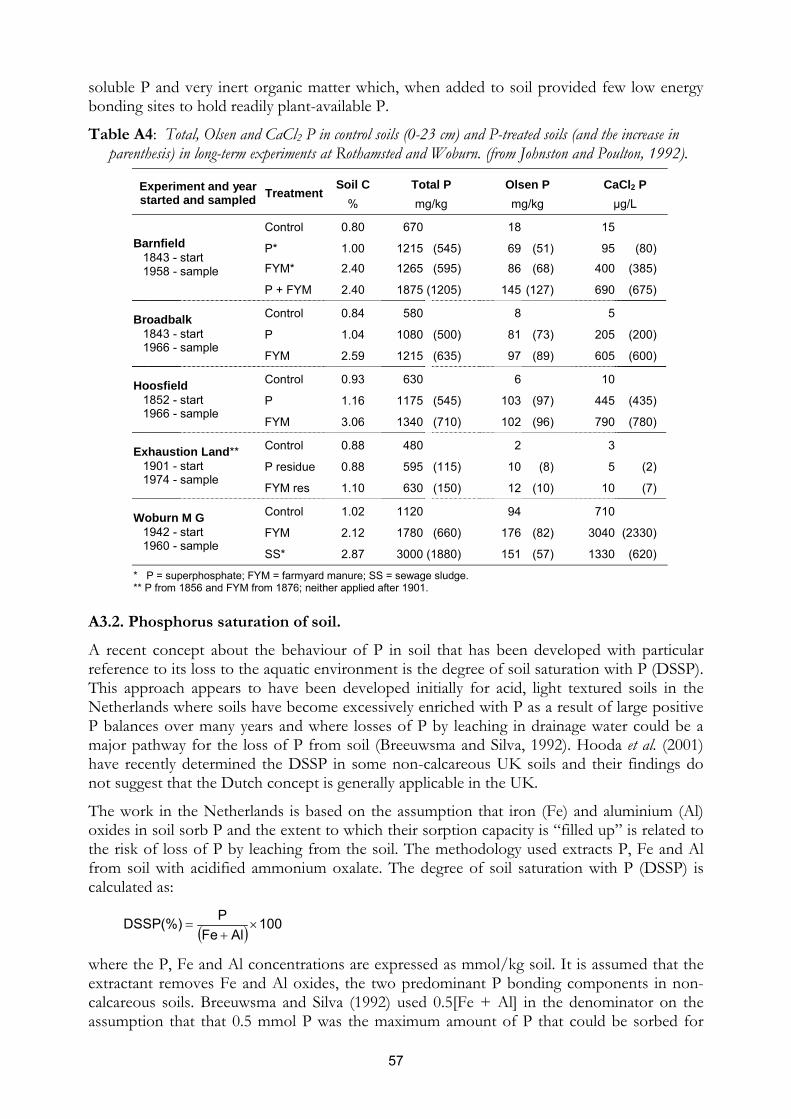
57
soluble P and very inert organic matter which, when added to soil provided few low energy bonding sites to hold readily plant-available P.
Table A4: Total, Olsen and CaCl2 P in control soils (0-23 cm) and P-treated soils (and the increase in parenthesis) in long-term experiments at Rothamsted and Woburn. (from Johnston and Poulton, 1992).
A3.2. Phosphorus saturation of soil. A recent concept about the behaviour of P in soil that has been developed with particular reference to its loss to the aquatic environment is the degree of soil saturation with P (DSSP). This approach appears to have been developed initially for acid, light textured soils in the Netherlands where soils have become excessively enriched with P as a result of large positive P balances over many years and where losses of P by leaching in drainage water could be a major pathway for the loss of P from soil (Breeuwsma and Silva, 1992). Hooda et al. (2001) have recently determined the DSSP in some non-calcareous UK soils and their findings do not suggest that the Dutch concept is generally applicable in the UK.
The work in the Netherlands is based on the assumption that iron (Fe) and aluminium (Al) oxides in soil sorb P and the extent to which their sorption capacity is “filled up” is related to the risk of loss of P by leaching from the soil. The methodology used extracts P, Fe and Al from soil with acidified ammonium oxalate. The degree of soil saturation with P (DSSP) is calculated as:
( ) 100AlFe
P(%)DSSP ×+
=
where the P, Fe and Al concentrations are expressed as mmol/kg soil. It is assumed that the extractant removes Fe and Al oxides, the two predominant P bonding components in non-calcareous soils. Breeuwsma and Silva (1992) used 0.5[Fe + Al] in the denominator on the assumption that that 0.5 mmol P was the maximum amount of P that could be sorbed for
Soil C Total P Olsen P CaCl2 P Experiment and year started and sampled Treatment
% mg/kg mg/kg μg/L
Control 0.80 670 18 15
P* 1.00 1215 (545) 69 (51) 95 (80)
FYM* 2.40 1265 (595) 86 (68) 400 (385)
Barnfield 1843 - start 1958 - sample
P + FYM 2.40 1875 (1205) 145 (127) 690 (675)
Control 0.84 580 8 5
P 1.04 1080 (500) 81 (73) 205 (200) Broadbalk
1843 - start 1966 - sample
FYM 2.59 1215 (635) 97 (89) 605 (600)
Control 0.93 630 6 10
P 1.16 1175 (545) 103 (97) 445 (435) Hoosfield
1852 - start 1966 - sample
FYM 3.06 1340 (710) 102 (96) 790 (780)
Control 0.88 480 2 3
P residue 0.88 595 (115) 10 (8) 5 (2) Exhaustion Land**
1901 - start 1974 - sample
FYM res 1.10 630 (150) 12 (10) 10 (7)
Control 1.02 1120 94 710
FYM 2.12 1780 (660) 176 (82) 3040 (2330) Woburn M G
1942 - start 1960 - sample
SS* 2.87 3000 (1880) 151 (57) 1330 (620)
* P = superphosphate; FYM = farmyard manure; SS = sewage sludge. ** P from 1856 and FYM from 1876; neither applied after 1901.

58
each mmol of [Fe + Al] for a maximum acceptable soil solution concentration of 0.1 mg P/L. Hooda et al. (2001) decided, however, not to apply this arbitrary factor because they considered that if a factor were necessary it should be determined for each individual situation.
Hooda et al. (2001) determined, among other soil parameters, the DSSP for soils from sites/experiments where there were either two (4 sites) or three (6 sites) levels of P inputs over periods of 4 to 50 years and where pHwater ranged from 5.2 to 6.7, i.e. all soils were non-calcareous. The DSSP of soils that had received large P inputs ranged from 5.2% up to less than 20%, with one exception where it was 42%; these values were significantly larger than the range, 3.3 to 16% (with one exception of about 22%) for the control or low P input soils, i.e. there had been an increase in the “P saturation” in these P treated, non calcareous soils. Breeuwsma and Silva (1992) suggested that a DSSP value of 25% is the critical limit above which the potential for P movement into surface and ground waters becomes unacceptable. Only at one of the ten UK sites studied by Hooda et al. (2001) was the DSSP value above this limit. Here large annual P inputs (287 kg P/ha) over a short period (4 years) had resulted in the large %DSSP. On the other nine sites, P manuring and fertilisation practices were comparable to some of those in common use in European and North American agriculture. Hooda et al. (2001) computed that on four of the sites where soils had a relatively small P retention capacity (as determined by their content of Fe and Al oxides) and a large P surplus, the 25% DSSP limit would be reached within 10-30 years if P surpluses were not decreased. On the other five soils with a relative large P retention capacity and a moderate P surplus, it would take 90-150 years to reach the 25% DSSP limit.
Hooda et al. (2001) were able to relate % DSSP for the soils they studied to Olsen P and a linear relationship, which accounted for 95% of the variance, suggested that, on average, the 25% DSSP was reached at 85 mg/kg Olsen P. This Olsen P value is well above the 25 mg/kg (top of P Index 2) currently recommended for optimum production from arable and grassland in England and Wales. This suggests that the DSSP level at which P leaching losses become unacceptable would not be exceeded if farmers follow current recommendations for maintenance P applications (MAFF, 2000) that seek to maintain about 25 mg/kg Olsen P. While it is probable that all soils can become “saturated” with P it is unlikely that the methodology used by Hooda et al. (2000) to estimate “P saturation” would be applicable to calcareous soils where calcium phosphates, rather than Fe and Al phosphates, are likely to be precipitated with excess P residues.
A4. SOIL PHOSPHORUS AND NITROGEN USE EFFICIENCY. There must be real concern about the efficiency with which other nutrients and inputs are used when there is too little soil P to achieve optimum yields. This is especially so for N. Table A5 shows the yields of spring barley grown on soils with different, but only small amounts of Olsen P and given increasing amounts of fertiliser N. On the soil with least Olsen P it was not justified, in terms of yield, to apply more than 48 kg N/ha while on the two soils with more but still too little Olsen P, 96 kg N/ha was optimum for yield. When calculated by the difference method (see Annex Section 5 for the method of calculation), Table A5 also shows just how much of each N application was not accounted for at harvest, 63 to 84 kg N from the 96 kg N application and 107 to 127 kg N/ha from the 144 kg N application. Such large quantities are a financial loss to the farmer and could have an adverse environmental impact if the N not accounted for was lost from the soil pool of nitrate-N by leaching or by denitrification to nitrous oxide, a greenhouse gas.

59
Table A5: Yields of spring barley, nitrogen in grain plus straw and nitrogen not accounted for when barley was grown on soils with small concentrations of Olsen P and given different amounts of fertiliser nitrogen, 1976-1985. (adapted from Johnston, 2000).
There is much evidence from long-term experiments to show that yields can be maintained or decline only slowly over a number of years when P is not applied to soils even with only quite small amounts of Olsen P. This is because P is released from the less readily available reserves, which is not measured by soil analysis. However, as the rate of release of P from these reserves declines, crop response to N and the efficiency with which the N is used declines also. An example of this is in Table A6.
Table A6: Effect applying fertiliser nitrogen to spring barley when no phosphorus is applied. (adapted from Johnston, 2000).
This shows how the yields of spring barley have changed over a 30-year period on a soil initially with 12 mg/kg Olsen P in 1970 and without fresh P since then. It was never justified to apply more than 96 kg N/ha in any of the three periods shown. Although the Olsen P had declined only a little by 1999, as the net result of P taken up by the crop and the release of P from the less readily available pool of soil P, the smaller amount of Olsen P resulted in an average grain yield of 4.21 t/ha in 1996-1999 compared to 5.27 t/ha in 1970-1973 when 96 kg N/ha were applied. The smaller yield in the latter period would have left a larger residue of N unaccounted for than in the first period.
Olsen P N applied, kg/ha Plot
mg/kg 0 48 96 144
Grain yield, t/ha
1 2 0.86 1.20 1.32 1.49
2 7 1.65 2.33 2.87 2.96
3 10 2.19 3.28 3.79 3.61
Nitrogen in grain plus straw, kg/ha
1 2 16 24 28 33
2 7 29 44 56 62
3 10 38 55 71 75
Fertilizer N not accounted for*, kg/ha
1 2 40 84 127
2 7 33 69 111
3 10 31 63 107
* Calculated by the difference method.
Nitrogen applied, kg/ha Period 48 96 144
Grain yield, t/ha
1970-73 3.21 5.27 4.94
1984-87 3.76 4.81 5.05
1996-99 3.18 4.21 3.88
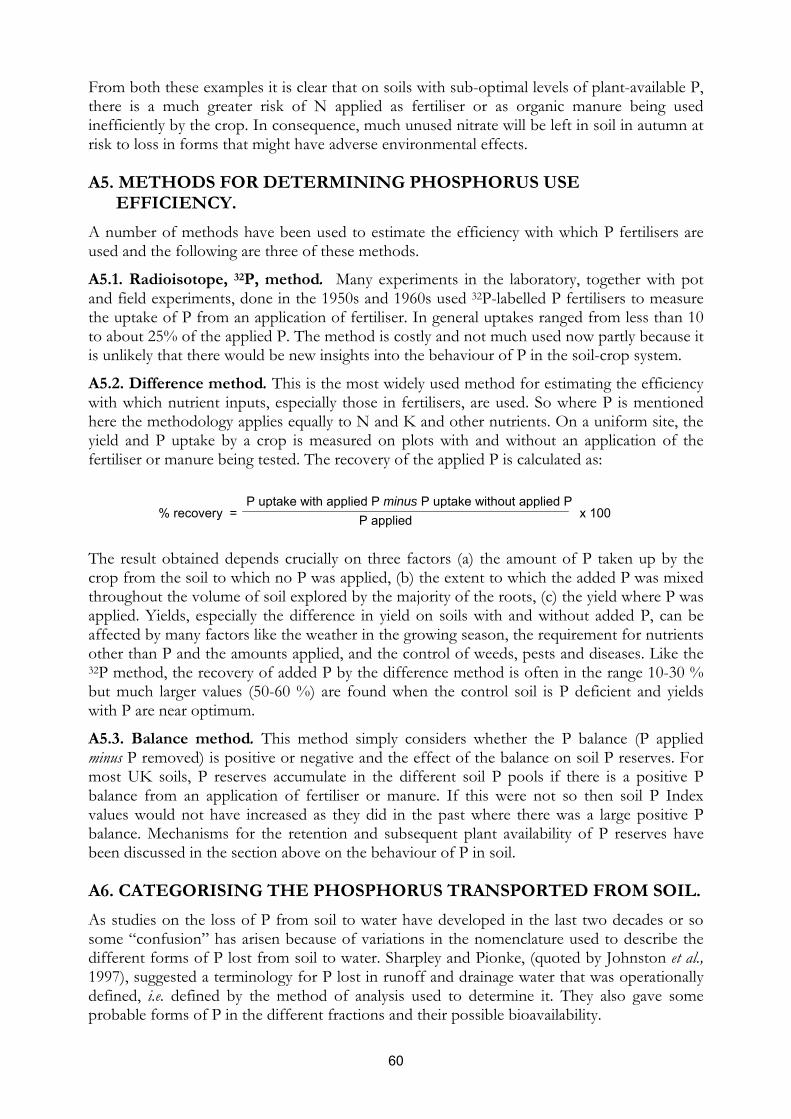
60
From both these examples it is clear that on soils with sub-optimal levels of plant-available P, there is a much greater risk of N applied as fertiliser or as organic manure being used inefficiently by the crop. In consequence, much unused nitrate will be left in soil in autumn at risk to loss in forms that might have adverse environmental effects.
A5. METHODS FOR DETERMINING PHOSPHORUS USE EFFICIENCY.
A number of methods have been used to estimate the efficiency with which P fertilisers are used and the following are three of these methods.
A5.1. Radioisotope, 32P, method. Many experiments in the laboratory, together with pot and field experiments, done in the 1950s and 1960s used 32P-labelled P fertilisers to measure the uptake of P from an application of fertiliser. In general uptakes ranged from less than 10 to about 25% of the applied P. The method is costly and not much used now partly because it is unlikely that there would be new insights into the behaviour of P in the soil-crop system.
A5.2. Difference method. This is the most widely used method for estimating the efficiency with which nutrient inputs, especially those in fertilisers, are used. So where P is mentioned here the methodology applies equally to N and K and other nutrients. On a uniform site, the yield and P uptake by a crop is measured on plots with and without an application of the fertiliser or manure being tested. The recovery of the applied P is calculated as:
The result obtained depends crucially on three factors (a) the amount of P taken up by the crop from the soil to which no P was applied, (b) the extent to which the added P was mixed throughout the volume of soil explored by the majority of the roots, (c) the yield where P was applied. Yields, especially the difference in yield on soils with and without added P, can be affected by many factors like the weather in the growing season, the requirement for nutrients other than P and the amounts applied, and the control of weeds, pests and diseases. Like the 32P method, the recovery of added P by the difference method is often in the range 10-30 % but much larger values (50-60 %) are found when the control soil is P deficient and yields with P are near optimum.
A5.3. Balance method. This method simply considers whether the P balance (P applied minus P removed) is positive or negative and the effect of the balance on soil P reserves. For most UK soils, P reserves accumulate in the different soil P pools if there is a positive P balance from an application of fertiliser or manure. If this were not so then soil P Index values would not have increased as they did in the past where there was a large positive P balance. Mechanisms for the retention and subsequent plant availability of P reserves have been discussed in the section above on the behaviour of P in soil.
A6. CATEGORISING THE PHOSPHORUS TRANSPORTED FROM SOIL. As studies on the loss of P from soil to water have developed in the last two decades or so some “confusion” has arisen because of variations in the nomenclature used to describe the different forms of P lost from soil to water. Sharpley and Pionke, (quoted by Johnston et al., 1997), suggested a terminology for P lost in runoff and drainage water that was operationally defined, i.e. defined by the method of analysis used to determine it. They also gave some probable forms of P in the different fractions and their possible bioavailability.
P uptake with applied P minus P uptake without applied PP applied% recovery = x 100

61
Later, Haygarth et al. (1998b) also gave an operationally defined fractionation for P forms in soil water and subsequently Haygarth and Sharpley (2000) slightly modified the descriptors but not the methodology used in the analysis of water samples. Table A7 gives the suggested new classification, which gives the filter size (in parentheses) used to separate “dissolved” (<0.45 μm) P in the sample. The suffix “unf” implies that the sample was not filtered before analysis and, therefore, contains both dissolved and particulate P. As a 0.45 μm cellulose nitrate-acetate filter is most frequently used the authors suggest that the size of the filter in μm does not need to be shown unless a different sized filter is used.
The methodology used is simple, namely using the molybdenum-blue (Mo-blue) method (Murphy and Riley, 1962) to determine P in the filtered and unfiltered solution with or without prior digestion with a suitable reagent. It is assumed that only inorganic P is determined by the Mo-blue method, the digestion converts organic P both in solution and particulate material to inorganic P to estimate total P in the solution.
Table A7: Phosphorus forms in water, (adapted from Haygarth and Sharpley, 2000).
New classification* Nomenclature used previously
1. Operationally defined by analysis of the untreated solution;
i) RP<0.45 Reactive P in the filtered solution.
Molybdate reactive P, MRP; Dissolved reactive P, DRP; Soluble reactive P, SRP; Dissolved molybdate reactive P; Orthophosphate; Inorganic P; Phosphate.
ii) RPunf Reactive P in the unfiltered solution.
Total reactive P.
2. Operationally defined by analysis of the digested solution:
iii) TP<0.45 Total P in the filtered digest.
Total dissolved P, TDP.
iv) TPunf Total P in the unfiltered digest.
Total P in a raw unfiltered sample, TP.
3. Fractions calculated using the four fractions above:
v) UP<0.45 = TP<0.45 - RP<0.45 Dissolved organic P, DOP; Soluble organic P, SOP; Dissolved unreactive P, DNRP.
vi) RP>0.45 = RPunf - RP<0.45 Molybdate reactive particulate P, MRPP; Particulate reactive P.
vii) TP>0.45 = TPunf - TP<0.45 Particulate P.
viii) UP>0.45 = TP>0.45 - RP>0.45
* the symbols used are as follows: RP = reactive P; UP = unreactive P; TP = total P.

62
A7. PATHWAYS OF WATER MOVEMENT IN AGRICULTURAL SOILS. Apart from P in soil eroded from the banks of rivers, the P transported from agricultural soils and delivered to lakes via streams and rivers must be carried in water except when soil is eroded by wind. Water flow from land is that part of precipitation that falls on land and ultimately appears in streams, rivers and lakes and can be partitioned between:
i) surface runoff, is water flowing over the land surface to streams;
ii) subsurface runoff, or storm seepage, is water that infiltrates the surface soil and moves towards streams above the main groundwater level as ephemeral, or shallow groundwater;
iii) ground water runoff or base runoff is precipitation that passes through the soil horizons until it either enters the groundwater or meets impervious strata. In the latter case the water flows sideways until eventually it is discharged at a spring or as seepage.
Water passing from the soil by all three hydrological pathways has the potential to entrain and retain P and transport it from the soil either at the soil profile scale or the slope/field scale.
A7.1. Soil profile scale. Across the whole range of soil textures the proportion of solid particles varies from ~40 to 50% but the size of the particles can range from clay to sand and they can be aggregated to form crumbs or peds. The remaining volume consists of pores or voids occupied by air or water, both of which are essential for roots to function properly. The number, size and distribution of the pores are related to the proportion of sand, silt and clay and the degree to which these mineral particles are aggregated into structural units (soil crumbs). There are two modes of flow at the soil profile scale.
i) Preferential, bypass or macropore flow (Thomas and Phillips, 1979) is the rapid transfer of water through larger, continuous pores or fissures and through root channels and animal burrows, macropores. Both larger fissures and macropores can increase the infiltration capacity of a soil by one or two orders of magnitude compared to matrix flow (Burt et al., 1996).
ii) Matrix flow or saturated/piston flow refers to the uniform movement of water through the soil once the soil pores are saturated; this type of flow is frequently found in sandy soils. Depending on the rate of flow, P may be adsorbed onto soil particles in the subsoil as seen in the Woburn long-term experiments (Johnston, 1975).
Preferential flow via fissures is important in soils subject to cracking due to shrinkage during dry weather, e.g. heavy textured, clayey soils, but the cracks tend to close on rewetting. On the other hand, macropores, like earthworm burrows, tend to function year round. Preferential flow can also occur parallel to the surface, laterally, as well as vertically. Crop productivity on many heavy textured soils has been improved by installing artificial drainage, usually tiles with permeable backfill together with mole drains and sub-soiling. Naturally occurring fissures and macropores feeding into such drainage systems quickly remove water and any soil it contains to field ditches and hence to rivers and lakes. Preferential flow may be effective in transporting P downwards from the surface of both grassland and arable land. This suggests that manures and fertilisers should not be applied to cracking soils while the fissures remain open.

63
A7.2. Slope/field scale.
The pathways at this scale are the link between the soil profile scale and the catchment/watershed scale via ditches and streams. Water can move to the ditch by overland or surface flow or by interflow or “through flow”, (for example at the interface of the plough layer and subsoil) or at an impermeable layer, like underlying impervious rock. Significant amounts of P can be transported by overland flow, especially in eroded material, when rain falls on saturated soil. Adding 32P to the soil surface on simulated slopes showed that the top few centimetres of soil play a critical role in the generation of P in runoff (Ahuja et al., 1981).
Some parts of a watershed are more likely to contribute water flow than others (Gburek and Sharpley, 1998) depending on the role of hill slope morphology in controlling water flow pathways. The P content of the water will depend on its availability in or on the soil from which the water comes. Such critical source areas for P (Pionke et al., 1997) are related to land use (Gburek et al., 1996). For example, fields to which large amounts of manure have been applied or with soil P concentrations that exceed the critical level. Overland flow depends on soil moisture status, related to the interval between rainfall events, rainfall duration, magnitude and intensity. As noted previously, rainfall intensity is important because it provides the energy to detach soil particles and the amount of rainfall and hence the amount of runoff controls the transport of this detached material.
Interflow or through flow tends to be parallel to the slope and the rate at which water is removed from the soil may be increased by artificial drainage systems. The rate of water movement through the different soil layers will affect the amount of P transported. Return flow occurs where subsurface flow emerges at the soil surface.
Haygarth et al. (2000) noted that “spatial and temporal variability in water movement along hydrological pathways are difficult to define and describe ……If advances are to made in quantifying and controlling PT (phosphorus transport) from diffuse agronomic sources, interpretations of PT processes must always be quantified and defined in these spatial and hydrological terms.”

REFERENCES. Ahuja, L.R., Sharpley, A.N., Yamamoto, M. and Menzel, R.G. (1981) The depth of rainfall-
runoff interaction as determined by 32P. Water Resources Research 17, 969-974. Anderson, N.J. (1995) Naturally eutrophic lakes: reality, myth or myopia? Trends in Ecology and
Evolution 10, 137-138. Berman, T. (1969) Phosphatase release of inorganic phosphorus in Lake Kinnerett. Nature
224, 1231-1232. Breeuwsma, A. and Silva, S. (1992) Phosphorus fertilization and environmental effects in the Netherlands
and Po region (Italy). Report No. 57. Agricultural Research Department, Wageningen, The Netherlands.
Boorman, D.B., Hollis, J.M. and Lilly, A. (1995) Hydrology of soil types: A hydrologically-based classification of the soils of the United Kingdom. Institute of Hydrology, Natural Environment Research Council, Wallingford, UK.
Burnhill, P., Chalmers, A. and Fairgreive, J. (1993) British Survey of Fertiliser Practice: Fertiliser Use on Farm Crops, 1993. HMSO, London.
Burt, T.P., Heathwaite, A.L. and Johnes, P.J. (1996) Stream water quality and nutrient export in the Slapton catchment. Field Studies 8, 613-627.
Catt, J.A., Harris, G.L. and Mason, D.J. (1995) Effects of drainflow restriction on losses of nitrate, phosphate and pesticides in the Brimstone Farm Leaching Experiment, Oxfordshire. In: New Horizons, New Challenges. Agricultural and Biological Engineering Conference, 20-23 September 1995, Papers and Abstracts, pp 83-84.
Catt, J.A., Howse, K.R., Farina, R., Brockie, D., Todd, A., Chambers, B.J., Hodgkinson, R., Harris, G.L. and Quinton, J.N. (1998) Phosphorus losses from arable land in England. Soil Use and Management 14, 168-174.
Chalmers, A.G., Renwick, A.W., Johnston, A.E. and Dawson, C.J. (1999) Design, development and use of a national survey of fertiliser applications. Proceedings No. 437. The International Fertiliser Society, York, UK. 42 pp.
Cooke, G.W. (1976) A review of the effects of agriculture on the chemical composition and quality of surface and underground waters. In: Agriculture and Water Quality. MAFF Technical Bulletin 32. HMSO, London. pp 5-57.
Crowther, E.M. (1945) Fertilizers during the war and after. Pamphlet No. 13, Bath and West and Southern Counties Society, Bath, UK 55 pp.
Defra (2005) Agricultural Census Statistics, England June 2005. Defra web site: http://statistics.defra.gov.uk/esg/statnot/june_eng.pdf. 25 October 2005.
Edwards, A.C. and Withers, P.J.A. (1998) Soil phosphorus management and water quality: a UK perspective. Soil Use and Management 14, 124-130.
FMA (1994) Fertiliser Statistics 1993 In: Fertiliser Review 1993. Fertiliser Manufacturers Association, Peterborough, UK.
Foy, R.H. and Withers, P.J.A. (1995) The contribution of agricultural phosphorus to eutrophication. Proceedings No. 365. The International Fertiliser Society, York, UK.
Gburek, W.J. and Sharpley, A.N. (1998) Hydrologic controls on phosphorus loss from upland agricultural catchments. Journal of Environmental Quality 27, 267-277.
Gburek, W.J., Sharpley, A.N. and Pionke, H.B. (1996) Identification of critical source areas for phosphorus export from agricultural watersheds. In: Anderson, M.G. and Brooks S.M. (eds) Advances in Hillslope Processes Vol. 1, 263-282. Wiley, New York.

65
Gburek, W.J., Sharpley, A.N., Heathwaite, A.L. and Folmar, G.J. (2002) Phosphorus management at the watershed scale: A modification of the phosphorus Index. Journal of Environmental Quality 29, 130-144.
Goodlass, G. and Allin, R. (2004). British Survey of Fertiliser Practice: Fertiliser Use on Farm Crops, 2003. ISBN 1 86190 127 5.
Goodlass, G and Welch, W. (2005). British Survey of Fertiliser Practice: Fertiliser Use on Farm Crops, 2004. ISBN 1 86190 128 3.
Glendinning, M.J., Powlson, D.S., Poulton, P.R., Bradbury, N.J., Palazzo, D. and Li, X. (1996) The effects of long-term applications of inorganic nitrogen fertilizer on soil nitrogen in the Broadbalk Wheat Experiment. Journal of Agricultural Science, Cambridge 127, 347-363.
Haygarth, P.M. and Jarvis, S.C. (1999) Transfer of phosphorus from agricultural soils. Advances in Agronomy 66, 195-249.
Haygarth, P.M. and Sharpley, A.N. (2000) Terminology for phosphorus transfer. Journal of Environmental Quality 29,10-15.
Haygarth, P.M., Chapman, P.J., Jarvis, S.C. and Smith R.V. (1998a) Phosphorus budgets for two contrasting grassland farming systems in the UK. Soil Use and Management 14, 160-167.
Haygarth, P.M., Hepworth, L. and Jarvis, S.C. (1998b) Forms of phosphorus transfer in hydrological pathways from soil under grazed grassland. European Journal of Soil Science 49, 65-72.
Haygarth, P.M., Heathwaite, A.L., Jarvis, S.C. and Harrod, T.R. (2000) Hydrological factors for phosphorus transfer from agricultural soils. Advances in Agronomy 69, 153-178.
Heathwaite, A.L. (1995) Sources of eutrophication: Hydrological pathways of catchment nutrient export. International Association of Hydrological Science 230, 161-176.
Heathwaite, A.L., Sharpley, A.N. and Gburek, W. (2000) A conceptual approach for integrating phosphorus and nitrogen management at watershed scales. Journal of Environmental Quality 29, 158-166.
Heckrath, G., Brookes, P.C., Poulton, P.R. and Goulding, K.W.T. (1995) Phosphorus leaching from soils containing different phosphorus concentrations in the Broadbalk experiment. Journal of Environmental Quality 24, 904-910.
Hesse, P.R. (1973) Phosphorus in lake sediments. In: Griffith, E.J. et al. (eds) Environmental Phosphorus Handbook. Wiley, New York. pp 585-611.
Hooda, P.S., Truesdale, V.W., Edwards, A.C., Withers, P.J.A., Aitken, M.N., Miller, A. and Rendell, A.R. (2001) Manuring and fertilization effects on phosphorus accumulation in soils and potential environmental implications. Advances in Environmental Research 5, 13-21.
Jenkins, S.H. and Lockett, W.T. (1943) Losses of P during sewage purification. Nature 151, 306-307.
Johnes, P., Moss, B. and Phillips, G. (1996) The determination of total nitrogen load and total phosphorus concentrations in fresh water from land use, stock headage and population data: Testing a model for use in conservation and water quality management. Freshwater Biology 36, 451-473.
Johnston, A.E. (1975) The Woburn Market Garden Experiment, 1942-69. II. The effects of the treatments on soil pH, soil carbon, nitrogen, phosphorus and potassium. Rothamsted Experimental Station Report for 1974, Part 2, 102-131.

66
Johnston, A.E. (1989) Phosphorus cycling in intensive arable agriculture. In: Tiessen, H.H. (ed) Phosphorus Cycles in Terrestrial and Aquatic Ecosystems. Regional Workshop 1: Europe. Proceedings SCOPE/ICSU Workshop pp 123-136. Saskatchewan Institute of Pedology, Saskatoon, Canada.
Johnston, A.E. (1993) Nitrophosphates and their use in agriculture – a historical review. In: Lee, R.G. (ed) Nitric acid-based Fertilizers and the Environment. International Fertilizer Development Center, Muscle Shoals, Alabama, USA. 37-48
Johnston, A.E. (1994) The Rothamsted Classical Experiments. In: Leigh, R.A. and Johnston, A.E. (eds) Long-term Experiments in Agricultural and Ecological Sciences. CAB International, Wallingford, UK. 9-37.
Johnston, A.E. (2000) Soil and Plant Phosphate. International Fertilizer Industry Association, Paris. 46pp.
Johnston, A.E. (2001) Principles of crop nutrition for sustainable food production. Proceedings No. 459. The International Fertiliser Society, York, UK. 39pp.
Johnston, A.E. and Poulton, P.R. (1977) Yields on the Exhaustion Land and changes in the NPK content of the soils due to cropping and manuring, 1852-1975. Rothamsted Experimental Station Report for 1976, Part 2, 53-85.
Johnston, A.E. and Poulton, P.R. (1992) The role of phosphorus in crop production and soil fertility: 150 years of field experiments at Rothamsted, United Kingdom. In: Schultz, J.J. (ed). Phosphate Fertilizers and the Environment. International Fertilizer Development Centre, Muscle Shoals, USA. 45-64.
Johnston, A.E., Tunney, H. and Foy, R.H. (1997) Phosphorus loss from agriculture to water: synthesis and summary. In: Tunney, H., Carton, O.T., Brookes, P.C. and Johnston, A.E. (eds) Phosphorus Loss from Soil to Water. CAB International, Wallingford, UK. 455-461.
Johnston A.E. and Steén, I. (2000) Understanding Phosphorus and its use in Agriculture. European Fertilizer Manufacturers Association, Brussels. 36pp.
Johnston, A.E., Poulton, P.R., Dawson, C.J. and Crawley, M.J. (2001a) Inputs of Nutrients and Lime for the Maintenance of Fertility of Grassland Soils. Proceedings No 486, The International Fertiliser Society, York, UK. 40pp.
Johnston, A.E., Poulton, P.R. and Syers, J.K. (2001b) Phosphorus, Potassium and Sulphur Cycles in Agricultural Soils. Proceedings No. 465, The International Fertiliser Society, York, UK. 44pp.
Kelly, P. (1995) ADAS Milk Cheque Statistics for November 1995. MAFF Annual Report. Leigh, R.A. and Johnston, A.E. (1986) An investigation into the usefulness of phosphorus
concentrations in tissue water as indicators of the phosphorus status of field grown spring barley. Journal of Agricultural Science, Cambridge 107, 329-333.
Lund, J.W.G. (1974) Phosphorus and the eutrophication problem. Nature 249, 797. MAFF (1976) Agriculture and Water Quality. Technical Bulletin No. 32, Ministry of Agriculture,
Fisheries and Food, HMSO, London. MAFF (1994) Fertiliser Recommendations for Agricultural and Horticultural Crops 6th edn. HMSO,
London. MAFF (1998) Code of Good Agricultural Practice for the Protection of Water, 2nd edn,
HMSO, London. MAFF (2000) Fertiliser Recommendations for Agricultural and Horticultural Crops (RB 209), 7th edn.
The Stationery Office, London.
67
Marschner, H. (1995) Mineral Nutrition of Higher Plants. 2nd Edition. Academic Press, London. 889pp.
Mattingly, G.E.G. (1970) Residual value of basic slag, Gafsa rock phosphate and superphosphate in a sandy podzol. Journal of Agricultural Science, Cambridge 75, 413-418.
McEwen, J., Day, W., Henderson, I.F., Johnston, A.E., Plumb, R.T., Poulton, P.R., Spaull, A.M., Stribley, D.P., Todd, A.D. and Yeoman, D.P. (1989) Effects of irrigation, N fertilizer, cutting frequency and pesticides on ryegrass, ryegrass-clover mixtures, clover and lucerne grown on heavy and light land. Journal of Agricultural Science, Cambridge 112, 227-247.
McGechan, M.B. (2003) Modelling phosphorus leaching to watercourses from extended autumn grazing by cattle. Grass and Forage Science 58, 151-159.
Mitchell, E.E. and Prepas, E.E. (1990) Atlas of Alberta Lakes. University of Alberta Press, Alberta. 75-81.
Murphy, J. and Riley, J.P. (1962) A modified single solution for determination of phosphate in natural waters. Analytica Chimica Acta 27, 31-36.
Nurnberg, G.K. (1996) Trophic state of clear, coloured, soft- and hard-water lakes with special consideration of nutrients, anoxia, phytoplankton and fish. Lake and Reservoir Management 12, 432-447.
OECD (1982) Eutrophication of Waters, Monitoring, Assessment and Control. Organisation for Economic Cooperation and Development, Paris. 154 pp.
Ozanne, P.G. (1980) Phosphate nutrition of plants – a general treatise. In: Khasawneh, F.E., Sample, E.C. and Kamprath, E.J. (eds) The Role of Phosphorus in Agriculture. ASA, CSSA, SSSA, Madison, Wisconsin, USA. 559-585.
Pionke, H.B., Gburek, W.J., Sharpley, A.N. and Zollweg, J.A. (1997) Hydrologic and chemical controls on phosphorus losses from catchments, In: Tunney, H., Carton, O.T., Brookes, P.C. and Johnston, A.E. (eds) Phosphorus Loss from Soil to Water. CAB International, Wallingford, UK. 225-242.
Poulton, P.R., Tunney, H. and Johnston A.E. (1997) Comparison of fertilizer recommendations in Ireland and England and Wales. In: Tunney, H., Carton, O.T., Brookes, P.C. and Johnston, A.E. (eds) Phosphorus Loss from Soil to Water. CAB International, Wallingford, UK. 449-452.
Preedy, N., McTiernan, K., Matthews, R., Heathwaite, A.L. and Haygarth, P.M. (2001) Rapid incidental phosphorus transfers from grassland. Journal of Environmental Quality 30, 2105-2112.
Rigler, F.H. (1973) A dynamic view of the phosphorus cycle. In: Griffith, E.J. et al. (eds) Environmental Phosphorus Handbook. Wiley, New York. 539-572.
Rowell, D.L. (1994) Soil Science: Methods and Applications. Longman Scientific and Technical, Harlow, Essex, UK. 350pp.
Ryden, J.C., Syers, J.K. and Harris, R.F. (1973) Phosphorus in runoff and streams. Advances in Agronomy 25, 1-45.
Scholefield, D., Tyson, K.C., Garwood, E.A., Armstrong, A.C., Hawkins, J. and Stone, A.C. (1993) Nitrate leaching from grazed grassland lysimeters: Effects of fertilizer input, field drainage, age of sward and patterns of weather. Journal of Soil Science 44, 601-614.
Sharpley, A.N., Smith, J.J. and Menzel, R.G. (1989) Phosphorus dynamics in agricultural runoff and reservoirs in Oklahoma. Lake and Reservoir Management 5, 75-81.

68
Shephard, M.A. and Withers, P.J.A. (1999) Application of poultry litter and triple superphosphate fertilizer to a sandy soil: effects on soil phosphorus status and profile distribution. Nutrient Cycling in Agroecosystems 54, 233-242.
Skinner, R.J. and Todd, A.D. (1998) Twenty-five years of monitoring the soil pH and nutrient status in England and Wales. Soil Use and Management 8, 16-20.
Smith, R.V., Lennox, X.D., Jordan, C., Foy, R.H. and McHale, E. (1995) Increase in soluble phosphorus transported in drain flow from a grassland catchment in response to soil phosphorus accumulation. Soil Use and Management 11, 204-209.
Smith, K.A., Chalmers, A.G., Chambers, B.J. and Christie, P. (1998) Organic manure phosphorus accumulation, mobility and management. Soil Use and Management 14, 154-159.
Smith, K.A., Brewer, A.J., Crabb, J. and Dauven, A. (2001) A survey of the production and use of animal manures in England and Wales. III. Cattle manures. Soil Use and Management 17, 77-87.
Thomas, E.A. (1973) Phosphorus and eutrophication. In: Griffith, E.J. et al. (eds) Environmental Phosphorus Handbook. Wiley, New York. pp 585-611.
Thomas, G.W. (1970) Soil and climatic factors which affect nutrient mobility. Soil Science Society of America Special Publication No. 4, 1-20.
Thomas, G.W. and Phillips, R.E. (1979) Consequences of water movement in macropores. Journal of Environmental Quality 8, 149-152.
TSO (2003) Agriculture in the United Kingdom 2003. The Stationery Office, London. Turner, B.L. and Haygarth, P.M. (2000) Phosphorus forms and concentrations in leachate
under four grassland soil types. Soil Science Society of America Journal 64, 1090-1099. Watson, C.J. and Foy, R.H. (2001) Environmental impacts of nitrogen and phosphorus
cycling in grassland systems. Outlook on Agriculture 30, 117-127. Withers, P.J.A. (2003) Sustainable use of phosphorus. Paper presented at a UKASTA
Meeting, Taunton 30th January 2003. Withers, P.J.A. and Bailey, G.A. (2003) Sediment and phosphorus transfer in overland flow
from a maize field receiving manure. Soil Use and Management 19, 28-35. Withers, P.J.A., Clay, S.D. and Breeze, V.G. (2001) Phosphorus transfer in runoff following
application of fertilizer, manure and sewage sludge. Journal of Environmental Quality 30, 180-188.
Withers, P. J.A., Ulen, B., Stamm, C. and Bechmann, M. (2003) Incidental phosphorus losses – are they significant and can they be predicted? Journal of Plant Nutrition and Soil Science 166, 459-468.
69
BIBLIOGRAPHY. References on national and EU eutrophication impacts: 1. Aquatic Eutrophication in England & Wales: a proposed management strategy.
Environment Agency, Bristol, December 1998.
2. Aquatic Eutrophication in England &Wales: a management strategy. Environment Agency, Bristol, August 2000.
3. Environment Agency aquatic eutrophication management strategy: first review report, June 2002.
4. The State of the Environment of England and Wales: Fresh Waters. Environment Agency, 1998. The Stationery Office, London.
5. Royal Commission on Environmental Pollution, Sixteenth Report: Freshwater Quality, 1992.
6. Wildlife and Fresh Water: an Agenda for Sustainable Management. English Nature, Peterborough, 1997.
7. Phosphorus and river ecology: tackling sewage inputs, English Nature and Environment Agency, March 2000. ISBN 1 85716 505 5.
8. The State of England’s Chalk Rivers, Environment Agency July 2004.
9. Biodiversity: The UK Steering Group report. HMSO, London, 1995. Plus the UK BAP action plans for mesotrophic lakes (1995), eutrophic standing waters (1998) and chalk rivers (1995).
10. Europe’s Environment: The Dobris Assessment. European Environment Agency, Copenhagen, 1995. CEC.
11. Europe’s Environment: the Second Assessment. European Environment Agency, Copenhagen, 1998. Also the Third Assessment, EEA, 2003.
12. European Rivers and Lakes – Assessment of their Environmental State. European Environment Agency Environmental Monograph No 1, 1994. EEA Copenhagen, 1994. ISBN 87-90198-01-8
13. Nutrients in European Ecosystems, European Environment Agency, Copenhagen 1999. ISBN: 92-9167-163-0.
14. Eutrophication and health, WHO Regional Office for Europe/European Commission, 2002. ISBN 92-894-4413-4.
15. Diffuse Water Pollution from Agriculture/Catchment Sensitive Farming reports by Defra and WAG. A range of reports from 2002-2005.

70
Main statutory and policy commitments on managing eutrophication: (Mostly summarised in Annex 2 of Reference 2 above.)
1. Water Framework Directive – measures have yet to be introduced but must address all pollution sources within river basin districts. Assessment and control of eutrophication will be a big issue.
2. Urban Waste Water Treatment Directive – requires reduction of nutrients from large sewage treatment works discharging to waters affected by eutrophication.
3. Nitrate Directive – targeting nitrates from agriculture.
4. Habitats Directive – so far addressing point sources but may have implications for diffuse pollution control.
5. UK Biodiversity Action Plan – includes a range of action plans including chalk rivers, mesotrophic lakes and eutrophic standing waters.
6. UK SSSI legislation – there is a Defra PSA target to achieve favourable or recovering condition by 2010.
7. OSPAR strategy to combat marine eutrophication, 1998.
8. Defra/WAG/SE marine policy – Safeguarding our Seas, 2002 – includes commitments on eutrophication.
9. Defra and WAG policy proposals on Catchment Sensitive Farming – the need to tackle nutrient pollution features strongly.
10. Environment Agency Vision (for the environment) and Corporate Strategy – these include commitments to tackle eutrophication and implement our strategy (as well as key Directives).

71
GLOSSARY OF TERMS. Bioavailable P: Phosphorus that is available for uptake by living organisms, usually taken to
mean immediately available. Biological balance: At any one point in time there will be an optimum balance between all
the living species within a water body. This balance can be upset by one species responding to an external stimulus and competing to partially or completely eliminating one or more other species.
Catchment/watershed: Catchment, the area of land from which excess rainfall flows (eventually) into a river. Watershed, a line of separation between waters flowing into different rivers.
Critical level of phosphorus: For any nutrient taken up by plant roots from the soil there will be a concentration in the soil solution, or a surrogate extractant, above which, provided all other growing conditions are optimum, there will be no further increase in growth or yield even though uptake of that nutrient may continue.
Degree of soil saturation: The extent to which those sites within a soil that can hold phosphorus are all occupied with phosphorus so that no more can be held and any further addition is at risk to loss by leaching.
Fixation of phosphorus: Based on earlier but mostly incomplete observations, it was considered that phosphorus added to soil in fertilisers or manures and not used by the crop for which it were applied became converted to chemical forms of phosphorus that did not remain available to subsequent crops that.
Flux: The amount or rate of flow across a given area. Offtake/uptake: A growing crop takes up a certain amount of each nutrient (uptake) but
not all of this amount will be removed in the produce taken from the field in the harvested crop (offtake). For example, the total amount of nutrient in a cereal or sugar beet crop (the uptake) will be larger than the offtake if the straw or tops of the beet are ploughed back into the soil. The amount of a nutrient for uptake must be available in the soil. The offtake is used to calculate the nutrient balance, i.e. nutrient applied minus nutrient removed.
Pathways: The different routes by which water can leave a soil. Phytase/phytate: Phytate is the naturally occurring organic compound in which much of
the phosphorus is stored in cereal grains. Phytase is the naturally occurring enzyme that hydrolyses phytate to inorganic phosphorus compounds and inositol so that in the early stages of germination the inorganic phosphorus can be moved to the developing cells.
Plant-available P: The total amount of soil phosphorus that is available for uptake by plant roots. As roots only take up phosphorus from the soil solution and because P in the soil solution can be replenished from P held at various sites within the soil matrix over different time scales it is usual to qualify plant-available P as immediately available (in the soil solution) or readily or less readily available according to the time scale over which the P becomes available in the soil solution. This definition does not imply any specific compound of P whether inorganic or organic.
Spatial variability: Variation between areas of land, can be at any scale from within field to within or between catchments.
Temporal variability: Change within a time scale that can range from hourly to yearly or between years.