phosphorus associations in aerosols: what can they tell...
TRANSCRIPT

Marine Chemistry 120 (2010) 44–56
Contents lists available at ScienceDirect
Marine Chemistry
j ourna l homepage: www.e lsev ie r.com/ locate /marchem
Phosphorus associations in aerosols: What can they tell us about P bioavailability?
L.D. Anderson a,⁎, K.L. Faul b, A. Paytan a
a Institute of Marine Sciences, University of California, 1156 High Street, Santa Cruz, CA 95064, USAb Environmental Sciences, Mills College, 5000 MacArthur Boulevard, Oakland, CA 94613, USA
⁎ Corresponding author.E-mail address: [email protected] (L.D. Anderson).
0304-4203/$ – see front matter © 2009 Elsevier B.V. Adoi:10.1016/j.marchem.2009.04.008
a b s t r a c t
a r t i c l e i n f oArticle history:Received 9 May 2008Received in revised form 28 April 2009Accepted 30 April 2009Available online 8 May 2009
Keywords:AerosolPhosphateSequential extractionSolubility
Phosphorus (P) in aerosols can originate from multiple sources (mineral dust, biomass burning, fuelemissions) and can be associated with multiple phases including various minerals, organic matter and Padsorbed on particle surfaces. These associations will greatly impact the solubility of P in an aerosol sampleand thus determine the bioavailability of P from atmospheric deposition to oceanic ecosystems. Here we usea sequential leaching extraction to determine the distribution of P within different operationally definedfractions in aerosol samples reaching the Gulf of Aqaba from different air mass trajectories and at differentseasons. We found that on average 40% of the P in aerosols is associated with the “authigenic” fraction(soluble in acetic acid) which is unlikely to dissolve in seawater and become bioavailable. Another 15% isassociated with each the HCl-“detrital” and insoluble organic matter components that are also not readilybioavailable. Only 15–30% of P is associated with phases that are water soluble or that are relatively solubleoxide phases that may be bioavailable for organisms. We did not find a consistent relationship between thedistribution of P in the various phases and air-mass back trajectory or season but a distinct and strongpositive correlation was observed between metals associated with anthropogenic sources such as Zn and Niand the extractable water soluble P fraction. This suggests that anthropogenic P sources are more soluble andbioavailable than mineral sources even though most of the P in aerosols in this region is in the mineral phase.These results have implications for determining how changes in atmospheric input of P to the ocean relatedto urban development and anthropogenic (wood and fuel burning) activities may impact marine ecosystems.
© 2009 Elsevier B.V. All rights reserved.
1. Introduction
Phosphorus (P) plays a critical role in all living systems(e.g., Westheimer, 1987). Unlike nitrogen (N), which can be retrievedfrom the abundant atmospheric pool and fixed in bioavailable formsfor organisms, the predominant source of P to the ocean is lowtemperature weathering from the continents (e.g., Froelich et al.,1982; Delaney, 1998; Paytan and McLaughlin, 2007). In portionsof the ocean and in many lakes, P is biolimiting on seasonal,(e.g., Sanudo-Wilhelmy et al., 2001; Mackey et al., 2007; Moutinet al., 2008) and geological time-scales (e.g., Tyrell, 1999). In suchsystems, atmospheric deposition of aerosols may provide additionalnutrients. Many studies have been conducted on the distribution,abundance, and availability of N in aerosols because of the role of Nspecies as both green house gas and acid rain components. Relativelylittle has been done to explore either the abundance or the bioavail-ability of aerosol P.
Aerosols include both natural components such as mineral dustand anthropogenic components such as bio-burning and diesel fuelby-products. Aerosols from industrialized and urban areas such asWestern and Eastern Europe are dominated by anthropogenic sources
ll rights reserved.
while dust storms from the Sahara or other deserts are enriched inmineral particles (e.g., Ridame and Guieu, 2002; Legrand andPuxbaum, 2007; Pio et al., 2007; Puxbaum et al., 2007). Althoughpublished data is limited, anthropogenic aerosol P concentrations forurban particulates and diesel fuel standards (SRM 1648 andSRM 1650) have high levels of total P (250 μmol g−1 aerosol and24 μmol g−1 aerosol, respectively, (Chutke et al., 1994; Huggins et al.,2000). Ash from agricultural and residential burning is also high inP (e.g., 550 mmol g−1, Sander and Andrén, 1997). Small aerosols fromforest and grass burning are up to 100 times more enriched withP relative to ash due to pyro-phosphate formation as hydrochloric acidinteracts with small organic molecules (Chester et al., 1987).
Crustal sources are generally quite low in P (~4 μmol g−1 aerosol,(Taylor and McLennan, 1995; Wedepohl, 1995)). However, mineraldust from the Saharan and Arabian deserts is enriched in P relative toother regions due to arid-alkaline-soil processes and the presenceof apatite-rich sedimentary formations (Bergametti et al., 1992;Chiapello et al., 1997; Guerzoni et al., 1999; Guieu et al., 2002).
The soluble fraction of P (percent soluble of total P) is generallylow for mineral dust (about 8% of total P) but can constitute 60–100%of the P associated with anthropogenic particles (Bergametti et al.,1992; Herut et al., 1999; Mignon and Sandroni, 1999; Markaki et al.,2003). However, it should be noted that different strategies ofassessing water soluble P have been applied to evaluate wet versus

45L.D. Anderson et al. / Marine Chemistry 120 (2010) 44–56
dry aerosol deposition (pure water simulating rain and seawater ex-tractions, respectively) (e.g., Mignon and Sandroni, 1999; Ridame andGuieu, 2002; Markaki et al., 2003; Chen et al., 2006b). Furthermore,dissolved concentrations of P in rainwater have been shown to be verysensitive to pH, largely because of the role of oxides in adsorbing andremoving P from solution (Mignon and Sandroni, 1999).
A comparison study of aerosols from the Gulf of Aqaba extractedusing sonication for 30 min in both seawater and pure water showedthat significantly less P is extracted in the seawater (Chen et al.,2006b). Interestingly, the only time that seawater extracted P wassimilar to pure water extracted concentrations was when air-massback trajectories suggested a dominance of anthropogenic-influencedEuropean aerosols. Thus, an increase in the relative amounts of aero-sols from anthropogenic sources could increase the seawater soluble Pfraction.
Water-soluble P concentrations in samples extracted from aerosolsfrom the Gulf of Aqaba are quite variable temporally but with noobvious seasonal trends (Chen et al., 2007). Concentrations of Cu, Zn,and Ni in these samples are well above crustal concentrations(calculated by normalizing to Al), which suggest that a significantfraction of the aerosols come from anthropogenic sources (Chen et al.,2007). The variable solubility of P in aerosols may be related to theassociation of P with specific phases (apatite, carbonate, adsorbed onclays or metal hydroxides, organic matter etc.) which have differentsusceptibility to dissolution. The degree of solubility will eventuallydetermine the bioavailability of P and the impact aerosol depositionmay have on the ecosystem.
Sequential extraction procedures have been used previously toascertain operationally defined components in both soils and oceansediments (Lucotte and d'Angeljan, 1985; Ruttenberg, 1992; Andersonand Delaney, 2000). When carefully calibrated, these techniques canyield insights into how elements of interest are sequestered and withwhat phases within the bulk sediment they are associated. Because ofthe importance of P to both terrestrial and oceanic productivity, anumber of techniques have been developed to specifically determineassociations of P. In this paper, we apply both a 4-step and a 5-stepextraction procedure developed specifically for oceanic sediments(Ruttenberg, 1992; Anderson and Delaney, 2000). The five stepprocedure includes the following extracts–magnesium chloride or
Table 1Summary and comparison of SEDEX five-step procedure and four-step extraction procedure
SEDEX five-step procedure(Ruttenberg, 1992) as modified for this study
Step name Chemical treatment(Step number)Chemical process
Water-soluble MilliQ water (pH=5.6, 10 ml)(Step 1) Extended dissolution experimeWeakly sorbed and easily soluble organic compounds Typical aerosols, 1 h
CDB-“oxide-associated” 0.22 M sodium citrate, 0.14 Msodium bicarbonate (pH=7.6)
(Step 2) 1 M MgCl2 (pH=8), 10 ml, 2 hReduction with dithionite and complexation with citrate Distilled water, 10 ml, 2 h
Acetate-“authigenic” 1 M sodium acetate buffered ((Step 3) 1 M MgCl2 (pH=8), 10 ml, 1 hDissolution 1 M MgCl2 (pH=8), 10 ml, 1 h
Distilled water, 10 ml, 1 h
HCl-“detrital” 1 N HCl, 13 ml, 16 h(Step 4)Acid dissolution
Residual-“organic” 50% (wv−1) MgNO3, 1 ml-dry(Step 5)Acid dissolution 1 N HCl, 13 ml, 24 h
water-, citrate bicarbonate dithionite extract (pH=7, CDB-), bufferedacetate (pH=4.3), hydrochloric acid (1 NHCl), and ashing/1 NHCl (inthis paper, this step is designated as residual)-that target weaklysorbed-, oxide-bound-, authigenic apatite-, detrital-, and organic-P inoceanic sediments, respectively (Ruttenberg, 1992). The 4-stepprocedure excludes the first step (see details of the extraction pro-cedure in Table 1).
We fully recognize that processes that dictate P forms andassociations within ocean sediments are distinctly different fromthose characteristic of aerosols. In particular, within ocean sediments,the primary source of P to the sediments is organic matter, which inturn is transformed to authigenic P (apatite), with or without anintermediate step sorbed to oxide coatings (e.g., Ruttenberg, 1990;Filippelli and Delaney, 1996; Anderson et al., 2001). Apatite as thepredominant final form can be predicted by the alkaline pH of bothseawater and pore-waters and the abundance of calcite (e.g., Savenko,2007). In contrast, P minerals formed within soils (a source ofatmospheric mineral dust) will vary with pH and soil composition andtheir solubility will vary accordingly. Low pH soils tend to formphosphate minerals with Al and Fe (variscite and strengite, respec-tively), while alkaline soils form the Ca minerals fluoroapatite andhydroxyapatite (e.g., Bohn et al., 1979). If these are transported viaaerosols and deposited within seawater, variscite and strengite willreadily dissolve under alkaline conditions whereas apatite willgenerally not (e.g., Bohn et al., 1979). However, recently formed,amorphous minerals tend to be soluble even under conditions ofsupersaturation (e.g., Bohn et al., 1979), thus the maturity of the soilcan affect dissolution as well. In addition, aerosols may have a sig-nificant anthropogenic source of P most likely associated with organiccompounds that are not abundant in sediments.
Despite these caveats, seasonal trends or relationship to air-massback trajectory could tell us something about potential P loading in theGulf of Aqaba. Furthermore, the P form or association in the aerosolscould tell something about the source of the P as well as its solubilityand bioavailability. Determining P components and association inaerosol samples from the Gulf of Aqaba could be interpreted in termsof sources and related solubility because of the existing vast data setsobtained on the same samples (co-collected at the same time andlocation see Chen et al., 2006a,b, 2007, 2008).
.
Four-step procedure Detection limits(Anderson and Delaney, 2000) (μmol g−1)
New step name(New step number)
nt was 4 days 0.03
sodium dithionite, 1.0 M, 10 ml, 6 h
CDB-“oxide-associated”(Step 1)
0.30“Adsorbed + oxide-associated”
pH=4), 10 ml, 5 h Acetate-“authigenic”(Step 2) 0.41
HCl-“detrital”(Step 3) 0.06
in oven at 80 °C, ash at 550 °C Residual-“organic”(Step 4) 0.05

46 L.D. Anderson et al. / Marine Chemistry 120 (2010) 44–56
2. Methods
2.1. Site description
Aerosol samples were collected in the small coastal town of Eilaton the shores of the Gulf of Aqaba (29_31′N, 34_55′E). There is noindustry in the region and the aerosol concentrations (totalsuspended particles per m3 of air) are relatively high (Chen et al.,2007). Metal concentrations and enrichment factors suggest anthro-pogenic inputs despite the proximity of the site to desert regions(Chen et al., 2008). Predominantly northern and northwestern windslikely bring aerosols from industrial European and Middle Easterncities (Chen et al., 2008).
2.2. Aerosol collection
An aerosol total suspended particle high-volume sampler with nonmetal detachable filter holders (HI-Q Environmental ProductsCompany of San Diego, California) was installed ~15 m above theground on the roof of the Interuniversity Institute of Marine Scienceslaboratory in Eliat, Israel, within 50m of the shore of the Gulf of Aqaba.This placement allows unobstructed exposure to air masses blownfrom all directions, and minimizes exposure to ground-level con-taminants. Four independent samples were collected for a 24-h periodwith airflow of 2.5–2.8 m3h−1 (total volume ~70 m3) each weekbetween August 2003, and November 2004. Air volume and aerosolweight were recorded for each sample. Filters used for aerosolcollection (47 mm polycarbonate membrane, Isopore™) wereprocessed within a laminar flow hood. All filters were pre-cleanedby first soaking in concentrated hydrochloric acid (A.C.S plus) for atleast 24 h, then in ultra-pure HCl twice, and finally rinsed thoroughlyin milli-Q water.
2.3. Trajectories
Air-mass back trajectories were calculated for each sample usingthe freely available NASA program HYbridSingle-Particle LagrangianIntegrated Trajectory (HYSPLIT) Model. Air-mass back trajectorieswere averaged over 5 days and calculated at 100, 700, and 2000 mheight levels for each sampling day at the sampling site (Chen et al.,2008). The major air-mass back trajectory sectors are the same asthose described in Chen et al, 2008 and include North African(Saharan desert, Zone 1), Arabian peninsula (Zone 2), Local, (Israel,Jordan, Syria, Iran, Iraq, Zone 3), Eastern Europe (Zone 4), WesternEurope (Zone 5), and Mediterranean (Zone 6).
2.4. Sequential extraction of P
We analyzed aerosol samples for P components on replicate filtersco-collected at the same sampling dates as those reported in Chenet al, 2007, 2008. We compared the four-step operationally definedsequential extraction (Anderson and Delaney, 2000) with a modifiedversion of the five-step P extraction procedure (SEDEX, Ruttenberg,1992) on splits of an individual filter. It should be emphasized thatthese techniques were developed and tested on oceanic sedimentsand therefore are not directly applicable to aerosols, yet they provide agoodmeans for comparison among samples (see Table 1 for extractionprocedures). The four-step procedure discriminates four components:exchangeable P (P sorbed to and incorporated in oxyhydroxides aswell as any P associated with labile organic matter), authigenic P(authigenic carbonate fluoroapatite), organic P (acid-insoluble), anddetrital P (terrestrial silicates and detrital apatite). The five-stepprocedure used here differs by starting with a milli-Q water rinse (theoriginal technique starts with MgCl2, (Ruttenberg, 1992)). The milli-Qrinse simulates solubility in rain water. Samples are centrifuged at10,000 rpm for 10 min to remove solids. Known volumes of
extractants are analyzed using a LaChat Quick Chem 8000 automatedspectrophotometric flow injection analysis system to measure P con-centrations in each of the solutions (Anderson and Delaney, 2000).
Detection limits, defined as three times the standard deviation ofreplicate measures of a low concentration solution standard andexpressed in equivalent concentration for a sample, were typically0.03 µmol g−1 for water extractable P, 0.30 µmol g−1 for citrate–dithionite–bicarbonate (CDB) extractable P, 0.41 µmol g−1 for acetateextractable P, 0.06 µmol g−1 for acid extractable P, and 0.05 µmol g−1
for ashing followed by acid extraction P. The long-term analyticalreproducibility has been established by running several aliquots of alarge well-mixed batch of oceanic sediment from the CaliforniaCurrent as samples with each run. Over 20 runs of the standard, steps2 through 5 had concentrations of 1.65±0.24, 18.82±0.98, 5.86±0.39, 1.47±0.07 µmol g−1, respectively. We dropped step one foroceanic sediment standard because the values were so low but it isincluded in the five step procedure for the aerosols.
2.5. Ancillary analyses
Thewater extracts (step 1 above) were also analyzed for additionalelements using an ICP-OES (Perkin Elmer). Concentrations of Al, Ca,Mg, and Na were determined and had detection limits of 0.94, 0.06,0.04, and 1.6 μM respectively. Other data on these samples used forcomparison to P extracts is available and has been published by Chenet al. (2007, 2008).
3. Results and discussion
P is critical to the productivity of both terrestrial and aqueoussystems, and thus better understanding its associations, solubility andbioavailability is important. We use the sequential extraction pro-cedure as a first order method of understanding how phosphate maybe locked up or released within aerosols with the ultimate objectiveof trying to better understand the role of aerosol-P in oligotrophicaqueous systems. While operationally defined the data set is inter-nally consistent and thus comparison among samples is possible.
3.1. Wood-ash and aerosol extended water dissolution experiment
To provide additional insights into the potential contribution ofbiomass burning to the different operational components, we ex-tracted five wood-ash samples (which simulate one potential anthro-pogenic P source) and 5 aerosol samples, and did a cross-comparisonof samples extracted by the 4- and 5-stepmethods. In this experiment,thewater-extraction stepwas extended to 4 days and analyzed for P aswell as Al, Ca, Mg and Na to see if we could elucidate any informationabout the water-soluble mineral phases. The intent of this experi-ment is not to try tomimic rain-water, as do our (see below) and Chenet al. 's (2007, 2008) as well as other short-term water extractions(typically a few minutes to 1 h), but to better understand potentialP association with various mineral phases. It should be noted that theoceanic sediment consistency standard that is typically run with ouroceanic sediment extractions behaved as expected and did not showsignificant redistribution between components with and without thewater-extraction step (Table 2).
3.2. Wood-ashBiomass burning contribution can be as high as 75% of the total
aerosol carbon during the winter season in low-lying rural areas(e.g., Chester et al., 1987; Sander and Andrén, 1997). Our ash sampleswere collected from the screen on top of a 30 ft flue on a wood-burning stove. P concentrations in our ash samples are extremely high(1800 μmol g−1 ash) and are an order of magnitude greater than theaverage amount extracted from the Aqaba aerosols (Tables 2 and 3).The greatest fraction of P fromwood ash samples was extractedwithin

Table 3Geometric mean regressions of phosphate from the 5-step sequential leachingextraction (includes a water rinse) of ash and aerosol samples versus total sedimentextractions.
Wood-ash P vs Al Na Ca Mg
m 0.93 12 581 14.69b 0.41 −48 −3964 7.11r 0.93 0.63 0.07 0.86r2 0.86 0.40 0.005 0.73
Aerosol P vsm −4.14 390 127 48b 21.56 −1292 −160 −143r −0.38 0.52 0.75 0.59r2 0.15 0.27 0.57 0.34
Only slopes significantly different from horizontal are included, (t-test, Davis, 1973).(Wood-ash, n=24, Aerosol, n=36). (m=slope, b=intercept, r=variance, r2=correlation coefficient).
Table 2P concentration and fraction of total P for sequential extractions with and without an extended water-extraction step.
Treatment
Extended water extraction No water extraction
Water 1 h Water 119 h CDB oxide Acetateauthigenic
HCl detrital Ash/HClorganic
Total CDB oxide Acetate authigenic HCl detrital Ash/HCl organic Total
Concentration μmol g−1) Concentration μmol g−1)
Aerosols (n=36) (n=6)Avg 11 24 1.32 110 3.67 8.00 146 17 169 2.78 7.73 196Std 6 12 0.63 111 2.55 3.07 116 10 103 1.00 3.20 109Rsd 58 50 48 101 69 38 79 60 61 36 41 56
Wood ash (n=24) (n=4)Avg 13 39 1214 497 27 3.78 1781 983 742 51 3.12 1781Std 2 8 41 60.67 23 1.41 106 396.43 185.96 36.24 0.20 329Rsd 16 20 3 12 87 37 6 40 25 71 7 19
Oceansediment
(n=12) (n=4)
Avg 0.24 0.49 1.01 25 4.36 3.27 34 1.06 24 4.79 3.08 33Std 0.34 0.05 0.16 0.31 0.43 0.30 0.84 0.09 2.70 0.08 0.09 2.61Rsd 141 10 15 1 10 9 2 9 11 2 3 8
Fraction of total P Fraction of total PAerosols (n=36) (n=6)Avg 0.10 0.21 0.01 0.65 0.04 0.09 0.09 0.82 0.02 0.07Std 0.05 0.09 0.01 0.17 0.04 0.08 0.03 0.10 0.03 0.08Rsd 47.71 43.64 148.89 26.06 121.40 88.13 35.04 12.23 138.24 119.72
Wood ash (n=24) (n=4)Avg 0.01 0.02 0.68 0.28 0.01 0.002 0.54 0.43 0.03 0.002Std 0.00 0.01 0.02 0.02 0.01 0.0006 0.15 0.13 0.02 0.0003Rsd 19.12 24.13 3.46 7.72 79.75 31.11 27.13 29.40 72.94 19.13
Oceansediment
(n=12) (n=4)
Avg 0.01 0.01 0.03 0.73 0.13 0.10 0.03 0.73 0.14 0.09Std 0.01 0.002 0.01 0.01 0.01 0.01 0.01 0.02 0.01 0.005Rsd 141 13 18 1 7 7 16 3 9 5
Sample number is given in parentheses and for the extended water experiment includes the six time steps.
47L.D. Anderson et al. / Marine Chemistry 120 (2010) 44–56
the CDB-“oxide”-step (Fig. 1). The concentration averaged 1200 μmolP g−1 wood-ash (Table 2). Concentrations of P in the water, acetate-“authigenic”-, HCl- “detrital” and residual-“organic” extraction stepswere 39, 500, 26, and 4 μmol P g−1 wood-ash respectively (Table 2).
Previous reports of total ash-P are similarly high (Sander andAndrén, 1997), 500–1300 μmol P g−1 ash). Thus even a small con-tribution of ash to the total aerosol composition will affect the total Pcontent and understanding the behavior of P within this ash fractionwill provide insights into the behavior of aerosols as a whole.
There are several indications that wood-ash P is associated withthe oxide component. The largest fraction of the total wood-ash P isextracted with CDB, suggesting association with the “oxide” phasewith or without a water extraction (68% and 54%, respectively).Interestingly, the addition of a water extraction step appears to mobi-lize some of the phosphate that would have been extracted withacetate- and thus defined as the “authigenic”-P fraction if therewas nowater step. The mobilized P is then adsorbed onto the oxide phase(Table 2). Thus the acetate-“authigenic”-fraction decreases and theCDB- “oxide”-fraction increases with the addition of a water ex-traction step (Fig. 1a). The addition of a water extraction step alsoseems to significantly decrease the variability of the CDB-“oxide”,acetate-“authigenic”, residual-“organic” extraction steps. Becauseultra-pure water (MilliQ, 18 Ω) has a pH 5.6, some dissolution ofphosphate mineral phases is expected, as is the re-adsorption tooxides. Thus, the assumption that the CDB-extraction is in fact dis-solving oxide-associated P is reasonable. Phosphate has a high affinityfor oxides (Dimirkoua et al., 2007). In fact, oxides are used to “scrub” Pemissions from biofuel-powered energy facilities (e.g., Grubb et al.,2000). However, some of the P within the acetate-“authigenic” andresidual-“organic” extraction steps change their association withinoperationally defined fractions with the addition of a water step, andthus that portion of the P does not meet the operational definition of“authigenic” or “organic” P.
The water-dissolved phosphate fraction is only a small part of thetotal ash P (~2%, Table 2). But because of the high concentration of P inash, the actual concentration release in water (per gram of sample) isgreater than for most of the natural aerosol extractions (Table 2,39 μmol g−1 ash vs 24 μmol g−1 aerosol). Water-dissolved P con-centrations are strongly correlated with Al concentrations (r2=0.86,Table 3), suggesting the release of highly available phosphate with Aloxide dissolution. The P to Al regression shows an almost one-to-onerelationship (Fig. 2). This relationship is different from that of crustalmaterial (ranges from 7–12 mmol P/mol Al, (e.g., Turekian andWedepohl, 1961; Wedepohl, 1995)) and is much more enriched in Prelative to Al compared to the average aerosol total digestion (0.21±0.19 mol/mol).
The shared variance between phosphate and Mg is also high(r2=0.73, Table 3). The initial increase in Mg concentration is

Fig. 2. Comparison of water-dissolved P and water-dissolved Al (A), Na (B), Ca (C), andMg (D) in wood-ash and Aqaba aerosol samples. All units are in μmol g−1.
Fig. 1. The fraction of total P extracted fromwood-ash (A) and Aqaba Aerosols (B) in thewater-dissolved, citrate-dithionite-bicarbonate (CDB)-“oxide-associated”, acetate-“authigenic”-, HCl-“detrital”, and residual-“refractory organic”-associated P phaseswith andwithout a 4 daywater extraction. Error bars are±1 standard deviation (n=5).
48 L.D. Anderson et al. / Marine Chemistry 120 (2010) 44–56
positively correlated with the P until Mg concentrations level out at~5 μmol g−1 (Table 2, Fig. 2). This is consistent with other studieswhere Al, Mg, and P were all hypothesized to participate in smallparticle formation during biomass burning (Leslie, 1981). Further-more, Al, Mg, and P in aerosols from anthropogenic sources tendto loosely associate with particulates and to dissolve more readily(Bergametti et al., 1992), and thus are likely to provide morebioavailable P.
Only 50% of thewater-soluble P dissolved within the first hour, andP dissolution continued over the 4-day period. Thus, the short perioddissolution typical of most aerosol extractions both ours and in otherstudies captures only a portion of the total water-soluble P. Thecontinued release of Al, in conjunction with the reallocation of P fromCDB fraction to the water soluble fraction with the addition of a waterextraction step, again suggests that dissolution of some portion ofmore soluble oxides may facilitate the release of bioavailable P. Itshould be reemphasized that short-term dissolution in fresh watershave been used to mimic rainfall and our longer term dissolutionexperiment, which was intended to extract information on P asso-ciation with potential mineral phases, would only be relevant in freshwater bodies where the aerosol interact with water for extendedperiods.
3.3. AerosolsThe likely sources of readily available P phases in the aerosol
samples are not as easily identified as those in wood ash. Totalconcentration of P ranges from 60 to 340 μmol g−1 aerosol and issignificantly lower than the wood ash extractable P concentrations
(Table 2). The greatest fraction of extracted aerosol-P was within theacetate-“authigenic”-step. Similar to the ash samples, aerosol Pfractions change based on whether a water extraction was appliedor not. With an initial water step, both CDB-“oxide” fraction and theacetate-“authigenic”-fraction decrease significantly (8% and 17%,respectively, Table 2). In several of the samples, P concentrationswithin the CDB-“oxide” fraction decreased to below detection limit.What is lost by these phases appears to be gained by the water-extracted P fraction (~21%). Thus, the four-step extraction procedurewould underestimate the amount of soluble aerosol P if aerosols weresuspended in fresh waters for an extended period of time. Multiple-day experiments need to be carried out to assess if this occurs in seawater as well.
Similar to the ash experiment, about half of the water-soluble P isdissolved within the first hour of extraction (Table 2). Unlike the ashthe water-soluble P fraction shows only a minor and negativecorrelationwith Al, althoughMg, Ca, and Na share significant varianceand is positively correlatedwith P (Table 2, Fig. 2). Note that the longerterm dissolution experiment (4 days) preformed on these sam-ples differs from the larger data set reported below in Sections 3.2 as30–60 min dissolutionwas employed. The intents of the two data setsare different. The short-term dissolution mimics rain water, while thelonger term dissolution experiments were meant to help in evaluatingthe potential P associated to various mineral phases. Data from theshort dissolution is more strongly negatively correlated with Al, buthas a miniscule correlation with Ca and weaker correlations with NaandMg. This suggests that, givenmore time, there may be Ca, Mg, andNa P-forms that are water soluble in lower pH fresh waters, and thusbioavailable, which may be overlooked in short time dissolutionprocedures applied to aerosols. Whether this is at all applicable tosalinewatersmust be testedwith similar longer termexperiments. Butas noted below, oceanic sediments do not show similar redistributionsbetween components during the longer distilled water extraction.
In contrast to the wood-ash and aerosol water extractions, theoceanic sediments (used as comparison standards) showed less than1% water dissolution and there was no change in the fractionsextracted within the CDB-“oxide”- and acetate-“authigenic” P with orwithout a prior water extraction step. This reiterates the differencesdiscussed above between the P phases in aerosols as compared tooceanic sediments. With time, in oceanic sediments P is transformedfrom mobile oxide-associated and organic phases to recalcitrantauthigenic apatite, locking P within the sediments. The P in aerosolson the other hand is more mobile. The shift of aerosol P compo-nents between operational definitions with the addition of a waterstep demonstrates that the CDB-“oxide”, acetate-“authigenic”, andHCl-“organic” phases have water-soluble fractions and are notaccounted for by the classical operational definitions developed inoceanic settings. Further research is needed to characterize the aerosol

Table 4Phosphorus extractions of aerosols from the Gulf of Aqaba.
Sample # Water CDB/oxides Acetate/authigenic Acid/detrital Residual/organic Total
Avg Std Rsd Avg Std Rsd Avg Std Rsd Avg Std Rsd Avg Std Rsd Avg Std Rsd
Extraction components concentration (μmol g−1 sed)All samples
10 6 62 23 13 57 104 81 77 10 7 68 13 26 208 149 101 68
SeasonalWinter (Nov–Feb) 24 10 8 81 19 9 47 118 100 84 8 4 54 7 3 42 174 149 85Spring (Mar–May) 15 8 4 58 19 7 40 84 63 75 8 6 77 11 10 96 122 72 59Summer (Jun–Aug) 12 11 4 34 25 8 33 90 72 80 14 7 50 13 6 46 142 84 59Fall (Sept–Oct) 7 8 1 8 31 25 81 100 52 52 7 5 75 6 4 58 148 66 44
Dominant air-mass trajectoryNorth African 11 6 3 57 16 7 44 75 49 65 7 2 33 7 3 40 135 113 84Arabian 5 10 6 59 19 8 41 116 106 92 6 4 61 5 2 36 253 243 96Local 7 12 10 85 17 6 33 118 56 47 8 4 55 12 14 116 228 151 66Eastern Europe 6 12 7 61 34 25 73 117 99 85 10 8 78 10 7 74 275 298 108Western Europe 10 9 4 41 26 8 32 80 72 90 13 9 65 12 6 51 169 119 70Mediterranean 17 11 6 50 23 12 51 120 97 81 10 6 59 9 4 44 197 136 69
Fraction of total PAll samples
0.17 0.07 40 0.13 0.04 31 0.40 0.18 46 0.15 0.07 45 0.15 0.09 59
SeasonalWinter (Nov–Feb) 24 0.17 0.07 45 0.12 0.05 39 0.53 0.23 43 0.12 0.07 61 0.12 0.08 63Spring (Mar–May) 15 0.14 0.06 44 0.12 0.04 31 0.54 0.23 42 0.12 0.08 69 0.15 0.11 73Summer (Jun–Aug) 12 0.19 0.06 31 0.14 0.04 30 0.39 0.20 50 0.18 0.08 44 0.16 0.06 35Fall (Sept–Oct) 7 0.18 0.07 37 0.18 0.09 51 0.54 0.22 41 0.10 0.08 85 0.08 0.06 75
Dominant air-mass trajectoryNorth African 11 0.14 0.07 52 0.14 0.04 25 0.42 0.13 32 0.14 0.07 48 0.14 0.07 48Arabian 5 0.15 0.04 28 0.10 0.01 14 0.51 0.29 57 0.08 0.06 84 0.09 0.09 97Local 7 0.17 0.07 41 0.10 0.02 23 0.47 0.19 40 0.09 0.04 48 0.09 0.02 24Eastern Europe 6 0.19 0.08 43 0.12 0.04 31 0.42 0.21 49 0.11 0.06 56 0.12 0.07 56Western Europe 10 0.17 0.06 35 0.16 0.05 27 0.35 0.30 87 0.17 0.12 71 0.15 0.10 66Mediterranean 17 0.18 0.06 34 0.13 0.05 43 0.49 0.27 55 0.12 0.08 70 0.10 0.06 61
Average concentrations and fraction of the total P concentration are parsed according to season and dominant air-mass trajectory.
49L.D. Anderson et al. / Marine Chemistry 120 (2010) 44–56
P phases that are being extracted and more aerosol specific protocolsdeveloped. Evaluation will be greatly aided by investigations focusingon aerosols withwell-characterized known sources (as done above forthe wood ash).
3.4. Aqaba aerosols
A significant portion of the total P in aerosols was water soluble(17%), although the largest percentage (~40%) of aerosol P is asso-ciated with the operationally defined authigenic mineral phases(e.g., apatite). CDB-“oxide”-, HCl-“detrital”, and residual-“organic”aerosol P fractions are about 13%, 15%, and 15%, respectively (Table 4).
3.4.1. Seasonal and air-mass trajectory trends in PWe grouped the Gulf of Aqaba aerosols according to season over a
2 year sampling period and according to the back-tracked air-masstrajectories in the preceding 5 days (Chen et al., 2008). P concentra-tion in none of the extraction steps show a statistically significantseasonal trend, although the variability is greater in the winter for thewater-extractable, the spring for the residual-“organic”-extractionstep, and the fall for the CDB-“oxide” extraction step. The highest Pconcentrations were extracted within the acetate-“authigenic”-P stepwith an average of ~100 μmol g−1 P for all the seasons but thevariability is high for both P concentrations (±81 μmol g−1) andfraction of the total P (±18%, Table 4). This differs from P aerosolextractions of East China Sea samples, which were dominated by the“detrital” fraction throughout the year (Detrital P/Total P(average)=72%) (Chen et al., 2006a) which the authors linked to mineral dustsources. Furthermore, the authors note a distinct seasonal pattern intheir year-long record. The winter had the highest percentage
“detrital” P loads associated with the northwest monsoons, and thespring had greatest percentage organic P loads, potentially associatedwith terrestrial andmarine biological activity (Chen et al., 2006a). Theair-mass sources in the East China Sea change seasonally thusresulting in the observed trend. Although the Gulf of Aqaba wasdominated by air masses from Europe and the Mediterranean (69% ofthe time, (Chen et al., 2007, 2008)), seasonal variability was not aspredictable. This contrasts with analyses of aerosol total P concen-trations over the northeast Mediterranean, where the summer dryseason had both higher P concentrations and high particle flux(Bergametti et al., 1992). The precipitation history of the air masseswas the primary control of the resultant aerosol P concentrations inthat region lowering P concentrations in the residual aerosols withmore precipitation (Bergametti et al., 1992). This illustrates that total Pcannot be used to get accurate predictions of the soluble fraction.
Most of the P concentrations within the different extraction-stepsdo not show statistically significant differences when related to air-mass back trajectories because of the high variability of P concen-tration in samples within each sector (Table 4). However, there areseveral interesting observations. The average water soluble P concen-trations are lowest for the North Africa source region. Saharan dustfrom this region, although P-enriched relative to crustal abundance(Bergametti et al., 1992; Migon and Sandroni, 1999), is relativelyinsoluble in water (Bergametti et al., 1992), thus this may not besurprising. However, P concentrations for the acetate “authigenic” Pextraction is also low for the North African air-mass sector comparedto other source regions. North Africa, as well as the Arabian Peninsula,and local Negev air-mass sectors have known deposits of phospho-rites (authigenic apatite), which should be extracted in this step. TheHCl-“detrital”-P concentrations are also slightly higher and more

Fig. 3. Comparison of water extracted P and total digests of Al (A), Fe (B), Mg (C), Ca (D), Zn (E), Ni (F), and Na (G). Total digest data from Chen et al. (2008) preformed on samplescollected simultaneously. Data is parsed according to the predominant air-mass back trajectory. Geometric regression lines are included for aerosols with statistically significanttrends (See Table 5).
50 L.D. Anderson et al. / Marine Chemistry 120 (2010) 44–56
variable in samples from the Eastern, Western Europe, and Mediter-ranean regions and not the desert zones (Table 4). If phosphoritedeposits contribute a lot of P to mineral dust in aerosols from NorthAfrican, Arabian, and local air-mass sectors, but have recrystallized,and thus were not extracted in the acetate “authigenic” P step, it isexpected that this component will dissolve in the HCl-“detrital” step.Thus, in general much of the soluble P in all samples seems to be
related to anthropogenic sourceswithin samples from each region andsector and not so much with mineral components.
3.4.2. P components compared to total metal digestsSome interesting trends are apparent when the P components
are compared to the metals in the total aerosol bulk digests on co-collected samples (data from Chen et al., 2007). Water-extractable P is

Table 5Cross-plot results for phosphorus components versus major and minor elements.
Al Fe Ca Mg Na Zn Ni
All z3 z4 z5 All z3 z4 All z3 z4 z6 All z3 z4 z6 All z3 All z3 z4 z5 all z2 z3 z4
Water/easily soluble# 42 6 5 9 6 5 42 5 5 12 42 6 5 12 42 5 42 5 42m −90 −44 −76 −34 −20 −574 −119 −48 −17 −27 227 88 0.25 0.88 0.02b 1782 1302 1645 702 570 8045 3525 1087 831 905 −879 303 3.27 −0.9 1.06r2 0.37 0.60 0.34 0.36 0.60 0.02 0.31 0.21 0.64 0.42 0.19 0.95 0.35 0.98 0.09
CDB/oxide-associated# 55 6 55 6 55 6 55 6 55 6 55 6 55 6m −94 −66 −31 −30 −41 −62 −26 133 92 0.04 0.54 0.005 0.02b 2548 1918 903 848 2954 1709 1070 −1451 −445 3.9 −3.4 0.89 1.14r2 0.08 0.84 0.11 0.83 0.73 0.04 0.90 0.12 0.78 0.05 0.81 0.03 0.50
Acetate/authigenic P# 55 6 5 55 6 5 55 5 55 5 6 55 5 10 55 5 6 5m −19 −8.2 4.7 −4.6 −3.3 1.3 27.7 16 −6.1 1.02 9.16 0.00 0.01 0.03 0.001 0.008 0.003 0.004b 2730 1823 −50 785 746 71 −866 274 1172 394 −5.0 5.33 3.4 4.18 1.03 0.04 1.10 0.66r2 0.05 0.66 0.35 0.05 0.55 0.29 0.06 0.55 0.03 0.49 0.93 0.01 0.44 0.59 0.02 0.70 0.52 0.76
Residual/organic P# 55 5 6 5 6 5 55 6 5 5 55m 665 60 −25 201 −103 64 17 0.12 0.01b −5387 −54 2460 243.4 1526 −23 355 3.63 1.08r2 0.01 0.39 0.74 0.52 0.04 0.25 0.57 0.32 0.02
All concentrations are in μmol g−1 aerosol. Data are given for all slopes that are significantly different from zero(t-test, Davis, 1973). Sector air-mass trajectories are given when correlations were significant (air-mass trajectory sectors are asidentified in Chen et al. (2008): North African (z1), Arabian (z2), local (z3), Eastern Europe (z4), Western Europe (z5), and the Mediterranean (z6), respectively.) Highly significant linear relationships for aerosols from the local air-masstrajectory (z3) are highlighted with gray. (#= number of samples, m= slope of line, b=intercept, and r2= correlation coefficient, calculated using standard geometric mean regression).
51L.D
.Anderson
etal./
Marine
Chemistry
120(2010)
44–56

52 L.D. Anderson et al. / Marine Chemistry 120 (2010) 44–56
negatively correlated with the total digest concentrations of Al, Fe, Ca,and Mg. The negative correlation is particularly strong for local air-mass back trajectories (z3, Fig. 3, Table 5). A negative relationshipbetween total digests concentrations of Al and Fe andwater-soluble Aland Fe is noted by Chen et al. (2008) as well. The authors suggest thatmineral dust is the primary control on the total Al and Fe aerosolconcentrations and that this fraction of the total aerosols is lesssoluble resulting in the negative correlation (Chen et al., 2008). Thus,when anthropogenic sources dominate, total Al is low but the solubleAl fraction is high; and when dust sources dominate, total Al is highand soluble Al fraction is low. The positive correlation of Al with P inthe water soluble extracts suggests that some P is also associated withthese more soluble phases in anthropogenic aerosols. Thus the nega-tive relationship between water-soluble P and total digest Al, Fe, Ca,and Mg concentrations likely results from mineral dust dilution of ananthropogenic aerosol source of soluble P, and is consistent with ourinterpretation based on the sequential leaching procedure.
The association of P with anthropogenic aerosols is also consistentwith the positive correlation between dissolved P and total digestionZn and Ni concentrations. Prior work suggests that Zn and Ni areassociated with anthropogenic aerosols (Duce et al., 1991; Herut et al.,2001; Chen et al., 2008). Furthermore, observations of aerosol waterleaches of Zn and Ni indicated solubility one to two orders higher thanthose of Al and Fe (Chen et al., 2006b) supporting more labile anthro-pogenic sources and consistent with the higher solubility of anthro-pogenic aerosols.
Water-soluble P concentrations from aerosol sources with a localair-mass back trajectory also have a very high correlation with totaldigest Na concentrations. Previous interpretations have suggestedthat most of the Na is from sea-salt (Chen et al., 2008). However, thecorrelation between Na+ and Cl− is not very strong (r2=0.49, (Chenet al., 2008)) and a significant portion of the samples are enrichedwith Na relative to seawater. Furthermore, neither Na–Mg nor Na–Kratios are the same as those of seawater. Because both Na+ and Cl−
have anthropogenic sources and/or atmospheric sinks, there is not asimple way to remove sea-salt using solely these elements (Leslie,1981; Levin et al., 1996). However, the higher Na concentrations, andcorrelationwith soluble P suggest Na contribution by aerosol particlescoated with Na sulphates from anthropogenic sources (e.g., Na2SO4,Levin et al., 1996) which also carry anthropogenic P.
P concentrations in the CDB-“oxide”-extraction show a negativerelationship with total digest major mineral related elements (Al, Fe,Ca, Mg) and a positive relationship with total digest anthropogenicmetals (Zn, Ni) (Table 5, Fig. 4). There is shared negative variance forthe aerosol data set as a whole for Al, Fe, Ca, and Mg, and all have ahighly significant negative linear relationship for regional aerosolspredominated by local air-mass back trajectories. These relationshipssuggest thatmineral dust particularly frommore local sources controlsthemajor element total digest concentrations, but thatminor elementsincluding Zn, Ni, and P are associated with anthropogenic aerosolsources. This is consistent with observations from other investigations(e.g., Bergametti et al.,1992; Herut et al.,1999, 2001; Chen et al., 2008).
If the wood ash experiment is representative of how P componentsin anthropogenic sources behave, then the oxide component couldcontinue to release soluble P to the environment and at least some ofthis P could be considered bioavailable. The CDB-“oxide”-P extractionsof samples with a local air-mass back trajectory, like the water ex-traction, also have a very high positive correlationwith total digest Naconcentrations. Again, this relationship is at least suggestive that thereis another source of Na besides sea salt and that, like P, this Na isassociated with anthropogenic aerosols.
The acetate-“authigenic”-extractable P concentrations show little,but statistically significant, shared variance with total digest Al and Fe(negative, Table 5, Fig. 5), andCa concentrations (positive, Table 5, Fig. 5)There is not a statistically significant relationship between acetate-“authigenic”-extractable P concentrations and total digest Ca concen-
trations in air-masses back-tracked to local region. This was unexpectedbecause Saharan and Arabian mineral dust is enriched in P because ofarid-alkaline-soil processes and presence of apatite-rich sedimentaryformations (Bergametti et al.,1992; Chiapello et al.,1997;Guerzoni et al.,1999; Guieu et al., 2002). Thus, these P-enriched forms were eithersoluble in water or CDB-extractions that proceeded the acetatetreatment or more likely the apatite is in a more crystalline form andis removedwithdetrital apatite in theacid step. Thedifferentbehaviorofauthigenic P phases in aerosol when compared to those from oceanicsediments is not surprising, being that mineral dust is formed in andassociated with different soil mineral phases in either the arid-alkalinelocal, Arabian, and African soils or the more lower pH, moist Europeansoils and in both cases thesemineralswill differ frommarine sediments.Acetate-“authigenic”-extractable P concentrations also have a verystrong and strong correlation with Na and Ni total digests for local air-masses (r2=0.93, 0.52, respectively, Fig. 5) and strong negativecorrelation between total digest Al and Fe (Table 5, Fig. 5). Asmentionedabove, the Ni and the Na, which is not associated with sea salt (excessNa), are related to anthropogenic sources, specifically burning of fossilfuel and Na2SO4 coating of aerosol particles, respectively (Rahn andLowenthal, 1984; Yatin et al., 2000; Venkataraman et al., 2002). Thesecombined relationships once again suggest that P-enriched aerosolparticles are primarily associated with anthropogenic sources and P-depleted aerosols are associatedwithmineral dust (as indicated by totaldigests of Al and Fe).
The residual-“organic” P extractions share little variance with thetotal digest concentrations of major or minor elements with the ex-ception of a significant negative correlation with total digests Caconcentrations from local air masses (Fig. 6, Table 5). Although, againthe relationship is negative, suggesting dilution of a higher potentiallyanthropogenic P aerosol source with a local low P mineral dust sourceenriched in carbonate minerals.
4. Summary and conclusions
A significant portion of the total P in aerosols was water soluble(17%), although the largest percentage (~40%) of aerosol P wasassociated with the operationally defined authigenic mineral phases(e.g., apatite). Interestingly, the comparison of extraction series withand without water digestion suggested that some fraction of theacetate “authigenic”-P and CDB-“oxide”-P phases was soluble inwater(8% and 17%, respectively) indicating that the P in aerosols is generallymore labile than in marine sediments for which the leachingprocedure was developed. This also suggests that at least somefraction of the acetate “authigenic”-P and CDB-“oxide”-P phases isbioavailable and water soluble. Phosphorus associated with oxidesand extracted in CDB-“oxide”-fraction (~15%) continued to dissolveover 4 days of exposure to water and thus, with time, may contributeto the bioavailable pool. However, this needs to be tested with seawater to see if this is also true in an oceanic setting. P is also associatedwith refractory organic matter (~15%) and this fraction is less likely tobe bioavailable like the detrital P (~4%).
P-extractions of wood ash, although not collected from theatmosphere and thus not a direct analog, were explored to provide apotential important end-member for one known source of anthro-pogenic aerosols (e.g., Pio et al., 2007). Total concentrations of P inwood-ash are an order of magnitude higher than in Gulf of Aqabaaerosols, although only a small fraction of the total was water soluble(2%). The average concentration of water-soluble P released from thewood-ash is still equivalent to or higher than the water-soluble Pconcentrations in natural aerosols collected in the Gulf of Aqaba area.Other studies have found that aerosol P from anthropogenic sourceswere highly water soluble (40–100%, Bergametti et al., 1992) but inthe wood-ash we used, a majority of the P was only extracted withinthe CDB/oxide steps. Over time, both water-soluble P and Al continuedto be released from wood-ash in close to a one-to-one relationship
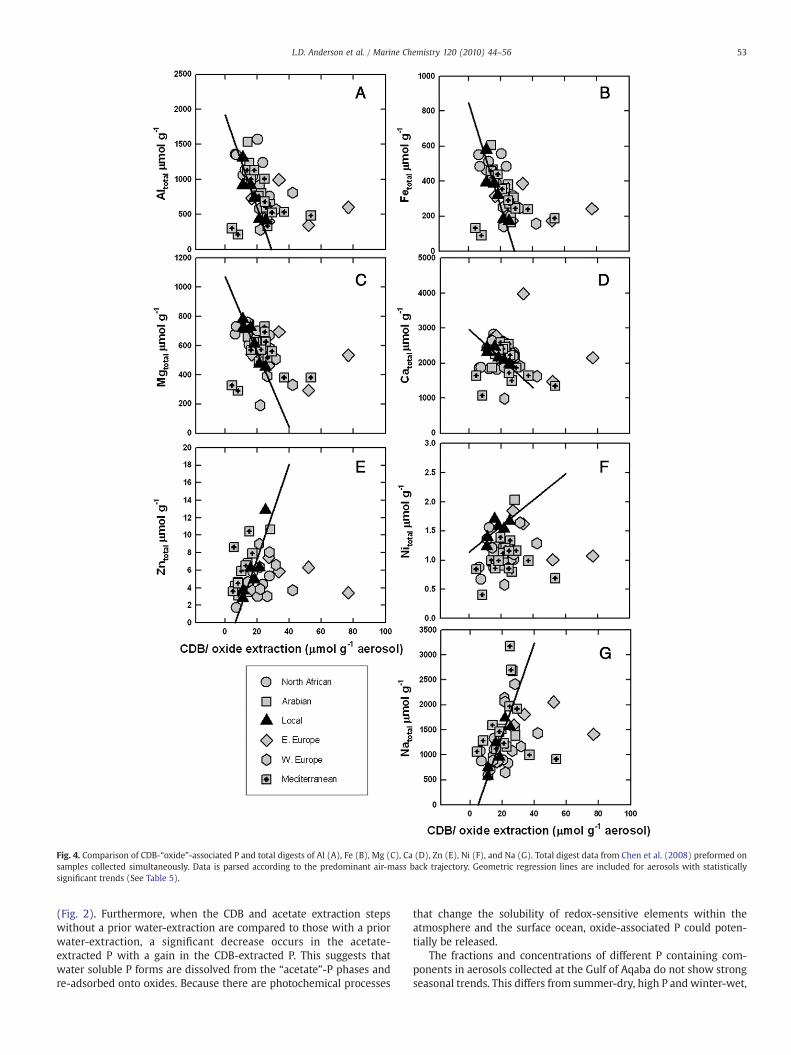
Fig. 4. Comparison of CDB-“oxide”-associated P and total digests of Al (A), Fe (B), Mg (C), Ca (D), Zn (E), Ni (F), and Na (G). Total digest data from Chen et al. (2008) preformed onsamples collected simultaneously. Data is parsed according to the predominant air-mass back trajectory. Geometric regression lines are included for aerosols with statisticallysignificant trends (See Table 5).
53L.D. Anderson et al. / Marine Chemistry 120 (2010) 44–56
(Fig. 2). Furthermore, when the CDB and acetate extraction stepswithout a prior water-extraction are compared to those with a priorwater-extraction, a significant decrease occurs in the acetate-extracted P with a gain in the CDB-extracted P. This suggests thatwater soluble P forms are dissolved from the “acetate”-P phases andre-adsorbed onto oxides. Because there are photochemical processes
that change the solubility of redox-sensitive elements within theatmosphere and the surface ocean, oxide-associated P could poten-tially be released.
The fractions and concentrations of different P containing com-ponents in aerosols collected at the Gulf of Aqaba do not show strongseasonal trends. This differs from summer-dry, high P and winter-wet,

Fig. 5. Comparison of acetate-“authigenic” P phases and total digests of Al (A), Fe (B), Mg (C), Ca (D), Zn (E), Ni (F), and Na (G). Total digest data from Chen et al. (2008) preformed onsamples collected simultaneously. Data is parsed according to the predominant air-mass back trajectory. Geometric regression lines are included for aerosols with statisticallysignificant trends (See Table 5).
54 L.D. Anderson et al. / Marine Chemistry 120 (2010) 44–56
low P observations reported for theMediterranean region (Bergamettiet al., 1992). Our study, however, comprises a relatively short record(2 years) with significant variability within each season, which makesstatistically significant observations difficult.
No statistically significant differences exist between the air-masssectors and soluble P concentrations in any fraction, probably due
to the small sample size and large variability. However, regionalaverages suggest some potential differences. Water-soluble P con-centrations are lowest in aerosols from North Africa, as would bepredicted from relatively insolubility of aerosol P from Saharanmineral dust (e.g., Bergametti et al., 1992). Surprisingly, the acetate“authigenic”-P phase is not high for North Africa sources. High P
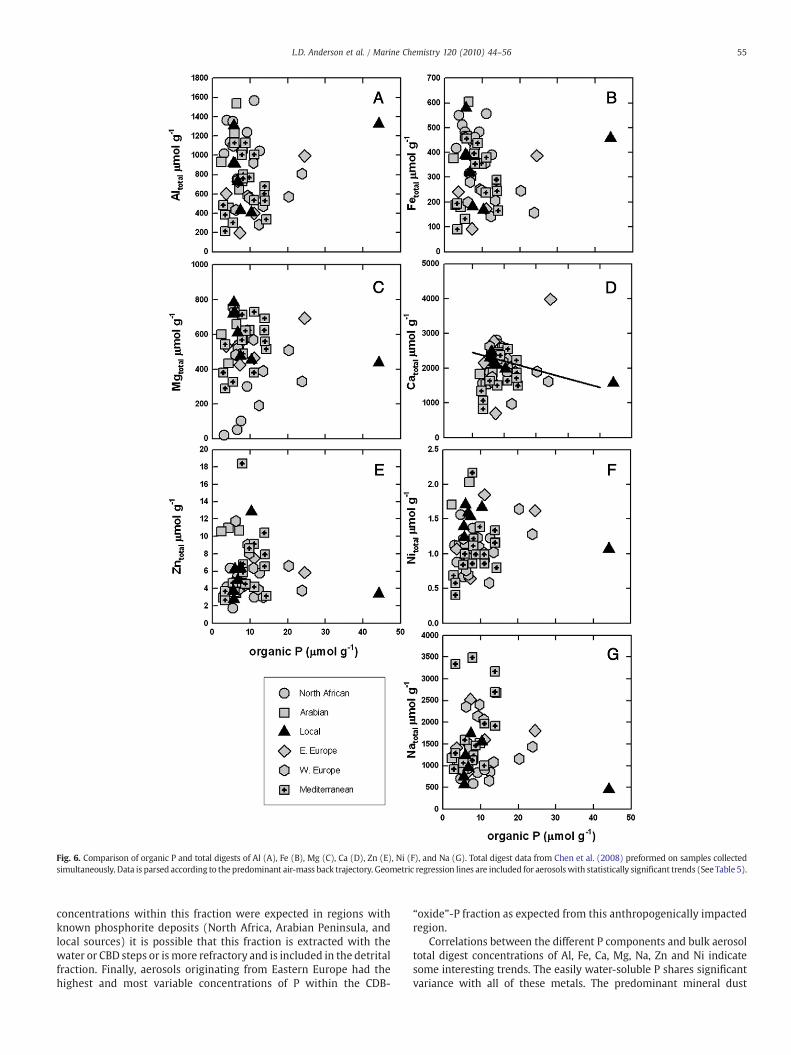
Fig. 6. Comparison of organic P and total digests of Al (A), Fe (B), Mg (C), Ca (D), Zn (E), Ni (F), and Na (G). Total digest data from Chen et al. (2008) preformed on samples collectedsimultaneously. Data is parsed according to the predominant air-mass back trajectory. Geometric regression lines are included for aerosolswith statistically significant trends (See Table 5).
55L.D. Anderson et al. / Marine Chemistry 120 (2010) 44–56
concentrations within this fraction were expected in regions withknown phosphorite deposits (North Africa, Arabian Peninsula, andlocal sources) it is possible that this fraction is extracted with thewater or CBD steps or is more refractory and is included in the detritalfraction. Finally, aerosols originating from Eastern Europe had thehighest and most variable concentrations of P within the CDB-
“oxide”-P fraction as expected from this anthropogenically impactedregion.
Correlations between the different P components and bulk aerosoltotal digest concentrations of Al, Fe, Ca, Mg, Na, Zn and Ni indicatesome interesting trends. The easily water-soluble P shares significantvariance with all of these metals. The predominant mineral dust

56 L.D. Anderson et al. / Marine Chemistry 120 (2010) 44–56
elements (Al, Fe, Ca, andMg) are negatively correlatedwith thewater-extracted P and the anthropogenic metals (Zn and Ni) are positivelycorrelated, suggesting two end-member mixing of a low P concentra-tion mineral dust aerosol source with a higher, potentially anthro-pogenic aerosol P source. The positive correlation between bothwater-soluble and CDB-“oxide”-associated P, and Zn and Ni suggestthat the anthropogenic source of P-containing aerosol is more solubleand thus potentially more bioavailable. Furthermore, the transfer ofacetate-“authigenic” P fraction to the CDB-“oxide”-associated andwater-soluble fractions, suggests that water facilitates the transfer of Pto a more easily dissolved phase. Thus the extractions in conjunctionwith alkaline earth and trace metal data give us a sense of the aerosolP fraction that would be biologically available to organisms. However,to better understand the different phases extracted with each step, aninvestigation of well-characterized aerosols with known sources anddefined end-member samples is required.
Acknowledgements
We are grateful to Anton Post and our colleagues at the Inter-university Institute for Marine Science in Eilat, Israel for assistancewith aerosol sample collection; Ying Chen and the Paytan Lab for laband field work assistance. The paper was significantly improved by theinsightful and detailed reviews by both editors and anonymousreviewers. This study is supported by the NASA New InvestigatorProgram NAG5 12663; and a NATO-Science for Peace SfP project982161 to AP.
References
Anderson, L.D., Delaney, M.L., 2000. Sequential extraction and analysis of phosphorus inmarine sediments: streamlining of the SEDEX procedure. Limnol. Oceanogr. 45 (3),509–515.
Anderson, L.D., Delaney, M.L., Faul, K.L., 2001. Carbon to phosphorus ratios in sediments:implications for nutrient cycling. Global Biogeochem. Cycles 15 (1), 65–79.
Bergametti, G., Remoudaki, E., Losno, R., Steiner, E., Chatenet, B., 1992. Source, transport,and deposition of atmospheric phosphorus over the northwestern Mediterranean.J. Atmos. Sci. 14, 501–513.
Bohn, H., McNeal, B., O Connor, G., 1979. Soil Chemistry. John Wiley and Son, New York.Chen, H.-Y., Fang, T.-H., Preston, M.R., Lin, S., 2006a. Characterization of phosphorus in
the aerosol of a coastal atmosphere: using a sequential extraction method. Atmos.Environ. 40, 279–289.
Chen, Y., Street, J., Paytan, A., 2006b. Comparison between pure-water- and seawater-soluble nutrient concentrations of aerosols from the Gulf of Aqaba. Mar. Chem. 101,141–152.
Chen, Y., et al., 2007. Estimates of atmospheric dry deposition and associated input ofnutrients to Gulf of Aqaba seawater. J. Geophys. Res. 112, 1–14.
Chen, Y., et al., 2008. Sources and fluxes of atmospheric trace elements to the Gulf ofAqaba, Red Sea. J. Geophys. Res. 113, 1–13.
Chester, R., Murphy, K.J.T., Towner, J., Thomas, A., 1987. The partitioning of elements incrust-dominated marine aerosols. Chem. Geol. 54, 1–15.
Chiapello, I., et al., 1997. Origins of African dust transported over the northeasterntropical Atlantic. J. Geophys. Res. 102, 13,701–13,709.
Chutke, N.L., Ambulkar, M.N., Aggarwal, A.L., Garg, A.N., 1994. Instrumental neutronactivation analysis of ambient air dust particulates frommetropolitan cities in India.Environ. Pollut. 85, 67–76.
Davis, J.C., 1973. Statistics and Data Analysis. John Wiley and Sons, New York. 550 pp.Delaney, M.L., 1998. Phosphorus accumulation in marine sediments and the oceanic
phosphorus cycle. Global Biogeochem. Cycles 12 (4), 563–572.Dimirkoua, A., Ioannoub, A., Doulaa, M., 2007. Preparation, characterization and
sorption properties for phosphates of hematite, bentonite and bentonite, hematitesystems. Adv. Colloid Interface Sci. 97, 37–61.
Duce, R.A., et al., 1991. The atmospheric input of trace species to the world ocean GlobalBiogeochem. Cycles 5, 193–259.
Filippelli, G.M., Delaney, M.L., 1996. Phosphorus geochemistry of equatorial Pacificsediments. Geochim. Cosmochim. Acta 60 (9), 1479–1495.
Froelich, P.N., Bender, M.L., Luedtke, N.A., Heath, G.R., DeVries, T., 1982. The marinephosphorus cycle. Am. J. Sci. 282, 474–511.
Grubb, D.G., Guimaraes, M.S., Valencia, R., 2000. Phosphate immobilization using anacidic type F fly ash. J. Hazard. Mater. 76, 217–236.
Guerzoni, S., et al., 1999. The role of atmospheric deposition in the biogeochemistry ofthe Mediterranean Sea. Prog. Oceanogr. 44, 147–190.
Guieu, C., Loye-Pilot, M.-D., Ridame, C., Thomas, C., 2002. Chemical characterization ofSaharan dust end-members: some biogeochemical implications for the westernMediterranean Sea. J. Geophys. Res. 107, 1–11.
Herut, B., Krom, M.D., Pan, G., Mortimer, R., 1999. Atmospheric input of nitrogen andphosphorus to the Southeast Mediterranean: sources, fluxes, and possible impact.Limnol. Oceanogr. 44 (7), 1683–1692.
Herut, B., Nimmo, M., Medway, Angela, Chester, R., Krom, M.D., 2001. Dry atmosphericinputs of trace metals at the Mediterranean coast of Israel (SE Mediterranean):sources and fluxes. Atmos. Environ. 35, 803–813.
Huggins, F.E., Shah, N., Huffman, G.P., Robertson, J.D., 2000. XAFS spectroscopiccharacterization of elements in combustion ash and fine particulate matter. FuelProcess. Technol. 65–66, 203–218.
Legrand, M., Puxbaum, H., 2007. Summary of the CARBOSOL project: present andretrospective state of organic versus inorganic aerosol over Europe. J. Geophys. Res.112, 1–7.
Leslie, A.C.D., 1981. Aerosol emissions from forest and grassland burnings in thesouthern Amazon Basin and central Brazil. Nucl. Instrum. Methods 181, 345–351.
Levin, Z., Ganor, E., Gladstein, V., 1996. The effects of desert particles coated with sulfateon rain formation in the Eastern Mediterranean. J. Appl. Meteorol. 35, 1511–1523.
Lucotte, M., d Angeljan, B., 1985. A comparison of several methods for the determinationof iron hydroxides and associated orthophosphates in estuarine particulate matter.Chem. Geol. 48, 257–264.
Mackey, K., et al., 2007. Phosphorus availability, phytoplankton community dynamics,and taxon-specific phosphorus status in the Gulf of Aqaba, Red Sea.
Markaki, Z., et al., 2003. Atmospheric deposition of inorganic phosphorus in theLevantine Basin, Eastern Mediterranean: spatial and temporal variability and itsrole in seawater productivity. Limnol. Oceanogr. 48 (4), 1557–1568.
Mignon, C., Sandroni, V., 1999. Phosphorus in rainwater: partitioning inputs and impacton the surface coastal ocean. Limnol. Oceanogr. 44, 1160–1165.
Migon, C., Sandroni, V., 1999. Phosphorus in rainwater: partitioning inputs and impacton the surface coastal ocean. Limnol. Oceanogr. 44, 1160–1165.
Moutin, T., et al., 2008. Phosphate availability and the ultimate control of new nitrogeninput by nitrogen fixation in the tropical Pacific Ocean. Biogeosciences 5, 95–109.
Paytan, A., McLaughlin, K., 2007. The oceanic phosphorus cycle. Chem. Rev. 107,563–576.
Pio, C., et al., 2007. Climatology of aerosol composition (organic versus inorganic) atnonurban sites on a west–east transect across Europe. J. Geophys. Res. 112, 1–15.
Puxbaum, H., et al., 2007. Levoglucosan levels at background sites in Europe forassessing the impact of biomass combustion on the European aerosol background.J. Geophys. Res. 112, 1–11.
Rahn, K.A., Lowenthal, D.H., 1984. Elemental tracers of distant regional pollutionaerosols. Science 223 (4632), 132–139.
Ridame, C., Guieu, C., 2002. Saharan input of phosphate to the oligotrophic water of theopen western Mediterranean Sea. Limnol. Oceanogr. 47 (3), 856–869.
Ruttenberg, K.C., 1990. Diagenesis and burial of phosphorus in marine sediments:Implications for the marine phosphorus budget. Ph.D. Thesis, Yale University, 375 pp.
Ruttenberg, K.C., 1992. Development of a sequential extraction method for differentforms of phosphorus in marine sediments. Limnol. Oceanogr. 37 (7), 1460–1482.
Sander, M.-L., Andrén, O., 1997. Ash from cereal and rape straw used for heatproduction: liming effect and contents of plant nutrients and heavy metals. WaterAir Soil Pollut. 93, 93–108.
Sanudo-Wilhelmy, S.A., et al., 2001. Phosphorus limitation of nitrogen fixation byTrichodesmium in the central Atlantic Ocean. Nature (411), 66–69.
Savenko, A.V., 2007. Physicochemical mechanism of the formation of recent diageneticphosphorites in the ocean. Geochemistry 418, 174–177.
Taylor, S.R., McLennan, S.M., 1995. The geochemical evolution of the continental crust.Rev. Geophys. 33, 241–265.
Turekian, K.K., Wedepohl, K.H., 1961. Distribution of the elements in somemajor units ofthe Earth's crust. Geol. Soc. Am. Bull. 72, 175–192.
Tyrell, T., 1999. The relative influences of nitrogen and phosphorus on oceanic primaryproductivity. Nature 400, 525–531.
Venkataraman, C., Reddy, C.K., Josson, S., Reddy, M.S., 2002. Aerosol size and chemicalcharacteristics at Mumbai, India, during the INDOEX-IFP (1999). Atmos. Environ.36, 1979–1991.
Wedepohl, K.H., 1995. The composition of the continental crust. Geochim. Cosmochim.Acta 59, 1217–1232.
Westheimer, F.H., 1987. Why nature chose phosphates. Science 235, 1173–1178.Yatin, M., et al., 2000. Atmospheric trace elements in Ankara, Turkey: 1. Factors affecting
chemical composition of fine particles. Atmos. Environ. 34, 1305–1318.