phosphorus and nitrogen removal in modified biochar...
TRANSCRIPT
UPTEC W 17 002
Examensarbete 30 hpMaj 2017
Phosphorus and Nitrogen Removal in Modified Biochar Filters
Ylva Stenström
i
ABSTRACT
Phosphorus and Nitrogen Removal in Modified Biochar Filters
Ylva Stenström
Onsite wastewater treatment systems in Sweden are getting old and many of them lack sufficient
phosphorus, nitrogen and organic carbon reduction. Biochar is a material that has been suggested
as an alternative to the common sand or soil used in onsite wastewater treatment systems. The
objective of this study was to compare the phosphorus removal capacity between three different
modified biochars and one untreated biochar in a batch adsorption and column filter experiment.
The modifications included impregnation of ferric chloride (FeCl3), calcium oxide (CaO) and
untreated biochar mixed with the commercial phosphorus removal product Polonite. To further
study nitrogen removal a filter with one vertical unsaturated section followed by one saturated
horizontal flow section was installed.
The batch adsorption experiment showed that CaO impregnated biochar had the highest
phosphorus adsorption, i.e. of 0.30 ± 0.03 mg/g in a 3.3 mg/L phosphorus solution. However, the
maximum adsorption capacity was calculated to be higher for the FeCl3 impregnated biochar
(3.21 ± 0.01 mg/g) than the other biochar types. The pseudo 2nd order kinetic model proved better
fit than the pseudo 1st order model for all biochars which suggest that chemical adsorption was
important. Phosphorus adsorption to the untreated and FeCl3 impregnated biochar fitted the
Langmuir adsorption isotherm model best. This indicates that the adsorption can be modeled as a
homogenous monolayer process. The CaO impregnated and Polonite mixed biochars fitted the
Freundlich adsorption model best which is an indicative of heterogenic adsorption.
CaO and FeCl3 impregnated biochars had the highest total phosphorus (Tot-P) reduction of
90 ± 8 % and 92 ± 4 % respectively. The Polonite mixed biochar had a Tot-P reduction of
65 ± 14 % and the untreated biochar had a reduction of 43 ± 24 %. However, the effluent of the
CaO impregnated biochar filter acquired a red-brown tint and a precipitation that might be an
indication of incomplete impregnation of the biochar. The FeCl3 effluent had a very low pH. This
can be a problem if the material is to be used in full-scale treatment system together with biological
treatment for nitrogen that require a higher pH.
The nitrogen removal filter showed a total nitrogen removal of 62 ± 16 % which is high compared
to conventional onsite wastewater treatment systems. Batch adsorption and filter experiment
confirms impregnated biochar as a promising replacement or addition to onsite wastewater
treatment systems for phosphorus removal. However the removal of organic carbon (as chemical
oxygen demand COD) in the filters was lower than expected and further investigation of organic
carbon removal needs to be studied to see if these four biochars are suitable in real onsite
wastewater treatment systems.
Keywords: biochar, modified biochar, phosphorus filter, wastewater, batch adsorption experiment, nitrogen
filter, COD, Tot-P, Tot-N
Department of Molecular Sciences, Swedish University of Agricultural Science (SLU)
Almas allé SE 750 07 UPPSALA
ii
REFERAT
Fosfor och kväverening i modifierade biokolsfilter Ylva Stenström
Många av Sveriges små avloppssystem är gamla och saknar tillräcklig rening av fosfor, kväve och
organiskt material. Följden är förorenat grundvatten samt övergödning i hav, sjöar och vattendrag.
Lösningar för att förbättra fosfor- och kvävereningen finns på marknaden men många har visat
brister i rening och robusthet. Biokol är ett material som har föreslagits som ersättare till jord eller
sand i mark och infiltrationsbäddar. Denna studie syftade till att i skak- och kolonnfilterexperiment
jämföra fosforreduktion mellan tre modifierade biokol och ett obehandlat biokol. Modifieringen av
biokolet innebar impregnering med järnklorid (FeCl3), kalciumoxid (CaO) samt blandning med
Polonite som är en kommersiell produkt för fosforrening. För att undersöka förbättring av
kväverening installerades även ett filter med obehandlat biokol där en vertikal aerob modul
kombinerades med en efterföljande horisontell anaerob modul.
Skakstudien där biokolen skakades i 3.3 mg/L fosforlösning visade att adsorptionen var högst i det
CaO-impregnerade biokolet, 0.3 ± 0.03 mg/g. Den maximala potentiella fosforadsorptionen
beräknades dock vara högst för biokolet som impregnerats med FeCl3, 3.21 ± 0.01 mg/g.
Skakförsöket visade också att fosforadsorptionen var främst kemisk då adsorptionen passade bättre
med pseudo andra ordningens modell än pseudo första. Adsorption av fosfor på obehandlat biokol
och FeCl3 impregnerat biokol modellerades bäst med Langmuir modellen, vilket tyder på en
homogen adsorption. Det Polonite-blandade biokolet och CaO-impregnerade biokolet
modellerades bäst med Freundlich modellen vilket är en indikation på en heterogen
adsorptionsprocess.
Biokol impregnerat med CaO och FeCl3 gav de högsta totalfosforreduktionerna på 90 ± 8 %
respektive 92 ± 4 %. Biokolet som var blandat med Polonite hade en reduktion på 65 ± 14 % och
det obehandlade biokolet 43 ± 24 %. Ett problem med filtratet från CaO-filtret var att det fick en
rödbrun färg samt en fällning vilket kan ha berott på ofullständig pyrolysering och impregnering.
Filtratet från det FeCl3 impregnerade biokolet hade mycket lågt pH vilket kan vara problematiskt
om mikrobiologisk tillväxt i filtret för rening av kväve och organiskt material vill uppnås.
Filtret för kväverening gav en total kvävereduktion på 62 ± 16 % vilket är högre än kommersiella
system. Resultaten från skak och filterstudien visade på att impregnerade biokol kan ge en
förbättrad fosforrening om de skulle användas i små avloppssystem. Rening av organiskt material,
kemisk syreförbrukning (COD), var dock låg i alla filter och behöver studeras ytterligare för att
avgöra om dessa biokol är lämpliga för småskalig avloppsvattenrening.
Nyckelord: biokol, impregnerat biokol, fosforfilter, avloppsvatten, skakexperiment, kvävefilter, COD,
Tot-P, Tot-N
Institutionen för molekylära vetenskaper, Sveriges lantbruksuniversitet (SLU), Almas allé 5 SE 750-07 Uppsala
iii
PREFACE
This project is the final thesis for the Master’s Program in Environmental and Water Engineering
at Uppsala University (UU) and the Swedish University of Agricultural Science (SLU). It
corresponds to 30 ETCS. The project was financed by the Swedish Agency for Marine and Water
Management. I would like to give thanks to my supervisor and biochar expert Sahar Dalahmeh,
researcher at the Department of Energy and Technology at SLU, for helping me with everything
throughout the project. I would also like to thank the subject reviewer Mikael Pell, professor at the
Department of Molecular Sciences at SLU for help with the experiments and with thorough
reviewing of the report.
Special thanks go to Nicholas Tenser, operating technician at Kungsängsverket for helping me with
providing equipment, relocating heavy filters and in the hazardous work of collecting wastewater.
A final thanks to Eric Cato, operating engineer at Kungsängsverket for help with installing the filter
and providing data from the WWTP lab.
Uppsala, February 2017
Ylva Stenström
Copyright © Ylva Stenström and the Department of Molecular Sciences, Swedish University of
Agricultural Science (SLU) UPTEC W 17 002, ISSN 1401-5765
Digitally published at the department of Earth Sciences, Uppsala University, 2017
iv
POPULÄRVETENSKAPLIG SAMANFATTNING
Kväve och fosforrening i modifierade biokolsfilter Ylva Stenström
Till små avloppsanläggningar räknas de anläggningar som renar avloppsvatten för upp till ca 200
personer. De flesta anläggningarna som används idag byggdes på 1970 och 80-talet. Många av dem
har börjat tappa funktionen och renar avloppsvattnet allt sämre. De flesta små avlopp är
markbaserade där avloppsvatten renas genom att filtreras genom en bädd med sand eller direkt ner
i jorden. I marken eller sanden börjar det växa bakterier som konsumerar kväve och organiskt
material (COD). Fosfor i avloppsvattnet fastnar också i marken genom bindning till
markpartiklarna. Då avloppsanläggningar inte fungerar som avsett släpps kväve, fosfor och COD
ut i grundvatten eller ytvatten. Orenat avloppsvatten i grundvatten är inte önskvärt eftersom många
hämtar sitt dricksvatten därifrån. Näringsämnen som hamnar i ytvatten skapar övergödning och
algblomningar vilket förstör vattenmiljöer, badplatser och förutsättningar för fisk. I Östersjön
märks det att de små avloppen har stor påverkan. Även fast bara 10 % av Sveriges befolkning renar
sitt avloppsvatten i små avlopp står de för 15 % av det totala fosfortillskottet. Resten av Sveriges
befolkning (ca 90 %) som renar sitt vatten i större reningsverk står för endast 18 % av
fosforbelastningen. För att förbättra reningen i små avlopp har nya prefabricerade lösningar
introducerats på marknaden. Ett problem med dessa är dock att de behöver omfattande tillsyn och
underhåll och inte är särskilt robusta.
Ett material som har visat sig vara intressant för avloppsvattensrening är biokol. Biokol är
egentligen samma material som grillkol men som tillverkats med miljömässigt eller agronomiskt
syfte. Biokol är mest känt för sina jordförbättrande egenskaper inom odling, men materialets stora
yta och bindningsförmåga gör det lämpligt för kväve och fosforrening. Om man jämför ett gram
biokol med ett gram sand finns det i biokolen 100 gånger så stor yta där fosfor kan fastna. Den
större ytan gör även biokol till ett bra material för tillväxt av mikroorganismer. I tidigare studier
har det kommit fram att biokol är väldigt bra på att ta bort organiskt material (> 90 % COD
borttagning). Dock finns fortfarande brister i fosfor- och kvävereduktion. I denna studie
undersöktes därför modifierade biokol för att se om en modifiering kunde öka reningsgraden.
För att undersöka fosforreduktion impregnerades biokol gjort av pilbark med järnklorid och
kalciumoxid som är två kemikalier som används för fosforbindning. Ett tredje biokol blandades
med det fosforbindande materialet Polonite som innehåller mycket kalk. De impregnerade biokolen
och polonitkolet jämfördes med obehandlat pilbarkskol i ett skakförsök. I skakförsöket skakades
de i olika koncentrationer av fosforlösningar för att se hur mycket som kunde bindas. Biokolen
testades också i ett kolonnförsök där de packades i kolonner för att filtrera riktigt avloppsvatten.
För att undersöka kvävereningsförmågan byggdes ett avloppsvattenfilter med två delar, en del med
vertikalt flöde följt av en vattenfylld del med horisontellt flöde. Detta skapade ett filter med en
syresatt del följt av en syrefattig vilket är gynnsamt för de bakterier som renar kväve.
Resultatet från skakstudien visade att det kalciumoxidimpregnerade biokolet hade störst kapacitet
att avlägsna fosfor. Det framgick också att järnkloridimpregnerat biokol har stor potential att binda
fosfor men att bindningen tar längre tid. Från kolonnexperimentet var det klart att de kalciumoxid-
v
och järnkloridimprgnerade biokolen hade högst fosforreduktion på mer än 90 %. Inget av de två
kolen visade tecken på minskad fosforreningsförmåga under studien. Ett problem med de
impregnerade biokolsfiltrena var att utflödet från det kalciumoxidbehandlade materialet fick en
gul-brunaktig färg samt en fällning vilket kan betyda att kolet inte hade blivit helt förkolnat vid
tillverkningen. En bättre impregnering av kalciumoxid hade möjligen resulterat i en bättre karaktär
på vattnet. Vatten filtrerat i järnkloridfiltret hade väldigt lågt pH vilket kan vara ett problem om
man vill använda materialet som fosfor och kvävefilter, då de kvävereducerande bakterierna trivs
i ett högre pH. Det polonitblandade biokolet hade en fosforreduktion på ca 65 % medan det
obehandlade biokolet bara tog bort ca 43 %. Både Polonite-biokolsfiltret och det obehandlade
biokolsfiltret tappade i effektivitet under försökets gång. Kvävefiltret visade hög
kvävereningsförmåga på ca 60 %.
Denna studie visar att biokol tillverkat av pilbark inte var bättre att rena avloppsvatten från kväve
och fosfor än konventionella små avloppsanläggningar. Men om biokolet modifieras med
impregnering kan materialet ses som lovande för fosforrening. Om en syrefri del läggs till i ett
biokolsfilter kan kvävereningen också förbättras väsentligt. Dock krävs vidare studier för att
undersöka hur biokolfilter bäst kan användas. Intressant var även att alla biokolfilter visade en låg
COD borttagningsförmåga jämfört med tidigare studier vilket även det skulle behöva undersökas
vidare.

vi
1. INTRODUCTION ...................................................................................................................... 1
1.1 ONSITE WASTWATER TREATMENT SYSTEMS ........................................................... 1
1.2 BIOCHAR .............................................................................................................................. 3
1.3 IMPREGNATED BIOCHAR ................................................................................................. 4
1.4 OBJECTIVES ......................................................................................................................... 4
2. MATERIALS AND METHOD ................................................................................................. 5
2.1 BIOCHAR PREPERATION .................................................................................................. 5
2.2 BATCH ADSORPTION EXPERIMENT .............................................................................. 5
2.2.1 Adsorption isotherm ......................................................................................................... 6
2.2.2 Kinetic isotherm ............................................................................................................... 7
2.3 COLUMN FILTERS .............................................................................................................. 8
2.4 NITROGEN REMOVAL FILTER ...................................................................................... 10
3. RESULTS .................................................................................................................................. 11
3.1 BATCH ADSORPTION EXPERIMENT ............................................................................ 11
3.1.1 Adsorption isotherm ....................................................................................................... 13
3.1.2 Kinetic isotherms ........................................................................................................... 15
3.2 COLUMN FILTERS ............................................................................................................ 17
3.3 NITROGEN REMOVAL FILTER ...................................................................................... 20
4. DISCUSSION ........................................................................................................................... 23
4.1 BATCH ADSOPTION EXPERIMENT ............................................................................... 23
4.2 COLUMN FILTER EXPERIMNET .................................................................................... 25
4.3 NITROGEN REMOVAL FILTER ...................................................................................... 26
4.4 COMPARING BIOCHARS AND FILTERS ....................................................................... 27
5. CONCLUSIONS ....................................................................................................................... 29
5.1 SUGGESTIONS FOR FURTHER EXPERIMENTS .......................................................... 29
6. REFERENCES ......................................................................................................................... 30
7. APPENDIX ............................................................................................................................... 33
APPENDIX I - Shaking experiment ........................................................................................... 33
APPENDIX II - Adsorption isotherms ....................................................................................... 34
APPENDIX III - Kinetic isotherms ............................................................................................ 36
APPENDIX VI - Filter experiments ........................................................................................... 38
1
1. INTRODUCTION
It is estimated that there are about 750 000 onsite wastewater treatment systems (OWTSs) in
Sweden. Out of these, only 400 000 have a treatment process that goes beyond primary
sedimentation. Most existing sites were built in the 1970s and 1980s (Ridderstolpe, 2009), and
today many systems are getting old and lack sufficient pollution reduction. This leads to discharge
of nitrogen (N) and phosphorus (P) into the environment causing eutrophication in downstream
water bodies (Hjelmqvist, 2012; Ejhed et al., 2004; Naturvårdsverket, 2014). Another problem is
that drilled drinking water wells risk contamination from nearby malfunctioning OWTSs
(Miljömålsrådet, 2010).
P has been suggested as a major concern regarding small wastewater treatment systems
(Ridderstolpe, 2009). Only a small fraction (about 10 %) of Sweden’s population uses OWTS, yet
they represent 15 % of the total net anthropogenic load of P on the Baltic Sea. This can be compared
with the load from larger wastewater treatment plants (WWTPs) treating the water of 90 % of the
population, but is responsible for only 18 % of the P load (HaV, 2016a). For eutrophication to
decrease in Swedish waters the level of P emissions have to decline (Boesch et al., 2006). The N
load to the Baltic sea from OWTS is small relative other anthropogenic sources (HaV, 2016a).
Nevertheless it is still important that the systems have a sufficient N treatment to prevent
eutrophication close to them and inadvertent pollution of ground water reservoirs that are used as
drinking water resources.
1.1 ONSITE WASTWATER TREATMENT SYSTEMS
OWTSs are defined as systems treating wastewater for up to 200 population equivalents and most
OWTSs in Sweden are built as vertical soil filters. The filters are installed with a septic tank in
which heavy particles in the wastewater undergo sedimentation. The water is then either led by
gravity or pumped into an infiltration unit. The effluent from infiltration units with closed bottoms
is collected and conveyed to a ditch or river. Effluent from infiltration systems with open bottom
is discharged directly to the ground water. In the latter the water percolates the underlying natural
soil. The vertical distance from the filter bottom to the ground water table is crucial and needs to
be at least 1 m (Ridderstolpe, 2009). The recommended hydraulic load for a Swedish OWTS is
30 – 60 L/m2 and day (Olshammar et al., 2015).
The main mechanism behind P removal in vertical soil filters is adsorption or precipitation to the
soil or bed material. The phosphate ions (PO43+) adsorbed to the surface of the material can also
react with iron (Fe), aluminum (Al) or calcium (Ca) minerals to form strong precipitates or surface
complexes. The pH in the soil affects the reaction. At low pH, the phosphate reacts with Fe and Al
more easily forming e.g. FePO4·H2O. At higher pH the PO43+ forms complexes with Ca ions more
easily, such as CaHPO4·2H2O and Ca4H(PO4)·3H2O (US EPA, 2002). Some of the P bound in
organic particles can be removed physically by the filtration through the soil. Initially the P
reduction can be very high. But the capacity to remove P will successively decrease and at some
point the bed material will reach saturation. At this time the efficiency of the P removal will be
essentially lowered or even cease (Olshammar et al., 2015). It has also been shown that P may be
2
released (desorbed) from the material in the event of heavy rains (Eveborn et al., 2012). This has
made it difficult to estimate the lifetime of P removal in soil infiltration beds.
N in vertical soil filters is removed partly by adsorption by ammonium (NH4+). However, the main
removal mechanism is through bacterial mediated processes. Bacterial growth is favored in soils
and materials with large pore volume and specific surface area (US EPA, 2002). By consuming
organic material (measured as chemical oxygen demand, COD, or biochemical oxygen demand,
BOD) in the wastewater, the bacteria will grow and create an active biofilm. Some parts of the
biofilm will be exposed to air and other parts will not. Nitrifying bacteria in the biofilm derive their
energy from oxidation of NH4+ to nitrite (NO2
-) in a first step and then further to nitrate (NO3-).
This process called nitrification is aerobic and the bacteria derive their carbon from carbon dioxide
fixation. Under anaerobic conditions, another group of bacteria called denitrifying bacteria reduces
NO3- or other nitrogen oxides to form nitrous oxide (N2O) and nitrogen gas (N2) in a process called
denitrification. When denitrifying the NO3- is used instead of oxygen for respiration. In addition,
denitrifying bacteria must be supplied with a readily available energy and carbon source to
denitrify. The combined nitrification-denitrification will lower the total content of N (Tot-N) in the
water (US EPA, 2002).
The rate of rebuilding and improving older OWTSs is low. Even some newly built systems have
shown poor pollutant reduction and do not pass the regulations on nutrient reduction. The Swedish
Agency for Marine and Water Management (Havs och Vattenmyndigheten) issued a proposition
in 2016 during the time that this thesis was being written. The proposition was to decrease the
required total P (Tot-P) removal from 70 % to be 40 % for general sites. However, for areas
classified as sensitive to wastewater the required Tot-P reduction was to be increased to 90 % (HaV,
2016b). Furthermore, the reduction of organic material was suggested to be at least 90 % for all
sites. It was also suggested that requirements for N reduction should be removed completely for
general OWTS. However requirements for N removal was suggested to be put to 50 % if the area
is classified as sensitive. A soil based wastewater system built according to present
recommendations has the capability to remove 30 ± 10 %, 70 ± 20 % and 80 ± 10 % of influent N,
P and COD, respectively (Olshammar et al., 2015). One problem is that many systems today have
not been built according to the recommended guidelines. A common mistake is to locate the soil
filter too close to the ground water, less than one meter. If the distance is too short the water does
not get treated. N and P removal also show large variations depending on soil, placement and load.
To improve the P and N removal in vertical soil filters, alternative solutions and upgrades have
become available on the market. An example is precipitation in the septic tank using iron or
aluminum salts that significantly improves the P removal rate. Other popular but not as common
upgrades are prefabricated treatment systems such as separate phosphor filters. Phosphor filters are
commonly made from material with high calcite content and are placed after a closed sand bed to
polish the effluent water. They are said to be able to remove up to 90 % of the P (Avloppsguiden,
2009). Polonite is an example of a material used in P filters. It is produced by heating the
sedimentary rock opoka that has a high silica and CaO content. Opoka also contains MgO, Al2O3
and Fe2O3 that helps improve P removal (Brogowski & Renman, 2004). Solutions for improving
N removal also exist. They can for instance be compact mini-treatment plants, mimicking
large-scale WWTPs. There are many different versions of mini treatment plants but most are built
3
with sedimentation, biological and chemical treatment. All mini-treatment plants use nitrification-
denitrification for the reduction of N and can remove around 30 – 60 % of total N. Artificial bed
material with large specific surface area is also a method to ensure good microbial development
yielding N and BOD removal rates of about 20 – 40 and 90 %, respectively (Avloppsguiden, 2009).
Alternative treatment methods, like the ones mentioned, have shown higher P, N and BOD removal
rates than vertical soil filters, but as of today require much supervision and service (HaV, 2016b).
A treatment system based on infiltration requires minimal attention and is robust to changes in both
load and temperature (Ridderstolpe, 2009). A robust system with high removal capacity is
desirable. However, the lack of quality in vertical soil filters makes it necessary to look for new
solutions for a secure reduction on P and N.
1.2 BIOCHAR
Char is the product of pyrolysis, where biomass is heated at high temperatures with no access to
oxygen. Char is known for its ability to improve soil quality and plant growth. It has also proven
itself useful for energy production, climate change mitigation and water treatment. Biochar is
defined as char specifically produced for agronomic and environmental management applications
(Joseph & Lehman, 2009). The char created after pyrolysis does not degrade over time, but is still
a reactive material. The material is similar to activated carbon but does not undergo any activation
process, making it a less expensive alternative. Yet biochar has twice the porosity of sand and has
a specific surface area more than a 100 times higher than sand or soil with corresponding particle
size (Dalahmeh, 2016). This gives biochar an excellent adsorption potential and can create a good
environment for microbiological growth which could be beneficial for P, N and COD removal.
P adsorption to biochar is physical and/or chemical. The physical adsorption constitutes weak van
der Waals forces between the phosphate ions and the surface. The large pore volume and specific
surface area of biochar increases the potential for physical adsorption (Lehmann & Joseph, 2009).
What chemical reaction that binds the P depends on the biochar surface and its chemical
composition.
A review of several different biochar experiments showed that P removal was not affected much
by hydraulic loading rate or particle size (Dalahmeh, 2016). However, to reach an optimal removal
of COD and pathogens, a particle size of 1.4 mm and hydraulic load of less than 50 L/m2 and day
was recommended. In the results of the review it was clear that biochar had the capacity to remove
62 – 88 % of the total nitrogen (Tot-N). Biochar also had the capacity to remove 32 – 89 % of the
total P (Tot-P), highly depending on its mother material. COD and BOD removal in biochar filters
was proven to be high (> 90%) and consistent while it was suggested that the P and N removal
processes in biochar filters needed further investigation to reach sufficient and reliable reduction
(Dalahmeh, 2016).
4
1.3 IMPREGNATED BIOCHAR
Recent studies of modified biochar have focused on removal of several different substances; from
reduction of heavy metals to carbon dioxide emissions. To impregnate or modify biochar with
different elements as a method to improve the removal of specific substances is a growing research
field (Rajapaksha et al., 2016). Modifications may occur before or after the biomass undergoes
pyrolysis and can include heat treatment, impregnation of different substances and acid or base
treatment to change and improve structure and removal properties. Modification of biochar with
the objective to remove P has been investigated in a few studies by preforming sorption
experiments with P solutions. In a study by Chen et al. (2011), biochar powder for P removal was
produced at different temperatures and impregnated with magnetite (Fe2O3) with a biochar to Fe
ratio of 0.9. The modified biochar showed higher P adsorption (up to 99 % removal) compared to
unmodified replicates. Adding iron oxides to the biochar can also have structural benefits
producing larger pore volume and specific surface area (Ren et al., 2015). Ferric chloride biochar
has been studied by Li et al. (2016) where a Fe to biochar ratio of 0.7 in the biochar resulted in a P
adoption as high as 16.58 mg P/g biochar which could be compared to natural sand that can have
an adsorption less than 1 mg/g P (Del Bubba et al., 2003). When Liu et al. (2015) tested column
filters with Fe modified biochar, 99 % of the Tot-P concentration was removed. Ca modified
biochar filters have been studied for the removal of arsenic and chromium (Agrafioti et al., 2014)
but is not as common for P removal. However Seo et al. (2005) impregnated and compared
construction aggregate quarry with CaO, Al and Fe and found that the CaO impregnated material
had superior P removal. Jung et al. (2016) analyzed fine biochar material produced by algae,
drained and dried in calcium-alginate beads to investigate P removal and found that the biochar
had the capacity to remove 100 mg P/g biochar.
1.4 OBJECTIVES
The overall goal of the project was to investigate the potential of biochar as filter media for removal
of wastewater pollutants. Biochar filter materials were tested in a batch adsorption experiment with
various phosphate concentrations and in filters for removal of P, N and COD from municipal
wastewater. Specific objectives were to:
(i) Evaluate P removal capacity using biochar modified by impregnation with ferric
chloride, calcium oxide and biochar mixed with Polonite in a batch adsorption
experiment using increasing concentrations of phosphate solutions.
(ii) Evaluate P removal capacity using the same biochar types as in (i) but in a column filters
fed with wastewater.
(iii) Investigate N transformation and removal in a biochar filter unit consisting of a vertical
flow non-saturated section followed by a horizontal flow saturated section.
5
2. MATERIALS AND METHOD
2.1 BIOCHAR PREPERATION
Pine bark of particle size of 1 – 7 mm was saturated with solutions of ferric chloride (FeCl3),
calcium oxide (CaO) before pyrolysis. FeCl3 and CaO are two common precipitation chemicals
used for P removal (US EPA, 2002). After being mixed in the solutions for 24 hours in room
temperature, the bark was dried in 100 ºC for another 24 hours. Finally the biochars were pyrolysed
in 350 ºC for 3.5 hours. The ratio between ion and biochar was 0.3 for both impregnated biochars.
The third biochar type was produced without any impregnation before pyrolysis but also had the
pine bark as mother material. After pyrolysis, it was mixed with granular Polonite at a ratio of 0.3.
The four different types of modified biochar used in the batch experiment and column filter
experiment were named as follows:
UBC – untreated biochar
FBC – biochar impregnated with ferric chloride (FeCl3)
CBC –biochar impregnated with calcium oxide (CaO)
PBC–biochar mixed with Polonite
The biochar used in the N removal filter originated from mixture of hard wood biomass and was
obtained from Vildelkol AB (Vindelkol, 2017).
2.2 BATCH ADSORPTION EXPERIMENT
A batch experiment was carried out to assess and compare the adsorption capacity of P for the
different types of biochar. One gram of each biochar type was added to 500 mL E-flasks containing
100 mL of phosphate solution of the concentrations 0.5, 3.3, 6.5, 13 and 26 mg
PO4-P/L (labeled C1-C5). The concentration were prepared by diluting 1000 mg PO4/L stock
solution based on monopotassium phosphate (KH2PO4) with distilled water (Table 1). The PO4-P
concentrations were selected based on what can be expected in an OWTS and diluted according to
Table 1 (Palm et al., 2002). Three replicates (n=3) were prepared for each concentration except for
C1 having only one replicate (n=1). The beakers were shaken on a rotary table for 24 hours at 130
rpm and constant room temperature 20 ± 2 ºC. Samples of the adsorbate solution (6 mL) from each
of the beakers were extracted after 0 min, 15 min, 75 min, 4 h and 24 h using a pipette. The sorbate
samples were filtered through a 0.45 µm filter and their PO4-P concentration was determined
according to method given in Table 2. The pH of the P solutions with biochar was measured during
the experiment using pH strips (Table 2). After 24 hours the residual solids were washed with
deionized water and then oven dried 80 ºC for 4 hours. The solids were finally stored in plastic
bags for later analysis using Scanning Electron Microscopy (SEM) and Fourier Transform- Infrared
Spectroscopy (FTIR), but this analysis was not performed during this thesis and was thus not
included in the report.
6
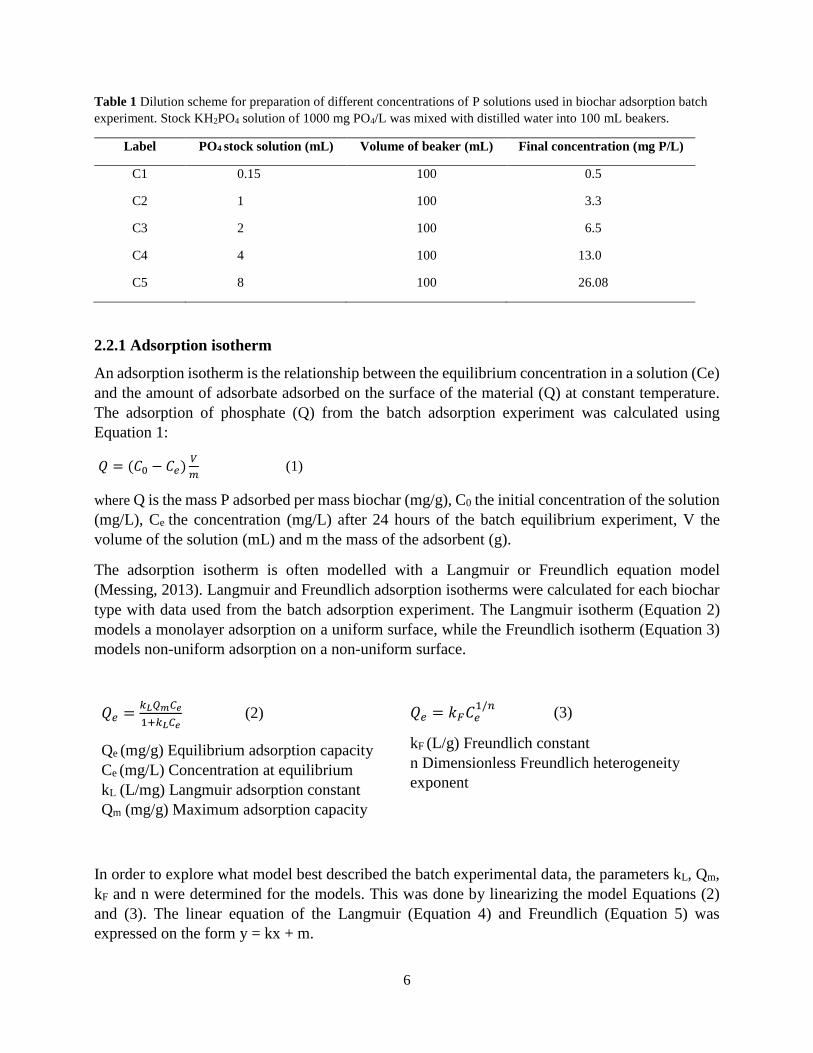
Table 1 Dilution scheme for preparation of different concentrations of P solutions used in biochar adsorption batch
experiment. Stock KH2PO4 solution of 1000 mg PO4/L was mixed with distilled water into 100 mL beakers.
Label PO4 stock solution (mL) Volume of beaker (mL) Final concentration (mg P/L)
C1 0.15 100 0.5
C2 1 100 3.3
C3 2 100 6.5
C4 4 100 13.0
C5 8 100 26.08
2.2.1 Adsorption isotherm
An adsorption isotherm is the relationship between the equilibrium concentration in a solution (Ce)
and the amount of adsorbate adsorbed on the surface of the material (Q) at constant temperature.
The adsorption of phosphate (Q) from the batch adsorption experiment was calculated using
Equation 1:
𝑄 = (𝐶0 − 𝐶𝑒)𝑉
𝑚 (1)
where Q is the mass P adsorbed per mass biochar (mg/g), C0 the initial concentration of the solution
(mg/L), Ce the concentration (mg/L) after 24 hours of the batch equilibrium experiment, V the
volume of the solution (mL) and m the mass of the adsorbent (g).
The adsorption isotherm is often modelled with a Langmuir or Freundlich equation model
(Messing, 2013). Langmuir and Freundlich adsorption isotherms were calculated for each biochar
type with data used from the batch adsorption experiment. The Langmuir isotherm (Equation 2)
models a monolayer adsorption on a uniform surface, while the Freundlich isotherm (Equation 3)
models non-uniform adsorption on a non-uniform surface.
𝑄𝑒 =𝑘𝐿𝑄𝑚𝐶𝑒
1+𝑘𝐿𝐶𝑒 (2)
Qe (mg/g) Equilibrium adsorption capacity
Ce (mg/L) Concentration at equilibrium
kL (L/mg) Langmuir adsorption constant
Qm (mg/g) Maximum adsorption capacity
𝑄𝑒 = 𝑘𝐹𝐶𝑒1/𝑛
(3)
kF (L/g) Freundlich constant
n Dimensionless Freundlich heterogeneity
exponent
In order to explore what model best described the batch experimental data, the parameters kL, Qm,
kF and n were determined for the models. This was done by linearizing the model Equations (2)
and (3). The linear equation of the Langmuir (Equation 4) and Freundlich (Equation 5) was
expressed on the form y = kx + m.
7
𝐶𝑒
𝑄𝑒=
𝐶𝑒
𝑄𝑚+
1
𝑘𝐿𝑄𝑚 (4) ln(𝑄𝑒) =
1
𝑛𝑙𝑛𝐶𝑒 + ln(𝑘𝐹) (5)
Linear plots of the Langmuir Equation (4) were created with Ce as x-axis vs Ce/Qe as y-axis. This
provided the Langmuir parameters Qm and kL were 1/kLQm is the intercept and 1/Qm as the slope.
Graphing Equation (5) with ln(Ce) on the x-axis and ln(Qe) on the y-axis provided the Freundlich
parameters kF and n where ln(kF) was the intercept and 1/n the slope. This was done for all biochar
types.
After obtaining all the parameters, Qe was calculated for each Ce with the Langmuir and Freundlich
Equations (2) and (3). The model that calculated Qe correlated best with the experimental Qe was
considered the best model to describe the P adsorption on each biochar type.
2.2.2 Kinetic isotherm
A kinetic isotherm describes the adsorption (Q) over time (t). The concentrations analyzed after 0
min, 15 min, 75 min, 4 h and 24 h in the batch adsorption experiment were used to calculate Qt
with Equation (1). The pseudo first (Equation 6) and second (Equation 7) order kinetic models are
commonly used to describe the adsorption over time:
𝑑𝑄𝑡
𝑑𝑡= 𝑘1(𝑄𝑒 − 𝑄𝑡) (6)
𝑑𝑄𝑡
𝑑𝑡= 𝑘2(𝑄𝑒 − 𝑄𝑡)2 (7)
Qt (mg/L) Amount adsorbed at time t
k1 (min-1) Pseudo 1st rate constant
k2 (g/mg/min) Pseudo 2nd rate constant
In order to see which of pseudo 1st and pseudo 2nd order kinetic models best described the
adsorption experiment their linear forms Equation (8) and (9) were used:
ln (𝑄𝑒 − 𝑄𝑡) = 𝑙𝑛𝑄𝑒 − 𝑘1𝑡 (8)
𝑡
𝑄𝑡=
1
𝑘2𝑄𝑒+
𝑡
𝑄𝑒 (9)
The pseudo 1st order equation was graphed on linear form with ln(Qe – Qt) on the y-axis and t on
the x-axis. From the linear plot the rate constant k1 (slope of the graph) and correlation coefficient
R2 was determined. Pseudo 2nd order equation was linearly graphed with t/Qt on the y-axis and t on
the x-axis with the intercept of the graph being 1/k2Qe and the slope 1/Qe. By plotting data this way
the k2 and R2 for the pseudo 2nd order equation was determined. The linear plot of the two models
with the highest correlation coefficient (R2) was considered the best model to describe the P
adsorption of the biochar types over time.
8
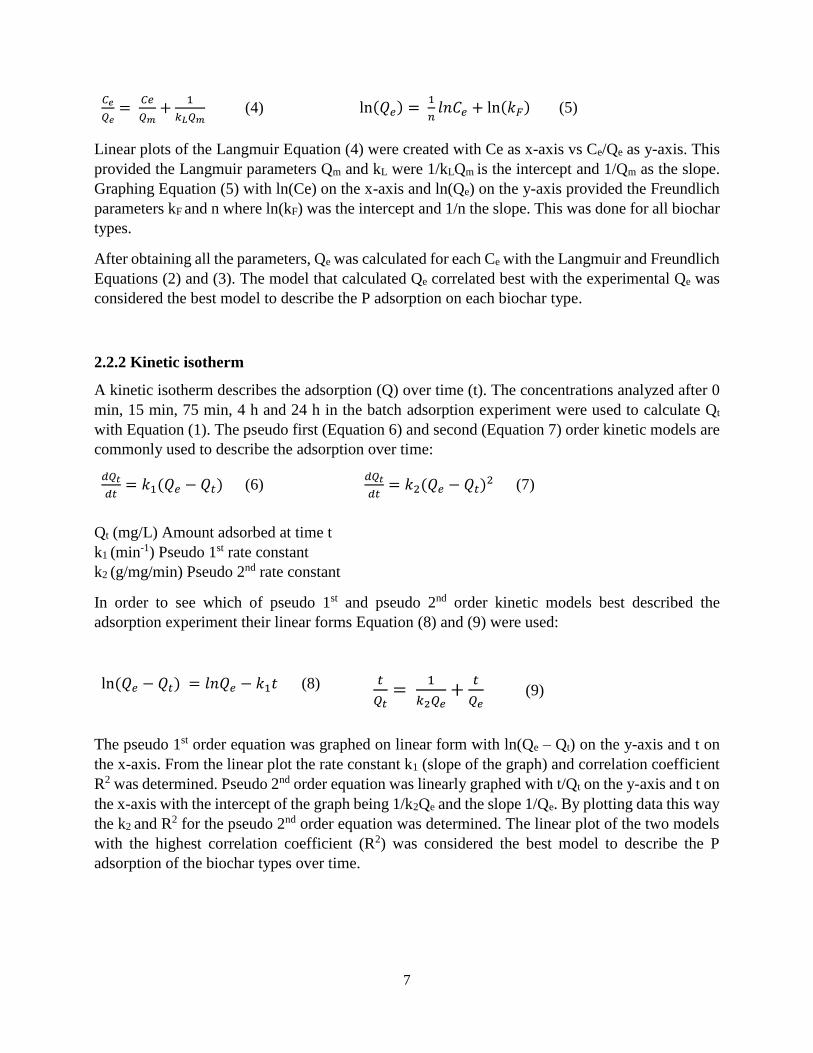
2.3 COLUMN FILTERS
To investigate the removal of P from real wastewater the four biochar types were tested in a 14
week long column filter experiment. Four 60 cm tall acrylic glass columns with diameter 4.25 cm
were filled separately with untreated biochar (UBC), biochar impregnated with calcium oxide
(CBC), biochar impregnated with ferric chloride (FBC), and biochar mixed with Polonite (PBC).
Underneath and on top of the main biochar layer, 5 cm coarser untreated biochar (8 mm in
diameter) was filled to prevent clogging on the very top of the filter and facilitate drainage on the
bottom (Figure 1). The filters received 71 mL wastewater per day divided equally between the
times 24:00, 08:30 and 16:00 to mimic the load of a real vertical soil infiltration system with 50
L/m2 and day (Olshammar et al., 2015). Peristaltic pumps regulated with timers were used to feed
the filters with wastewater stored in a fridge (2 – 4 oC). Before feeding, the wastewater was left
outside the fridge for 20 minutes to reach room temperature. The wastewater was collected twice
a week on Mondays and Thursdays mornings from the municipal wastewater treatment plant in
Uppsala (Kungsängsverket). The water was collected directly from the primary sedimentation step
of the plant and had to be filtered through a 0.8 mm mesh to remove particles to prevent clogging
of the pipe of the pumps.
Figure 1 Experimental set-up for column filters filled with untreated biochar (UBC), biochar impregnated with
calcium oxide (CBC), biochar impregnated with ferric chloride (FBC) and biochar mixed with Polonite (PBC).
Sampling of the inflow and outflow was done once a week, on Wednesdays, starting on the third
week of the experiment. The following parameters were determined weekly: Tot-P, PO4-P,
Tot-N, NO3-N, NH4-N and pH and every second week COD was analyzed. The main objective was
to investigate P but N measurements took place too. All analysis was conducted using chemical
kits (Table 2).
9
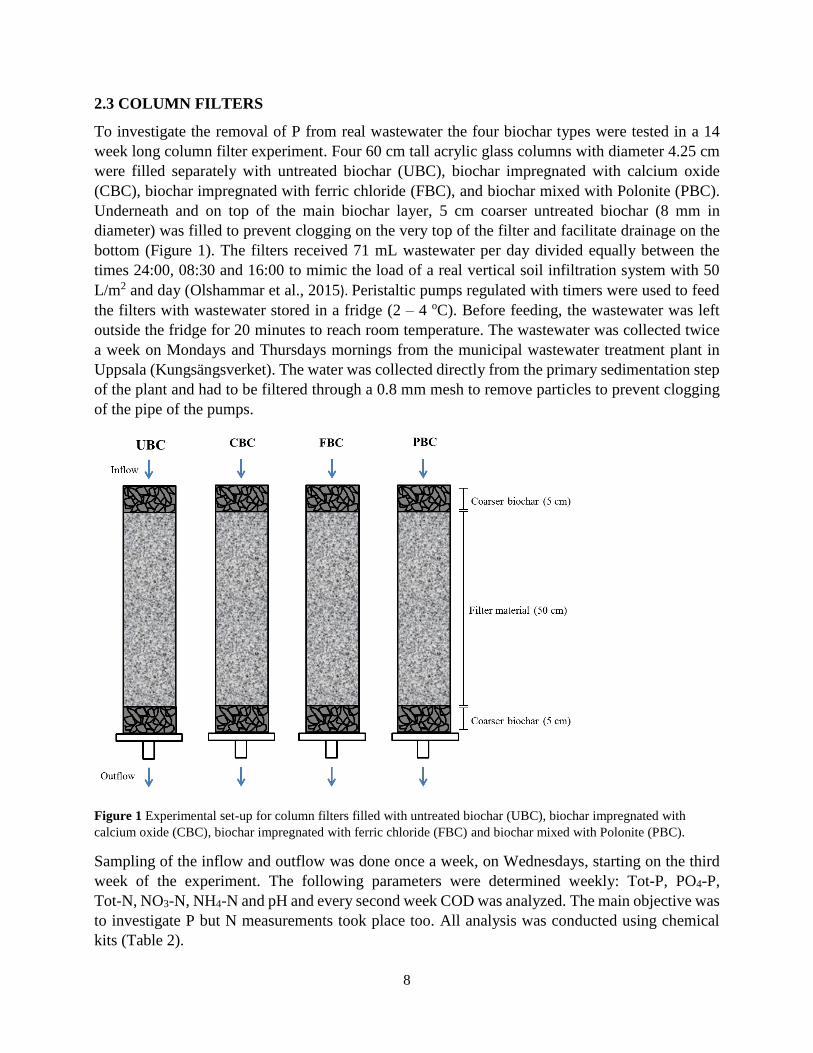
Table 2 Analytical kits, analytical concentration ranges and instruments used for analyzing pollutants in wastewater
used in the column filter and lab-scale filter unit experiments.
Substance Kit name/Method Range mg/L Instruments
Tot-N
Spectroquant
Crack Set 20
1.14963.0001
0.1-25.0
Spectroquant NOVA 60,
VWR International
Sverige
Thermal reactor TR420,
Merck
NH4-N
Spectroquant
Ammonium Test
1.00683.0001
2.0-150
Spectroquant NOVA 60
and Aquamate, VWR
International Sverige
NO3-N
Spectroquant
Nitrate Test
1.09713.0002
0.1-25.0
Spectroquant NOVA 60
and Aquamate, VWR
International Sverige
Tot-P
Spectroquant
Crack set 10
1.14687.0001
0.0025-5
Spectroquant NOVA 60
and Aquamate, VWR
International Sverige
Thermal reactor TR420,
Merck
PO4-P
Spectroquant
Phosphate test
1.14848.0002
0.0025-5
Spectroquant NOVA 60
and Aquamate, VWR
International Sverige
COD
Spectroquant
COD Cell test
1.09772.0001 and
1.09773.0001
10-100
and 100 - 1500 Spectroquant NOVA 60
pH pH strips 7-14, 1-7 and
1-14
Papier dosatest, VWR
MColorptest, Merck
Removal efficiency was calculated from the difference in concentrations of inflow and outflow of
the filters (Equation 10):
𝐸 = 100 𝐶𝑖𝑛−𝐶𝑜𝑢𝑡
𝐶𝑖𝑛 (10)
where E is the removal efficiency (%); Cin the concentration of the influent (mg/L); and Cout the
concentration of the effluent (mg/L).
10
2.4 NITROGEN REMOVAL FILTER
A biochar filter with an aerobic vertical flow section combined with an anaerobic horizontal flow
section was installed at Kungsängsverket and operated for 14 weeks. The biochar used originated
from mixture of hard wood biomass and was obtained from Vildelkol AB (Vindelkol, 2017). The
horizontal and vertical flow sections were installed using two boxes each with the size of
74×40×29 cm placed on top of each other (Figure 2). In the vertical flow section, a 3 cm drainage
layer was prepared with coarse biochar (8 - 16 mm in diameter) at the bottom which had a slope of
(1.5: 60; i.e. 2.5%). The section was then filled up to 30 cm with biochar of a particle size that
varied between 2.5 and 5 mm. A second 3 cm layer of coarse biochar was placed on the top of the
main filter to prevent clogging on the surface.
The horizontal flow biochar section was prepared by filling the box with coarse biochar (25 - 40
mm in diameter) in two 10 cm layers at the inlet and outlet sides. The main 54 cm part of the section
was then filled with biochar (1.6 - 2.5 mm in diameter). The depth of the biochar in the horizontal
flow section was 30 cm. The outlet of the horizontal flow section was located at a level 4 cm below
the inlet level. Before the start of the experiment the filter was gently washed with distilled water.
During the experiment, pumps fed the filter with 3 L three times a day, at 9:00, 16:00 and 01:00.
This gave a flow of around 42 L/m2 and day. The wastewater was initially pumped from after
primary sedimentation in the plant. However, FeCl3 added directly after the primary sedimentation
in the plant interfered with N analysis so the filter with sampling point was relocated in week 7 to
a location before the actual FeCl3 dosing in the middle of the primary sedimentation. The water
pumped from the primary sedimentation was filtered through a 0.8 mm sieve and the flow was
lowered to 1.5 L/day giving a load of 21 L/m2 to prevent clogging.
11
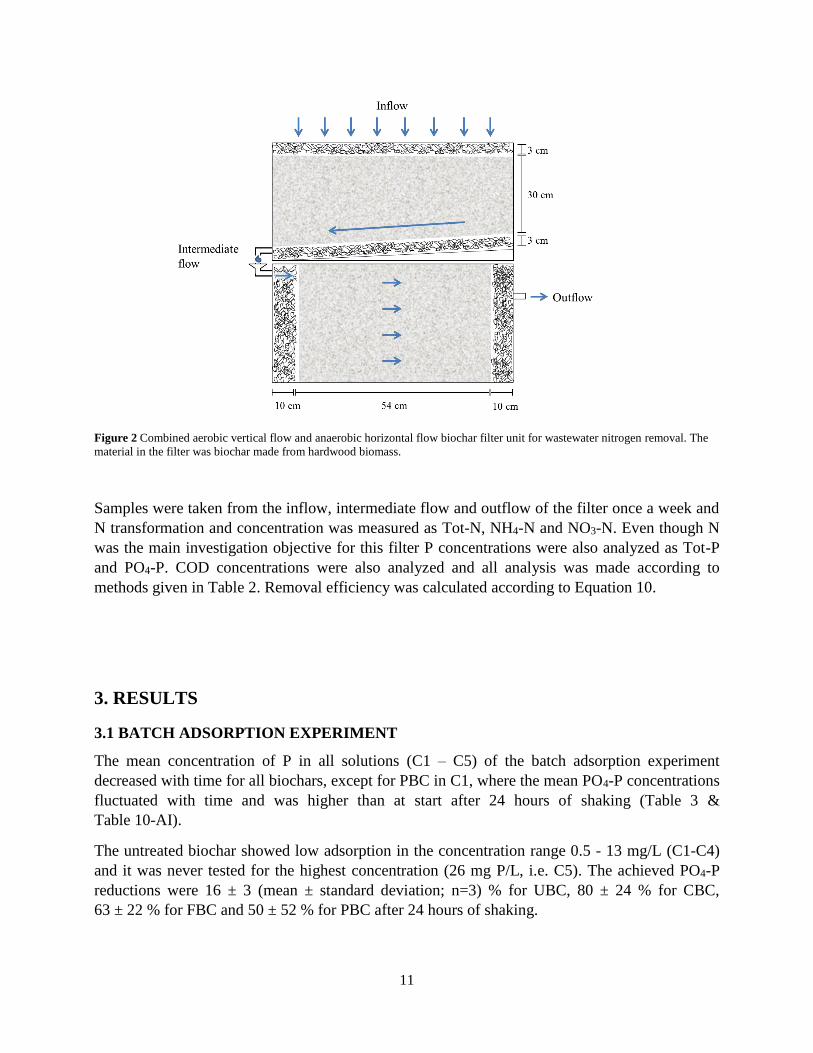
Figure 2 Combined aerobic vertical flow and anaerobic horizontal flow biochar filter unit for wastewater nitrogen removal. The
material in the filter was biochar made from hardwood biomass.
Samples were taken from the inflow, intermediate flow and outflow of the filter once a week and
N transformation and concentration was measured as Tot-N, NH4-N and NO3-N. Even though N
was the main investigation objective for this filter P concentrations were also analyzed as Tot-P
and PO4-P. COD concentrations were also analyzed and all analysis was made according to
methods given in Table 2. Removal efficiency was calculated according to Equation 10.
3. RESULTS
3.1 BATCH ADSORPTION EXPERIMENT
The mean concentration of P in all solutions (C1 – C5) of the batch adsorption experiment
decreased with time for all biochars, except for PBC in C1, where the mean PO4-P concentrations
fluctuated with time and was higher than at start after 24 hours of shaking (Table 3 &
Table 10-AI).
The untreated biochar showed low adsorption in the concentration range 0.5 - 13 mg/L (C1-C4)
and it was never tested for the highest concentration (26 mg P/L, i.e. C5). The achieved PO4-P
reductions were 16 ± 3 (mean ± standard deviation; n=3) % for UBC, 80 ± 24 % for CBC,
63 ± 22 % for FBC and 50 ± 52 % for PBC after 24 hours of shaking.
12
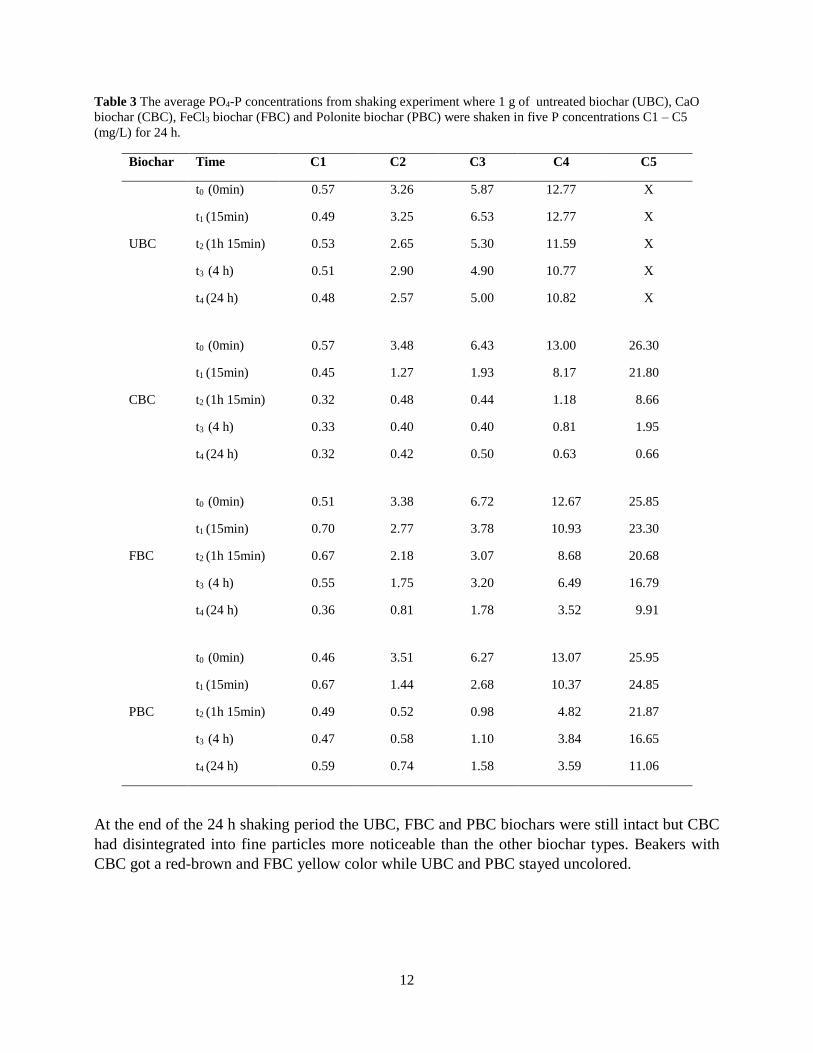
Table 3 The average PO4-P concentrations from shaking experiment where 1 g of untreated biochar (UBC), CaO
biochar (CBC), FeCl3 biochar (FBC) and Polonite biochar (PBC) were shaken in five P concentrations C1 – C5
(mg/L) for 24 h.
Biochar Time C1 C2 C3 C4 C5
UBC
t0 (0min) 0.57 3.26 5.87 12.77 X
t1 (15min) 0.49 3.25 6.53 12.77 X
t2 (1h 15min) 0.53 2.65 5.30 11.59 X
t3 (4 h) 0.51 2.90 4.90 10.77 X
t4 (24 h) 0.48 2.57 5.00 10.82 X
CBC
t0 (0min) 0.57 3.48 6.43 13.00 26.30
t1 (15min) 0.45 1.27 1.93 8.17 21.80
t2 (1h 15min) 0.32 0.48 0.44 1.18 8.66
t3 (4 h) 0.33 0.40 0.40 0.81 1.95
t4 (24 h) 0.32 0.42 0.50 0.63 0.66
FBC
t0 (0min) 0.51 3.38 6.72 12.67 25.85
t1 (15min) 0.70 2.77 3.78 10.93 23.30
t2 (1h 15min) 0.67 2.18 3.07 8.68 20.68
t3 (4 h) 0.55 1.75 3.20 6.49 16.79
t4 (24 h) 0.36 0.81 1.78 3.52 9.91
PBC
t0 (0min) 0.46 3.51 6.27 13.07 25.95
t1 (15min) 0.67 1.44 2.68 10.37 24.85
t2 (1h 15min) 0.49 0.52 0.98 4.82 21.87
t3 (4 h) 0.47 0.58 1.10 3.84 16.65
t4 (24 h) 0.59 0.74 1.58 3.59 11.06
At the end of the 24 h shaking period the UBC, FBC and PBC biochars were still intact but CBC
had disintegrated into fine particles more noticeable than the other biochar types. Beakers with
CBC got a red-brown and FBC yellow color while UBC and PBC stayed uncolored.

13
The pH in the PO4 solution at the start of the shaking (t0) was 7.0, but it changed with time
(Table 4). In the flasks with UBC, CBC and PBC, pH increased to 7.5, 8.5 and 8.8 while the
solution with FBC’s pH was lowered to 3.0.
Table 4 Mean pH in the different solution concentrations during the batch adsorption experiment for untreated
biochar (UBC), calcium oxide impregnated biochar (CBC), ferric chloride impregnated biochar (FBC) and untreated
biochar mixed with Polonite (PBC).
Time UBC CBC FBC PBC
t0 (0min) 7.0 7.0 7.0 7.0
t1 (15min) x 8.7 4.7 9.2
t2 (1h 15min) 7.0 9.0 4.5 9.5
t3 (4 h) 7.3 8.8 4.3 9.3
t4 (24 h) 7.5 8.5 3.0 8.8
3.1.1 Adsorption isotherm
All adsorption isotherm curves show that increasing equilibrium concentrations (Ce) gave an
increase in P adsorbed on the surface (Qe) (Figure 3). The UBC isotherm showed linear behavior,
where an increase in concentration (Ce) gave a constant increase in the P concentration on the
biochar surface (Qe). However, the standard deviations of the replicates were high and hence
observed trends can only be considered indicative as error bars overlapped to a large extent.
Adsorption isotherm curves for FBC and PBC were linear in lower concentrations but at higher
equilibrium concentrations, Qe increased less. CBC showed the opposite with a small increase of
Qe in lower concentrations but higher Qe when the concentration became higher.
0
0.1
0.2
0.3
0.4
0 5 10
Qe
[mg/
g]
Ce [mg/L]
Experiment
Langmuir
Freundlich
UBC
0
1
2
3
4
0.3 0.4 0.5 0.6 0.7
Qe
[mg/
g]
Ce [mg/L]
Experiment
Langmuir
Freundlich
CBC
14
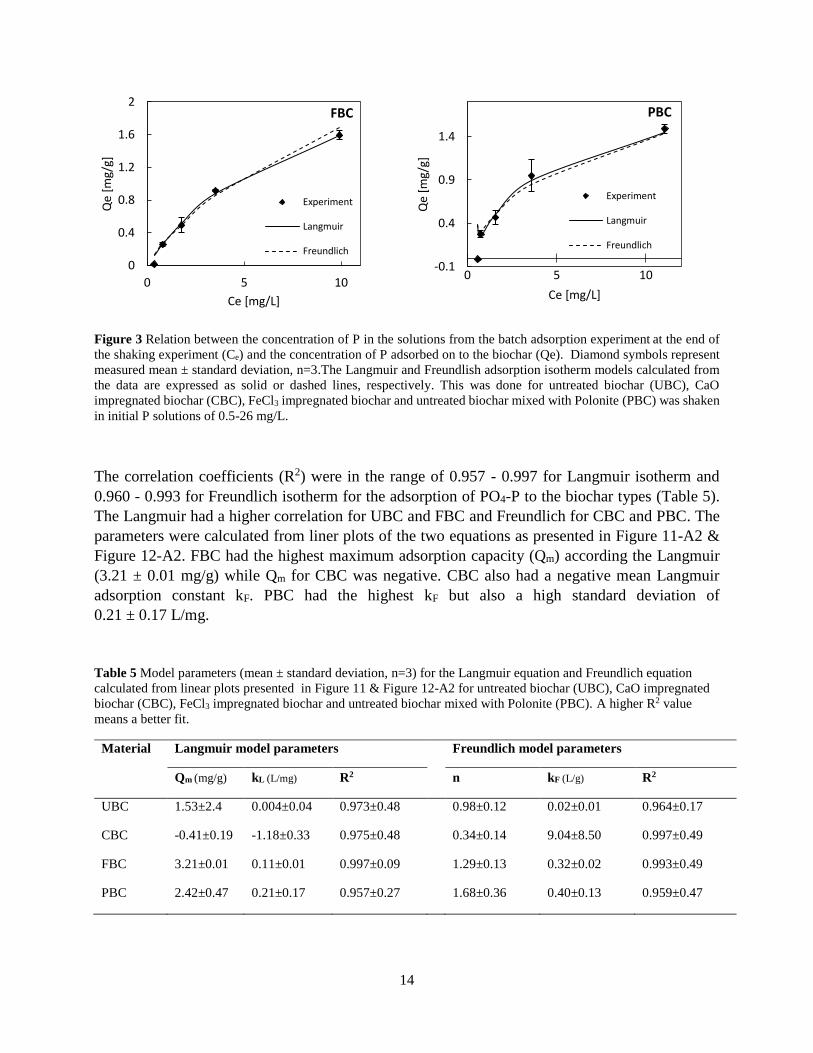
Figure 3 Relation between the concentration of P in the solutions from the batch adsorption experiment at the end of
the shaking experiment (Ce) and the concentration of P adsorbed on to the biochar (Qe). Diamond symbols represent
measured mean ± standard deviation, n=3.The Langmuir and Freundlish adsorption isotherm models calculated from
the data are expressed as solid or dashed lines, respectively. This was done for untreated biochar (UBC), CaO
impregnated biochar (CBC), FeCl3 impregnated biochar and untreated biochar mixed with Polonite (PBC) was shaken
in initial P solutions of 0.5-26 mg/L.
The correlation coefficients (R2) were in the range of 0.957 - 0.997 for Langmuir isotherm and
0.960 - 0.993 for Freundlich isotherm for the adsorption of PO4-P to the biochar types (Table 5).
The Langmuir had a higher correlation for UBC and FBC and Freundlich for CBC and PBC. The
parameters were calculated from liner plots of the two equations as presented in Figure 11-A2 &
Figure 12-A2. FBC had the highest maximum adsorption capacity (Qm) according the Langmuir
(3.21 ± 0.01 mg/g) while Qm for CBC was negative. CBC also had a negative mean Langmuir
adsorption constant kF. PBC had the highest kF but also a high standard deviation of
0.21 ± 0.17 L/mg.
Table 5 Model parameters (mean ± standard deviation, n=3) for the Langmuir equation and Freundlich equation
calculated from linear plots presented in Figure 11 & Figure 12-A2 for untreated biochar (UBC), CaO impregnated
biochar (CBC), FeCl3 impregnated biochar and untreated biochar mixed with Polonite (PBC). A higher R2 value
means a better fit.
Material Langmuir model parameters Freundlich model parameters
Qm (mg/g) kL (L/mg) R2 n kF (L/g) R2
UBC 1.53±2.4 0.004±0.04 0.973±0.48 0.98±0.12 0.02±0.01 0.964±0.17
CBC -0.41±0.19 -1.18±0.33 0.975±0.48 0.34±0.14 9.04±8.50 0.997±0.49
FBC 3.21±0.01 0.11±0.01 0.997±0.09 1.29±0.13 0.32±0.02 0.993±0.49
PBC 2.42±0.47 0.21±0.17 0.957±0.27 1.68±0.36 0.40±0.13 0.959±0.47
0
0.4
0.8
1.2
1.6
2
0 5 10
Qe
[mg/
g]
Ce [mg/L]
Experiment
Langmuir
Freundlich
FBC
-0.1
0.4
0.9
1.4
0 5 10
Qe
[mg/
g]
Ce [mg/L]
Experiment
Langmuir
Freundlich
PBC
15
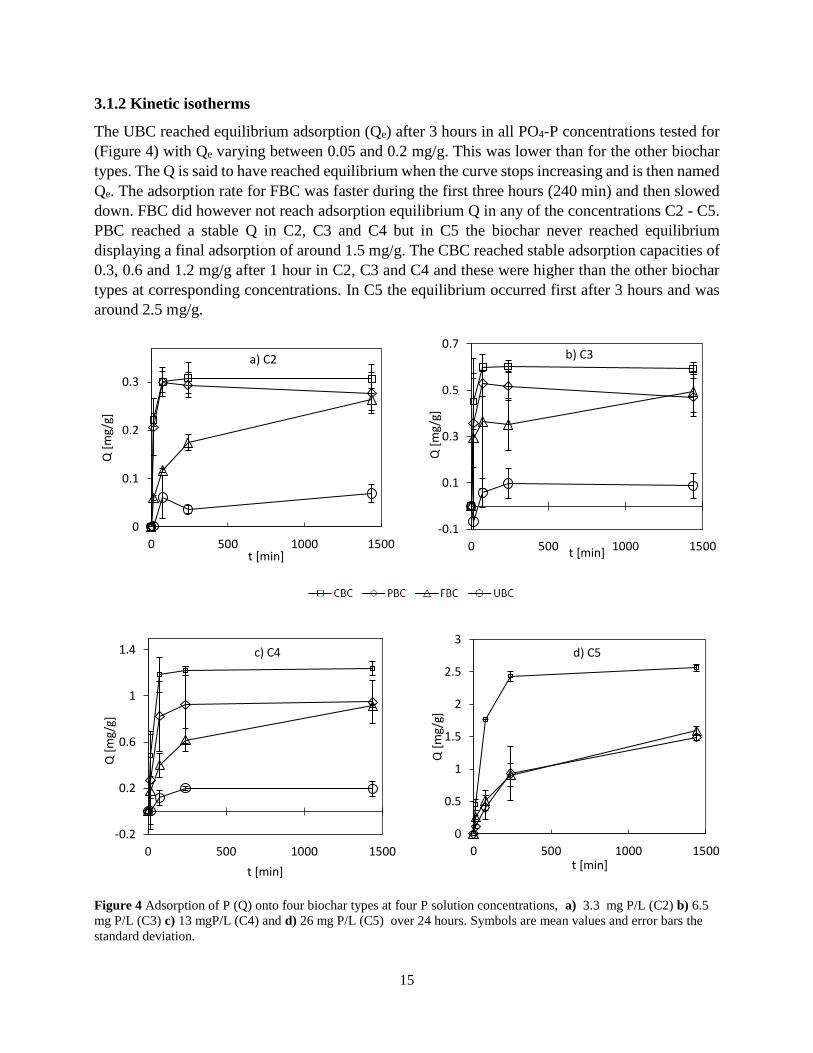
3.1.2 Kinetic isotherms
The UBC reached equilibrium adsorption (Qe) after 3 hours in all PO4-P concentrations tested for
(Figure 4) with Qe varying between 0.05 and 0.2 mg/g. This was lower than for the other biochar
types. The Q is said to have reached equilibrium when the curve stops increasing and is then named
Qe. The adsorption rate for FBC was faster during the first three hours (240 min) and then slowed
down. FBC did however not reach adsorption equilibrium Q in any of the concentrations C2 - C5.
PBC reached a stable Q in C2, C3 and C4 but in C5 the biochar never reached equilibrium
displaying a final adsorption of around 1.5 mg/g. The CBC reached stable adsorption capacities of
0.3, 0.6 and 1.2 mg/g after 1 hour in C2, C3 and C4 and these were higher than the other biochar
types at corresponding concentrations. In C5 the equilibrium occurred first after 3 hours and was
around 2.5 mg/g.
Figure 4 Adsorption of P (Q) onto four biochar types at four P solution concentrations, a) 3.3 mg P/L (C2) b) 6.5
mg P/L (C3) c) 13 mgP/L (C4) and d) 26 mg P/L (C5) over 24 hours. Symbols are mean values and error bars the
standard deviation.
0
0.1
0.2
0.3
0 500 1000 1500
Q [
mg/
g]
t [min]
a) C2
-0.1
0.1
0.3
0.5
0.7
0 500 1000 1500
Q [
mg/
g]
t [min]
b) C3
-0.2
0.2
0.6
1
1.4
0 500 1000 1500
Q [
mg/
g]
t [min]
c) C4
0
0.5
1
1.5
2
2.5
3
0 500 1000 1500
Q [
mg/
g]
t [min]
d) C5
16
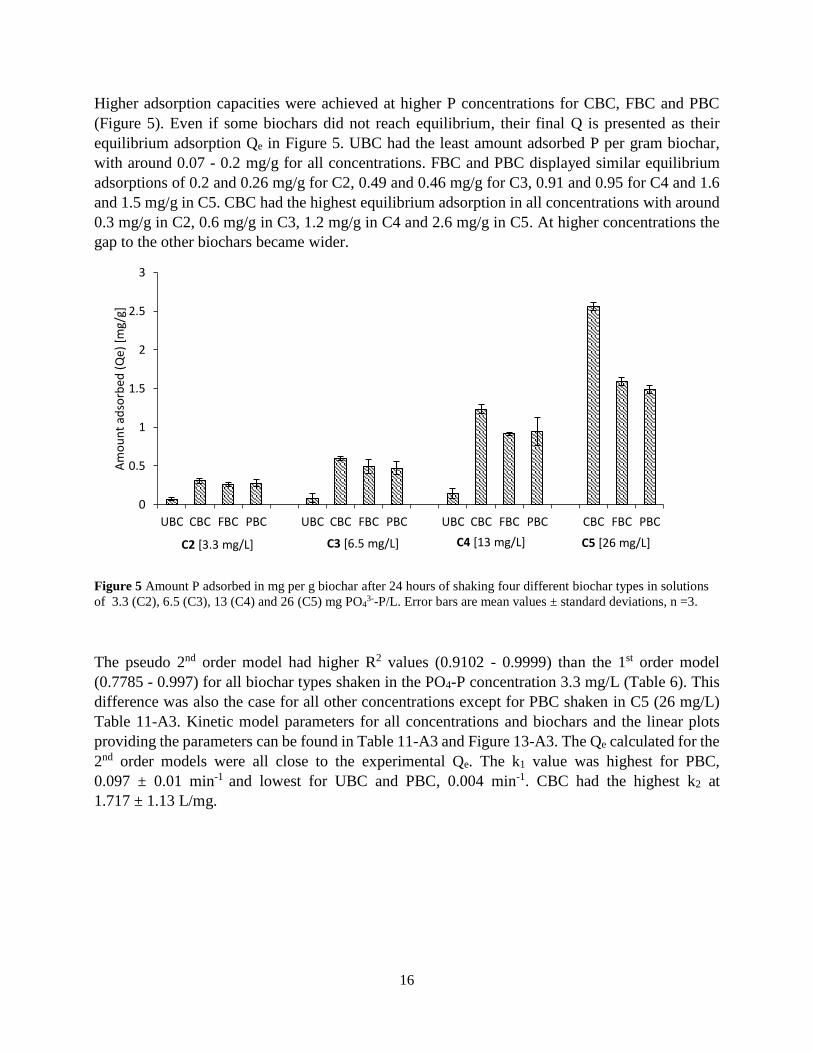
Higher adsorption capacities were achieved at higher P concentrations for CBC, FBC and PBC
(Figure 5). Even if some biochars did not reach equilibrium, their final Q is presented as their
equilibrium adsorption Qe in Figure 5. UBC had the least amount adsorbed P per gram biochar,
with around 0.07 - 0.2 mg/g for all concentrations. FBC and PBC displayed similar equilibrium
adsorptions of 0.2 and 0.26 mg/g for C2, 0.49 and 0.46 mg/g for C3, 0.91 and 0.95 for C4 and 1.6
and 1.5 mg/g in C5. CBC had the highest equilibrium adsorption in all concentrations with around
0.3 mg/g in C2, 0.6 mg/g in C3, 1.2 mg/g in C4 and 2.6 mg/g in C5. At higher concentrations the
gap to the other biochars became wider.
Figure 5 Amount P adsorbed in mg per g biochar after 24 hours of shaking four different biochar types in solutions
of 3.3 (C2), 6.5 (C3), 13 (C4) and 26 (C5) mg PO43--P/L. Error bars are mean values ± standard deviations, n =3.
The pseudo 2nd order model had higher R2 values (0.9102 - 0.9999) than the 1st order model
(0.7785 - 0.997) for all biochar types shaken in the PO4-P concentration 3.3 mg/L (Table 6). This
difference was also the case for all other concentrations except for PBC shaken in C5 (26 mg/L)
Table 11-A3. Kinetic model parameters for all concentrations and biochars and the linear plots
providing the parameters can be found in Table 11-A3 and Figure 13-A3. The Qe calculated for the
2nd order models were all close to the experimental Qe. The k1 value was highest for PBC,
0.097 ± 0.01 min-1 and lowest for UBC and PBC, 0.004 min-1. CBC had the highest k2 at
1.717 ± 1.13 L/mg.
0
0.5
1
1.5
2
2.5
3
UBC CBC FBC PBC UBC CBC FBC PBC UBC CBC FBC PBC CBC FBC PBC
Am
ou
nt
adso
rbed
(Q
e) [
mg/
g]
C2 [3.3 mg/L] C3 [6.5 mg/L] C4 [13 mg/L] C5 [26 mg/L]
17
Table 6 Pseudo 1st and pseudo 2nd order model parameters and the experimental value of equilibrium adsorption
(Qe) from batch adsorption experiment where four different types of biochar were shaken in 3.3 mg P/L (C2). All
parameters are presented as mean ± standard deviation, n=3 and they were calculated by linearization of pseudo 1st
and pseudo 2nd order kinetic models (Figure 13-A3).
Material Pseudo first order model Pseudo second order model Experimental
Qe [mg/g] R2 k1 [min-1] Qe [mg/g] R2 k2 [L/mg] Qe [mg/g]
UBC 0.064±0.03 0.779±0.26 0.004±0.02 0.068±0.02 0.911±0.081 -0.021±0.37 0.069±0.01
CBC 0.156±0.09 0.836±0.14 0.028±0.02 0.307±0.03 0.999±0.0001 1.717±1.13 0.307±0.03
FBC 0.229±0.03 0.919±0.07 0.004±0.00 0.281±0.03 0.997±0.002 0.036±0.01 0.264±0.02
PBC 0.266±0.04 0.997±0.01 0.097±0.05 0.264±0.04 0.999±0.001 -0.499±1.35 0.277±0.04
3.2 COLUMN FILTERS
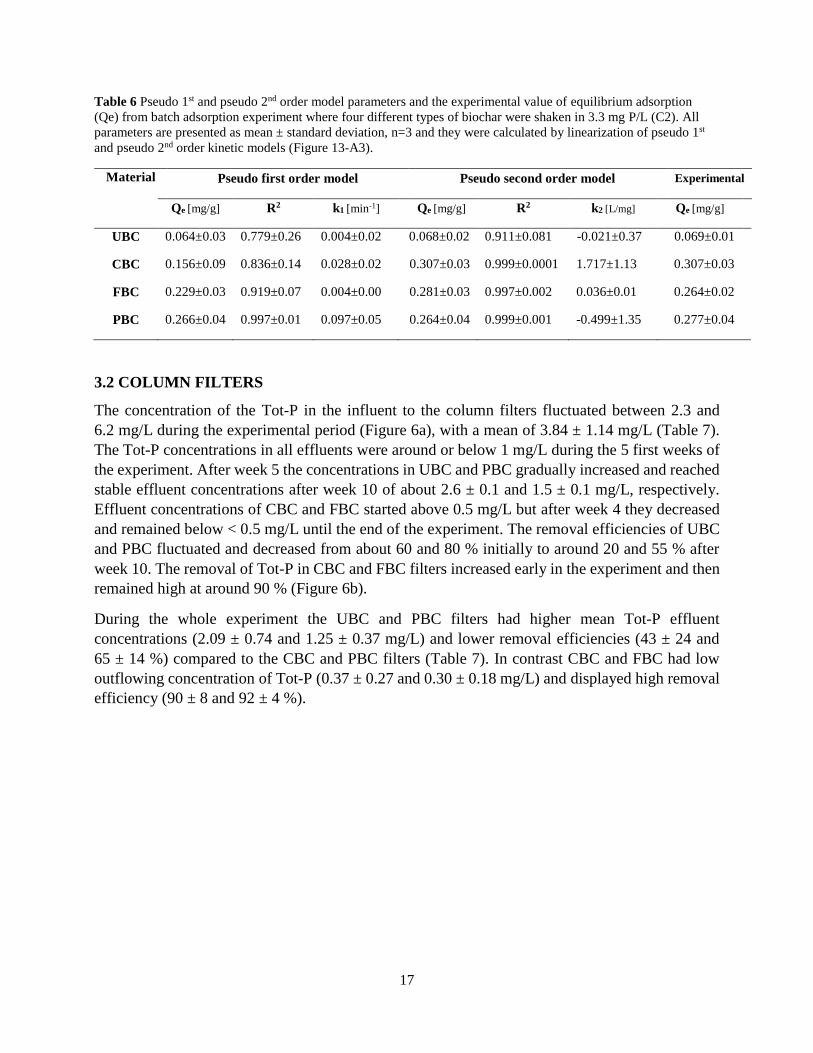
The concentration of the Tot-P in the influent to the column filters fluctuated between 2.3 and
6.2 mg/L during the experimental period (Figure 6a), with a mean of 3.84 ± 1.14 mg/L (Table 7).
The Tot-P concentrations in all effluents were around or below 1 mg/L during the 5 first weeks of
the experiment. After week 5 the concentrations in UBC and PBC gradually increased and reached
stable effluent concentrations after week 10 of about 2.6 ± 0.1 and 1.5 ± 0.1 mg/L, respectively.
Effluent concentrations of CBC and FBC started above 0.5 mg/L but after week 4 they decreased
and remained below < 0.5 mg/L until the end of the experiment. The removal efficiencies of UBC
and PBC fluctuated and decreased from about 60 and 80 % initially to around 20 and 55 % after
week 10. The removal of Tot-P in CBC and FBC filters increased early in the experiment and then
remained high at around 90 % (Figure 6b).
During the whole experiment the UBC and PBC filters had higher mean Tot-P effluent
concentrations (2.09 ± 0.74 and 1.25 ± 0.37 mg/L) and lower removal efficiencies (43 ± 24 and
65 ± 14 %) compared to the CBC and PBC filters (Table 7). In contrast CBC and FBC had low
outflowing concentration of Tot-P (0.37 ± 0.27 and 0.30 ± 0.18 mg/L) and displayed high removal
efficiency (90 ± 8 and 92 ± 4 %).
18
Figure 6 a) The Tot-P concentrations in the influent and in the effluent and b) the removal efficiency of the
untreated biochar filter (UBC), CaO impregnated biochar filter (CBC), FeCl3 impregnated biochar filter (FBC) and
the biochar filter mixed with Polonite (PBC).
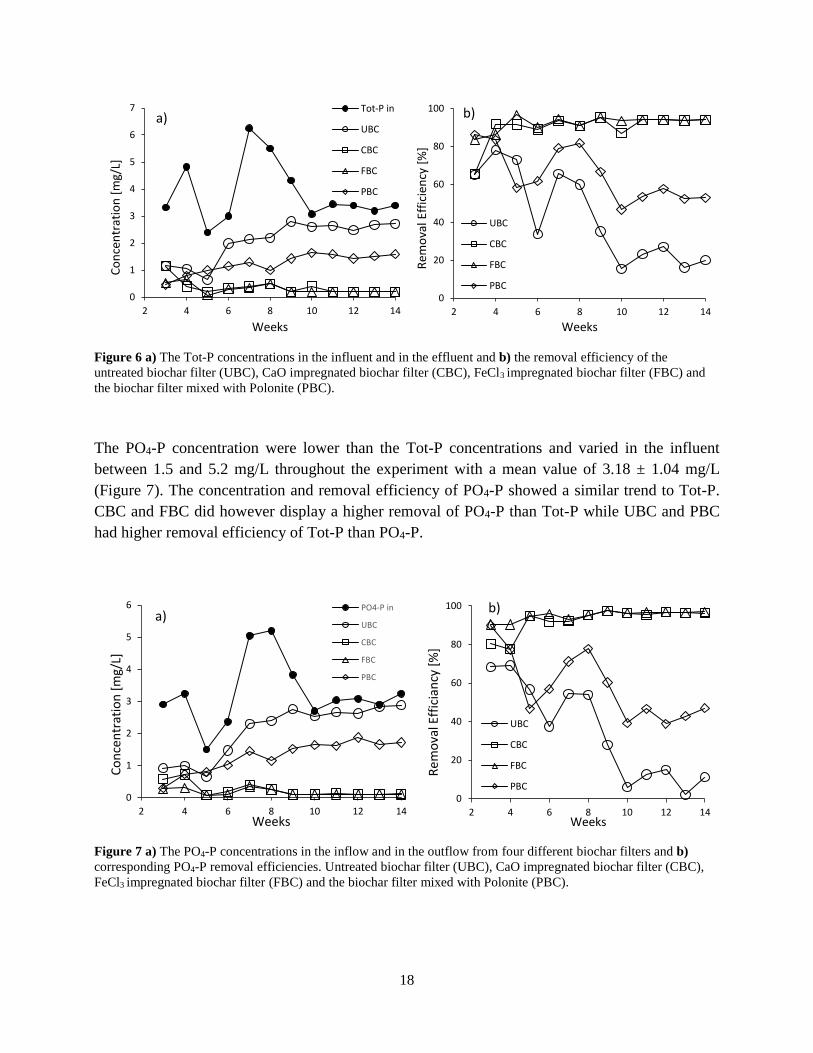
The PO4-P concentration were lower than the Tot-P concentrations and varied in the influent
between 1.5 and 5.2 mg/L throughout the experiment with a mean value of 3.18 ± 1.04 mg/L
(Figure 7). The concentration and removal efficiency of PO4-P showed a similar trend to Tot-P.
CBC and FBC did however display a higher removal of PO4-P than Tot-P while UBC and PBC
had higher removal efficiency of Tot-P than PO4-P.
Figure 7 a) The PO4-P concentrations in the inflow and in the outflow from four different biochar filters and b)
corresponding PO4-P removal efficiencies. Untreated biochar filter (UBC), CaO impregnated biochar filter (CBC),
FeCl3 impregnated biochar filter (FBC) and the biochar filter mixed with Polonite (PBC).
0
1
2
3
4
5
6
7
2 4 6 8 10 12 14
Co
nce
ntr
atio
n [
mg/
L]
Weeks
Tot-P in
UBC
CBC
FBC
PBC
a)
0
20
40
60
80
100
2 4 6 8 10 12 14
Rem
ova
l Eff
icie
ncy
[%
]
Weeks
UBC
CBC
FBC
PBC
b)
0
1
2
3
4
5
6
2 4 6 8 10 12 14
Co
nce
ntr
atio
n [
mg/
L]
Weeks
PO4-P in
UBC
CBC
FBC
PBC
a)
0
20
40
60
80
100
2 4 6 8 10 12 14
Re
mo
val E
ffic
ian
cy [
%]
Weeks
UBC
CBC
FBC
PBC
b)
19
The COD analysis showed that UBC removed 36 ± 22% of the COD and PBC removed
30 ± 30 %. No clear trend could be red from those data points taken once every second week and
the standard deviations were high (Table 7). In average the CBC and FBC had a higher
concentration of COD in the effluent than in the influent, resulting in negative removal efficiencies
-122 ± 186 % and -100 ± 141 %.
The pH varied in filter effluents. The influent to the filters was neutral with pH 7.1 ± 0.4. The UBC
filter effluent was just below neutral (pH 6.7 ± 0.5) while effluents from CBC and PBC discharged
an effluent with higher pH (7.8 ± 0.4). The largest pH change was observed for FBC which had an
average effluent pH of 2.6 ± 0.9 over the experimental period (Table 7).
The appearance of the effluent from the filters differed from each other and changed over time.
Initially the UBC and PBC effluents were turbid and greyish. The CBC effluent had a red-brown
color and the FBC effluent was yellow, both turbid. Over time the color and turbidity of UBC, PBC
and FBC disappeared but CBC kept its red-brown color. On the surface of the effluent beaker of
CBC a precipitate formed and kept forming during the whole experiment.
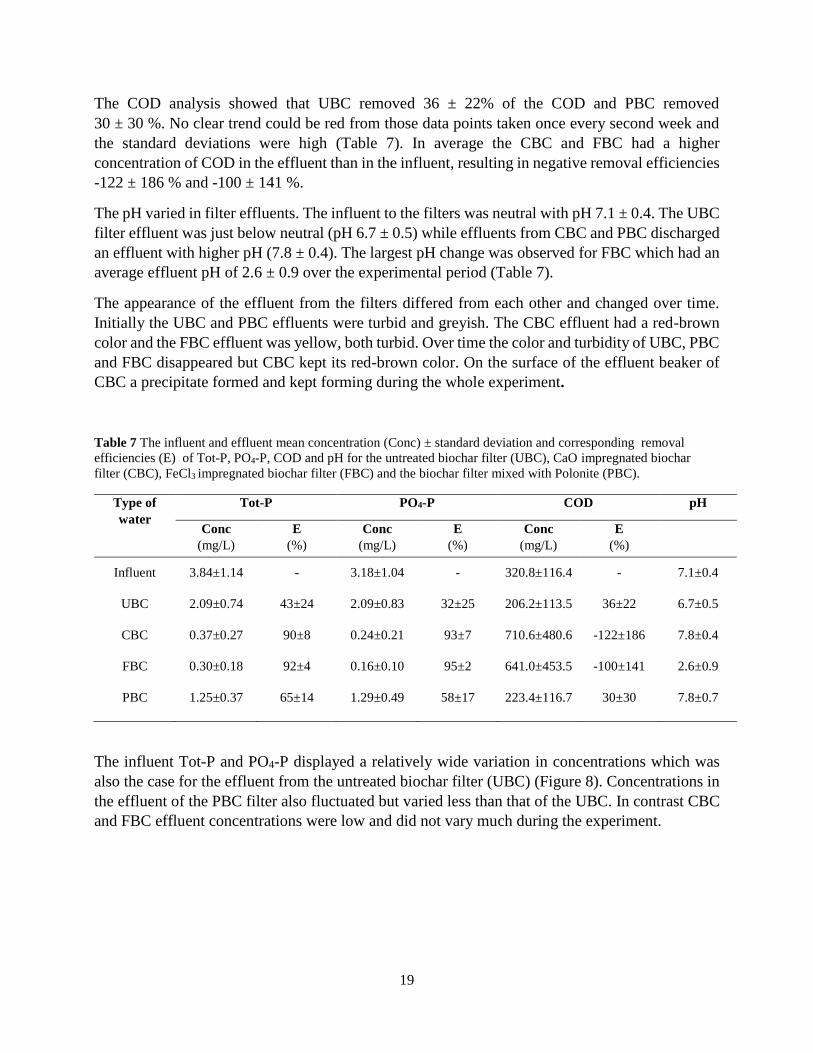
Table 7 The influent and effluent mean concentration (Conc) ± standard deviation and corresponding removal
efficiencies (E) of Tot-P, PO4-P, COD and pH for the untreated biochar filter (UBC), CaO impregnated biochar
filter (CBC), FeCl3 impregnated biochar filter (FBC) and the biochar filter mixed with Polonite (PBC).
Type of
water
Tot-P PO4-P COD pH
Conc
(mg/L)
E
(%)
Conc
(mg/L)
E
(%)
Conc
(mg/L)
E
(%)
Influent 3.84±1.14 - 3.18±1.04 - 320.8±116.4
- 7.1±0.4
UBC 2.09±0.74 43±24
2.09±0.83 32±25 206.2±113.5 36±22 6.7±0.5
CBC 0.37±0.27 90±8 0.24±0.21 93±7 710.6±480.6 -122±186 7.8±0.4
FBC 0.30±0.18 92±4 0.16±0.10 95±2 641.0±453.5 -100±141 2.6±0.9
PBC 1.25±0.37 65±14 1.29±0.49 58±17 223.4±116.7 30±30 7.8±0.7
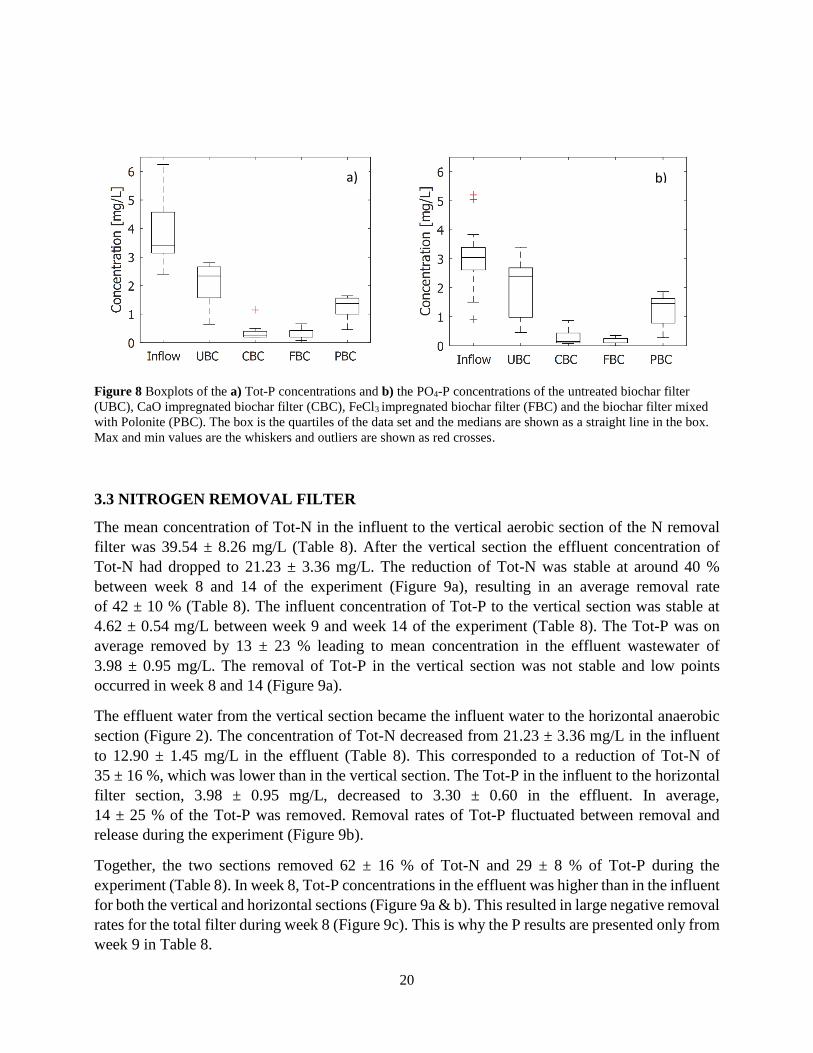
The influent Tot-P and PO4-P displayed a relatively wide variation in concentrations which was
also the case for the effluent from the untreated biochar filter (UBC) (Figure 8). Concentrations in
the effluent of the PBC filter also fluctuated but varied less than that of the UBC. In contrast CBC
and FBC effluent concentrations were low and did not vary much during the experiment.
20
Figure 8 Boxplots of the a) Tot-P concentrations and b) the PO4-P concentrations of the untreated biochar filter
(UBC), CaO impregnated biochar filter (CBC), FeCl3 impregnated biochar filter (FBC) and the biochar filter mixed
with Polonite (PBC). The box is the quartiles of the data set and the medians are shown as a straight line in the box.
Max and min values are the whiskers and outliers are shown as red crosses.
3.3 NITROGEN REMOVAL FILTER
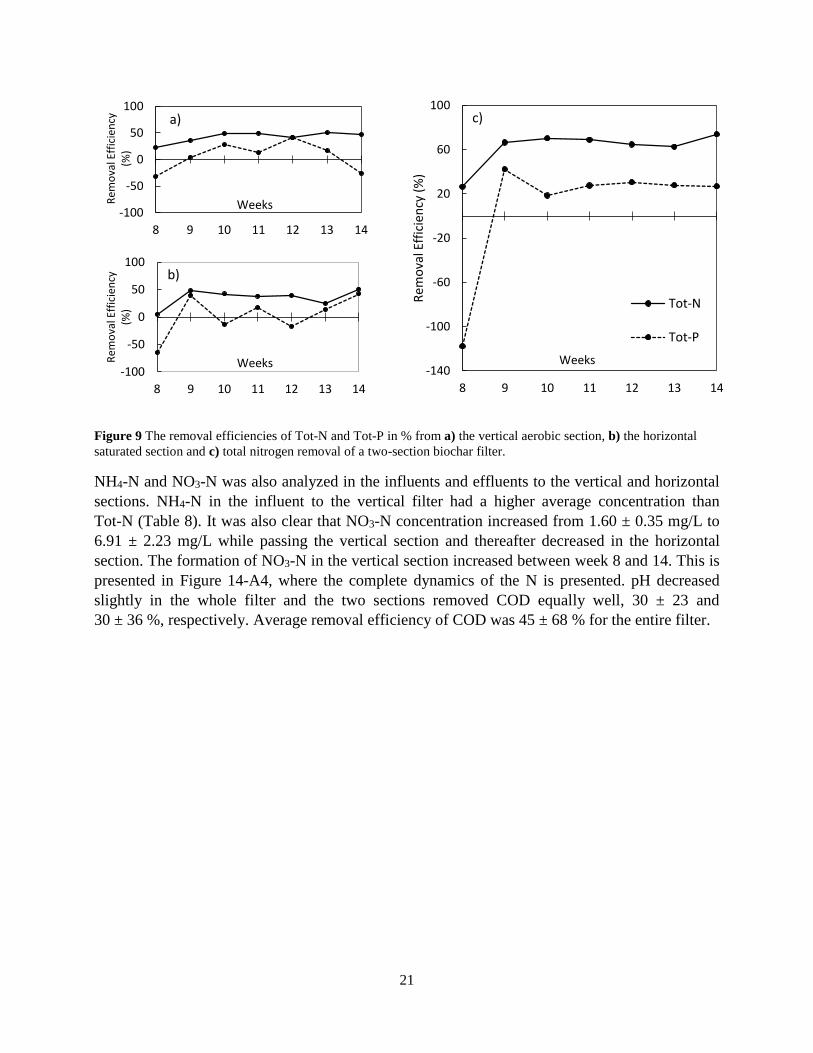
The mean concentration of Tot-N in the influent to the vertical aerobic section of the N removal
filter was 39.54 ± 8.26 mg/L (Table 8). After the vertical section the effluent concentration of
Tot-N had dropped to 21.23 ± 3.36 mg/L. The reduction of Tot-N was stable at around 40 %
between week 8 and 14 of the experiment (Figure 9a), resulting in an average removal rate
of 42 ± 10 % (Table 8). The influent concentration of Tot-P to the vertical section was stable at
4.62 ± 0.54 mg/L between week 9 and week 14 of the experiment (Table 8). The Tot-P was on
average removed by 13 ± 23 % leading to mean concentration in the effluent wastewater of
3.98 ± 0.95 mg/L. The removal of Tot-P in the vertical section was not stable and low points
occurred in week 8 and 14 (Figure 9a).
The effluent water from the vertical section became the influent water to the horizontal anaerobic
section (Figure 2). The concentration of Tot-N decreased from 21.23 ± 3.36 mg/L in the influent
to 12.90 ± 1.45 mg/L in the effluent (Table 8). This corresponded to a reduction of Tot-N of
35 ± 16 %, which was lower than in the vertical section. The Tot-P in the influent to the horizontal
filter section, 3.98 ± 0.95 mg/L, decreased to 3.30 ± 0.60 in the effluent. In average,
14 ± 25 % of the Tot-P was removed. Removal rates of Tot-P fluctuated between removal and
release during the experiment (Figure 9b).
Together, the two sections removed 62 ± 16 % of Tot-N and 29 ± 8 % of Tot-P during the
experiment (Table 8). In week 8, Tot-P concentrations in the effluent was higher than in the influent
for both the vertical and horizontal sections (Figure 9a & b). This resulted in large negative removal
rates for the total filter during week 8 (Figure 9c). This is why the P results are presented only from
week 9 in Table 8.
a) b)
21
Figure 9 The removal efficiencies of Tot-N and Tot-P in % from a) the vertical aerobic section, b) the horizontal
saturated section and c) total nitrogen removal of a two-section biochar filter.
NH4-N and NO3-N was also analyzed in the influents and effluents to the vertical and horizontal
sections. NH4-N in the influent to the vertical filter had a higher average concentration than
Tot-N (Table 8). It was also clear that NO3-N concentration increased from 1.60 ± 0.35 mg/L to
6.91 ± 2.23 mg/L while passing the vertical section and thereafter decreased in the horizontal
section. The formation of NO3-N in the vertical section increased between week 8 and 14. This is
presented in Figure 14-A4, where the complete dynamics of the N is presented. pH decreased
slightly in the whole filter and the two sections removed COD equally well, 30 ± 23 and
30 ± 36 %, respectively. Average removal efficiency of COD was 45 ± 68 % for the entire filter.
-100
-50
0
50
100
8 9 10 11 12 13 14
Rem
ova
l Eff
icie
ncy
(%
)
Weeks
a)
-140
-100
-60
-20
20
60
100
8 9 10 11 12 13 14
Re
mo
val E
ffic
ien
cy (
%)
Weeks
Tot-N
Tot-P
c)
-100
-50
0
50
100
8 9 10 11 12 13 14
Rem
ova
l Eff
icie
ncy
(%
)
Weeks
b)
22
Table 8 The average removal efficiencies (%) and concentrations (mg/L) ± standard deviation for all for pollutants
measured in the N removal filter. The filter had an aerobic vertical flow section followed by an anaerobic horizontal
flow section.
Pollutant
Concertration (mg/L) Removal efficiency (%)
Inflow Vertical
section
effluent
Horizontal
section
effluent
Vertical
section
Horizontal
flow section
Total
Removal
efficiency
pH 7.1±0.1 6.7±0.4 6.8±0.4
Tot-N 39.54±8.26 21.23±3.36 12.90±1.45 42±10 35±16 62±16
Tot-P* 4.62±0.54 3.98±0.95 3.30±0.60 13±23 14±25 29±8
NH4-N 42.67±8.55 14.67±2.66 11.00±1.10 65±8 23±17 74±5
NO3-N 1.60±0.35 6.91±2.23 2.66±0.98 -341±131 58±23 -64±53
PO4-P*
4.05±0.74 3.79±0.96 2.97±0.56 3±29 19±23 27±10
COD 286.20±116.35 197.80±100.52 152.00±96.43 30±23 30±36 45±68
* Means calculated from week 9
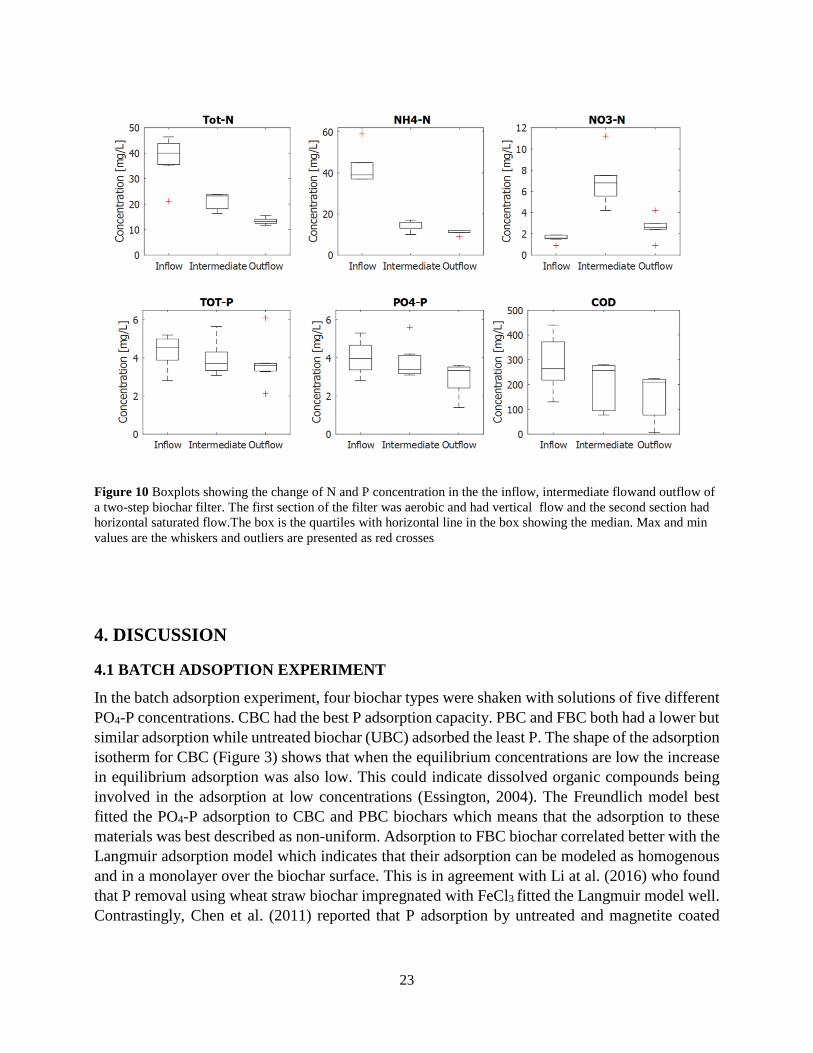
The N removal filter recived wastewater with a verying Tot-N and NH4-N concentration and more
N was removed in the first section than in the second. However, the concentrations in the effluent
had smaller variation (Figure 10). The NO3-N concentration in the intermediate flow varied more
than the NO3-N concentrations in inflow and outflow of the filter. The Tot-P and PO4-P
concentrations in inflow and intermediate flow had a similar variation. The Tot-P concentrations
in the outflow was however less varied than the PO4-P concentraions. COD concentration data had
the largest variation of all analyzed pollutants.
23
Figure 10 Boxplots showing the change of N and P concentration in the the inflow, intermediate flowand outflow of
a two-step biochar filter. The first section of the filter was aerobic and had vertical flow and the second section had
horizontal saturated flow.The box is the quartiles with horizontal line in the box showing the median. Max and min
values are the whiskers and outliers are presented as red crosses
4. DISCUSSION
4.1 BATCH ADSOPTION EXPERIMENT
In the batch adsorption experiment, four biochar types were shaken with solutions of five different
PO4-P concentrations. CBC had the best P adsorption capacity. PBC and FBC both had a lower but
similar adsorption while untreated biochar (UBC) adsorbed the least P. The shape of the adsorption
isotherm for CBC (Figure 3) shows that when the equilibrium concentrations are low the increase
in equilibrium adsorption was also low. This could indicate dissolved organic compounds being
involved in the adsorption at low concentrations (Essington, 2004). The Freundlich model best
fitted the PO4-P adsorption to CBC and PBC biochars which means that the adsorption to these
materials was best described as non-uniform. Adsorption to FBC biochar correlated better with the
Langmuir adsorption model which indicates that their adsorption can be modeled as homogenous
and in a monolayer over the biochar surface. This is in agreement with Li at al. (2016) who found
that P removal using wheat straw biochar impregnated with FeCl3 fitted the Langmuir model well.
Contrastingly, Chen et al. (2011) reported that P adsorption by untreated and magnetite coated
24
biochar made from orange peel fitted the Freundlich model better. The large standard deviation of
the P adsorption on UBC makes it difficult to compare it to the equation models (Figure 3).
The Langmuir adsorption constant kF was higher for adsorption on PBC than for the other biochar
types. This indicates that the affinity between P and PBC was the highest. The Langmuir maximum
adsorption Qm for CBC was negative which is not realistic indicating that this model was not
suitable for describing adsorption on CBC (Table 5). FBC had the highest Qm at 3.2 mg/g but this
is still lower than that reported by Liu et al. (2015) who demonstrated an adsorption capacity of
16.58 mg/g for a Fe impregnated biochar made from wheat straw. The biochar in the study by Li
et al. (2016) had a smaller diameter than the biochar in this experiment (< 1 mm vs
1 - 7 mm) and higher iron to biochar ratio, 0.7 vs 0.3, which can explain the difference.
Looking at the Qe for the kinetic adsorption experiment it is clear that the CBC had the highest
equilibrium adsorption at all concentrations tested (Figure 5). In C2 (3.3 mgP/L), i.e. the
concentration closest to the average influent wastewater concentration of PO4-P in the column
filters, CBC had the highest Qe of 0.3 ± 0.03 mg/g after 24 h of shaking. Jung et al. (2016) received
a Qe of 100 mg/g on their Ca modified biochar in a batch sorption experiment. However, the
concentration in the experiment by Jung et al. (2016) was 326 mg/L PO4-P, which makes it
inappropriate to compare between the experiments since the concentrations in this study were
lower. The higher concentration of P in the solution the more obvious difference between the
adsorption characteristics of the different biochar types could be seen (Figure 5). Twenty-four
hours was not enough for the FBC biochar to reach an equilibrium adsorption (Figure 4) which
means that the Qe for FBC of 0.264 ± 0.02 mg/g in C2 would most likely be higher and even pass
that of PBC (0.277 ± 0.04 mg/g) if longer time would have been given. Alternatively, it could have
continued and never reached equilibrium due to a continuous formation of complexes as discussed
by Essington (2004). The pseudo second order model was the better fit compared to pseudo first
for most biochar types and concentrations (Table 6). This means that the adsorption can be assumed
to be mainly chemical as suggested by Ho & McKay (1999 & 1998). The calculated Qe from the
pseudo second order equation was close to the experimental Qe which implies the accuracy of the
model. In previous studies, the second order kinetic model was proven to be the best model for
describing P adsorption on magnesium modified biochar. However, FeCl3 modified biochar has
shown a better fit for the pseudo first order model by Zhang et al. (2013).
Adsorption and kinetic isotherms behave very different for different types of materials and
chemicals, hence, results are difficult to compare. Experimental conditions like beaker size,
material properties and preparation, temperature, reaction time etc. have a large influence on the
results and these conditions are rarely the same in different studies. Therefore, batch adsorptions
experiments are more suitable in comparing adsorption characteristics between materials in the
same study (Essington, 2004).
25
4.2 COLUMN FILTER EXPERIMNET
The inflowing PO4-P and Tot-P concentrations to the column filters varied considerably as can be
seen in Figure 7 and Figure 6 and also in the box plot in Figure 8. The concentration probably
varied because the quality of the wastewater from the WWTP differs between days and even
changes during the day. These variations can also explain why the average concentration of the
inflowing Tot-P, 3.84 mg/L (Table 7) was lower than yearly average of 6 mg/L for WWTP
(Kungsängsverket, 2016).
The untreated biochar (UBC) filter had the smallest removal efficiency of Tot-P (43 ± 24 %) of all
filters (Table 7). This is lower than what could be expected from a fully functioning vertical soil
filter having an estimated Tot-P removal of 70 ± 20 % (Olshammar et al., 2015). The Tot-P
reduction in UBC was also in the lower range of what have been shown possible (32 - 89 %) in
other filters using untreated biochar (Table 9) (Dalahmeh, 2016). PBC had an average removal of
65 ± 14 % of Tot-P which is comparable of what could be expected from vertical soil filters and
also of previously studied biochars. P concentration in the effluent of the UBC and PBC filters
continued to increase during the experiment but seemed to become stabilized towards the end. It is
difficult to recognize if they would have continued to decrease in efficiency given longer time. The
Tot-P removal in CBC and FBC were 90 ± 8 % and 92 ± 4 % respectively and their PO4-P removal
rates were even higher. This is similar to previous batch adsorption studies where Fe modified
biochar has been shown to remove of up to 99 % of P (Chen et al., 2011; Liu et al., 2015).
When comparing the Tot-P and PO4-P removal, both UBC and Polonite biochar removed more
Tot-P than PO4-P (Table 7). The CBC and FBC showed the opposite trend. This means that UBC
and PBC removed organic P better while CBC and FBC were more efficient in removing inorganic
P. The impregnation in CBC and FBC probably created different surface structures compared to
UBC and PBC. PBC should have similar surface to that of UBC since they had the same untreated
biochar, which possibly could explain the grouping in the two Tot-P and PO4-P characteristics.
The initial yellow color of the FBC filter effluent, also seen in the shaking solutions from the batch
adsorption experiment, can most likely be explained by FeCl3 treatment that carries a yellow color
when dissolved in water. FeCl3 also lowers the pH which can explain the drop in pH seen in the
effluent water from the filter and in the PO4-P solution of the batch adsorption experiment. An
average pH of 2.6 ± 0.9 from the FBC filter effluent (Table 7) most likely created unfavorable
environment for nitrifying and denitrifying bacteria which must be considered undesirable for
wastewater treatment even if low pH favors precipitation reactions between P and iron (US EPA
2002). In contrast, CaO and Polonite increase the pH in aqueous solutions which explains the pH
increase in the beakers during the batch sorption experiment (Table 4). The red-brown color of the
CBC effluent probably originated from the mother material – willow tree bark. Water that is filtered
through bark receives a red-brown color due to the release of organic acids (Dalahmeh et al., 2012).
If the color comes from the bark it indicates that the pyrolysis of the biochar was never fully
completed as the biochar itself would not release any color. Organic acids present in bark would
lower the pH, meaning that the pH might have been even higher in the CBC effluent if the pyrolysis
had been complete. Presence of organic acids can explain the shape of CBCs adsorption isotherm
and can also be an explanation to the high COD content in the CBC effluent. Ca and Fe ions were
26
most likely released from the CBC and FBC filter materials to the effluents which possibly could
explain their high COD contents as calcium and iron compounds can be chemically oxidized in the
analysis procedure. To investigate the removal of organic matter it would have been more
appropriate to measure biochemical oxygen demand (BOD) or total organic carbon (TOC). TOC
sampling occurred but lack of proper equipment and time stopped the analysis. Ca and Fe ions are
not likely to affect the COD of PBC and UBC filter effluents to the same extent, yet these filters
had lower COD removal rates (36 and 22 %, respectively) than shown in most previous biochar
studies (90 %) as reported in Table 9 (Dalahmeh, 2016).
Another problem except for the color of the CBC effluent was the precipitate adding to the effluent
beaker surface. It is likely that the precipitate is some calcium phosphate mineral which might lead
to problems with clogging in the long run in a full-scale system.
4.3 NITROGEN REMOVAL FILTER
The two sections of the N removal filter removed 62 ± 16 % of the influent N (Figure 9 &
Table 9). This was higher than conventional vertical soil filers where removal rates of 30 ± 10 %
can be expected (Olshammar et al., 2015) and also higher than alternative OWTP solutions in
general (Avloppsguiden, 2009) (Tabel 9). The average total N concentration was lower than that
of NH4-N in the influent which is not realistic. This is likely due to error in analysis during week
11, 12 and 13 (Figure 14c-A4). The increase in NO3-N concentration in the first and decrease in
the second section show that nitrification and denitrification took place (Figure 9a & b). However
it was not until the end of the experiment the nitrate removal was high enough to remove almost of
the NO3-N created in the vertical section. The average outflow concentration from the horizontal
filer was 2.66 ± 0.98 mg/L. It is likely that the NO3-N and Tot-N removal capacity would have
continued to increase as the biofilm in the filter continued to grow and mature. The P removal in
the N removal filter was 29 ± 8 % which was lower than the removal rate observed for UBC in the
column experiment and what can be expected from vertical soil filers (Table 9). The relocation of
the filter in week 7 seemed to negatively affect the filter performance the following week. When
moving the filter some of the water from the lower section had to be emptied and particles were
released from the biochar. The disturbance of the microbial community in the biofilm and loose
particles was probably the reason why P was released during week 8. After this the removal of Tot-
P became more stable (Figure 9c). Moving the filter to the primary sedimentation also meant that
the water entering the filter from week 8 was more turbid and contained more particles than before.
This could explain why the overall COD removal was relatively low (45 ± 68 %) and varied more
compared to vertical soil filters (80 ± 10 %) (Olshammar et al., 2015).
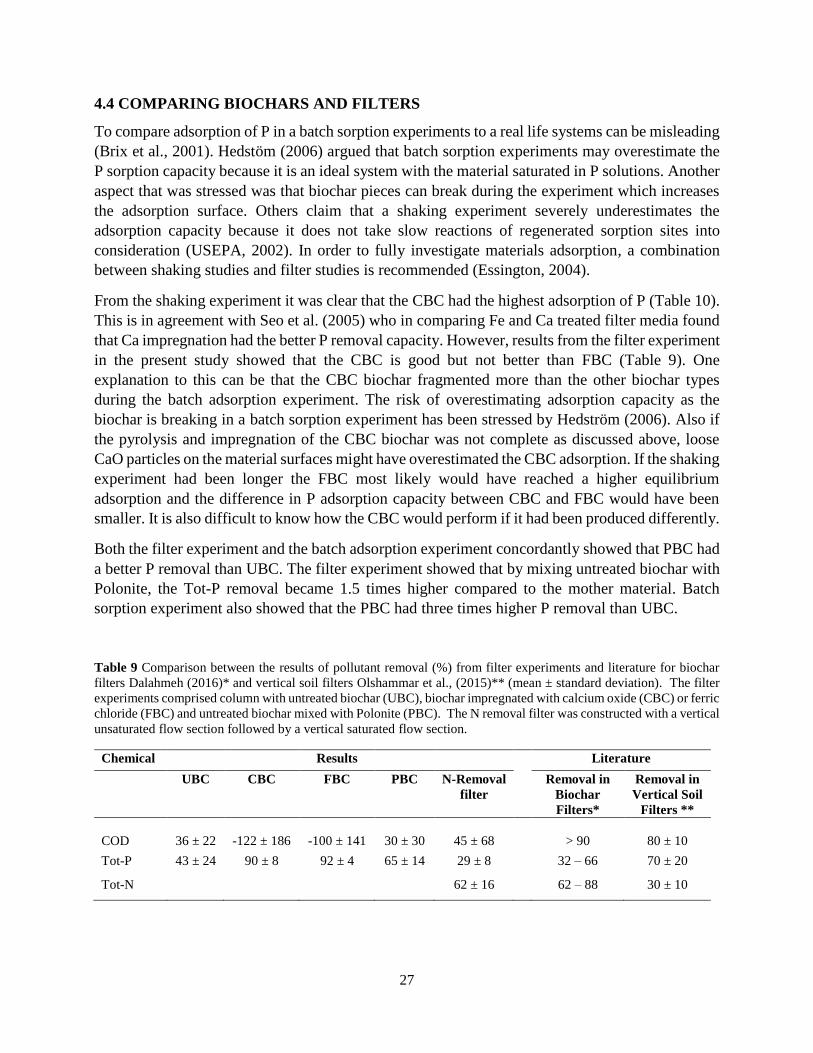
27
4.4 COMPARING BIOCHARS AND FILTERS
To compare adsorption of P in a batch sorption experiments to a real life systems can be misleading
(Brix et al., 2001). Hedstöm (2006) argued that batch sorption experiments may overestimate the
P sorption capacity because it is an ideal system with the material saturated in P solutions. Another
aspect that was stressed was that biochar pieces can break during the experiment which increases
the adsorption surface. Others claim that a shaking experiment severely underestimates the
adsorption capacity because it does not take slow reactions of regenerated sorption sites into
consideration (USEPA, 2002). In order to fully investigate materials adsorption, a combination
between shaking studies and filter studies is recommended (Essington, 2004).
From the shaking experiment it was clear that the CBC had the highest adsorption of P (Table 10).
This is in agreement with Seo et al. (2005) who in comparing Fe and Ca treated filter media found
that Ca impregnation had the better P removal capacity. However, results from the filter experiment
in the present study showed that the CBC is good but not better than FBC (Table 9). One
explanation to this can be that the CBC biochar fragmented more than the other biochar types
during the batch adsorption experiment. The risk of overestimating adsorption capacity as the
biochar is breaking in a batch sorption experiment has been stressed by Hedström (2006). Also if
the pyrolysis and impregnation of the CBC biochar was not complete as discussed above, loose
CaO particles on the material surfaces might have overestimated the CBC adsorption. If the shaking
experiment had been longer the FBC most likely would have reached a higher equilibrium
adsorption and the difference in P adsorption capacity between CBC and FBC would have been
smaller. It is also difficult to know how the CBC would perform if it had been produced differently.
Both the filter experiment and the batch adsorption experiment concordantly showed that PBC had
a better P removal than UBC. The filter experiment showed that by mixing untreated biochar with
Polonite, the Tot-P removal became 1.5 times higher compared to the mother material. Batch
sorption experiment also showed that the PBC had three times higher P removal than UBC.
Table 9 Comparison between the results of pollutant removal (%) from filter experiments and literature for biochar
filters Dalahmeh (2016)* and vertical soil filters Olshammar et al., (2015)** (mean ± standard deviation). The filter
experiments comprised column with untreated biochar (UBC), biochar impregnated with calcium oxide (CBC) or ferric
chloride (FBC) and untreated biochar mixed with Polonite (PBC). The N removal filter was constructed with a vertical
unsaturated flow section followed by a vertical saturated flow section.
Chemical Results Literature
UBC CBC FBC PBC N-Removal
filter
Removal in
Biochar
Filters*
Removal in
Vertical Soil
Filters **
COD 36 ± 22 -122 ± 186 -100 ± 141 30 ± 30 45 ± 68 > 90 80 ± 10
Tot-P 43 ± 24 90 ± 8 92 ± 4 65 ± 14 29 ± 8 32 – 66 70 ± 20
Tot-N
62 ± 16 62 – 88 30 ± 10
28
A factor that affects the P and N removal is the volume and depth of the filters. The column filters
were 50 cm tall which is similar to the 55 and 60 cm biochar filters compared with (Dalahmeh,
2016). The unsaturated filter section in the N removal filter was 30 cm deep which is smaller than
the vertical soil filters (Olshammar et al., 2015). It is possible that a larger N removal filter might
have had a better N removal.
If for instance the CBC or FBC would be used in real-scale filters the amount of filter material do
not need to be high since the removal efficiency is high. It is possible that impregnated biochar in
a filter would be more suitable as a separate P filter module connected to a larger system such as
the N removal filter. To use the N filter in larger scale would require some planning on where to
locate the filter. Alternately the unsaturated section or the whole filter system could be installed on
top of a soil profile with a pump feeding the filter with wastewater from a septic tank.
4.4 POSSIBLE SUORCES OF EXPERIMENTAL ERROR
In the second week of the column experiment large hydrophobic (dry) areas in the column filters
were observed and the filters were therefore washed with distilled water which enabled wastewater
to flow through the entire filter volume. It could not be excluded that the washing could have
removed some of the impregnation on FBC and CBC lowering their removal capacity.
The N removal filter was relocated due to interference of FeCl3 on the N samples. After that the N
removal filter had been relocated analysis results became more stable. However it is possible that
some residual FeCl3, used as P precipitation chemical, from the wastewater got adsorbed and stayed
in the filter and further influenced the analysis. Initially, N parameters were also measured in the
influent and effluent of the column filters. However, it soon became clear that ions and high COD
from the filters themselves interfered with the kits for chemical analyses, giving unrealistic and
highly fluctuating results. It was therefore decided to stop the N measurements in week 5 and to
only present P data as the analysis kit for P was not as affected by high COD. In conclusion, there
is a risk that some of the results in this report might be affected by intrinsic COD and ions from the
filter materials. In future studies, when sampling water from impregnated filters, it is important to
consider the potential problems the impregnation itself might cause on the analysis.
29
5. CONCLUSIONS
The batch adsorption and filter experiments in this study demonstrates that modification of biochar
made from hard wood bark can improve phosphorus removal capacity. Especially modification by
impregnation before pyrolysis can improve the phosphorus removal compared to unmodified
biochar or biochar mixed with Polonite. These materials are promising replacements or additions
to vertical soil filters.
The column filters with biochar impregnated with ferric chloride and calcium oxide showed
phosphorus removal rates of 93 ± 7 % and 95 ± 2 % which was higher than untreated biochar and
biochar mixed with Polonite which removed 32 ± 25 % and 58 ± 17 %, respectively.
The Freundlich adsorption model best fitted the P adsorption onto CaO impregnated and Polonite
mixed biochar. Adsorption to untreated and FeCl3 biochar correlated better with the Langmuir
adsorption model. The adsorption over time for all biochar types was best described by pseudo 2nd
order kinetic model.
The effluent from ferric chloride impregnated biochar had low pH. The effluent from the calcium
oxide impregnated biochar had some precipitation in it and a brown-red color and the biochar was
probably not completely prepared. The low pH, color and precipitation can be a problem if the
materials are to be used in full-scale treatment system.
Biochar filter consisting of a vertical flow aerobic section followed by a horizontal section with
saturated flow reached a high total nitrogen removal rate of 62 ± 16 %, a removal rate higher than
that of conventional vertical soil filters as well as most alternative onsite wastewater treatment
systems.
5.1 SUGGESTIONS FOR FURTHER EXPERIMENTS
For further studies it would be interesting to see how impregnated biochar filters and N removal
units will perform in a long-term column study. Improved filtration or sedimentation of the
inflowing wastewater to the N removal filter would make a more realistic set up and possible better
COD treatment. Clogging effects, not investigated in this study, and changes in flow patterns
through the filters caused by clogging would be another important area to investigate in order to
evaluate the life time of filter materials. It would be worth considering redoing the calcium oxide
impregnation of the biochar to see if the observed color and precipitation effects would disappear.
It would also be interesting to expose calcium oxide biochar to higher P concentration in a batch
adsorption experiment to see if the adsorption isotherm will show signs of a decreasing equilibrium
adsorption (Qe). A longer batch adsorption experiment to investigate the FeCl3 equilibrium
adsorption would also be interesting.
30
6. REFERENCES
Agrafioti, E., Kalderis, D. and Diamadopoulos, E., 2014. Ca and Fe modified biochars as
adsorbents of arsenic and chromium in aqueous solutions. Journal of environmental
management, 146, pp.444-450
Avloppsguiden, 2009. Systemlösningar för enskilt avlopp – en översiktlig jämförelse. Available:
http://husagare.avloppsguiden.se/avloppsteknik.htmL [2017-01-31]
Brix, H., Arias, C.A. and Del Bubba, M., 2001. Media selection for sustainable phosphorus
removal in subsurface flow constructed wetlands. Water science and technology, 44(11-12),
pp.47-54.
Del Bubba, M., Arias, C.A. and Brix, H., 2003. Phosphorus adsorption maximum of sands for use
as media in subsurface flow constructed reed beds as measured by the Langmuir isotherm. Water
Research, 37(14), pp.3390-3400
Dalahmeh, S., 2016. Capacity of biochar filters for wastewater treatment in onsite systems ‒
Technical Report. Havs och vattensmyndigheten, Institutionen för energi och teknik. Rapport
2016:090
Dalahmeh, S., Pell, M., Vinnerås, B., Hylander, L., Öborn, I., Jönsson, H. (2012). Efficiency of
bark, activated charcoal, foam and sand filters in reducing pollutants from greywater. Water,
Air, & Soil Pollution 223(7), 3657-3671.
Boesch, D., Hecky, R., O’Melia, C., Schindler, D. and Seitzinger, S., 2006. Eutrophication of
Swedish seas. Naturvårdsverket report, 5509
Brogowski, Z. and Renman, G., 2004. Characterization of opoka as a basis for its use in
wastewater treatment. Polish Journal of Environmental Studies, 13(1), pp.15-20.
Chen, B., Chen, Z. and Lv, S., 2011. A novel magnetic biochar efficiently sorbs organic
pollutants and phosphate. Bioresource technology, 102(2), pp.716-723
Ejhed, H., Malander, M. and Staaf, H., 2004. Kunskapsläget om enskilda avlopp i Sveriges
kommuner: En enkätstudie. Naturvårdsverket. Rapport 5415
Eveborn, D., Gustafsson, J.P., Elmefors, E., Ljung, E., Yu, L. and Renman, G., 2012.
Kvantifiering av fosforläckage från markbaserade avloppssystem. Swedish Agency for Marine
and Water Management: Göteborg, Sweden
Essington, M.E., 2004. Soil and water chemistry: An integrative approach. CRC press
Hedström, A., 2006. Reactive filter materials for ammonium and phosphorus sorption in small
scale wastewater treatment, Doctoral dissertation, Luleå University of Technology
Hjelmqvist, J., 2012. Små avlopp ingen skitsak-Uppföljning av Naturvårdsverkets
tillsynskampanj för små avlopp. Havs-och vattenmyndigheten, rapport 11
31
Havs- och vattenmyndigheten., 2016a. Näringsbelastningen på Österjön och Västerhavet. Havs-
och vattenmyndigheten
Havs- och vattenmyndigheten., 2016b. Tydligare regler för små avloppsanläggningar,
Författningsförslag för avloppsanläggningar upp tom 200 pe, Available:
https://www.havochvatten.se/hav/vagledning--lagar/vagledningar/sma-avlopp/forslag-till-ny-
forordning-om-sma-avlopp.html [2017-02-10]
Ho, Y.S. and McKay, G., 1999. Pseudo-second order model for sorption processes. Process
biochemistry, 34(5), pp.451-465
Ho, Y.S. and McKay, G., 1998. A comparison of chemisorption kinetic models applied to
pollutant removal on various sorbents. Process Safety and Environmental Protection, 76(4),
pp.332-340
Joseph, S. and Lehmann, J., 2009. Biochar for environmental management: science and
technology (No. 631.422 B615bi). London, GB: Earthscan
Jung, K.W., Jeong, T.U., Kang, H.J. and Ahn, K.H., 2016. Characteristics of biochar derived
from marine macroalgae and fabrication of granular biochar by entrapment in calcium-alginate
beads for phosphate removal from aqueous solution. Bioresource technology, 211, pp.108-116.
Li, J.H., Lv, G.H., Bai, W.B., Liu, Q., Zhang, Y.C. and Song, J.Q., 2016. Modification and use of
biochar from wheat straw (Triticum aestivum L.) for nitrate and phosphate removal from
water. Desalination and Water Treatment, 57(10), pp.4681-4693
Liu, F., Zuo, J., Chi, T., Wang, P. and Yang, B., 2015. Removing phosphorus from aqueous
solutions by using iron-modified corn straw biochar. Frontiers of Environmental Science &
Engineering, 9(6), pp.1066-1075
Messing, I., 2013. Markfysikens grunder, institutionen för mark och miljö SLU
Miljömålsrådet, 2010. Miljömålen – svensk konsumtion och global miljö- påverkan.
Miljömålsrådets uppföljning av de Svenska miljömålen, de Facto 2010. Naturvårdsverket,
Stockholm
Naturvårdsverket, 2014. Rening av avloppsvatten i Sverige 2014, SBN 978-91-620-8703-6
Olshammar, M., Ek, M., Rosenquist, L., Ejhed, H., Sidvall, A. and Svanström, S.,
2015. Uppdatering av kunskapsläget och statistik för små avloppsanläggningar (No. 166).
Report
Palm, O., Malmén, L. and Jönsson, H., 2002. Robusta, uthålliga små avloppsystem.
Naturvårdsverket, rapport 5224
Rajapaksha, A.U., Chen, S.S., Tsang, D.C., Zhang, M., Vithanage, M., Mandal, S., Gao, B.,
Bolan, N.S. and Ok, Y.S., 2016. Engineered/designer biochar for contaminant
removal/immobilization from soil and water: Potential and implication of biochar
modification. Chemosphere, 148, pp.276-291
32
Ren, J., Li, N., Li, L., An, J.K., Zhao, L. and Ren, N.Q., 2015. Granulation and ferric oxides
loading enable biochar derived from cotton stalk to remove phosphate from water. Bioresource
technology, 178, pp.119-125
Ridderstolpe, P., 2009. Markbaserad rening: en förstudie för bedömning av kunskapsläge och
utvecklingsbehov: länsstyrelserna: Stockholm: Västra Götaland: Skåne. Länsstyrelsen Västra
Götalands län
Uppsala Vatten AB 2015, Miljörapport 2015 Kungsänsverket, available:
http://www.uppsalavatten.se/Global/Uppsala_vatten/Dokument/Milj%C3%B6rapporter/2015/Mil
jorapport_Kungsangsverket_2015.pdf [2017-01-10]
US EPA, 2002. Onsite Wastewater Treatment Systems Manual. EPA/625/R-00/008. U.S.
Environmental Protection Agency
Vindelkol AB, 2009. Biokol-Terra Preta, Available: http://www.vindelkol.se/text1_13.html,
[2017-02-08]
Seo, D.C., Cho, J.S., Lee, H.J. and Heo, J.S., 2005. Phosphorus retention capacity of filter media
for estimating the longevity of constructed wetland. Water Research, 39(11), pp.2445-2457
Zhang, M., Gao, B., Varnoosfaderani, S., Hebard, A., Yao, Y. and Inyang, M., 2013. Preparation
and characterization of a novel magnetic biochar for arsenic removal. Bioresource
technology, 130, pp.457-462
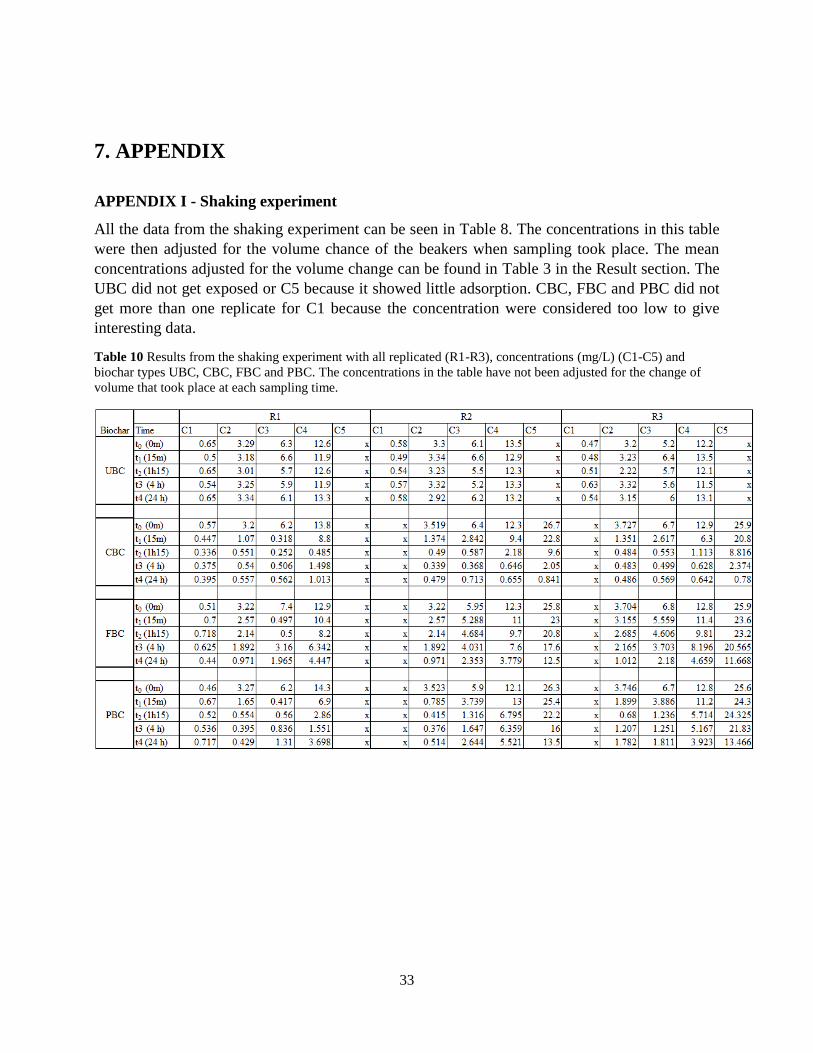
33
7. APPENDIX
APPENDIX I - Shaking experiment
All the data from the shaking experiment can be seen in Table 8. The concentrations in this table
were then adjusted for the volume chance of the beakers when sampling took place. The mean
concentrations adjusted for the volume change can be found in Table 3 in the Result section. The
UBC did not get exposed or C5 because it showed little adsorption. CBC, FBC and PBC did not
get more than one replicate for C1 because the concentration were considered too low to give
interesting data.
Table 10 Results from the shaking experiment with all replicated (R1-R3), concentrations (mg/L) (C1-C5) and
biochar types UBC, CBC, FBC and PBC. The concentrations in the table have not been adjusted for the change of
volume that took place at each sampling time.
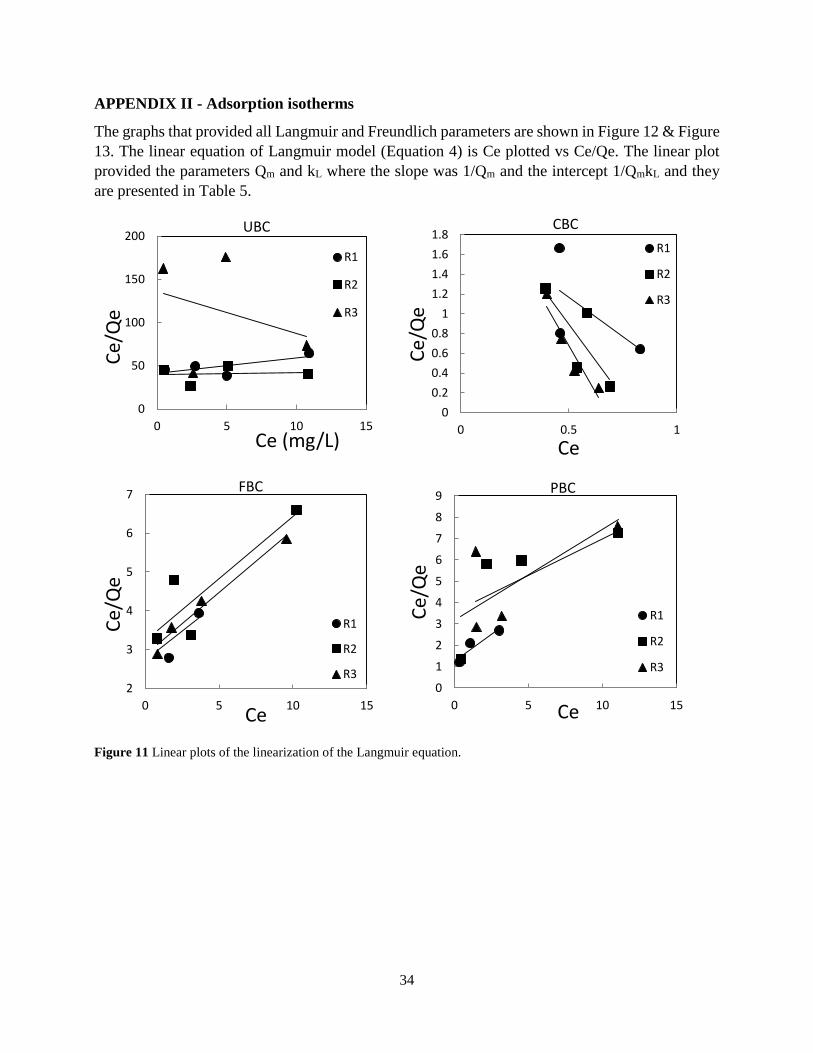
34
APPENDIX II - Adsorption isotherms
The graphs that provided all Langmuir and Freundlich parameters are shown in Figure 12 & Figure
13. The linear equation of Langmuir model (Equation 4) is Ce plotted vs Ce/Qe. The linear plot
provided the parameters Qm and kL where the slope was 1/Qm and the intercept 1/QmkL and they
are presented in Table 5.
Figure 11 Linear plots of the linearization of the Langmuir equation.
0
50
100
150
200
0 5 10 15
Ce/
Qe
Ce (mg/L)
UBC
R1
R2
R3
0
0.2
0.4
0.6
0.8
1
1.2
1.4
1.6
1.8
0 0.5 1C
e/Q
e
Ce
CBC
R1
R2
R3
2
3
4
5
6
7
0 5 10 15
Ce/
Qe
Ce
FBC
R1
R2
R30
1
2
3
4
5
6
7
8
9
0 5 10 15
Ce/
Qe
Ce
PBC
R1
R2
R3
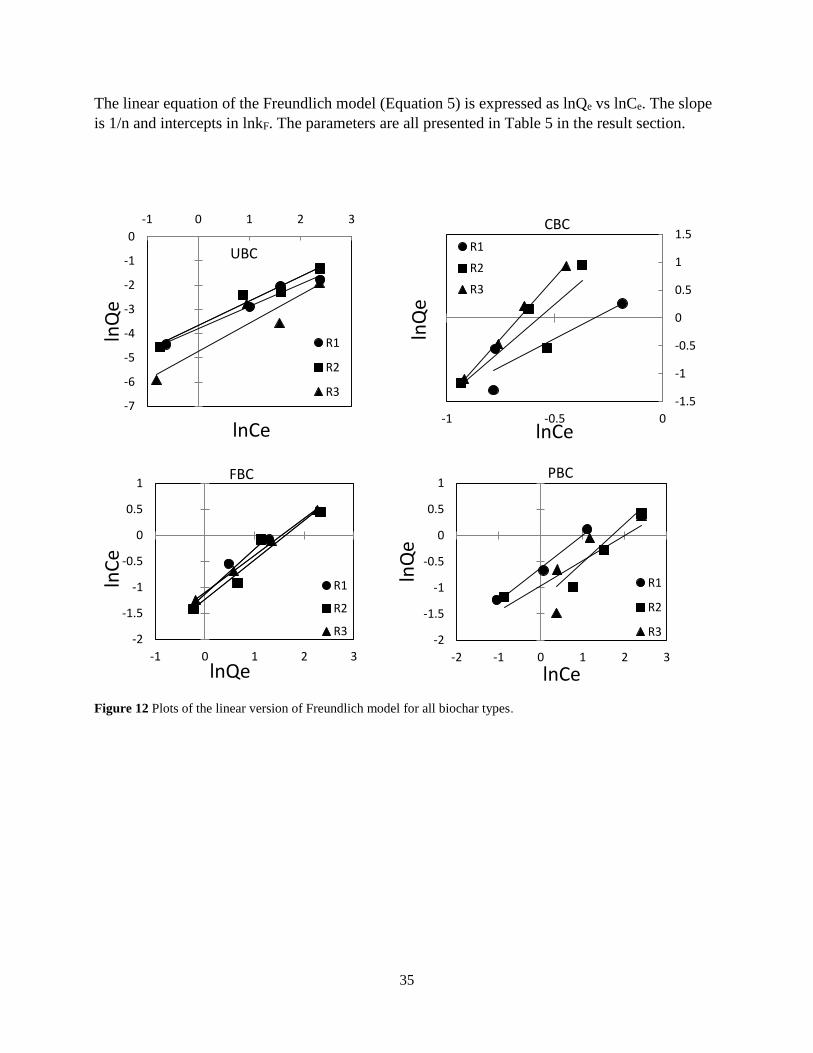
35
The linear equation of the Freundlich model (Equation 5) is expressed as lnQe vs lnCe. The slope
is 1/n and intercepts in lnkF. The parameters are all presented in Table 5 in the result section.
Figure 12 Plots of the linear version of Freundlich model for all biochar types.
-7
-6
-5
-4
-3
-2
-1
0
-1 0 1 2 3
lnQ
e
lnCe
UBC
R1
R2
R3-1.5
-1
-0.5
0
0.5
1
1.5
-1 -0.5 0ln
Qe
lnCe
CBC
R1
R2
R3
-2
-1.5
-1
-0.5
0
0.5
1
-1 0 1 2 3
lnC
e
lnQe
FBC
R1
R2
R3-2
-1.5
-1
-0.5
0
0.5
1
-2 -1 0 1 2 3
lnQ
e
lnCe
PBC
R1
R2
R3
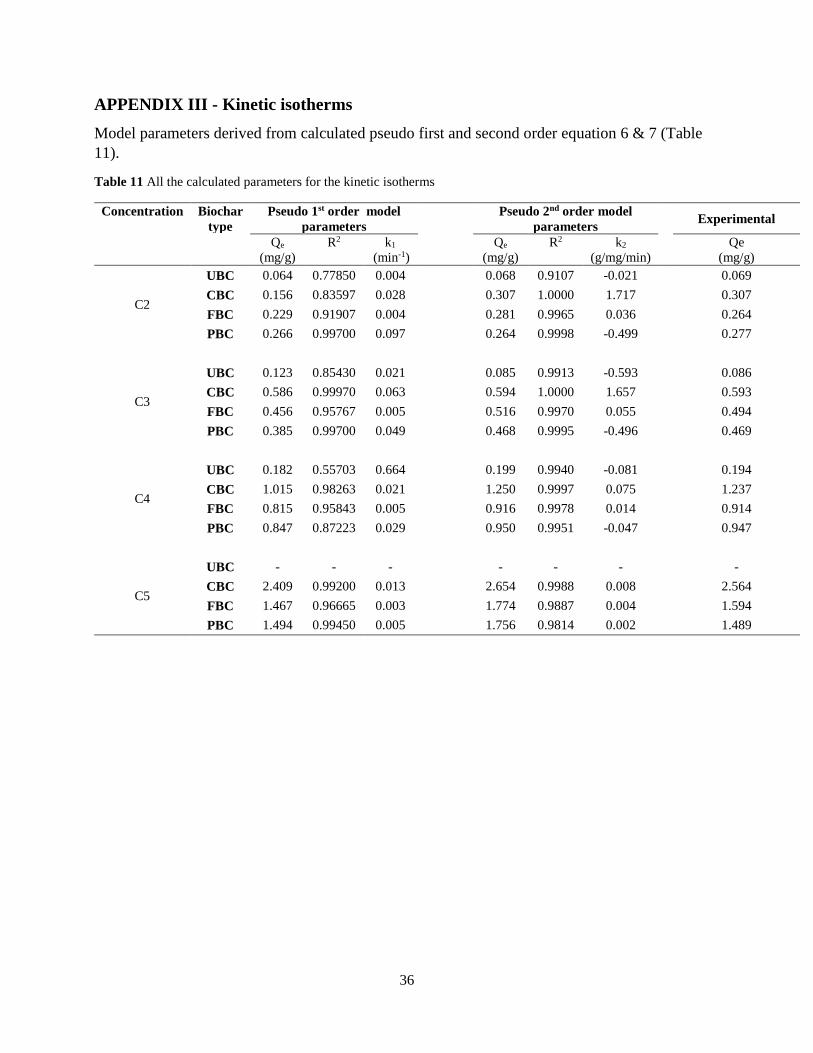
36
APPENDIX III - Kinetic isotherms
Model parameters derived from calculated pseudo first and second order equation 6 & 7 (Table
11).
Table 11 All the calculated parameters for the kinetic isotherms
Concentration Biochar
type
Pseudo 1st order model
parameters Pseudo 2nd order model
parameters
Experimental
Qe
(mg/g)
R2
k1
(min-1) Qe
(mg/g)
R2
k2
(g/mg/min)
Qe
(mg/g)
C2
UBC 0.064 0.77850 0.004 0.068 0.9107 -0.021 0.069
CBC 0.156 0.83597 0.028 0.307 1.0000 1.717 0.307
FBC 0.229 0.91907 0.004 0.281 0.9965 0.036 0.264
PBC 0.266 0.99700 0.097 0.264 0.9998 -0.499 0.277
C3
UBC 0.123 0.85430 0.021 0.085 0.9913 -0.593 0.086
CBC 0.586 0.99970 0.063 0.594 1.0000 1.657 0.593
FBC 0.456 0.95767 0.005 0.516 0.9970 0.055 0.494
PBC 0.385 0.99700 0.049 0.468 0.9995 -0.496 0.469
C4
UBC 0.182 0.55703 0.664 0.199 0.9940 -0.081 0.194
CBC 1.015 0.98263 0.021 1.250 0.9997 0.075 1.237
FBC 0.815 0.95843 0.005 0.916 0.9978 0.014 0.914
PBC 0.847 0.87223 0.029 0.950 0.9951 -0.047 0.947
C5
UBC - - - - - - -
CBC 2.409 0.99200 0.013 2.654 0.9988 0.008 2.564
FBC 1.467 0.96665 0.003 1.774 0.9887 0.004 1.594
PBC 1.494 0.99450 0.005 1.756 0.9814 0.002 1.489
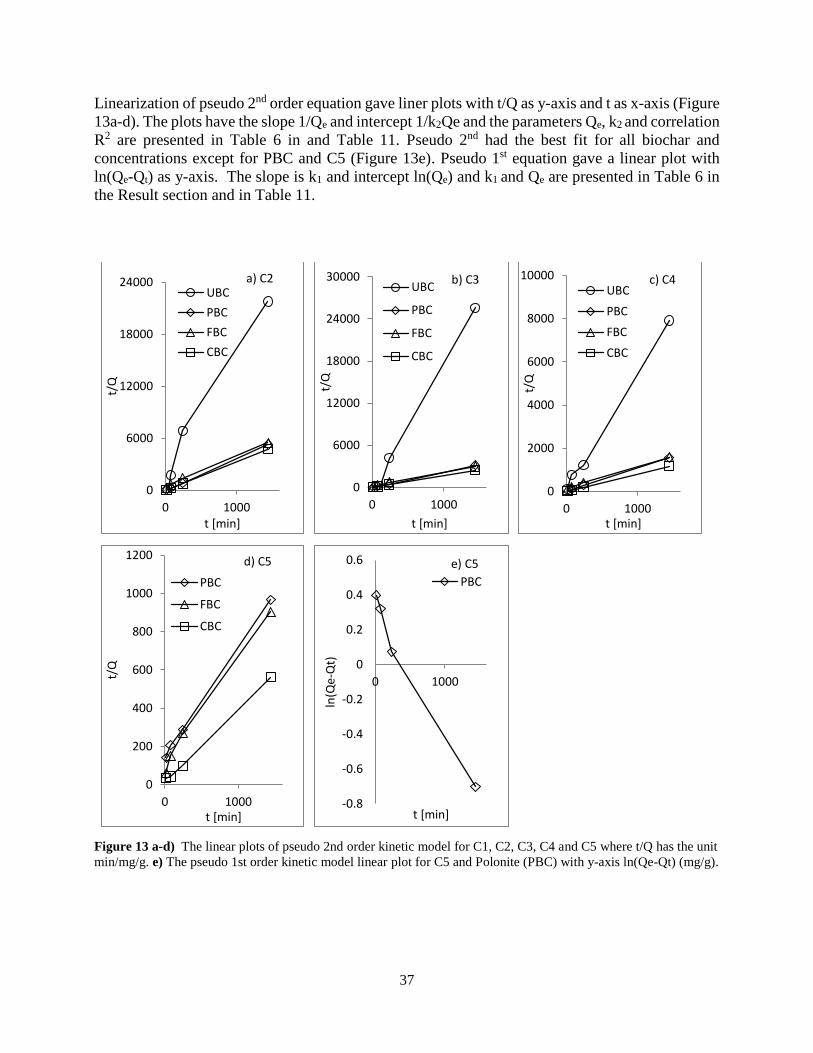
37
Linearization of pseudo 2nd order equation gave liner plots with t/Q as y-axis and t as x-axis (Figure
13a-d). The plots have the slope 1/Qe and intercept 1/k2Qe and the parameters Qe, k2 and correlation
R2 are presented in Table 6 in and Table 11. Pseudo 2nd had the best fit for all biochar and
concentrations except for PBC and C5 (Figure 13e). Pseudo 1st equation gave a linear plot with
ln(Qe-Qt) as y-axis. The slope is k1 and intercept ln(Qe) and k1 and Qe are presented in Table 6 in
the Result section and in Table 11.
Figure 13 a-d) The linear plots of pseudo 2nd order kinetic model for C1, C2, C3, C4 and C5 where t/Q has the unit
min/mg/g. e) The pseudo 1st order kinetic model linear plot for C5 and Polonite (PBC) with y-axis ln(Qe-Qt) (mg/g).
0
6000
12000
18000
24000
0 1000
t/Q
t [min]
a) C2UBC
PBC
FBC
CBC
0
6000
12000
18000
24000
30000
0 1000
t/Q
t [min]
b) C3UBC
PBC
FBC
CBC
0
2000
4000
6000
8000
10000
0 1000
t/Q
t [min]
c) C4UBC
PBC
FBC
CBC
0
200
400
600
800
1000
1200
0 1000
t/Q
t [min]
d) C5
PBC
FBC
CBC
-0.8
-0.6
-0.4
-0.2
0
0.2
0.4
0.6
0 1000
ln(Q
e-Q
t)
t [min]
e) C5
PBC
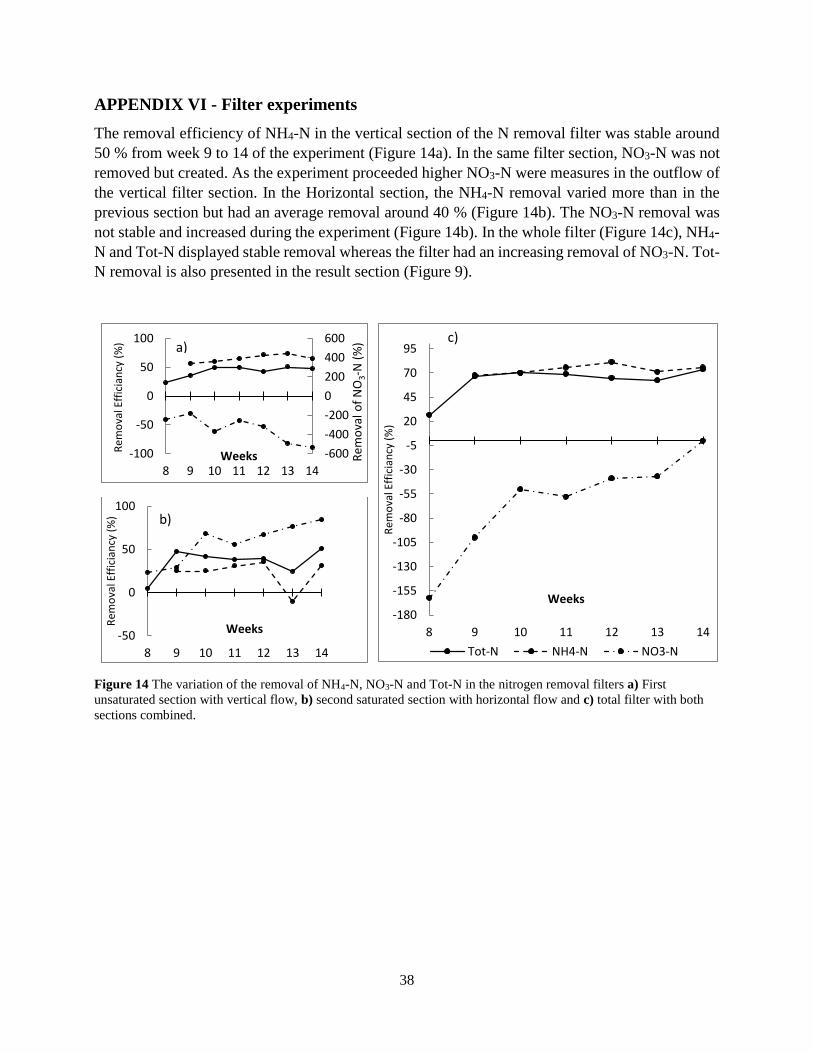
38
APPENDIX VI - Filter experiments
The removal efficiency of NH4-N in the vertical section of the N removal filter was stable around
50 % from week 9 to 14 of the experiment (Figure 14a). In the same filter section, NO3-N was not
removed but created. As the experiment proceeded higher NO3-N were measures in the outflow of
the vertical filter section. In the Horizontal section, the NH4-N removal varied more than in the
previous section but had an average removal around 40 % (Figure 14b). The NO3-N removal was
not stable and increased during the experiment (Figure 14b). In the whole filter (Figure 14c), NH4-
N and Tot-N displayed stable removal whereas the filter had an increasing removal of NO3-N. Tot-
N removal is also presented in the result section (Figure 9).
Figure 14 The variation of the removal of NH4-N, NO3-N and Tot-N in the nitrogen removal filters a) First
unsaturated section with vertical flow, b) second saturated section with horizontal flow and c) total filter with both
sections combined.
-600
-400
-200
0
200
400
600
-100
-50
0
50
100
8 9 10 11 12 13 14
Rem
ova
l of
NO
3-N
(%
)
Rem
ova
l Eff
icia
ncy
(%
)
Weeks
a)
-180
-155
-130
-105
-80
-55
-30
-5
20
45
70
95
8 9 10 11 12 13 14
Rem
ova
l Eff
icia
ncy
(%
)
Weeks
Tot-N NH4-N NO3-N
c)
-50
0
50
100
8 9 10 11 12 13 14
Rem
ova
l Eff
icia
ncy
(%
)
Weeks
b)