phosphorus and nitrogen budget for inland, saline water shrimp
TRANSCRIPT

Research Article Open Access
Sun and Boyd, Fish Aquac J 2013, 4:1 DOI: 10.4172/2150-3508.1000080
Research Article Open Access
Volume 4 • Issue 1 • 1000080Fish Aquac JISSN: 2150-3508 FAJ, an open access journal
Keywords: Nitrogen; Phosphorus; Inland shrimp farming
Introduction There has been considerable research on nitrogen and phosphorus
budgets for marine shrimp farms [1-5]. These studies show that only 20 to 40% of nitrogen and 10 to 15% of phosphorus applied to ponds in feed are recovered in harvested shrimp. In fish culture, 20 to 40% of both nitrogen and phosphorus are recovered from feed in harvest biomass [6]. The reason for the lower recovery of feed phosphorus in shrimp is that shrimp, unlike fish, do not have a boney skeleton – bone is made of calcium phosphate.
Much of the feed nitrogen not recovered in shrimp is lost from ponds by diffusion of nitrogen gases resulting from denitrification and ammonia from metabolic activities into the air. Some nitrogen is contained in organic matter that accumulates in pond sediment, and much phosphorus is adsorbed by sediment. As a result, the amount of nitrogen and phosphorus in pond effluent is much less than the difference between the amounts of these nutrients applied in feed and recovered at harvest in shrimp.
Although still a small proportion of shrimp aquaculture production, inland shrimp culture has become common in several areas worldwide. Inland ponds for shrimp culture typically are supplied with low-salinity water from saline aquifers [7]. Most environmental concerns of inland shrimp culture focus on salinization, because these culture systems often discharge into small, freshwater streams [8-10]. Discharges of nitrogen and phosphorus have not been given as much attention in inland shrimp farming as in coastal shrimp farming, but a recent study by Prapaiwong and Boyd [11] revealed that considerable nitrogen and phosphorus were contained in effluent from an inland shrimp farm. Because nitrogen and phosphorus can cause eutrophication, and ammonia and nitrite in effluents can be toxic to aquatic animals in receiving waters Boyd and Tucker [6] more information should be obtained on nitrogen and phosphorus budgets in inland, low-salinity shrimp ponds.
The purpose of this study was to prepare nitrogen and phosphorus budgets for inland, low-salinity shrimp ponds in Alabama and to estimate the quantities of nitrogen and phosphorus released into natural waters through effluents from these systems.
Methods Ponds and management
This study was conducted in three ponds at the Greene Prairie Aquafarm, an inland shrimp farm, located beside Alabama Highway 43 about 5 km north of Fork land in the Black land Prairie region of west-central Alabama. The newly constructed, embankment ponds used in this study had not contained water before were selected for the study in the 2011 growing season (Figure 1). Pond water surface areas were as follows: N-10, 1.62 ha; N-11, 1.53 ha; N-12, 1.92 ha; average depths for three ponds were 1.11 m, 0.95 m and 0.95 m, respectively. When water levels are 10 cm below the top of overflow pipes, watershed areas were as follows: N-10, 0.21 ha; N-11, 0.25 ha; N-12, 0.27 ha.
Ponds were filled with saline ground water from a well. The drop-fill practice was implemented to provide storage capacity for rainfall and prevent overflow after normal rainfall events [12,13]. The initial water levels in the ponds were about 10 cm below the tops of the overflow pipes when shrimp were stocked, and well water was added to the ponds to replace evaporation and seepage. Water levels were maintained 10-15 cm below the top the overflow pipes.
Ponds N-10 and N-11 were stocked with post-larval shrimp at 20/m2 and 21/ m2 on 20 April and N-12 was stocked with post-larval shrimp at 21/m2 on 12 May. Feed containing 35% crude protein was used throughout the production cycle. Ponds were not treated with
*Corresponding author: Claude E Boyd, School of Fisheries, Aquaculture andAquatic Sciences, Auburn University, Alabama 36849 USA, Tel: 1-224-844-4078;E-mail: [email protected]
Received July 31, 2013; Accepted October 24, 2013; Published October 31, 2013
Citation: Sun W, Boyd CE (2013) Phosphorus and Nitrogen Budgets for Inland, Saline Water Shrimp Ponds in Alabama. Fish Aquac J 4: 080. doi: 10.4172/2150-3508.1000080
Copyright: © 2013 Sun W, et al. This is an open-access article distributed under the terms of the Creative Commons Attribution License, which permits unrestricted use, distribution, and reproduction in any medium, provided the original author and source are credited.
AbstractPhosphorus and nitrogen budgets were prepared for ponds at an inland low-salinity shrimp farm in the Black
land Prairie region of Alabama. The study was conducted during the first crop in three newly constructed ponds that had never before contained water. The main input of phosphorus and nitrogen was feed and averaged 47 kg/ha and 208.5 kg/ha, respectively. These inputs respectively accounted for 98.9% and 95.5% of total input for phosphorus and nitrogen; other inputs of phosphorus and nitrogen were post larvae, well water, rainfall and runoff, that combined, averaged 0.5 kg/ha and 9.8 kg/ha, respectively. The major output of phosphorus and nitrogen was shrimp harvest that averaged 5.2 kg/ha for phosphorus and 45.7 kg/ha for nitrogen. Only 10.9% of phosphorus and 21% of nitrogen applied in feed were incorporated into shrimp. Other losses of phosphorus and nitrogen were water outflows (seepage and harvest effluent) that accounted for 3.2 kg/ha for phosphorus and 7.8 kg/ha for nitrogen. The difference between the inputs and outputs of phosphorus is thought to represent adsorption by bottom soils. For nitrogen, the discrepancy between input and output apparently was caused by accumulation of organic nitrogen in bottom soil, denitrification and NH3 volatilization.
Phosphorus and Nitrogen Budgets for Inland, Saline Water Shrimp Ponds in AlabamaWei Sun and Claude E Boyd*School of Fisheries, Aquaculture and Aquatic Sciences, Auburn University, Alabama 36849, USA
Fish
erie
san
d AquacultureJ ournal
ISSN: 2150-3508Fisheries and Aquaculture Journal

Citation: Sun W, Boyd CE (2013) Phosphorus and Nitrogen Budgets for Inland, Saline Water Shrimp Ponds in Alabama. Fish Aquac J 4: 080. doi: 10.4172/2150-3508.1000080
Page 2 of 5
Volume 4 • Issue 1 • 1000080Fish Aquac JISSN: 2150-3508 FAJ, an open access journal
nitrogen and phosphorus fertilizers. Each pond was equipped with a 10-hp electrically-powered, paddlewheel aerator to avoid low dissolved oxygen concentration.
Shrimp were harvested during September; Pond N-12 was harvested on 10 September after 128 days of culture, and Ponds N-11 and N-10 were harvested on 13 September and 22 September after 146 days and 155 days of culture, respectively. During harvest, water drained from ponds was pumped into adjacent ponds that had already been harvest to save water for reuse.
Water budget
Water budgets for the three ponds were based on the method presented by Boyd [12] that uses the hydrologic equation:
Inflows=Outflows ± Change in storage.
Inflows included well water, precipitation and runoff. Outflows were evaporation, seepage, overflow and draining for harvest.
Precipitation and evaporation were measured with a standard rain gauge and a class A evaporation pan, respectively, that were installed near the ponds. Pond evaporation was calculated by multiplying a pan coefficient of 0.81 by pan evaporation [14].
Staff gauges were attached to the piers of each pond to measure the water level. Discharge from the well could not be measured directly, and it was calculated [12]by the following equation:
W=(E+S+O+H) – (P+R)
Where, W=water from well, E=evaporation, S=seepage out, O=overflow, H=pond water depth, P=precipitation, R=runoff.
According to the curve number method [15], approximately 67% rain falling on the watershed entered the ponds in runoff. The equation for calculation of the depth increase resulting from run-off into a given a pond was:
R=0.67 (a/A)P
Where, a=watershed area (m2) and A=pond surface area (m2).
Seepage was estimated during dry periods when there were no
inflows to ponds [12]. The difference in the decline in water level and evaporation is seepage:
S=ΔH – E.
Water levels were maintained 10 cm below the top the overflow pipes to avoid overflow, but staff gauges were read within a few hours after the major rainfall event to check if the water level exceeded the top of the stand pipe. Overflow was estimated as
O=H – T
Where, T=elevation of top of drain pipe.
Phosphorus and nitrogen determinations
Feed samples were obtained during the production cycle and shrimp samples were collected at harvest. The samples were dried at 60°C in a mechanical convection oven and pulverized with an IKA Economic Analytical Mill (Cole-Parmer, Vernon Hills, IL, USA). The pulverized samples were sent to the Auburn University Soil Testing Laboratory for total nitrogen determination by a Leco CHN analyzer. This instrument has a sensitivity of 0.001% nitrogen and an accuracy of 0.01% nitrogen.
The phosphorus analysis followed the procedure outlined by Boyd and Teichert-Coddington [16]. Samples (1.00 g) were incinerated at 500°C for 8 h in a muffle furnace. A 2.0 N acid solution was prepared by mixing equal volumes of 1.0 N HNO3 and 1.0 N HCl, and 5.00 mL of this solution were added to the ash of each sample. The mixture was then rubbed with a rubber policeman and put on a hot plate until nearly dry. The residual was dissolved and transferred to a 100-ml volumetric flask and diluted to volume with 2.0 N acid solution. The resulting solution was filtered through Whatman Number 42 filter paper, and the concentration of total phosphorus was determined by the Auburn University Soil Testing Laboratory with an inductively coupled plasma atomic emission spectrophotometer [ICP-AES] (SpectroCiros CCD, SPECTRO Analytical Instruments, Inc. Mahway, New Jersey, USA). This instrument will detect down to 0.250 mg/L of phosphorus, and the coefficient of variation for repeated analysis of the same solution is about 10%.
Figure 1: Satellite image of Greene Prairie Aquafarm near Forkland, Alabama.
Citation: Sun W, Boyd CE (2013) Phosphorus and Nitrogen Budgets for Inland, Saline Water Shrimp Ponds in Alabama. Fish Aquac J 4: 080. doi: 10.4172/2150-3508.1000080
Page 3 of 5
Volume 4 • Issue 1 • 1000080Fish Aquac JISSN: 2150-3508 FAJ, an open access journal
A 30-cm diameter plastic funnel was placed in a 2-L plastic bottle and installed on a pond embankment to collect rainwater samples. Water samples were collected every 2 weeks throughout the production cycle and at harvest. Samples of well water were collected when well water was pumped into ponds. Water samples were put into 2-L plastic bottles, stored in insulated ice chests and transported to Auburn University for analysis. Samples were subjected to alkaline, persulfate digestion [17]. In this procedure, 10 ml water samples were pipetted into 30-mL test tubes, and 5 mL of 0.075N NaOH and 0.1 g of potassium persulfate were added to the test tubes. Capped test tubes were mixed by inverting twice and autoclaved at 110˚C for 30 min. After the samples cooled to room temperature, 1 mL of borate buffer (61.8 g H3BO3 and 8 g NaOH in 1,000 mL of distilled water) were added. After digestion, 5 ml of resulting solution were transferred to another set of tubes to analyze total phosphorus by the ascorbic acid method [18]. The remaining solution in the tubes was read by ultraviolet spectrophotometry for determination of total nitrogen concentration. Filtered water samples were measured for soluble reactive phosphorus using membrane filtration and ascorbic acid method finish, for NO3-N by the NAS reagent method [18] and for TAN by the salicylate-hypochlorite method [19]. The minimum detectable phosphorus concentration by the ascorbic acid method is 10 μg/L, the accuracy based on spike-recovery is 1.39% and the coefficient of variation for repeated measurements of the sample is 1.75%.
Before ponds were filled with water, soil samples were collected to a depth of 15 cm with aid of a shovel at nine locations in an S-shaped pattern in each pond bottom. Equal volumes of the nine samples were combined and thoroughly mixed to provide a single composite sample for analysis. Ponds were completely drained for harvest in September and sediment samples were collected from ponds N-10 and N-11 were collected as described above. Because water drained from the ponds was pumped to adjacent ponds that had already been harvested, pond N-12 still contained water when the bottom soil samples were collected. Cores were taken with a 5-cm core sample tubes, and the heavy clay soil was so sticky that the tube core tube could not be forced more than 10 cm into the soil. Soil samples were dried at 60°C in a mechanical convection oven and pulverized with a mechanical soil crusher (Custom Laboratory Equipment, Orange City, Florida, USA) to pass a 40-mesh screen. Methods used for determination of total phosphorus and total nitrogen concentration in soil samples were the same as the ones used for feed and shrimp samples.
Phosphorus and nitrogen budget
Phosphorus and nitrogen budgets were prepared for each pond by summing the inputs and outputs of phosphorus and nitrogen. For phosphorus, the inputs were post larval shrimp, feed, well water, rainfall
and run-off. The outputs were shrimp harvest, overflow, seepage, and sediment accumulation. For nitrogen, the inputs were post larval shrimp, feed, well water, rainfall, run-off and N2 fixation. The outputs were shrimp harvest, overflow, seepage, sediment accumulation, ammonia volatilization, and denitrification. The quantities of the post larvae, feed and weight of harvested shrimp were obtained from the production record provided by the owner. Volumes of well water, rainfall, run-off, seepage, overflow, and drainage effluent were obtained by multiplying the depth of water measured in water budgets by pond areas. Quantities of inputs and outputs of phosphorus and nitrogen were obtained by multiplying the quantities of inputs and outputs of water by their phosphorus and nitrogen concentrations.
Results and Discussion Amounts and composition of inputs and outputs
Precipitation and class A pan evaporation data collected at the shrimp farm and obtained from an National Weather Service (NWS) gauging station at Demopolis Lock and Dam about 30 km southeast of the farm are provided (Table 1). Total rainfall for May and July was slightly higher at the gauging station than at the farm and the total rainfall throughout the production cycle was higher at the farm than at the gauging station, while evaporation was slightly higher at the station. Seepage was measured three times for each pond and the average values and standard deviations for three ponds were as follows: N-10, 0.128 ± 0.10 cm/day; N-11, 0.139 ± 0.09 cm/day; N-12, 0.09 ± 0.08 cm/day.
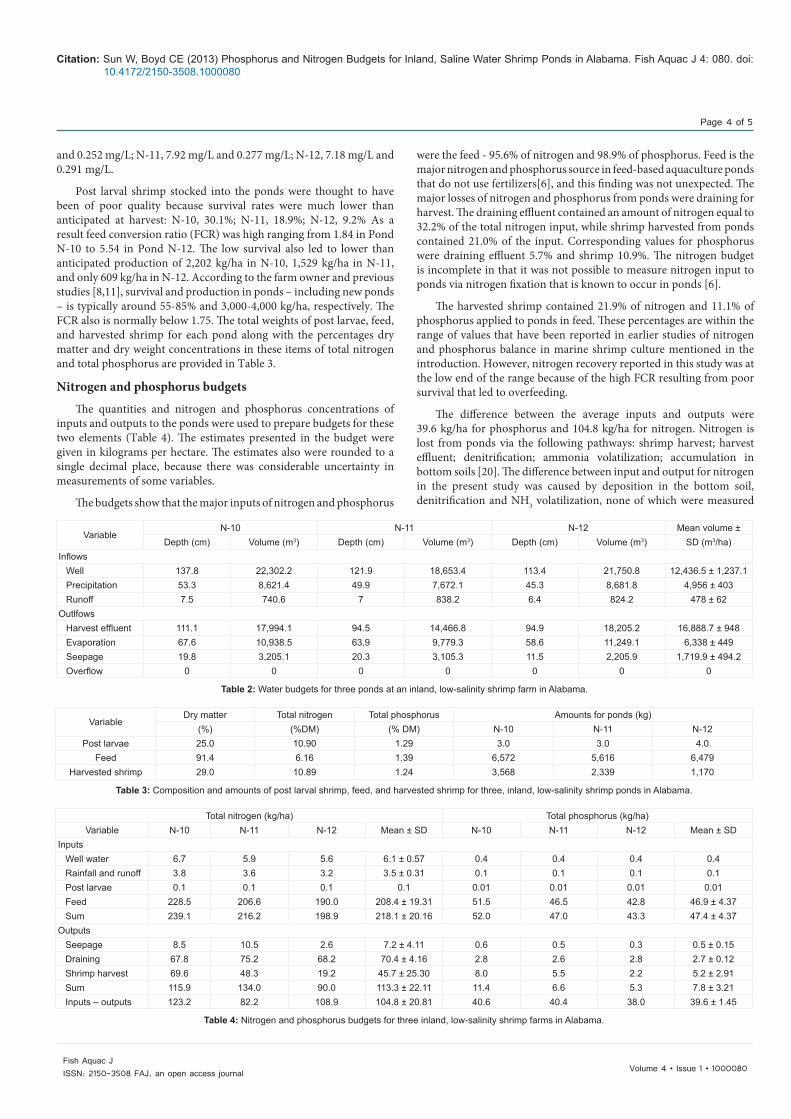
The ponds were initially filled with well water, and precipitation and runoff replaced about 70% of water losses caused by evaporation and seepage. Overflow events were not observed at any time during the production cycle. Total amounts of water introduced to ponds by the three sources are given (Table 2). The effluent discharge during harvest was the largest loss of water. Evaporation was a major loss from ponds and seepage was a much smaller loss as compared to harvest effluent and evaporation. The volumes of water loss also are provided in Table 2. Rain water falling into ponds contained an average 0.649 mg/L total nitrogen and 0.018 mg/L total phosphorus while the well water had an average of 0.490 mg/L and 0.032 mg/L of these two variables, respectively. Runoff could not be collected and was assumed to be similar to rainwater in total nitrogen and phosphorus concentration. Seepage also could not be measured, and was assumed to be similar in composition to pond water. Average concentrations of total nitrogen and total phosphorus, respectively, in pond water were: N-10, 4.27 mg/L and 0.281 mg/L; N-11, 7.92 mg/L and 0.277 mg/L; N-12, 7.18 mg/L and 0.291 mg/L. At draining for harvest, the concentration of total nitrogen and total phosphorus in ponds at draining tended to be higher than the averages for the entire growing season. The respective values for total nitrogen and total phosphorus were: N-10, 6.28 mg/L
Precipitation (cm) Class A pan evaporation (cm)Period Farm NWS Farm NWS
20-30 April 4.6 4.6 4.7 5.4 May 4.6 7.5 17.3 16.5 June 4.7 2.3 18.2 17.7 July 13.6 16.3 17.1 18.2
August 4.7 2.4 15.7 17.1 1-22 September 21.1 14.8 10.4 10.3
Total 53.3 47.9 83.4 85.2
Table 1: Precipitation and class A pan evaporation data for different periods between 20 April and 22 September 2011 at an inland, low-salinity shrimp farm in Alabama and at a nearby National Weather Service (NWS) reporting station (Demopolis, Alabama Lock and Dam).
Citation: Sun W, Boyd CE (2013) Phosphorus and Nitrogen Budgets for Inland, Saline Water Shrimp Ponds in Alabama. Fish Aquac J 4: 080. doi: 10.4172/2150-3508.1000080
Page 4 of 5
Volume 4 • Issue 1 • 1000080Fish Aquac JISSN: 2150-3508 FAJ, an open access journal
and 0.252 mg/L; N-11, 7.92 mg/L and 0.277 mg/L; N-12, 7.18 mg/L and 0.291 mg/L.
Post larval shrimp stocked into the ponds were thought to have been of poor quality because survival rates were much lower than anticipated at harvest: N-10, 30.1%; N-11, 18.9%; N-12, 9.2% As a result feed conversion ratio (FCR) was high ranging from 1.84 in Pond N-10 to 5.54 in Pond N-12. The low survival also led to lower than anticipated production of 2,202 kg/ha in N-10, 1,529 kg/ha in N-11, and only 609 kg/ha in N-12. According to the farm owner and previous studies [8,11], survival and production in ponds – including new ponds – is typically around 55-85% and 3,000-4,000 kg/ha, respectively. The FCR also is normally below 1.75. The total weights of post larvae, feed, and harvested shrimp for each pond along with the percentages dry matter and dry weight concentrations in these items of total nitrogen and total phosphorus are provided in Table 3.
Nitrogen and phosphorus budgets
The quantities and nitrogen and phosphorus concentrations of inputs and outputs to the ponds were used to prepare budgets for these two elements (Table 4). The estimates presented in the budget were given in kilograms per hectare. The estimates also were rounded to a single decimal place, because there was considerable uncertainty in measurements of some variables.
The budgets show that the major inputs of nitrogen and phosphorus
were the feed - 95.6% of nitrogen and 98.9% of phosphorus. Feed is the major nitrogen and phosphorus source in feed-based aquaculture ponds that do not use fertilizers[6], and this finding was not unexpected. The major losses of nitrogen and phosphorus from ponds were draining for harvest. The draining effluent contained an amount of nitrogen equal to 32.2% of the total nitrogen input, while shrimp harvested from ponds contained 21.0% of the input. Corresponding values for phosphorus were draining effluent 5.7% and shrimp 10.9%. The nitrogen budget is incomplete in that it was not possible to measure nitrogen input to ponds via nitrogen fixation that is known to occur in ponds [6].
The harvested shrimp contained 21.9% of nitrogen and 11.1% of phosphorus applied to ponds in feed. These percentages are within the range of values that have been reported in earlier studies of nitrogen and phosphorus balance in marine shrimp culture mentioned in the introduction. However, nitrogen recovery reported in this study was at the low end of the range because of the high FCR resulting from poor survival that led to overfeeding.
The difference between the average inputs and outputs were 39.6 kg/ha for phosphorus and 104.8 kg/ha for nitrogen. Nitrogen is lost from ponds via the following pathways: shrimp harvest; harvest effluent; denitrification; ammonia volatilization; accumulation in bottom soils [20]. The difference between input and output for nitrogen in the present study was caused by deposition in the bottom soil, denitrification and NH3 volatilization, none of which were measured
VariableN-10 N-11 N-12 Mean volume ±
Depth (cm) Volume (m3) Depth (cm) Volume (m3) Depth (cm) Volume (m3) SD (m3/ha) Inflows
Well 137.8 22,302.2 121.9 18,653.4 113.4 21,750.8 12,436.5 ± 1,237.1 Precipitation 53.3 8,621.4 49.9 7,672.1 45.3 8,681.8 4,956 ± 403 Runoff 7.5 740.6 7 838.2 6.4 824.2 478 ± 62
OutlfowsHarvest effluent 111.1 17,994.1 94.5 14,466.8 94.9 18,205.2 16,888.7 ± 948 Evaporation 67.6 10,938.5 63.9 9,779.3 58.6 11,249.1 6,338 ± 449 Seepage 19.8 3,205.1 20.3 3,105.3 11.5 2,205.9 1,719.9 ± 494.2 Overflow 0 0 0 0 0 0 0
Table 2: Water budgets for three ponds at an inland, low-salinity shrimp farm in Alabama.
VariableDry matter Total nitrogen Total phosphorus Amounts for ponds (kg)
(%) (%DM) (% DM) N-10 N-11 N-12 Post larvae 25.0 10.90 1.29 3.0 3.0 4.0
Feed 91.4 6.16 1.39 6,572 5,616 6,479 Harvested shrimp 29.0 10.89 1.24 3,568 2,339 1,170
Table 3: Composition and amounts of post larval shrimp, feed, and harvested shrimp for three, inland, low-salinity shrimp ponds in Alabama.
Total nitrogen (kg/ha) Total phosphorus (kg/ha)Variable N-10 N-11 N-12 Mean ± SD N-10 N-11 N-12 Mean ± SD
Inputs Well water 6.7 5.9 5.6 6.1 ± 0.57 0.4 0.4 0.4 0.4 Rainfall and runoff 3.8 3.6 3.2 3.5 ± 0.31 0.1 0.1 0.1 0.1 Post larvae 0.1 0.1 0.1 0.1 0.01 0.01 0.01 0.01 Feed 228.5 206.6 190.0 208.4 ± 19.31 51.5 46.5 42.8 46.9 ± 4.37 Sum 239.1 216.2 198.9 218.1 ± 20.16 52.0 47.0 43.3 47.4 ± 4.37
Outputs Seepage 8.5 10.5 2.6 7.2 ± 4.11 0.6 0.5 0.3 0.5 ± 0.15 Draining 67.8 75.2 68.2 70.4 ± 4.16 2.8 2.6 2.8 2.7 ± 0.12 Shrimp harvest 69.6 48.3 19.2 45.7 ± 25.30 8.0 5.5 2.2 5.2 ± 2.91 Sum 115.9 134.0 90.0 113.3 ± 22.11 11.4 6.6 5.3 7.8 ± 3.21 Inputs – outputs 123.2 82.2 108.9 104.8 ± 20.81 40.6 40.4 38.0 39.6 ± 1.45
Table 4: Nitrogen and phosphorus budgets for three inland, low-salinity shrimp farms in Alabama.
Citation: Sun W, Boyd CE (2013) Phosphorus and Nitrogen Budgets for Inland, Saline Water Shrimp Ponds in Alabama. Fish Aquac J 4: 080. doi: 10.4172/2150-3508.1000080
Page 5 of 5
Volume 4 • Issue 1 • 1000080Fish Aquac JISSN: 2150-3508 FAJ, an open access journal
because of lack of research resources. Soil samples were collected before and after the production cycle, but the results were highly variable and no difference occurred. This was not surprising, because similar difficulties in measuring nitrogen accumulation in pond bottoms during a single crop had been reported earlier [21].
The discrepancy for phosphorus was assumed to have resulted from absorption by the bottom soils. Bottom sediment of pond strongly adsorbs phosphorus through various processes. Phosphorus is bound in acidic soil mainly as aluminum phosphate, but some also is bound as iron phosphate. In soil neutral or basic reaction, phosphorus is bound in calcium phosphate. Clay particles in soil also can adsorb phosphorus [22]. Phosphorus availability in water depends on the pH of water and mud [23]. Under acidic conditions, phosphorus concentration in water is controlled by solubilities of iron and aluminum phosphates. In near-neutral and high alkalinity condition, phosphorus concentration in water is determined by solubilities of calcium and iron phosphorus [24]. The previously mentioned study by Masuda and Boyd [23] showed that although about two-thirds of phosphorus applied to ponds in feeds and fertilizers accumulate in bottom soils, this phosphorus was tightly bound and only a small amount was water soluble. Bottom soils usually have a large capacity to absorb phosphorus, but the capacity has limits [23,25]. It usually will take 20 years or more to saturate bottom soils with phosphorus at normal feeding rates in catfish culture in the southeastern United States [21]. Therefore, reducing phosphorus inputs to ponds in feed can extend the time to saturate pond soils [26]. However, when considered over several crops, it has been shown that about two-third of phosphorus applied in feed to catfish ponds [23] and shrimp ponds accumulates in bottom soil [5].
The average amounts of nitrogen and phosphorus contained in draining effluent were equivalent to 21.9% of nitrogen and 5.8% of phosphorus applied to ponds in feed. Overflow from ponds was avoided during the present study by maintaining storage volume below the elevation of overflow pipes in order to retain rain water falling into ponds. This procedure is currently used on the farm and prevents overflow other than for exceptionally large rainfall events that typically occur only at intervals of several years. Thus, aside from improving the feed conversion ratio, the main way of lessening the release of nitrogen and phosphorus in farm effluent would be to reduce discharge volume. Although some ponds would need to be drained to provide storage volume, much water could be retained during harvest by transferring it to adjacent ponds rather than discharging it from the farm.
References
1. Briggs MRP, Funge-Smith SJ (1994) A nutrient budget of some intensivemarine shrimp ponds in Thailand. Aquaculture Res 25: 789-811.
2. Teichert-Coddington DR, Martinez D, Ramírez E (2000) Partial nutrient budgets for semi-intensive shrimp farms in Honduras. Aquaculture 190: 139-154.
3. Wahab MA, Bergheim A, Braaten B (2003) Water quality and partial massbudget in extensive shrimp ponds in Bangladesh. Aquaculture 218: 413-423.
4. Paez-Osuna F, Guerrero-Galvan SR, Ruan-Fernandez AC, Espinoza-Angulo R (1997) Fluxes and mass balances of nutrients in a semi-intensive shrimp farmin North-western Mexico. Marine Pollution Bulletin 34: 290-297.
5. Boyd CE, Corpron K, Bernard E, Pengsang P (2006) Estimates of bottomsoil and effluent load of phosphorus at a semi-intensive marine shrimp farm. Journal of the World Aquaculture Society 37: 41-47.
6. Boyd CE, Tucker CS (1998) Pond Aquaculture Water Quality Management.Kluwer Academic Publishers, Boston, Massachusetts, USA.
7. Roy LA, Davis DA, Saoud IP, Boyd CA, Pine HJ, et al. (2010) Shrimp culture in inland low salinity waters. Reviews in Aquaculture 2: 191-208.
8. Boyd CA, Boyd CE, McNevin AA, Rouse DB (2006) Salt discharge from an
inland farm for marine shrimp in Alabama. Journal of the World Aquaculture Society 37: 345-355.
9. Braaten RO, Flaherty M (2001) Salt balances of inland shrimp ponds in Thailand: implications for land and water salinization. Environmental Conservation 28:357-367.
10. Pine HJ, Boyd CE (2011) Stream salinization by inland brackish-water aquaculture. North American Journal of Aquaculture 73: 107-113.
11. Prapaiwong N, Boyd CE (2012) Effluent volume and pollutant loads at an inland, low-salinity, shrimp farm in Alabama. Aquacultural Engineering 48: 1-5.
12. Boyd CE (1982) Hydrology of small experimental fish ponds at Auburn, Alabama. Transactions of the American Fisheries Society 111: 638-644.
13. Cathcart TP, Pote JW, Rutherford DW (1999) Reduction of effluent discharge and ground water use in catfish ponds. Aquacultural Engineering 20: 163-174.
14. Boyd CE (1985) Chemical budgets for channel catfish ponds. Transactions of the American Fisheries Society 114: 291-298.
15. Yoo KH, Boyd CE (1994) Hydrology and Water Supply for Aquaculture. Chapman and Hall, New York, USA.
16. Boyd CE, Teichert-Coddington D (1995) Dry matter, ash, and elementalcomposition of pond-cultured Penaeus vannamei and P. stylirostris. Journal ofthe World Aquaculture Society 26: 88-92.
17. Eaton AD, Clesceri LS, Rice EW, Greenberg AE (2005) Standard Methodsfor the Examination of Water and Wastewater. (21st edition) American PublicHealth Association, Washington, D.C. USA.
18. Gross A, Boyd CE (1998) A digestion procedure for the simultaneousdetermination of total nitrogen and total phosphorus in pond water. Journal ofthe World Aquaculture Society 29: 300-303.
19. Bower CE, Holm-Hansen T (1980) A salicylate-hypochlorite method for determining ammonia in seawater. Canadian Journal of Fisheries and AquaticScience 37: 794-798.
20. Gross A, Boyd CE, Wood CW (2000) Nitrogen transformations and balance inchannel catfish ponds. Aquaculture Engineering 24: 1-14.
21. Boyd CE (1995) Bottom Soils, Sediment, and Pond Aquaculture. Chapman and Hall, New York, USA.
22. Boyd CE (2000) Water Quality, an Introduction. Kluwer Academic Publishers,Boston, Massachusetts, USA.
23. Masuda K, Boyd CE (1994) Phosphorus fractions in soil and water ofaquaculture ponds built on clayey, Ultisols at Auburn, Alabama. Journal of theWorld Aquaculture Society 25: 379-395.
24. Moore A, Reddy KR (1994) Role of Eh and pH on phosphorus geochemistry in sediments of Lake Okeechobee, Florida. Journal of Environmental Quality23:955-964.
25. Boyd CE, Munsiri P (1996) Phosphorus adsorption capacity and availability ofadded phosphorus in soils from aquaculture areas in Thailand. Journal of theWorld Aquaculture Society 27:60-167.
26. Gross A, Boyd CE, Lovell RT, Eya JC (1998) Phosphorus budgets for channelcatfish ponds receiving diets with different phosphorus concentrations. Journal of the World Aquaculture Society 29:31-39.