phosphates cause of eutrophication - ccb.se · one of the main reasons for the progressive...
TRANSCRIPT

PhosPhates cause of eutroPhication

One of the main reasons for the progressive eutrophication of surface water is the phosphorus entering into them due to improperly managed fertilization. The problem of eutrophication becomes a global problem that poses a great threat to flora and water fauna. In order to limit this process, it is very important to properly balance the fertilizer components. The basis for the rational management of the fertilizer should be the exact determination of the soil’s physicochemical parameters, consideration of the level of groundwater and the susceptibility to erosion.
Improperly conducted fertilizer management poses a serious threat to the environment and significantly reduces the effectiveness and agricultural profitability. Although due to the low mobility of phosphorus compounds, it is less susceptible to losses during agricultural production. When the sorption capacity of the soil is exceeded (which means a very high content of this component in the soil), the phosphorus compounds move down to the bottom of the soil profile. Other losses as a result of surface dishwashing and wind erosion. Therefore, it is very important to use indicators to determine the degree of loading of a given environmental component and at the same time to assess the correctness of the conducted fertilizer management. One of the most commonly used indicators is the gross phosphorus balance.
The phosphorus balance is the difference between the inflow of ingredients to the area used for agriculture, in mineral fertilizers, in seed, and the amount of the component in the yields of the main commodity crops harvested for fodder from arable land and grassland, as well as in identifiable harvested side crops and catch crops.
figure 1. Phosphorus gross balance sheet.
A positive gross balance value means a surplus of phosphorus and a negative shortage of phosphorus. The acceptable phosphorus surplus is 2 kg P / ha ( Artur Granstedt – Ecological Recycling Agriculture; Guidelines for farmers and advisors.

agricultural economy in the Baltic countries imPact on the quality of Baltic waters and Progressive eutroPhication.
Based on the data from the European Commission’s report, the values of the gross balance of phosphorus in individual countries were analyzed.
figure 2. Balance results per NUTS II / III regions [1].
Among the Baltic countries, the most sustainable phosphorus economy is maintained by Sweden, whose balance of gross balance for this nutrient component in 2003 amounted to 0.1 kg P/ha UA, which means that there is an almost closed fertilizer economy.
figure 3. Gross phosphorus balances in Sweden in 2003 [1].
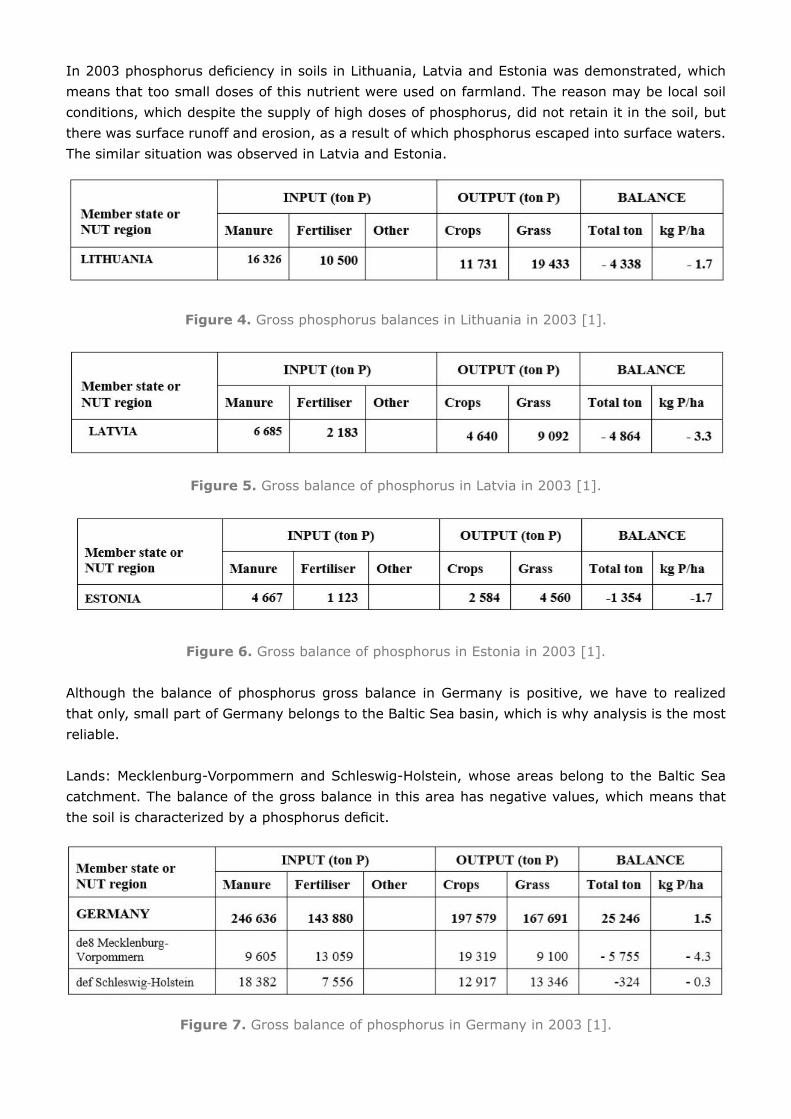
In 2003 phosphorus deficiency in soils in Lithuania, Latvia and Estonia was demonstrated, which means that too small doses of this nutrient were used on farmland. The reason may be local soil conditions, which despite the supply of high doses of phosphorus, did not retain it in the soil, but there was surface runoff and erosion, as a result of which phosphorus escaped into surface waters. The similar situation was observed in Latvia and Estonia.
figure 4. Gross phosphorus balances in Lithuania in 2003 [1].
figure 5. Gross balance of phosphorus in Latvia in 2003 [1].
figure 6. Gross balance of phosphorus in Estonia in 2003 [1].
Although the balance of phosphorus gross balance in Germany is positive, we have to realized that only, small part of Germany belongs to the Baltic Sea basin, which is why analysis is the most reliable.
Lands: Mecklenburg-Vorpommern and Schleswig-Holstein, whose areas belong to the Baltic Sea catchment. The balance of the gross balance in this area has negative values, which means that the soil is characterized by a phosphorus deficit.
figure 7. Gross balance of phosphorus in Germany in 2003 [1].

The only Baltic country except Poland, whose gross balance of phosphorus is almost 11 kg P/ha UR is Finland. As can be seen from the table below, the average consumption of phosphate fertilizers in this country is too high.
figure 8. The balance of phosphorus gross balance in Finland in 2003 [1].
The average balance of gross phosphorus in Poland in 2003, as shown in the table below, was 10.1 kg P/ha UAA.
figure 9. The balance of phosphorus gross balance in Poland in 2003 [1].
This means that in Poland, too much phosphate fertilizers are used, the surplus of which, due to soil erosion and surface runoff, enters surface waters, and then to the Baltic. The area of Poland is the largest part of the Baltic Sea basin, hence sustainable fertilizer management in this area is particularly important.
the situation in Poland has changed 10 years later
The figure 10 presents the actual balance of the gross balance, the optimal balance of the gross balance and the difference between them. The actual value determines the current phosphorus content in the soil. The optimal value is the recommended value for individual provinces. If the difference between them is bigger, it mean that in the soil is surplus phosphorus. If this value is negative, it means that too little phosphorus is delivered to agricultural land, in relation to soil needs.
Province Actual balance of the gross balance
Optimal balance of the gross balance Disparity balance P
Polska / Pl 2,5 1,2 1,4
Dolnośląskie -1,5 1,6 -3,1
Kujawsko-Pomorskie 0,9 -1,4 2,3
Lubelskie 2,1 1,5 0,6
Lubuskie 3,0 0,2 2,8
Łódzkie 6,2 1,4 4,8
Małopolskie -1,9 5,4 -7,3
Mazowieckie 2,5 1,1 1,3
Opolskie 1,2 0,5 0,7
Podkarpackie -0,6 3,7 -4,3
Podlaskie 2,5 4,0 -1,5
Pomorskie 1,9 1,1 0,8
Śląskie 4,0 1,0 3,0
Świętokrzyskie 4,2 2,8 1,4
Warmińsko-Mazurskie 0,9 1,7 -0,8
Wielkopolskie 7,7 -1,4 9,2
Zachodnio-Pomorskie 1,1 1,6 -0,5
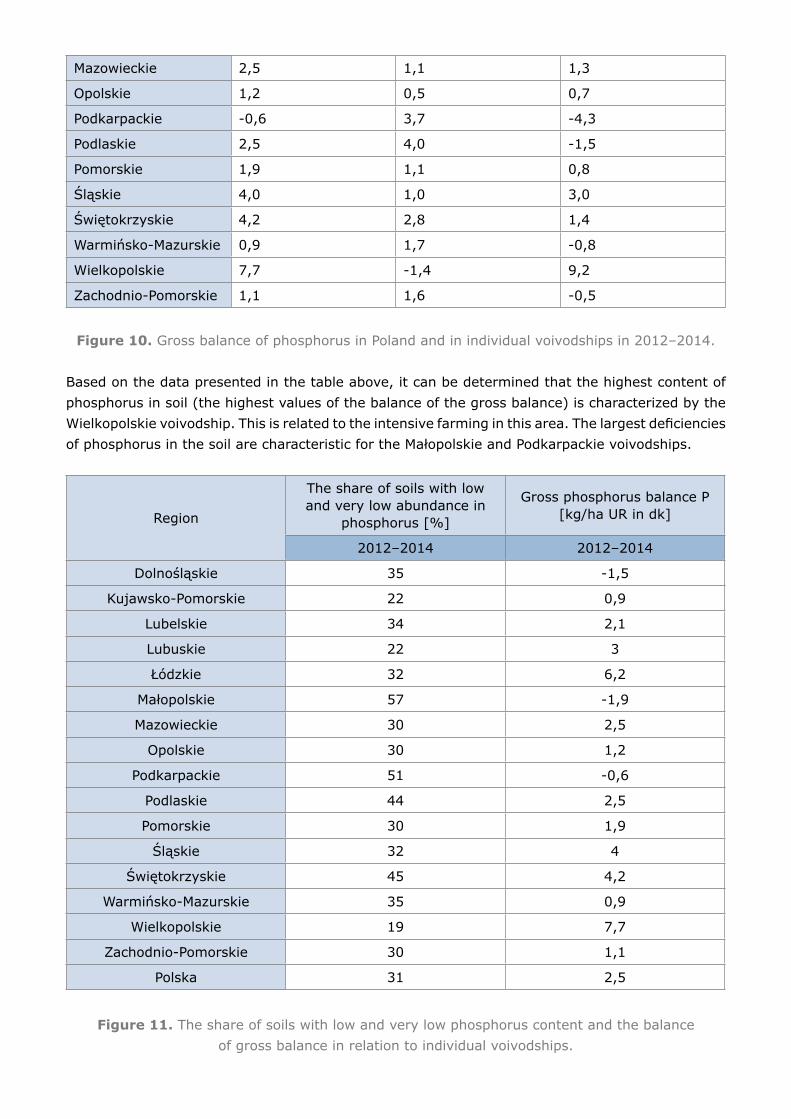
figure 10. Gross balance of phosphorus in Poland and in individual voivodships in 2012–2014.
Based on the data presented in the table above, it can be determined that the highest content of phosphorus in soil (the highest values of the balance of the gross balance) is characterized by the Wielkopolskie voivodship. This is related to the intensive farming in this area. The largest deficiencies of phosphorus in the soil are characteristic for the Małopolskie and Podkarpackie voivodships.
Region
The share of soils with low and very low abundance in
phosphorus [%]
Gross phosphorus balance P [kg/ha UR in dk]
2012–2014 2012–2014
Dolnośląskie 35 -1,5
Kujawsko-Pomorskie 22 0,9
Lubelskie 34 2,1
Lubuskie 22 3
Łódzkie 32 6,2
Małopolskie 57 -1,9
Mazowieckie 30 2,5
Opolskie 30 1,2
Podkarpackie 51 -0,6
Podlaskie 44 2,5
Pomorskie 30 1,9
Śląskie 32 4
Świętokrzyskie 45 4,2
Warmińsko-Mazurskie 35 0,9
Wielkopolskie 19 7,7
Zachodnio-Pomorskie 30 1,1
Polska 31 2,5
figure 11. The share of soils with low and very low phosphorus content and the balanceof gross balance in relation to individual voivodships.

According to studies by J. Kopiński, the most phosphorus in Polish agriculture is added to soils in mineral fertilizers, and the largest outflow occurs in the main crop plants.
The largest flow of phosphorus have the opolskie and wielkopolskie voivodships. However, the most conservative, even extensively, is managed by phosphorus in the Małopolskie Voivodships and Podkarpackie. Such an economy leads to depletion of available, and later spare, forms of phosphorus, which will result in a serious impoverishment of soil fertility and a significant reduction in the use of their production potential.
In the prevailing area of Poland, the applied level of phosphorus fertilization was not justified by the amount of obtained crop yields. Undoubted influence was also improper condition of agrochemical soil, although in recent years have seen a slight improvement.
In many provinces (in particular in Małopolskie and Podkarpackie) the share of soils with low and very low abundance in phosphorus exceeded 50 %, and a relatively small number of farms used any phosphate fertilizers. The size of the balance at the national level in recent years amounted to 2.5 kg P/ha UAA in dk and was 1.4 kg higher than the optimal one, after taking into account the balance indicator (expressing the state of the soils) and atmospheric precipitation.
The high surplus of phosforus, also in relation to the calculated optimum demonstrated in Wielkopolska indicates a potentially high risk of this component being dispersed beyond the agrosystem. Nevertheless, when analyzing statistical data, a trend has been observed for several years in the amount of clean P delivered to agricultural lands. The figure below (Fig. 12) presents the values of pure phosphorus supplied with mineral fertilizers in relation to the total mineral fertilizer consumption in farms with an area of 100 ha and more (whose arable lands constitute about 21 % of the UAA area in the country).
Economic years The amount of pure component in relation to the total mineral fertilizer consumption in a given year
2012/2013 19,2 %
2013/2014 17,6 %
2014/2015 17,0 %
figure 12. Percentage of pure P in relation to the total consumption of mineral fertilizersin 2012–2015 in farms with an area of 100 ha and more.
In the assessment of the level of soil phosphorus fertilization should also take into account the manure in fertilization, which in addition to mineral fertilizers is a valuable source of essential plant nutrients. Manure during decomposition contribute to enriching the soil with humus and improve its physical and chemical properties. Importantly manure increase the sorption capacity of soil and the possibility of slow decomposition of phosphorus (about 4 years!). In 2014/2015, approximately 44.8 million tons of manure was used in agriculture, which in relation to pure P component in good culture amounted to approx. 0.22 kg P/ha UAA. Also in the amount of natural fertilizers used there is a downward trend (Fig. 13).

figure 13. The amount of manure used in Poland in years 2009/10–2014/15.
conclusions
Despite a noticeable downward trend in the use of phosphate fertilizers and manure, Poland as a country lying entirely in the drainage basin of the Baltic Sea, it is still characterized by very high value of the gross balance. Predominant surface soils in Poland are light soils and poor in humus, which translates into a small sorption capacity. This means that when using high doses of phosphorus, a small amount of phosphorus is retained in the soil. Most of the supplied biogen passes due to soil erosion and unregulated water relations, to surface waters, and with them to the Baltic Sea. The amount of manure used in recent years has also adversely affected the sorption capacity of the soil - regular supply of manure to agricultural lands contributes to the increase of humus content in the soil. In this way, the management of fertilizer in Poland contributes to the eutrophication of the Baltic Sea. The current state of affairs can be improved by increasing the level of humus in the soil, regulating agricultural use of water and proper matching doses of fertilizer.
In recent years, the consumption of mineral phosphate fertilizers in Poland has been declining, which is also reflected in the gross balance of the balance, whose value in 10 years fell to 4 kg/ha of UAA (data for 2013 OECD).

Our mission is: Supporting sustainable development, saving and improving the environment, protection of nature and life, as well as human health.
Brochure development: Karolina Chomacka, Maria StaniszewskaEditor: Karolina ChomackaTypesetting: Magdalena Niglus
Polish Ecological ClubCity of Gliwice Chapterul. Ziemowita 1, 44-100 [email protected]
we are all resPonsiBle for the quality of our environment – you are too! you can make a real difference for the world we live in. start acting!
The project is co-financed from the EU Life Program
references
[1] Główny Urząd Statystyczny. Rocznik Statystyczny Rzeczypospolitej Polskiej 2016.[2] Final report to the European Commission. 2005 r. Addressing phosphorus related problems
in farm practice.[3] Kopiński Jerzy, Tujaka Arkadiusz. 2009. Bilans azotu i fosforu w rolnictwie polskim. Woda-
Środowisko-Obszary Wiejskie. T.9. Z. 4(28) s. 103–116.[4] Kopiński Jerzy. 2015. Określenie stopnia polaryzacji oddziaływania produkcji rolniczej na
środowisko na podstawie bilansu azotu brutto. Roczniki Naukowe SERiA XVII (1): 112–117.[5] Kopiński Jerzy. 2016, Ocena gospodarowania fosforem w procesie produkcji rolniczej na
poziomie NUTS-0, NUTS-2, Roczniki Naukowe Stowarzyszenia Ekonomistów Rolnictwa i Agrobiznesu, t. XVIII, z.1).
[6] Pondel Henryk, Maria Ruszkowska, Stanisław Sykut, Henryk Terelak. 1991. Wymywanie składników nawozowych z gleb w świetle badań prowadzonych przez IUNG. Roczniki Gleboznawcze 42 (3/4): 97–106.
[7] Sapek Andrzej. 1998. Phosphorus cycle in Polish agriculture. [W] Phosphorus in agriculture and water quality protection, red. A. Sapek, 8-18. Falenty: IMUZ.
[8] Sapek Andrzej. 2008. Nawożenie fosforem a jego skutki w środowisku. Woda-Środowisko-Obszary Wiejskie, 2008: t.8 z. 2b (24). IMUZ. s. 127–137.
[9] Sapek Barbara. 2014. Nagromadzanie i uwalnianie fosforu w glebach – źródła, procesy, przyczyny. Woda-Środowisko-Obszary Wiejskie, t. 14. Z. 1(45) s. 77–100.