phosphate sorption characteristics and external p
TRANSCRIPT

Journal of Agriculture and Rural Development in the Tropics and Subtropics
Volume 109, No. 2, 2008, pages 139–149
Phosphate Sorption Characteristics and External P Requirements
of Selected South African Soils
E. M. Gichangi 1∗, P. N. S. Mnkeni 1† and P. Muchaonyerwa 1
Abstract
The Transkei is the largest consolidated area in South Africa where land is held by small-
holder farmers but little is known about the extent of phosphate fixation in the region.
This study was conducted to determine the phosphate sorption properties and external
P requirements (EPR) of selected soils from the Transkei region, South Africa and to
relate derived sorption values to selected soil parameters. The P sorption maxima and
EPR values varied widely ranging from 192.3 to 909.1 mg P kg−1 and from 2 to 123 mg
P kg−1 soil, respectively. Citrate dithionite bicarbonate-extractable aluminum explained
most of the observed variations in P sorption. About 43% of the soils were found to
be moderate P fixers and may need management interventions to ensure adequate P
availability to crops. The single point sorption index accurately predicted the EPR of
the soils obviating the need to use multiple point sorption isotherms. The results sug-
gested that the use of blanket phosphate fertilizer recommendations may not be a good
strategy for the region as it may lead to under-application or over-application of P in
some areas.
Keywords: External P requirement, P-sorption, Single point sorption test, Citrate
dithionite bicarbonate-extractable aluminum, South Africa
1 Introduction
The sorption of phosphate by oxides of iron and aluminum, and amorphous materials in
soils is a major contributing factor to reduced effectiveness of added phosphates neces-
sitating larger applications of fertilizer P to achieve good crop yields (Warren, 1994).
Phosphate sorption studies on soils from KwaZulu-Natal and Mpumalanga provinces,
South Africa have shown that highly weathered soils have high sorption capacities rang-
ing from 500 to 1197 mg P kg−1 soil (Bainbridge et al., 1995; Henry and Smith,
2002). The highest P fixers were weathered red or yellow-brown clays with high ox-
alate (amorphous) aluminum content, and especially those with a humic-horizon. The
Transkei is the largest consolidated area (4, 365, 263 ha) in South Africa where land is
held by smallholder farmers (van Averbeke et al., 2008). Little is, however, known
1 Department of Agronomy, University of Fort Hare, PB X1314, Alice, 5700, South Africa∗ Permanent address: Kenya Agricultural Research Institute P.O. Box 340-90100 Machakos,
Kenya, email: [email protected]† corresponding author: email: [email protected]
139
on the extent of P retention by soils in this region of South Africa despite the common
occurrence in the region of soils with potential for high P fixation (Buhmann et al.,
2006a).
Phosphorus sorption relationships are commonly used in the determination of the ex-
ternal phosphorus requirement (EPR) of crops. According to Fox (1981) EPR is the
concentration of P in solution that is non-limiting to plant growth. For most crops, the
amount of P in equilibrium with 0.2 mg P l−1 (P0.2) has been shown to be the threshold
over which no response to P is observed (Beckwith, 1965; Iyamuremye et al., 1996;
Nziguheba et al., 1998). The P requirements, estimated in this manner aim at building
up the status of soil phosphorus by a single application to a level which, thereafter, only
requires maintenance application to replenish losses owing to plant uptake, removal by
erosion or continuing slow reactions between phosphate and soil (Henry and Smith,
2003). No information could be found on the EPR of soils in the Eastern Cape Province,
South Africa. Such information is, however, necessary to guide P fertilizer recommen-
dations to ensure that crop yields are not compromised due to under-fertilization and
that ground water is not polluted with P transported from over-fertilized soils.
Though phosphorus sorption relationships have been used successfully to assess the pre-
liminary fertilizer requirements, the labour and time involved in constructing P sorption
curves make it too expensive for routine soil testing laboratories. Henry and Smith
(2003) proposed a single point sorption test procedure for obtaining an index of the
P requirement in soils that avoids the need for constructing multiple point sorption
isotherms. It was, therefore of interest to determine if the single point sorption proce-
dure could be used as an index for estimating the P requirements of soils in the Eastern
Cape. The objectives of this study were, therefore: (i) to quantify and compare the P
sorption characteristics of selected soils from the Transkei region of the Eastern Cape,
South Africa, and (ii) to relate the P sorption characteristics of the soils determined
from Langmuir adsorption equations with single point sorption test values and other soil
parameters.
2 Materials and Methods
2.1 Soil preparation
Surface soil samples (0-15 cm) were collected from cultivated farmers’ fields from four
districts (Elliotdale, Mthata, Lusikisiki and Mt. Fletcher) in Transkei, South Africa
(Table 1). The districts were selected to represent low (0-600 meters above sea level
(masl)), medium (700-1100 masl) and high (1500-3000 masl) altitudes. The soils were
air dried and ground to pass through a 2mm sieve.
2.2 Soil characterization
Soil pH was measured in water and 1.0 M KCl (soil: solution ratio of 1:2.5) using a pH
meter with a glass and reference calomel electrode (Model pH 330 SET-1, 82362) after
the soil suspensions were shaken for 30 minutes and left standing for 1 hour. Electrical
conductivity was measured in water (1:2.5 soil:water ratio) using a conductivity meter
(Model Cond.330i/SET 82362). Organic C and N were determined by dry combustion
140

Table 1: Selected chemical properties of soils used in the study.
Sampling Sites and Grid ReferencesNtlonyana Ncihane Qweqwe Qunu Chevy Chase Bethania Flagstaff
Properties 31°46’27”S 32°00’04”S 31°41’42”S 31°46’27”S 30°50’54”S 30°39’41”S ND ‡28°38’16”E 28°42’33”E 28°42’09”E 28°38’16”E 28°32’12”E 28°16’45”E
pH H2O 5.0 4.9 5.6 5.5 4.6 5.6 4.7
pH KCl 4.3 4.1 4.9 4.9 3.9 4.9 4.0
Total P(g kg−1)
0.18 0.18 0.21 0.14 0.17 0.18 0.42
Total N(g kg−1)
1.93 0.87 0.81 0.70 0.83 0.16 1.30
Organic C(g kg−1)
25.7 11.3 12.3 10.4 15.4 3.97 21.9
Bulk density(kg m−3)
1351 1449 1471 1492 1515 1698 1429
Exchang. acidity(cmol (+) kg−1)
0.93 0.83 0.07 0.10 1.27 0.10 1.73
CEC(cmol (+) kg−1)
16.5 11.3 15.8 7.4 6.3 4.6 16.2
% sand 21.1 39.0 53.2 40.6 74.7 54.7 21.8% silt 56.4 45.2 30.3 38.5 12.8 28.0 45.2% clay 22.5 15.8 16.5 20.9 12.5 17.3 33.0
Soil Form ∗ Klapmuts Cartref Glenrosa Westleigh Hutton Hutton Inanda
CorrespondingWRB Soil units†
Planosol Luvisol Cambisol Acrisol Ferralsol Ferralsol Ferralsol
∗ : South Africa Soil Classification Working Group (1991); † : World Reference Base (2006); ‡ : data notavailable.
using a LECO TRUSPEC C/N auto-analyzer (LECO Corporation, 2003). Total P
was estimated following wet digestion with H2O2/H2SO4 (Okalebo et al., 2002). Ex-
changeable Ca2+, Mg2+, K+, and Na+ were extracted with 1.0 M ammonium acetate
at pH 7 (Okalebo et al., 2002) and determined by atomic absorption spectrophotome-
ter. Exchangeable acidity (Al3+ + H+) was extracted with 1.0 M KCl and titrated
with 0.05 M NaOH (Okalebo et al., 2002). Cation exchange capacity was estimated
by the summation of exchangeable cations and exchangeable acidity.
Amorphous Fe and Al (Feox and Alox) were determined in 0.2 M acidified ammo-
nium oxalate adjusted to pH 3.0 with oxalic acid (Warren, 1994). Dithionite citrate
bicarbonate-extractable Fe and Al (FeCDB and AlCDB) were determined by the method
of Mehra and Jackson (1960) as cited by Agbenin (2003). Exchangeable Al and
Fe (AlKCl and FeKCl) were extracted with 1.0 M KCl as outlined by Okalebo et al.
(2002). The extracts were separated by centrifuging at 3000 rev min−1 for 10 min and
filtered with Whatman No.42 filter paper to get a clear solution. Al and Fe in all the
extracts were measured by atomic absorption spectrophotometer (table 2). All analy-
ses were done in triplicate. Particle size analysis was done by the pipette method as
described by Kettler et al. (2001).
141
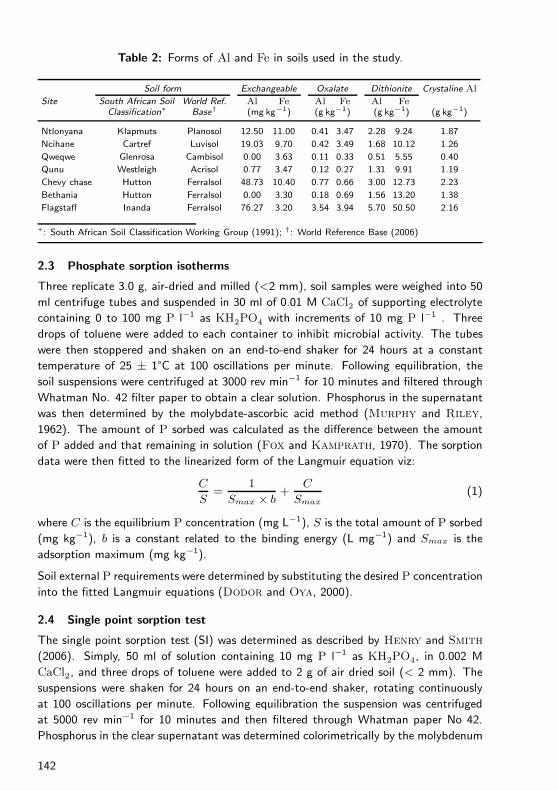
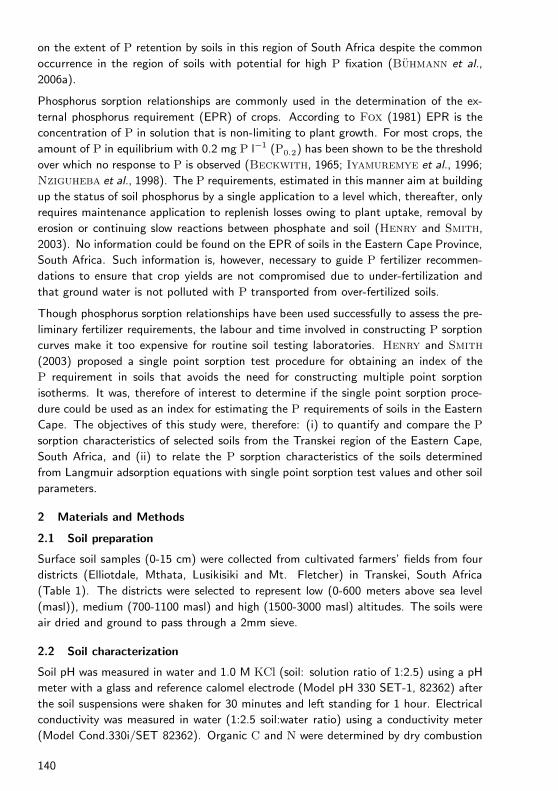
Table 2: Forms of Al and Fe in soils used in the study.
Soil form Exchangeable Oxalate Dithionite Crystaline Al
Site South African Soil World Ref. Al Fe Al Fe Al FeClassification∗ Base† (mg kg−1) (g kg−1) (g kg−1) (g kg−1)
Ntlonyana Klapmuts Planosol 12.50 11.00 0.41 3.47 2.28 9.24 1.87
Ncihane Cartref Luvisol 19.03 9.70 0.42 3.49 1.68 10.12 1.26
Qweqwe Glenrosa Cambisol 0.00 3.63 0.11 0.33 0.51 5.55 0.40
Qunu Westleigh Acrisol 0.77 3.47 0.12 0.27 1.31 9.91 1.19
Chevy chase Hutton Ferralsol 48.73 10.40 0.77 0.66 3.00 12.73 2.23
Bethania Hutton Ferralsol 0.00 3.30 0.18 0.69 1.56 13.20 1.38
Flagstaff Inanda Ferralsol 76.27 3.20 3.54 3.94 5.70 50.50 2.16
∗: South African Soil Classification Working Group (1991); †: World Reference Base (2006)
2.3 Phosphate sorption isotherms
Three replicate 3.0 g, air-dried and milled (<2 mm), soil samples were weighed into 50
ml centrifuge tubes and suspended in 30 ml of 0.01 M CaCl2 of supporting electrolyte
containing 0 to 100 mg P l−1 as KH2PO4 with increments of 10 mg P l−1 . Three
drops of toluene were added to each container to inhibit microbial activity. The tubes
were then stoppered and shaken on an end-to-end shaker for 24 hours at a constant
temperature of 25 ± 1°C at 100 oscillations per minute. Following equilibration, the
soil suspensions were centrifuged at 3000 rev min−1 for 10 minutes and filtered through
Whatman No. 42 filter paper to obtain a clear solution. Phosphorus in the supernatant
was then determined by the molybdate-ascorbic acid method (Murphy and Riley,
1962). The amount of P sorbed was calculated as the difference between the amount
of P added and that remaining in solution (Fox and Kamprath, 1970). The sorption
data were then fitted to the linearized form of the Langmuir equation viz:
C
S=
1
Smax × b+
C
Smax(1)
where C is the equilibrium P concentration (mg L−1), S is the total amount of P sorbed
(mg kg−1), b is a constant related to the binding energy (L mg−1) and Smax is the
adsorption maximum (mg kg−1).
Soil external P requirements were determined by substituting the desired P concentration
into the fitted Langmuir equations (Dodor and Oya, 2000).
2.4 Single point sorption test
The single point sorption test (SI) was determined as described by Henry and Smith
(2006). Simply, 50 ml of solution containing 10 mg P l−1 as KH2PO4, in 0.002 M
CaCl2, and three drops of toluene were added to 2 g of air dried soil (< 2 mm). The
suspensions were shaken for 24 hours on an end-to-end shaker, rotating continuously
at 100 oscillations per minute. Following equilibration the suspension was centrifuged
at 5000 rev min−1 for 10 minutes and then filtered through Whatman paper No 42.
Phosphorus in the clear supernatant was determined colorimetrically by the molybdenum
142

blue method (Murphy and Riley, 1962). The amount of P sorbed was calculated
as the difference between the amount of P added and that remaining in solution. The
single point sorption index was calculated as the amount of P sorbed expressed as a
percentage of the added P (Henry and Smith, 2003).
2.5 Statistical analysis
Relationships between P sorption parameters, and P sorbed at equilibrium with 0.2 mg
P L−1 (P0.2), with selected soil chemical properties were done with simple regression
and correlations and tested for significance at p = 0.05 using the GenStat statistical
software (Lawes Agricultural Trust, 2005). The contribution of soil properties
to sorption parameters were examined using the maximum r2 improvement stepwise
model-building procedure (SAS Institute Inc., 2001).
3 Results
3.1 Phosphate sorption
Sorption behavior was adequately described by the linearized Langmuir sorption equation
with coefficients of determination (r2) values > 0.95 observed for all the soils studied.
Sorption isotherms for the seven soils showed that the soils differed considerably in
sorption characteristics (Table 3). Sorption maxima ranged from 192.3 to 909.1 mg P
kg−1 and sorption affinity constant ranged from 0.051 to 0.786 l mg−1. The amount of
P required to maintain a soil solution concentration of 0.2 mg P l−1 (P0.2) ranged from
2 to 123 mg P kg−1 soil (Table 3) and as expected the trend was similar to that of the
sorption maxima. Values for the single point sorption test (SI) expressed in percentage
ranged from 9.5 to 86.5% (Table 3) and were highly and significantly correlated with
Smax (r = 0.92), sorption affinity constant (r = 0.812), and external P requirement (r=
0.93).
Table 3: Phosphate sorption parameters of the different soils used in the study.
Linearized Langmuir equationSoil form S = SmaxbC/(1 + bC)
South African World Ref.Site
Soil Classification∗ Base† Smax b R2 SI EPR (P0.2) EPR (P1.0)
Ntlonyana Klapmuts Planosol 526.3 0.247 0.978 49.4 25 104
Ncihane Cartref Luvisol 476.2 0.158 0.965 48.1 15 65
Qweqwe Glenrosa Cambisol 204.1 0.051 0.959 9.5 2 10
Qunu Westleigh Acrisol 192.3 0.122 0.985 25.5 5 21
Chevy Chase Hutton Ferralsol 555.6 0.269 0.974 79.2 28 118
Bethania Hutton Ferralsol 285.7 0.095 0.965 33.5 5 25
Flagstaff Inanda Ferralsol 909.1 0.786 0.983 86.5 123 400
S =Total sorbed P (mg kg−1), Smax = sorption maxima (mgP kg−1), b= sorption affinity constant
(L mg−1), C= equilibrium P concentration (mg L−1), SI =Single point sorption test (%), EPR =external
phosphate requirement (mg P kg−1)∗: South African Soil Classification Working Group (1991); †: World Reference Base (2006)
143

3.2 Relationship between phosphate sorption parameters with soil properties
The regression of P sorption maxima on selected individual soil properties showed that
AlCDB, FeCDB, AlKCl, pH, Alcrys and Fecrys explained 89%, 69.8%, 83.9%, 79.7%,
62.8%, and 40.5%, respectively of the variations in Smax (Table 4). Using the stepwise
multiple regression procedure (p = 0.05), a combination of organic carbon, AlKCl,
AlCDB and Alox explained 93.2% of the variation in Smax of which 87.8% of the variation
was explained by AlCDB alone. These results suggested that the different forms of Al
were primarily responsible for P sorption in the soils. The addition of soil organic carbon
to the AlCDB model only marginally increased the variation in Smax explained by the two
parameters to 91.1%. The functions best fitting the data were:
Smax = 85.87 + 150 AlCDB (R2 = 0.878)
Smax = 46.73 + 128 AlCDB + 78.73 C (R2 = 0.911)
where; Smax = Adsorption maximum, CDB = citrate dithionate bicarbonate,
C = organic carbon.
Table 4: Relationships of sorption maxima (Smax) with selected soil variables.
Variable (x) Functions best fitting data R2
pHwater (1 : 2.5) Y = 195560e−1210lx 0.797
AlKCl Y = −0.04x2 + 10.99x + 257.91 0.839
Alox Y = 117.75x2 + 627.34x + 164.93 0.855
Feox Y = 44.03x2–67.60x + 316.33 0.607
AlCDB Y = −23.04x2 + 310.05x–115.20 0.894
FeCDB Y = −0.26x2 + 28.96x + 107.95 0.698
Alcrys Y = 95.87e0.8836x 0.628
Fecrys Y = 275.13e0.025lx 0.405
Y = sorption maxima, KCl = potassium chloride, ox = ammonium oxalate, CDB = citratedithionate bicarbonate, crys = crystalline
3.3 Relationship between single point sorption tests (SI) with adsorptionmaxima (Smax) and external P requirement (EPR) P0.2
The single point sorption test (SI) values were closely related to the adsorption maxima
(Smax) and external P requirements (EPR) (Figure 1a and b) with R2 values > 0.90.
The functions best fitting the data were: Smax = 0.059 SI2 + 4.232 SI + 115.5 (R2 =
0.967) and EPR = 0.028 SI2 - 1.233 SI + 13.28 (R2 = 0.994).
144

Figure 1: Relationships between the single point sorption test (SI) and Langmuir ad-sorption maxima (Smax) (a), and the external P requirements (EPR) (b) forthe soils studied.
Smax= 0.059SI2 + 4.232SI + 115.5
R2��=��0.967
0
100
200
300
400
500
600
700
800
900
1000
0 20 40 60 80 100
S max(m
g��P��kg
�-1)
SI��(%)
(a)
0
20
40
60
80
100
120
140
0 20 40 60 80 100
EPR��(m
g��P��kg
�-1 )
SI��(%)
(b)
EPR = 0.028SI2 - 1.233SI + 13.28R2��=��0.994
4 Discussion
The soils varied widely in their extent of P sorption as reflected by the ranges in adsorp-
tion maxima (Smax) and sorption index (SI) (Table 3). Soils collected from Qweqwe,
Qunu, Ncihane and Bethania had low P sorption values and thus could be categorised
as low P sorbers whereas soils from Ntlonyana, Chevy Chase and Flagstaff are moderate
sorbers based on the scale of phosphate sorption of Juo and Fox (1977). Soils from
Chevy Chase, Bethania, and Flagstaff were all classified as Ferralsols but they differed
substantially in the extent to which they fixed phosphorus indicating that soils belong-
145

ing to the same form will not necessarily fix P to the same extent or have similar P
fertilizer requirements. Buhmann et al. (2006b) observed similar P sorption trends for
soils of the Lusikisiki area, Eastern Cape Province, South Africa and suggested that for
optimum P recommendations soil P fertilization assessments need to be made at field
scale level.
The observed differences in sorption parameters were largely explained by the variations
in the amounts of Al in the soils. However, as revealed by stepwise multiple regression
analysis most of the variation in Smax (87.8%) was explained by AlCDB alone with only a
marginal increase of 3.3% when soil organic C was included in the model. Our findings
are in agreement with those of Agbenin (2003); Henry and Smith (2002) and Duf-
fera and Robarge (1999) who also observed that AlCDB had greater influence on P
retention than other Al forms in the tropical soils they studied. The observed depen-
dence of P sorption on AlCDB suggested that citrate dithionite bicarbonate extractable
Al is the single most important soil parameter that could be used for indicating the
potential for soil P sorption in the area. The equation: Smax = 85.87 + 150 AlCDB
could therefore be used for estimating P sorption in the region after validation using
a wider range of soils. Organic C was not significantly correlated with any of the P
sorption parameters but together with AlCDB explained 91 % of the variations in Smax.
This suggested possible active participation of organic matter in governing P sorption in
the experimental soils, possibly through Al-organo complexes as suggested by Haynes
and Swift (1989).
The amounts of added P required to maintain a concentration of 0.2 mg P L−1 (P0.2)
in solution (EPR) were generally lower than ranges reported in other studies (Warren,
1994; Iyamuremye et al., 1996; Mehadi and Taylor, 1988; Dodor and Oya, 2000).
Duffera and Robarge (1999) for example reported values ranging from 50 to 201
mg P kg−1 for surface samples from non-cultivated and non-fertilized areas in Ethiopia.
Only Flagstaff soil with an EPR of 123 mg P kg−1 fell within this range while others
such as Qweqwe, Qunu and Bethania had very low EPR values indicating possible
early P saturation for these soils following repeated applications of P fertilizers. This
could lead to elevated P levels in the soil solution which in time could contribute to the
eutrophication of freshwater bodies. For purposes of water quality protection, the United
States Environmental Protection Agency (USEPA) has recommended a maximum level
of 1 mg P L−1 in surface runoff (US Environmental Protection Agency, 1986).
External P requirements (EPR) calculated based on this criterion for the different soils
ranged from 10 to 400 mg P kg−1 equivalent to 20 to 800 kg P ha−1 (Table 3). Given
the low usage of fertilizers in sub Saharan Africa estimated at 8 kg nutrients ha−1
(Morris et al., 2007), these results suggest that unless rates of fertilizer use increase
substantially, it will take some time before the application of fertilizer poses a significant
threat to water quality in the region. Therefore, in the short term emphasis should be
placed on ways of minimizing P fixation so as to increase P use efficiency, especially
for soils such as Flagstaff, Chevy Chase and Ntlonyana with relatively high P fixing
capacities.
146

The close association between SI with EPR (R2 = 0.994) suggested that the SI function
(EPR = 0.028SI2 - 1.233SI + 13.28) could be used to predict the external P requirement
(P0.2) for soils in the region most of which seem to have low to moderate P sorbing
capacities. Henry and Smith (2003) also found high coefficients of determination (R2
= 0.98) in the relationship between SI and P0.11 for low to moderate sorbing soils of
the tobacco growing areas of Kwa-Zulu Natal. They also concluded that SI can be
used advantageously as a time saving measure to obtain an index of the external P
requirement of soils instead of having to produce full P isotherms.
5 Conclusions
The seven soils studied varied widely in their capacities to sorb P with four of the soils
classified as low P fixing and the remaining three (43%) as moderate P fixers. The lat-
ter category may need management interventions to ensure that P availability to crops
is not compromised. The contrasting differences in the P fixing capacities of the soils
suggested that the use of blanket phosphate fertilizer recommendations may not be a
good strategy for the region as it may lead to under-application or over-application of P
in some areas with the attendant consequences of compromised crop yields or freshwater
quality. The differences in P sorption observed between the different soils were largely
explained by variations in their citrate dithionite bicarbonate-extractable aluminum con-
tents indicating that this parameter could be used for indicating the potential soil P
sorption in the area. The results further showed that the single point test function could
successfully be used to predict the external P requirements for the soils in the area
obviating the need to use multiple point sorption isotherms.
Acknowledgements
The authors are grateful to the University of Fort Hare and the National Research
Foundation (NRF) of South Africa for funding the study. We also acknowledge with
gratitude, The Director, Kenya Agricultural Research Institute (KARI) for granting study
leave to the first author. The views expressed in this paper are those of the authors and
do not in any way reflect the views of the NRF, the University of Fort Hare, or KARI.
References
Agbenin, J. O.; Extractable iron and aluminium effects on phosphate sorption in a
savanna Alfisol; Soil Science Society of America Journal ; 67:589–595; 2003.
van Averbeke, W., Mnkeni, P. N. S., Harris, P. J. C. and Mkile, Z.; Fertility
status of cropped soils in smallholder farming systems of the Transkei region, Eastern
Cape Province, South Africa; in: Proceedings of the 15th International Symposium
of the International Scientific Centre for Fertilizers, 27-30 September 2004, Pretoria,
South Africa: Fertilizer and Fertilization for Sustainability in Agriculture: The First
World meets the Third World- Challenges for the Future, edited by Haneklaus, S.,
Hera, C., Rietz, R.-M. and Schnug, E.; 513–526; International Scientific Centre
for Fertilizers (CIEC); 2008.
147

Bainbridge, S. H., Miles, N., Praan, R. and Johnston, M. A.; Phosphorus
sorption in Natal soils; South African Journal of Plant and Soil ; 12(2):59–64; 1995.
Beckwith, R. S.; Sorbed phosphates at standard supernatant concentration as an es-
timate of the phosphate needs of soils; Australian Journal of Experimental Agriculture
and Animal Husbandry ; 5:52–58; 1965.
Buhmann, C., Beukes, D. J. and Turner, D. P.; Acidity/Al in soils of Lusikisiki
area of the Eastern Cape Province; South African Journal of Plant and Soil ; 23:87–92;
2006a.
Buhmann, C., Beukes, D. J. and Turner, D. P.; Plant nutrient status of soils of
the Lusikisiki area, Eastern Cape Province; South African Journal of Plant and Soil ;
23:93–98; 2006b.
Dodor, D. E. and Oya, K.; Phosphate sorption characteristics of major soils in
Okinawa, Japan; Communications in Soil Science and Plant Analysis; 31:277–288;
2000.
Duffera, M. and Robarge, W. P.; Soil characteristics and management effects on
phosphorus sorption by highland plateau soils of Ethiopia; Soil Science Society of
America Journal ; 63:1455–1462; 1999.
Fox, R. L.; External phosphorus requirements of crops; in: Chemistry in the Soil
Environment. ASA Special Publication Number 40 ; 223–240; America Society of
Agronomy, Madison, Wisconsin; 1981.
Fox, R. L. and Kamprath, E. J.; Phosphate sorption isotherms for evaluating the
phosphate requirements of soils; Soil Science Society of America Proceedings; 34:902–
907; 1970.
Haynes, R. J. and Swift, R. S.; The effect of pH and drying on adsorption of
phosphate by aluminium-organic matter associations; Journal of Soil Science; 40:773–
781; 1989.
Henry, P. C. and Smith, M. F.; Phosphorus sorption study of selected South African
soils; South Africa Journal of Plant and Soil ; 19:61–69; 2002.
Henry, P. C. and Smith, M. F.; A single point sorption test for the routine determi-
nation of the phosphorus requirement of low to moderate P-fixing soils; South Africa
Journal of Plant and Soil ; 20:132–140; 2003.
Henry, P. C. and Smith, M. F.; Two-step approach to determine some useful phos-
phorus characteristics of South African soils: A review of work done at the ARC-
Institute for Soil, Climate and water; South Africa Journal of Plant and Soil ; 23:64–
72; 2006.
Iyamuremye, F., Dick, R. P. and Baham, J.; Organic amendments and phosphorus
dynamics: I. Phosphorus chemistry and sorption; Soil Sci.; 161(7):426–435; 1996.
Juo, A. R. S. and Fox, R. L.; Phosphate sorption characteristics of some bench-mark
soils of West Africa; Journal of Soil Science; 124:370–376; 1977.
Kettler, T. A., Doran, J. W. and Gilbert, T. L.; Simplified method for soil
particle-size determination to accompany soil quality analyses; Soil Science Society
of America Journal ; 65:849–852; 2001.
Lawes Agricultural Trust; GenStat, Release 4.24DE; Reference Manual ; Rotham-
sted Experimental Station; Harpenden, Herts, UK; 2005.
148

LECO Corporation; TRUSPEC C/N Determinator. Instruction Manual ; LECO Cor-
poration, 3000 Lakeview Avenue. St Joseph, MI49085, USA; 2003.
Mehadi, A. A. and Taylor, R. W.; Phosphate adsorption by two highly weathered
soils; Soil Science Society of America Journal ; 52:627–632; 1988.
Mehra, O. P. and Jackson, M. L.; Iron oxide removal from soils and clays by a
dithionate-citrate system buffered with sodium bicarbonate; Clays and Clay Minerals;
7:317–327; 1960.
Morris, M., Kelly, V. A., Kopicki, R. J. and Byerlee, D.; Fertilizer use in
African agriculture: lessons learned and good practice guidelines; The World Bank,
Washington, DC; 2007.
Murphy, J. and Riley, J. P.; A modified single solution method for the determination
of phosphate in natural waters; Analytica Chemica Acta; 27:31–36; 1962.
Nziguheba, G., Palm, C. A., Buresh, R. J. and Smithson, P. A.; Soil phosphorus
fractions and adsorption as affected by organic and inorganic sources; Plant and Soil ;
198:159–168; 1998.
Okalebo, J. R., Gathua, K. W. and Woomer, P. L.; Laboratory Methods of Soil
and Plant Analysis: A Working Manual ; TSBF-KARI, Nairobi, Kenya; 2002.
SAS Institute Inc.; SAS/STAT user’s guide, release 8.2 edition; SAS Institute Inc.,
Cary, NC; 2001.
US Environmental Protection Agency; Environmental indicators of water qual-
ity in the United States. EPA 841-R-96-002 ; US Environmental Protection Agency
(USEPA), Office of Water (4503F), Washington, DC; 1986.
Warren, G. P.; Influence of soil properties on the response to phosphorus in some
tropical soils: I. Initial response to fertilizer; European Journal of Soil Science; 45:337–
344; 1994.
149

150