phononic and magnetic excitations in the quasi-one-dimensional heisenberg antiferromagnet kcuf3
TRANSCRIPT

Phononic and magnetic excitations in the quasi-one-dimensional Heisenbergantiferromagnet KCuF3V. Gnezdilov, J. Deisenhofer, P. Lemmens, D. Wulferding, O. Afanasiev, P. Ghigna, A. Loidl, and A. Yeremenko Citation: Low Temperature Physics 38, 419 (2012); doi: 10.1063/1.4709772 View online: http://dx.doi.org/10.1063/1.4709772 View Table of Contents: http://scitation.aip.org/content/aip/journal/ltp/38/5?ver=pdfcov Published by the AIP Publishing Articles you may be interested in Magnetic interactions in a quasi-one-dimensional antiferromagnet Cu(H2O)2(en)SO4 J. Appl. Phys. 115, 17B305 (2014); 10.1063/1.4865323 Magnetism of A 2 Cu 2 Mo 3 O 12 ( A = Rb or Cs): Model compounds of a one-dimensional spin- 1 ∕ 2 Heisenbergsystem with ferromagnetic first-nearest-neighbor and antiferromagnetic second-nearest-neighbor interactions J. Appl. Phys. 97, 10B303 (2005); 10.1063/1.1851675 Light scattering on phonons in quasi-one-dimensional antiferromagnet CsFeCl 3 2 H 2 O induced by magneticordering Low Temp. Phys. 28, 516 (2002); 10.1063/1.1496660 Magnetization measurement on the S=1 quasi-one-dimensional Heisenberg antiferromagnet Ni(C 5 H 14 N 2 ) 2 N 3(PF 6 ) J. Appl. Phys. 89, 7338 (2001); 10.1063/1.1361264 NiCl 2 H 2 O : A quasi-one-dimensional Heisenberg antiferromagnet J. Appl. Phys. 87, 6052 (2000); 10.1063/1.372609
This article is copyrighted as indicated in the article. Reuse of AIP content is subject to the terms at: http://scitation.aip.org/termsconditions. Downloaded to IP: 202.28.191.34
On: Sun, 21 Dec 2014 23:36:37

Phononic and magnetic excitations in the quasi-one-dimensional Heisenbergantiferromagnet KCuF3
V. Gnezdilova)
B. Verkin Institute for Low Temperature Physics and Engineering of the National Academy of Sciences ofUkraine, 47 Lenin Ave., Kharkov 61103, Ukraine and Institute for Condensed Matter Physics, BraunschweigUniversity of Technology, D-38106 Braunschweig, Germany
J. Deisenhofer
Experimental Physics V, Center for Electronic Correlations and Magnetism, University of Augsburg, D-86135Augsburg, Germany
P. Lemmens and D. Wulferding
Institute for Condensed Matter Physics, Braunschweig University of Technology, D-38106 Braunschweig,Germany
O. Afanasiev
B. Verkin Institute for Low Temperature Physics and Engineering of the National Academy of Sciencesof Ukraine, 47 Lenin Ave., Kharkov 61103, Ukraine
P. Ghigna and A. Loidl
Dipartimento di Chimica Fisica, Universita di Pavia, 1-27100 Pavia, Italy
A. Yeremenko
B. Verkin Institute for Low Temperature Physics and Engineering of the National Academy of Sciencesof Ukraine, 47 Lenin Ave., Kharkov 61103, Ukraine(Submitted December 15, 2011)
Fiz. Nizk. Temp. 38, 538–548 (May 2012)
The Raman-active phonons and magnetic excitations in the orbitally ordered, quasi one-dimensional
Heisenberg antiferromagnet KCuF3 are studied as a function of temperature in the range between 3
and 290 K in different scattering configurations. The low-energy Eg and B1g phonon modes show
an anomalous softening (�25% and �13%, respectively) between room temperature and the
characteristic temperature TS¼ 50 K. In this temperature range, a freezing-in of F� ion dynamic
displacements is proposed to occur. In addition, the Eg mode at about 260 cm�1 clearly splits below
TS. The width of the phonon lines above TS follows an activated behavior with an activation energy
of about 50 K. Our observations clearly evidence reduction of the lattice symmetry below TS and
indicate strong coupling of lattice, spin, and orbital fluctuations for T > TS. A strongly polarization
dependent quasielastic scattering is observed at temperatures above TN¼ 39 K due to magnetic-
energy fluctuations. For temperatures below TN a rich spectrum of additional modes is observed,
with different lineshape, polarization and temperature dependence. We attribute them to longitudinal
and transverse magnetic modes as well as to a continuum of magnetic excitations. VC 2012 AmericanInstitute of Physics. [http://dx.doi.org/10.1063/1.4709772]
1. Introduction
KCuF3 has long been known as a paradigm for an orbi-
tally ordered system where cooperative Jahn–Teller (JT)
distortion is strongly competing with the electronic degrees
of freedom as the driving force behind the orbital order.1–4
Recently, realistic band structure calculations highlighted
KCuF3 as a benchmark system for modeling structural relax-
ation effects due to electronic correlations5,6 and for reveal-
ing the effect of electronic superexchange on the orbital
ordering (OO).7 The compound seems to be orbitally ordered
throughout its solid phase, but shows long-range A-type anti-
ferromagnetic (AFM) ordering only below TN¼ 39 K. In lit-
erature, an orbital ordering temperature of about 800 K is
often evoked in this system, but astonishingly, experimental
evidence for a transition at this temperature seems to be
evasive. Earlier it was reported that between 670 and 720 K
an irreversible transition takes place.8 The paramagnetic
(PM) susceptibility is described by a Bonner–Fisher law with
an exchange constant J¼ 190 K (Ref. 1) indicating that this
compound is a good realization of a one-dimensional (1D)
spin chain in the PM regime. Inelastic neutron scattering
(NS) studies reveal a spinon-excitation continuum, a clearly
1D quantum phenomenon existing also below the Neel tem-
perature.9,10 From a structural point of view, the relatively
high tetragonal symmetry (D184h � I4=mcm) (Refs. 11–16)
makes KCuF3 one of the simplest systems to study. There
exists a second structural polytype (D54h) with a different
arrangement of F distortions within the c plane.14 This phase
1063-777X/2012/38(5)/9/$32.00 VC 2012 American Institute of Physics419
LOW TEMPERATURE PHYSICS VOLUME 38, NUMBER 5 MAY 2012
This article is copyrighted as indicated in the article. Reuse of AIP content is subject to the terms at: http://scitation.aip.org/termsconditions. Downloaded to IP: 202.28.191.34
On: Sun, 21 Dec 2014 23:36:37

that may exist up to a few % in every sample has different
physical properties regarding magnetic anisotropies and
ordering temperature (TN¼ 22 K). Nevertheless, the estab-
lished symmetry assignment of the D184h phase has been
questioned by the X-ray diffraction investigation17 which
suggests an existence of orthorhombic distortions in KCuF3
at room temperature with D42 symmetry. A low-temperature
Raman scattering (RS) study18 reveals a difference of spectra
measured in xz and yz polarization as well as anomalously
broad linewidths of the stretching modes, which are inter-
preted as evidence of symmetry lower than D184h also below
the Neel temperature. Although the orthorhombic distortions
are involved in explaining the electron spin resonance (ESR)
properties of KCuF3,19 discrepancies remain in the analysis
of recent NQR,20 AFM resonance,21 and further experimen-
tal and theoretical findings.22,23 Besides, in x-ray resonant
scattering experiments on KCuF3 (Refs. 24 and 25) indica-
tions for a coupling of lattice and magnetic degrees of free-
dom are found. Only recently, the ESR properties for T > TN
could be successfully explained within the tetragonal sym-
metry by assuming a dynamical Dzyaloshinsky–Moriya
(DM) interaction related to strong oscillations of the bridg-
ing F� ions perpendicular to the crystallographic c axis.26 It
is argued that these dynamic distortions freeze in at a tem-
perature TS¼ 50 K, leading to an effectively lower symmetry
and the occurrence of exciton–magnon sidebands in optical
absorption experiments.27
Here, we report on a detailed study of:
(i) the temperature dependence of the Raman-active
phonons in a KCuF3 single crystal tracking the symmetry
reduction during the anticipated freezing of the dynamic dis-
tortion at TS¼ 50 K and the Neel ordering at TN¼ 39 K;
(ii) a complete data set of the magnetic excitations in
this compound collected for the first time using Raman
scattering.
We find large softening of the lowest lying Eg mode and
the B1g mode by 25% and 13% between room temperature
and TS, respectively. The linewidth and the integrated inten-
sity of these modes also exhibit anomalies at TS and TN.
Moreover, the Eg mode at about 260 cm�1 clearly splits
below TS evidencing the existence of an antiferrodistortive
lattice instability in KCuF3 which leads to a symmetry
reduction at TS¼ 50 K prior to magnetic ordering.
At low temperatures (below TN), magnetic excitations
characteristic of 3D and 1D magnetic correlations are
observed simultaneously in our Raman experiment. The
energy ranges of these phases are separated by another
region where the crossover from 1D to 3D behavior occurs.
2. Experimental details
The single crystal was oriented by Laue diffraction, cut
along the (110) pseudocubic plane and mechanically pol-
ished to optical quality. Details on crystal growth are
described in Ref. 25. The sample has previously been inves-
tigated by ESR and optical spectroscopy.26,27 The Raman
spectra were obtained with two different experimental setups
and in two geometries of experiment: (i) a DILOR XY triple
spectrometer with a liquid nitrogen cooled CCD detector
(quasi-backscattering geometry) and (ii) a U1000 high-
resolution double spectrometer with RCA 31034 A photo-
multiplier (right-angle scattering geometry). The 647 nm
Ar/Kr ion (5 mW output power), the 532.1 nm solid-state
(5 mW output power), and the 632.8 nm He–Ne (25 mW
output power) lasers were used for excitation in these two
setups. Temperature dependencies were obtained in optical
gas-flow cryostats and a closed-cycle cryostat by varying
temperature from 3 K to room temperature.
3. Experimental results and discussion
3.1. Raman phonons
The polarized phonon Raman spectra of single crystal-
line KCuF3 were obtained in yy, zz, xy, xz, and yz scattering
configurations. The number of lines and the selection rules
are fully consistent with the theoretically expected Raman-
active normal modes18 of KCuF3 with tetragonal D184h,
CRam ¼ A1gðyy; zzÞ þ B1gðyyÞ þ 2B2gðxyÞ þ 3Egðxz; yzÞ:(1)
The three lines observed in Raman spectra at 290 K in both
the xz and yz spectra correspond to the three Eg modes. The
line observed with different intensities in yy and zz spectra is
identified as the A1g mode. The intense line observed only in
yy spectrum can be assigned to the B1g mode. Finally, the
two lines in xy spectra are the two B2g modes. At room tem-
perature all lines have a Lorentzian lineshape. The observed
spectra and the mode assignments are in agreement with the
previously reported data at 10 K.18 A direct comparison of
our data at 4 K and 290 K with Ref. 18 and theoretical esti-
mates28 is presented in Table I. In general, there is a good
agreement between the corresponding values except for the
B2g(l) mode with a frequency of 240.4 cm�1 observed in our
experiments in contrast to a somewhat higher frequency of
265.8 cm�1 reported in Ref. 18. The second discrepancy is
that the lines assigned to the Eg(l,2) and B1g are almost two
times broader in the low-temperature Raman spectra of Ref.
18. We can relate these discrepancies to different quality of
the studied samples.
In the following we will focus on the temperature de-
pendence of the phonon modes in KCuF3 and mostly Eg(1),
Eg(2) and B1g. In Figs. 1–3 we show the temperature depend-
ent parameters (frequency, linewidth, and integrated inten-
sity, respectively) for the five phonon modes. The phonon
TABLE I. Frequencies and linewidths of the observed Raman modes in
cm�1 in KCuF3 at 4 and 290 K compared to the experimental values
reported in Ref. 18 at 10 K and calculations from Ref. 28.
Frequency, cm�1 Linewidth, cm�1
Mode 290 K 4 K
10 K
(Ref. 18)
Calculated
(Ref. 28) 290 K 4 K
10 K
(Ref. 18)
A1g 367.3 373.5 374.8 398 23.1 4.9 9.2
B1g 81.6 70.9 72.8 100 7.1 0.9 1.6
B2g(1) 240.4 245.2 265.8 259 30.8 8.7 7.0
B2g(2) 554.8 561.3 563.0 586 22.6 9.1 9.1
Eg(1) 63.0 47.4 53.2 50 5.8 0.7 3.0
Eg(2) 262.9 260.8 261.6 136 7.5 1.7 3.0
Eg(3) 132.3 129.3 131.2 268 7.5 1.6 1.6
420 Low Temp. Phys. 38 (5), May 2012 Gnezdilov et al.
This article is copyrighted as indicated in the article. Reuse of AIP content is subject to the terms at: http://scitation.aip.org/termsconditions. Downloaded to IP: 202.28.191.34
On: Sun, 21 Dec 2014 23:36:37
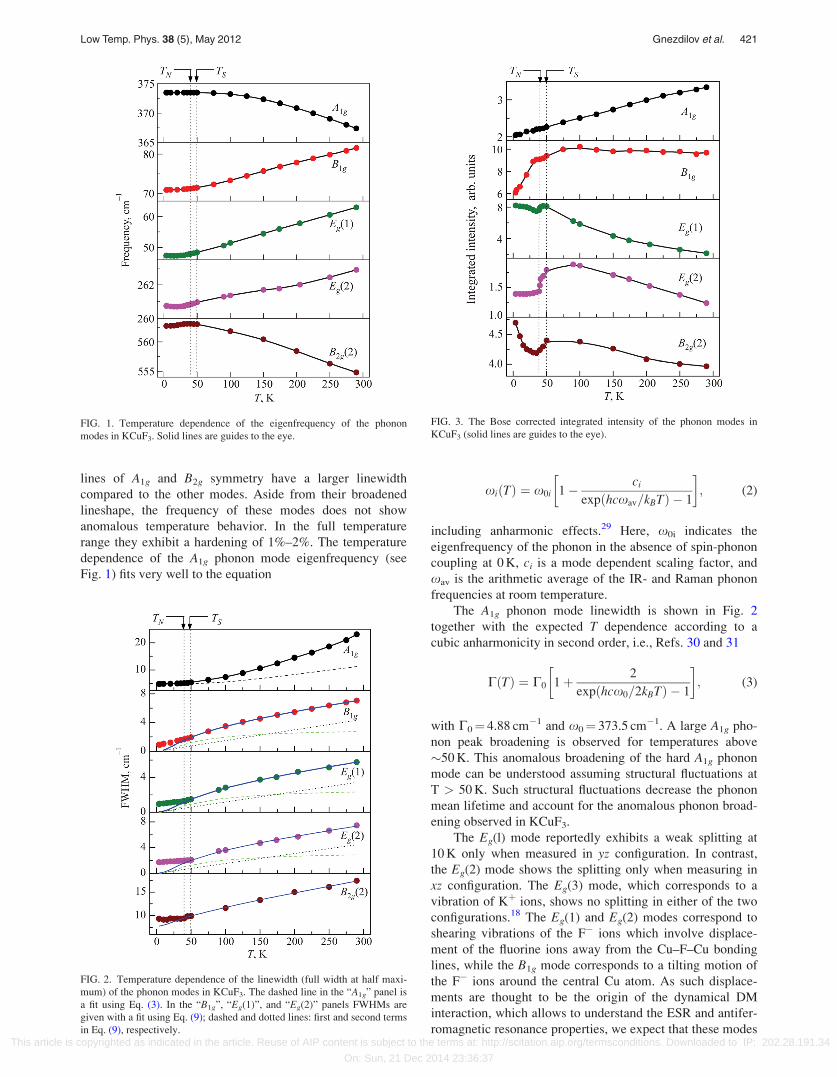
lines of A1g and B2g symmetry have a larger linewidth
compared to the other modes. Aside from their broadened
lineshape, the frequency of these modes does not show
anomalous temperature behavior. In the full temperature
range they exhibit a hardening of 1%–2%. The temperature
dependence of the A1g phonon mode eigenfrequency (see
Fig. 1) fits very well to the equation
xiðTÞ ¼ x0i 1� ci
expðhcxav=kBTÞ � 1
� �; (2)
including anharmonic effects.29 Here, x0i indicates the
eigenfrequency of the phonon in the absence of spin-phonon
coupling at 0 K, ci is a mode dependent scaling factor, and
xav is the arithmetic average of the IR- and Raman phonon
frequencies at room temperature.
The A1g phonon mode linewidth is shown in Fig. 2
together with the expected T dependence according to a
cubic anharmonicity in second order, i.e., Refs. 30 and 31
CðTÞ ¼ C0 1þ 2
expðhcx0=2kBTÞ � 1
� �; (3)
with C0¼ 4.88 cm�1 and x0¼ 373.5 cm�1. A large A1g pho-
non peak broadening is observed for temperatures above
�50 K. This anomalous broadening of the hard A1g phonon
mode can be understood assuming structural fluctuations at
T > 50 K. Such structural fluctuations decrease the phonon
mean lifetime and account for the anomalous phonon broad-
ening observed in KCuF3.
The Eg(l) mode reportedly exhibits a weak splitting at
10 K only when measured in yz configuration. In contrast,
the Eg(2) mode shows the splitting only when measuring in
xz configuration. The Eg(3) mode, which corresponds to a
vibration of Kþ ions, shows no splitting in either of the two
configurations.18 The Eg(1) and Eg(2) modes correspond to
shearing vibrations of the F� ions which involve displace-
ment of the fluorine ions away from the Cu–F–Cu bonding
lines, while the B1g mode corresponds to a tilting motion of
the F� ions around the central Cu atom. As such displace-
ments are thought to be the origin of the dynamical DM
interaction, which allows to understand the ESR and antifer-
romagnetic resonance properties, we expect that these modes
FIG. 1. Temperature dependence of the eigenfrequency of the phonon
modes in KCuF3. Solid lines are guides to the eye.
FIG. 2. Temperature dependence of the linewidth (full width at half maxi-
mum) of the phonon modes in KCuF3. The dashed line in the “A1g” panel is
a fit using Eq. (3). In the “B1g”, “Eg(1)”, and “Eg(2)” panels FWHMs are
given with a fit using Eq. (9); dashed and dotted lines: first and second terms
in Eq. (9), respectively.
FIG. 3. The Bose corrected integrated intensity of the phonon modes in
KCuF3 (solid lines are guides to the eye).
Low Temp. Phys. 38 (5), May 2012 Gnezdilov et al. 421
This article is copyrighted as indicated in the article. Reuse of AIP content is subject to the terms at: http://scitation.aip.org/termsconditions. Downloaded to IP: 202.28.191.34
On: Sun, 21 Dec 2014 23:36:37

are strongly related to the proposed freezing of the dynamic
fluorine displacements below TS¼ 50 K.26,27
Indeed, when looking at the Raman data of the Eg(1) and
Eg(2) vibrational modes in yz configuration shown in Fig. 4,
an anomalous softening of both modes is observed for T
> 50 K. While the frequency shift of the Eg(2) is only about
2 cm�1, the low-energy Eg(1) mode exhibits a frequency shift
of about 16 cm�1. This corresponds to softening of 1 and
25% with respect to the room temperature eigenfrequency.
To discuss the origin of the observed effect, we first
assume that this mode softening is the precursor of a struc-
tural phase transition32 with a x2Eg/ ðT � TcÞ soft mode
behavior, where Tc is the phase transition temperature.
Indeed the frequency data for the Eg(1) mode in KCuF3 can
be fitted excellently for T > 50 K using
x2Eg¼ aT þ x2
0; (4)
with a¼ 8.93 cm�2/K and x0¼ 45.53 cm�1. Extrapolating
x2Egð1Þ to zero one can obtain a virtual transition temperature
Tv¼�334 K. Although the negative sign indicates that the
occurrence of the structural phase transition is highly
unlikely, the energy scale of this virtual transition tempera-
ture is close to the orbital-ordering transition temperature
Too� 350 K calculated by assuming a purely electronic
superexchange mechanism.7
Similar to the Eg(l) mode, both Eg(2) and B1g modes ex-
hibit softening at T > 50 K (see Figs. 1 and 4) with
a¼ 3.99 cm�2/K and Tv¼�16858 K for the Eg(2) and
a¼ 6.43 cm�2/K and Tv¼�743 K for the B1g mode. While
for the B1g mode with softening of about 13% relative to
room temperature the virtual transition temperature is still
reasonable, the value for the Eg(2) mode appears not to be
physically meaningful due to the moderate softening of only
1%–2%. Note that in other fluorides with rutile structure like
MnF2, NiF2, and FeF2 the virtual transition temperatures of
�1240 K, �1700 K, and �1780 K have been derived from
the softening of Raman modes, respectively.33–35
In magnetic materials, the frequency change of a phonon
i with temperature can be written as36–40
DxiðTÞ ¼ ðDxiÞlatt þ ðDxiÞren þ ðDxiÞs�ph þ ðDxiÞanh: (5)
The first term, ðDxiÞlatt, is the contribution to the phonon fre-
quency due to the lattice expansion/contraction. For a nearly
cubic lattice it can be roughly estimated by the Gruneisen
law,
Dxi
xi
� �latt
¼ �ci
DV
V
� �; (6)
where ci is the Gruneisen parameter for the phonon mode i.Equation (6) is applicable for cubic crystals or isotropically
expanded/contracted lattices. The second term, ðDxiÞren,
accounts for the effects of renormalization of the electronic
states in the phonon i that may occur near the spin ordering
temperature. The third term, ðDxiÞs�ph, is the spin-phonon
contribution, caused by the modulation of the exchange inte-
gral by lattice vibrations. Finally, the last term ðDxiÞanh is
the intrinsic anharmonic contribution, i.e., the anharmonic
frequency shift at constant volume.
To analyze the origin of the observed phonon modes
behavior in KCuF3 at temperatures above 50 K, we first con-
sider the lattice contribution ðDxiÞlatt. The lattice parameters
in KCuF3 show a smooth thermal contraction below Too (c/adecreases not more than 0.1% between TN and room temper-
ature8) without anomalies at TN. Phonons are expected (with
regard to ðDxiÞlatt) to shift to higher frequencies with
decreasing temperature, as the spring constants of all vibra-
tions tighten at low temperatures. Besides, KCuF3 is an
insulator at all temperatures of our experiment. Therefore,
the carrier-induced vibrational softening (with regard to
ðDxiÞren) is not a suitable model for this system.
The spin influence on the lattice dynamics has been
studied by several authors. In particular, considering a near-
est neighbor Heisenberg spin system, Baltensberger and Hel-
man related the frequency shift of a given phonon mode to
the magnetic energy of the system36–40
Dxs�ph � khsi � sji; (7)
where k is the spin-phonon coupling constant and hsi � sj irepresents the spin-spin correlation function. In the paramag-
netic state the coupling parameter k can be determined if the
frequency shift of the phonon mode Dx and the spin-spin
correlation function hsi � sj i are known. The latter quantity
can be directly derived from the measured susceptibility
data:
hsi � sjiv ¼kBTvðTÞNAg2l2
B
� sðsþ 1Þ3
: (8)
Assuming that the spin-phonon coupling shows up in the
temperature dependence of the phonon frequencies of
KCuF3 in the paramagnetic state, we have estimated k for
the Eg(l), Eg(2), and B1g modes using our Raman and mag-
netic susceptibility (not shown here) data. The spin-spin cor-
relation function of KCuF3 shows a similar temperature
evolution as the Eg(l), Eg(2), and B1g mode frequencies:
hsi � sj i decreases upon lowering the temperature from 290 to
50 K. Yet, the estimated spin-phonon coupling constants
must be very large (k� 100, 13, 75 cm�1 for the Eg(l), Eg(2),
and B1g modes, respectively) to explain the observed fre-
quency shift with ðDxiÞs�ph term alone. However, for cor-
rectly describing the observed frequency shift in KCuF3 it is
necessary to take into account the sum of different terms in
Eq. (7), namely, due to AFM and FM exchanges in theFIG. 4. Temperature dependence of the Eg(l) and Eg(2) modes obtained in
yz scattering geometry.
422 Low Temp. Phys. 38 (5), May 2012 Gnezdilov et al.
This article is copyrighted as indicated in the article. Reuse of AIP content is subject to the terms at: http://scitation.aip.org/termsconditions. Downloaded to IP: 202.28.191.34
On: Sun, 21 Dec 2014 23:36:37

magnetic structure. The sign of the frequency shift depends
on whether the Cu–F bond vibrations are influenced by AFM
or FM exchange.
Lattice instabilities in our Raman experiments strongly
manifest themselves in anomalous phonon linewidths behav-
ior with temperature (see Fig. 2). Above 50 K the linewidth
data for Eg(l), Eg(2), and B1g modes can be described by
CtotðTÞ ¼ CanhðTÞ þ CrðTÞ ¼ AT þ B exp � Ur
kBT
� �; (9)
where Uanh is the contribution arising from anharmonic pho-
non interactions in crystalline solids, with zone center modes
decaying into pairs of phonons with equal but opposite wave
vectors. Ur is the contribution to the total linewidth arising
from the dynamic deviation of the F� ions away from the
Cu–Cu bonding lines, Ur is a potential barrier, and A and Bare constants. The data can be described very well over the
temperature range 290–50 K by Eq. (9) yielding an energy
Ur¼ 56 (Eg(l)), 49 (Eg(2)), and 47 (B1g) K remarkably close
to the temperature TS¼ 50 K where the dynamic displace-
ments are proposed to become static.27 Below TS¼ 50 K the
width of the phonon lines decreases nearly linearly with
temperature.
The lattice fluctuations, associated with the dynamic dis-
placement of the apical fluorine ions away from the c axis
manifest themselves in an anomalously large thermal dis-
placements parameter12 and the occurrence of a dynamical
DM interaction.26 As a prerequisite for the latter, the charac-
teristic time of the dynamic distortions must be large com-
pared to the time scale of the exchange interaction and the
amplitude of these distortions must be high.26
In Ref. 41 an essential role of the orbital degree of free-
dom in governing the dynamical coupling between the spin
and lattice degrees of freedom in KCuF3 was established.
We recall here that a giant softening of the breathing mode
in the FMI phase of lightly doped LaMnO3 was interpreted
earlier in terms of the presence of fluctuating orbitals as well
as strong orbital-lattice coupling.42 In this mechanism, the
frequency shift of a phonon mode relies on whether the re-
spective ion displacements involve an orbital-ordering pat-
tern. Displacement of apical ions in a perovskite structure
usually means a tilt of a CuF6 octahedron as a whole.43 In-
plane fluctuations of F� ions influence the spin-spin correla-
tions due to strong spin-lattice coupling mediated through
the orbitals. It is known that FM spin ordering causes a soft-
ening of the lattice, while AFM causes a hardening.41,44 Tak-
ing into account both AFM and FM fluctuating in-plane
spin-spin correlations in KCuF3 over a wide temperature
range above TN, it is possible that the development of the
FM correlations with decreasing temperature leads to the
observed phonon modes softening.
In the KCuF3 scenario, the dynamical displacement of
the fluorine ions freezes with decreasing temperature and
becomes static at TS¼ 50 K.26,27 Below 50 K we observe a
deviation from this softening behavior and the frequency
levels off in the magnetically ordered state.
The Bose corrected integrated intensities of the phonon
modes in KCuF3 are shown in Fig. 3. The intensities of the
Eg(l), Eg(2), B1g, and B2g modes show anomalies at TS and
TN, reflecting distinct changes of the modes polarizability at
these temperatures.
To get more information about coupling between the lat-
tice and the orbit degrees of freedom, we measured Raman
spectra in the high-frequency region, expecting to observe
some features coupled to orbital dynamics. Unlike doped
manganites with highly complicated high-order excitation
spectra, only one broad peak was observed in KCuF3 in zzscattering geometry at energies above the first-order phonons
(see Fig. 5). We can tentatively assign this peak at
�1100 cm�1 to two-phonon scattering of the 555 cm�1
B2g(2) mode, taking into account the multiplication rules of
the irreducible representations and the fact that similar
changes in frequencies over temperature are observed. The
ratio of the second to first order I(2)/I(1) is constant within the
measured temperature interval. This fact evidences that the
second order phonon in KCuF3 couples in some degree to
the orbital order and the Franck–Condon mechanism is
expected to be active.
Although clear anomalies of phonon modes associated
with TS and TN have been observed, we could not observe
the splitting of the Eg(l) mode in yz configuration reported in
Ref. 18 at 10 K. (Only the asymmetry of the Eg(l) phonon
line develops with the temperature lowering from TS to TN.)
Hence, we tried to reproduce the reported splitting of the
Eg(2) mode in xz configuration and trace its temperature de-
pendence. A weak additional mode at the high-frequency
side of the Eg(2) appears at T < 50 K. As shown in Fig. 6,
the appearance of this additional mode coincides with TS
suggesting a splitting of the Eg(2) mode in agreement with
the scenario of a symmetry reduction at TS, as was suggested
previously.27 Nevertheless, we have to point out that this
splitting of about 6 cm�1 is larger than the reported one of
about 1 cm�1 and appears on the high-energy flank in con-
trast to the one reported by Ueda and coworkers,18 which
appears on the low-energy side of the original Eg(2) mode.
These discrepancies cannot be easily explained and may be
due to the different samples used in our work. We would
FIG. 5. Second-order Raman spectra of KCuF3. The inset shows the ratio of
second- to first-order scattering at 555 cm�1 as a function of temperature.
Low Temp. Phys. 38 (5), May 2012 Gnezdilov et al. 423
This article is copyrighted as indicated in the article. Reuse of AIP content is subject to the terms at: http://scitation.aip.org/termsconditions. Downloaded to IP: 202.28.191.34
On: Sun, 21 Dec 2014 23:36:37

like to point out that in a recent Raman study a splitting of
the Eg(2) similar to our data has been reported.41
A static displacement of fluorine ions away from the caxis at temperatures T < TS assumes the lowering of the
KCuF3 crystal symmetry. If the symmetry is lower than D184h,
a removal of the Eg modes degeneracy and the appearance of
extra lines in the Raman spectra is expected. The observed
splitting of the Eg(2) mode in xz configuration confirms this
scenario, although this information alone is not sufficient to
determine the low-temperature symmetry. Additional evi-
dence has been obtained by X-ray scattering where a split-
ting of the Bragg reflection associated with GdFeO3 type
distortions has been found below 50 K.41
To summarize, we believe that the softening of certain
phonon modes in KCuF3 is connected with the simultaneous
and coupled change in magnetic-structural-orbital sectors
upon cooling. In this respect, it is worth highlighting that in
KCuF3 the spin-spin relaxation time measured by the ESR
linewidth can only be explained by assuming dynamic lattice
distortion of the type associated with the anomalous Raman
modes.26
3.2. Magnetic excitations
To date, very comprehensive neutron scattering experi-
mental and theoretical work has been directed toward the
spin dynamics in KCuF3. The dynamical response for all
energy, wave vector, and temperature scales has been
sampled and the magnetic crossover diagram (see Fig. 4 in
Ref. 9), which shows that the system clearly has aspects of
both 1D and 3D spin-1/2 magnetism, has been constructed.
It is therefore striking that corresponding investigations
using light scattering are still incomplete despite the rich in-
formation that light scattering can give.45 We will omit from
our discussion quasielastic scattering due to fluctuations of
the spin energy density. This effect has been described previ-
ously in KCuF3 by Yamada and Onda.46 It is a very general
feature of low-dimensional spin systems45 and it was
observed for intrachain polarization corresponding to zz con-
figuration. Below we report a complete data set of the mag-
netic excitations in KCuF3 collected for the first time via
Raman scattering.
Upon cooling, a broad quasielastic background of scat-
tering is replaced by a more structured spectrum in a wide
energy region. At temperatures close and below the 3D
ordering temperature the phonon lines in xx, yy, and zzRaman spectra of KCuF3 are superimposed by a wider,
structured background (Fig. 7). The large width of the
observed signal distinguishes it from the sharp phonon lines.
Referring to the results of numerous neutron scattering
investigations,47–49 we assume magnetic excitations and the
corresponding multi-spinon Raman-scattering processes as
the origin of the observed background. The magnetic back-
ground scattering in RS is bounded by the upper and lower
boundaries consistent with the boundaries of the multi-
spinon continuum (26 meV < E < 80 meV) determined in
the earlier investigations.9,47–49
Below TN two new features emerge in different polariza-
tions with different shapes and peak intensities that can be
attributed to magnetic excitations. Firstly, a broad band
extending from about 100 to 180 cm�1 appears in the xxand yy polarization configurations with the incoming and
outgoing light polarization perpendicular to the c axis of the
crystal (Fig. 8). Second, sharp and rather symmetric peak
develops in crossed yz polarization at around 113 cm�1
(Fig. 9). Both features appear below the magnetic ordering
temperature, thus suggesting magnetic excitations as their
origin. We attribute the broad band to a longitudinal mode
and the sharp peak with lower energy to a transverse mode.
This interpretation is motivated by the energy scale9 of the
peak energy and the selection rules.
In the following, we will discuss the above-mentioned
observations in more details:
(i) Many theoretical and experimental investigations have
been directed towards the spectroscopic investigations of the
spinon continuum in the 1D spin-1/2 systems.50–53 The multi-
spinon excitation spectrum is observed in both low- and high-
temperature phases of KCuF3 in neutron scattering experi-
ments48,49,54 and was compared to the Muller ansatz,55 ana-
lytic expressions for the two-spinon contribution of the Bethe
ansatz solutions.56 An excellent agreement was found for the
temperatures above TN. However, within the Fleury–Loudon
scheme57,58 there would be no magnetic light scattering in the
case of the strictly 1D linear chain with pure nearest-neighbor
interactions. The light scattering operator commutes with the
original Heisenberg Hamiltonian. This is exactly the case for
KCuF3, where only quasielastic scattering is observed in
intrachain scattering configuration at temperatures above TN.
FIG. 6. Temperature dependence of the eigenfrequency of the Eg(2) and the
split-off mode below TS in xz scattering geometry. Lines are drawn to guide
the eye.
FIG. 7. Multi-spinon continuum (blue line) at T¼ 3.5 K together with the
longitudinal mode (red line) located at 145 cm�1 extracted from the yyRaman spectra of KCuF3 (black line). Dashed lines separate the different
regimes of KCuF3 as a function of energy (Ref. 9).
424 Low Temp. Phys. 38 (5), May 2012 Gnezdilov et al.
This article is copyrighted as indicated in the article. Reuse of AIP content is subject to the terms at: http://scitation.aip.org/termsconditions. Downloaded to IP: 202.28.191.34
On: Sun, 21 Dec 2014 23:36:37

As clearly seen in Fig. 7, a wide scattering continuum is pres-
ent in the Raman spectra of KCuF3 at temperatures below TN
where long-range 3D magnetic order develops.
The low-temperature spin-excitation continuum in
KCuF3, observed in inelastic neutron scattering experiments,
was compared to the theoretical predictions for both two-
magnon excitations in a 3D antiferromagnet and multi-
spinon excitations in a 1D AFM spin-1/2 chain.54 It was
found that conventional 3D spin-wave theory with the inclu-
sion of two-magnon terms could qualitatively explain the
observations at low energies but not the continuum at higher
energies.
It is known that the ordered moment per Cu site in
KCuF3 is reduced by 50% at T� TN compared to the satura-
tion value in 3D due to quantum fluctuations.25 Therefore,
this system clearly has aspects of both 1D and 3D spin-1/2
magnetism at low temperatures. The question arises what
happens to the excitation spectrum when weak interchain
coupling is “switched on.” A simple physical picture was
provided by the chain-mean field theory,59 treating the inter-
chain interactions as a staggered field and applying a random
phase approximation.60,61 A multispinon continuum starting
at�22 meV and extending upward in energy was predicted.61
We want to highlight that the observations of a structured
background in our RS experiments at low temperatures are
consistent with an interpretation of the magnetic continuum
in terms of multispinon excitations: (1) in energy position
and (2), most surprisingly, the shape of the multi-spinon
background is similar to the spin excitation continuum meas-
ured using neutron scattering.48 As to the polarization proper-
ties, inclusion of the terms beyond the nearest neighbors in cdirection into the effective light coupling Hamiltonian, spin-
orbit coupling, and “phonon assisted superexchange”62 can
lead to the appearance of multi-spinon scattering not only in
the polarization parallel to the chain direction.57
(ii) The existence of a novel longitudinal mode in
coupled quantum chain compounds has been established the-
oretically and experimentally (Refs. 9, 10, 60, 64, and 65).
This mode appears in the AFM ordered phase of spin-1/2
quasi-one-dimensional system where a long-range order
coexists with strong quantum fluctuations. Furthermore, it
indicates a reduction in the ordered spin moment of the spin-
1/2 antiferromagnet. In theory, the longitudinal mode in
KCuF3 is predicted at 17.4 meV (Ref. 61) and observed in
neutron scattering at 16 meV (Ref. 65) with a width of
5 meV. In our Raman scattering experiments the longitudinal
mode (Fig. 8) is observed in xx and yy scattering geometry at
145 cm�1 (18 meV) at T¼ 3.5 K with a width of �5 meV.
With temperature increasing, the peak position of this mode
shifts to 128 cm�1 (15.8 meV) and broadens up to 16.6 meV
in the vicinity of TN. The intensity of the longitudinal mode
is plotted as a function of temperature in Fig. 10. The energy
FIG. 8. Temperature dependence of the longitudinal mode in the Raman
spectra of KCuF3. The spectra have been offset vertically for clarity.
FIG. 9. Temperature dependence of the transverse mode in the Raman
spectra of KCuF3. The spectra have been offset vertically for clarity.
FIG. 10. Temperature dependence of the normalized integrated intensity of
the longitudinal mode obtained from Raman (closed circles) and neutron
scattering (open circles) (Ref. 10) experiments on KCuF3. The open squares
present the temperature dependence of the normalized intensity of the trans-
verse mode and the black dashed line show the fit with a power law.
Low Temp. Phys. 38 (5), May 2012 Gnezdilov et al. 425
This article is copyrighted as indicated in the article. Reuse of AIP content is subject to the terms at: http://scitation.aip.org/termsconditions. Downloaded to IP: 202.28.191.34
On: Sun, 21 Dec 2014 23:36:37

of the longitudinal mode is to a good approximation propor-
tional to the square of the ordered moment, and this is in
good agreement with neutron experiments.10
(iii) Inelastic light scattering in a homogeneous Heisen-
berg spin chain does not allow the observation of transverse
modes known for T < TN from spin-wave theory.66 There-
fore, we have to assign the observation of a sharp mode in yzcrossed geometry at 113 cm�1 (see Fig. 9) to some modifica-
tions of the scattering mechanism. They can be potentially
caused by interchain interaction, spin-orbit interaction, or or-
bital fluctuations. While interchain interaction is certainly
present and represents a key factor for the observation of
long-range order, it would by itself not lead to a large scat-
tering intensity by spin flips. Therefore, and in agreement
with the scattering in crossed geometry, spin-orbit interac-
tion might be the origin of this mode. Comparing the temper-
ature variation of the transverse and longitudinal mode
intensities (Fig. 10), it can be seen that the former does not
trace the Neel temperature of 39 K. It rather fits to a power
law, I ¼ I0ð1� T=TNÞ2b, with TN¼ 22 K and b¼ 0.217.
This variation points to another origin due to a small amount
of the second structural polytype ðD54hÞ of KCuF3 phase pres-
ence in our sample.
Generally speaking, the magnetic excitation spectrum of
KCuF3 collected in Raman scattering measurements shows
the features characteristic for the 1D behavior over a large
range of energies and temperatures. At low temperatures
(below TN) additional low-energy excitations are found.
From these the longitudinal mode, a quantum feature, which
arises in systems where a limited amount of long-range mag-
netic order co-exist with quantum fluctuations, is the most
interesting as it signals the crossover from 1D to 3D behav-
iour. In the magnetic phase diagram of KCuF3 the longitudi-
nal mode separates the energy range of 1D- and 3D-like
magnetic excitations at T < TN.9 Our observations are in an
excellent agreement with neutron scattering data9,10,48,54 and
strongly support the concept that KCuF3 is a good realization
of a material close to a quantum critical point.
4. Summary
In summary, the main outcomes of this work are the
following:
(i) Temperature-dependent Raman spectra of single
crystalline KCuF3 show strong softening of the lowest-lying
Eg(l) and the B1g mode for T > TS. Both modes together with
the Eg(2) mode (at about 260 cm�1) exhibit anomalies at the
characteristic temperature TS¼ 50 K. In xz scattering config-
uration the Eg(2) doublet clearly splits by about 6 cm�1. The
temperature dependence of the linewidth of these modes
yields an activated behavior with an energy Ur� 50 K corre-
sponding to TS. We ascribe this anomalous behavior to the
simultaneous and coupled change in magnetic-structural-or-
bital sectors upon cooling. An antiferrodistortive lattice
instability is connected with strong dynamic displacements
of the F� ions away from the Cu–F–Cu line along the c axis.
The displacements strongly influence the spin-spin relaxa-
tion by allowing for a Dzyaloshinsky–Moriya interaction.
They become static for T < TS.
(ii) The temperature-dependent magnetic excitation
spectrum of KCuF3 was collected in our Raman scattering
experiment for the first time. In the high-temperature phase
it shows quasielastic scattering, characteristic for the 1D
chain systems. In the low-temperature phase, below TN,
transverse and longitudinal magnetic modes as well as a
multi-spinon continuum emerge in different energy regions
of the Raman spectra in different polarizations and with dif-
ferent shapes and intensities. The simultaneous observation
of these magnetic excitations evidences the coexistence of a
limited amount of long-range antiferromagnetic order with
strong quantum fluctuations in KCuF3.
We like to thank M. V. Eremin and B. Lake for impor-
tant discussions. D.W. and P.L. acknowledges support by
B-IGSM and NTH “Contacts in Nanosystems.” We also
acknowledge support by the DFG via TRR80 and via LE
967/6-1 and the Swiss NSF through NCCR MaNEP.
a)Email: [email protected]
1S. Kadota, I. Yamada, S. Yoneyama, and K. Hirakawa, J. Phys. Soc. Jpn.
23, 751 (1967).2K. I. Kugel and D. I. Khomskii, Sov. Phys. Usp. 25(4), 231 (1982).3A. I. Liechtenstein, V. I. Anisimov, and J. Zaanen, Phys. Rev. B 52,
R5467 (1995).4J. E. Medvedeva, M. A. Korotin, V. I. Anisimov, and A. J. Freeman, Phys.
Rev. B 65, 172413 (2002).5I. Leonov, N. Binggeli, Dm. Korotin, V. I. Anisimov, N. Stojic, and
D. Vollhardt, Phys. Rev. Lett. 101, 096405 (2008).6I. Leonov, Dm. Korotin, N. Binggeli, V. I. Anisimov, and D. Vollhardt,
e-print arXiv:0909.1283.7E. Pavarini, E. Koch, and A. I. Lichtenstein, Phys. Rev. Lett. 101, 266405
(2008).8A. Okazaki and Y. Suemune, J. Phys. Soc. Jpn. 16, 671 (1961).9B. Lake, D. A. Tennant, C. D. Frost, and S. E. Nagler, Nature Mater 4,
329 (2005).10B. Lake, D. A. Tennant, and S. E. Nagler, Phys. Rev. B 71, 134412
(2005).11A. Okazaki and Y. Suemune, J. Phys. Soc. Jpn. 16, 176 (1961).12R. H. Buttner, E. N. Maslen, and N. Spadaccini, Acta Cryst. B 46, 131
(1990).13M. Tsukuda and A. Okazaki, J. Phys. Soc. Jpn. 33, 1088 (1972).14M. T. Hutchings, E. J. Samuelson, G. Shirane, and K. Hirakawa, Phys.
Rev. 188, 919 (1969).15M. T. Hutchings, H. Ikeda, and J. M. Milne, J. Phys. C: Solid State Phys.
12, L739 (1979).16S. K. Satija, J. D. Axe, G. Shirane, H. Yoshizawa, and K. Hirakawa, Phys.
Rev. B 21, 2001 (1980).17M. Hidaka, T. Eguchi, and I. Yamada, J. Phys. Soc. Jpn. 67, 2488 (1998).18T. Ueda, K. Sugawara, T. Kondo, and I. Yamada, Solid State Commun.
80, 801 (1991).19I. Yamada, H. Fujii, and M. Hidaka, J. Phys.: Condens. Matter 1, 3397
(1989).20C. Mazzoli, G. Allodi, R. De Renzi, G. Guidi, and P. Ghigna, J. Magn.
Magn. Mater. 242, 935 (2002).21L. Li, Q. Shi, M. Mino, H. Yamazaki, and I. Yamada, J. Phys.: Condens.
Matter 17, 2749 (2005).22I. Yamada and N. Kato, J. Phys. Soc. Jpn. 63, 289 (1994).23N. Binggeli and M. Altarelli, Phys. Rev. B 70, 085117 (2004).24L. Paolasini, R. Caciuffo, A. Sollier, P. Ghigna, and M. Altarelli, Phys.
Rev. Lett. 88, 106403 (2002).25R. Caciuffo, L. Paolasini, A. Sollier, P. Ghigna, E. Pavarini, J. van den
Brink, and M. Altarelli, Phys. Rev. B 65, 174425 (2002).26M. V. Eremin, D. V. Zakharov, H.-A. Krug von Nidda, R. M. Eremina,
A. Shuvaev, A. Pimenov, P. Ghigna, J. Deisenhofer, and A. Loidl, Phys.
Rev. Lett. 101, 147601 (2008).27J. Deisenhofer, I. Leonov, M. V. Eremin, Ch. Kant, P. Ghigna, F. Mayr,
V. V. Iglamov, V. I. Anisimov, and D. van der Marel, Phys. Rev. Lett.
101, 157406 (2008).28A. E. Nikiforov and S. Yu. Shashkin, Phys. Solid State 38, 1880 (1996).29K. Wakamura and T. Arai, J. Appl. Phys. 63, 5824 (1988).
426 Low Temp. Phys. 38 (5), May 2012 Gnezdilov et al.
This article is copyrighted as indicated in the article. Reuse of AIP content is subject to the terms at: http://scitation.aip.org/termsconditions. Downloaded to IP: 202.28.191.34
On: Sun, 21 Dec 2014 23:36:37

30P. G. Klemens, Phys. Rev. 148, 845 (1966).31M. Balkanski, R. F. Wallis, and E. Haro, Phys. Rev. B 28, 1928 (1983).32G. A. Samara and P. S. Peercy, Phys. Rev. B 7, 1131 (1973).33D. J. Lockwood, Fiz. Nizk. Temp. 28, 709 (2002) [Low Temp. Phys. 28,
505 (2002)].34D. J. Lockwood, R. S. Katiyar, and V. C. Y. So, Phys. Rev. B 28, 1983
(1983).35D. J. Lockwood, in Proceedings of IX International Conference on Raman
Spectroscopy, edited by M. Tsuboi (Chemical Society of Japan, Tokyo,
1984), p. 810.36W. Baltensperger and J. S. Helman, Helv. Phys. Acta 41, 668 (1968).37W. Baltensperger, J. Appl. Phys. 41, 1052 (1970).38P. Bruesch and F. D. Ambrogio, Phys. Status Solidi B 50, 513 (1972).39D. J. Lockwood and M. G. Cottam, J. Appl. Phys. 64, 5876 (1988).40J. M. Wesselinowa and A. T. Apostolov, J. Phys.: Condens. Matter 8, 473
(1996).41J. C. T. Lee, S. Yuan, S. Lal, Y. I. Joe, Yu Gan, S. Smadici, K. Finkelstein,
Y. Feng, A. Rusydi, P. M. Goldbart, S. L. Cooper, and P. Abbamonte,
e-print: arXiv:0911.0619; Nature Phys. doi: 10.1038/nphys2117 (2011).42K.-Y. Choi, Yu. G. Pashkevich, V. P. Gnezdilov, G. Guntherodt, A. V.
Yeremenko, D. A. Nabok, V. I. Kamenev, S. N. Barilo, S. V. Shiryaev, A.
G. Soldatov, and P. Lemmens, Phys. Rev. B 74, 064406 (2006).43J. Deisenhofer, M. V. Eremin, D. V. Zakharov, V. A. Ivanshin, R. M. Ere-
mina, H.-A. Krug von Nidda, A. A. Mukhin, A. Balbashov, and A. Loidl,
Phys. Rev. B 65, 104440 (2002).44T. Rudolf, Ch. Kant, F. Mayr, J. Hemberger, V. Tsurkan, and A. Loidl,
Phys. Rev. B 76, 174307 (2007).45P. Lemmens, G. Guntherodt, and C. Cros, Phys. Rep. 375, 1 (2003) and
references therein.46I. Yamada and H. Onda, Phys. Rev. B 49, 1048 (1994).47S. E. Nagler, D. A. Tennant, R. A. Cowley, T. G. Perring, and S. K. Satija,
Phys. Rev. B 44, 12361 (1991).48D. A. Tennant, R. A. Cowley, S. E. Nagler, and A. M. Tsvelik, Phys. Rev.
B 52, 13368 (1995).49D. A. Tennant, T. G. Perring, R. A. Cowley, and S. E. Nagler, Phys. Rev.
Lett. 70, 4003 (1993).
50H.-J. Mikeska and A. K. Kolezhuk, in Quantum Magnetism, LectureNotes in Physics, Vol. 645, edited by U. Schollwock, J. Richter, B. J. J.
Farell, and R. F. Bishop (Springer-Verlag, Berlin, 2004), p. 1, and refer-
ences therein.51P. Lemmens, G. Guntherodt, and C. Gross, Phys. Rep. 375, 1 (2003); P.
Lemmens and P. Millet, in: Quantum Magnetism, Lecture Notes inPhysics, Vol. 645, edited by U. Schollwock, J. Richter, B. J. J. Farell, and
R. F. Bishop (Springer-Verlag, Berlin, 2004), and references therein.52A. Gozar and G. Blumberg, in Frontiers in Magnetic Materials, edited by
A. V. Narlikar, (Springer-Verlag, Berlin, 2005), p. 697 and references
therein.53A. A. Zvyagin and V. O. Cheranovskii, Fiz. Nizk. Temp. 35, 578 (2009)
[Low Temp. Phys. 35, 455 (2009)].54D. A. Tennant, S. E. Nagler, D. Welz, G. Shirane, and K. Yamada, Phys.
Rev. B 52, 13381 (1995).55G. Muller, H. Thomas, H. Beck, and J. C. Bonner, Phys. Rev. B 24, 1429
(1981).56H. Bethe, Z. Phys. 71, 205 (1931).57P. A. Fleury and R. Loudon, Phys. Rev. 166, 514 (1968).58B. S. Shastry and B. I. Shraiman, Phys. Rev. Lett. 65, 1068 (1990); B. S.
Shastry and B. I. Shraiman, Int. J. Mod. Phys. B 5, 365 (1991).59D. J. Scalapino, Y. Imry, and P. Pincus, Phys. Rev. B 11, 2042 (1975).60H. J. Schulz, Phys. Rev. Lett. 77, 2790 (1996).61F. H. L. Essler, A. M. Tsvelik, and G. Delfino, Phys. Rev. B 56, 11001
(1997).62B. S. Shastry and B. I. Shraiman, Phys. Rev. Lett. 65, 1068 (1990).63R. R. P. Singh, P. Prelovsek, and B. S. Shastry, Phys. Rev. Lett. 77, 4086
(1996).64B. Lake, R. A. Cowley, and D. A. Tennant, J. Phys.: Condens. Matter 9,
10951 (1997).65B. Lake, D. A. Tennant, and S. E. Nagler, Phys. Rev. Lett. 85, 832 (2000).66For a review see M. G. Cottam, and D. J. Lockwood, Light Scattering in
Magnetic Solids (Wiley, New York, 1986).
This article was published in English in the original Russian journal. Repro-
duced here with stylistic changes by AIP.
Low Temp. Phys. 38 (5), May 2012 Gnezdilov et al. 427
This article is copyrighted as indicated in the article. Reuse of AIP content is subject to the terms at: http://scitation.aip.org/termsconditions. Downloaded to IP: 202.28.191.34
On: Sun, 21 Dec 2014 23:36:37