phonetic and social selectivity in speech accommodation by molly
TRANSCRIPT
Phonetic and Social Selectivity in Speech Accommodation
by
Molly Elizabeth Babel
B.A. (University of Minnesota, Twin Cities) 2004M.A. (University of California, Berkeley) 2006
A dissertation submitted in partial satisfaction of the
requirements for the degree of
Doctor of Philosophy
in
Linguistics
in the
GRADUATE DIVISION
of the
UNIVERSITY OF CALIFORNIA, BERKELEY
Committee in charge:Professor Keith Johnson, Chair
Professor Andrew GarrettProfessor Rodolfo Mendoza-Denton
Spring 2009
The dissertation of Molly Elizabeth Babel is approved:
Chair Date
Date
Date
University of California, Berkeley
Spring 2009

Phonetic and Social Selectivity in Speech Accommodation
Copyright 2009
by
Molly Elizabeth Babel

1
Abstract
Phonetic and Social Selectivity in Speech Accommodation
by
Molly Elizabeth Babel
Doctor of Philosophy in Linguistics
University of California, Berkeley
Professor Keith Johnson, Chair
Spontaneous phonetic imitation - the phenomenon where interacting talkers come to be more
similar-sounding - may be an important mechanism in dialect convergence and historical
sound change. Recent research has been concerned with whether spontaneous imitation is
an automatic (and hence unavoidable) process, or whether it is consciously mediated by
social factors (e.g., Giles and Coupland 1991, Goldinger 1998, Pickering and Garrod 2004,
Pardo 2006). Recently, Nielsen (2008) suggests that imitation of VOT can be influenced by
abstract linguistic knowledge as well. This dissertation presents the result from a project
that investigated phonetic imitation of vowels. The results show that talkers accommodate
on the first and second formants of the model talker in the task, but that not all vowels
are imitated to a significant degree. In this study of American English, only the low vowels
/A/ and /æ/ exhibit strong imitation effects, and this effect lies primarily within the F1
dimension. I argue that this is due to the increased repertoire of production variants

2
talkers store for low vowels as a result of the difference in jaw height in accented and
unaccented environments. In addition to these findings of phonetic selectivity, the degree
to which vowels were imitated were subtly affected by implicit social measures of how the
participant felt about the model talker in the experiment. The results of this study suggest
that participants only make use of pre-existing tokens within their phonetic repertoire in
a shadowing task and that the use of those variants is mediated by implicit social factors.
Such results demonstrate that phonetic imitation is not automatic in terms of occurring
all the time, but indeed automatic in terms of happening subconsciously. That is, the
social factors that mediate the imitation process are not explicit social choices, but implicit
socio-cognitive biases.
Professor Keith JohnsonDissertation Committee Chair

i
To you.

ii
Contents
List of Figures iv
List of Tables viii
1 Introduction 11.1 The issues . . . . . . . . . . . . . . . . . . . . . . . . . . . . . . . . . . . . . 11.2 Accommodation in non-linguistic behavior . . . . . . . . . . . . . . . . . . . 61.3 Outline . . . . . . . . . . . . . . . . . . . . . . . . . . . . . . . . . . . . . . 8
2 Background 122.1 Phonetic accommodation in the real world . . . . . . . . . . . . . . . . . . . 132.2 Phonetic Accommodation in the Laboratory . . . . . . . . . . . . . . . . . . 20
2.2.1 Communication Accommodation Theory . . . . . . . . . . . . . . . . 202.2.2 Laboratory phonology and exemplar-based models . . . . . . . . . . 232.2.3 A psycholinguistic model of accommodation . . . . . . . . . . . . . . 44
2.3 Speech variation . . . . . . . . . . . . . . . . . . . . . . . . . . . . . . . . . 462.3.1 Speech accommodation and style-shifting . . . . . . . . . . . . . . . 472.3.2 Speech and Race . . . . . . . . . . . . . . . . . . . . . . . . . . . . . 50
2.4 Brief Summary . . . . . . . . . . . . . . . . . . . . . . . . . . . . . . . . . . 53
3 Methodology 553.1 Shadowing Task . . . . . . . . . . . . . . . . . . . . . . . . . . . . . . . . . 56
3.1.1 Stimuli . . . . . . . . . . . . . . . . . . . . . . . . . . . . . . . . . . 563.1.2 Participants . . . . . . . . . . . . . . . . . . . . . . . . . . . . . . . . 623.1.3 Procedure . . . . . . . . . . . . . . . . . . . . . . . . . . . . . . . . . 62
3.2 Data Analysis . . . . . . . . . . . . . . . . . . . . . . . . . . . . . . . . . . . 643.3 Implicit Association Task . . . . . . . . . . . . . . . . . . . . . . . . . . . . 66
3.3.1 Stimuli . . . . . . . . . . . . . . . . . . . . . . . . . . . . . . . . . . 663.3.2 Participants . . . . . . . . . . . . . . . . . . . . . . . . . . . . . . . . 673.3.3 Procedure . . . . . . . . . . . . . . . . . . . . . . . . . . . . . . . . . 683.3.4 IAT Data Analysis . . . . . . . . . . . . . . . . . . . . . . . . . . . . 70
3.4 Predictions . . . . . . . . . . . . . . . . . . . . . . . . . . . . . . . . . . . . 70
iii
4 Results & Discussion 734.1 Mixed Effects Modeling . . . . . . . . . . . . . . . . . . . . . . . . . . . . . 754.2 Results . . . . . . . . . . . . . . . . . . . . . . . . . . . . . . . . . . . . . . . 76
4.2.1 Asocial Conditions . . . . . . . . . . . . . . . . . . . . . . . . . . . . 764.2.2 Black talker Conditions . . . . . . . . . . . . . . . . . . . . . . . . . 934.2.3 White talker Conditions . . . . . . . . . . . . . . . . . . . . . . . . . 1044.2.4 Black Social Condition . . . . . . . . . . . . . . . . . . . . . . . . . . 1164.2.5 White Social Condition . . . . . . . . . . . . . . . . . . . . . . . . . 1204.2.6 Degrees of Imitation . . . . . . . . . . . . . . . . . . . . . . . . . . . 123
4.3 Discussion . . . . . . . . . . . . . . . . . . . . . . . . . . . . . . . . . . . . . 126
5 Conclusion 1355.1 General summary . . . . . . . . . . . . . . . . . . . . . . . . . . . . . . . . . 1365.2 Discipline specific summaries . . . . . . . . . . . . . . . . . . . . . . . . . . 140
5.2.1 Phonetics . . . . . . . . . . . . . . . . . . . . . . . . . . . . . . . . . 1415.2.2 Sociolinguistics . . . . . . . . . . . . . . . . . . . . . . . . . . . . . . 1435.2.3 Psycholinguistics . . . . . . . . . . . . . . . . . . . . . . . . . . . . . 145

iv
List of Figures
3.1 Picture of the Black talker whose voice and image were used in the experiment. 583.2 Picture of the White talker whose voice and image were used in the experiment. 583.3 Mean formant values taken from tokens used as stimuli for the shadowing task. 603.4 The F1-F2 location of the vowel nuclei for each word stimulus for the two
talkers. . . . . . . . . . . . . . . . . . . . . . . . . . . . . . . . . . . . . . . . 613.5 Participant view of a trial in either Block 3 or 5 of IAT depending on partic-
ipants’ assigned condition. . . . . . . . . . . . . . . . . . . . . . . . . . . . . 69
4.1 Spontaneous phonetic imitation in the Asocial Conditions for the male par-ticipants by Condition. The Difference in Distance measure on the y-axisindicates the amount of phonetic imitation. A value of zero shows no changein vowel production as a result of auditory exposure to the model talker. Anegative value demonstrates phonetic imitation and a positive value demon-strates acoustic divergence. Blocks 4, 5, and 6 are Shadowing Blocks whileBlock 7 is the Post-task Block. The error bars represent 95% confidenceintervals. . . . . . . . . . . . . . . . . . . . . . . . . . . . . . . . . . . . . . . 79
4.2 Spontaneous phonetic imitation in the Asocial Conditions for each vowel forthe male participants collapsed across Condition. The Difference in Distancemeasure on the y-axis indicates the amount of phonetic imitation. A valueof zero shows no change in vowel production as a result of auditory exposureto the model talker. A negative value demonstrates phonetic imitation anda positive value demonstrates vocalic divergence. Blocks 4, 5, and 6 areShadowing Blocks while Block 7 is the Post-task Block. The error barsrepresent 95% confidence intervals. . . . . . . . . . . . . . . . . . . . . . . . 80
4.3 Formant plot displaying the spontaneous phonetic imitation in the BlackAsocial Condition for the male participants. Formant values are plotted inthe Bark scale. The Black model talker’s mean vowels are plotted in black.Male participants’ Pre-task (Block 2) vowel means are plotted in light grayand their productions from the Final Shadowing Block (Block 6) are plottedin dark gray. . . . . . . . . . . . . . . . . . . . . . . . . . . . . . . . . . . . 82

v
4.4 Formant plot displaying the spontaneous phonetic imitation in the WhiteAsocial Condition for the male participants. Formant values are plotted inthe Bark scale. The White model talker’s mean vowels are plotted in black.Male participants’ Pre-task (Block 2) vowel means are plotted in light grayand their productions from the Final Shadowing Block (Block 6) are plottedin dark gray. . . . . . . . . . . . . . . . . . . . . . . . . . . . . . . . . . . . 84
4.5 Spontaneous phonetic imitation in the Asocial Conditions for the female par-ticipants collapsed across vowel. The Difference in Distance measure on they-axis indicates the amount of phonetic imitation. A value of zero showsno change in vowel production as a result of auditory exposure to the modeltalker. A negative value demonstrates phonetic imitation and a positive valuedemonstrates vocalic divergence. Blocks 4-6 are Shadowing Blocks whileBlock 7 is the Post-task Block. Responses in the Black Asocial Conditionare shown with the filled circles. Responses in the White Asocial Conditionare shown with the unfilled circles. The error bars represent 95% confidenceintervals. . . . . . . . . . . . . . . . . . . . . . . . . . . . . . . . . . . . . . . 87
4.6 Spontaneous phonetic imitation in the Asocial Conditions for the female par-ticipants by vowel. The Difference in Distance measure on the y-axis indi-cates the amount of phonetic imitation. A value of zero shows no changein vowel production as a result of auditory exposure to the model talker. Anegative value demonstrates phonetic imitation and a positive value demon-strates vocalic divergence. Blocks 4, 5, and 6 are Shadowing Blocks whileBlock 7 is the Post-task Block. The error bars represent 95% confidenceintervals. . . . . . . . . . . . . . . . . . . . . . . . . . . . . . . . . . . . . . . 89
4.7 Formant plot displaying the spontaneous phonetic imitation in the BlackAsocial Condition for the female participants. Formant values are plotted inthe Bark scale. The Black model talker’s mean vowels are plotted in black.Female participants’ Pre-task (Block 2) vowel means are plotted in light grayand their productions from the Final Shadowing Block (Block 6) are plottedin dark gray. . . . . . . . . . . . . . . . . . . . . . . . . . . . . . . . . . . . 91
4.8 Formant plot displaying the spontaneous phonetic imitation in the WhiteAsocial Condition for the female participants. Formant values are plotted inthe Bark scale. The White model talker’s mean vowels are plotted in black.Female participants’ Pre-task (Block 2) vowel means are plotted in light grayand their productions from the Final Shadowing Block (Block 6) are plottedin dark gray. . . . . . . . . . . . . . . . . . . . . . . . . . . . . . . . . . . . 92
4.9 Spontaneous phonetic imitation in the Black talker Conditions for the maleparticipants. The Difference in Distance measure on the y-axis indicates theamount of phonetic imitation. A value of zero shows no change in vowelproduction as a result of auditory exposure to the model talker. A negativevalue demonstrates phonetic imitation and a positive value demonstratesvocalic divergence. Blocks 4, 5, and 6 are Shadowing Blocks while Block 7 isthe Post-task Block. The error bars represent 95% confidence intervals. . . 95

vi
4.10 Spontaneous phonetic imitation in the Black talker Conditions for the maleparticipants. The Difference in Distance measure on the y-axis indicates theamount of phonetic imitation. A value of zero shows no change in vowelproduction as a result of auditory exposure to the model talker. A negativevalue demonstrates phonetic imitation and a positive value demonstratesvocalic divergence. Blocks 4, 5, and 6 are Shadowing Blocks while Block 7 isthe Post-task Block. The error bars represent 95% confidence intervals. . . 96
4.11 Formant plot displaying the spontaneous phonetic imitation in the BlackSocial Condition for the male participants. Formant values are plotted inthe Bark scale. The Black model talker’s mean vowels are plotted in black.Female participants’ Pre-task (Block 2) vowel means are plotted in light grayand their productions from the Final Shadowing Block (Block 6) are plottedin dark gray. . . . . . . . . . . . . . . . . . . . . . . . . . . . . . . . . . . . 97
4.12 Spontaneous phonetic imitation in the Black talker Conditions for each vowelfor the female participants collapsed across Condition. The Difference in Dis-tance measure on the y-axis indicates the amount of phonetic imitation. Avalue of zero shows no change in vowel production as a result of auditoryexposure to the model talker. A negative value demonstrates phonetic imi-tation and a positive value demonstrates vocalic divergence. Blocks 4, 5, and6 are Shadowing Blocks while Block 7 is the Post-task Block. The error barsrepresent 95% confidence intervals. . . . . . . . . . . . . . . . . . . . . . . . 99
4.13 Spontaneous phonetic imitation in the Black talker Conditions for the femaleparticipants. The Difference in Distance measure on the y-axis indicates theamount of phonetic imitation. A value of zero shows no change in vowelproduction as a result of auditory exposure to the model talker. A negativevalue demonstrates phonetic imitation and a positive value demonstratesvocalic divergence. Blocks 4, 5, and 6 are Shadowing Blocks while Block 7 isthe Post-task Block. The error bars represent 95% confidence intervals. . . 100
4.14 Formant plot displaying the spontaneous phonetic imitation in the BlackSocial Condition for the female participants. Formant values are plotted inthe Bark scale. The Black model talker’s mean vowels are plotted in black.Female participants’ Pre-task (Block 2) vowel means are plotted in light grayand their productions from the Final Shadowing Block (Block 6) are plottedin dark gray. . . . . . . . . . . . . . . . . . . . . . . . . . . . . . . . . . . . 101
4.15 Spontaneous phonetic imitation in the White talker Conditions for the maleparticipants. The Difference in Distance measure on the y-axis indicates theamount of phonetic imitation. A value of zero shows no change in vowelproduction as a result of auditory exposure to the model talker. A negativevalue demonstrates phonetic imitation and a positive value demonstratesvocalic divergence. Blocks 4, 5, and 6 are Shadowing Blocks while Block 7 isthe Post-task Block. The error bars represent 95% confidence intervals. . . 106
vii
4.16 Spontaneous phonetic imitation in the White talker Conditions for the maleparticipants. The Difference in Distance measure on the y-axis indicates theamount of phonetic imitation. A value of zero shows no change in vowelproduction as a result of auditory exposure to the model talker. A negativevalue demonstrates phonetic imitation and a positive value demonstratesvocalic divergence. Blocks 4, 5, and 6 are Shadowing Blocks while Block 7 isthe Post-task Block. The error bars represent 95% confidence intervals. . . 108
4.17 Formant plot displaying the spontaneous phonetic imitation in the BlackSocial Condition for the female participants. Formant values are plotted inthe Bark scale. The Black model talker’s mean vowels are plotted in black.Female participants’ Pre-task (Block 2) vowel means are plotted in light grayand their productions from the Final Shadowing Block (Block 6) are plottedin dark gray. . . . . . . . . . . . . . . . . . . . . . . . . . . . . . . . . . . . 109
4.18 Spontaneous phonetic imitation in the White talker Conditions for the femaleparticipants. The Difference in Distance measure on the y-axis indicates theamount of phonetic imitation. A value of zero shows no change in vowelproduction as a result of auditory exposure to the model talker. A negativevalue demonstrates phonetic imitation and a positive value demonstratesvocalic divergence. Blocks 4, 5, and 6 are Shadowing Blocks while Block 7 isthe Post-task Block. The error bars represent 95% confidence intervals. . . 111
4.19 Spontaneous phonetic imitation in the White talker Conditions for the femaleparticipants. The Difference in Distance measure on the y-axis indicates theamount of phonetic imitation. A value of zero shows no change in vowelproduction as a result of auditory exposure to the model talker. A negativevalue demonstrates phonetic imitation and a positive value demonstratesvocalic divergence. Blocks 4, 5, and 6 are Shadowing Blocks while Block 7 isthe Post-task Block. The error bars represent 95% confidence intervals. . . 113
4.20 Spontaneous phonetic imitation in the White Social condition for the femaleparticipants. . . . . . . . . . . . . . . . . . . . . . . . . . . . . . . . . . . . . 115124
4.22 Amount of imitation of the participants to the model talkers. The phoneticdistance measure on the y-axis indicates the amount the participant groupsmodified their phonetic distance in response to the model talker. A value of0 would mean that participants did not change their vowel productions inresponse to the model talkers. The more imitation was observed, the higherthe Distance value. There were no significant differences between any of thegroups. . . . . . . . . . . . . . . . . . . . . . . . . . . . . . . . . . . . . . . . 125
4.23 Pre-task vowel productions from Subject 200, a female participant. . . . . . 132

viii
List of Tables
3.1 Stimuli used in shadowing task. All words have raw frequency counts of ≤1per million in spontaneous speech as determined by Baayen et al. (1993). . 57
3.2 The six experimental conditions and their design. Voice refers to the racialidentity of the talker whose voice was used in the condition. Picture refersto whether there was a digital image of the talker presented in the condition,and if so, what the racial identity of the talker was. The Male and Femalecolumns refer to the number of participants in each group who were assignedto each Condition. . . . . . . . . . . . . . . . . . . . . . . . . . . . . . . . . 63
3.3 Names and words used as stimuli for the Implicit Association Task. . . . . . 67
4.1 Fixed Effects for the Asocial Conditions for male participants. Symbols fol-lowing the t-values indicate the associated p-value: ‘***’ p < 0.001, ‘**’ p <0.01, ‘*’ p < 0.05, and ‘.’ p < 0.1. . . . . . . . . . . . . . . . . . . . . . . . 83
4.2 Fixed effects output for the mixed effects model composed of the data fromthe Asocial Condition for the female participants. Symbols following the t-values indicate the associated p-value: ‘***’ p < 0.001, ‘**’ p < 0.01, ‘*’ p< 0.05, and ‘.’ p < 0.1. . . . . . . . . . . . . . . . . . . . . . . . . . . . . . 90
4.3 Fixed effects for the Conditions with the Black talker for male participants.Symbols following the t-values indicate the associated p-value: ‘***’ p <0.001, ‘**’ p < 0.01, ‘*’ p < 0.05, and ‘.’ p < 0.1. . . . . . . . . . . . . . . . 102
4.4 Fixed Effects for the Conditions with the Black talker for female participants.Symbols following the t-values indicate the associated p-value: ‘***’ p <0.001, ‘**’ p < 0.01, ‘*’ p < 0.05, and ‘.’ p < 0.1. . . . . . . . . . . . . . . . 103
4.5 Fixed effects for the Conditions with the White talker for male participants.Symbols following the t-values indicate the associated p-value: ‘***’ p <0.001, ‘**’ p < 0.01, ‘*’ p < 0.05, and ‘.’ p < 0.1. . . . . . . . . . . . . . . . 107
4.6 Fixed effects for the Conditions with the White talker for female participants.Symbols following the t-values indicate the associated p-value: ‘***’ p <0.001, ‘**’ p < 0.01, ‘*’ p < 0.05, and ‘.’ p < 0.1. . . . . . . . . . . . . . . . 114
4.7 Fixed Effects for the Black talker Conditions for the White male participants.Symbols following the t-values indicate the associated p-value: ‘***’ p <0.001, ‘**’ p < 0.01, ‘*’ p < 0.05, and ‘.’ p < 0.1. . . . . . . . . . . . . . . . 117
ix
4.8 Results of simple linear regressions examining relationships between the so-cial factors IAT and Attractivness Ratings and vowel subsets for male par-ticipants in the Black Social Condition. Symbols following the R2 valuesindicate the associated p-value: ‘***’ p < 0.001, ‘**’ p < 0.01, ‘*’ p < 0.05,and ‘.’ p < 0.1. . . . . . . . . . . . . . . . . . . . . . . . . . . . . . . . . . . 118
4.9 Fixed Effects for the Black Social Condition for the White female partici-pants. Symbols following the t-values indicate the associated p-value: ‘***’p < 0.001, ‘**’ p < 0.01, ‘*’ p < 0.05, and ‘.’ p < 0.1. . . . . . . . . . . . . 119
4.10 Results of simple linear regressions examining relationships between the socialfactors IAT and Attractivness Ratings and vowel subsets for female partici-pants in the Black Social Condition. Symbols following the R2 values indicatethe associated p-value: ‘***’ p < 0.001, ‘**’ p < 0.01, ‘*’ p < 0.05, and ‘.’ p< 0.1. . . . . . . . . . . . . . . . . . . . . . . . . . . . . . . . . . . . . . . . 120
4.11 Fixed Effects for the White talker Conditions for the Male female partici-pants. Symbols following the t-values indicate the associated p-value: ‘***’p < 0.001, ‘**’ p < 0.01, ‘*’ p < 0.05, and ‘.’ p < 0.1. . . . . . . . . . . . . 121
4.12 Results of simple linear regressions examining relationships between the At-tractivness Ratings and vowel subsets for male participants in the WhiteSocial Condition. Symbols following the R2 values indicate the associatedp-value: ‘***’ p < 0.001, ‘**’ p < 0.01, ‘*’ p < 0.05, and ‘.’ p < 0.1. . . . . 122
4.13 Fixed Effects for the White talker Conditions for the White female partici-pants. Symbols following the t-values indicate the associated p-value: ‘***’p < 0.001, ‘**’ p < 0.01, ‘*’ p < 0.05, and ‘.’ p < 0.1. . . . . . . . . . . . . 122
4.14 Results of simple linear regressions examining relationships between the At-tractivness Ratings and vowel subsets for female participants in the WhiteSocial Condition. Symbols following the R2 values indicate the associatedp-value: ‘***’ p < 0.001, ‘**’ p < 0.01, ‘*’ p < 0.05, and ‘.’ p < 0.1. . . . . 123
x
Acknowledgments
We don’t like to admit it, but a lot of where we are in life has to do with luck. I
am infinitely lucky to have stumbled across a field of study that I find endlessly fascinating,
and I am lucky that I appear not to be terrible at it. Seems like a decent match.
I am also exceedingly fortunate to have stumbled in the paths of amazing mentors
and advisors. I certainly would not be at this moment in my life had it not been for Ben
Munson. Ben is one of the most compassionate, kooky, and supportive people I have ever
met. A true friend for the ages. Ben, I owe you so much. Keith Johnson is the epitome of
a great advisor; I cannot imagine a better one. He is wise, insightful, and kind. A winning
combination in any person and especially in an advisor. Thanks, Keith, for spotting my
overly innovative word choices and pointing out not-so-hot and overly ambitious theoretical
ideas. This dissertation has clearly benefited from the perspectives of my other committee
members, Andrew Garrett and Rudy Mendonza-Denton. Rudy pushed me in completely
new directions. I am incredibly excited to continue thinking and reading about social
psychology in my future work. When I first came to Berkeley I thought Andrew Garrett
was one of the scariest people alive. While I may still feel that way, he has been a significant
inspiration over the years, particularly in the classroom. Thank you.
My office was always continually inhabited by the absolute best officemates –
namely, Grant McGuire and Anne Pycha. I look up to the both of them more than they
could ever know. The amount that I have learned from Grant and Anne both professionally
and personally has really been tremendous. On more than one occasion I believe I have
told people I want to be Anne Pycha when I grow up. Grant was my officemate for 3
xi
years; how glad I am he followed Keith to Berkeley. When I think of life-long colleagues, I
think of Grant. While Sam Tilsen was never officially an officemate, I have thrown myriad
ideas in that guy’s direction. Most of them bounce back to me better than they had
originated. Other folks in the Phonology Lab at Berkeley have played significant roles in
the developments of many of the ideas in this dissertation and beyond: Charles Chang,
Christian DiCanio, Susanne Gahl, Sharon Inkelas, Reiko Kataoka, Shira Katseff, John
Ohala, and Yao Yao, to name too few, I’m sure. Ronald Sprouse deserves special mention
for his expert technical support. Dasha Bulatov and Tyler Frawley: you have put so much
work into this dissertation. Thank you!
The Linguistics Department at UC Berkeley is so fortunate to have not only bril-
liant minds, but amicable personalities as well. Thanks to Alice Gaby for continuous pro-
fessional input and basically everything else. My linguistic horizons have certainly been
broadened, let alone my social horizons, by my favorite syntacticians: Hannah Haynie,
Michael Houser, and Maziar Toosarvandani.
While I am positively certain my brothers and sisters – Zack, Jacob, Joseph,
Madeline, Britta, and August – won’t have the slightest desire to ever peruse these pages, I
want to thank them for simply being awesome. Thanks to Mom for giving me perspective
on life. I miss you. Dan and Leonard Hirst deserve shout-outs for the drool and the
wine, respectively. I have received a considerable amount of support from Ali and Aydın
Durgunoglu in years past: cok tesekkuler! Erdem Durgunoglu, you were great. Thanks for
all of your love, support, and laughter over the years. Lots and lots of appreciation also go
to A-roar for not impinging upon my productivity in the last couple months too much (and

xii
for being beyond great).
My funding sources over the years certainly deserve acknowledgment. My time at
Berkeley has been funded throughout the years by the University of California, Berkeley
itself and the National Institute of Health. The National Science Foundation, the Abi-
gail Hodgen Publication Fund, and the Center for Race and Gender at UC Berkeley have
generously supported my research over the years. I hope you all keep it up.
Lastly, thanks to the state of California for my education and sustainable agri-
culture; to The Current at Minnesota Public Radio for streaming online; and, to the cities
of Berkeley and Oakland for having beautiful weather, year-round farmers’ markets, and
well-maintained tennis courts.

1
Chapter 1
Introduction
This dissertation is concerned with phonetic accommodation of vowels, i.e. how
an individual passively acquires the acoustic characteristics of vowels of the individuals he
or she is interacting with. In this chapter, I introduce some of issues that go along with this
topic. These issues are laid out in Section 1.1. A particularly interesting aspect of speech
accommodation is that it is part of a larger set of imitative behaviors; Section 1.2 describes
this parallel non-linguistic behavior. Finally, a general outline of the remaining chapters of
this dissertation is given in Section 1.3.
1.1 The issues
As people learn to speak, they acquire the language and dialect spoken around
them. Sentence structure, lexical selection, and pronunciation are all determined by the
patterns being used in the ambient language we are exposed to. Having grown up in
Minnesota, I did not learn how to speak with a British accent, but with a Minnesotan one.
2
However, after moving to California as an adult, with time my speech has lost many of
its Minnesotan features. To native Californian ears though, I do not sound Californian,
per se, but I do sound much less Minnesotan. Interestingly, the Minnesotan features of
my speech return when interacting with old friends and family or even when talking about
my childhood or Minnesota-infused memories. A central question surrounding this dialect-
shifting behavior is whether it is an automatic – that is, uncontrolled behavior – or whether
it is an intentional social act on my part to identify as a native Minnesotan.
In addition to changes in language production as a result of exposure to a new
dialect, similar changes in speech have been induced in the laboratory. For example, imagine
a picture with a man holding a cake and a woman standing by. The orientation of the
image suggests the man intends to pass the cake to the woman. Participants who have been
exposed to an oral description The boy gave the toy to the teacher are more likely to describe
the cake picture as The man gave the cake to the woman than The man gave the woman
the cake. The second description is a completely grammatical utterance that accurately
conveys what is going on in the picture. But, simply being exposed to the construction
give X to Y favors the future use of that construction over give Y X (Bock 1986, Branigan
et al. 2007, Pickering and Ferreira 2008). Similarly, with word choice, individuals align their
lexical selections to those of their interlocutors (Garrod and Doherty 1994).
This question of how why we sound like we do is particularly interesting from a
phonetic perspective. The fact that the perceptual categories of language are labile is well
grounded (Norris et al. 2003, Kraljic and Samuel 2005, 2006, 2007, Kraljic et al. 2008a,b,
Maye et al. 2008). But, in terms of speech production, when we are faced with the question
3
why do talkers sound like they do, the immediate answer is that it is determined by a talker’s
physiology. The exact size and shape of talker’s oral cavity play a large role in determining
the acoustic characteristics of that particular talker. Someone who is taller will have a
larger oral cavity, and therefore the acoustic resonances that come from that cavity – or
that individual – will be lower. However, if we ignore physiological differences between
talkers, the question of why do we sound like we do boils down to a question of how do we
sound like those around us. From birth, talkers acquire the ambient language and dialect
to which they are exposed, and, if we are to examine how these speech production targets
may change from one production to the next, we simply need to examine what is known as
phonetic imitation.
Phonetic imitation, also known as phonetic convergence or phonetic accommoda-
tion, is the process in which a talker acquires acoustic characteristics of the individual they
are interacting with. Like sentence structure and lexical selection, phonetic imitation has
also been investigated in the laboratory. This research has revealed that phonetic conver-
gence can occur in both socially minimal situations where talkers are simply producing
single words (Goldinger 1997, 1998, Goldinger and Azuma 2004b, Namy et al. 2002) and
in cooperative, socially rich, dyadic interactions (Pardo 2006, In press). These studies have
shown that talkers imitate acoustic characteristics of the voice to which they are exposed,
but the way in which imitation was measured does not tell us anything about what exactly
within the continuous acoustic signal is imitated. This is a real gap in our knowledge. An
understanding of what is targeted in phonetic imitation is crucial as it reveals details about
the structure of linguistic representation in the mind. The primary goal of this dissertation
4
is to fill this gap. To do so, the experiment described in the subsequent chapters specifically
examines the imitation of vowels in the production of single words.
In the opening paragraph, I raised the question of whether a speaker consciously
switches between dialects, or whether this behavior is more automatic in nature. This
question relates to the second goal of this dissertation. In linguistics, describing a process
as social is often synonymous as describing the process as intentional. For example, take
style-shifting. Style-shifting is the process of changing ways of speaking according to social
context; your speech style is different when you are talking to a child, giving an oral presen-
tation, or casually chatting with friends. One approach to style describes it as a “controlled
device” employed in language use (Labov 2001a:85). Others have labeled language as a
“fairly low-level process” while the social meaning it is imbued with is subject to “conscious
manipulation” (Eckert 2001:124). It is my goal to test the hypothesis that social linguistic
behaviors are automatic as opposed to conscious efforts used to convey social meaning,
although that type of social act does, of course, take place in the process of verbal social
interaction. To do this I use race as a social variable. Through the experiment described in
the following chapters, I show how implicit measures of racial bias predict speech behavior.
To do so, I use what is called an Implicit Association Task (IAT). The IAT, first described
in Greenwald et al. (1998), is a standard tool used in social psychology. It is a task that
uses reaction time in category classification to measure implicit biases. In using the IAT in
language research, we are able to tap socialized racial attitudes to see how they influence
speech behavior.
The two major goals of this dissertation are to demonstrate that (1) talkers accom-

5
modate to the vowels of a model talker in a spontaneous imitation task, and (2) automated
social behavior affects the degree of imitation. To achieve this, an auditory naming task
was conducted (Goldinger 1998, Namy et al. 2002). White participants were exposed to
single word productions from either a Black talker or a White talker; their task was simply
to identify each word by saying it out loud. Participants were randomly assigned to either
the Black talker or the White talker; they were also randomly assigned to either a condition
with a still digital image of the talker (the Social Conditions) or a picture-less condition (the
Asocial Conditions). Upon completing the speech production task, participants completed
an IAT that measured their Black/White bias. The details of this task are reported in
Chapter 3.
This dissertation will also contributes to a debate within the study of speech
accommodation. The two main theories about linguistic accommodation differ with respect
to the primary motivation for imitation. One theory states that imitation serves a social
function. Under this theory, speakers of language use it to modulate social distance by
converging or diverging their speech patterns (Shepard et al. 2001). The other theory
describes imitative behavior as automatic and uncontrolled (Goldinger 1998, Trudgill 2008,
Pickering and Garrod 2004b). In this dissertation I demonstrate that vowel imitation is
selective from both a phonetic and social perspective, but that this selective behavior is
automatic and uncontrolled.

6
1.2 Accommodation in non-linguistic behavior
One of the most interesting aspects of phonetic imitation is that convergent behav-
ior is not limited to speech communication, but is a fundamental aspect of human behavior.
People imitate one another in behavioral modes other than language. The purpose of this
section is to situate the study of language accommodation within the larger study of human
behavior.
It is common knowledge that yawning is contagious. In a number of articles,
Bargh and colleagues (Chartrand and Bargh 1996, Dijksterhuis and Bargh 2001, Bargh and
Williams 2006) argue that such processes of behavioral imitation are part of an automatic
perceptual-behavioral link that is, crucially, mediated by social factors. Chartrand and
Bargh (1996:893) posit that behavioral convergence fosters positive feelings between inter-
actors and functions as a social adhesive for creating and maintaining social relationships.
In a series of experiments, the authors investigated how interacting partners mimic subtle
movements like facial expressions, foot shaking, and face rubbing in the absence of a common
goal. Chartrand and Bargh found that facial expressions were imitated to a large extent
while face rubbing and foot shaking tended to converge yet remained insignificant statis-
tically. In the second experiment, subjects rated their partner as more likeable and rated
the interaction as having gone more smoothly when the partner mimicked their actions.
Finally, the third experiment examined why select individuals mimic partners’ behavior to
a greater extent than others. Participants were administered an empathy test that reveals
the effect of an individual’s level of “cognitive, perspective-taking component of empathy
and not the emotional, empathic-concern facet” on behavioral convergence (p. 904). Par-

7
ticipants who scored in the top half of the perspective-taking empathy test mimicked more
behaviors than those who scored in the lower half.1 The results of the empathic-concern test
had no effect on the behavior of the participants. The authors conclude by predicting that
members of different cultures (collectivist vs individualist cultures) should have different
levels of behavioral mimicry.
The automaticity and innateness of the perception-behavioral link is highlighted
in Dijksterhuis and Bargh (2001). Behaviors are imitated because of the way they are
mentally represented; in Bargh and Williams (2006), this mental representation is argued
to be an automatic cognitive reflex associated with the activation of mirror neurons. It
is reasoned that people share with other animals the basic perceptual mechanisms that
connect directly to our behavioral representations. The only difference, argue Dijksterhuis
and Bargh (2001), is that higher-level primates have developed further brain functions that
can mediate and inhibit the perceptual-behavioral link. This means that social knowledge
may be the inhibitor of imitation and not the facilitator. In other words, the default
behavior may be imitation, but a social reason not to perform behavioral convergence
may prevent it. Dijksterhuis and Bargh go on to argue that the strength of the link is
mediated by disincentives and obstacles that conflict with goals and purposes, self-focused
attention, and liking. Self-focused attention eliminates the amount of attention given to
others in the environment and inhibits the imitative reflex of the perceptual-behavioral
link. If participation in a mimicked activity would cause harm of prevent the attainment
of goals, the link is inhibited. The most simple mitigating factor is liking. The implication1Empathy has also been shown to improve an individual’s ability to reproduce detailed aspects of a
second language (Taylor et al. 1971). They suggest that empathy may be related to an individual’s generalperceptual abilities.

8
of this factor is clear. If an individual has social bonds with a particular interlocutor or
enjoys the behavior one is witnessing, it is more likely that the individual will engage in the
perceived behavior.
What is perceived, however, is not always part of physical reality. Three types
of perception are considered “natural and automatic”: observables, trait inferences, and
social stereotypes (Dijksterhuis and Bargh 2001:9). Observables are what we perceive;
that is, we can only perceive the information observed by the senses. The concept of
perception is further complicated in the case of the perception of social stereotypes where
what is perceived is an automatic generation of characteristics associated with the activated
stereotype. Trait inferences are not part of the perceptible environment, but are the traits
associated with the perceived action. The types of observable percepts and the factors
that inhibit or facilitate the perceptual-behavioral link posited in this literature have direct
correlates in speech and have the potential to explain many speech perception patterns.
There is considerable evidence in studies of speech perception that support these claims
(for examples see Johnson and Strand 1996, Johnson et al. 1999, Niedzielski 1999, Hay et
al. 2006a,b).
1.3 Outline
This first chapter serves to present the themes of this dissertation and to contextu-
alize them within the study of linguistics and human behavior more broadly. In Chapter 2,
the focus turns to accommodation in speech, especially at the phonetic level. Chapter 2 of
this dissertation reviews a wide array of literature on, perhaps, seemingly disparate topics.

9
Chapter 2 covers not only previous research on phonetic imitation, but also a discussion
of possible mechanisms that may account for and explain why accommodative behavior
exists in language. Traditional work in sociolinguistics, particularly dialect change, is also
reviewed. This literature is important for two key reasons. One simply relates to the vari-
able nature of the speech signal. Users of language select from a pool of variants, both in
speech production and speech perception. This selection is based on socially meaningful
contextual information. Second, as noted in the opening paragraph, dialect change is essen-
tially long-term accommodation to new speech patterns. Therefore, the descriptive work on
what changes in the course of dialect shift is important in terms of predicting how research
participants will respond in an experimental paradigm.
Chapter 3 describes the methodology used for the lexical shadowing task and
the Implicit Association Task (Greenwald et al. 1998). The aim of the experiment is to
investigate imitation in vowels and to understand the role of social information in the
process. The lexical shadowing task is similar to that of Goldinger (1998) and Namy et al.
(2002). In brief, in this type of task participants read words aloud in a pre-task test. This is
followed by the shadowing blocks where participants hear a model talker produce the same
words from the word list; the participants’ task is to identify the words by saying them
out loud. Finally, participants provide post-task productions by reading the same words
from the pre-task test again. Phonetic accommodation is determined by examining how
the shadowed productions and the post-task productions – those subsequent to exposure to
the model talker – have changed compared to the pre-task productions. The model talker
voices are those of either a Black talker or a White talker, both male speakers of California
10
English.
There are three novel methodological contributions in this dissertation discussed
in greater depth in Chapter 3. The first novel methodological step is the use of visual
information in the shadowing task. In two of the conditions, participants are presented with
the audio of a talker, along with a static image of the talker whose voice they are exposed to.
The second methodological contribution comes from the fact that the expressed intention
of this dissertation is to examine imitation in vowels. As such, the AXB task which has
been a standard practice for determining imitation (Goldinger 1998, Namy et al. 2002, Pardo
2006) cannot be used. This dissertation uses the Euclidean distance between a participant’s
production and the model talker’s production to measure the amount of imitation. The
difference in the Euclidean distances between pre-exposure productions (the Pre-task) and
post-exposure productions (Shadowing and Post-task) is calculated to determine how much
a participant changed their vowel productions as a result of auditory exposure to the model
talker. The third methodological step involves the integration of social psychology tools into
linguistic research. As described in detail in Chapter 3, participants completed an Implicit
Association Task that measured their racial bias. The other social measure collected was
participants’ perceptions of the attractiveness of the talker to which they were exposed.
Both IAT scores and the Attractiveness ratings were used in the statistical analysis of the
speech production results.
A description of the statistical modeling of the data can be found in Chapter 4,
along with the results of the experiment and a discussion of the findings. The data were fit
to mixed effects models, and subsequent analyses of variance further investigated the results.

11
The main findings were that participants did imitate talkers’ vowels, and that this phonetic
convergence was selective both phonetically and socially. In terms of phonetic selectivity,
female participants imitated the low vowels /A/ and /æ/, while male participants imitated
/A/ and /æ/ the most, and to some extent they also imitated /o/ and /u/. Social selectivity
was also found. For both male and female participants, those who scored with less of a pro-
White bias on the IAT were more likely to converge on the vowels of the Black talker. The
results with the Attractiveness ratings were mixed. Female participants were more likely
to imitate when they rated the talker as attractive. However, for the male participants,
the less attractive they found the talker, the more likely they were to imitate. Chapter 4
finishes with a discussion of the results and proposes a theory to account for these data.
In short, I argue that participants are making use of word-level production variants that
already exist within their repertoire. This theory accounts for the phonetic specificity; see
Chapter 4 for the details of this argument.
In the concluding chapter I review the findings presented in Chapter 4 and the
explanation for the results. Chapter 5 also includes a presentation of the empirical and
theoretical questions raised by this work. The implications gleaned from this work for
phonetic theory, sociolinguistics, and psycholinguistics are summarized separately.
12
Chapter 2
Background
This chapter provides the theoretical and empirical background to the disserta-
tion experiment. Section 2.1 begins the chapter with a discussion of work on dialect contact
and dialect change, from both the sociolinguists’ perspective and that of phoneticians and
laboratory phonologists. Research on phonetic accommodation in the lab is reviewed in
Section 2.2. Experimental approaches from both social psychologists and more traditional
phonetics research are addressed. The divide between these two camps reflects the debate
surrounding the primary motivation for imitation; this debate is also presented in Section
2.2. Section 2.3 is about variation in speech and the role it may play in phonetic accom-
modation. The final section of this chapter, Section 2.4, summarizes key points from this
chapter. Throughout this dissertation, I evaluate the extent to which social cognition may
play a role in accommodation, and this will be a clear theme in this chapter.
13
2.1 Phonetic accommodation in the real world
Before reviewing research that explicitly sets out to explore speech accommoda-
tion in a lab setting, it is important to briefly discuss work on dialect acquisition and new
dialect formation since dialect acquisition can be understood as a longterm exercise in lin-
guistic accommodation. Research in dialect contact has long grappled with issues of speech
convergence and accommodation. There are large methodological differences between some
of the earlier work that addressed these issues and the most recent experimental work, but
the results are consistent. In most cases, over time a talker will begin to sound more like the
talkers of the new dialect, losing elements of the original dialect. While the work on dialect
contact and dialect acquisition may not directly address the socially mediated process of
phonetic accommodation, it is important to briefly visit the topic as any theory or model of
phonetic accommodation must be able to reconcile the facts surrounding dialect acquisition
and the purported difficulties in succeeding completely.
Trudgill (1981, 1986:11) argues that dialect accommodation will take place when
a linguistic variable is highly salient and considered a marker. A marker is a linguistic
variable that is used by speakers in both sociolinguistic and stylistic variation to mark
social meaning. Markers contrast with indicators which are used only as a sociolinguistic
variable and are below the level of consciousness (Labov 2001b:196). Thus, markers are
the salient linguistic elements which are adopted in dialect acquisition. Trudgill (1986:11)
claims that increased awareness of markers arises when a variable is one of the following:
highly stigmatized, involved in an ongoing sound change in a dialect, phonetically distant
from a variable that shares its distribution, or maintains a phonological contrast that has

14
been obliterated in the contact dialect.
In dialect contact, it is agreed that lexical convergence takes place first, as the main
motivator in dialect convergence is the desire to be understood (Trudgill 1981, 1986). Trudg-
ill, however, emphasizes the phonetic nature of dialect accommodation involving sound
patterns:
The point is that during accommodation speakers do not modify their phono-logical systems, as such, so that they more closely resemble those of the speak-ers they are accommodating to. Rather, they modify their pronunciations ofparticular words, in the first instance, with some words being affected beforeothers. Speakers’ motivation, moreover, is phonetic rather than phonological:their purpose is to make individual words sound the same as when pronouncedby speakers of the target variety. (emphasis in original; Trudgill 1986:58)
This claim is supported by evidence from Trudgill himself (Trudgill 1981), Payne
(1980), and Chambers (1992). Payne (1980) examines the acquisition of the dialect spoken
in King of Prussia, a suburb of Philadelphia, by three groups of children. The children
had recently moved from either New York City, the Northern Cities dialect area, or a third
dialect area known for tensing /æ/ only before nasals. In the study all of the children
were able to acquire new phonetic forms that simply involved moderately adjusting their
articulation, although children aged 10 to 14 demonstrated difficultly in acquiring the en-
tire new system. All of the children, however, experienced great difficulty acquiring more
complicated phonological rules, namely the behavior of /æ/ in different consonant environ-
ments. Payne showed that children from the Northern Cities area were most successful at
acquiring the /æ/-tensing rules because, compared to the other children, they had to do
the least amount of restructuring of their existing /æ/-tensing rule. Families differed in the
extent that the children, regardless of the age they moved to King of Prussia, acquired the
rules. It should also be noted that even some children who were born in King of Prussia to

15
out-of-state parents never acquired the /æ/-tensing rules like a native speaker of the dialect
with native dialect speaking parents.
Along the same lines, Trudgill (1981) presents data illustrating that children who
move to Norwich from a different dialect area accommodate phonetically to new sounds,
but fail to make phonological changes to their inventories. The same pattern of dialect
acquisition holds for children who are born in Norwich, but have non-Norwich parents. An
example of a phonological change that incoming children fail to acquire is the merger of
Middle English /u:/ and /2u/. These sounds have merged in most varieties of British En-
glish as /oÚ/ resulting in homophony between nose and knows. In Norwich English these
words belong to two different lexical classes, retaining the distinction from Middle English.
Children who move to Norwich are unable to keep these lexical classes distinct. Trudgill
(1981) also refutes the claim made in Giles (1973) that style-shifting in sociolinguistic inter-
views is caused by accommodations made to the interviewer by the interviewee. Trudgill,
a native of Norwich, reveals that he actually accommodated toward his interviewees with
respect to glottal variants for /t/; he used fewer glottal variants than the lowest class par-
ticipants and more than the two highest social class subjects. Glottal variants of /t/ are
associated strongly with lower class speakers in Norwich. The fronting and backing of /A/ is
an indicator in the Norwich community. Upon examination of his /A/ production, Trudgill
was able to show that his sound did not fluctuate as a function of the interviewee. This is
evidence that accommodation only occurs with segments that are socially salient markers
of identity, which /t/ is but /A/ is not.
Again, Chambers (1992) finds the same result: children who move into new di-

16
alect zones struggle to fully acquire complex phonological patterns. Chambers followed
the dialect acquisition process for six Canadian children aged 9 to 17 who have moved to
southern England. The children adopted phonetic features of the dialect prior to acquir-
ing phonological features. Acquisition abilities greatly increased as the age of the child
decreased.
Traditionally, research on dialect contact and acquisition has remained agnostic
regarding the mechanisms and motivations for accommodation. Recently, however, Trudg-
ill (2008:252) argued that “accommodation is not only a subconscious but also a deeply
automatic process.” He reaches this conclusion after reviewing four cases of European lan-
guages forming new varieties as a result of dialect contact and he discards the theory that
new dialects arise as a result of the formation of new national identities:
...if a common identity is promoted through language, then this happens asa consequence of accommodation; it is not its driving force. Identity is nota powerful enough driving force to account for the emergence of new, mixeddialects by accommodation. It is parasitic upon accommodation, and is chrono-logically subsequent to it (Trudgill 2008:251).
It is striking to see Trudgill, a traditional sociolinguist, eschewing social factors as
a palpable force in language change. Citing work on behavioral imitation, Trudgill connects
linguistic convergence with all types of behavioral accommodation. While it might be ap-
pealing to automatically lump speech behavior with other physical human behaviors, it has
yet to be demonstrated that linguistic accommodation is automatic. Trudgill’s claim has
been extensively criticized (Bauer 2008, Mufwene 2008, Tuten 2008, Schneider 2008, Coup-
land 2008, Holmes and Kerswill 2008). For example, there are instances where individuals
have lived for a considerable amount of time in a new dialect area without accommodating
greatly (Bauer 2008).
17
Trudgill’s hypothesis makes a prediction that is testable: if linguistic accommo-
dation is automatic, it should not only be demonstrable in the laboratory, but everyone
should do it. The topic has become of great interest to phoneticians and psycholinguistics
as well. Basically, the way in which a talker’s productions can change through interactions
and experiences raises many questions about the representation of language, particularly
the variation in our phonetic repertoires.
Phoneticians and laboratory phonologists have also examined dialect change. In
a study of dialect change of Canadians living in Alabama, Munro et al. (1999) found that
Canadians living in Canada perceived the speech of Canadians living in Alabama as some-
where between that of Canadians in Canada and native Alabamans. While there was
considerable individual variation among the Canadians in Alabama that was somewhat re-
lated to the length of residence, their speech had generally accommodated to the speech of
Alabamans. Impressionistic coding of the data revealed that the level of monothongization
of the vowel in words like ‘wife’, ‘good-bye’, and ‘driving’ indicated the perceived regional
identity of the talkers.
Both production and perception in new dialect exposure were examined by Evans
and Iverson (2007). Nineteen college students from a northern English dialect (Sheffield)
were interviewed at the commencement of university studies, three months after the begin-
ning of studies, after one year of study, and after two years of study at a southern English
university where Standard Southern British English (SSBE) was spoken. Of particular in-
terest in this research was the behavior of the vowels in bud, cud, and bath. SSBE has
/2/ in bud and cud and /a/ in bath. Northern varieties of English use the vowel /U/ for

18
bud and cud and /A/ for bath. Acoustic analyses revealed that bud and cud became more
centralized. In the northern dialects, cud and could are homophonous with each other; both
have the vowel /U/. Could has this vowel in the southern dialects, but cud has /2/. In-
terestingly, after their time at the university, the participants began to centralize the vowel
for could as well. Participants were also rated on a ten-point scale from ‘very northern’
to ‘very southern’. While overall participants were rated as sounding more southern after
their time at the university, one participant was rated as more northern-sounding after the
two years and the ratings of three participants did not change. Despite these changes in
production, there was no overall change in the position of participants’ perception based on
an examination of their best exemplar locations, although participants who were rated as
having maintained a more northern accent did in fact choose more northern exemplars.
A series of studies have focused on longitudinal changes within the speech of a
single speaker over a fifty year span. Harrington (2006, 2007) and Harrington et al. (2000a,b)
have analyzed vowel changes in the speech of the Queen Elizabeth II. The recordings under
analysis were her yearly Christmas broadcasts from 1952 through 2002. After accounting
for maturational changes in the vocal tract, this work has demonstrated that the Queen’s
vowels are shifting in the direction of Southern British English and away from Received
Pronunciation. This is potentially due to the increased exposure the Queen may have to
Southern British English as a result of changes in British class structure (Harrington et al.
2000a).
An important recent study by Delvaux and Soquet (2007) examined shifts by
French female speakers of the Mons dialect of Belgian French (n = 8) to the Liege dialect
19
of Belgian French female model talker. In their experiment, Delvaux and Soquet measured
the duration and mel-frequency cepstral coefficients (MFCCs; Davis and Mermelstein, 1980)
for /o/ and /E/, two vowels whose realizations differ across the two regiolects of Belgian
French. In these two dialects of Belgian French the formant values of the mid-back vowel
vary (/föigo/, Mons: [föigo], Liege: [föigO]) and the duration of /E/ varies (/kEs/, Mons:
[kEs], Liege: [kE:s]). Target words containing the key phonemes were elicited in a sentence
production task. Discriminant analysis were used to determine the patterns of accommo-
dation to the Liege dialect. Mons speakers imitated the model talker based on the MFCC
measures and duration of both /o/ and /E/ which means both dialect markers – duration
of /E/ and spectral information for /o/ – and non-dialect or talker-specific acoustic markers
– duration of /o/ and spectral information of /E/. The effect diminished but still per-
sisted into a post-task production test. This demonstrates what the authors call mimesis
since exposure to the model talker left a memory trace that influenced production in the
post-task.
It is challenging to account for all types of accommodation strategies in studies
of dialect contact because of the varying desires for incomers into a new region regarding
assimilation, community acceptance, and identity maintenance. Research on dialect accom-
modation does, however, illustrate that phonetic convergence may target more salient social
linguistic variables and affect words that vary little phonologically from a talker’s native
dialect representation. Research on languages and communities in contact is highly relevant
to studies of phonetic imitation as it describes data and makes predictions about what does
or should happen when sound systems come into contact.

20
2.2 Phonetic Accommodation in the Laboratory
In this section I summarize previous research which demonstrates that phonetic
accommodation happens in a lab setting. In doing so I broadly describe two theories about
linguistic accommodation that differ with respect to the primary motivation for imitation.
One theory states that imitation is primarily for social purposes. The main framework
within this perspective is Communication Accommodation Theory. This theory is fleshed
out in the following section, but it basically states that users of language converge and
diverge so as to manipulate the social distance between themselves and their interlocutors.
The other theory essentially accounts for imitation in stating that it is an automatic conse-
quence of linguistic representation. The automatic theory is like that espoused by Trudgill
(2008), described above in Section 2.1. Exemplar-based theories are popular mechanisms
used to account for the data. These two theories – the social and the automatic – both make
similar predictions for phonetic accommodation, but are attained by different mechanisms.
2.2.1 Communication Accommodation Theory
Communication Accommodation Theory (CAT; formerly referred to as Speech Ac-
commodation Theory) was developed by a team of social psychologists – namely Howard
Giles and colleagues – as a response to Labovian-style explanations of speech variation that
looked solely at time and context to explain patterns in linguistic behavior (Giles 1973).
CAT develops from the idea that speech convergence phenomenon are motivated by an indi-
vidual’s “often” subconscious motivation to be socially accepted or identify with a particular
social group (Giles and Coupland 1991:71-72). More recent renditions of communication

21
accommodation theory have not changed this viewpoint; Shepard et al. (2001:33-34) posit
that both social and cognitive processes affect linguistic behavior and that individual mo-
tivation is the driving force behind speech behavior. Language is, therefore, a tool used by
speakers to achieve the ideal social distance between themselves and others.
According to CAT, communicators can adopt any one of four accommodation
strategies in speech: convergence, divergence, maintenance, and complementarity. Talkers
who modify their speech to reinforce valued and socially meaningful differences between
themselves and their interlocutors are invoking the complementarity strategy. For example,
Shepard et al. (2001:35) find that men employ more masculine speech patterns when talking
with women than when talking with men. Maintenance occurs when neither member of a
pair of talkers modifies their language use in reaction to the other speaker. Divergence is
the result of speakers maximizing their linguistic distinctiveness to separate themselves so-
cially from their fellow interlocutor. Convergence arises when speakers alter their linguistic
patterns to adopt styles more like that of their interlocutors (Shepard et al. 2001:35).
These strategies provide a framework for how individuals may behave in commu-
nication situations. CAT has been informed by myriad studies on communication behavior
with only a small minority constituting what could be considered phonetic or phonological
investigations. In fact, the scholars who have developed CAT are generally not linguists and
have actually been criticized for working with language while not understanding linguistics
(Trudgill 1981). The studies reviewed here are those that are most relevant to more contem-
porary work on phonetic convergence and the implications it has for current sociolinguistic,
phonetic, and psycholinguistic theories. Less focused summaries produced by Giles and col-

22
leagues are an excellent resource for those who are interested in accommodation strategies
in the broader context (Giles and Coupland 1991, Giles et al. 1991, Thakerar et al. 1982,
Shepard et al. 2001).
Giles (1973) set the stage for the formulation of accommodation theory when he
argued that sociolinguists’ speech was driving style-shifting in sociolinguistic interviews.
He demonstrated the effect interviewers had on their interviewees by conducting interviews
with 13 working class boys in their late teens. Giles, a speaker of Received Pronunciation,
and a 17 year-old Bristol speaker served as the interviewers. The same topic was discussed in
both interviews. Two groups of listeners – 18 Bristol-born adults and 18 Welsh-born adults
– were presented with the voice of a participant taken from both interviews. Welsh listeners
were more sensitive to participant changes in accent conditioned by interviewer. They
were more accurate in identifying accent differences than the Bristol listeners. Crucially,
even though the social situation was highly similar across interview contexts, participants
imitated the speech of the two interviewers to different extents. Giles proposed that, in
general, the interviewee attempted to standardize his speech for social approval.
Accommodating to the speech of a conversational partner can affect how a talker is
evaluated socially. This has been shown in a French Canadian community (Giles et al. 1973).
The perceived cultural gap was reduced and speakers were judged to be more considerate
when French and English Canadian bilinguals attempted to speak English to an English-
dominant listener group. By accommodating to the linguistic needs of English-dominant
listeners, bilingual speakers were evaluated more favorably. The English-listeners returned
the perceived favor by attempting to speak in French in a later task.

23
In a less bilingual community, accent convergence and divergence was found for
different groups of Welsh-born adults in Bourhis and Giles (1977). Welsh is an endangered
language spoken by about half a million people in Wales. A group of Welsh adults who
attended both Welsh language and Welsh culture classes were found to diverge from an
out-group English speaker by adopting a Welsh-accented English dialect. The English
interviewer had questioned the vitality and function of the Welsh language in modern day.
The second group of Welsh adults participating in the experiment also attended Welsh
language classes, but only on business time with the explicit goal of furthering their careers.
These adults were found to converge with the English interviewer. The perceived changes
in the accents of the adults were determined on an 11-point scale by two judges who were
not linguistically trained and naive to the experiment1.
Despite the longstanding view of social factors influencing convergence within
CAT, early models of exemplar-based theories of speech perception suggested that pho-
netic convergence phenomena are an automatic cognitive reflex of the system (Goldinger
1998) as opposed to being socially motivated. While there does exist some evidence for the
automaticity of this reflex, it becomes clear as we review work below that a talker’s social
knowledge and desires mediate the strength and nature of convergence in language.
2.2.2 Laboratory phonology and exemplar-based models
This section is roughly divided into sections based around authors that considered
exemplar models and those that did not. Several of those that did not consider exemplar1Babel (2008) attempts to replicate the Bourhis and Giles study using New Zealand and Australian
Englishes. This study is discussed in more detail below.

24
theories (or any particular linguistic theories, for that matter) were studies conducted in a
discipline outside of linguistics (like sociology and psychology).
Phonetic convergence without exemplar models
Research on phonetic convergence has used several different methodologies over
the years to determine the degree and direction of accommodation. Only recently have
studies begun to explore the segmental effects of phonetic imitation (Shockley et al. 2004,
Nielsen 2008, Pardo In press). The earliest studies examined broader acoustic measures and
relied more on perceptual judgments from listeners. Earlier studies also considered the psy-
chological and social factors that affected the direction of talkers’ convergent or divergent
behavior. Natale (1975a) examined convergence of mean vocal intensity between interacting
partners in two experiments. In the first experiment, twenty-one male subjects conversed
one-on-one with the interviewer; the subject and experimenter were not visible to one an-
other. The intensity level of the interviewer was instrumentally manipulated three times
through the course of the experiment. Subjects generally converged toward the intensity
level of the interviewer, but there were a fair amount of individual differences. The second
experiment explored intensity convergence in conversations between 50 same-sex dyads who
could not see each other. Prior to participation, participants completed the Marlowe-Crown
Social Desirability test (Crown and Marlowe 1964), which evaluates an individual’s desire
to be accepted by society. Dyads met for three conversations, each separated by one week.
Mean vocal intensity was determined by the average of the peak-recorded intervals every ten
seconds. Convergence was measured as a reduction in the difference in mean vocal intensity
for a dyad between participants. Individual subjects’ scores on the social desirability test
25
were positively correlated with their contribution toward their dyad’s convergence. The
effect of convergence was longitudinal and cumulative; that is, over time subjects converged
more. In another study, Natale (1975b) investigated convergence of temporal patterns in
speech. Thirteen same-sex conversational dyads were recorded on two occasions. Partici-
pants completed the Marlowe-Crown Social Desirability test before engaging in the dyadic
conversations. Regression analysis demonstrated that a participant’s score on the social
desirability test predicted the extent to which they converged with their interlocutor. Inter-
estingly, this result was only significant for the second conversation. Increased familiarity
and social engagement with a conversational partner prompted convergence of temporal
patterns, but the convergence was not immediate.
More recently, Carahaly (2000) examined the ability of listeners to identify the
sexual orientation of 40 talkers in two conversational contexts. In one context, participants
talked with a same-sex straight conversational partner, while in the other context had a
same-sex gay conversational partner. Participants were aware of the sexual orientation of
the conversational partner before recording. In the listening task, participants rated the
talkers’ sexual orientation, among other personal attributes. Listeners were most accurate
in identifying the sexual orientation of a talker in the context of the gay partner. Although
Carahaly does not discuss her results in terms of phonetic accommodation, her finding
suggests a possibility: in the gay partner context, gay interviewees were converging and
straight interviewees were diverging from the speech style of the interviewer to modify
social distance.
Gregory and colleagues have conducted a series of investigations that explore
26
how convergence affects the quality of a conversation. Gregory and Hoyt (1982) used five
archived one-on-one conversations between Gregory and men stationed at an air force base.
The topic of conversation was race relations in the air force. From each conversation ex-
cerpts were taken from both the interviewer and the interviewee. Intensity, pause duration,
pause frequency, turn-taking duration, and turn-taking frequency were measured. The re-
sults illustrate that conversational partners converge toward each other. Gregory and Hoyt
note that the conversation with the lowest levels of convergence was filled with misunder-
standings and miscommunication. They conclude that “cultural homogeneity facilitates
adaptation” in conversations (p. 43).
Using 12 interviews from the same corpus of conversations and an additional 11
interviews from an Egyptian Arabic database, Gregory et al. (1993) examined convergence
in F0 across dyads. Long-term-average spectra (LTAS) were averaged from selections taken
from the conversations. Gregory, Webster, and Huang predicted that fundamental fre-
quency was the acoustic component on which talkers would converge and, therefore, with
their set of male talkers, they examined only acoustic information from a 62 to 192 Hz
band. The method of analysis used correlation coefficients to compare actual and virtual
conversations to one another. For both the American English and Egyptian Arabic data
sets, actual conversations had significantly higher match scores than the virtual pairings,
indicating that convergence had occurred. The American English interviews were subject
to another task. Listeners were asked to rate various qualities of the individuals participat-
ing in the interviews and the caliber of the interview itself. Each listener heard only one
interview, evaluating the interviewer, interviewee, and interview on a 7-point scale using

27
34 different indices. The indices were divided into three semantic sets: evaluation (e.g.,
important/unimportant), potency (e.g., loud/soft), and affect (e.g., constant/erratic). A
MANOVA examined the relationships between the semantic characterizations of the in-
terviews and the convergence scores. The three interviews with the highest correlation
scores had significant results for the potency factors; the averaged spectra from the inter-
views correlated with the potency ratings. Listeners rated interviews more favorably when
convergence occurred.
Convergence of talkers’ F0 was examined again by Gregory and Webster (1996)
using 25 interviews from the Larry King Live television program. Using the same method as
Gregory et al. (1993), Gregory and Webster found that F0 convergence took place between
King and all 25 of his interviewees. In this investigation the researchers explored the
direction of the convergence; that is, whether King was accommodating to his guests or
whether the guests were converging toward King. The social status of the guest was used
as a variable with the hypothesis that King would accommodate toward high status guests
while lower status guests would accommodate to him. The amount of variation in F0, grossly
calculated as the standard deviation, was taken for each talker and entered into a factor
analysis. Gregory and Webster’s hypothesis was borne out: King accommodated toward
guests with high social status and less with those with lower status. The results from the
F0 data illustrate that Larry King modulates his F0 less when he is interacting with talkers
of a lower social status.2 In a third experiment undergraduate students compared the social
status of the 25 guests to determine how the perceived prestige of the guest compared with2Of course, since this is a nationally aired television show all of the guests are of rather high status.
But, for example, Dan Quayle and Garrison Keillor were on the lower status end with Mike Wallace andElizabeth Taylor on the higher end based on King’s convergence level.
28
the convergence patterns. Students generally appeared to have the same social judgments
as Larry King. The results suggest those perceived more favorably by students were the
talkers Larry King accommodated to.3
Gregory et al. (1997) examined how filtering the audio signal influences talkers’
ability to converge and engage in quality conversations. Thirty pairs of talkers were placed
in different rooms and given the task of completing a game together. During the task, the
speech of a single member of each of the pairs was either high-pass filtered at 550 Hz, low
pass filtered at 1000 Hz, or unaltered. Their conversational partners heard filtered speech in
the high- and low-pass conditions, but the researchers recorded unfiltered speech from both
participants. Long-term average spectra matching routines were executed on the recorded
files. Convergence was found in the unfiltered and low-pass filter conditions. No convergence
was found in the high-pass condition where the frequency region for F0 had been removed.
Groups of listeners rated the conversations for quality using the indices in Gregory et al.
(1993). Generally, judgments were more negative for conversations that had been filtered,
although the low-pass group did receive slightly more favorable ratings than the high-pass
group. Gregory et al. (1997) illustrate that low frequency energy plays a significant role
in phonetic convergence and that listeners use this information to evaluate the quality of a
conversation.
Using a modified version of the same experimental design as Gregory et al. (1997),
Gregory et al. (2001) sought to determine how visual information influences convergence of
talkers’ F0. One group of pairs was given the opportunity to monitor their conversational3It is likely that the strength of the social perception results would have increased if Larry King had
made the explicit social judgments. It seems unlikely that undergraduate college students would have thesame opinions of individuals as Larry King would.

29
partner over the visual channel while the control condition was limited to oral communi-
cation. In this set of experiments, members of a conversational pair are in different rooms
but are hooked up to closed-circuit television that enable them to see their interlocutor. In
addition to calculating F0 convergence in the high-pass filter, low-pass filter, and unfiltered
conditions, experimenters counted the frequency and durations of looks to the television
monitor. Analysis of long-term average spectra of the conversational partners found pho-
netic convergence for the low-pass and unfiltered pairs. Researchers found that the filtered
participant in the high-pass filter group looked up less than the unfiltered partner. Gregory
et al. (2001) reason that the filtered partner is likely attempting to accommodate their
speech, but because the partner in not hearing the talker’s fundamental frequency, he is
not responding to the attempted accommodation strategy. In turn, this causes the filtered
talker to become submissive and self-conscious. Using a factor analysis with a measure of
F0 variance as in Gregory and Webster (1996), the researchers determine that the unfiltered
partners in the high-pass condition behave more dominantly with less F0 variation. Finally,
listeners rated the audio of the interactions. Listeners rated conversations with the visual
channel with fewer social/emotional ratings than the conversations from the audio-only
condition.
The results from the two Gregory et al. experiments regarding the lack of con-
vergence in high-pass filtered speech is curious. Gregory and colleagues were apparently
unaware of the missing fundamental frequency phenomenon, as it is presumed that the
missing F0 information was what accounted for the lack of convergence. Listeners – hu-
mans, cats, and other creatures – are, however, able to calculate fundamental frequencies

30
from the harmonics of the audio signal despite the actual frequency region of the funda-
mental being removed. So what explains the lack of convergence? It is possible that by
removing important acoustic and linguistic information with the high-pass filter, talkers
were no longer as engaged with their fellow talker because the conversation felt less natural.
Or, perhaps, calculating the missing F0 interfered with talkers’ abilities to converge because
of asynchronies in perceiving, processing, and planning speech routines. At any rate, it is
interesting to note that the absence of information below 500 Hz effectively prevented talk-
ers from converging in two of these experiments. Although it certainly cannot be concluded
that F0 is the only aspect of the speech stream that is involved in phonetic accommodation.
Lastly, gendered patterns of linguistic convergence were considered by Bilous and
Krauss (1988). In this paper, they test the stereotype that men always dominate women
in conversation by exploring the conversational patterns of same-gender and mix-gender
dyads. In single-gender dyads, women interrupted more often, but in mixed-gender dyads
they accommodated their interruption level to that of the men. Men had longer utterances
in single-gender dyads, but converged below the level of women in the mixed-gender dyads.
In terms of number of pauses, men had more in single-gender dyads than women, but fewer
in the mixed-gender condition. The frequency of back-channel talk and laughter was higher
for women in both mixed- and single-gender groups. Men converged toward women in
mixed-gender for the back-channel talk and laughter variables, but women also increased
the frequency of both in the mixed-gender conditions as well. These are the only two
variables where there is divergence by female talkers.
One salient aspect about the research reviewed in this section is that the data

31
under analysis were from spontaneous conversations. The type of analysis used to analyze
imitation at the utterance level is unable to focus in on particular words or segmental
features that may be the target of accommodation. In the following section we will review
imitation research that has focused on the word-level, bringing us down to a lower level of
linguistic representation.
Phonetic convergence within exemplar models
Early versions of exemplar-based models of speech perception predict that pho-
netic convergence is the automatic result of cognitive reflexes. Exemplar-based models posit
that detailed traces or linguistic chunks are stored during speech perception. This propo-
sition is backed by convincing evidence. It has been long known among phoneticians that
social information is encoded in speech (Ladefoged and Broadbent 1957) and it has become
increasingly recognized that social factors are integral components of talkers’ phonologies
as well (cf. Docherty and Foulkes 2000). Moreover, it has been shown that listeners re-
tain detailed talker-specific knowledge for further language processing. For example, in a
word recognition task, Palmeri et al. (1993) demonstrated that talker-specific information
was retained in long-term memory and used to determine whether words presented in the
experiment were ‘old’ or ‘new’. Goldinger (1996) presents copious amounts of data fur-
ther supporting this concept. In addition, he found that manipulating the subjects’ level of
processing (i.e., attention paid to stimulus) affected the level of detail in the memory traces.
A simple exemplar-based model that incorporates speech perception and produc-
tion functions as follows (see Pierrehumbert (2001, 2003) for a detailed presentation of these
ideas): Upon hearing a word, episodic traces associated by the talker voice or word are acti-
32
vated in memory. The more familiar a voice or the higher frequency the word, the higher the
number of activated traces because of increased experience. Goldinger (1997:46) clarifies,
“even if an exact match to the [word] exists in memory, all similar activated traces create
a ‘generic echo,’ regressing toward the mean of the activated set.” It is the mean of the
activated set that is selected for production. Goldinger’s theory clearly predicts that upon
hearing low frequency words or unique voices fewer traces will be activated with the end
result being more phonetic convergence in these contexts. Thus, from a memory systems
approach, Goldinger sees convergence as the inevitable result of an episodic lexical access
system, not as a social phenomenon.
To test this, Goldinger (1998) examined how word frequency and recency interact
in a lexical shadowing task. The methodology he developed in this experiment has been used
in subsequent work investigating phonetic convergence. Prior to participation, participants
read a word list composed of the words that would be used in the lexical shadowing task.
The words were divided into four sets: high, middle high, middle low, and low frequency. In
the task, participants shadowed words produced by a talker heard over headphones either
immediately in the immediate shadowing condition or at a delay of 3000-4000 milliseconds
in the delayed shadowing condition.4 After the task, participants were asked to read the
word list a second time. A group of listeners were recruited for an AXB similarity task
to determine the patterns of convergence. Goldinger found differences in the levels of4This type of immediate shadowing is different from the type of shadowing described in Marslen-Wilson
(1985). Marslen-Wilson draws a distinction between close shadowers (those who can respond before 300ms) and distant shadowers (those whose responses average over 500 ms). Goldinger’s participants wouldall fall into the distant shadowers group. What is remarkable about the group of close shadowers is thatthese talkers are able to commence articulation prior to perceiving the entire word. This demonstrates thatlisteners have continuous uptake of segmental information and that this information can be put into thespeech production mechanism very quickly.

33
phonetic convergence based on the lexical frequency of the shadowed word, the number
of repetitions presented over the course of the experiment, and the delay at which the
participant was instructed to utter the word. In the immediate shadowing condition, all
word types were judged to have converged for all talkers with increasing word frequency
inhibiting convergence. However, in the delayed shadowing condition, only middle low and
low frequency words showed convergence patterns. In a second experiment, listeners were
presented with non-words that varied in the number of times they were presented to simulate
word frequency effects. Non-word production converged in the immediate shadowing task
across all frequency levels, with infrequency non-words converging to the greatest degree.
The same pattern was found in the delayed condition although the degree of convergence was
not as strong as in the immediate shadowing condition. A third experiment also made use
of non-words, but varied the talker voice between the training and test sessions. Phonetic
convergence was detected by listeners in both same- and different-voice conditions, but
the same voice condition induced larger imitation effects in both immediate and delayed
shadowing conditions.
In another task, Goldinger and Azuma (2004b) revealed that effects of episodic
memory traces are activated in orthographic representations. In this experiment, partici-
pants read a word list composed of 160 words from four frequency groups. One day later
participants entered the training phase of the task where they heard four talkers produce
the words which were repeated a variable number of times. Upon hearing the word, they
had to match it to the same word on a grid on a computer. After one week participants
were invited back to re-read the word list. After the passing of another week, participants
34
were given a visual recognition memory test with the original 160 words and an additional
160 frequency matched items. A group of listeners completed an AXB classification task to
determine which token sounded like a better imitation of the target. The results illustrated
that recognition is best for low frequency words and increases with repetition. At twelve
repetitions, however, the frequency effects disappear and all words are equally recognizable.
Perceived imitation was strongest for low frequency words, but in this case the frequency
effect continued to increase with repetitions.5
To determine what aspects of the acoustic signal are converging, Goldinger (1997)
reports the results of a pilot study involving acoustic measurements. Average pitch, into-
nation, and word duration were measured. All participants deviated from their baseline
average pitch toward the pitch of the talker they were exposed to in the shadowing task. In
post-hoc analyses, Goldinger found that lower frequency words did indeed have more acous-
tic matching than higher frequency words. The interaction between frequency and recency
on phonetic convergence indicates that convergence is influenced by language processing at
a level apart from social factors.
By proposing that an odd or unfamiliar voice will activate fewer memory traces,
Goldinger implicitly acknowledges social factors may be involved in phonetic convergence.
The idea behind this is that an odd-sounding voice would not have as much competition
from the exemplars of other voices, allowing the population average to be dominated by the
presented token. But, the lack of social considerations in his model make Goldinger’s ear-
liest models of exemplar-based speech perception untenable. This obvious critique is made5This result suggests that spoken and orthographic language representations are stored jointly. How to
reconcile this finding with Caramazza’s (1997) proposal that independent lexemes exist for orthographicand phonological representations is well beyond the scope of this dissertation, but an interesting conundrumnevertheless.

35
by Magnuson and Nusbaum (2007). Magnuson and Nusbaum found that when acoustic
differences between two talkers were minimal – such as synthesized male voices with F0s
at 150 Hz and 160 Hz – listeners processed the two voices as a single voice and produced
no latency effects in a blocked talker trial unless they were explicitly told that there were
to be two voices. They argue that to account for this effect, along with previous research
findings illustrating that talker-specific characteristics can be retained in memory, we need
an analytic exemplar model that allows for active control in the perceptual system. They
suggest Johnson (1997) and Goldinger’s later exemplar model based on Adaptive Resonance
Theory (ART; Grossberg 1980), endorsed by Goldinger and Azuma (2003). Johnson (1997)
presents an exemplar-based model of speech perception that incorporates attention weights
into a formula that calculates auditory similarity prior to categorization. Goldinger and
Azuma (2003) illustrate the ease with which a speech perception unit can fluctuate be-
tween the syllable and phoneme by manipulating a participants’ expectations. The ability
to achieve such malleable perceptual events is modeled using ART.
ART is a neural and cognitive model that accounts for how the brain continues
to adapt and learn in a constantly changing environment (Grossberg 1999). The model is
formulated to account for both visual and auditory perception and is founded on pattern
behaviors displayed by neurons in the brain. Grossberg (2003) describes a process whereby
attention, expectations, and pre-learned stereotypes can influence speech perception. Reso-
nance states form when physical bottom-up acoustic information is matched with top-down
knowledge. Top-down knowledge consists of chunks at all levels of linguistic representation:
phoneme, word, or larger more sentential like phrases. Information in the bottom-up sig-
36
nal that does not match the higher level knowledge can be inhibited, thereby completely
ignored. Attention is focused on parts of the signal that have been previously learned
as important. This allows for language-specific bottom-up tracking which is necessary as
speakers of different languages attend to different cues in the acoustic signal (Wagner et al.
2006).
Using Goldinger’s paradigm, Namy et al. (2002) also investigated speech accom-
modation across men and women. This study probed whether men and women converge
in the presence of minimal social interaction. A stated purpose of the experiment was to
examine whether differences in perceptual abilities “operat[e] on the level of the perceptual
sensitivity to indexical features” (p. 424). The methodology of this experiment followed
the protocol used in Goldinger (1998). Four talkers (2 male, 2 female) read a list of twenty
words. Eight males and 8 females constituted the shadowing group; these subjects read
the word list and subsequently shadowed the productions from the four talkers. Finally,
32 male and 32 female listeners participated in an AXB forced-choice task to determine
which token sounded more like the talker’s original production. Results show that female
shadowers accommodated to the talkers more than male shadowers (54% vs. 51%). In
addition, shadowers generally accommodated more to male talkers. Post-hoc analyses show
that female shadowers accommodated more to male talkers (57%) than to female talkers
(51%), while male shadowers accommodated equally to both male and female talkers. The
analysis on the perception results revealed that female listeners detect more instances of
shadowing than male listeners. Namy et. al. interpreted their results as suggesting that
a perceptual reflex underlies phonetic convergence since there would have been no social

37
motive for accommdation in the experiment. They claim that the increased levels of con-
vergence for women suggests that women are better at imitating the indexical properties
of the talkers. This, they argue, is the result of different socialization practices for women,
such that they are taught to attend to and accommodate toward indexical features in the
voices of talkers.
Some of the most influential recent work on phonetic convergence is reported in
Pardo (2006). Pardo examines phonetic convergence in same-gender dyads involved in
jointly completing a map task. Paired participants were assigned positions as the giver or
receiver of a series of map instructions. The giver has a completed map while the receiver
has an empty map; the role of the giver is to guide the receiver along a path on the map.
Participants read word lists before and after the task containing place names in the map to
serve as stimuli in the perception study. Pardo also employed Goldinger’s (1998) paradigm;
the X tokens in the AXB similarity task were taken from the recordings of an individual’s
conversational partner in the map task. Dyads were perceived to have converged on 62%
of the trials. In the AXB similarity task, listeners judged male dyads to converge more
than women (75% vs. 58%). Women were found to converge toward the speaker who was
receiving instructions. Men patterned oppositely; they converged toward the speech of the
male talkers giving instructions. Pardo concludes that particular social factors dependent on
the situational context of a conversation facilitate the bridge between speech perception and
production. Because of the research illustrating convergent behavior across languages within
a single Brazilian Portuguese and American English bilingual (Sancier and Fowler 1997),
Pardo attributes convergence phenomena to a entrainment process and not an exemplar-
38
based language system. Sancier and Fowler report on the increase of a talker’s VOT in
Portuguese after having spent extensive time speaking English in the United States. Cross-
linguistic syntactic alignment is described in Hartsuiker et al. (2003). Spanish-English
bilinguals were found to produce more English passive sentences after being primed with
Spanish passives in a picture description task. Hartsuiker et al. (2003) provide a shared-
syntax model of language organization that accounts for their results along with other
disparate work on code-switching and the mental representation of language in bilingual
speakers. If multilingual speakers do store categories and representations jointly, as argued
by Hartsuiker et al. (2003), then exemplar-based language sytsems may retain explanatory
power in phonetic convergence.
Pardo (In press) reports on the acoustic analyses conducted on the speech of the
same-gender dyads along with presenting results from the mixed-gender dyads whose data
are not discussed in Pardo (2006). Like same-gender dyads, mixed-gender pairs converged,
albeit to a lesser extent; listeners perceived mixed-gender pairs to have converged on 53%
of the trials. Pardo conducted linear regressions with F0 and duration data to determine
the cues on which listeners based their judgments. The acoustic measures were taken as
the difference of F0 and duration between each pair for each AXB trial. These values
accounted for 41% of the variance for the female talkers, but only 7% of the variance for
the male data. In pre- and post-task sessions, participants in Pardo’s study also read a list
of hVt words. The first and second formants of /i/, /u/, /æ/, and /A/ were measured and
compared across the pre- and post-task readings. Talkers were found to diverge or converge,
depending on the talkers’ role (receiver or giver) and the vowel identity. The high vowels

39
converged and low vowels diverged. Givers were found to centralize their vowel space more
than receivers. Overall, Pardo found that the low vowels centralized for the givers and
accounted for the divergent patterns. What is perhaps most interesting about this finding
is that these formant values did not come from the place names in the map task, but from
vowels in words recorded in the post-task session. Accommodation strategies being applied
to these vowels suggests that the talker’s entire phonological system was affected by the
exposure to the map task partner.6
Naturally, linguists should be very concerned with the phonetic details involved
in speech accommodation. In this light, some work has been done on the imitation of
lengthened VOT. Shockley et al. (2004) demonstrated that talkers imitate the lengthened
VOT in American English voiceless stops. Nielsen (2008) expanded on VOT imitation in
American English. Nielsen (2006, 2007a,b) has found an interaction between imitation and
generalization across the system that suggests at least part of phonetic accommodation
process is an automatic reflex which affects the linguistic system at the levels of the word,
phoneme, and feature. The methodology used in Nielsen’s work employed a comparison
of baseline and test productions that are separated by an auditory exposure phase. In the
exposure phase, the VOT of the talker’s /p/ is lengthened in disyllabic /p/-initial words.
In the test production set, /k/-initial words are introduced into the word list. Nielsen
revealed that not only do participants imitate the increased VOTs for /p/-initial words,
but they generalize the lengthened pattern to a segment sharing the same [+ spread glottis]
feature: the /k/-initial words. A word-specificity effect is maintained as the increased VOT6It is necessary to make the caveat that it appears the vowel distributions for the receivers and givers
different already in the pre-task reading of the hVt words; Pardo does not address this issue.

40
effects are strongest in the /p/-initial words heard in the exposure phase. Nielsen (2007a,b)
presented another group of listeners with /p/-initial words with shortened VOTs. Listeners
in this group did not imitate the shortened /p/ VOTs, nor did they apply any such pattern
to the /k/-initial words introduced in the test phase. Nielsen reasons that the shortened
VOTs encroach on the phonetic space of the unaspirated “voiced” /b d g/ stops in English.
This work demonstrates that while imitation may be automatic, it is limited by the linguistic
system such that imitation does not eliminate a meaningful phonemic contrast. Another
study that demonstrates language knowledge affects imitation is Nye and Fowler (2003).
Participants shadowed sentences that varied in terms of their phonotactic approximation to
English. Shadowing was more reliable in the 1st order approximation of English as opposed
to the 12th order of approximation. This result suggests that language-specific phonotactic
knowledge guides imitative faithfulness.
Recently, Mitterer and Ernestus (2008) argue that imitation is phonological (and
not phonetic) using data from a speeded shadowing task (like that of Marslen-Wilson (1985))
in Dutch. In the experiment participants were presented with either an alveolar or uvular
variant of /r/. The group of participants was equally split between individuals who were
habitual users of the alveolar trill and those that were habitual users of the uvular trill. In
general participants retained their habitual pronunciations and did not imitate the place
of articulation. Other stimuli had either a voiced or unaspirated stop in onset position.
The voiced stops differed with respect to the number of pre-voicing glottal cycles. Par-
ticipants imitated the presence or absence of pre-voicing, but the difference in amount of
pre-voicing was not imitated. Mitterer and Ernestus conclude from these results that the

41
relationship between speech perception and production is linked by abstract phonological
representations.
I recently attempted to replicate Bourhis and Giles (1977) with New Zealand and
Australia interactions (Babel 2008). Forty-two New Zealanders participated in a lexical
shadowing task with an Australian talker producing monosyllabic words with vowels from
the lexical sets (Wells 1982) kit, dress, trap, barn, and thought. Participants were
divided between two conditions: one in which their national identity was insulted and one
in which their national identity was complimented. After the speech task, participants
completed an Implicit Association Task (IAT; Greenwald et al. 1998) designed to measure
individuals’ biases toward New Zealand and Australia. The Euclidean distance between
each participants’ pre-task and shadowed productions were measured. A step-wise linear
regression model with the linguistic factors word, word frequency, and vowel and the non-
linguistic factors age, gender, IAT score, and experiment condition were fit to the data.
Only the vowels from the lexical sets dress and trap and the IAT score were included in
the model; they accounted for 18% of the variance. Participants’ IAT scores were negatively
correlated with their degree of convergence (t [40] = -3.291, p < 0.01, Pearsons R = -0.46).
This means that participants who scored as pro-Australian on the IAT were more likely
to imitate the Australian talker. One important finding of this work is that convergent
behavior was found in both conditions. Overall, only three instances of accent divergence
were found in the data. Another significant implication of this work is the discovery that
in speech accommodation, talkers imitate the spectral characteristics of vowels.
The ability to control the cognitive, social, and psychological mechanisms that

42
determine the degree of convergence is argued to be a skill that develops with age. Street and
Cappella (1989) examine the development of accommodation strategies in children. In their
experiment, thirty-seven children 3 to 6 years of age participated in dyadic conversations
with an adult female. Children accommodated toward the adult in speech rate and turn-
taking pause duration. The degree of accommodation was predicted not by a child’s age,
but a child’s level of involvement, responsiveness, and their syntactic ability. Other research,
however, has found that four year-old children, but not five year-olds, match the duration of
words produced by adult voices in a rapid shadowing task (Ryalls and Pisoni 1997). While
the socially mediated aspects of phonetic convergence must develop as a child acquires
necessary levels of psychological maturity and social cognition, Westermann and Miranda
(2004) present a model where motor neurons that are activated for the perception and
production of speech develop during the babbling phase of child language acquisition. These
mirror neurons are presumably the starting point from which the perception-production link
in speech behavior is initiated for both phonetic convergence and the acquisition of new
sounds in second language learning and beyond. Kuhl and Metzloff (1996) demonstrate
that infants as young as 12 weeks imitated the point vowels /i/, /a/, and /u/ in response to
an image of female talker producing the same vowels. This is interpreted as evidence for a
perceptual-motor loop that develops into an auditory-articulatory map for use later in life.
To recap, the research reviewed in this section demonstrates that social factors
influence patterns of phonetic convergence and imitation. Social and psychological attitudes
influence an individual’s degree of convergence. This was shown in the earliest studies by
Giles and his colleagues, as well as by Natale. Work by Gregory and collaborators indicates
43
that social status influences the direction of the accommodation and that naive listeners
rate a conversation more highly if the participants converged.
The aspects of the acoustic signal that undergo convergence are not yet completely
understood. With preliminary data, Goldinger (1997) argued that talkers were converging
on fundamental frequency. Gregory and colleagues present evidence that F0 is an aspect
of speech that converges. The fact that talkers failed to calculate the missing fundamen-
tal frequency and converge is, nonetheless, surprising. Pardo (In press) found that while
female talkers converged with respect to F0 and duration, men did very little. She found
that /i/ and /u/ tended to converge while /æ/ and /A/ diverged when comparing pre- and
post-task readings of words not involved in the task. Givers and receivers of map direc-
tions had different degrees of vowel centralization with givers contributing to the divergent
low vowel data. Inadvertently, Ryalls and Pisoni (1997) revealed that four year-old chil-
dren converged on duration in a lexical repetition task while adults and five year-olds did
not. Crucially, Shockley et al. (2004) and Nielsen (2006, 2007a,b) found that participants
imitated lengthened VOT in aspirated American English stops.
Research reviewed in this section began to address how lower-level linguistic knowl-
edge (words and phonemes) are affected in phonetic convergence. Much of this work, how-
ever, has used gross perceptual measures to examine convergence. Acoustic measures are
still a novel method in determining phonetic imitation, and in using acoustic analyses re-
searchers can find exactly what aspects of the acoustic signal may be imitated.
44
2.2.3 A psycholinguistic model of accommodation
It is worth reviewing the automatic interactive alignment model proposed by Pick-
ering and Garrod (2004b) that is intended to account for all types of linguistic alignment in
dialogue. In Pickering and Garrod (2004b) the interactive alignment model is proposed and
contrasted with a more traditional autonomous transmission account of spoken language
which views the processes of speech perception and production as distinct and unrelated.
Pickering and Garrod’s understanding of speech perception is not limited to the perception
of acoustic information and lexical access, but total comprehension of linguistic content
from the talker. Every level of linguistic representation – the situation model, semantics,
syntax, the lexicon, phonology, and phonetics – is connected within an individual, and each
level of representation between the listener and the talker is connected. An automatic prim-
ing process that percolates through the levels of representations of the interlocutors aligns
speech. The use of a representation by a talker leads to the activation of that representation
in the listener.
Pickering and Garrod (2004b) commit to the concept that this priming is a di-
rect aspect of the perceptual-behavioral link, like that proposed by Dijksterhuis and Bargh
(2001; see Section 1.2 above). This model is used in psycholinguistics not only to account
for speech accommodation, but also in speech reduction processes that relate to contex-
tual probability. When interlocutors are aligning speech processes, planned reduction is
permitted if predictable linguistic alignment is shared (cf. Pluymaeker et al. 2005).
The interactive alignment model received ample and deserving criticism for omit-
ting the exact nature of the priming mechanism (Goldinger and Azuma 2004a, Kaschak
45
and Glenberg 2004) and for failing to consider the myriad social factors that influence the
level of alignment across speakers (Brennan and Metzing 2004, Brown-Schmidt and Tanen-
haus 2004, Krauss and Pardo 2004). Kaschak and Glenberg (2004) argue that an automatic
priming mechanism must function via a memory-based language processing system. Using a
model with a memory base that automatically selects recently perceived or produced chunks
for retrieval predicts the alignment patterns reported in Pickering and Garrod. Grossberg’s
Adaptive Resonance Theory (ART, described above in Section 2.2.2; Grossberg 1980) is sug-
gested as the mechanism whereby priming occurs in the Pickering and Garrod model. The
resonance chunks and the dynamics of the system allow for the holistic nature of priming
in dialogue across all linguistic representations (Goldinger and Azuma 2004a).
Brennan and Metzing (2004) disagree with the automaticity of the alignment pro-
cess and argue for a more flexible process that allows a talker to consider the needs and
history of a listener. Likewise, Brown-Schmidt and Tanenhaus (2004) admit that language
users can be very “egocentric”, but Pickering and Garrod ignore the fact that talkers often
take great care in choosing the best construction for the particular listener-specific knowl-
edge base they are communicating with. Likewise, the model is criticized by Krauss and
Pardo (2004) for ignoring how talkers accommodate to listeners who have clearly different
knowledge bases. Krauss and Pardo also note that alignment is not the only outcome of
talking; in many cases divergence may occur.
Pickering and Garrod (2004a) fine-tune their model after considering criticisms
such as those mentioned in the previous paragraphs. They agree that a memory-based
language system such as ART may be a good choice for their model. Crucially, the authors
46
restate their claims about the automaticity of priming in light of the evidence that surfaced
in the commentaries. They take a step back and acknowledge that social factors are involved
in alignment, but maintain that the process is still unconscious and lacks any explicit
decision making process.
2.3 Speech variation
In recent years it has become exceedingly clear that sociolinguistics has an impor-
tant place in phonetics and phonology. Work in laboratory phonology has illustrated that
social information such as age, gender, and class are crucial to the parsing of the speech
signal. The intersection of these subfields, in addition to their relevance to phonetic con-
vergence, are developed in more detail below in Section 2.3.1 which discusses style-shifting
in speech production.
This work is important for this dissertation in two respects. For one, research
on speech variation presents some of the empirical data showing that talkers and listeners
store multiple linguistic representations, accessing different productions and percepts as they
negotiate socially appropriate language use. As we will see in the following chapters, these
multiple representations play an important role in imitative behavior. The second reason
relates to the issue of social automaticity. Sociolinguists see contextually varied language
use as conscious acts on the part of the speaker. This dissertation tests the idea that socially
influenced behavior in speech production is the result of implicit and uncontrollable social
biases.

47
2.3.1 Speech accommodation and style-shifting
Labov’s (1963) pioneering work on the social stratification of linguistic variables
in Martha’s Vineyard set the stage for the examination of how social structures motivate
linguistic variation, which is a basic principle of sociolinguistic variation. Sociolinguistic
variation is characterized in a community as any number of variables that occur to differ-
entiate speakers socially. There are differing views on what constitutes stylistic variation,
however. Eckert (2001) defines style as any number of linguistic variables that indicate or
mark a social identity either on an individual level or beyond. The so-called “third wave”
of sociolinguistics focuses on the talker’s ability to style-shift; that is, to modify their social
position according the demands of a situation by altering their linguistic patterns. Oth-
ers view stylistic variation as the sociolinguistic variation that is demonstrated by a single
speaker (Labov 2001a, Bell 2001). That speaker, for example, is not changing their position
within the social hierarchy, but rather is presenting a particular version of their dynamic
social identity at a given moment. Under this view, it is often claimed that community-level
sociolinguistic variables must exist before such variables enter the style-shifting repertoire of
a speaker (Bell 1984:159). What we are concerned with here is not the theory surrounding
style, but how intra-speaker communication induces stylistic variability.7
Audience design (Bell 1984) is a model which attempts to account for stylistic
variation. In audience design, a speaker considers not only the addressee in the selection
of the proper variable for an utterance, but also the individuals who are assuming the
roles of auditor, overhearer, and eavesdropper. Bell stresses that the audience serves an7Style is a tremendously broad topic in sociolinguistics and is, clearly, not covered exhaustively in this
section. For a fuller description of stylistic phenomenon see the chapters in Eckert and Rickford (2001).

48
active role in the design of an utterance. Furthermore, he notes the role of the addressee is
particularly active in audience design, as shown in work by Giles and colleagues on CAT.
The automaticity of the audience design model is not adequately addressed by Bell, but it
is acknowledged that a full understanding of a speaker’s social and psychological networks,
biases, and values are necessary to predict all of the linguistic patterns that are accountable
through audience design (Bell 1984:169).
In terms of what information speakers use to determine how to craft their speech,
Bell (1984:167) considers three possibilities: (1) Speakers examine an addressee’s personal
traits and design their style accordingly; (2) Speakers gauge the general speech style of an
addressee and design accordingly; or, (3) speakers listen for specific linguistic variables and
select their stylistic variants to reflect their findings. Research has revealed evidence for
all three options, but the degree to which each possibility motivates design is unanswered
by Bell. The first option recalls Thakerar et al.’s (1982) finding that conversation pairs
converged toward the stereotyped speech style of the other member of the pair; we will
consider data below that shows listeners perceive stereotyped linguistic features of social
groups and not the actual information present in the physical signal. If we can remove
the implied intentionality from the third possibility, it sounds much like accommodation. It
seems Bell’s theory is describing nearly the same phenomenon as CAT and exemplar models
of speech perception and production.
Bell (2001) expanded the theory of audience design by adding a notion of “referee
design” as a mechanism in parallel with the “audience design” mechanism that gave the
theory its name. Referee design is defined as the change in a speaker’s style that affiliates

49
the speaker with a particular social group as prompted by the audience (p. 163). Bell argues
that a comprehensive theory of style-shifting must consider the two principal driving forces:
audience design and referee design. While a talker is crafting from a stylistic repertoire
that heeds the needs of the audience, a speaker feels the pressure to maintain a level of
faithfulness to their social network and larger social affiliations.
The collaborative relationship between a talker, the audience, and the social group
pressures in the development of style across the course of an interaction is an integral aspect
of Bell’s theory. This echoes the collaborative nature of the understanding process outlined
in Clark and Wilkes-Gibbs (1986). Schober and Clark (1989) also underscore the importance
of the addressee as opposed to the overhearer in the understanding of novel information. In
a task where addressees had to organize novel images into an order directed by the speaker,
addressees were more accurate at arranging these in the proper order than overhearers
who had been privy to the conversation since the beginning. There is a clear benefit to
participating in the development of understanding; observing does not supply the same
amount of information. This suggests that despite the importance of the greater audience
in the design of the style, the addressee may well have the most influence on a talker’s style.
The importance of the addressee in the design of style is illustrated in Sharma
(2005) with speakers of Indian American English. Phonological stylistic variation for non-
native speakers of American English appeared more often in “discourse-prominent and
salient positions” (Sharma 2005:209). Speakers who style-shifted into marked American
English phonological forms were more likely to positively evaluate the American English
dialect and consider the acquisition of an American identity a valuable resource. When

50
attention was drawn to an utterance, the style was shifted away from standard American
English and into a style shared more intimately between Sharma and her interviewees,
indicating audience design as a function of attention in interviews. Moreover, the shift
toward a less standard style contradicts Labov (1966). The increased attention fostering
stronger accommodation toward the fellow interlocutor echoes the argument made above
that salience encourages convergence.
Investigations of style-shifting and audience design underscore the fact that talkers
have multiple speech production targets available when selecting an utterance. Target
selection is highly influenced by the interlocutor. This work within sociolinguistics has
focused either on talkers’ use of these variants as a means to intentionally deploy social
meaning. Sociolinguists view this use of language as controlled and conscious (Labov 2001a,
Eckert 2001). In the next section I describe a traditional method from social psychology
that can be used to probe how unconscious bias may relate to speech production.
2.3.2 Speech and Race
The social themes in this dissertation are less concerned with traditional macro-
level sociolinguistics variables. I am more concerned about implicit measures of social
cognition and how interracial interactions may interact with cognitive processing (Richeson
and Trawalter 2008, Richeson and Shelton 2007). For example, Richeson and Trawalter
(2005) found White participants performed worse on a Stroop Task after completing an
Implicit Association Task (IAT) and interacting with a Black experimenter and not a White
experimenter. The larger the pro-White bias, the worse the performance on the Stroop

51
task.8 Black participants had similar behavior when interacting with a White experimenter,
as opposed to the Black experimenter.
The methodology of the experimental task is presented in detail in Chapter 3 and
was briefly described in Chapter 1. But I will quickly review the basic outline here before
going in more depth about social cognition: White participants were exposed to single word
productions from either a Black talker or a White talker. The task of the participants was
to identify each word by saying it out loud. Participants were randomly assigned to either
the Black talker or the White talker; they were also randomly assigned to either a condition
with a still digital image of the talker (the Social Conditions) or a picture-less condition
(the Asocial Conditions). In addition to the basic manipulation that White participants
are interacting with either a Black or White talker, measures of subtle racial bias were
also taken. This was done in order to consider the deeper motivation for a participant’s
behavior in the shadowing task. A problem with incorporating methodologies that probe
social behavior is that the information must be collected experimentally since individuals
are not always forthright about their social values, identities, and ideologies. The IAT is an
experimental paradigm developed by Greenwald et al. (1998) that examines social cognition
by measuring implicit biases. In this study, it is predicted that the IAT will measure the
implicit racial biases that prime participants’ behavior in the shadowing task. Specifically,
the type of question being explored with this task is will a White participant who did not
converge with the Black talker have a stronger IAT effect than a White participant who
did converge with the Black talker? An advantage of the IAT is that it provides gradient8The Stroop task asks participants to identify the font color of printed words. The test words in the task
are actual color names. The increased latency in reaction time associated with identifying the font colorwhen reading a color name (i.e., when “red” is printed in a green font).
52
measures as opposed to binary social variables. It should be noted that psychological
measures like the IAT do not represent an individual’s static perspective on the social world.
Dasgupta and Greenwald (2001) illustrate that exposing participants to positive images of
Black people reduced participants’ White bias – even ingrained biases are flexible.
This dissertation is particularly relevant to sociolinguistic theories about the re-
lationship between African American English and more mainstream varieties of American
English. Since the 1970s, researchers have argued that the speech of Blacks and Whites in
urban settings is diverging due to segregation and racism (Fasold 1981, Labov and Harris
1986, Fasold et al. 1987). Bailey and Maynor (1989) demonstrate that syntactic differences
between the speech of urban Black and White children differ more than rural Black and ur-
ban White children differ. In their study, listeners judging the race of adults’ and childrens
voices were more accurate for the childrens voices. This suggests that the speech patterns
of Black and White children are more distinct than that of Black and White adults. To-
gether, Bailey and Maynor interpret their data as supporting the idea that Black and White
varieties of English in urban environments are diverging. This dissertation experiment has
the potential to offer experimental evidence toward this controversy. A failure to converge
phonetically in the experimental task may indicate divergence in real world situations is
due to social and psychological factors.
Carpenter et al. (2008) have illustrated that Jamaican children also have specific
listener expectations for different racial phenotypes in speech perception. Admittedly, the
view of race considered in this dissertation is unsophisticated. At attempt was made to
match the African American and European American talkers as much as possible. The
53
talkers in this dissertation were selected because they worked in the same office on the UC
Berkeley campus, approximated each other in age, and had spent the majority of their
lives in California. The exact racial phenotype of the talkers is of little importance. What
matters for the two talkers in this experiment is that they simply differ in racial identity.
With only two talkers of differing racial characteristics, what is being examined is how
gross racial categories influence speech behavior. Although the race manipulation in this
experiment is simplistic, there have been no prior studies on phonetic convergence that
manipulate race in any way. Therefore, in addition to making a contribution to phonetic
theory, this dissertation also makes a (small) step toward understanding the sociolinguistics
of race.9
2.4 Brief Summary
A considerable amount of work has been done on phonetic accommodation. There
has also been a good amount of research devoted to how social factors may influence speech
accommodation. However, to date, the social factors considered with phonetic accommoda-
tion have largely been major demographic factors or related to the quality of the interaction.
Another major gap within the work on phonetic accommodation comes from the methods
used to determine imitation and convergent behavior; it is unknown what within the pho-
netic structure is imitated. What is needed is a study that examines the acoustic detail of
imitation and incorporates implicit social measures. The methodology for such a study is9Race is being used in this dissertation as a social difference between two talkers that in all likelihood
function in concert with myriad other social characteristics that distinguish the talkers. The thesis investi-gated here is whether or not phonetic convergence may be determined by social information, not just whetherrace as a social construct modifies typically occurring convergent speech behavior.

54
described in Chapter 3.
55
Chapter 3
Methodology
To determine whether vowels are imiated and whether social cognition would affect
degree of imitation, I ran an experiment in which speakers repeated words that they heard
over headphones. This will be called the speech production task or the shadowing task and
is described in Section 3.1. Section 3.2 provides details on the analysis of the acoustic
data. The data from the speech production task were acoustically analyzed (to extract the
vowel formants) and the acoustic measurements were used to compute a difference in
distance measure. Participants also completed an Implicit Association Task to measure
their racial bias; this is described in Section 3.3. The IAT score was used in the statistical
modeling along with the acoustic data. Before the results are presented in Chapter 4, this
chapter concludes with a set of predictions in Section 3.4.
56
3.1 Shadowing Task
3.1.1 Stimuli
Low frequency monosyllablic words were taken from the English CELEX database
using the COBUILD logarithmic spoken lemma frequency count (Baayen et al. 1993). All
words had raw frequency counts of ≤1 uses per million (CobSLog ≤ 0.301). Fifty low fre-
quency words containing the vowels /i æ A o u/ were selected as stimuli (see Table 3.1).
The vowels /æ A o u/ were chosen because their positions within the vowel space are very
much dialectically and socially conditioned (Labov 1994, Clopper and Pisoni 2004). In
California English /o/ and /u/ are fronted, having a higher F2 than in many other North
American English dialects. The low vowels /ae/ and /A/ have lower F2s in California En-
glish than other dialects. While the participant population for this experiment is primarily
Californian, or at least from the Western US, the exact location of these vowels varies
within the Californian population, and participants from other dialect regions of the US
are also represented in the subject population. The high front vowel /i/, however, does not
vary significantly either socially or dialectally. Trudgill (1981) argues that attention and
social salience are key explanatory factors in phonetic convergence. If Trudgill’s assessment
is accurate, then participants should not converge on the /i/ vowel as it is not subject to
meaningful variation. In contrast, the other four vowels vary considerably within and across
dialects. For example, different US dialects are at different stages in the process of back
vowel fronting. As /o/ and /u/ undergo a sound change, more innovative variants are avail-
able to speakers in particular social contexts (e.g., style shifting), while more conservative
variants are also accessible. This larger available set of productions leads to the prediction,
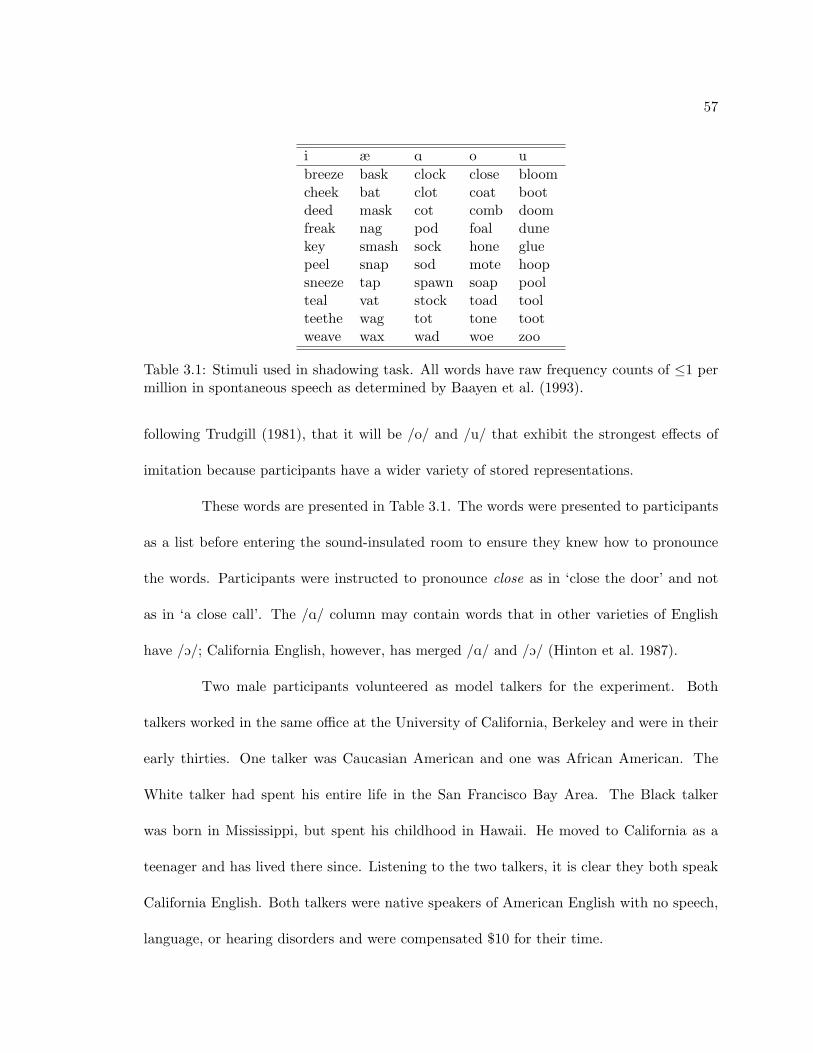
57
i æ A o ubreeze bask clock close bloomcheek bat clot coat bootdeed mask cot comb doomfreak nag pod foal dunekey smash sock hone gluepeel snap sod mote hoopsneeze tap spawn soap poolteal vat stock toad toolteethe wag tot tone tootweave wax wad woe zoo
Table 3.1: Stimuli used in shadowing task. All words have raw frequency counts of ≤1 permillion in spontaneous speech as determined by Baayen et al. (1993).
following Trudgill (1981), that it will be /o/ and /u/ that exhibit the strongest effects of
imitation because participants have a wider variety of stored representations.
These words are presented in Table 3.1. The words were presented to participants
as a list before entering the sound-insulated room to ensure they knew how to pronounce
the words. Participants were instructed to pronounce close as in ‘close the door’ and not
as in ‘a close call’. The /A/ column may contain words that in other varieties of English
have /O/; California English, however, has merged /A/ and /O/ (Hinton et al. 1987).
Two male participants volunteered as model talkers for the experiment. Both
talkers worked in the same office at the University of California, Berkeley and were in their
early thirties. One talker was Caucasian American and one was African American. The
White talker had spent his entire life in the San Francisco Bay Area. The Black talker
was born in Mississippi, but spent his childhood in Hawaii. He moved to California as a
teenager and has lived there since. Listening to the two talkers, it is clear they both speak
California English. Both talkers were native speakers of American English with no speech,
language, or hearing disorders and were compensated $10 for their time.

58
The audio-stimuli for the experiment were recorded in a sound-insulated booth
with a head-mounted AKG C520 microphone positioned three inches from the talker’s
mouth. The words in Table 3.1 were randomly presented on the computer monitor four
times each through E-prime experimental software (Schneider et al. 2002). The most natural
and clear sounding of the four tokens of each word was selected for use in the experiment.
The talkers were also digitally photographed for the visual stimuli; see Figures 3.1 and 3.2.1
Figure 3.1: Picture of the Black talker whose voice and image were used in the experiment.
Figure 3.2: Picture of the White talker whose voice and image were used in the experiment.
The talkers were given no instruction on how to read the words other than to1There are, of course, other visual and physical differences between the talkers. The Black talker has
facial hair and dreadlocks, while the White talker has shorter hair and is wearing a sport coat. Participantperception of these talker differences may be subsumed under the Attractiveness Rating measure. Participantresponse to the racial difference is measured with the Implicit Association Task described in 3.3.
59
produce them clearly and naturally. The formant frequencies for the vowel in each word
that are used as stimuli in the shadowing task for each talker is shown in Figure 3.4. The
average vowel differences between the talkers are evident in the formant frequencies of
the individual words. Formant frequencies vary for different words reflecting influence of
neighboring consonants (Stevens and House 1963).
The most obvious differences between the Black and White talkers are the positions
of the low vowels. For /æ/ the White talker has a characteristic nasal split; in nasal
environments /æ/ is more tensed and has a lower F1. This pattern in /æ/ exists in the
Black talker’s tokens as well, but the difference between the two allophones of /æ/ is not
quite as demarcated. The White talker is also exceptional in having an /A/ with a very low
F2. This type of retracted /A/ is typical of the California vowel shift. Figure 3.3 shows the
average formant location of the vowels from the 50 selected words from each talker.
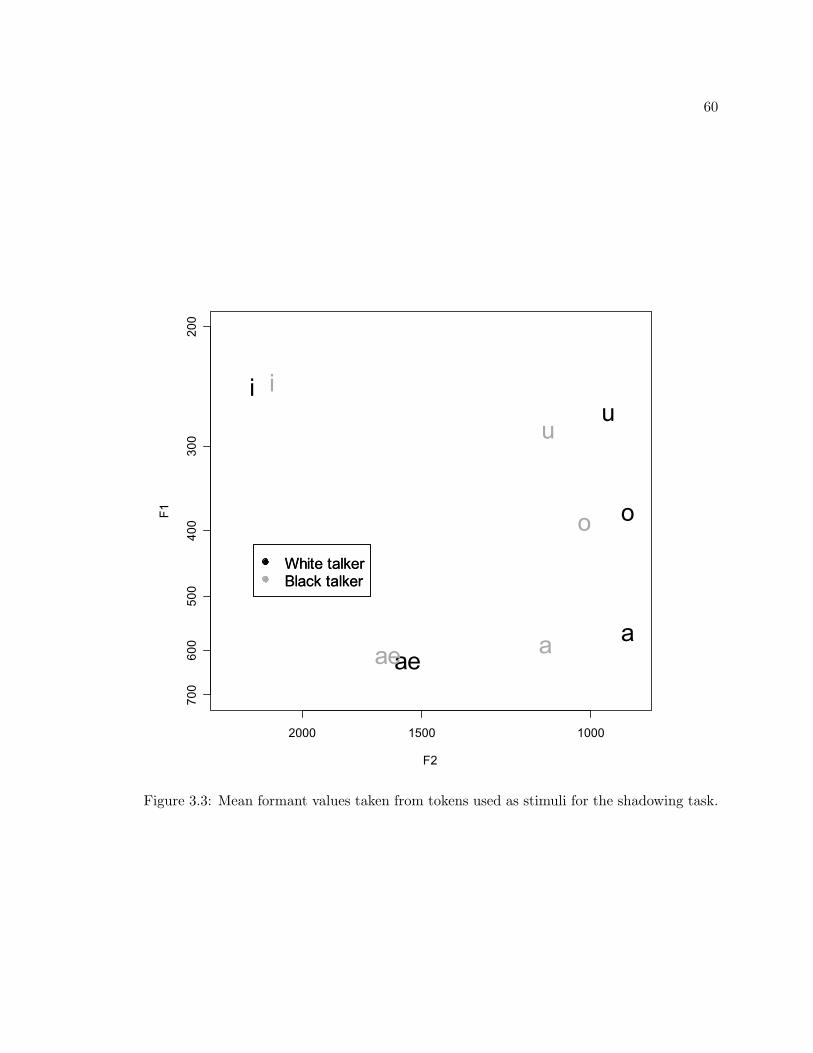
60
2000 1500 1000
700
600
500
400
300
200
F2
F1
a
ae
i
o
u
aae
i
o
u
White talker
Black talker
White talker
Black talker
Figure 3.3: Mean formant values taken from tokens used as stimuli for the shadowing task.

61
2500 2000 1500 1000 500
700
600
500
400
300
200
F2
F1
baskbat
bloombootbreezecheek
clock
close
clot
coat
comb
cot
deed
doomdune
foal
freakglue
hone
hoop
key
mask
mote
nag
peel
pod
pool
smashsnap
sneeze
soap
socksod
spawn
stock
tap
teal
teethe
toad
tone
tooltoot
tot
vat
wad
wag
wax
weave
woe
zoo
baskbat
bloom
boot
breezecheek
clock
close
clot
coat
comb
cot
deed
doom
dune
foal
freak
glue
hone
hoop
key
mask
mote
nag
peel
pod
pool
smash
snap
sneeze
soap
socksod
spawn
stock
tap
teal
teethe
toad
tone
tooltoot
totvat
wad
wag
wax
weave
woe
zoo
White talkerBlack talker
Figure 3.4: The F1-F2 location of the vowel nuclei for each word stimulus for the twotalkers.

62
3.1.2 Participants
One hundred and seventy-eight participants recruited from the University of Cali-
fornia, Berkeley community completed the task. Of these, 24 were Black. Two of the Black
participants were removed for failure to complete the task accurately, leaving 22 Black par-
ticipants. Because this is not enough data to make any generalizations, this data will not be
discussed further. Of the 154 White participants (87 female, 64 male), the data from four
participants were excluded from the analysis. Two of these participants did not complete
the task accurately.2 The other was removed because it was discovered after the task that
she had profound hearing loss. The final participant was removed because she personally
knew the model talker to which she had been assigned.
The participants whose data have been included in the analysis have no reported
speech, hearing, or language disorders. All participants were compensated $10 for their
time.
3.1.3 Procedure
Participants in the shadowing task were tested individually and were assigned to
one of six conditions. Information about the experimental conditions and the number of
participants assigned to each is summarized in Table 3.2.
The paradigm for the speech production task is a simple shadowing paradigm
(Goldinger 1998). The procedure in all six conditions was identical. Participants were
seated in a sound-attenuated room at a computer workstation where the experiment was2Leaving the sound booth during experiment and speaking unnaturally are examples of failing to complete
the task accurately.
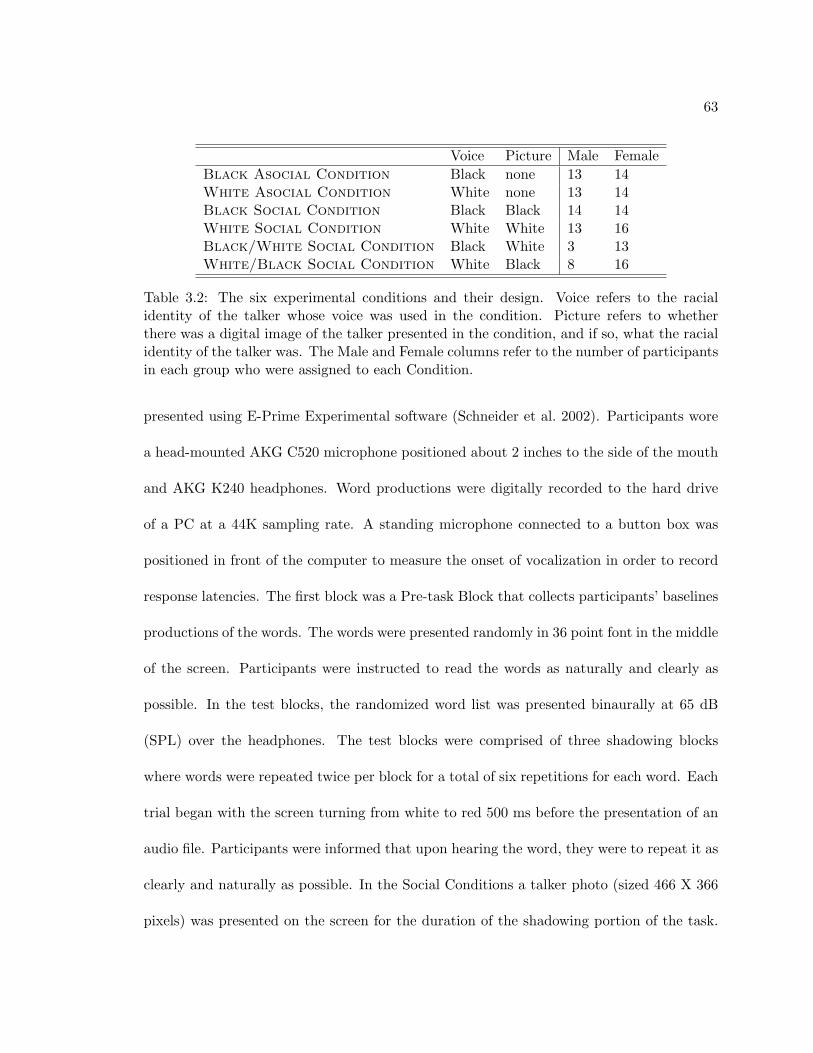
63
Voice Picture Male FemaleBlack Asocial Condition Black none 13 14White Asocial Condition White none 13 14Black Social Condition Black Black 14 14White Social Condition White White 13 16Black/White Social Condition Black White 3 13White/Black Social Condition White Black 8 16
Table 3.2: The six experimental conditions and their design. Voice refers to the racialidentity of the talker whose voice was used in the condition. Picture refers to whetherthere was a digital image of the talker presented in the condition, and if so, what the racialidentity of the talker was. The Male and Female columns refer to the number of participantsin each group who were assigned to each Condition.
presented using E-Prime Experimental software (Schneider et al. 2002). Participants wore
a head-mounted AKG C520 microphone positioned about 2 inches to the side of the mouth
and AKG K240 headphones. Word productions were digitally recorded to the hard drive
of a PC at a 44K sampling rate. A standing microphone connected to a button box was
positioned in front of the computer to measure the onset of vocalization in order to record
response latencies. The first block was a Pre-task Block that collects participants’ baselines
productions of the words. The words were presented randomly in 36 point font in the middle
of the screen. Participants were instructed to read the words as naturally and clearly as
possible. In the test blocks, the randomized word list was presented binaurally at 65 dB
(SPL) over the headphones. The test blocks were comprised of three shadowing blocks
where words were repeated twice per block for a total of six repetitions for each word. Each
trial began with the screen turning from white to red 500 ms before the presentation of an
audio file. Participants were informed that upon hearing the word, they were to repeat it as
clearly and naturally as possible. In the Social Conditions a talker photo (sized 466 X 366
pixels) was presented on the screen for the duration of the shadowing portion of the task.

64
Finally, the post-test block was identical to the baseline block where participants read the
words from the screen. The experiment took less than half an hour to complete.
Upon exiting the sound booth participants in the Asocial Conditions were asked
to identify the race of the model talker. Those in the Social Conditions were asked to rate
the model talker’s attractiveness on a scale of 1 to 10. Both the Black and White talker
were overwhelmingly identified as White by participants (25/27 “White” responses for Black
talker, 27/27 “White” responses for White talker).3 The talkers’ perceived attractiveness
ratings varied considerably (Male participants: Black talker M = 4.8, SD = 2.6, White
talker M = 4.1, SD = 2; Female participants: Black talker M = 5.8, SD = 1.6, White
talker M = 2.9, SD = 1.2). These values were used as predictors in the Social Conditions
in the statistical models. Participants completed a final non-speech task before leaving the
lab. This was the Implicit Association Task described in Section 3.3 below.
In Chapter 4 only the results from the Asocial Conditions and the congruent Social
Conditions (Black/Black and White/White) are discussed. The crossed Social Conditions
were removed from the analysis for two reasons: (1) too few male participants were recruited
for these conditions, and (2) preliminary analysis of the female data revealed behavior that
was not mirrored in any of the other conditions.
3.2 Data Analysis
A Praat (Boersma and Weenink 2005) script automatically identified pauses by
marking boundaries at regions preceding and following over 600 ms of low intensity energy3Two male participants identified the Black talker as Asian. During debriefing after the session was
completed these two participants said they felt the label ‘Asian’ was neutral, which was why they suggestedthis as the talker’s race.

65
(< 59 dB). These boundaries were hand-corrected so as to roughly mark the onset and
offset of the vowel. A second Praat script extracted the mean first and second formants
from a series of Gaussian windows spanning the middle 50% of the vowel with a 2.5 ms
step size. Outliers were identified as those tokens where the F1 or F2 was more than three
standard deviations away from the mean. This was based on the group mean for each
formant for each vowel and was done separately for the male and female data. Outliers
were then removed from the dataset. Formant values were normalized to the Bark scale
before proceeding with data analysis using the formula given in Traunmuller (1990). The
Bark scale is a vowel intrinsic nonlinear transformation of the frequency scale that better
approximates the way in which the auditory system responds to frequencies compared to
raw Hertz values.
We are interested in evaluating how a participant’s productions change as a result
of auditory exposure to the model talker. As a measure of how productions changed, we
need a measure of how much a particular word production changes through the course of
the experiment. To this end, the Euclidean distance was calculated from each participant
production to the model talker production of the same word from the talker to which they
had been assigned within the two dimensional formant space. The equation for finding the
Euclidean distance is shown in (1). For each participant production, the first and second
formants are entered into the equation along with the formant values for the same word for
the model talker that the participant was exposed to. The Euclidean distance is a way of
calculating distance ‘as the crow flies’; it calculates a straight line between two locations
within a two-dimensional space.
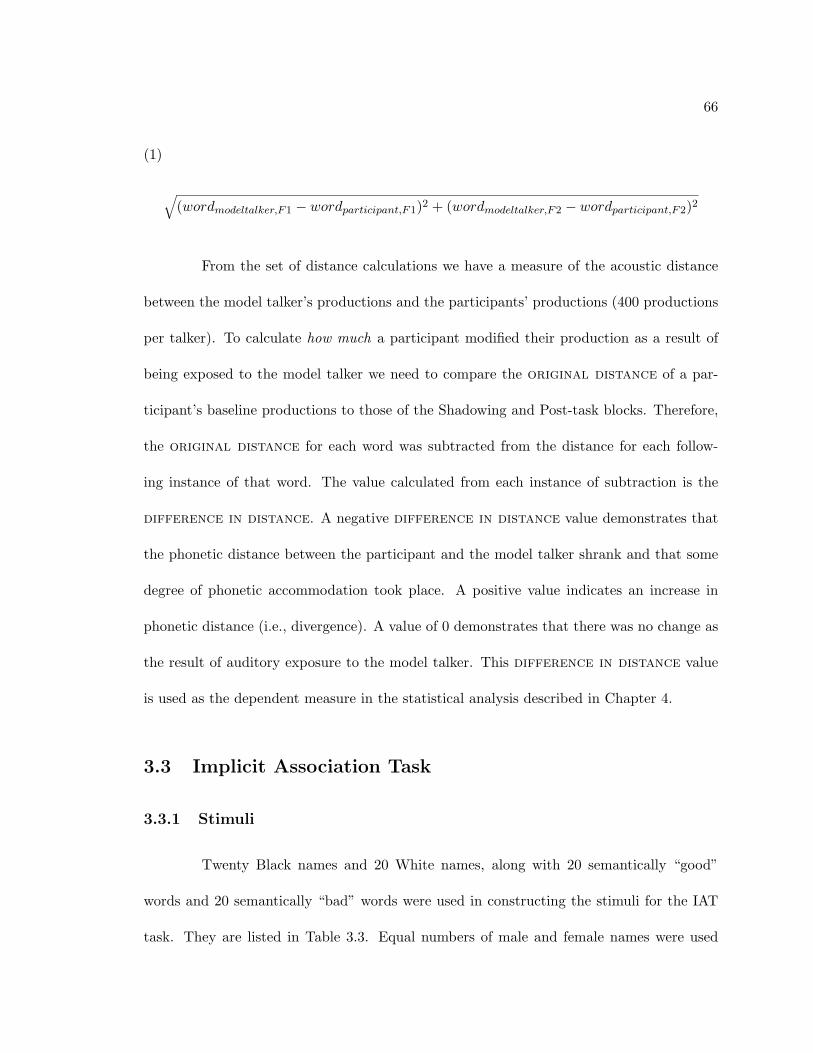
66
(1)
√(wordmodeltalker,F1 − wordparticipant,F1)2 + (wordmodeltalker,F2 − wordparticipant,F2)2
From the set of distance calculations we have a measure of the acoustic distance
between the model talker’s productions and the participants’ productions (400 productions
per talker). To calculate how much a participant modified their production as a result of
being exposed to the model talker we need to compare the original distance of a par-
ticipant’s baseline productions to those of the Shadowing and Post-task blocks. Therefore,
the original distance for each word was subtracted from the distance for each follow-
ing instance of that word. The value calculated from each instance of subtraction is the
difference in distance. A negative difference in distance value demonstrates that
the phonetic distance between the participant and the model talker shrank and that some
degree of phonetic accommodation took place. A positive value indicates an increase in
phonetic distance (i.e., divergence). A value of 0 demonstrates that there was no change as
the result of auditory exposure to the model talker. This difference in distance value
is used as the dependent measure in the statistical analysis described in Chapter 4.
3.3 Implicit Association Task
3.3.1 Stimuli
Twenty Black names and 20 White names, along with 20 semantically “good”
words and 20 semantically “bad” words were used in constructing the stimuli for the IAT
task. They are listed in Table 3.3. Equal numbers of male and female names were used
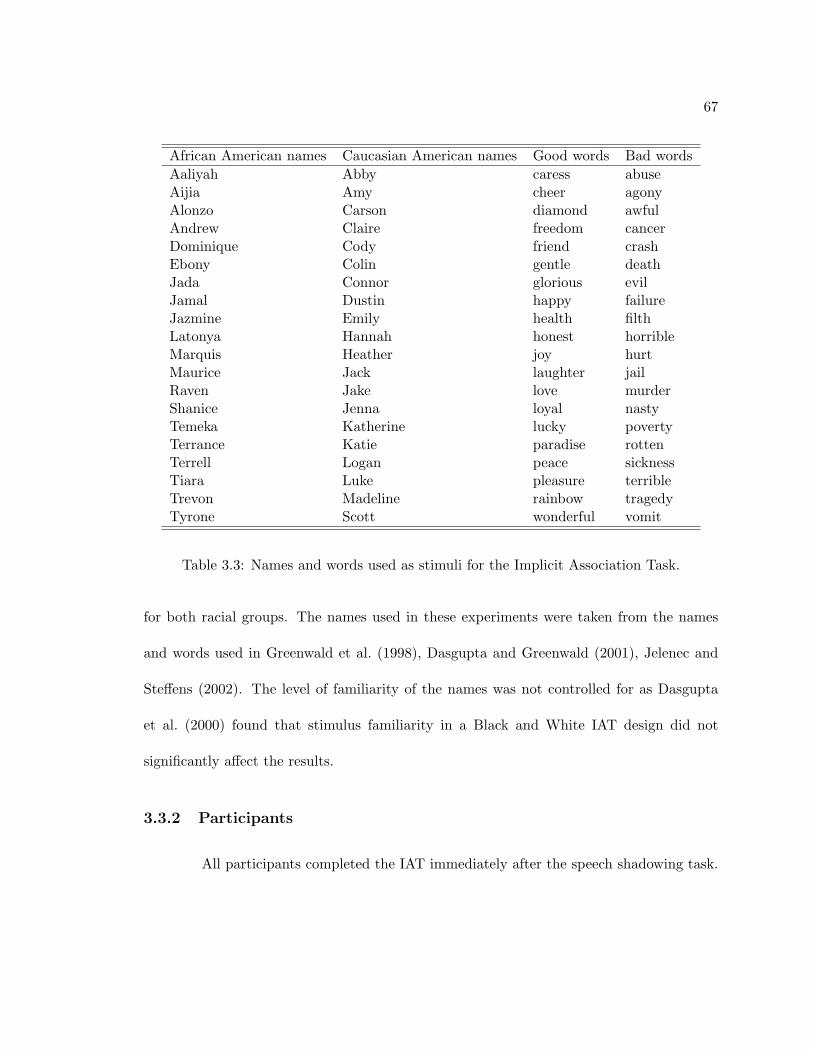
67
African American names Caucasian American names Good words Bad wordsAaliyah Abby caress abuseAijia Amy cheer agonyAlonzo Carson diamond awfulAndrew Claire freedom cancerDominique Cody friend crashEbony Colin gentle deathJada Connor glorious evilJamal Dustin happy failureJazmine Emily health filthLatonya Hannah honest horribleMarquis Heather joy hurtMaurice Jack laughter jailRaven Jake love murderShanice Jenna loyal nastyTemeka Katherine lucky povertyTerrance Katie paradise rottenTerrell Logan peace sicknessTiara Luke pleasure terribleTrevon Madeline rainbow tragedyTyrone Scott wonderful vomit
Table 3.3: Names and words used as stimuli for the Implicit Association Task.
for both racial groups. The names used in these experiments were taken from the names
and words used in Greenwald et al. (1998), Dasgupta and Greenwald (2001), Jelenec and
Steffens (2002). The level of familiarity of the names was not controlled for as Dasgupta
et al. (2000) found that stimulus familiarity in a Black and White IAT design did not
significantly affect the results.
3.3.2 Participants
All participants completed the IAT immediately after the speech shadowing task.
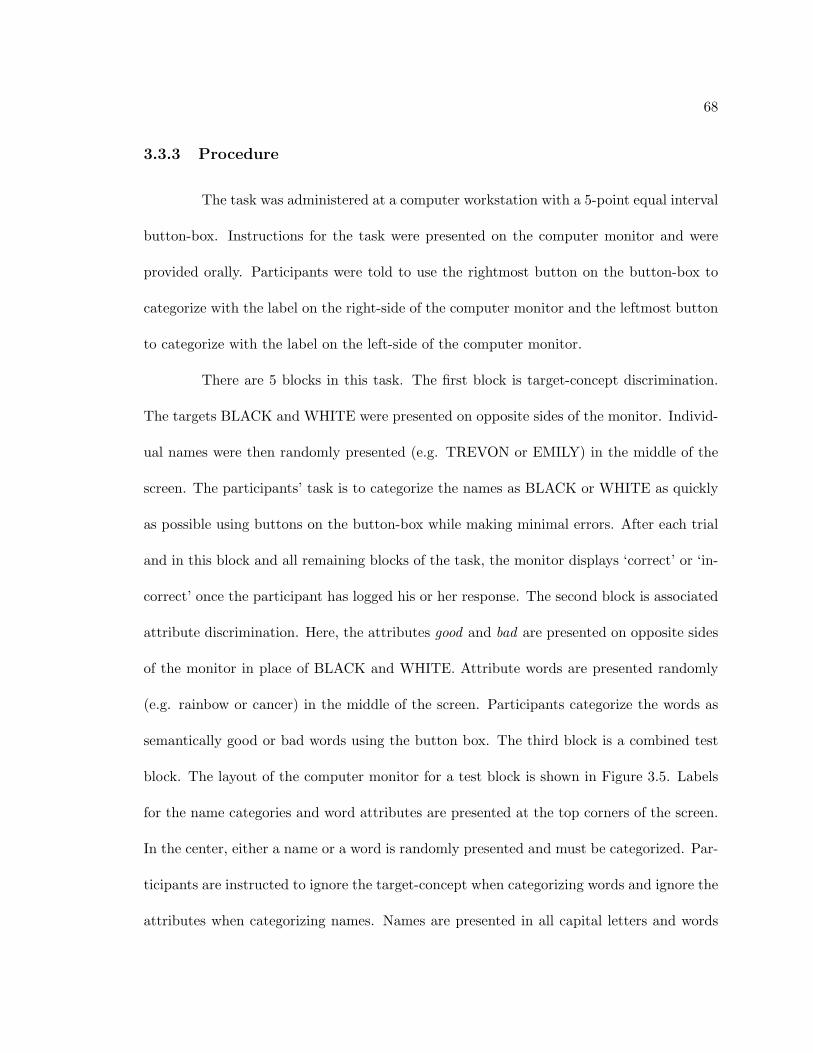
68
3.3.3 Procedure
The task was administered at a computer workstation with a 5-point equal interval
button-box. Instructions for the task were presented on the computer monitor and were
provided orally. Participants were told to use the rightmost button on the button-box to
categorize with the label on the right-side of the computer monitor and the leftmost button
to categorize with the label on the left-side of the computer monitor.
There are 5 blocks in this task. The first block is target-concept discrimination.
The targets BLACK and WHITE were presented on opposite sides of the monitor. Individ-
ual names were then randomly presented (e.g. TREVON or EMILY) in the middle of the
screen. The participants’ task is to categorize the names as BLACK or WHITE as quickly
as possible using buttons on the button-box while making minimal errors. After each trial
and in this block and all remaining blocks of the task, the monitor displays ‘correct’ or ‘in-
correct’ once the participant has logged his or her response. The second block is associated
attribute discrimination. Here, the attributes good and bad are presented on opposite sides
of the monitor in place of BLACK and WHITE. Attribute words are presented randomly
(e.g. rainbow or cancer) in the middle of the screen. Participants categorize the words as
semantically good or bad words using the button box. The third block is a combined test
block. The layout of the computer monitor for a test block is shown in Figure 3.5. Labels
for the name categories and word attributes are presented at the top corners of the screen.
In the center, either a name or a word is randomly presented and must be categorized. Par-
ticipants are instructed to ignore the target-concept when categorizing words and ignore the
attributes when categorizing names. Names are presented in all capital letters and words
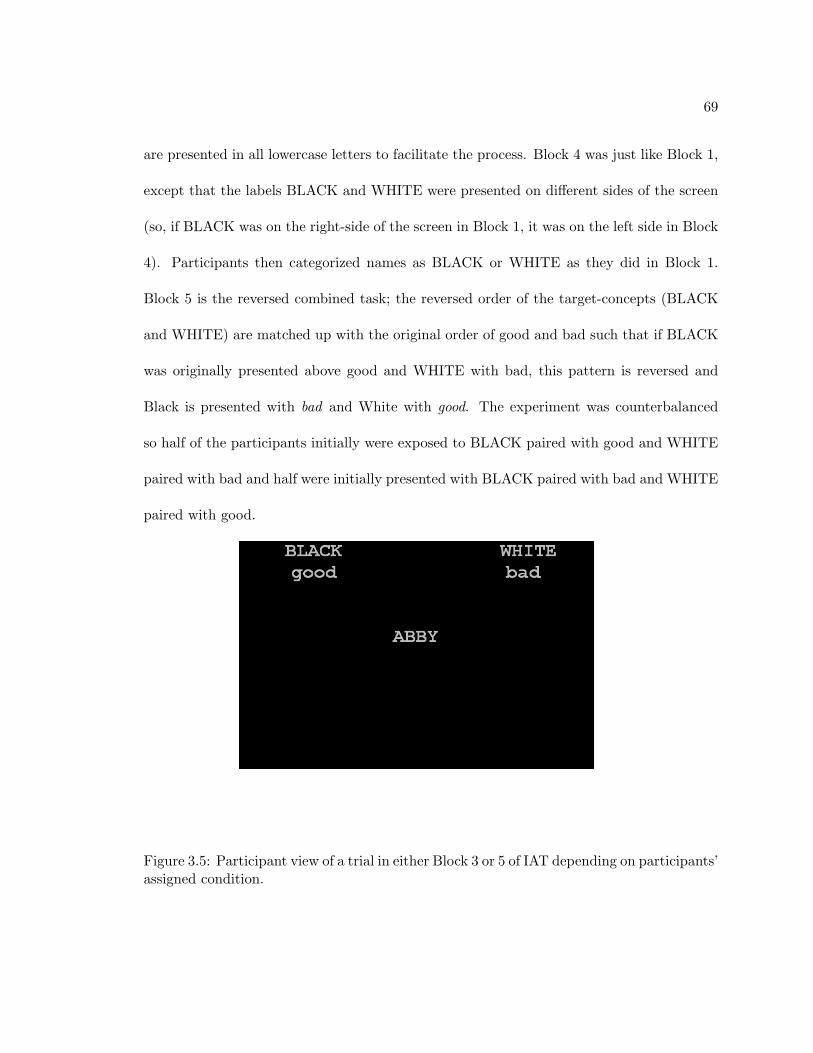
69
are presented in all lowercase letters to facilitate the process. Block 4 was just like Block 1,
except that the labels BLACK and WHITE were presented on different sides of the screen
(so, if BLACK was on the right-side of the screen in Block 1, it was on the left side in Block
4). Participants then categorized names as BLACK or WHITE as they did in Block 1.
Block 5 is the reversed combined task; the reversed order of the target-concepts (BLACK
and WHITE) are matched up with the original order of good and bad such that if BLACK
was originally presented above good and WHITE with bad, this pattern is reversed and
Black is presented with bad and White with good. The experiment was counterbalanced
so half of the participants initially were exposed to BLACK paired with good and WHITE
paired with bad and half were initially presented with BLACK paired with bad and WHITE
paired with good.
Figure 3.5: Participant view of a trial in either Block 3 or 5 of IAT depending on participants’assigned condition.
70
3.3.4 IAT Data Analysis
Participants’ scores were calculated using the updated methods described in Green-
wald et al. (2003). After removing outliers, the mean was calculated for each participant
based on correct responses for each block. One standard deviation was also calculated for
each block. Then, each response error was replaced with the block mean and a 600 ms
penalty. Means were then re-calculated for each block and the difference between these two
blocks was computed. Finally, to get the IAT score, the difference was divided by the stan-
dard deviation previously calculated. These values were used as predictors in the statistical
models for the Black Social Condition described in Chapter 4.
3.4 Predictions
Having reviewed the background literature in Chapter 2 and the task design in
the current chapter, some hypotheses regarding who imitates and what is imitated can
be formulated. Trudgill (2008) argues that phonetic accommodation is automatic to the
point of happening all of the time. Under this hypothesis, everyone should imitate all
vowels and the social measures (IAT scores and Attractiveness Ratings) should not affect
the results, since he considers identity formation to follow accommodation and not be
a prior influence. Communication Accommodation Theory (CAT; Shepard et al. 2001)
clearly claims that social biases determine the degree of accommodation; this theory makes
no prediction regarding which vowels are imitated, but both IAT scores and Attractiveness
Ratings are hypothesized to affect the amount of imitation. Exemplar-based models predict
amount of imitation would be determined by a participant’s previous experiences and what

71
has been amassed in their exemplar stores (Goldinger 1998, Pierrehumbert 2001); from this
no specific hypotheses can be posited since there is no way to gauge the distribution of
tokens in an individual’s memory. Popular psycholinguistic models of accommodation like
the interactive alignment model (Pickering and Garrod 2004b), acknowledge that social
factors may play a role in imitation and defer to work on nonlinguistic accommodation by
Dijksterhuis and Bargh (2001). From this model, we can predict that the social measures
will influence degree of imitation, but not whether there will be differences in which vowels
are accommodated.
The socially sensitive theories make no explicit prediction regarding perceived
attractiveness of an interlocutor, or regarding an interlocutor’s racial group. I intuit that
when attracted to an individual or when favorably viewing a member of a racial group, one
would want to decrease the social distance. Therefore, for socially sensitive theories, the
predictions for the social measures are as follows: participants who rate the talker as more
attractive will be more likely to imitate the acoustic characteristics of the talker’s vowels
and participants who score with a pro-Black bias will be more likely to imitate the vowels
of the Black talker. In all cases it is assumed that imitation decreases the social distance
between the participant and the model talker.
There are also predictions for other factors within the design. For vowels, Trudgill
(1981) predicts that socially salient linguistic variables are more susceptible to imitation (see
discussion above in Section 2.1). By this account we would expect /æ A o u/ to be imitated
(and not /i/), as these are all undergoing sound changes in California English. In terms of
participant gender, we can also make a prediction. Both model talkers for the experiment are
72
male. We would, therefore, expect that male participants would accommodate more since
exact imitation of the male model talkers may actually be possible for male participants.
There is also a prediction for the Block. In exemplar-based theories, the more activation
there is of a token, the stronger the effect it will have on production. So, there should
be more imitation in the last shadowing block (Block 6) than in the first shadowing block
(Block 4). Also, after auditory exposure has ceased in the post-task block (Block 7), we
predict the effect of accommodation to decrease.
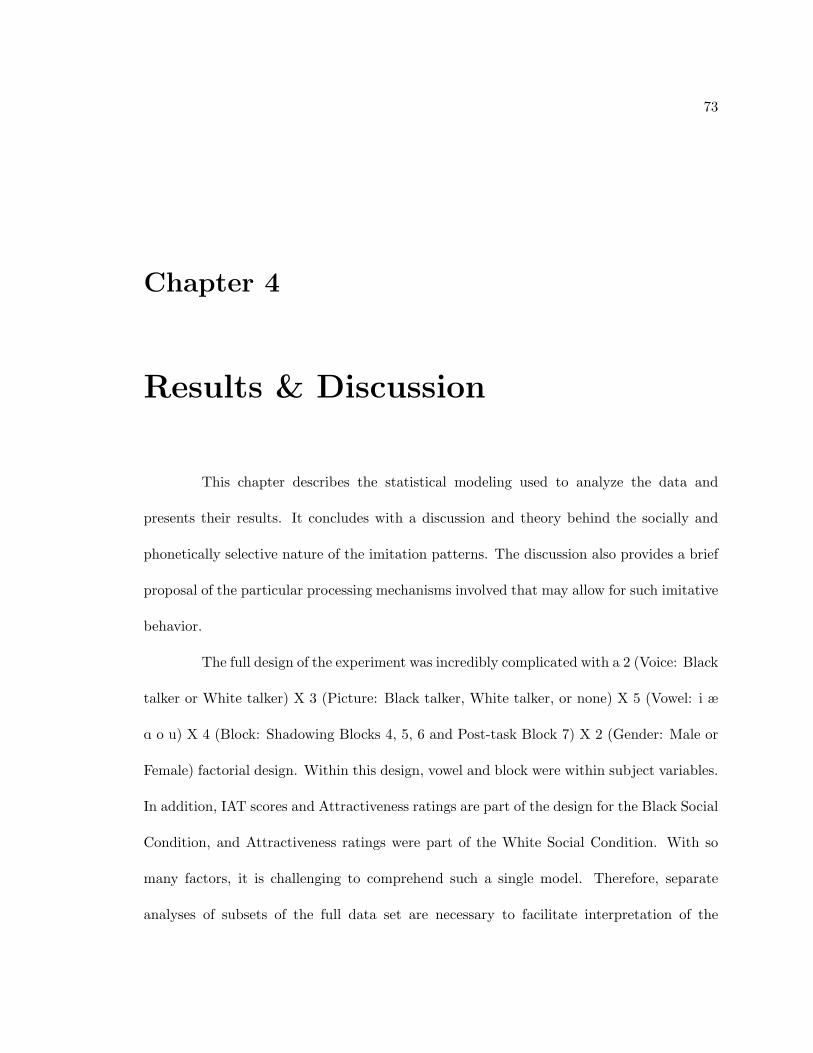
73
Chapter 4
Results & Discussion
This chapter describes the statistical modeling used to analyze the data and
presents their results. It concludes with a discussion and theory behind the socially and
phonetically selective nature of the imitation patterns. The discussion also provides a brief
proposal of the particular processing mechanisms involved that may allow for such imitative
behavior.
The full design of the experiment was incredibly complicated with a 2 (Voice: Black
talker or White talker) X 3 (Picture: Black talker, White talker, or none) X 5 (Vowel: i æ
A o u) X 4 (Block: Shadowing Blocks 4, 5, 6 and Post-task Block 7) X 2 (Gender: Male or
Female) factorial design. Within this design, vowel and block were within subject variables.
In addition, IAT scores and Attractiveness ratings are part of the design for the Black Social
Condition, and Attractiveness ratings were part of the White Social Condition. With so
many factors, it is challenging to comprehend such a single model. Therefore, separate
analyses of subsets of the full data set are necessary to facilitate interpretation of the

74
results.
One simple way to uncomplicate the analysis is to analyze the data from male
and female participants separately. Within each of the male and female subsets, the within-
participant variables Vowel and Block can be fully explored. More complexity in the analyses
can be avoided by looking at at these variables sequentially and systematically across pairs of
cells. Therefore, the analyses are organized in the following way. Section 4.2.1 examines the
two Asocial Conditions. This analysis explores whether one particular talker’s voice elicited
more imitation than the other. Results for the Social and Asocial Conditions with the
Black talker’s voice are given in Section 4.2.2; this analysis examines how visual information
specifically about the Black talker affects imitation. Section 4.2.3 does the same for the
data from the White Asocial and White Social conditions, asking the question of how
visual information about the White talker influences imitative behavior. The analyses in
Sections 4.2.4 and 4.2.5 incorporate the social measures. The next two Sections are for
the Social Conditions only and incorporate the social factors IAT and Attractiveness. In
Section 4.2.4, using data from the Black Social Condition, the question of how IAT scores
and Attractiveness ratings affect accommodation to the Black talker is addressed. For the
White Social Condition, Section 4.2.5 has a mixed model with the Attractiveness Ratings
where we can see how this measure affected accommodation. Section 4.2.6 provides an
analysis of the overall amount of imitation for male and female participants. Finally, a
discussion of the results is given in Section 4.3. In addition to summarizing the results,
Section 4.3 provides a theory that accounts for the findings.

75
4.1 Mixed Effects Modeling
The main approach to the data analysis was mixed effects modeling. Mixed effects
models were hand-fit using the lmer() package for R (R Development Core Team 2008)
described in Baayen (2008).1
The details of the models are provided in each sub-section of Section 4.2 (Results)
below. Mixed models combine random effects – like participant and word – that are ran-
domly sampled from a larger population with fixed effects – like Block, Condition, Vowel,
IAT score, etc. – that are the variables selectively chosen for testing in the experimental
design. The dependent measure in all of the models was the difference in distance
measure. The calculation for this metric was described in Chapter 3. Models were hand-fit
for particular combinations of data so as to address particular questions and hypotheses.
In an effort to avoid over-fitting the models, simpler models for each data set were also
constructed. Simple models were compared to more complex models using a likelihood
ratio test. In all cases the more complex models with the larger degrees of freedom were
justified.2
1The lmer() package does not provide p-values for the models’ resulting t-values. In each analysis below,p-values were estimated using the pvals.fnc() that is associated with the larger languageR() packagedescribed in Baayen (2008).
2Age of participant was a fixed effect that was originally entered into all of the models. In no case did itresult in a better fit and it is not discussed further.

76
4.2 Results
4.2.1 Asocial Conditions
Productions from the two Asocial Conditions – one with the Black talker and
the other with the White talker – were analyzed using a mixed model. This was done to
determine whether one talker’s voice elicited more imitation than the other. Subject and
word were used as random factors in the model while Block, Vowel, and Condition were
entered as fixed effects. Block (Shadowing Blocks 4-6, Post-task Block 7), Vowel (i, æ, A,
o, u), and Condition (Black Asocial and White Asocial) were entered into the model as
potential main effects and interactions.
When predictors are categorical with multiple levels, the model assumes a default
reference level. The reference level is clear when the category has two variables, like Con-
dition where the choice within the model is White Asocial or Black Asocial. For fixed
predictors with more than one category, the model selects a reference level as a default. So,
for example, all experimental blocks are compared against the first shadowing block (Block
4). For vowels, the reference level is /A/. These reference levels hold for all of the models
presented in this chapter.
Male participants
The output for the mixed effects model for productions in the two Asocial Condi-
tions for the male participants is presented in Table 4.1. This table reports the coefficients
of each fixed predictor and the interactions. Overall, this model accounts for 11.1% of the
variance in the data.

77
Figure 4.1 presents the data for the two Asocial Condition across Blocks. In this
figure, the difference in distance measure on the y-axis indicates the amount of phonetic
imitation. A value of zero shows no change in vowel production as a result of auditory
exposure to the model talker. A negative value demonstrates phonetic imitation and a
positive value demonstrates acoustic divergence within the vowel. This figure is suggestive
of a trend toward cumulativity where imitation gets progressively stronger throughout the
shadowing portion of the task. Overall, there is the general impression that there is more
imitation in the last shadowing block (Block 6) than in the previous two shadowing blocks
(Blocks 4 and 5). However, the model summarized in Table 4.1 finds that a main effect for
Block 6 is just beyond the level of significance [β = -0.07, t(8206) = -1.8, p < 0.1] and there
were no other Block main effects. The mixed effects model also reports a significant effect
for Condition [β = -0.26, t(8206) = -4.6, p < 0.001]. There are also two-way interactions
between Condition x Block 7 and Condition and each of the vowels. Three-way interactions
between Condition x Block 7 x /o/ and Condition x Block 7 and /i/ were also found. The
coefficients for these interactions are reported in Table 4.1.
In order to further elucidate patterns, the data were also subjected to repeated
measures of analysis of variance.3 The difference in distance measure was entered as
the dependent variable. Block, Vowel, and Condition were treated as independent variables
and Subject was entered as the error term. There were main effects of Block (F (3, 34) =
7.1, p < 0.001) and Vowel (F (4, 64) = 10.04, p < 0.001), and a single interaction between
Condition x Vowel (F (4, 64) = 3.5, p < 0.05). Post-hoc tests found that Blocks 4, 5, and3Tukey’s Honest Significant Difference test was used in post-hoc testing. Post-hoc repeated measures
Tukey tests were conducted by building a general linear model lme() using the R package nlme and thenrunning the command glht() within the multcomp package. This was the method of pair-wise comparisonfor all of the data reported in Chapter 4.

78
6 (the Shadowing Blocks) exhibited more imitation than Block 7 (Post-task Block) (Blocks
4/7, p < 0.01; Blocks 5/7 and 6/7, p < 0.001). This means that male participant imitation
did not compound across the duration of the Shadowing task. The degree of imitation was
held relatively constant throughout exposure to the model talker. In the ANOVA, there
was no effect of Condition, as had been reported in Table 4.1.
Figure 4.2 presents data for each vowel and block collapsed across the Black Aso-
cial and White Asocial Conditions. The difference in distance measure on the y-axis
indicates the amount of phonetic imitation. A value of zero shows no change in vowel pro-
duction as a result of auditory exposure to the model talker. A negative value demonstrates
phonetic imitation and a positive value demonstrates vocalic divergence. Blocks 4, 5, and 6
are Shadowing Blocks while Block 7 is the Post-task Block. This figure demonstrates prefer-
ential imitation for the low vowels /A/ and /æ/. The behavior for the rounded back vowels
/o/ and /u/ is less predictable, but there is clearly some convergence within these vowels for
male participants in the Shadowing Blocks. Participants’ production of /i/ changes little
throughout the course of the experiment. As reported above, the ANOVA returned a main
effect for Vowel. Post-hoc pair-wise comparisons found that the low vowels were imitated
to the exclusion of all others. The vowels /A/ and /æ/ were imitated more than /i/ (/A/,
p < 0.001; /æ/, p < 0.001), /o/ (/A/, p < 0.05; /æ/, p < 0.01), and /u/ (/A/, p < 0.05;
/æ/, p < 0.01).
In order to see the actual direction of the imitative patterns, we can turn our
attention to Figures 4.3 and 4.4. These are formant plots of the vowel convergence for the
male participants in the Asocial Conditions. The formant values are plotted in the Bark
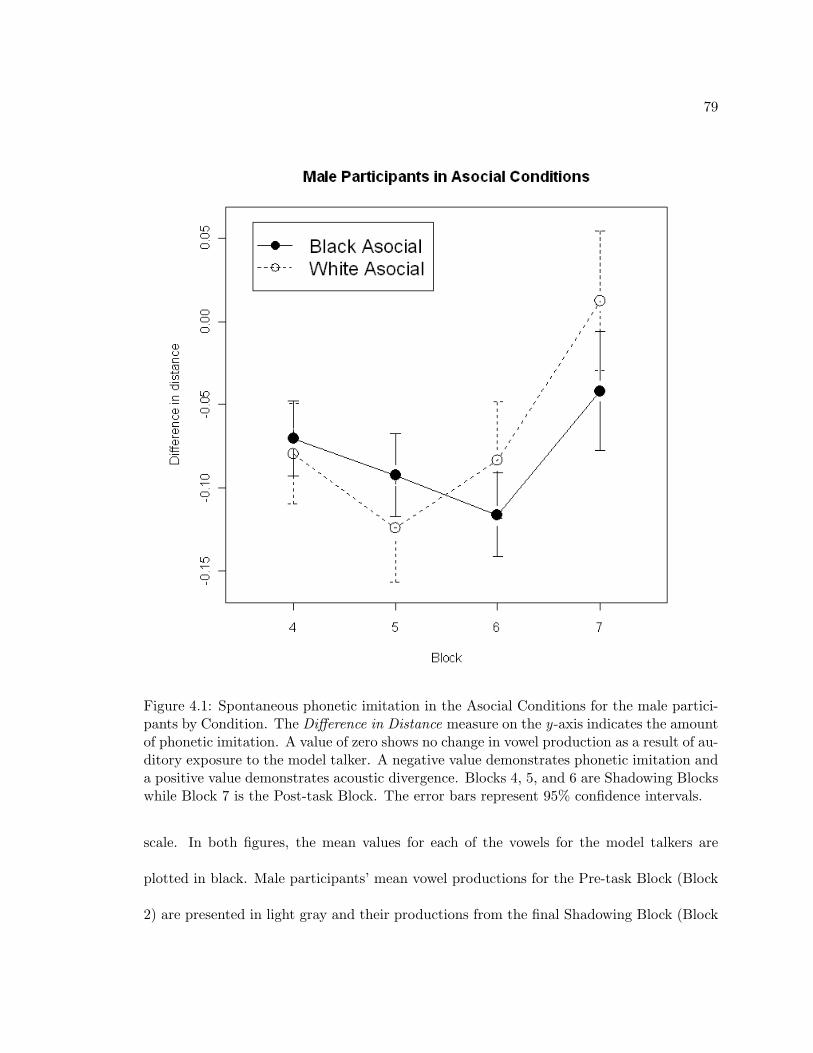
79
Figure 4.1: Spontaneous phonetic imitation in the Asocial Conditions for the male partici-pants by Condition. The Difference in Distance measure on the y-axis indicates the amountof phonetic imitation. A value of zero shows no change in vowel production as a result of au-ditory exposure to the model talker. A negative value demonstrates phonetic imitation anda positive value demonstrates acoustic divergence. Blocks 4, 5, and 6 are Shadowing Blockswhile Block 7 is the Post-task Block. The error bars represent 95% confidence intervals.
scale. In both figures, the mean values for each of the vowels for the model talkers are
plotted in black. Male participants’ mean vowel productions for the Pre-task Block (Block
2) are presented in light gray and their productions from the final Shadowing Block (Block

80
Figure 4.2: Spontaneous phonetic imitation in the Asocial Conditions for each vowel forthe male participants collapsed across Condition. The Difference in Distance measure onthe y-axis indicates the amount of phonetic imitation. A value of zero shows no changein vowel production as a result of auditory exposure to the model talker. A negativevalue demonstrates phonetic imitation and a positive value demonstrates vocalic divergence.Blocks 4, 5, and 6 are Shadowing Blocks while Block 7 is the Post-task Block. The errorbars represent 95% confidence intervals.
6) are plotted in dark gray. The difference in distance values revealed that the phonetic
distance between participants and the model talker to which they were exposed decrease,
but the direction is unspecified. More detail about participants’ response to the auditory

81
stimulus, however, can be gained from the vowel plots. Figure 4.3 and 4.4 demonstrate
some interesting details of imitation. Notice for /A/ in Figure 4.3 for the Black Asocial
Condition, male participants are raising the F2 (and lowering their F1) to approximate the
Black talker’s /A/. For the participants’ /A/ in the White Asocial Condition in Figure 4.4
we see a lowering of F2 (and lowering of F1) in the process of spontaneously imitating his
speech. In addition to this pattern, we see large shifts in participants’ productions of /æ/ in
the direction of the model talkers’ /æ/. For the male participants we see shifts both within
the F1 and F2 dimensions of the vowel space.

82
Figure 4.3: Formant plot displaying the spontaneous phonetic imitation in the Black AsocialCondition for the male participants. Formant values are plotted in the Bark scale. TheBlack model talker’s mean vowels are plotted in black. Male participants’ Pre-task (Block2) vowel means are plotted in light gray and their productions from the Final ShadowingBlock (Block 6) are plotted in dark gray.

83
Effect β Estimate Standard Error t-valueBlock 5 -0.0194052 0.0410142 -0.473Block 6 -0.0730409 0.0410142 -1.781.Block 7 0.0197195 0.0502339 0.393/æ/ -0.0923375 0.0491064 -1.880./i/ 0.0535158 0.0492735 1.086/o/ 0.0368249 0.0496815 0.741/u/ -0.0328904 0.0491403 -0.669White Asocial Condition -0.2601857 0.0562418 -4.626***Block 5 : /æ/ -0.0630178 0.0578348 -1.090Block 6 : /æ/ -0.0119582 0.0578913 -0.207Block 7 : /æ/ 0.0432592 0.0707888 0.611Block 5 : /i/ 0.0153164 0.0581767 0.263Block 6 : /i/ 0.0504283 0.0580890 0.868Block 7 : /i/ -0.0462686 0.0710874 -0.651Block 5 : /o/ -0.0001682 0.0587736 -0.003Block 6 : /o/ -0.0131402 0.0587734 -0.224Block 7 : /o/ -0.0182832 0.0720356 -0.254Block 5 : /u/ 0.0339983 0.0579185 0.587Block 6 : /u/ 0.1074392 0.0578903 1.856.Block 7 : /u/ 0.0655107 0.0710884 0.922Block 5 : White Asocial Condition -0.0298397 0.0610615 -0.489Block 6 : White Asocial Condition 0.0684430 0.0610587 1.121Block 7 : White Asocial Condition 0.2085844 0.0750335 2.780**/æ/ : White Asocial Condition 0.2098722 0.0608648 3.448***/i/ : White Asocial Condition 0.3465310 0.0607313 5.706***/o/ : White Asocial Condition 0.3252074 0.0612799 5.307***/u/ : White Asocial Condition 0.3682474 0.0605861 6.078***Block 5 : /æ/ : White Asocial Condition 0.0765837 0.0860454 0.890Block 6 : /æ/ : White Asocial Condition -0.0442294 0.0861371 -0.513Block 7 : /æ/ : White Asocial Condition -0.1114707 0.1055737 -1.056Block 5 : /i/ : White Asocial Condition 0.0347385 0.0860073 0.404Block 6 : /i/ : White Asocial Condition -0.0038763 0.0859985 -0.045Block 7 : /i/ : White Asocial Condition -0.2198679 0.1054452 -2.085*Block 5 : /o/ : White Asocial Condition -0.0200021 0.0866800 -0.231Block 6 : /o/ : White Asocial Condition -0.0455015 0.0866503 -0.525Block 7 : /o/ : White Asocial Condition -0.2263670 0.1063035 -2.129*Block 5 : /u/ : White Asocial Condition -0.0552634 0.0858063 -0.644Block 6 : /u/ : White Asocial Condition -0.0347244 0.0857856 -0.405Block 7 : /u/ : White Asocial Condition -0.1628811 0.1053389 -1.546
Table 4.1: Fixed Effects for the Asocial Conditions for male participants. Symbols followingthe t-values indicate the associated p-value: ‘***’ p < 0.001, ‘**’ p < 0.01, ‘*’ p < 0.05,and ‘.’ p < 0.1.

84
Figure 4.4: Formant plot displaying the spontaneous phonetic imitation in the White AsocialCondition for the male participants. Formant values are plotted in the Bark scale. TheWhite model talker’s mean vowels are plotted in black. Male participants’ Pre-task (Block2) vowel means are plotted in light gray and their productions from the Final ShadowingBlock (Block 6) are plotted in dark gray.
85
Female participants
The output for the mixed effects model for productions in the two Asocial Condi-
tions for the female participants is presented in Table 4.2. This table reports the coefficients
of each fixed predictor and the interactions. Overall, this model accounts for 13.9% of the
variance in the female Asocial data.
We see in the model summarized in Table 4.2 that there are significant main
effects for the experimental Blocks [Block 5: β = -0.11, t(9883) = –2.3, p < 0.05; Block
6: β = -0.17, t(9883) = -3.4, p < 0.001; Block 7: β = -0.15, t(9883) = -2.5, p < 0.05].
The interactions between Block x Condition do not approach significance. These results
can be seen in Figure 4.5 where the amount of imitation is presented for each Block and
Condition. The difference in distance measure on the y-axis indicates the amount of
phonetic imitation. A value of zero shows no change in vowel production as a result of
auditory exposure to the model talker. A negative value demonstrates phonetic imitation
and a positive value demonstrates acoustic divergence within the vowel.
This figure nicely demonstrates an important result for the female participants: the
effects of auditory exposure are cumulative. Female participants in the Asocial Conditions
increased the amount of imitation of the model talker throughout the Shadowing Blocks.
We reach the maximum amount of imitation in Block 6, the final shadowing block. In
Block 7 the degree of imitation decreases, as evident in the vertical jump along the y-axis
in Figure 4.5. This value, however, remains below 0. What this means is that the effects of
imitation persisted into the Post-task Block.
To further explore the relationships between the variables, a repeated measures

86
ANOVA with difference in distance as the dependent variable, Block, Condition, and
Vowel as predictors, and Subject as the error term was conducted. There were main effects
of Block (F (3, 57) = 8.4, p < 0.001) and Vowel (F (4, 80) = 21.3, p < 0.001). There was
also a significant interaction between Block x Vowel (F (12, 324) = 4.5, p < 0.001). In
post-hoc testing, the significant differences were found between Blocks 4 and 6 (p < 0.001),
verifying the observed effect of cumulativity for the female participants. There were also
significant differences between Blocks 5 and 7 (p < 0.05) and Blocks 6 and 7 (p < 0.001).
Figure 4.6 shows the extent to which vowels are preferentially imitated. For female
participants the low vowels /A/ and /æ/ are cumulatively imitated across Blocks. At the
same time /o u i/ show little change across blocks. Auditory exposure to the model talkers’
/A/ and /æ/ modified the production of these vowels, but the production targets of the
other three vowels were not affected by the model talkers’ auditory targets. Recall from
the Methodology Chapter that phonetic distance is calculated as the Euclidean distance –
a measure which takes displacement within the first and second formant into consideration.
As such, the directionality of imitation cannot be determined from Figures 4.6. The manner
in which participants’ productions shift toward those of the model talker is shown in Figures
4.7 and 4.8. These are formant plots of vowel convergence for the female participants in
the Asocial Conditions. The formant values are plotted in the Bark scale. In both figures,
the mean values for each of the vowels for the model talkers are plotted in black. Female
participants mean vowel productions for the Pre-task Block (Block 2) are presented in
light gray and their productions from the final Shadowing Block (Block 6) are plotted
in dark gray. From these figures we can attain a better understanding of the direction
87
Figure 4.5: Spontaneous phonetic imitation in the Asocial Conditions for the female partic-ipants collapsed across vowel. The Difference in Distance measure on the y-axis indicatesthe amount of phonetic imitation. A value of zero shows no change in vowel production asa result of auditory exposure to the model talker. A negative value demonstrates phoneticimitation and a positive value demonstrates vocalic divergence. Blocks 4-6 are ShadowingBlocks while Block 7 is the Post-task Block. Responses in the Black Asocial Condition areshown with the filled circles. Responses in the White Asocial Condition are shown with theunfilled circles. The error bars represent 95% confidence intervals.
of phonetic imitation. The difference in distance values revealed that the phonetic
distance between participants and the model talker to which they were exposed did indeed

88
shrink. More detail about participants’ response to the auditory stimulus, however, can be
gained from the vowel plots. We see in these figures that the majority of female imitation
comes within the F1 dimension of the low vowels. The mean values for /A/ and /æ/ in the
Final Shadowing Block are lower than in the female’s pre-task productions.
After finding the main effect of Vowel in the analysis of variance, preferential
imitation for low vowels was examined with post-hoc testing. Like the male participants,
we find for the females that /A/ and /æ/ are imitated to the exclusion of /i/ (/A/, p <
0.01; /æ/, p < 0.001), /o/ (/A/ and /æ/, p < 0.001), and /u/ (/A/ and /æ/, p < 0.001).

89
Figure 4.6: Spontaneous phonetic imitation in the Asocial Conditions for the female partic-ipants by vowel. The Difference in Distance measure on the y-axis indicates the amount ofphonetic imitation. A value of zero shows no change in vowel production as a result of au-ditory exposure to the model talker. A negative value demonstrates phonetic imitation anda positive value demonstrates vocalic divergence. Blocks 4, 5, and 6 are Shadowing Blockswhile Block 7 is the Post-task Block. The error bars represent 95% confidence intervals.

90
Effect β Estimate Standard Error t-valueBlock 5 -0.109544 0.049164 -2.228*Block 6 -0.166413 0.049471 -3.364***Block 7 -0.153203 0.060129 -2.548*/æ/ -0.211337 0.064303 -3.287**/i/ 0.022455 0.064204 0.350/o/ -0.012751 0.064473 -0.198/u/ 0.017326 0.063958 0.271White Asocial Condition -0.148324 0.074405 -1.993*Block 5 : /æ/ 0.037134 0.069166 0.537Block 6 : /æ/ 0.001613 0.069412 0.023Block 7 : /æ/ 0.253945 0.084266 3.014**Block 5 : /i/ 0.089710 0.068959 1.301Block 6 : /i/ 0.154351 0.069208 2.230*Block 7 : /i/ 0.182935 0.084280 2.171*Block 5 : /o/ 0.107792 0.069464 1.552Block 6 : /o/ 0.139944 0.069712 2.007*Block 7 : /o/ 0.187703 0.084954 2.209*Block 5 : /u/ 0.157365 0.068590 2.294*Block 6 : /u/ 0.161015 0.068839 2.339*Block 7 : /u/ 0.250354 0.083911 2.984**Block 5 : White Asocial Condition -0.008292 0.070258 -0.118Block 6 : White Asocial Condition -0.014674 0.070510 -0.208Block 7 : White Asocial Condition 0.112567 0.086044 1.308/æ/ : White Asocial Condition 0.126906 0.070017 1.813./i/ : White Asocial Condition 0.183920 0.069829 2.634**/o/ : White Asocial Condition 0.291227 0.070137 4.152***/u/ : White Asocial Condition 0.149767 0.069633 2.151*Block 5 : /æ/ : White Asocial Condition -0.060304 0.099109 -0.608Block 6 : /æ/ : White Asocial Condition -0.012822 0.099381 -0.129Block 7 : /æ/ : White Asocial Condition -0.094700 0.120826 -0.784Block 5 : /i/ : White Asocial Condition 0.035102 0.098731 0.356Block 6 : /i/ : White Asocial Condition 0.005183 0.098909 0.052Block 7 : /i/ : White Asocial Condition -0.154197 0.120855 -1.276Block 5 : /o/ : White Asocial Condition 0.031013 0.099107 0.313Block 6 : /o/ : White Asocial Condition 0.029434 0.099352 0.296Block 7 : /o/ : White Asocial Condition -0.179805 0.121363 -1.482Block 5 : /u/ : White Asocial Condition 0.004617 0.098429 0.047Block 6 : /u/ : White Asocial Condition 0.025050 0.098628 0.254Block 7 : /u/ : White Asocial Condition -0.084401 0.120468 -0.701
Table 4.2: Fixed effects output for the mixed effects model composed of the data from theAsocial Condition for the female participants. Symbols following the t-values indicate theassociated p-value: ‘***’ p < 0.001, ‘**’ p < 0.01, ‘*’ p < 0.05, and ‘.’ p < 0.1.
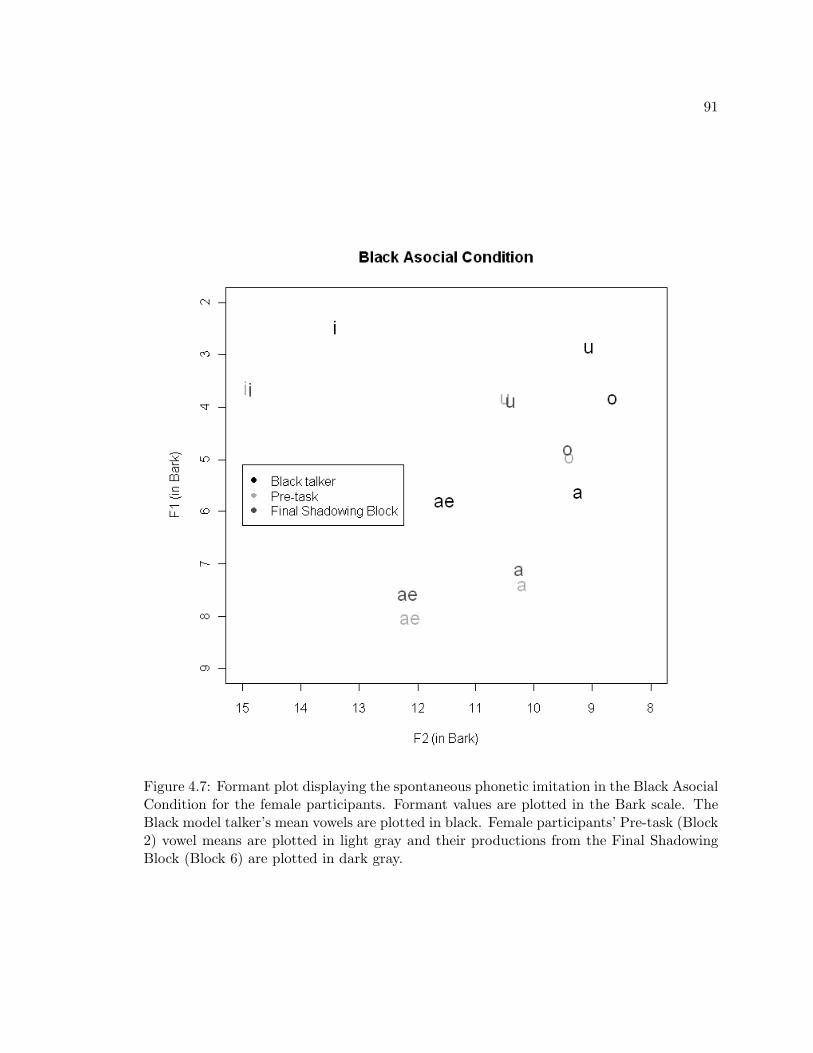
91
Figure 4.7: Formant plot displaying the spontaneous phonetic imitation in the Black AsocialCondition for the female participants. Formant values are plotted in the Bark scale. TheBlack model talker’s mean vowels are plotted in black. Female participants’ Pre-task (Block2) vowel means are plotted in light gray and their productions from the Final ShadowingBlock (Block 6) are plotted in dark gray.

92
Figure 4.8: Formant plot displaying the spontaneous phonetic imitation in the White AsocialCondition for the female participants. Formant values are plotted in the Bark scale. TheWhite model talker’s mean vowels are plotted in black. Female participants’ Pre-task (Block2) vowel means are plotted in light gray and their productions from the Final ShadowingBlock (Block 6) are plotted in dark gray.
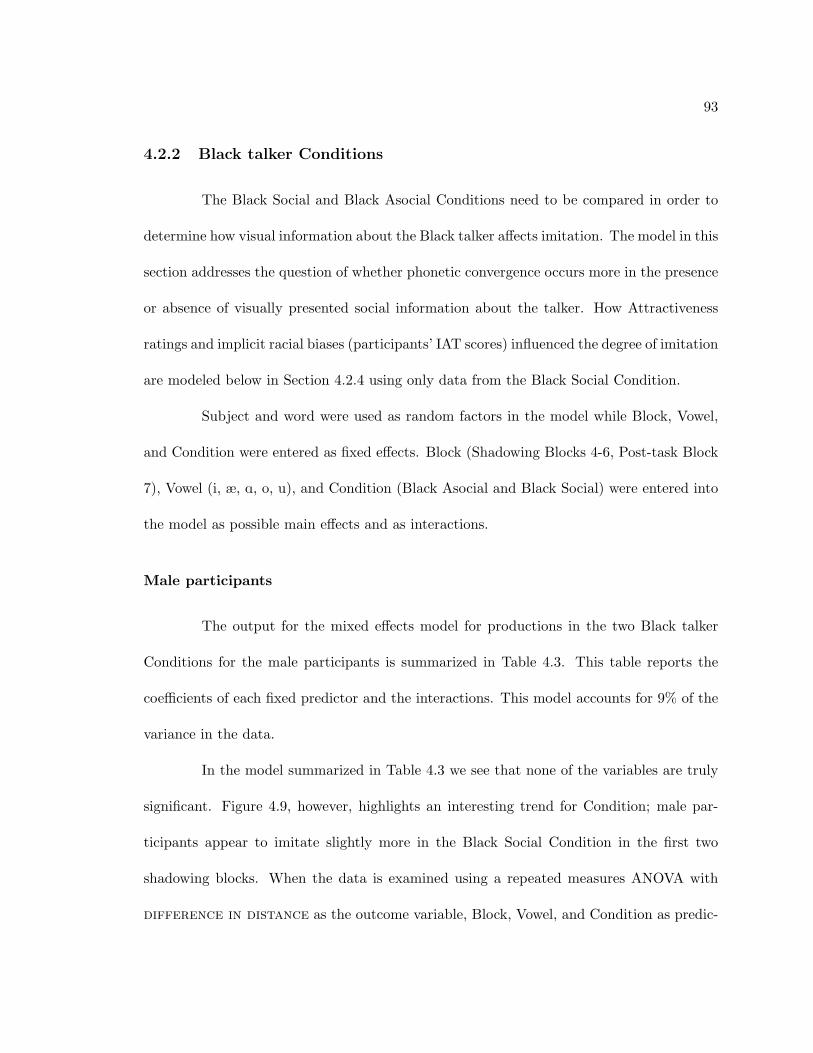
93
4.2.2 Black talker Conditions
The Black Social and Black Asocial Conditions need to be compared in order to
determine how visual information about the Black talker affects imitation. The model in this
section addresses the question of whether phonetic convergence occurs more in the presence
or absence of visually presented social information about the talker. How Attractiveness
ratings and implicit racial biases (participants’ IAT scores) influenced the degree of imitation
are modeled below in Section 4.2.4 using only data from the Black Social Condition.
Subject and word were used as random factors in the model while Block, Vowel,
and Condition were entered as fixed effects. Block (Shadowing Blocks 4-6, Post-task Block
7), Vowel (i, æ, A, o, u), and Condition (Black Asocial and Black Social) were entered into
the model as possible main effects and as interactions.
Male participants
The output for the mixed effects model for productions in the two Black talker
Conditions for the male participants is summarized in Table 4.3. This table reports the
coefficients of each fixed predictor and the interactions. This model accounts for 9% of the
variance in the data.
In the model summarized in Table 4.3 we see that none of the variables are truly
significant. Figure 4.9, however, highlights an interesting trend for Condition; male par-
ticipants appear to imitate slightly more in the Black Social Condition in the first two
shadowing blocks. When the data is examined using a repeated measures ANOVA with
difference in distance as the outcome variable, Block, Vowel, and Condition as predic-
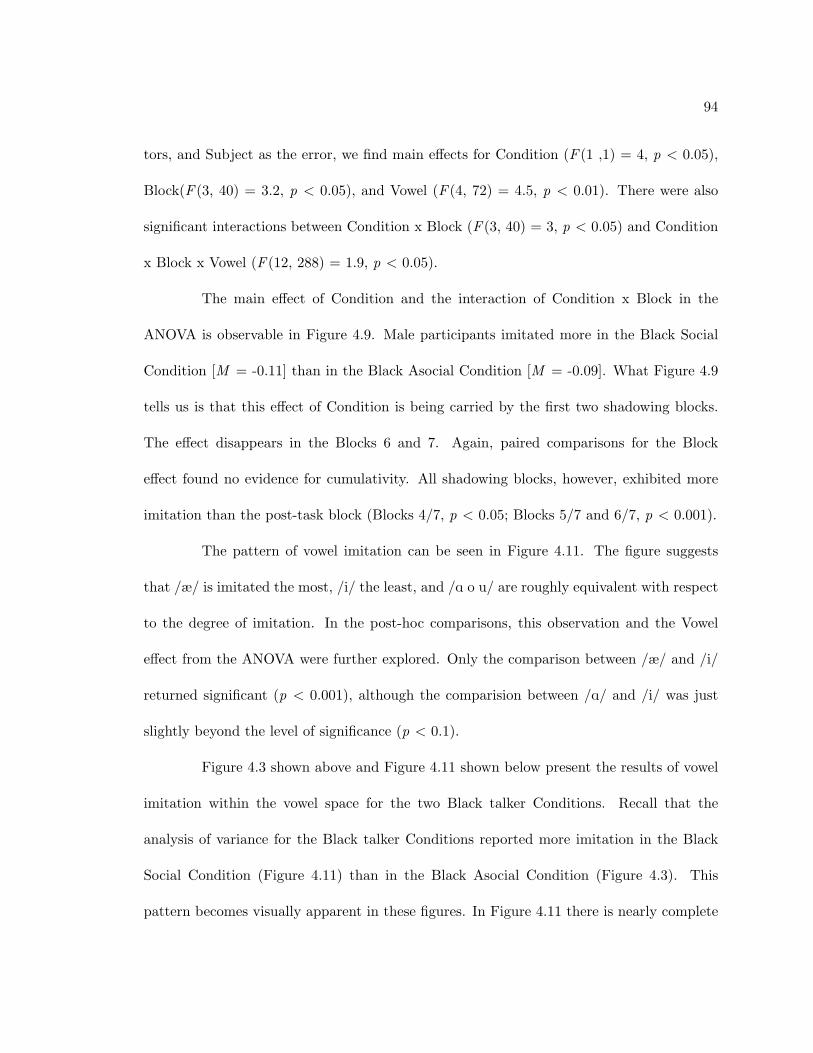
94
tors, and Subject as the error, we find main effects for Condition (F (1 ,1) = 4, p < 0.05),
Block(F (3, 40) = 3.2, p < 0.05), and Vowel (F (4, 72) = 4.5, p < 0.01). There were also
significant interactions between Condition x Block (F (3, 40) = 3, p < 0.05) and Condition
x Block x Vowel (F (12, 288) = 1.9, p < 0.05).
The main effect of Condition and the interaction of Condition x Block in the
ANOVA is observable in Figure 4.9. Male participants imitated more in the Black Social
Condition [M = -0.11] than in the Black Asocial Condition [M = -0.09]. What Figure 4.9
tells us is that this effect of Condition is being carried by the first two shadowing blocks.
The effect disappears in the Blocks 6 and 7. Again, paired comparisons for the Block
effect found no evidence for cumulativity. All shadowing blocks, however, exhibited more
imitation than the post-task block (Blocks 4/7, p < 0.05; Blocks 5/7 and 6/7, p < 0.001).
The pattern of vowel imitation can be seen in Figure 4.11. The figure suggests
that /æ/ is imitated the most, /i/ the least, and /A o u/ are roughly equivalent with respect
to the degree of imitation. In the post-hoc comparisons, this observation and the Vowel
effect from the ANOVA were further explored. Only the comparison between /æ/ and /i/
returned significant (p < 0.001), although the comparision between /A/ and /i/ was just
slightly beyond the level of significance (p < 0.1).
Figure 4.3 shown above and Figure 4.11 shown below present the results of vowel
imitation within the vowel space for the two Black talker Conditions. Recall that the
analysis of variance for the Black talker Conditions reported more imitation in the Black
Social Condition (Figure 4.11) than in the Black Asocial Condition (Figure 4.3). This
pattern becomes visually apparent in these figures. In Figure 4.11 there is nearly complete

95
Figure 4.9: Spontaneous phonetic imitation in the Black talker Conditions for the maleparticipants. The Difference in Distance measure on the y-axis indicates the amount ofphonetic imitation. A value of zero shows no change in vowel production as a result ofauditory exposure to the model talker. A negative value demonstrates phonetic imitationand a positive value demonstrates vocalic divergence. Blocks 4, 5, and 6 are ShadowingBlocks while Block 7 is the Post-task Block. The error bars represent 95% confidenceintervals.
overlap in participants’ productions in the final shadowing block for /æ/ and /A/. A large
part of this imitation is within the F1 dimension, but for /A/ there is also clear movement
within F2. For /o/ we also see movement within both F1 and F2.
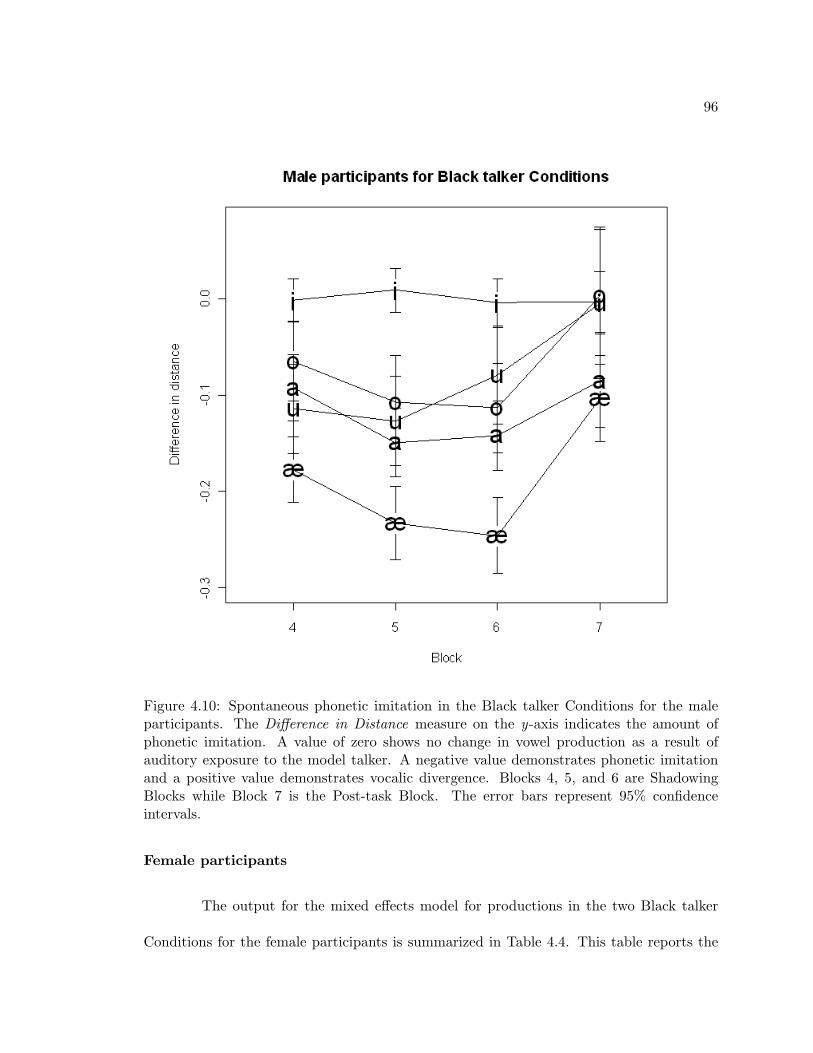
96
Figure 4.10: Spontaneous phonetic imitation in the Black talker Conditions for the maleparticipants. The Difference in Distance measure on the y-axis indicates the amount ofphonetic imitation. A value of zero shows no change in vowel production as a result ofauditory exposure to the model talker. A negative value demonstrates phonetic imitationand a positive value demonstrates vocalic divergence. Blocks 4, 5, and 6 are ShadowingBlocks while Block 7 is the Post-task Block. The error bars represent 95% confidenceintervals.
Female participants
The output for the mixed effects model for productions in the two Black talker
Conditions for the female participants is summarized in Table 4.4. This table reports the

97
Figure 4.11: Formant plot displaying the spontaneous phonetic imitation in the Black SocialCondition for the male participants. Formant values are plotted in the Bark scale. TheBlack model talker’s mean vowels are plotted in black. Female participants’ Pre-task (Block2) vowel means are plotted in light gray and their productions from the Final ShadowingBlock (Block 6) are plotted in dark gray.
coefficients of each fixed predictor and the interactions. This model accounts for 10.2% of
the variance in the data.
While the effect of Condition is not significant in the model, Figure 4.12 demon-
strates the consistent trend that female participants imitated the Black talker’s voice more

98
in the Asocial Condition. That is, when the Black talker’s image was not presented as part
of the task, there was more imitation.
The effect of experimental block is also apparent in Figure 4.12. As summarized
in Table 4.4, each of the Blocks were significant predictors in the mixed model [Block 5: β
= -0.11, t(9839) = -2.3, p < 0.01; Block 6: β = -0.17, t(9839) = -3.5, p < 0.001; Block 7: β
= -0.15, t(9839) = -2.6, p < 0.001]. The observation that female participants imitate more
after longer periods of exposure to the talker holds true. A repeated measures ANOVA
with difference in distance as the dependent variable, Block, Condition, and Vowel as
independent variables, and Subject as the error term was run. It revealed main effects of
Block (F (3, 57) = 11.2, p < 0.001) and Vowel (F (4, 79) = 8.7, p < 0.001). There was
also a significant interaction between Vowel x Block (F (12, 324) = 4.5, p < 0.001). In the
post-hoc tests with Block, we again find how imitation compounds for female participants
across shadowing blocks. Female participants imitated more in Block 6 than in Block 4 (p
< 0.01) and Block 5 (p < 0.05). They also exhibited more imitation in Block 6 than in
Block 7 (p < 0.01).
Figure 4.13 demonstrates selective vowel imitation. Here we see a slight depar-
ture from what we have seen previously. Figure 4.13 suggests that /æ/ is imitated to the
exclusion of other vowels. The main effect of Vowel in the ANOVA was followed up with
post-hoc tests. Paired-comparisons confirmed the observation. They revealed that /æ/
elicits imitation, while none of the other vowels do; /æ/ was imitated more than /A/ and
/o/ (p < 0.01) and /u/ and /i/ (p < 0.001).
As reported above, for the Black talker Conditions, /æ/ exhibited the most im-

99
Figure 4.12: Spontaneous phonetic imitation in the Black talker Conditions for each vowelfor the female participants collapsed across Condition. The Difference in Distance measureon the y-axis indicates the amount of phonetic imitation. A value of zero shows no changein vowel production as a result of auditory exposure to the model talker. A negativevalue demonstrates phonetic imitation and a positive value demonstrates vocalic divergence.Blocks 4, 5, and 6 are Shadowing Blocks while Block 7 is the Post-task Block. The errorbars represent 95% confidence intervals.
itation of all of the vowels. Figure 4.7 shown above displays the vowel specific behavior
in a vowel plot for the Black Asocial Condition. The vowel patterns for the Black Social
Condition are shown in Figure 4.14. Here it is apparent that for the female participants in

100
Figure 4.13: Spontaneous phonetic imitation in the Black talker Conditions for the femaleparticipants. The Difference in Distance measure on the y-axis indicates the amount ofphonetic imitation. A value of zero shows no change in vowel production as a result ofauditory exposure to the model talker. A negative value demonstrates phonetic imitationand a positive value demonstrates vocalic divergence. Blocks 4, 5, and 6 are ShadowingBlocks while Block 7 is the Post-task Block. The error bars represent 95% confidenceintervals.
this condition, the first formant of /æ/ is being lowered to approximate that of the model
male talker.

101
Figure 4.14: Formant plot displaying the spontaneous phonetic imitation in the Black SocialCondition for the female participants. Formant values are plotted in the Bark scale. TheBlack model talker’s mean vowels are plotted in black. Female participants’ Pre-task (Block2) vowel means are plotted in light gray and their productions from the Final ShadowingBlock (Block 6) are plotted in dark gray.
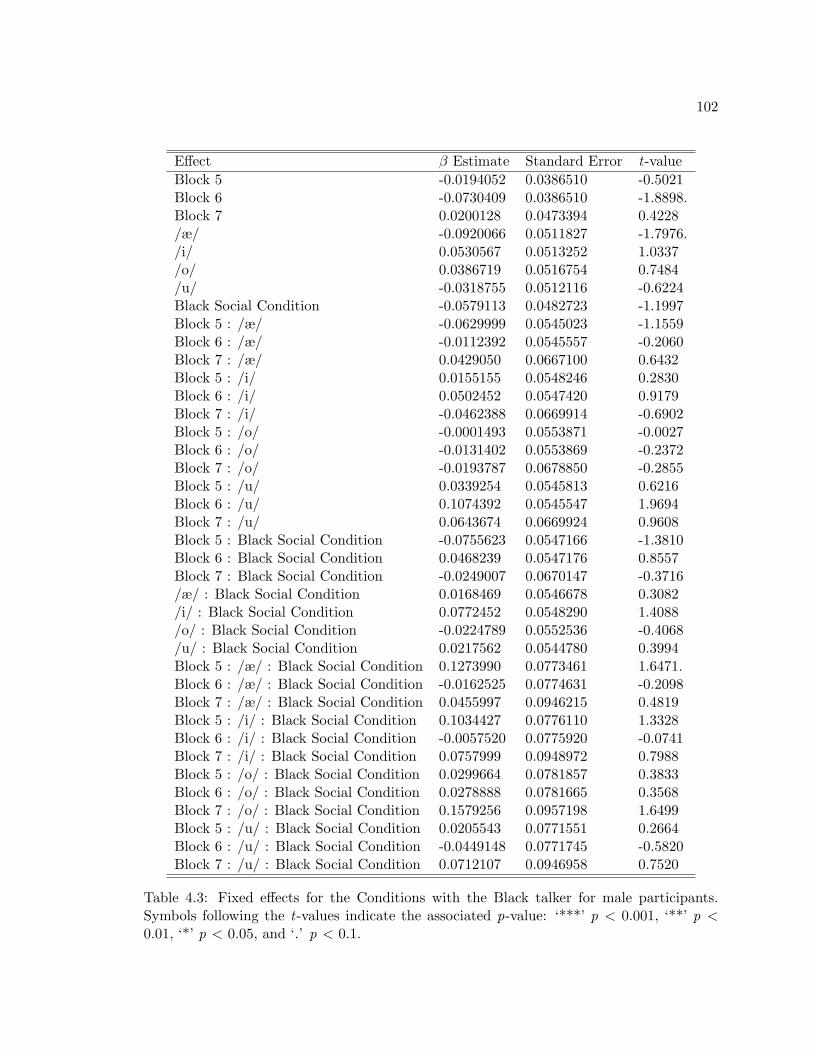
102
Effect β Estimate Standard Error t-valueBlock 5 -0.0194052 0.0386510 -0.5021Block 6 -0.0730409 0.0386510 -1.8898.Block 7 0.0200128 0.0473394 0.4228/æ/ -0.0920066 0.0511827 -1.7976./i/ 0.0530567 0.0513252 1.0337/o/ 0.0386719 0.0516754 0.7484/u/ -0.0318755 0.0512116 -0.6224Black Social Condition -0.0579113 0.0482723 -1.1997Block 5 : /æ/ -0.0629999 0.0545023 -1.1559Block 6 : /æ/ -0.0112392 0.0545557 -0.2060Block 7 : /æ/ 0.0429050 0.0667100 0.6432Block 5 : /i/ 0.0155155 0.0548246 0.2830Block 6 : /i/ 0.0502452 0.0547420 0.9179Block 7 : /i/ -0.0462388 0.0669914 -0.6902Block 5 : /o/ -0.0001493 0.0553871 -0.0027Block 6 : /o/ -0.0131402 0.0553869 -0.2372Block 7 : /o/ -0.0193787 0.0678850 -0.2855Block 5 : /u/ 0.0339254 0.0545813 0.6216Block 6 : /u/ 0.1074392 0.0545547 1.9694Block 7 : /u/ 0.0643674 0.0669924 0.9608Block 5 : Black Social Condition -0.0755623 0.0547166 -1.3810Block 6 : Black Social Condition 0.0468239 0.0547176 0.8557Block 7 : Black Social Condition -0.0249007 0.0670147 -0.3716/æ/ : Black Social Condition 0.0168469 0.0546678 0.3082/i/ : Black Social Condition 0.0772452 0.0548290 1.4088/o/ : Black Social Condition -0.0224789 0.0552536 -0.4068/u/ : Black Social Condition 0.0217562 0.0544780 0.3994Block 5 : /æ/ : Black Social Condition 0.1273990 0.0773461 1.6471.Block 6 : /æ/ : Black Social Condition -0.0162525 0.0774631 -0.2098Block 7 : /æ/ : Black Social Condition 0.0455997 0.0946215 0.4819Block 5 : /i/ : Black Social Condition 0.1034427 0.0776110 1.3328Block 6 : /i/ : Black Social Condition -0.0057520 0.0775920 -0.0741Block 7 : /i/ : Black Social Condition 0.0757999 0.0948972 0.7988Block 5 : /o/ : Black Social Condition 0.0299664 0.0781857 0.3833Block 6 : /o/ : Black Social Condition 0.0278888 0.0781665 0.3568Block 7 : /o/ : Black Social Condition 0.1579256 0.0957198 1.6499Block 5 : /u/ : Black Social Condition 0.0205543 0.0771551 0.2664Block 6 : /u/ : Black Social Condition -0.0449148 0.0771745 -0.5820Block 7 : /u/ : Black Social Condition 0.0712107 0.0946958 0.7520
Table 4.3: Fixed effects for the Conditions with the Black talker for male participants.Symbols following the t-values indicate the associated p-value: ‘***’ p < 0.001, ‘**’ p <0.01, ‘*’ p < 0.05, and ‘.’ p < 0.1.

103
Effect β Estimate Standard Error t-valueBlock 5 -0.1086440 0.0472476 -2.299*Block 6 -0.1654352 0.0475430 -3.480***Block 7 -0.1522879 0.0577849 -2.635**/æ/ -0.2100330 0.0612410 -3.430***/i/ 0.0258172 0.0611456 0.422/o/ -0.0104833 0.0614066 -0.171/u/ 0.0199022 0.0609072 0.327Black Social Condition 0.1021552 0.0649609 1.573Block 5 : /æ/ 0.0358487 0.0664695 0.539Block 6 : /æ/ 0.0011119 0.0667067 0.017Block 7 : /æ/ 0.2543609 0.0809810 3.141**Block 5 : /i/ 0.0884468 0.0662714 1.335Block 6 : /i/ 0.1531226 0.0665107 2.302*Block 7 : /i/ 0.1818845 0.0809953 2.246*Block 5 : /o/ 0.1072382 0.0667563 1.606Block 6 : /o/ 0.1403367 0.0669948 2.095*Block 7 : /o/ 0.1876176 0.0816424 2.298*Block 5 : /u/ 0.1565793 0.0659167 2.375*Block 6 : /u/ 0.1609613 0.0661556 2.433*Block 7 : /u/ 0.2494390 0.0806400 3.093**Block 5 : Black Social Condition 0.0335676 0.0677104 0.496Block 6 : Black Social Condition 0.0622385 0.0680134 0.915Block 7 : Black Social Condition 0.1561213 0.0830571 1.880./æ/ : Black Social Condition -0.0677113 0.0674834 -1.003/i/ : Black Social Condition -0.1113764 0.0675578 -1.649./o/ : Black Social Condition -0.0399574 0.0676280 -0.591/u/ : Black Social Condition -0.1042350 0.0672144 -1.551Block 5 : /æ/ : Black Social Condition -0.0522500 0.0953345 -0.548Block 6 : /æ/ : Black Social Condition 0.0006579 0.0954574 0.007Block 7 : /æ/ : Black Social Condition -0.0298693 0.1164488 -0.257Block 5 : /i/ : Black Social Condition -0.0070687 0.0953762 -0.074Block 6 : /i/ : Black Social Condition -0.0670097 0.0955893 -0.701Block 7 : /i/ : Black Social Condition -0.1581834 0.1167693 -1.355Block 5 : /o/ : Black Social Condition -0.0966409 0.0954448 -1.013Block 6 : /o/ : Black Social Condition -0.1970371 0.0956803 -2.059*Block 7 : /o/ : Black Social Condition -0.3120244 0.1169818 -2.667**Block 5 : /u/ : Black Social Condition -0.0414154 0.0948818 -0.436Block 6 : /u/ : Black Social Condition -0.0973257 0.0951165 -1.023Block 7 : /u/ : Black Social Condition -0.3516227 0.1163021 -3.023**
Table 4.4: Fixed Effects for the Conditions with the Black talker for female participants.Symbols following the t-values indicate the associated p-value: ‘***’ p < 0.001, ‘**’ p <0.01, ‘*’ p < 0.05, and ‘.’ p < 0.1.

104
4.2.3 White talker Conditions
Like the Black talker Conditions, the White talker Social and Asocial Conditions
need to be paired in a model to determine the extent to which visually presented social
information about the talker affects the degree of imitation.
Again, participant and word were used as random factors in the model while Block,
Vowel and Condition were entered as fixed effects. Block (Shadowing Blocks 4-6, Post-task
Block 7), Vowel (i, æ, A, o, u), and Condition (White Asocial and White Social) were entered
into the model as possible main effects and as interactions.
Male participants
The output for the mixed effects model for productions in the two White talker
Conditions for the male participants is summarized in Table 4.5. This table reports the
coefficients of each fixed predictor and the interactions. The model accounts for 12.7% of
the variance in the data.
Figure 4.15 demonstrates the trend for male participants to imitate more in the
social condition. This trend, however, exists in the final shadowing block and in the post-
test block. This is a reversed trend for what we saw for the Black talker Conditions in
Figure 4.9 where convergence was stronger in Shadowing Blocks 4 and 5 and disappeared
in Blocks 6 and 7. The mixed effects model reported a significant effect for Block 7 [β =
0.23, t(7774) = 4.1, p < 0.001]. From Figure 4.15 we can surmise that the three shadowing
blocks differ very little in terms of amount of imitation.
An ANOVA with Block, Vowel, and Condition as predictors, difference in dis-

105
tance as the dependent variable, and Subject as the error term, returned with significant
effects for Block (F (3, 31) = 10.5, p < 0.001) and Vowel (F (4, 60) = 13, p < 0.001).
There was also a significant interaction between Block x Vowel (F (12, 252) = 2, p < 0.05).
Pairwise comparisons for the effect of Block found no differences in the amount of imita-
tion between the shadowing blocks, but significant differences between all three shadowing
blocks and the post-test block (Blocks 4/7, p < 0.05; Blocks 5/7, p < 0.01; Blocks 6/7, p
< 0.001).
Figure 4.16 visually presents the preferential imitation of vowels. Male partici-
pants’ convergent behavior for the White talker’s vowels clearly targets some vowels more
than others. When the main effect of Vowel was followed up in post-hoc tests, we find that
/A/ was imitated more than /i o u/ (p < 0.001) and /æ/ was imitated more than /i/ (p <
0.001) and /u/ (p < 0.01).
Having verified differences in degree of imitation between vowels, we can turn our
attention to Figures 4.4 and 4.17 and observe the directions of the vowel changes within the
formant plots space. The White model talker produced low vowels with a very low F2; the
average F1 of these vowels was also lower than that of the male participants. In Figures 4.4
and 4.17 we see that male participants imitated these low vowels with respect to F1 and
F2. We see lowering of both of these formants in the participant productions in response
to the model talker’s tokens.

106
Figure 4.15: Spontaneous phonetic imitation in the White talker Conditions for the maleparticipants. The Difference in Distance measure on the y-axis indicates the amount ofphonetic imitation. A value of zero shows no change in vowel production as a result ofauditory exposure to the model talker. A negative value demonstrates phonetic imitationand a positive value demonstrates vocalic divergence. Blocks 4, 5, and 6 are ShadowingBlocks while Block 7 is the Post-task Block. The error bars represent 95% confidenceintervals.

107
Effect β Estimate Standard Error t-valueBlock 5 -0.048432 0.053827 -0.900Block 6 -0.004825 0.053822 -0.090Block 7 0.227250 0.066324 3.426***/æ/ 0.120081 0.067513 1.779/i/ 0.402604 0.067170 5.994***/o/ 0.365226 0.067464 5.414***/u/ 0.337949 0.067122 5.035***White Social Condition 0.049216 0.070160 0.701Block 5 : /æ/ 0.012943 0.075808 0.171Block 6 : /æ/ -0.055802 0.075894 -0.735Block 7 : /æ/ -0.066796 0.093201 -0.717Block 5 : /i/ 0.049236 0.075376 0.653Block 6 : /i/ 0.047074 0.075457 0.624Block 7 : /i/ -0.264881 0.092672 -2.858**Block 5 : /o/ -0.021289 0.075810 -0.281Block 6 : /o/ -0.059125 0.075761 -0.780Block 7 : /o/ -0.244307 0.093022 -2.626**Block 5 : /u/ -0.022306 0.075332 -0.296Block 6 : /u/ 0.073194 0.075329 0.972Block 7 : /u/ -0.096316 0.092499 -1.041Block 5 : White Social Condition -0.005918 0.074410 -0.080Block 6 : White Social Condition -0.111483 0.074526 -1.496Block 7 : White Social Condition -0.134351 0.091458 -1.469/æ/ : White Social Condition 0.002186 0.074240 0.029/i/ : White Social Condition -0.051744 0.073896 -0.700/o/ : White Social Condition -0.196861 0.074437 -2.645**/u/ : White Social Condition -0.062475 0.073844 -0.846Block 5 : /æ/ : White Social Condition -0.019940 0.105089 -0.190Block 6 : /æ/ : White Social Condition 0.120515 0.105320 1.144Block 7 : /æ/ : White Social Condition -0.040762 0.128930 -0.316Block 5 : /i/ : White Social Condition -0.033262 0.104612 -0.318Block 6 : /i/ : White Social Condition 0.065939 0.104865 0.629Block 7 : /i/ : White Social Condition 0.108689 0.128349 0.847Block 5 : /o/ : White Social Condition 0.069660 0.105312 0.661Block 6 : /o/ : White Social Condition 0.196747 0.105536 1.864.Block 7 : /o/ : White Social Condition 0.234965 0.129309 1.817.Block 5 : /u/ : White Social Condition 0.102733 0.104608 0.982Block 6 : /u/ : White Social Condition 0.005663 0.104719 0.054Block 7 : /u/ : White Social Condition 0.061808 0.128224 0.482
Table 4.5: Fixed effects for the Conditions with the White talker for male participants.Symbols following the t-values indicate the associated p-value: ‘***’ p < 0.001, ‘**’ p <0.01, ‘*’ p < 0.05, and ‘.’ p < 0.1.
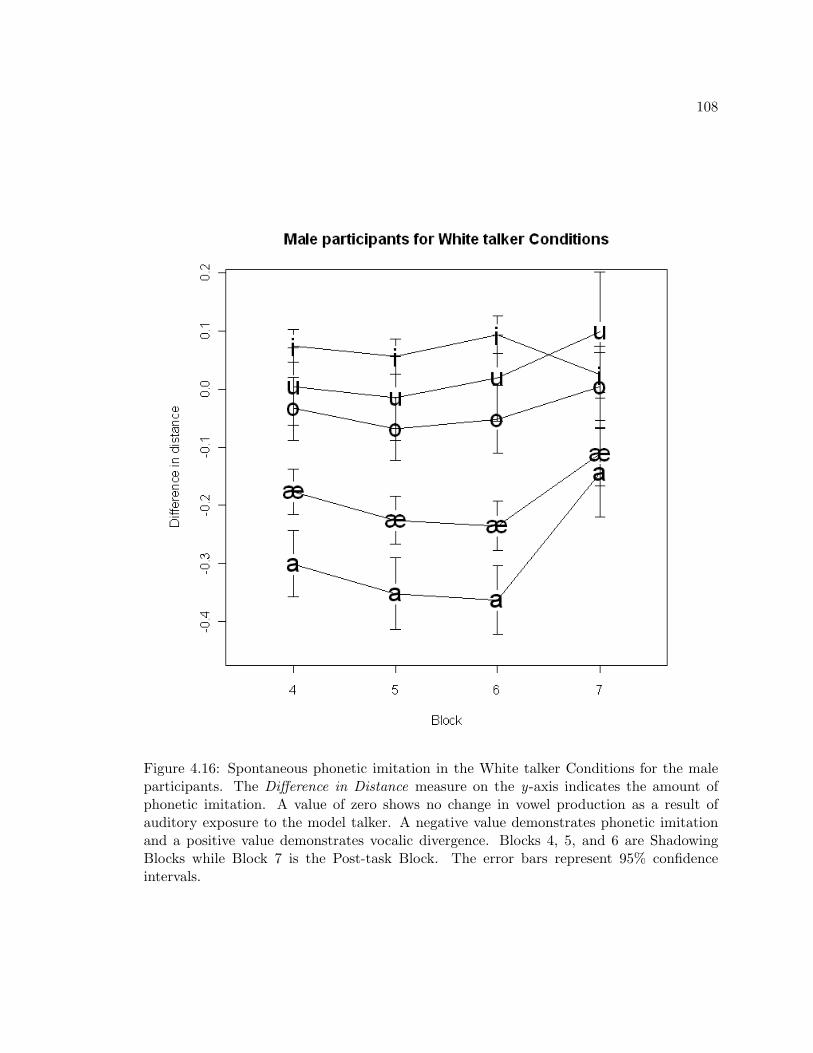
108
Figure 4.16: Spontaneous phonetic imitation in the White talker Conditions for the maleparticipants. The Difference in Distance measure on the y-axis indicates the amount ofphonetic imitation. A value of zero shows no change in vowel production as a result ofauditory exposure to the model talker. A negative value demonstrates phonetic imitationand a positive value demonstrates vocalic divergence. Blocks 4, 5, and 6 are ShadowingBlocks while Block 7 is the Post-task Block. The error bars represent 95% confidenceintervals.
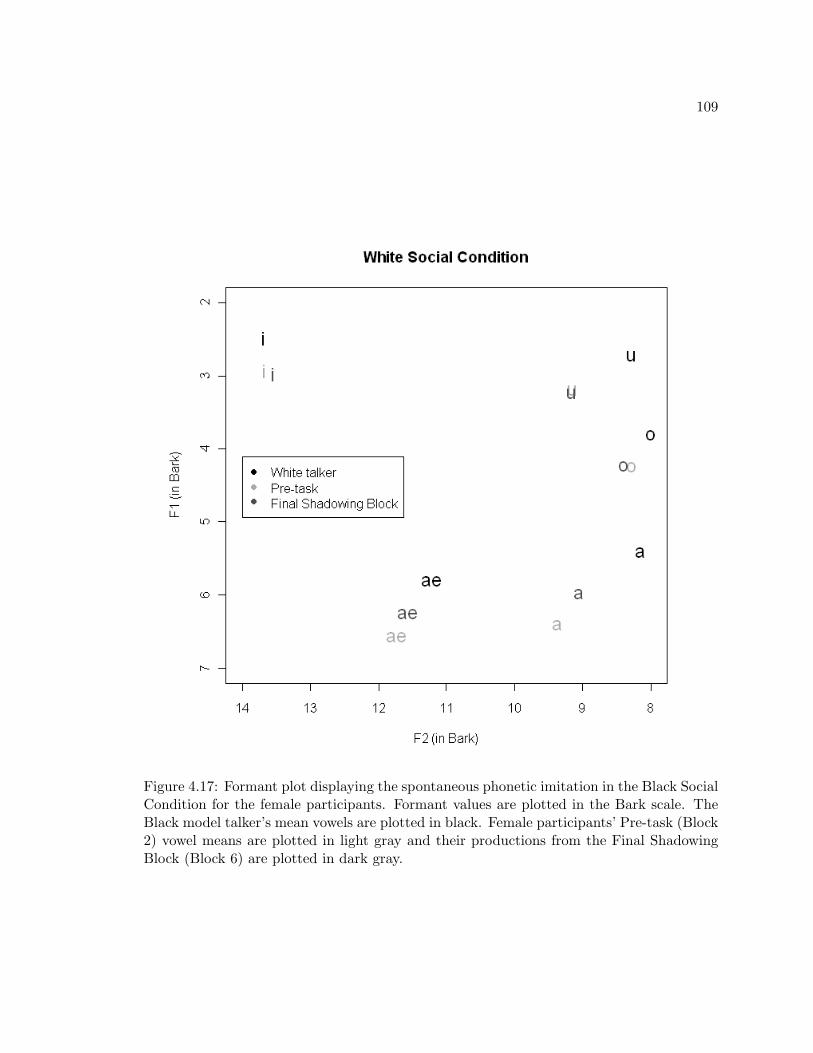
109
Figure 4.17: Formant plot displaying the spontaneous phonetic imitation in the Black SocialCondition for the female participants. Formant values are plotted in the Bark scale. TheBlack model talker’s mean vowels are plotted in black. Female participants’ Pre-task (Block2) vowel means are plotted in light gray and their productions from the Final ShadowingBlock (Block 6) are plotted in dark gray.
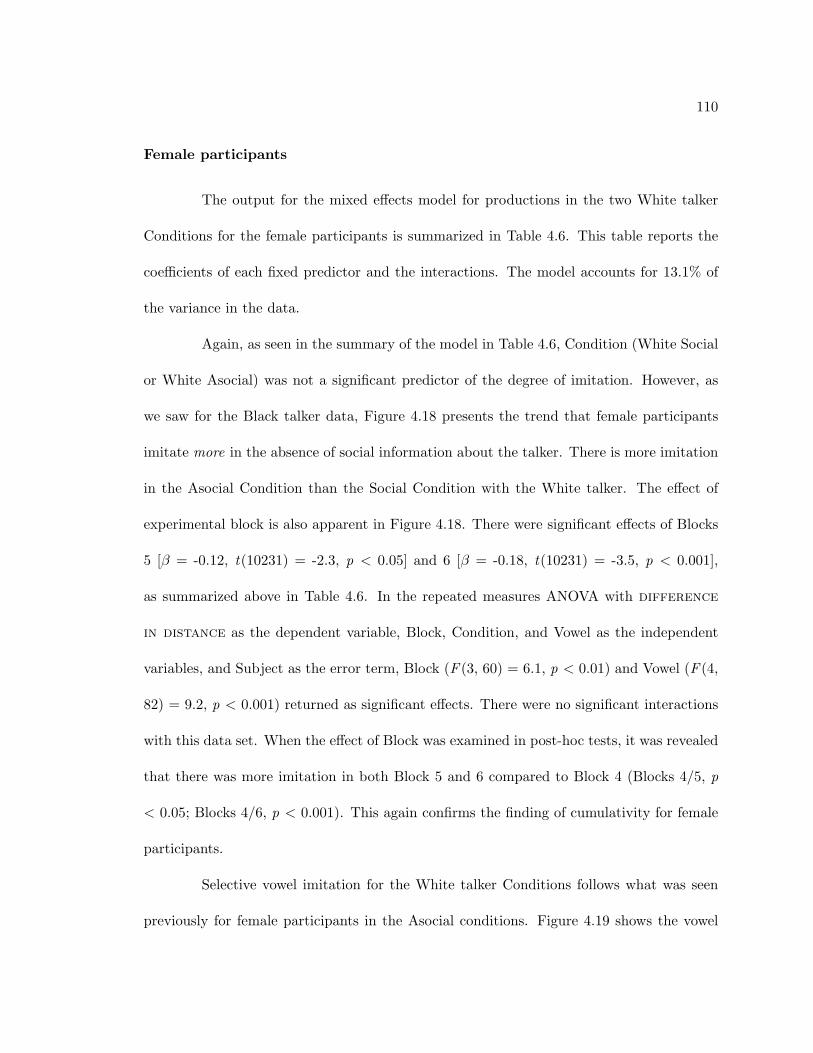
110
Female participants
The output for the mixed effects model for productions in the two White talker
Conditions for the female participants is summarized in Table 4.6. This table reports the
coefficients of each fixed predictor and the interactions. The model accounts for 13.1% of
the variance in the data.
Again, as seen in the summary of the model in Table 4.6, Condition (White Social
or White Asocial) was not a significant predictor of the degree of imitation. However, as
we saw for the Black talker data, Figure 4.18 presents the trend that female participants
imitate more in the absence of social information about the talker. There is more imitation
in the Asocial Condition than the Social Condition with the White talker. The effect of
experimental block is also apparent in Figure 4.18. There were significant effects of Blocks
5 [β = -0.12, t(10231) = -2.3, p < 0.05] and 6 [β = -0.18, t(10231) = -3.5, p < 0.001],
as summarized above in Table 4.6. In the repeated measures ANOVA with difference
in distance as the dependent variable, Block, Condition, and Vowel as the independent
variables, and Subject as the error term, Block (F (3, 60) = 6.1, p < 0.01) and Vowel (F (4,
82) = 9.2, p < 0.001) returned as significant effects. There were no significant interactions
with this data set. When the effect of Block was examined in post-hoc tests, it was revealed
that there was more imitation in both Block 5 and 6 compared to Block 4 (Blocks 4/5, p
< 0.05; Blocks 4/6, p < 0.001). This again confirms the finding of cumulativity for female
participants.
Selective vowel imitation for the White talker Conditions follows what was seen
previously for female participants in the Asocial conditions. Figure 4.19 shows the vowel

111
Figure 4.18: Spontaneous phonetic imitation in the White talker Conditions for the femaleparticipants. The Difference in Distance measure on the y-axis indicates the amount ofphonetic imitation. A value of zero shows no change in vowel production as a result ofauditory exposure to the model talker. A negative value demonstrates phonetic imitationand a positive value demonstrates vocalic divergence. Blocks 4, 5, and 6 are ShadowingBlocks while Block 7 is the Post-task Block. The error bars represent 95% confidenceintervals.
data for each block collapsed across the White talker Conditions. The difference in
distance measure on the y-axis indicates the amount of phonetic imitation. A value of
zero shows no change in vowel production as a result of auditory exposure to the model

112
talker. A negative value demonstrates phonetic imitation and a positive value demonstrates
vocalic divergence. Blocks 4, 5, and 6 are Shadowing Blocks while Block 7 is the Post-task
Block. The mixed model (Table 4.6) reports vowels /i o u/ as significant predictors. When
the Vowel effect from the ANOVA was subjected to pairwise comparisons we find that /A/
is imitated more than /i/ (p < 0.01), /o/ (p < 0.001), and /u/ (p < 0.01). There is also
more imitation for /æ/ than the non-low vowels /i/ (p < 0.01), /o/ (p < 0.001), and /u/
(p < 0.01).
Referring back to Figure 4.8 and looking now to Figure 4.20, it is apparent again
that the majority of imitation for female participants is within the F1 dimension of the low
vowels /æ/ and /A/.

113
Figure 4.19: Spontaneous phonetic imitation in the White talker Conditions for the femaleparticipants. The Difference in Distance measure on the y-axis indicates the amount ofphonetic imitation. A value of zero shows no change in vowel production as a result ofauditory exposure to the model talker. A negative value demonstrates phonetic imitationand a positive value demonstrates vocalic divergence. Blocks 4, 5, and 6 are ShadowingBlocks while Block 7 is the Post-task Block. The error bars represent 95% confidenceintervals.

114
Effect β Estimate Standard Error t-valueBlock 5 -0.1178489 0.0521456 -2.260*Block 6 -0.1804212 0.0521967 -3.457***Block 7 -0.0410161 0.0639487 -0.641/æ/ -0.0832439 0.0695822 -1.196/i/ 0.2068981 0.0694780 2.978**/o/ 0.2791269 0.0695483 4.013***/u/ 0.1682921 0.0695112 2.421*White Social Condition 0.0474621 0.0763566 0.622Block 5 : /æ/ -0.0236991 0.0737497 -0.321Block 6 : /æ/ -0.0133030 0.0738912 -0.180Block 7 : /æ/ 0.1593013 0.0899680 1.771.Block 5 : /i/ 0.1247540 0.0734100 1.699.Block 6 : /i/ 0.1587588 0.0734132 2.163*Block 7 : /i/ 0.0288970 0.0899949 0.321Block 5 : /o/ 0.1393723 0.0734423 1.898.Block 6 : /o/ 0.1689417 0.0735449 2.297*Block 7 : /o/ 0.0084598 0.0900492 0.094Block 5 : /u/ 0.1610702 0.0733446 2.196*Block 6 : /u/ 0.1847390 0.0733813 2.518*Block 7 : /u/ 0.1656000 0.0898080 1.844.Block 5 : White Social Condition 0.0661251 0.0712086 0.929Block 6 : White Social Condition 0.0557803 0.0712192 0.783Block 7 : White Social Condition 0.1377287 0.0872635 1.578/æ/ : White Social Condition 0.1211463 0.0712024 1.701./i/ : White Social Condition -0.0712158 0.0710193 -1.003/o/ : White Social Condition -0.1464361 0.0714011 -2.051*/u/ : White Social Condition 0.0006323 0.0708903 0.009Block 5 : /æ/ : White Social Condition 0.0266125 0.1009179 0.264Block 6 : /æ/ : White Social Condition 0.0006518 0.1011161 0.006Block 7 : /æ/ : White Social Condition -0.1953692 0.1235207 -1.582Block 5 : /i/ : White Social Condition -0.0603554 0.1006100 -0.600Block 6 : /i/ : White Social Condition -0.0310936 0.1005935 -0.309Block 7 : /i/ : White Social Condition -0.0714586 0.1233646 -0.579Block 5 : /o/ : White Social Condition -0.1316522 0.1010478 -1.303Block 6 : /o/ : White Social Condition -0.0909841 0.1010634 -0.900Block 7 : /o/ : White Social Condition -0.1853009 0.1237095 -1.498Block 5 : /u/ : White Social Condition -0.1924278 0.1003374 -1.918.Block 6 : /u/ : White Social Condition -0.1063702 0.1003269 -1.060Block 7 : /u/ : White Social Condition -0.2615501 0.1229492 -2.127*
Table 4.6: Fixed effects for the Conditions with the White talker for female participants.Symbols following the t-values indicate the associated p-value: ‘***’ p < 0.001, ‘**’ p <0.01, ‘*’ p < 0.05, and ‘.’ p < 0.1.

115
Figure 4.20: Spontaneous phonetic imitation in the White Social condition for the femaleparticipants.

116
4.2.4 Black Social Condition
Using the productions from the Black Social Condition, we can construct a model
of how participants’ judgments of the talker’s attractiveness and their racial bias scores (as
measured by the Implicit Association Task) shape imitation patterns. Since it is assumed
that any potential social effect would be intensified during the social “interaction” itself,
only productions from the shadowed blocks were used in the model. For the Black Social
Condition mixed models, participant and word were entered as random effects while Vowel
(i, æ, A, o, u), Attractiveness ratings (a number on a scale of 1-10), and IAT scores (a
continuous value measuring racial bias) were entered as fixed effects.
Male participants
The output of the mixed effects model for the male participants in the Black Social
Condition for the social factors (IAT score and Attractiveness ratings) is given in Table 4.7.
This model accounts for 12.2% of the variance in the data.
There was no main effect of IAT score on degree of imitation for the Black talker
with male participants. For the Social data, in addition to constructing a mixed model,
simple linear regressions were fit to each vowel category subset to look for more subtle
effects. The intercept, slopes, and Adjusted R2 values for each vowel subset where IAT
scores are fit to the difference in distance measure are reported in the top half of
Table 4.8. Only the models for for /æ/ and /o/ provided significant results, meaning the
degree to which these vowels were imitated was affected by the degree of racial bias of
the participant. A negative IAT score signals a pro-Black bias and a positive IAT score
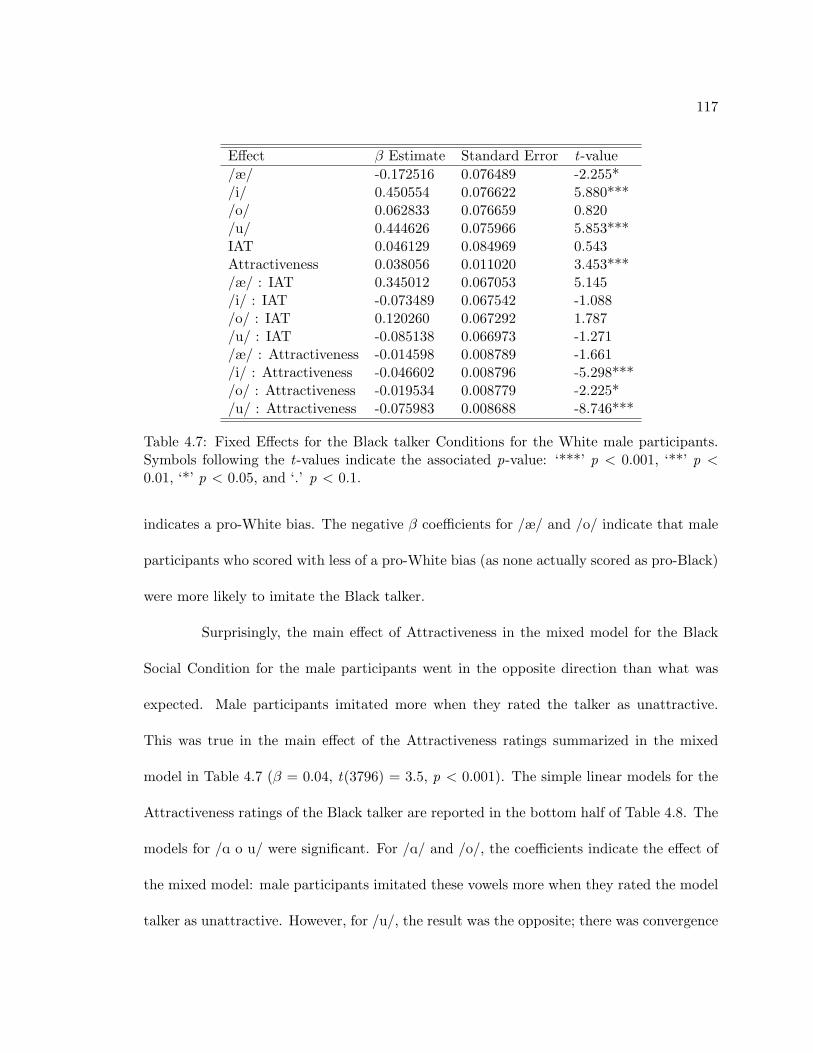
117
Effect β Estimate Standard Error t-value/æ/ -0.172516 0.076489 -2.255*/i/ 0.450554 0.076622 5.880***/o/ 0.062833 0.076659 0.820/u/ 0.444626 0.075966 5.853***IAT 0.046129 0.084969 0.543Attractiveness 0.038056 0.011020 3.453***/æ/ : IAT 0.345012 0.067053 5.145/i/ : IAT -0.073489 0.067542 -1.088/o/ : IAT 0.120260 0.067292 1.787/u/ : IAT -0.085138 0.066973 -1.271/æ/ : Attractiveness -0.014598 0.008789 -1.661/i/ : Attractiveness -0.046602 0.008796 -5.298***/o/ : Attractiveness -0.019534 0.008779 -2.225*/u/ : Attractiveness -0.075983 0.008688 -8.746***
Table 4.7: Fixed Effects for the Black talker Conditions for the White male participants.Symbols following the t-values indicate the associated p-value: ‘***’ p < 0.001, ‘**’ p <0.01, ‘*’ p < 0.05, and ‘.’ p < 0.1.
indicates a pro-White bias. The negative β coefficients for /æ/ and /o/ indicate that male
participants who scored with less of a pro-White bias (as none actually scored as pro-Black)
were more likely to imitate the Black talker.
Surprisingly, the main effect of Attractiveness in the mixed model for the Black
Social Condition for the male participants went in the opposite direction than what was
expected. Male participants imitated more when they rated the talker as unattractive.
This was true in the main effect of the Attractiveness ratings summarized in the mixed
model in Table 4.7 (β = 0.04, t(3796) = 3.5, p < 0.001). The simple linear models for the
Attractiveness ratings of the Black talker are reported in the bottom half of Table 4.8. The
models for /A o u/ were significant. For /A/ and /o/, the coefficients indicate the effect of
the mixed model: male participants imitated these vowels more when they rated the model
talker as unattractive. However, for /u/, the result was the opposite; there was convergence
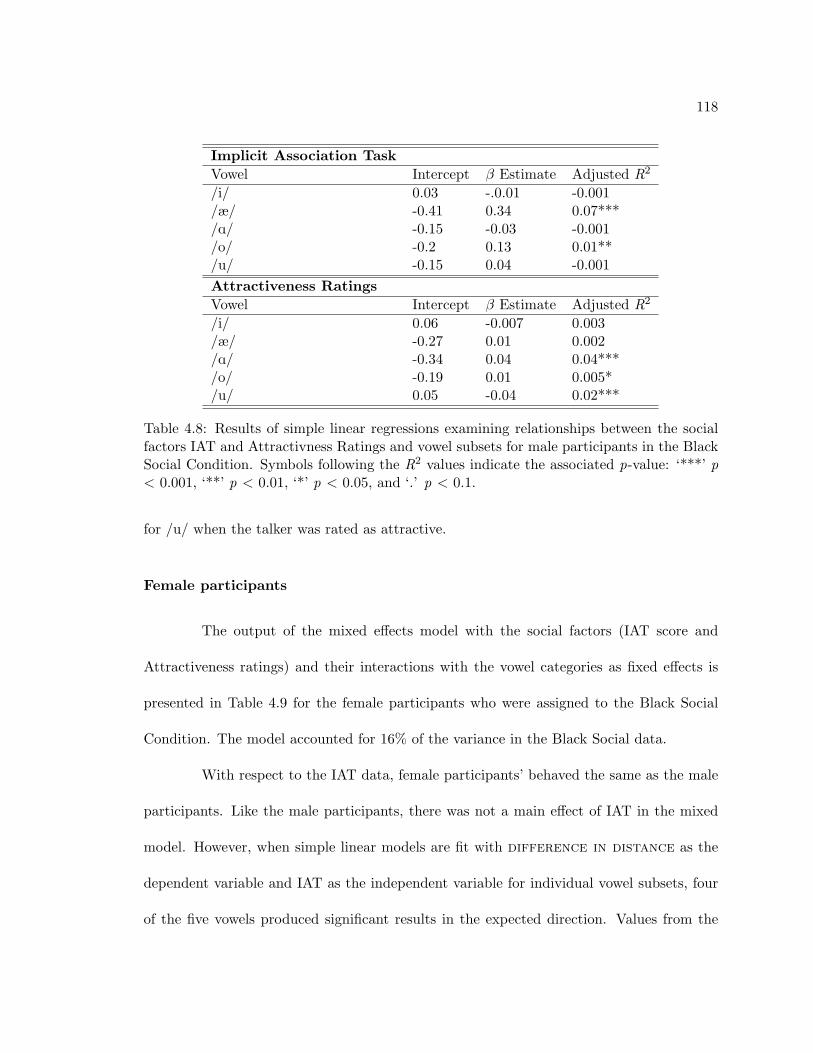
118
Implicit Association TaskVowel Intercept β Estimate Adjusted R2
/i/ 0.03 -.0.01 -0.001/æ/ -0.41 0.34 0.07***/A/ -0.15 -0.03 -0.001/o/ -0.2 0.13 0.01**/u/ -0.15 0.04 -0.001Attractiveness RatingsVowel Intercept β Estimate Adjusted R2
/i/ 0.06 -0.007 0.003/æ/ -0.27 0.01 0.002/A/ -0.34 0.04 0.04***/o/ -0.19 0.01 0.005*/u/ 0.05 -0.04 0.02***
Table 4.8: Results of simple linear regressions examining relationships between the socialfactors IAT and Attractivness Ratings and vowel subsets for male participants in the BlackSocial Condition. Symbols following the R2 values indicate the associated p-value: ‘***’ p< 0.001, ‘**’ p < 0.01, ‘*’ p < 0.05, and ‘.’ p < 0.1.
for /u/ when the talker was rated as attractive.
Female participants
The output of the mixed effects model with the social factors (IAT score and
Attractiveness ratings) and their interactions with the vowel categories as fixed effects is
presented in Table 4.9 for the female participants who were assigned to the Black Social
Condition. The model accounted for 16% of the variance in the Black Social data.
With respect to the IAT data, female participants’ behaved the same as the male
participants. Like the male participants, there was not a main effect of IAT in the mixed
model. However, when simple linear models are fit with difference in distance as the
dependent variable and IAT as the independent variable for individual vowel subsets, four
of the five vowels produced significant results in the expected direction. Values from the

119
Effect β Estimate Standard Error t-value/æ/ -0.68114 0.15398 -4.424***/i/ -0.54040 0.15508 -3.485***/o/ -0.89789 0.15386 -5.836***/u/ -1.95802 0.15399 -12.715***IAT -0.08203 0.13777 -0.595Attractiveness -0.12905 0.03273 -3.942***/æ/ : IAT 0.16669 0.09454 1.763/i/ : IAT -0.11072 0.09548 -1.160/o/ : IAT 0.24324 0.09437 2.577**/u/ : IAT 0.47373 0.09428 5.025***/æ/ : Attractiveness 0.06217 0.02235 2.782**/i/ : Attractiveness 0.09272 0.02251 4.120***/o/ : Attractiveness 0.13498 0.02233 6.046***/u/ : Attractiveness 0.31808 0.02238 14.212***
Table 4.9: Fixed Effects for the Black Social Condition for the White female participants.Symbols following the t-values indicate the associated p-value: ‘***’ p < 0.001, ‘**’ p <0.01, ‘*’ p < 0.05, and ‘.’ p < 0.1.
simple linear models are summarized in the top half of Table 4.10. A negative IAT score
indicates a pro-Black bias and a positive IAT score indicates a pro-White bias. Thus, for /i
æ A o/ we find negative β values which indicate that female participants with a pro-Black
bias were more likely to imitate the /i æ A o/ productions by the Black talker.
The mixed model for the Black Social Condition data revealed a main effect of
Attractiveness rating [β = -0.13, t(4083) = -3.9, p < 0.001] and interactions between the
vowel categories and this rating. This data is summarized in Table 4.9. In Table 4.10 we
see the results of simple linear regression conducted on vowel subsets for the Attractiveness
Rating data for the female participants. For the vowels that returned significant results,
there are mixed results. For /æ/ and /A/ – the vowels that were most imitated for female
participants – we find that female participants are more likely to imitate these vowels when
the have given the model talker a high Attractiveness rating. We find more imitation

120
Implicit Association TaskVowel Intercept β Estimate Adjusted R2
/i/ -0.02 0.09 0.01**/æ/ -0.34 0.26 0.03***/A/ -0.05 0.25 0.02***/o/ -0.1 0.15 0.01*/u/ -0.01 -0.09 0.001Attractiveness RatingsVowel Intercept β Estimate Adjusted R2
/i/ 0.03 -0.01 0.002/æ/ 0.17 -0.08 0.05***/A/ 0.68 -0.12 0.09***/o/ 0.03 -0.02 0.0004/u/ -0.79 0.13 0.07***
Table 4.10: Results of simple linear regressions examining relationships between the socialfactors IAT and Attractivness Ratings and vowel subsets for female participants in theBlack Social Condition. Symbols following the R2 values indicate the associated p-value:‘***’ p < 0.001, ‘**’ p < 0.01, ‘*’ p < 0.05, and ‘.’ p < 0.1.
when the model talker is rated as Attractive; this is also the direction of the main effect
of Attractiveness for the mixed model. For /u/ we nonetheless find that there is more
imitation for this vowel when the model talker is rated as unattractive.
4.2.5 White Social Condition
The only social measure we have as a potential predictor for imitation in the White
Social condition is Attractiveness. Therefore, the model for the White Social condition used
Participant and word as random effects while Vowel (i æ A o u) and Attractiveness ratings
(a number on a scale of 1-10) as fixed effects. Like in the Black Social Condition only
productions from the Shadowing Blocks were used in the modeling of the data.
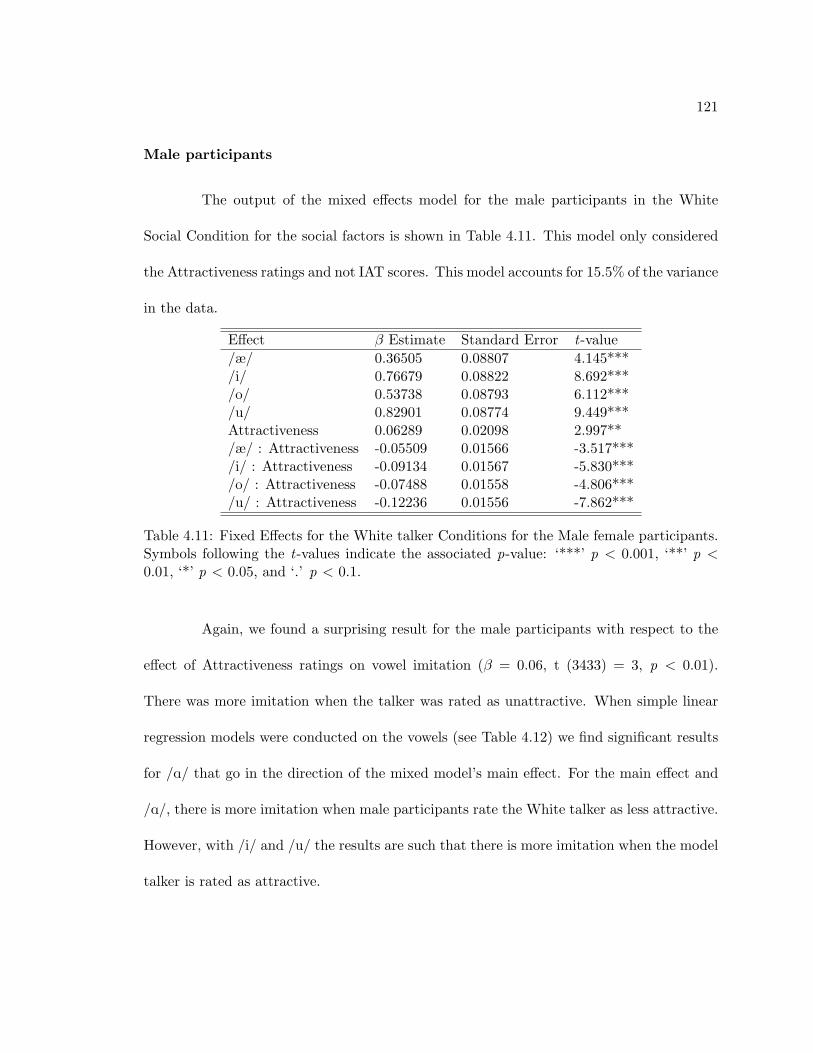
121
Male participants
The output of the mixed effects model for the male participants in the White
Social Condition for the social factors is shown in Table 4.11. This model only considered
the Attractiveness ratings and not IAT scores. This model accounts for 15.5% of the variance
in the data.
Effect β Estimate Standard Error t-value/æ/ 0.36505 0.08807 4.145***/i/ 0.76679 0.08822 8.692***/o/ 0.53738 0.08793 6.112***/u/ 0.82901 0.08774 9.449***Attractiveness 0.06289 0.02098 2.997**/æ/ : Attractiveness -0.05509 0.01566 -3.517***/i/ : Attractiveness -0.09134 0.01567 -5.830***/o/ : Attractiveness -0.07488 0.01558 -4.806***/u/ : Attractiveness -0.12236 0.01556 -7.862***
Table 4.11: Fixed Effects for the White talker Conditions for the Male female participants.Symbols following the t-values indicate the associated p-value: ‘***’ p < 0.001, ‘**’ p <0.01, ‘*’ p < 0.05, and ‘.’ p < 0.1.
Again, we found a surprising result for the male participants with respect to the
effect of Attractiveness ratings on vowel imitation (β = 0.06, t (3433) = 3, p < 0.01).
There was more imitation when the talker was rated as unattractive. When simple linear
regression models were conducted on the vowels (see Table 4.12) we find significant results
for /A/ that go in the direction of the mixed model’s main effect. For the main effect and
/A/, there is more imitation when male participants rate the White talker as less attractive.
However, with /i/ and /u/ the results are such that there is more imitation when the model
talker is rated as attractive.
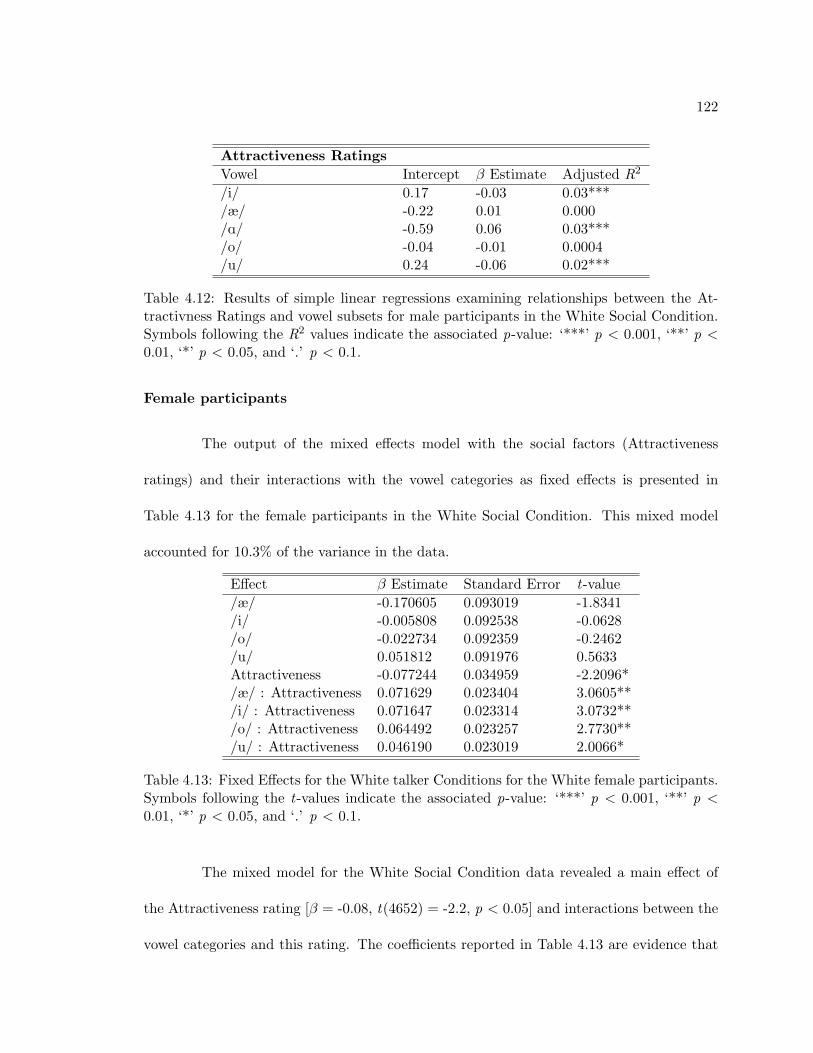
122
Attractiveness RatingsVowel Intercept β Estimate Adjusted R2
/i/ 0.17 -0.03 0.03***/æ/ -0.22 0.01 0.000/A/ -0.59 0.06 0.03***/o/ -0.04 -0.01 0.0004/u/ 0.24 -0.06 0.02***
Table 4.12: Results of simple linear regressions examining relationships between the At-tractivness Ratings and vowel subsets for male participants in the White Social Condition.Symbols following the R2 values indicate the associated p-value: ‘***’ p < 0.001, ‘**’ p <0.01, ‘*’ p < 0.05, and ‘.’ p < 0.1.
Female participants
The output of the mixed effects model with the social factors (Attractiveness
ratings) and their interactions with the vowel categories as fixed effects is presented in
Table 4.13 for the female participants in the White Social Condition. This mixed model
accounted for 10.3% of the variance in the data.
Effect β Estimate Standard Error t-value/æ/ -0.170605 0.093019 -1.8341/i/ -0.005808 0.092538 -0.0628/o/ -0.022734 0.092359 -0.2462/u/ 0.051812 0.091976 0.5633Attractiveness -0.077244 0.034959 -2.2096*/æ/ : Attractiveness 0.071629 0.023404 3.0605**/i/ : Attractiveness 0.071647 0.023314 3.0732**/o/ : Attractiveness 0.064492 0.023257 2.7730**/u/ : Attractiveness 0.046190 0.023019 2.0066*
Table 4.13: Fixed Effects for the White talker Conditions for the White female participants.Symbols following the t-values indicate the associated p-value: ‘***’ p < 0.001, ‘**’ p <0.01, ‘*’ p < 0.05, and ‘.’ p < 0.1.
The mixed model for the White Social Condition data revealed a main effect of
the Attractiveness rating [β = -0.08, t(4652) = -2.2, p < 0.05] and interactions between the
vowel categories and this rating. The coefficients reported in Table 4.13 are evidence that

123
female participants imitate more when the talker is rated as more attractive. The results
of simple linear models for each of the vowel subsets are reported in Table 4.14. Only the
model for /A/ proved significant. The β value indicates the same pattern as the main effect
of Attractiveness: the more attractive participants rated the talker, the more likely they
were to imitate the spectral characteristics of /A/.
Attractiveness RatingsVowel Intercept β Estimate Adjusted R2
/i/ 0.01 -0.01 -0.001/æ/ -0.15 -0.008 -0.001/A/ 0.02 -0.08 0.03***/o/ -0.002 -0.01 -0.001/u/ 0.07 -0.03 0.002
Table 4.14: Results of simple linear regressions examining relationships between the Attrac-tivness Ratings and vowel subsets for female participants in the White Social Condition.Symbols following the R2 values indicate the associated p-value: ‘***’ p < 0.001, ‘**’ p <0.01, ‘*’ p < 0.05, and ‘.’ p < 0.1.
4.2.6 Degrees of Imitation
By analyzing these data with mixed effects models, we are unable to make par-
ticular observations and generalizations from the data. In this section, I will present some
statistical summaries of the imitation behavior in order to reveal particularly interesting
and relevant aspects of the data. One such observation can be seen in the above vowel
plots: both male and female participants were acoustically more similar-sounding to the
Black talker prior to participation in the experiment. Participants’ original distances from
the model talkers are shown in Figure 4.21. Both male [t(1841) = -12.4, p < 0.001] and
female talkers [t(2597) = -10.2, p < 0.001] begin as more similar to the Black talker than

124
the White talker.4
Figure 4.21: original distance of the participants to the model talkers. The phoneticdistance of participants to the talker is on the y-axis. A value of 0 would mean there is nodifference between the participant groups and the talker. The higher the Distance value,the more acoustically different the population is from the model talker. Both male andfemale groups of participants were significantly closer to the Black talker at the beginningof the experiment.
Given this fact about the inherent acoustic similarity of all participants to the
Black talker, it might be predicted that all participants imitate the Black talker’s voice
more, considering that a closer approximation of his vowel space is more tenable. However,
a t-test comparing whether participants converge on the vowels of the Black talker more
than the White talker found no significant differences [female: t(20006) = -0.12, n.s.; male:4There are two potential explanations for why this may be the case. One such possibility is that the
Black talker was shorter than the White talker. His height, and therefore vocal tract length, may have closerapproximated that of both the male and female participants in the experiment. A second possibility is thatthe Black talker had a less advanced California accent. While his speech was clearly indicative of a WesternUS dialect, the Black talker’s /æ/ and /A/ were much less retracted (i.e., higher second formants) than thoseof the White talker.

125
t(14572) = -0.85, n.s.]. This lack of a significant effect is shown in Figure 4.22. Figure
4.22 also demonstrates that pooled across Conditions, male participants did not imitate
more than female participants [t(36706) = 0.72, n.s.]. This finding is relatively surprising
considering that male participants presumably actually had the physiological potential to
fully imitate the spectral characteristics of the model talkers’ voices. Female participants,
on the other hand, could only approximate the vocal characteristics of the male model
talkers. Despite this crucial fact, male and female participants imitated to the same overall
degree.
Figure 4.22: Amount of imitation of the participants to the model talkers. The phoneticdistance measure on the y-axis indicates the amount the participant groups modified theirphonetic distance in response to the model talker. A value of 0 would mean that participantsdid not change their vowel productions in response to the model talkers. The more imitationwas observed, the higher the Distance value. There were no significant differences betweenany of the groups.
126
4.3 Discussion
In Chapter 2 two basic theories of speech accommodation were presented. The au-
tomatic theory claimed that accommodation was a reflex of the representation of language
in memory. This theory predicts that imitation is unintentional and, according to Trudgill
(2008), lacking social influence entirely. Under this theory it was hypothesized that partici-
pants would imitate the model talker all the time. A social theory of accommodation, such
as Communication Accommodation Theory (CAT), argues that convergence and divergence
are social tools used by talkers to manipulate the social distance between themselves and
interlocutors. When participants rated the talker as attractive it was predicted that they
would imitate more as a way to decrease the social distance. For the IAT scores, it was
predicted that participants who scored with a pro-Black bias would accommodate to the
speech of the Black talker more. The results of this experiment address these issues by
demonstrating that spontaneous phonetic imitation is both phonetically and socially selec-
tive. The social measures that proved to be significant predictors in the statistical models
tapped implicit social values. A major contribution of this work is to provide a push for
sociolinguistics toward the concept that social values are ingrained biases and not elements
that are purposefully deployed on the part of speakers of language, as is suggested by Labov
(2001a) and Eckert (2001).
To summarize the findings reported above, phonetic imitation was found to be
phonetically selective. Not all vowels changed as a result of exposure to the model talkers.
In response to both the Black and White talkers female participants consistently imitated
/A/ and /æ/. This held true across all conditions with the exception of the Black Social

127
Condition. In this condition, female participants did not imitate /A/. When females imi-
tated these vowels, they did so primarily through shifts within the F1 dimension, lowering
the F1 of the low vowels so as to approximate the vowel targets provided by the model
talkers. The vowels /o/, /u/, and /i/ were essentially unchanged throughout the course of
the experiment.
The figures displaying overall difference in distance for the vowel categories
across blocks for the male participants indicated there was some imitation of /o/ and /u/,
but not enough to be significant in the statistical analyses. It is easily observed, nonetheless,
that there was more imitation for these back round vowels for the male participants than
for the female participants. For the male participants though the low vowels /A/ and /æ/
were still the primary targets for imitation. These vowels were imitated more for the male
participants than the other vowels. Like the female participants, the production of /i/
did not change for male participants. Of the vowels that were imitated, male participants
shifted their productions with respect to both the first and second formants. The largest
shifts appeared to be within the F1 dimension. The reasons for this are spelled out below.
Social effects were evident in several places in the data. Most obviously, IAT scores
and Attractiveness ratings contributed to the mixed models and the simple linear regression
models fit for the vowel category subsets by male and female participants. For both male
and female participants in the Black Social Condition, participants who scored with pro-
Black biases on the IAT were more likely to converge on the vowels of the Black talker. The
effect of Attractiveness went in the expected direction for the female participants. In both
the Black and White Social Conditions, when female participants rated the talkers as more

128
attractive, they were more likely to imitate the talker’s vowels. For the male participants,
the Attractiveness results were significant, but went in an opposite direction. The less
attractive male participants rated the talkers, the more likely they were to imitate the
vowels.5 The results for the female participants are what we would predict under a social
theory of accommodation: when you view a talker positively, you want to decrease the
social distance and, thus, you accommodate. These results fall within the the predictions of
CAT, but what distinguishes these results from a classic CAT view is that it is unlikely that
participants were explicitly imitating as a way to decrease social distance. In descriptions
of CAT, talkers are described as making choices and using strategies when they converge
or diverge with an interlocutor (Shepard et al. 2001:34).
Other social effects in the data come about when comparing the Social and Asocial
Conditions. For female participants there was a non-significant trend toward more imitation
in the Asocial Conditions for both the Black and White talkers. The male participants, on
the other hand, imitated more in the Social Conditions; this predictor was significant in the
ANOVA for the Black talker.
(Trudgill 1981) predicted that socially salient variables will elicit more accommo-
dation. The vowels /æ A o u/ are all undergoing sound changes in California English, and
therefore have the potential to be socially salient, following Trudgill (1986). While there is5This is a very strange finding, particularly considering the consistency of the results for both the Black
and white talkers. I think that this effect is likely due to the subject population. Presumably, the majorityof the male participants were heterosexual. In all likelihood, these college-age students were surprised tobe asked to rate the attractiveness of a talker and gave a response that was actually not based on theattractiveness of the talker. I would predict that using a female talker with male participants we would findthe expected pattern where there is more imitation when shadowing a voice from a talker deemed to beattractive. Another possibility was suggested by Andrew Garrett. He suggested that this could be relatedto competition between men. Male participants could view an attractive male as a threat and be inclinedto socially distance themselves from him.

129
no measure of what is truly socially salient in the minds of California participants, /o/ and
/u/ are certainly highly parodied in depictions of California accents. By this account /o/
and /u/ should have shown effects of imitation. This was not the case in the current study.
The selective nature of imitation from both a phonetic and social perspective is
evidence that purely automatic theories of imitation are wrong. Imitation is mediated to
some extent by both social and linguistic factors. However, participants were unaware of
their imitative behaviors and the fact that imitation targeted specific vowels suggests that
spontaneous phonetic imitation is well beyond a talker’s conscious control. This fact also
shows that a social theory in the vein of sociolinguistics or CAT cannot be completely
right. How communication accommodation theorists view imitative behavior as a choice
is referenced above. Within sociolinguistics, stylistic variation is considered a “controlled
device” by Labov (2001a:85) and “conscious manipulation” by (Eckert 2001:124). It is hard
to imagine that groups of participants would purposefully (and consistently) imitate select
vowels. Neither a purely automatic nor a social theory that involves a conscious mechanism
for accommodation is supported by the results of this experiment. Instead the data support
an automatic theory of accommodation where we assume that implicit social factors will play
a role on an unintentional level, where we can understand spontaneous phonetic imitation as
a behavior that makes use of participants’ pre-existing phonetic repertoire. The importance
of a talker’s phonetic repertoire is in the following paragraph.
The results of the experimental conditions converge on the idea that talkers stay
within their pre-existing phonetic repertoire when participating in shadowing tasks. Partic-
ipants are selecting from pre-existing variants in order to approximate the auditory targets

130
of the model talker, but they are not encoding new speech production targets simply for this
task. To reach this understanding, first let us consider the fact that there are spectral dif-
ferences between prosodically accented and unaccented vowels (Lindblom 1963, Engstrand
1988). For example, in the sentence The man IS going to the store, as a content word
man is stressed, but the prosodic focus of the sentence is on is, leaving man unaccented.
However, in the sentence The MAN is going to the store, the subject man is both accented
and stressed. The amount of formant expansion associated with accented and unaccented
vowels is related to jaw movement (de Jong 1995), particularly within F1 (Summers 1987).
Summers found greater differences in F1 for /æ/ than /A/, which matches up well with the
current finding for participants where we find the most imitation for /æ/. The tendency
for the spectral differences between accented and unaccented vowels has been argued to be
greater for low vowels overall, perhaps in relation to vowel sonority (Beckman et al. 1992).
Again, this aligns itself nicely with our results.
This explanation for the results also dovetails nicely with the data reported in
Section 4.2.6. In that section I reported male and female participants imitated to the
same overall degree. While there is some sociolinguistic research that suggests that women
exhibit more variation in their speech than men (Labov 1990, 2001b:366-384), there is no
work (that I am aware of) that posits larger phonetic repertoires for individual women than
men. That is, while women as a population group may have more variable speech, that
does not imply that individual women have more production variants within a category.
Recently, Clopper and Pierrehumbert (2008) reported that shifts in vowel produc-
tion toward more innovative forms in a regional dialect were found more often in contexts of

131
high semantic predictability. This is another type of stored word-level variant in a talker’s
production repertoire that could be accessed in a word repetition task. In the data reported
here, we see changes in participants’ vowel productions primarily in the direction of more
innovative variants. For example, for male participants we documented shifts toward the
model talkers’ retracted low vowels and fronted back round vowels. Low vowels with lower
F2 and back vowels with higher F2 are the novel variants in most dialects of American
English (Hinton et al. 1987, Moonwomon 1991, Munson et al. 2006). Given this, the fact
that no imitation was revealed for vowels other than /A/ and /æ/ for female participants
makes sense. Within a female talker’s /u/ and /o/ repertoire, there will be few tokens with
extremely low second formants (the kind of F2 needed to imitate a male talker).
In American English, the F2 of /u/ greatly depends on the consonantal environ-
ment. For example, in coronal environments /u/ has a higher F2. This, along with the
general trend of fronting the back vowels in American English, gives /u/ a large category
size. Take, for example, the distribution of /u/ in Subject 200’s Pre-task vowel productions
shown in Figure 4.23. We can see that /u/ extends from the canonical back area associated
with the cardinal vowel to the higher F2 space occupied by /i/. A word like dune would
have a vowel with a high F2, while a word like pool would occupy the low F2 /u/ cluster.
A female participant like Subject 200 has /u/ tokens with comparatively lower F2s in her
inventory that she could potentially employ in an effort to spontaneously imitate a model
male talker who had lower F2s in his /u/ category in general. This, however, was not found
to be true. Female participants only imitated low vowels. The failure of a participant to
recruit the production plans for a vowel that would better satisfy an acoustic match of the

132
auditory target that would be taken from another lexical item is in favor of word-specific
phonetics (Pierrehumbert 2002). Participants are only making use of variations in produc-
tion plans from within a single word; they are unable to implement vowel variants from
other words in the process of spontaneous phonetic imitation.
Figure 4.23: Pre-task vowel productions from Subject 200, a female participant.
Invoking word-specific phonetics in an explanation of the results contradicts previ-
ous work on imitation. As reviewed in Chapter 2, Nielsen (2008) finds that participants in
a shadowing task with artificially lengthened VOT generalize the [long VOT] to other stop
consonants that share the feature [-voice]. So, when participants were exposed to length-
ened VOTs in /t/, they extended the lengthened feature to /k/ as well. While evidence for

133
abstraction and categorical behavior was found in Nielsen’s study, it was not found here.
There are a couple of reasons for why this might be the case. For one, it may be a funda-
mental difference between vowels and consonants. The feature categories of consonants may
be organized in such a way that makes generalization across a set easier. Another possible
reason may have to do with Nielsen’s interpretation of the results. It is possible that the
lengthened VOT on the /k/ words arose not within the lexicon or in activating phonemes in
the early stages of phonological planning, but in the execution of the motor commands. In
the course of producing /t/ words with lengthened VOT, the motor plans associated with
maintaining an open glottis get carried over into /k/ words. The issue here is at what level
of linguistic representation does convergence take place. Is it a generalization that takes
place within an abstracted segmental representation or is it inertia of articulators in motor
planning? Nielsen’s data cannot answer this question, but it leaves open the possibility that
her results and those reported here are not inherently conflicting. It is also worth noting
that in Nielsen’s data more imitation was found for the specific words with lengthened
VOT to which listeners had been exposed than in the words to which the feature had been
generalized.
A mention of the mechanisms at work in spontaneous phonetic imitation is in order.
Exemplar-based models of speech production and perception appear at first glance to be
able to account for these results. Above, however, I argue against automatic convergence as
would be predicted by simple, asocial, exemplar-models. Since imitation is not a consistent
consequence of auditory exposure, it is unlikely that production and perception work out of
the same stores of exemplars. Although, the fact that auditory exposure can shift production
134
targets at all does imply a strong connection between the two processes. One important
finding in this experiment speaks directly to the issue of exemplars and activation levels. In
all of the Conditions for the female participants there was a cumulative effect of exposure.
The difference in distance decreased with each shadowing block such that the final
shadowing block (Block 6) always exhibited the most imitation. Male participants shifted
immediately upon exposure to the model talker. There were no differences between the
three shadowing blocks for the male participants in any of the Conditions. Let’s consider
imitation the result of a production target being activated by auditory exposure. Male
participants are more likely to have speech production targets that approximate the tokens
of the male model talkers already in their repertoires. It takes little exposure then for
those tokens to become activated. Female participants are unlikely to have many (if any)
production targets available that closely match the acoustic structure of the male model
talkers. In this case, it takes higher levels of activation – more auditory exposure – to
highlight these production targets.
In the following and final Chapter, we review the purpose of this dissertation and
reiterate the most valuable findings.

135
Chapter 5
Conclusion
The previous chapter, Chapter 4, presented the results of a study on phonetic
accommodation and provided an explanation for the data based on the talker’s pre-existing
phonetic repertoires. Before summarizing these results and discussing their implications
for phonetics (Section 5.2.1), sociolinguistics (Section 5.2.2), and psycholinguistics (Section
5.2.3), let’s review the general goals of this dissertation. One was to test whether the spectral
characteristics of vowels were imitated in phonetic accommodation. The second goal sought
to examine whether implicit social cognition was at work in language production. The
experimental design was described in Chapter 3 and the results were reported in Chapter
4. As summarized below, talker did indeed imitate vowels and measures of implicit social
cognition contributed in predicting the results.

136
5.1 General summary
The empirical focus of this dissertation was the spontaneous imitation of acoustic
detail in a word-repetition task. The fact that participants in an experimental task acquire
vocal characteristics of a model talker or interlocutor has been well founded (Goldinger
1998, Namy et al. 2002, Pardo 2006). In terms of what was being imitated, previous
work had found that participants imitate voice onset time (Nielsen 2008, Shockley et al.
2004), and there was some evidence that pitch was imitated to a certain extent (Goldinger
1997). Using broader acoustic measures, like measures of long-term average spectra and mel-
frequency cepstral coefficients, other researchers have documented phonetic convergence as
well (Delvaux and Soquet 2007, Gregory et al. 1993). Imitation of vowel formant frequencies
had previously not been examined. This is the type of imitation that would prove significant
for real-life cases of accommodation such as dialect shift within an individual or language
change across a community of speakers.
In order to explore vowel imitation specifically, a lexical shadowing task using 50
low frequency monosyllabic words containing the vowels /i æ A o u/ was designed using two
model talkers. The two talkers were both men in their early thirties who spoke California
English. The two talkers differed, however, in that one was Black and one was White. Ex-
perimental conditions were blocked by talker, so that a single participant was only exposed
to the voice of one model talker. Research participants first completed a Pre-task Block
where they read the 50 words aloud. The purpose of this block was to obtain a baseline
production for how participants produce the vowels in the word list. The main part of the
task was a series of three Shadowing Blocks where participants were auditorally presented
137
with tokens from a model talker and instructed to identify the word that they are hearing by
saying it out loud. From participant productions in the Shadowing Blocks we can examine
how much participants have modified their vowel productions as a result of exposure to the
model talker. The final stage of the speech production experiment was a Post-task Block
where participants were again asked to simply read the word list aloud; from this block we
are able to see how phonetic convergence persists after exposure to the model talker has
ceased.
In addition to exposing participants to different talkers, in some conditions – the
Social Conditions – participants were presented with still digital images of the model talker,
while in the Asocial Conditions participants were only presented with an audio signal. It is
important to test for differences in amount of imitation between these conditions because
automatic theories of linguistic convergence posit that imitation happens automatically at
all times, which means that under strong interpretations of these theories there is no room
for social factors to influence the extent to which participants acoustically match a model
talker. Other social measures were also obtained. Upon completing the speech production
task, participants in the Social Conditions were asked to rate the attractiveness of the
model talker they were exposed to. All participants also completed an Implicit Association
Task (IAT; Greenwald et al. 1998) that provided an implicit measure of their racial bias
to the racial categories Black and White. Following theories of accommodation suggesting
that imitation will occur when speakers of language wish to decrease social distance, it was
hypothesized that there will be more imitation when participants rate the model talker as
more attractive. It was also predicted that participants in the Black Social Condition who
138
score with a pro-Black bias would be more likely to imitate the Black model talker.
To assess vowel imitation, a Praat script extracted the mean first and second
formants of the middle 50% of each vowel. Formant values were normalized to the Bark
scale prior to analysis. Using the Bark-scaled data, the Euclidean distance between each
word from each participant and the same word produced by the model talker to which the
participant was exposed was calculated. Then, the distance for each Shadowing and Post-
task production was subtracted from the distance for the Pre-task productions providing a
difference in distance measure. Comparing values this way gives us a measure of how
much a participant’s vowel production changed as a result of auditory exposure to the model
talker. A negative difference in distance value indicates convergence while a positive
value denotes divergence; this is important to understanding several of the figures presented
in Chapter 4. Both mixed effects modeling and repeated measures by-subject ANOVAs
were used to analyze the data using the difference in distance as the outcome variable.
Analyses were conducted separately for male and female participant data. Separate analyses
were also done for particular subsets of the data so that particular hypothesis could be
tested. For example, in the analysis for the Black talker data where we combine data from
the Black Social and Black Asocial Condition we are asking how visual information about
the Black talker affects imitation patterns.
The results of the experiment indicate that spontaneous phonetic imitation of the
spectral characteristics of vowels is both phonetically and socially selective. This is evidence
against an automatic theory of accommodation where imitation is an inevitable reflex of
the organization or representation of the language system. We cannot, however, reject the

139
automatic aspect of imitation entirely. It may well be automatic in the sense that it is not
a conscious act on the part of a speaker of language (cf. Bargh and Chartrand 1999), but
phonetic imitation is mediated by both social and linguistic factors. In terms of phonetic
selectivity, for both male and female participants there is significantly more imitation for
the low vowels /A/ and /æ/ than for /i o u/. The specifics of these results are discussed
in more detail in Section 5.2.1. There was also a trend for male participants to imitate
the back vowels /o/ and /u/ more than /i/, but this was not significant and was not a
trend for female participants. The behavior when /A/ and /æ/ were imitated varied across
gender. Male participants imitated immediately upon exposure; there were no significant
differences in terms of how much they imitated across the three shadowing blocks. Female
participants, on the other hand, imitated more and more across shadowing blocks. There
was more imitation in the final shadowing block (Block 6) than the first one (Block 4). This
particular result is discussed more in Section 5.2.3.
Aspects of social selectivity in spontaneous phonetic imitation were also found.
The details and broader implications of the social results are addressed in Section 5.2.2,
and they are briefly summarized here as well. One major pattern involves male participants
imitating more in the Social Conditions, while female participants seemed to imitate more
in the Asocial Conditions, although the pattern for females was an insignificant trend. The
results from the Attractiveness ratings and the IAT scores interacted in interesting ways
with amount of imitation. For both male and female participants, those who scored with
a pro-Black bias (or less of a pro-White bias, as the case may be) were more likely to
imitate the voice of the Black talker. Implicit racial biases influenced the degree to which
140
participants accommodated to the vowels of the Black talker. How the Attractiveness
ratings interacted with imitation differed across male and female participants. For female
participants we found the overall effect that the more attractive the model talker was rated,
the more his voice was imitated. Male participants, however, had the opposite pattern. The
more unattractive the model talker, the more likely we were to find imitation. For both
male and female participants their respective directions of imitation and attractiveness were
the same for both the Black and the White talkers.
The details of why these particular results were found are debated in the following
discipline specific summaries but, in sum, these results fall under a theory of word-specific
phonetics (Pierrehumbert 2002) where participants make use of pre-existing production
variants in a laboratory experiment. A larger range of potential representations for the
low vowels are available to talkers as a result of differences in jaw height in accented and
unaccented environments (de Jong 1995). The results indicate that speech production
targets are influenced by ambient auditory exposure, and that, crucially, phonemes are not
static linguistic entities, but malleable targets.
5.2 Discipline specific summaries
The topic of this dissertation cuts across many subdisciplines within linguistics.
With this in mind I have summarized results and conclusions for phonetics (5.2.1), sociolin-
guistics (5.2.2), and psycholinguistics (5.2.3) in separate sections below.
141
5.2.1 Phonetics
This dissertation was motivated with a basic concern to understand why do we
sound like we do. Physiological differences between individuals, of course, shape the major-
ity of acoustic differences between talkers. An individual’s speech though is still so variable
that speakers struggle to accurately reproduce recordings of themselves (Vallabha and Tuller
2004). As we acquire our native language we learn the variety spoken by our peer group.
Moreover, as we move from one dialect area to another, we modify our ways of speaking to
reflect the speech patterns of our new community (Munro et al. 1999, Evans and Iverson
2007). So, a significant portion of this why do we sound as we do question can be answered
with an explanation involving how ambient auditory exposure changes speech production.
The experiment reported in this dissertation sought to uncover details about how
ambient auditory exposure elicited imitation of vowel formant frequencies. Phonetic con-
vergence was only found for /æ/ and /A/. These results are explained within a theory
of word-specific phonetics (Pierrehumbert 2002) in which participants are making use of
pre-existing speech production targets in order to approximate the speech of the model
talker. It is logical that we would find more imitation for the low vowels then as they ex-
hibit larger amounts of variation in accented and unaccented environments (de Jong 1995,
Summers 1987). With more word-specific production variants available to a participant,
they are able to select a production that is a better acoustic match for the model talker’s
production. This conclusion is also supported by other work demonstrating that phonemes
exhibiting more variation within a community of speakers are more likely to be imitated
(Babel 2008, Delvaux and Soquet 2007).

142
A highly important aspect of this result is that it demonstrates the labile nature
of linguistic segments with respect to both their perceptual encoding and their variation in
production. First, listeners must perceive the detailed acoustic structure of an utterance
in order to have those details influence their production. Second, in speech production,
participants alter the characteristics of the output without modifying the categorical identity
of the segment they produce. The exact selection of a production variant is determined by
auditory exposure.
A second important theoretical point for the phonetic focus of this thesis relates
to what exactly participants are doing when imitating vowels. While this question cannot
be completely resolved with the data we have here, it is worth discussing in brief. The basic
question is: Are participants aiming for acoustic imitation or are they imitating a gestural
target as a location within the vowel space? With the latter interpretation, a participant
may interpret a vowel as being relatively low for that particular model talker and then
imitate by producing a low vowel in their own phonetic vowel space. One reason why I do
not think this is a viable interpretation of what participants are doing relates to data from
the female participants. Consider the /æ/ vowel which received the greatest amount of
imitation by female participants. If a female participant interprets the model talker’s /æ/
as being relatively low for his vowel space (a highish F1) and thus imitates that relative
lowness, she (in raising her F1) would actually diverge from the model talker following the
way in which I measured imitation. Female participants all lowered their F1 in the process
of imitation. Therefore, while it cannot be conclusive, the results suggest acoustic imitation
and not articulatory imitation.

143
5.2.2 Sociolinguistics
There is an immense amount of variation in the speech signal. While some of this
variation is phonetically motivated (e.g. Stevens and House (1963) and Ohman (1966)), a lot
of it has to do with sociolinguistic variation. Users of language vary their use of language
based on whether they are speaking formally or informally, to children or to adults, or
influenced by some emotional state. This type of contextual variation occurs at all levels of
language.
In this dissertation, I have focused on phonetic variation. Specifically, the exper-
iment examined how a talker’s production of a vowel will change as the result of auditory
exposure to another talker, as discussed above. The social factors taken into consideration
in the experiment were the perceived attractiveness of the model talkers as rated on a 1-10
point scale and a measure of implicit racial bias for Black and White as measured on an
IAT. With respect to the latter social measure, male and female participants patterned
identically. Participants were less likely to imitate the Black talker (in the Black Social
Condition) when they scored with a strong pro-White bias. For the Attractiveness ratings,
male and female participants provided different results. For both the Black and White
talker, female participants were more likely to imitate when they rated the talker as at-
tractive, while male participants imitated more when they rated the talker as unattractive.
The results from both of these social measures clearly demonstrate that implicit and subtle
sentiments felt towards talkers affect speech production. These results are, of course, subtle
effects, but their implications are important. In a laboratory experiment where the social
and communicative aspects of language are minimal (if at all existent), we still witness

144
evidence of social influence on language use. I can only imagine that in real-life cases of
phonetic accommodation, social biases must play an even larger role. This finding that par-
ticipants who scored with a stronger pro-White bias on the IAT were less likely to imitate
the Black talker does suggest the possibility that it is social biases driving the divergence of
African American English and more mainstream varieties of American English (cf. Fasold
1981, Labov and Harris 1986, Fasold et al. 1987, Bailey and Maynor 1989).
As reviewed in Chapter 2, language accommodation has long been of interest
to sociolinguists both because of its implications for style-shifting (audience design) and
dialect change. The results of this experiment demonstrate that a large part of style shifting
may be an epiphenomenon of imitation. Upon exposure to a particular style of speech, a
speaker will shift toward that production. While not all of style-shifting can be explained
by way of accommodation, certainly some it can. In Chapter 2, a highlight of the discussion
regarding sociolinguistics and accommodation was Trudgill’s recent view of accommodation
as an automatic process (Trudgill 2008). An eminent sociolinguist who has long worked
on issues of dialect contact and change, Trudgill, shockingly, shifted his previous view of
accommodation as highly social (Trudgill 1986) and now holds a strongly asocial view. The
results of this dissertation supports Trudgill’s (2008:252) view that imitation is subconscious
and automatic. However, Trudgill is mistaken in stating that accommodation is wholly
asocial; it cannot be said that accommodation is a process that is devoid of social influence.
A final point in this section is methodological. Sociolinguists often consider the
social aspects of language to be intentional actions on the part of a speaker to, for example,
index some particular aspect of their identity or to play a particular role in a community

145
or conversation. Psychologists, on the other hand, view social cognition more as implicit
knowledge. In this dissertation, I integrated the IAT – a standard social psychology tool
that measures implicit social biases – into a laboratory phonology experiment. The results
were successful and demonstrated how social cognition subtly affects speech production.
The potential for IATs and other social psychology tools to shed light on sociolinguistic
work is great. I hope other researchers incorporate these methods into their research.
5.2.3 Psycholinguistics
The elephant in the room throughout this dissertation has been the question of
what the underlying cognitive mechanisms for phonetic imitation are. What sorts of pro-
cesses cause this type of linguistic behavior? Are these mechanisms and processes aspects
of cognition that are limited to speech? Whatever cognitive mechanisms are involved, it is
unlikely that they are limited to speech. As mentioned in Section 2.1, convergent behavior
transcends all aspects of human behavior. This means that some basic aspect of human
cognition relates perceived behavior to produced behavior. What’s particularly interesting
to note is that within this basic imitation reflex, Dijksterhuis and Bargh (2001) argue that
the ability to not imitate is what is social. While it cannot be conclusively determined
by the data from this experiment whether participants, for example, imitated the Black
talker more when they had a pro-Black bias or less when they had a pro-White bias, it
certainly suggests an interesting interpretation of what linguistic divergence might be. Not
imitating an interlocutor may well be the only method of increasing social distance, to put
the behavior in Communication Accommodation Theory terms.
One result of this dissertation that is of interest to psycholinguistics is the finding

146
of cumulative imitation for the female participants and immediate imitation for the male
participants. A discussion within the syntactic priming literature is whether syntactic
imitation is the result of activation or learning (cf. Pickering and Ferreira 2008). Bock and
Griffin (2000) found that structural priming persists over longer intervals. They argue that
since structural priming effects persist beyond immediate exposure this must be indicative
of some type of learning and not transient activation. In a similar vien, Delvaux and Soquet
(2007) suggest calling spontaneous phonetic imitation ‘mimesis’ since there is evidence that
it leaves a memory trace when imitative effects are maintained into post-task productions.
While I am not interested in conjuring up an argument against the fact that imitation may
be some type of learning (and it does seem odd to pit memory against learning), the results
of this dissertation do suggest that an activation level threshold must be reached in order to
find imitation. In the shadowing blocks female participants consistently imitated more in
the final shadowing block than they did in the first block. For the female participants the
more exposure they had to the model, the more they imitated. Male participants showed no
such effect of cumulative exposure. Male participants shifted immediately upon exposure to
the model talker and did not increase their imitative behavior after the initial shift. Female
participants needed more exposure – more activation – in order to shift their productions.
That female participants needed more auditory exposure in order to imitate does indeed
suggest that spontaneous phonetic imitation is a phenomenon that, in addition to being
due to implicit learning, shows effects of activation threshold as well.
The last point to be made in this section concerns the debate surrounding the
motivation for imitation. That is, whether the primary motive is social or an automatic
147
consequence of the organization of knowledge. This dissertation found phonetically and
socially selective imitation. This must be interpreted as evidence that strong versions of an
automatic theory of accommodation cannot be correct. Imitation is mediated to some extent
by both social and linguistic factors. Participants were not imitating intentionally and their
behavior was limited to specific vowels. This suggests that spontaneous phonetic imitation
is well beyond a talker’s conscious control, and thus, that a strong version of the social
theory also cannot be completely right. It is hard to imagine that groups of participants
would purposefully (and consistently) imitate select vowels. Neither a purely automatic or
a social theory that involves a conscious mechanism for accommodation is supported by the
results of this experiment. Instead the data support an automatic theory of accommodation
where we assume that implicit social factors will play a role on an unintentional level (cf.
Pickering and Garrod 2004). This dissertation is the first work demonstrating the how
implicit social factors influence imitation in speech.
The real question is how this social selectivity is incorporated and encoded in the
language system. How do our language representations fall susceptible to these automatic
social influences? The question is not whether social information is stored as a part of
language knowledge, but how particular variants get activated for production when that
production does not necessarily correlate with the social feature “Black,” for example. In
this experiment, participants were more likely to imitate acoustic characteristics of vowels
that were not affiliated with the speech of African Americans, per se. However, if we
consider this behavior in terms of implicit social goals (e.g. who is a desirable member of
your social group), we can understand the social selectivity as follows: a participant with

148
a pro-White bias who is shadowing the Black talker will not pursue the Black talker as
a friend. The automatic response to imitate is then inhibited by the social bias against
the individual. The results of this dissertation provide language-specific evidence for this
fundamental theory of human behavior.
149
Bibliography
Baayen, R. H. 2008. Analyzing linguistic data. Cambridge University Press.
Baayen, R.H., R. Piepenbrock, and H. van Rijn. 1993. The CELEX lexical database (CD-
ROM). Linguistic Data Consortium, University of Pennsylvania.
Babel, Molly. 2008. Dialect convergence and divergence in New Zealand English. University
of California, Berkeley.
Bailey, Guy, and Natalie Maynor. 1989. The divergence controversy. American Speech
64:12–39.
Bargh, John A., and Erin L. Williams. 2006. The automaticity of social life. Current
Directions in Psychological Science 15:1–4.
Bauer, Laurie. 2008. A question of identity: A response to Trudgill. Language in Society
37:272–273.
Beckman, Mary E., Jan Edwards, and Janet Fletcher. 1992. Prosodic structure and tempo
in a sonority model of articulatory dynamics. In Papers in Laboratory Phonology II , ed.
Gerard Docherty and D. R. Ladd, 68–86. Cambridge University Press.
Bell, Allan. 1984. Language style as audience design. Language in Society 13:145–204.
Bell, Allan. 2001. Back in style: reworking audience design. In Style and Sociolinguistic
150
Variation, ed. Penelope Eckert and John R. Rickford, 139–169. Cambridge University
Press.
Bilous, Francis R., and Robert M. Krauss. 1988. Dominance and accommodation in the
conversational behaviours of same- and mixed-gender dyads. Language & Communication
8:183–194.
Bock, J. Kathryn. 1986. Syntactic persistence in language production. Cognitive Psychology
18:355–387.
Bock, Kathryn, and Zenzi M. Griffin. 2000. The persistence of structural priming: Transient
activation or implicit learning? Journal of Experimental Psychology: General 129:177–
192.
Boersma, Paul, and David Weenink. 2005. Praat: doing phonetics by computer (version
4.3.29) [computer program], from http://www.praat.org/. Institute of Phonetic Sciences,
Amsterdam.
Bourhis, Richard Y., and Howard Giles. 1977. The language of intergroup distinctiveness.
In Language, ethnicity, and intergroup relations, ed. Howard Giles, 119–136.
Branigan, Holly P., Martin J. Pickering, Janet F. McLean, and Alexandra A. Cleland. 2007.
Syntactic alignment and participant role in dialogue. Cognition 104:163–197.
Brennan, Susan E., and Charles A. Metzing. 2004. Commentary on Pickering and Garrod.
Two steps forward, one step back: Partner-specific effects in a psychology of dialogue.
Behavioral and Brain Sciences 27:192–193.
Brown-Schmidt, Sarah, and Michael K. Tanenhaus. 2004. Commentary on Pickering and
Garrod. Priming and alignment: Mechanism or consequence? Behavioral and Brain

151
Sciences 27:193–194.
Carahaly, Lynn N. 2000. Listener accuracy in identifying the sexual orientation of male and
female speakers. Master’s thesis, Department of Linguistics, The Ohio State University.
Caramazza, Alfonso. 1997. How many levels of processing are there in lexical access?
Cognitive Neuropsychology 14:177–208.
Carpenter, Karen, Hubert Devonish, and Charlene Coore. 2008. Un fieva mi, uu taak
laik mi: Exploring race, language, and self-concept in Jamaican primary school children.
University of West Indies, Mona, Jamaica.
Chambers, Jack. 1992. Dialect acquisition. Language 68:673–705.
Chartrand, Tanya L., and John A. Bargh. 1996. The chameleon effect: the perception-
behavior link and social interaction. Journal of Personality and Social Psychology 76:893–
910.
Clark, Herbert H., and Deanna Wilkes-Gibbs. 1986. Referring as a collaborative process.
Cognition 22:1–39.
Clopper, Cynthia G., and Janet B. Pierrehumbert. 2008. Effects of semantic predictability
and regional dialect on vowel space reduction. Journal of the Acoustical Society of America
124:1682–1688.
Clopper, Cynthia G., and David B. Pisoni. 2004. Some acoustic cues for the perceptual
categorization of American English regional dialects. Journal of Phonetics 32:111–140.
Coupland, Nikolaus. 2008. The delicate constitution of identity in face-to-face accommoda-
tion: A response to Trudgill. Language in Society 37:267–270.
Crown, Douglas P., and David Marlowe. 1964. The approval motive - Studies in evaluative

152
dependence. New York: John Wiley & Sons, Inc.
Dasgupta, Nilanjana, and Anthony G. Greenwald. 2001. On the malleability of automatic
attitudes: Combating automatic prejudice with images of admired and disliked individ-
uals. Journal of Personality and Social Psychology 81:800–814.
Dasgupta, Nilanjana, Debbie E. McGhee, Anthony G. Greenwald, and Mahzarin R. Banaji.
2000. Automatic preference for White Americans: Eliminating the familiarity explana-
tion. Journal of Experimental Social Psychology 36:316–328.
Davis, Steven B., and Paul Mermelstein. 1980. Comparison of parametric representations
for monosyllabic word recognition in continuously spoken sentences. IEEE Transactions
on Acoustics, Speech, and Signal Processing 28:357–366.
Delvaux, Veronique, and Alain Soquet. 2007. The influence of ambient speech on adult
speech productions through unintentional imitation. Phonetica 64:145–173.
Dijksterhuis, Ap, and John A. Bargh. 2001. The perception-behavior expressway: Auto-
matic effects of social perception on social behavior. In Advances in Experimental Social
Psychology , ed. Mark Zanna, 1–40.
Docherty, Gerard, and Paul Foulkes. 2000. Speaker, speech, and knowledge of sounds.
In Phonological Knowledge: conceptual and empirical issues, ed. Noel Burton-Roberts,
Philip Carr, and Gerard Docherty, 105–129. Oxford University Press.
Eckert, Penelope. 2001. Style and social meaning. In Style and Sociolinguistic Variation,
ed. Penelope Eckert and John R. Rickford, 85–108. Cambridge University Press.
Eckert, Penelope, and John R. Rickford. 2001. Style and sociolinguistic variation. Cam-
bridge University Press.

153
Engstrand, Olle. 1988. Articulatory correlates of stress and speaking rate in Swedish VCV
utterances. Journal of the Acoustical Society of America 83.
Evans, Bronwen G., and Paul Iverson. 2007. Plasticity in vowel perception and production:
A study of accent change in young adults. Journal of the Acoustical Society of America
121:3814–3826.
Fasold, Ralph W. 1981. The relation between Black and White speech in the south. Amer-
ican Speech 56:163–189.
Fasold, Ralph W., William Labov, Fay Boyd Vaughn-Cooke, Guy Bailey, Walt Wolfram,
Arthur K. Spears, and John Rickford. 1987. Are Black and White vernaculars diverging?
Papers from the NWAVE XIV Panel Discussion. American Speech 62:3–80.
Garrod, Simon, and Gwyneth Doherty. 1994. Conversation, co-ordination, and conven-
tion: An empirical investigation of how groups establish linguistic conventions. Cognition
53:181–215.
Giles, Howard. 1973. Accent mobility: a model and some data. Anthropological Linguistics
15:87–105.
Giles, Howard, and Nikolas Coupland. 1991. Language: Contexts and consequences. Milton
Keynes: Open University Press.
Giles, Howard, Nikolas Coupland, and Justine Coupland. 1991. Accommodation theory:
Communication, context, and consequence. In Contexts of Accommodation, ed. Howard
Giles, Justine Coupland, and Nikolas Coupland, 1–68.
Giles, Howard, Donald M. Taylor, and Richard Bourhis. 1973. Towards a theory of inter-
personal accommodation through language: some Canadian data. Language in Society

154
2:177–192.
Goldinger, Stephen D. 1996. Words and voices: Episodic traces in spoken word identification
and recognition memory. Journal of Experimental Psychology 22:116–1183.
Goldinger, Stephen D. 1997. Perception and production in an episodic lexicon. In Talker
Variability in Speech Processing , ed. Keith Johnson and John W. Mullennix, 33–66. Aca-
demic Press: San Diego.
Goldinger, Stephen D. 1998. Echoes of echoes? An episodic theory of lexical access. Psy-
chological Review 105:251–279.
Goldinger, Stephen D., and Tamiko Azuma. 2003. Puzzle-solving science: the quixotic quest
for units in speech perception. Journal of Phonetics 31:305–320.
Goldinger, Stephen D., and Tamiko Azuma. 2004a. Commentary on Pickering and Garrod.
Resonances within and between linguistic beings. Behavioral and Brain Sciences 27:199–
200.
Goldinger, Stephen D., and Tamiko Azuma. 2004b. Episodic memory in printed word
naming. Psychonomic Bulletin & Review 11:716–722.
Greenwald, Anthony G., Debbie E. McGhee, and Jordan L. K. Schwartz. 1998. Measuring
individual differences in implicit cognition: The implicit association test. Journal of
Personality and Social Psychology 74:1464–1480.
Greenwald, Anthony G., Brian A. Nosek, and Mahzarin R. Banaji. 2003. Understanding
and using the Implicit Association Test: I. An improved scoring algorithm. Journal of
Personality and Social Psychology 85:197–216.
Gregory, Stanford W., Kelly Dagan, and Stephen Webster. 1997. Evaluating the relation
155
between vocal accommodation in conversational partners’ fundamental frequencies to
perceptions of communication quality. Journal of Nonverbal Behavior 21:23–43.
Gregory, Stanford W., Brian E. Green, Robert M. Carrothers, and Kelly A. Dagan. 2001.
Verifying the primacy of voice fundamental frequency in social status accommodation.
Language and Communication 21:37–60.
Gregory, Stanford W., and Brian R. Hoyt. 1982. Conversation partner mutual adaptation
as demonstrated by fourier series analysis. Journal of Psycholinguistic Research 11:35–46.
Gregory, Stanford W., and Stephen Webster. 1996. A nonverbal signal in voices of in-
terview partners effectively predicts communication accommodation and social status
perceptions. Journal of Personality and Social Psychology 70:1231–1240.
Gregory, Stanford W., Stephen Webster, and Gang Huang. 1993. Voice pitch and amplitude
convergence as a metric of quality in dyadic interviews. Language and Communication
13:195–217.
Grossberg, Stephen. 1980. How does a brain build cognitive code? Psychological Review
87:1–51.
Grossberg, Stephen. 1999. The link between brain learning, attention, and consciousness.
Consciousness and Cognition 8:1–44.
Grossberg, Stephen. 2003. Resonant neural dynamics of speech perception. Journal of
Phonetics 31:423–445.
Harrington, Jonathan. 2006. An acoustic analysis of ‘happy-tensing’ in the Queen’s Christ-
mas broadcasts. Journal of Phonetics 34:439–457.
Harrington, Jonathan. 2007. Evidence for a relationship between synchronic variability and
156
diachronic change in the Queen’s annual Christmas broadcasts. In Laboratory Phonology
9: Phonetics and Phonology , ed. Jennifer Cole and Jose I. Hualde, 125–144. Walter de
Gruyter.
Harrington, Jonathan, Sallyanne Palethrope, and Catherine I. Watson. 2000a. Does the
Queen speak the Queen’s English? Nature 408:927–928.
Harrington, Jonathan, Sallyanne Palethrope, and Catherine I. Watson. 2000b. Monoph-
thongal vowel changes in Received Pronunciation: an acoustic analysis of the Queen’s
Christmas broadcasts. Journal of the International Phonetic Association 30:63–78.
Hartsuiker, Robert J., Martin J. Pickering, and Eline Veltkamp. 2003. Is syntax sepa-
rate or shared between languages? Cross-linguistic syntactic priming in Spanish-English
bilinguals. Psychological Science 15:409–414.
Hinton, Leanne, Birch Moonwoman, Sue Bremmer, Herb Luthin, Mary van Clay, Jean
Learner, and Hazel Corcoran. 1987. It’s not just the Valley Girls: A study of California
English. In Proceedings of the Thirteenth Annual Meeting of the Berkeley Linguistics
Society , ed. Jon Aske, Natasha Beery, Laura Michaelis, and Hana Filip, 117–28. Berkeley,
CA: Berkeley Linguistics Society.
Holmes, Janet, and Paul Kerswill. 2008. Contact is not enough: A response to Trudgill.
Language in Society 37:273–277.
Jelenec, Petra, and Melanie C. Steffens. 2002. Implicit attitudes toward elderly women and
men. Current Research in Social Psychology 7:1–14.
Johnson, Keith. 1997. Speech perception without speaker normalization: An exemplar
model. In Talker Variability in Speech Processing , ed. Keith Johnson and John W. Mul-

157
lennix, 145–165.
de Jong, Kenneth J. 1995. The supraglottal articulation of prominence in English: Linguistic
stress as localized hyperarticulation. Journal of the Acoustical Society of America 97.
Kaschak, Michael, and Arthur Glenberg. 2004. Commentary on Pickering and Garrod.
Interactive alignment: Priming or memory retrival? Behavioral and Brain Sciences
27:201–202.
Kraljic, Tanya, Susan E. Brennan, and Arthur G. Samuel. 2008a. Accommodating variation:
Dialects, idiolects, and speech processing. Cognition 107:54–81.
Kraljic, Tanya, and Arthur G. Samuel. 2005. Perceptual learning for speech: Is there a
return to normal? Cognitive Psychology 51:141–178.
Kraljic, Tanya, and Arthur G. Samuel. 2006. Generalization in perceptual learning for
speech. Psychonomic Bulletin & Review 13:262–268.
Kraljic, Tanya, and Arthur G. Samuel. 2007. Perceptual adjustments to multiple speakers.
Journal of Memory and Language 56:1–15.
Kraljic, Tanya, Arthur G. Samuel, and Susan E. Brennan. 2008b. First impressions and last
resorts: How listeners adjust to speaker variability. Psychological Science 19:332–338.
Krauss, Robert M., and Jennifer S. Pardo. 2004. Commentary on Pickering and Garrod.
Is alignment always the result of automatic priming? Behavioral and Brain Sciences
27:203–204.
Kuhl, Patricia K., and Andrew N. Metzloff. 1996. Infant vocalizations in response to speech:
Vocal imitation and developmental change. Journal of the Acoustical Society of America
100:2425–2438.
158
Labov, William. 1963. The social motivation of a sound change. Word 19:273–309.
Labov, William. 1966. Social stratification of English in New York City . Center for Applied
Linguistics.
Labov, William. 1990. The intersection of sex and social class in the course of linguistic
change. Language Variation and Change 2:205–254.
Labov, William. 1994. Principles of linguistic change: Internal Factors. Blackwell Publish-
ing.
Labov, William. 2001a. The anatomy of style-shifting. In Style and Sociolinguistic Varia-
tion, ed. Penelope Eckert and John R. Rickford, 85–108. Cambridge University Press.
Labov, William. 2001b. Principles of linguistic change: Social Factors. Blackwell Publish-
ing.
Labov, William, and Wendell A. Harris. 1986. De facto segregation of black and white ver-
naculars. In Diversity and Diachrony , ed. David Sankoff. Philadelphia: John Benjamins
Publishing Company.
Ladefoged, Peter, and D. E. Broadbent. 1957. Information conveyed by vowels. Journal of
the Acoustical Society of America 29:629–637.
Lindblom, Bjorn. 1963. Spectrographic study of vowel reduction. Journal of the Acoustical
Society of America 35:1773–1781.
Magnuson, James S., and Howard C. Nusbaum. 2007. Acoustic differences, listener expec-
tations, and the perceptual accommodation of talker variability. Journal of Experimental
Psychology: Human Perception and Performance 33:391–409.
Marslen-Wilson, William D. 1985. Speech shadowing and speech comprehension. Speech
159
Communication 4:55–73.
Maye, Jessica, Richard N. Aslin, and Michael K. Tanenhaus. 2008. The weckud wetch of
the wast: Lexical adaptation to a novel accent. Cognitive Sciences 32:543–562.
Mitterer, Holger, and Mirjam Ernestus. 2008. The link between speech perception and
production is phonological and abstract: Evidence from a shadowing task. Cognition
109:168–173.
Moonwomon, Birch. 1991. Sound change in San Francisco English. Doctoral Dissertation,
University of California, Berkeley.
Mufwene, Salikoko S. 2008. Colonization, population contacts, and the emergence of new
language varieties: A response to Trudgill. Language in Society 37:254–258.
Munro, Murray J., Tracey M. Derwing, and James E. Flege. 1999. Canadians in Alabama:
a perceptual study of dialect acquisition in adults. Journal of Phonetics 27:385–403.
Munson, Benjamin, Elizabeth C. McDonald, Nancy L. DeBoe, and Aubrey R. White. 2006.
The acoustic and perceptual bases of judgments of women and men’s sexual orientation
from read speech. Journal of Phonetics 34:202–240.
Namy, Laura L., Lynne C. Nygaard, and Denise Sauterberg. 2002. Gender differences in
vocal accommodation: the role of perception. Journal of Language and Social Psychology
21:422–432.
Natale, Michael. 1975a. Convergence of mean vocal intensity in dyadic communication as a
function of social desirability. Journal of Personality and Social Psychology 32:790–804.
Natale, Michael. 1975b. Social desirability as related to convergence of temporal speech
patterns. Perceptual and Motor Skills 40:827–830.

160
Niedzielski, Nancy. 1999. The effect of social information on the perception of sociolinguistic
variables. Journal of Language and Social Psychology 18:62–85.
Nielsen, Kuniko. 2008. The specificity of allophonic variability and its implications for ac-
counts of speech perception. Doctoral Dissertation, University of California, Los Angeles.
Nielsen, Kuniko Y. 2006. Specificity and generalizability of spontaneous phonetic imitation.
In Proceedings of the 9th International Conference on Spoken Language Processing , 1–4.
Nielsen, Kuniko Y. 2007a. Implicit phonetic imitation is constrained by phonemic contrast.
In Proceedings of the International Congress of the Phonetic Sciences XVI , 1961–1964.
Nielsen, Kuniko Y. 2007b. The interaction between spontaneous imitation and linguistic
knowledge. In UCLA Working Papers in Phonetics, 125–137.
Norris, Dennis, James M. McQueen, and Anne Cutler. 2003. Perceptual learning in speech.
Cognitive Psychology 47:204–238.
Nye, Patrick W., and Carol A. Fowler. 2003. Shadowing latency and imitation: the effect
of familiarity with the phonetic patterning of english. Journal of Phonetics 31:63–79.
Ohman, S. E. G. 1966. Coarticulation in VCV utterances: Spectrographic measurements.
Journal of the Acoustical Society of America 39:151–168.
Palmeri, Thomas J., Stephen D. Goldinger, and David B. Pisoni. 1993. Episodic encoding
of voice attributes and recognition memory for spoken words. Journal of Experimental
Psychology: Learning, Memory, and Cognition 19:309–328.
Pardo, Jennifer S. 2006. On phonetic convergence during conversational interaction. Journal
of the Acoustical Society of America 119:2382–2393.
Pardo, Jennifer S. In press. Acoustic-phonetic variation and conversational interaction. In
161
Expressing Oneself/Expressing One’s self: A Festschrift in Honor of Robert M. Krauss,
ed. Ezequiel Morsella.
Payne, Arvilla C. 1980. Factors controlling the acquisition of the Philadelphia dialect by
out-of-state children. In Locating language in time and space, ed. William Labov, 179–218.
Academic Press: New York.
Pickering, Martin J., and Victor S. Ferreira. 2008. Structural priming: A critical review.
Psychological Bulletin 134:427–459.
Pickering, Martin J., and Simon Garrod. 2004a. Author’s response: The interactive-
alignment model: Developments and refinements. Behavioral and Brain Sciences 27:212–
219.
Pickering, Martin J., and Simon Garrod. 2004b. Toward a mechanistic psychology of dia-
logue. Behavioral and Brain Sciences 27:169–226.
Pierrehumbert, Janet. 2001. Exemplar dynamics: Word frequency, lenition, and contrast.
In Frequency effects and the emergence of lexical structure, ed. Joan Bybee and Paul
Hopper, 137–157. Amsterdam: John Benjamins.
Pierrehumbert, Janet. 2002. Word-specific phonetics. In Papers in Laboratory Phonology
VII , ed. Carlos Gussenhoven and Natasha Warner, 101–139. Berlin: Mouton de Gruyter.
Pierrehumbert, Janet. 2003. Phonetic diversity, statistical learning, and acquisition of
phonology. Language and Speech 46:115–154.
Pluymaeker, Mark, Mirjam Ernestus, and R. Harald Baayen. 2005. Articulatory planning
is continuous and sensitive to informational redundancy. Phonetica 62:146–159.
R Development Core Team. 2008. R: A language and environment for statisti-

162
cal computing . R Foundation for Statistical Computing, Vienna, Austria. URL
http://www.R-project.org, ISBN 3-900051-07-0.
Richeson, Jennifer A., and J. Nicole Shelton. 2007. Negotiating interracial interactions:
Costs, consequences, and possibilities. Current Directions in Psychological Science
16:316–320.
Richeson, Jennifer A., and Sophie Trawalter. 2005. Why do interracial interactions impair
executive funtion? A resource depletion account. Journal of Personality and Social
Psychology: Interpersonal Relations and Group Processes 88:934–947.
Richeson, Jennifer A., and Sophie Trawalter. 2008. The threat of appearing prejudiced and
race-based attentional biases. Psychological Science 19:98–102.
Ryalls, Brigette Oliver, and David B. Pisoni. 1997. The effect of talker variability on word
recognition in preschool children. Developmental Psychology 33:441–452.
Sancier, Michele L., and Carol A. Fowler. 1997. Gestural drift in a bilingual speaker of
Brazilian Portuguese and English. Journal of Phonetics 25:421–436.
Schneider, Edgar W. 2008. Accommodation versus identity?: A response to Trudgill. Lan-
guage in Society 37:262–267.
Schneider, Walter, Amy Eschman, and Anthony Zuccolotto. 2002. E-Prime: User’s Guide,
version 1.0. Psychology Software Tools.
Schober, Michael F., and Herbert H. Clark. 1989. Understanding by addressees and over-
hearers. Cognitive Psychology 21:211–232.
Sharma, Devyani. 2005. Dialect stabilization and speaker awareness in non-native varieties
of English. Journal of Sociolinguistics 9:194–224.

163
Shepard, Carolyn A., Howard Giles, and Beth A. LePoire. 2001. Communication accommo-
dation theory. In The New Handbook of Language and Social Psychology , ed. W. Peter
Robinson and Howard Giles, 33–56. John Wiley & Sons Ltd.
Shockley, Kevin, Laura Sabadini, and Carol A. Fowler. 2004. Imitation in shadowing words.
Perception & Psychophysics 66:422–429.
Stevens, Kenneth N., and Arthur S. House. 1963. Perturbation of vowel articulations by
consonant context: An acoustical study. Journal of Speech and Hearing Research 6:111–
128.
Strand, Elizabeth A., and Keith Johnson. 1996. Gradient and visual speaker normalization
in the perception of fricatives. In Natural language processing and speech technology,
results of the 3rd KONVENS conference, Bielefeld, October 1996 , ed. Dafydd Gibbon,
14–26. Mouton de Gruyter.
Street, Richard L. Jr., and Joseph N. Cappella. 1989. Social and linguistic factors influencing
adaptation in children’s speech. Journal of Psycholinguistic Research 18:497–519.
Summers, W. Van. 1987. Effects of stress and final-consonant voicing on vowel production:
Articulatory and acoustic analyses. Journal of the Acoustical Society of America 82:847–
863.
Taylor, Linda L., John C. Catford, Alexander Z. Guiora, and Harlan L. Lane. 1971. Psy-
chological variables and ability to pronounce a second language. Language and Speech
14:146–157.
Thakerar, Jitendra N., Howard Giles, and Jenny Cheshire. 1982. Psychological and linguistic
parameters of speech accommodation theory. In Advances in the social psychology of

164
language, ed. Colin Fraser and Klaus R. Scherer, 205–256.
Traunmuller, Hartmut. 1990. Analytical expressions for the tonotopic sensory scale. Journal
of the Acoustical Society of America 88:97–100.
Trudgill, Peter. 1981. Linguistic accommodation: Sociolinguistic observations on a so-
ciopsychological theory. In Papers from the Parasession on Language and Behavior , ed.
Roberta Hendrick, Carrie Masek, and Mary Frances Miller, 218–237. Chicago: Chicago
Linguistics Society.
Trudgill, Peter. 1986. Dialects in contact . Blackwell Publishing.
Trudgill, Peter. 2008. Colonial dialect contact in the history of European languages: On
the irrelevance of identity in new-dialect formation. Language in Society 37:241–280.
Tuten, Donald N. 2008. Identity formation and accommodation: Sequential and simulta-
neous relations. Language in Society 37:259–262.
Vallabha, Gautam K., and Betty Tuller. 2004. Perceptuomotor bias in the imitation of
steady state vowels. Journal of the Acoustical Society of America 116:1184–1197.
Wagner, Anita, Mirjam Ernestus, and Anne Cutler. 2006. Formant transitions in fricative
identification: The role of native fricative inventory. Journal of the Acoustical Society of
America 120:2267–2277.
Wells, J.C. 1982. Accents of English 3: Beyond the British Isles. Cambridge University
Press.
Westermann, Gert, and Eduardo Reck Miranda. 2004. A new model of sensorimotor cou-
pling in the development of speech. Brain and Language 89:393–400.