phoenix solar ag · phoenix solar ag . excellence in global solar pv solutions . december 2016 ....
TRANSCRIPT

Phoenix Solar AG Excellence in Global Solar PV Solutions
December 2016
Invenergy Luning NV Project 65 MWp – COD 01/2017 Site view Sept. 28th, 2016
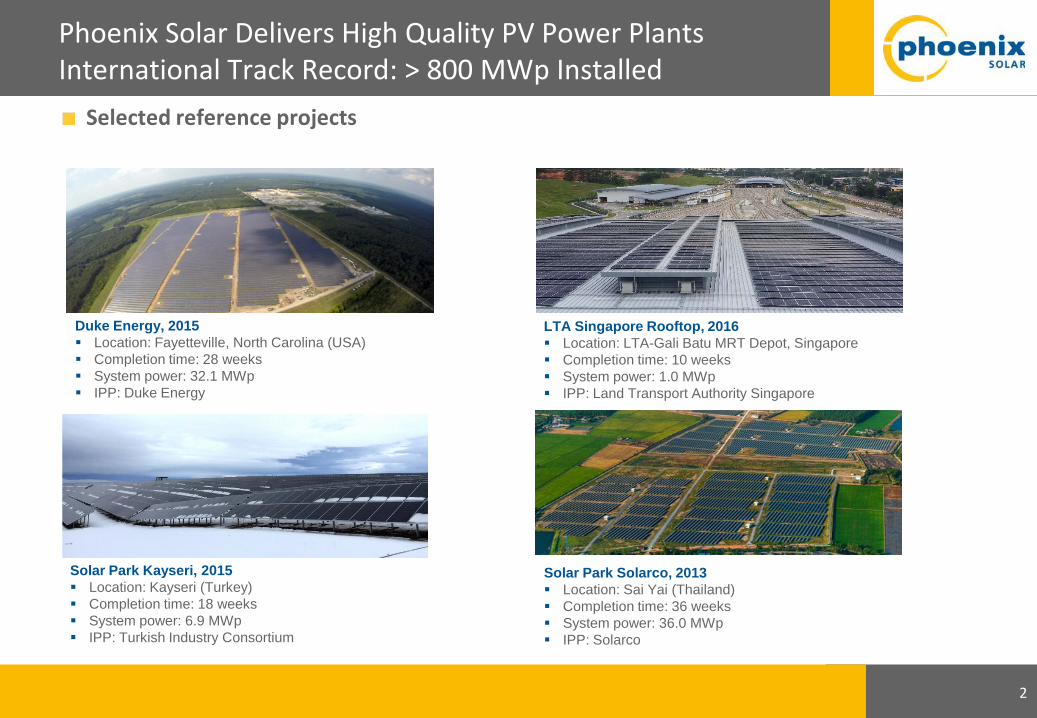
Phoenix Solar Delivers High Quality PV Power Plants International Track Record: > 800 MWp Installed
2
Selected reference projects
Duke Energy, 2015 Location: Fayetteville, North Carolina (USA) Completion time: 28 weeks System power: 32.1 MWp IPP: Duke Energy
Solar Park Kayseri, 2015 Location: Kayseri (Turkey) Completion time: 18 weeks System power: 6.9 MWp IPP: Turkish Industry Consortium
Solar Park Solarco, 2013 Location: Sai Yai (Thailand) Completion time: 36 weeks System power: 36.0 MWp IPP: Solarco
LTA Singapore Rooftop, 2016 Location: LTA-Gali Batu MRT Depot, Singapore Completion time: 10 weeks System power: 1.0 MWp IPP: Land Transport Authority Singapore
Phoenix Solar Focuses on the Utility-Scale and C&I Segments, i.e. 80–90% of the PV Market
3
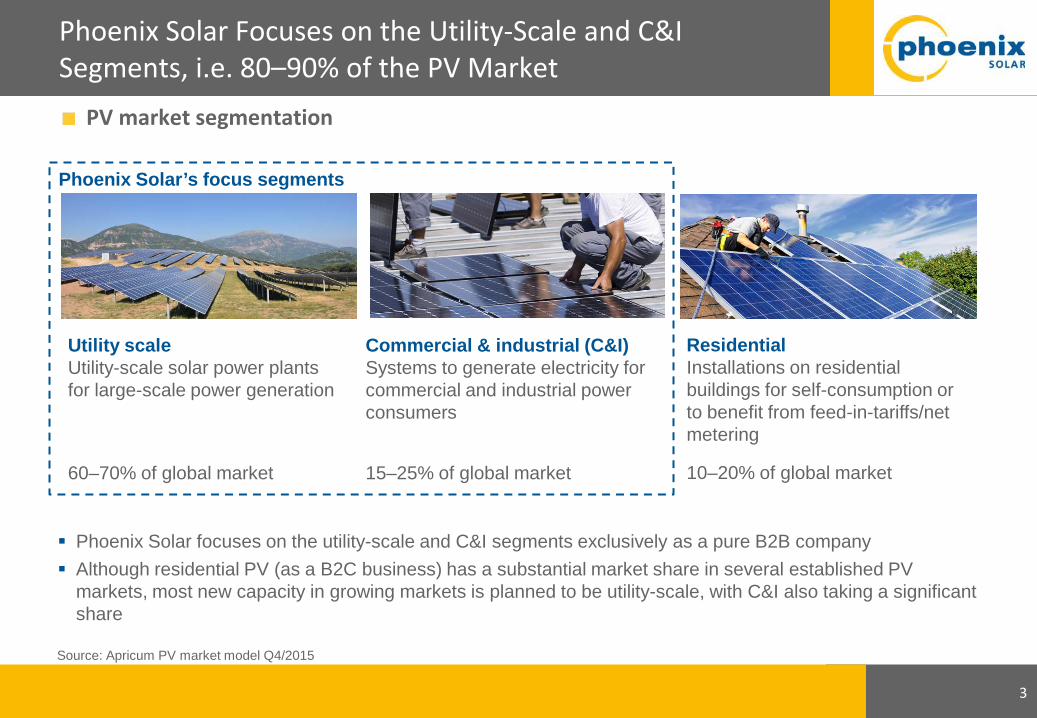
PV market segmentation
Utility scale Utility-scale solar power plants for large-scale power generation 60–70% of global market
Commercial & industrial (C&I) Systems to generate electricity for commercial and industrial power consumers 15–25% of global market
Residential Installations on residential buildings for self-consumption or to benefit from feed-in-tariffs/net metering 10–20% of global market
Phoenix Solar’s focus segments
Phoenix Solar focuses on the utility-scale and C&I segments exclusively as a pure B2B company Although residential PV (as a B2C business) has a substantial market share in several established PV
markets, most new capacity in growing markets is planned to be utility-scale, with C&I also taking a significant share
Source: Apricum PV market model Q4/2015

Phoenix Solar is a Pioneer of the Photovoltaic Industry Mainly Focused on the Engineering of Power Plants
The predominant business model is „EPC“ of photovoltaic power plants – both, roof-top and green-field.
4
Customers Industrial, commercial and institutional investors, utilities
Sales
Operations
Suppliers Diverse local sales agents
in: progressional milestone payments
Engin- eering
Procure- ment
Construc- tion
Manufacturer independent: always best price-performance ratio for customer
in: long term contracts monthly/annual fees
Operation &
Mainten- ance (intl.)
Cash Flows
out: personnel and materials

Proposal Project Finance
Design & Engineering
Construction & Commissioning
Due Diligence Origination Operations &
Maintenance
Project Development EPC Skills O&M
5
Plant Design optimization is key to our
services. LCOE analysis to determine
right technology for the right use
Site studies: Geotechnical studies,
permitting, environmental, Phase I, PPA
negotiations, Interconnection Studies
Utility like safety standards are our
number one priority. Executing on time,
on budget and with an excellent
attention to detail based on high quality
German Engineering
Financial advisory work related to
arranging of construction and
permanent financing, financial model
review and 2 set of eyes for closing
documents
Director O&M oversees group.
Strong management, operations
and monitoring capabilities to
reduce overall ownership costs
Helping clients
select the optimal
sites in regards to
project execution
& production
Comprehensive,
competitive and
customized
proposal
depending on
customer needs
Phoenix Solar: Comprehensive „EPC+“ Capabilities

Phoenix has a truly global presence: Clear focus on fast growing, accessible markets
6
All 100% owned subsidiaries, except Phoenix Solar Singapore (75%), Phoenix Solar Malaysia (75%) and Phoenix Solar Oman (70%)
Phoenix Solar M.E.P.E., Greece (Since June 2008)
Phoenix Solar AG, Germany (Since Nov. 1999)
Phoenix Solar S.L., Spain (Since Apr. 2006)
Phoenix Solar SAS, France (Since Sept. 2009)
Phoenix Solar L.L.C., Oman (Since Dec. 2009)
Phoenix Solar Inc., USA (Since Sept. 2010)
Phoenix Solar Sdn Bhd, Malaysia (Since Sept. 2010)
Phoenix Solar Philippines Inc., Manila (Since Sep. 2015)
Phoenix Solar Pte Ltd., Singapore (Since Sep. 2006)
82%
7% 7% 4%
Revenue split 2015
Americas Middle East
Asia Pacific Europe Office locations

Phoenix Solar Delivers High-Quality PV Systems on Time and on Budget with High Customer Benefit
7
Customer focus
Differentiated approach Local partners
Flexible value chain position
Reliable quality at competitive pricing
On time and on budget Problem solvers
Experienced team
Lean structure
Agile reaction to markets
Lean and agile organization
Every market is different
Ultimate Goal: Create sustainable value for owners and investors globally through reliable engineering and execution of high performance power plants

0
20
40
60
80
100
120
140
160
Solar PV - CSi
Solar PV - thin film
Geothermal Wind Biomass Nat. Gas - Combined
Cycle
Coal Nuclear
low high
Lazard LCoE Study – 9th Iteration Levelized Cost of Energy: all-in production cost / unsubsidized
8
Quelle: Lazard, Levelized Cost of Energy Analysis, 11/2015 UNSUBSIDIZED
$US / MWh

The Global Solar PV Market is Expected to Continue its Rapid Growth
The global solar PV market is expected to continue its rapid growth, with annual installations more than doubling from 2014 to 2019
Annual investments in new PV installations amounted for approximately $90B in 2014 and are expected to reach $125–170B in 2020
Improving economics and ever-expanding grid parity are becoming more important drivers than subsidies in many countries
At the same time, a global push to phase out fossil fuels remains a strong tailwind for renewable energy, including solar
For growing economies with a strong growth in power demand, PV is the best way to quickly add new capacity
9
Projected annual global solar PV market [GWp]
31 39 42
58 62
66
77 85
94
2012 2013 2014 2015 2016E 2017E 2018E 2019E 2020E
Source: Apricum PV market model Q4/2015, center scenario – revised after ITC extension
≈$90B
≈$125–170B
15%
CAGR ’12–’20

In the Selected Countries and Segments, Phoenix has a Large Potential Volume to Address
10
Total addressable market volume forecast in target regions [GW]
Source: Apricum Market Model Q4/2015 center scenario, revised after ITC extension (high and low cases shown for totals); only target segments shown (utility, C&I, where applicable and no residential)
3.9 5.0 9.0 7.6 9.1 10.3 12.0 1.5
1.4 1.6
1.9 2.5
3.2
1.1 1.8 2.2
2.6
2.9
1.0
1.3 1.5
1.5 1.5
1.5
2014 2015 2016 2017 2018 2019 2020
= range between high and low case
7.9
12.7 12.5
14.8
17.0
19.6
5.4 North America
Southeast Asia
MENA
Europe

Development since start of restructuring
11
Return to growth since 2015 – shift to 100% project business entails new challenges
2012/2013: Focus on Power Plants segment in growth regions (USA, MENA, Asia Pacific)
2014: German business completely discontinued.
2015: Shift to growing the business again, comprehensive sales focus
2012-2014: Headcount reduced by >270 within 1.5 years. Cost reduction by 60% in personnel and other operating expenses compared to 2011 realized break even level more than halved.
152.5 83.0 84.5 .16,5 113.5
241.0
72.4 56.7 17.3 5.9
2011A 2012A 2013A 2014A 2015A
Power Plants Components & Systems
2011A 2012A 2013A 2014A 2015A
-84.7
-31.8
-1.4 -4.6 -1.6
Sales (€M) EBIT (€M)

9M/2015 9M/2016
Revenue Growth and Earnings Improvement Continue
Revenues (€M)
82,202
108,334
FY 2014 FY 2015
+253%
33,783
119,407
EBIT (€M)
12
EBITDA (€M)
9M/2015 9M/2016
+88.6%
-3,503 -400
FY 2014 FY 2015
+66%
-4,616 -1,579
9M/2015 9M/2016
+€3mn
-2,508 427
FY 2014 FY 2015
+92%
-3,047 -237
9M/2015-2016 and full year development 2014–2015
+31.8%

Free order backlog at EUR 130.3 mn; weighted project pipeline holds 286 MWp; growth in all phases; weak order intake (project delays)
Highlights for the third quarter and the nine months of 2016: Q3: net profit, strong cash flow, improved gross margin
13
Strong backlog and pipeline
Gross margin improved
Q3 : net profit EBIT: 2.0 mn
Positive op. cash flow
Sale of Bâti-solaire PP
Higher efficiency: In spite of attributing operating personnel to project cost, gross margin improved to 8.8% in 9M/16 (up from 7.9%).
Business generates cash: CF from operations EUR 6.3 mn in 9M
Proceeds were used to repay debts: Net debt reduced to EUR 21 mn (09/30/16), down from EUR 34 (12/31/15)
Revenue growth
Revenues grew 32% in the nine months, 30% in the 3rd quarter; driven by all three core regions US, Middle East, Asia/Pacific
With positive EBIT in Q3 - operating loss close to zero for the 9M: EBIT: EUR -0.4 mn (9M/16) vs. EUR -3.5 mn (9M/15)

2014 A 2015 A 2016 E (prev.)
2016 E (rev.)
2016 Guidance revised due to project delays: Revenues to grow by 30 % / Operating profit of 0.5 to 2 €M
Revenues (€M)
14
EBIT (€M)
Revenues and EBIT for 2014/15 (actual) and 2016 (original and revised forecast)
2014 A 2015 A 2016 E (prev.)
2016 E (rev.)
33.8
119.4
180
210
2.0
4.0
-1.6 - 4.6
Careful cost management: Reduce cost per MWp
annually → increase gross margin Carefully adapt work-
force to revenue growth, flexible solutions Further reduce other
expenses after end of restructuring Mid-term: improve
financial result
150
135
2.0
0.5

Phoenix Solar Group CEO Direction & Vision Strong focus continues on building the foundation
15
Phase I 2015: Turnaround
Volume: from €34 to €120 mio
Turnaround, stabilization Global pipeline process
& growth Bank refinance 03/2016:
allows for both investor scenario and/or organic growth
Get last skeletons out of the cupboard (Altlasten)
Phase II 2016: Build Foundation Volume: from €120 mio
to > € 180 mio, + 50% Geography:
1) Strengthen 3 core Regions (NA, ME, AP) & 2) Expand to selected new markets
HR/Org Development Process Organization:
Efficiency, Best Practice Supply Chain: Cost +
Strategic Partnerships Value Chain: From EPC
to Project Development
Phase III Steady, Profitable Growth 2017-20
Volume: Consistent, rapid growth
Become a differentiated, global Solar PV Solutions Provider
Achieve significant market share in selected markets, segments
System 2020: drive technology
Further strategic fine-tuning t.b.d.

Phoenix Solar Group CEO Direction & Vision Strong focus continues on building the foundation
16
Phase I 2015: Turnaround
Volume: from €34 to €120 mio
Turnaround, stabilization Global pipeline process
& growth Bank refinance 03/2016:
allows for both investor scenario and/or organic growth
Get last skeletons out of the cupboard (Altlasten)
Phase II 2016: Build Foundation Volume: from €120 mio
to > € 180 mio, + 50% Geography:
1) Strengthen 3 core Regions (NA, ME, AP) & 2) Expand to selected new markets
HR/Org Development Process Organization:
Efficiency, Best Practice Supply Chain: Cost +
Strategic Partnerships Value Chain: From EPC
to Project Development
Phase III Steady, Profitable Growth 2017-20
Volume: Consistent, rapid growth
Become a differentiated, global Solar PV Solutions Provider
Achieve significant market share in selected markets, segments
System 2020: drive technology
Further strategic fine-tuning t.b.d.

Phoenix Solar Group CEO Direction & Vision Strong focus continues on building the foundation
17
Phase I 2015: Turnaround
Volume: from €34 to €120 mio
Turnaround, stabilization Global pipeline process
& growth Bank refinance 03/2016:
allows for both investor scenario and/or organic growth
Get last skeletons out of the cupboard (Altlasten)
Phase II 2016: Build Foundation Volume: from €120 mio
to > € 180 mio, + 50% Geography:
1) Strengthen 3 core Regions (NA, ME, AP) & 2) Expand to selected new markets
HR/Org Development Process Organization:
Efficiency, Best Practice Supply Chain: Cost +
Strategic Partnerships Value Chain: From EPC
to Project Development
Phase III Steady, Profitable Growth 2017-20
Volume: Consistent, rapid growth
Become a differentiated, global Solar PV Solutions Provider
Achieve significant market share in selected markets, segments
System 2020: drive technology
Further strategic fine-tuning t.b.d.

34,0
131,1
102,1
85,5
195,7 189,4 182,4
130,3
7,8
93,2
4,3 24,7
144,9
2,0
38,6
4,0
Dec 14 Mar 15 Jun 15 Sep 15 Dec 15 Mar 16 Jun 16 Sep 16
Free Order Backlog / Order Intake
Free order backlog Order Intake
18
Free Order Backlog is a Strong Indicator for Future Revenues

Close to 75% of Phoenix Solar’s Pipeline is Contracted / Under Construction
19
7
107 63
34 53 61 72 88
44
20
178 95 65
74 40
70
91
108
114 110
139
Mar 15 Jun 15 Sep 15 Dec 15 Mar 16 Jun 16 Sep 16
M3 On short list M4 Contract M5 Construction
MWp per milestone – weighted
135
221
174
320
262 235
286
20
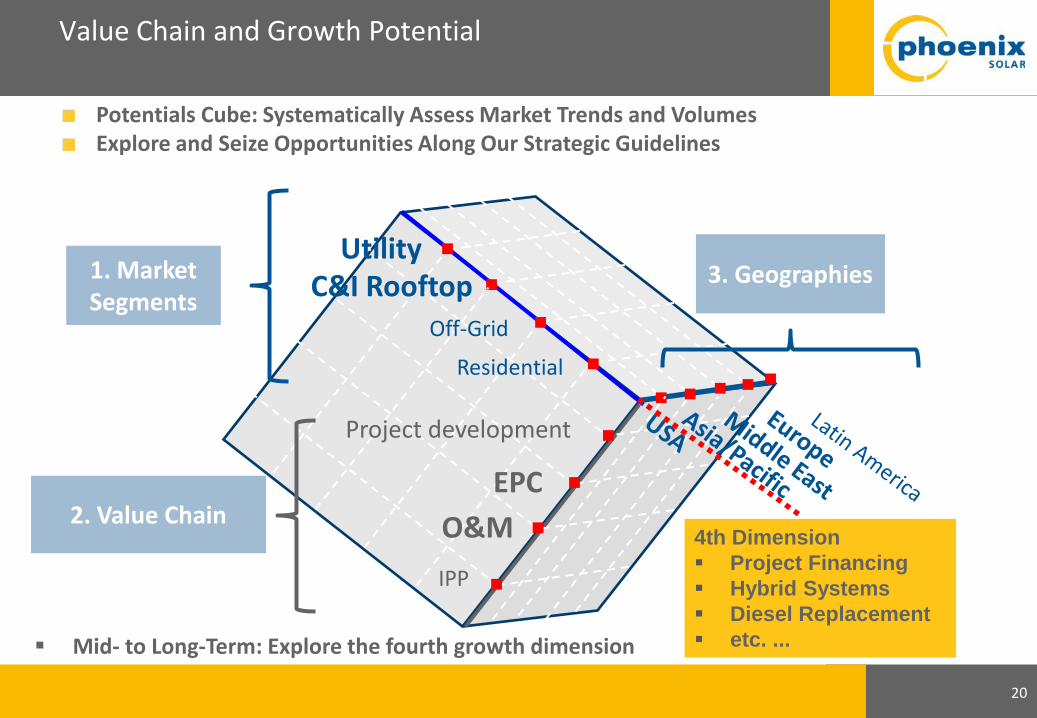
1. Market Segments
3. Geographies
2. Value Chain
EPC O&M IPP
Residential
Off-Grid
C&I Rooftop Utility
Project development
Value Chain and Growth Potential
Potentials Cube: Systematically Assess Market Trends and Volumes Explore and Seize Opportunities Along Our Strategic Guidelines
4th Dimension Project Financing Hybrid Systems Diesel Replacement etc. ... Mid- to Long-Term: Explore the fourth growth dimension

Strengthen footprint in three target regional clusters by further enhancing sales activities in high-growth markets in which Phoenix has already established itself Expand global reach by
entering into new markets within the three target regions (e.g., Mexico, Australia, Morocco)
Expand into project development
Improve competitiveness
Phoenix Solar’s Expansion and Growth: Poised to Enable a Step Change in Valuation
21
Expand to new geographies
Value creation for shareholders by investment in Phoenix
Build project development business leveraging broad expertise gained from EPC offering Enable Phoenix to hold
developed projects in emerging markets until risk perception of long-term project investors improves and projects can be sold at a better valuation
Increase attractiveness to clients and partners requesting a strong balance sheet and thereby increasing competitiveness Build global supply chain
capabilities to achieve 6–8% relative system cost savings annually Introduce process
organization to ensure efficiency, measurability and exchange of best practice
Phoenix Solar AG
“Excellence in Global Solar PV Solutions”

23
Full Service EPC: High quality EPC services at a competitive price
EPC +: Value-added services upstream: skills in project development & financing, downstream: O & M track record and skills
German-engineered, on-time, on-budget delivery of quality systems
Integrity, transparency, good Corporate Governance
Our core strengths
Customers do not look for price alone but rather for price/performance. Demand for reliable, experienced, global
EPC partners remains healthy.
Global presence
1.2 GWp track record
Bankability
Global network: suppliers, sub-contractors, financing partners
Team: qualified, seasoned industry professionals
Focus on ground mount & C&I rooftops
B2B customers and investors

Solar seen as “the future’s default technology” – the bright prospects for solar are widely accepted
24
“80% of countries are expected to be at grid parity by the end of 2017.”
Deutsche Bank – Jan 2015
Analyst market coverage
“Despite the recent drop in oil price, we expect solar electricity to become competitive with retail electricity in an increasing number of markets globally due to declining solar panel costs as well as improving financing and customer acquisition costs.”
Deutsche Bank – Mar 2015
“For the first time, the cost of generating electricity from the sun can compete with traditional sources of power in a number of key markets.”
Morgan Stanley – Jan 2015
“We believe solar will eventually replace nuclear and coal, and [be] establish[ed] as the default technology of the future to generate and supply electricity.”
UBS – Jun 2015
“The price of solar continues to move further toward grid parity – at utility scale, not just at the socket. “
HSBC – Mar 2014
“We commend world leaders for the ambitious pledges made [at COP21], which is sure to accelerate deployment of solar and boost investor confidence – sending a strong message that the low-carbon economy is real and already well underway."
Solar Power Europe – Dec 2015

Broad experience in growth - oriented
business development, general
management and leadership with
international businesses. Expert for the
technical, sales-related, commercial and
financial aspects of utility-scale and
commercial rooftop solar PV systems.
With extensive experience in financial
affairs, Manfred Hochleitner takes the
responsibility for Controlling, Treasury,
Group Accounting, Tax functions and he
plays a significant role in Group financing.
Expert in the field of photovoltaics since
1994. Lead a wide range of international
renewables & storage projects on behalf
of the European Commission & European
Parliament. CEO of the European
Photovoltaic Industry Association (EPIA)
2000 to 2003 and a board member since.
Tim P. Ryan CEO since 01/2015
Manfred Hochleitner CFO since 01/2015
Dr. Murray Cameron Founder, Member of the Executive Board (2003)
25
Major Responsibilities:
Corporate Strategy
Business Development and Sales
USA, Asia Pacific, Middle East Regions
Corporate Communications
Major Responsibilities:
Finance and administration
Internal Audit, Legal and Compliance
Europe Region
Investor Relations
Major Responsibilities:
Global Partner Network
Global Procurement
Strategy Projects
Phoenix Solar’s management consists of a well-balanced mix of industry and functional experts
Appendix

The Phoenix Solar Share: Key Data
5,4% 1,1%
93,6%
Volker Wiewer
Management & supervisory board Free float
PS4 share price development (1 yr)
Share details
Capital market data*
Shareholder structure ISIN / WKN DE000A0BVU93 / A0BVU9 Symbol PS4 Number of shares issued and outstanding
7,372,700 no-par bearer shares
Share capital € 7,372,700 Treasury shares none Authorized share capital € 3,686,350 Market segment Deutsche Börse Prime Standard Trading XETRA, Frankfurt (Prime Standard),
Munich (M:access), Stuttgart, Berlin, Dusseldorf, Hamburg, Hanover, Tradegate Exchange
Financial year end 31 December Designated sponsor Oddo Seydler
0 100 200 300 400 500 600 700
0
2,00
4,00
6,00
8,00
Jun-
15
Jul-1
5
Aug-
15
Sep-
15
Oct
-15
Nov
-15
Dec
-15
Jan-
16
Feb-
16
Mar
-16
Apr-
16
May
-16
Jun-
16
Jul-1
6
Aug-
16
Sep-
16
Oct
-16
Volume ('000) Share Price (€)
26 Appendix
Share price (in €) 2.423 52-w-high / -low 5.000 / 2.276
30-day avg. share price absolute / volume weighted 2.691 / 2.526
90-day avg. share price absolute / volume weighted 2.965 / 2.8655
180-day avg. share price absolute / volume weighted 3.286 / 3.2624
30-day avg. trading volume (in shares) 16,441 90-day avg. trading volume 12,301 180-day avg. trading volume 14,940 No. of shares outstanding (in ’000) 7,372.7 Market capitalization (in €M) 17.9
* as of Nov. 14, 2016

27
13,6*14,88
Share Price Development (Jun 5, 2016 – Dec 4, 2016)
Appendix

28
The content of this presentation is solely for information purposes and is not intended to constitute a recommendation for investment or a solicitation to subscribe or an offer to buy or sell securities of the company. Phoenix Solar AG shall undertake no liability whatsoever for any loss in connection with this presentation or the information contained therein. This also applies particularly to any eventual loss in connection with the shares of Phoenix Solar AG. This document contains forward-looking statements on future developments which are based on management’s current assessment. Words such as “anticipate”, “assume”, “believe”, “estimate”, “expect”, “intend”, “can/could”, “plan”, “project”, “forecast”, “should”, and similar terms are indicative of such forward-looking statements. Such statements are subject to certain risks and uncertainties which are mainly outside the sphere of influence of Phoenix Solar AG, but which have an impact on the business activities, the success, the business strategy and the results. These risks and factors of uncertainty include, for instance, climatic change, changes in the state subsidisation of photovoltaics, the introduction of competitor products or technologies of other companies, the development of the planned internationalisation of business activities, fierce competition as well as rapid technological change in the photovoltaic market. If one of these or other factors of uncertainty or risks should occur, or if the assumptions underlying the statements should prove incorrect, the actual results may diverge substantially from the results in these statements or implicit indications. Phoenix Solar AG does not have the intention nor will it undertake any obligation to realise forward-looking statements on an ongoing basis or at a later point in time as this is entirely dependent on circumstances prevailing on the day of their release. In some countries the dissemination of this presentation and the information contained therein may be restricted or prohibited under the law. This presentation is therefore expressly not intended for persons resident in legal systems under which such an offer or solicitation is not permissible, or for persons for whom such an offer or invitation would constitute a breach of the law.
Appendix
Disclaimer

29
Phoenix Solar AG Dr. Joachim Fleïng Hirschbergstraße 4 D-85254 Sulzemoos Germany Phone +49 8135 938-315 Fax +49 8135 938-429 www.phoenixsolar-group.com [email protected]
Appendix
Contact Details