phoenix sky harbor people mover
TRANSCRIPT

31
Phoenix Sky Harbor People Mover� Financial Considerations
32
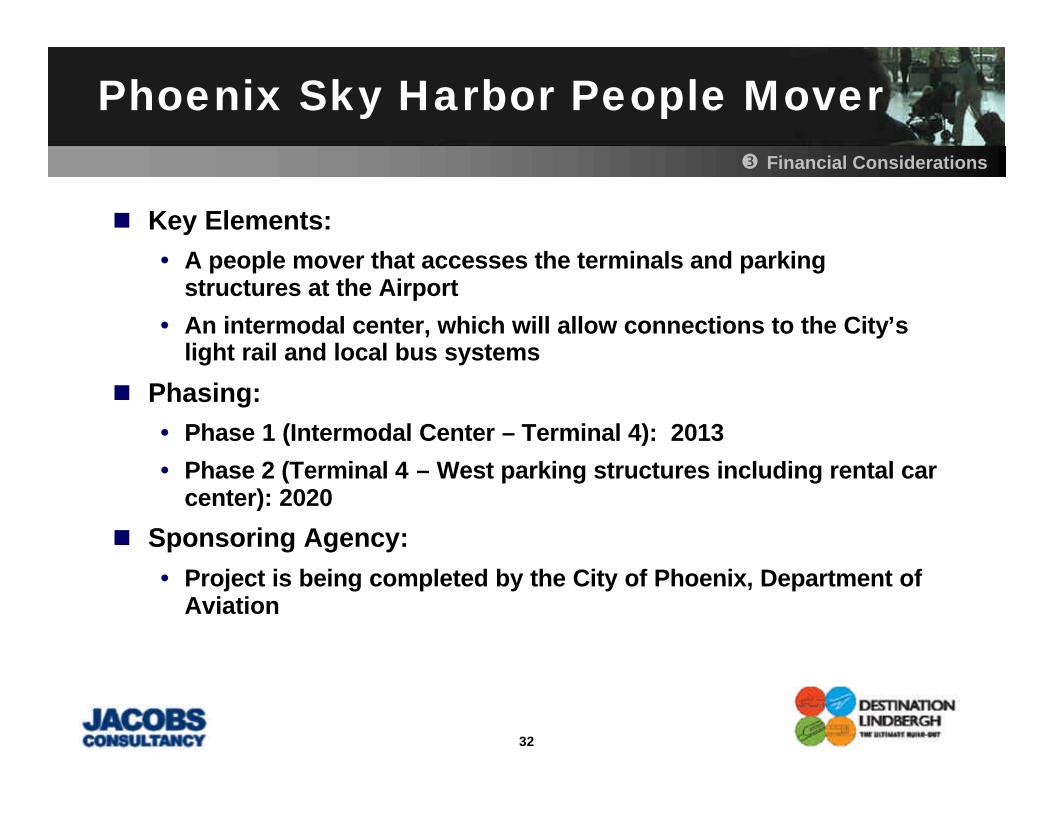
Phoenix Sky Harbor People Mover
n Key Elements:• A people mover that accesses the terminals and parking
structures at the Airport
• An intermodal center, which will allow connections to the City’s light rail and local bus systems
n Phasing:• Phase 1 (Intermodal Center – Terminal 4): 2013
• Phase 2 (Terminal 4 – West parking structures including rental car center): 2020
n Sponsoring Agency: • Project is being completed by the City of Phoenix, Department of
Aviation
� Financial Considerations

33
Phoenix Sky Harbor People Mover
n Project Cost:•Construction – 50% of Total•Total – $3 billion (including bond financing and interest costs)
n Plan of Finance:•90% of the project is PFC eligible
•A greater portion of the project will be paid by PFCs if the maximum PFC level is raised to $6.00
65%975PFCs
100%1,500Total
35%525Airport Revenue Bonds
PercentageEstimated Amount(Approx. $millions)
Funding source
� Financial Considerations

34
T.F. Green Airport Intermodal Center
T.F. Green Airport (Providence, RI) is a constrained airfield facility located directly adjacent to a busy intercity rail corridor.
� Financial Considerations
35
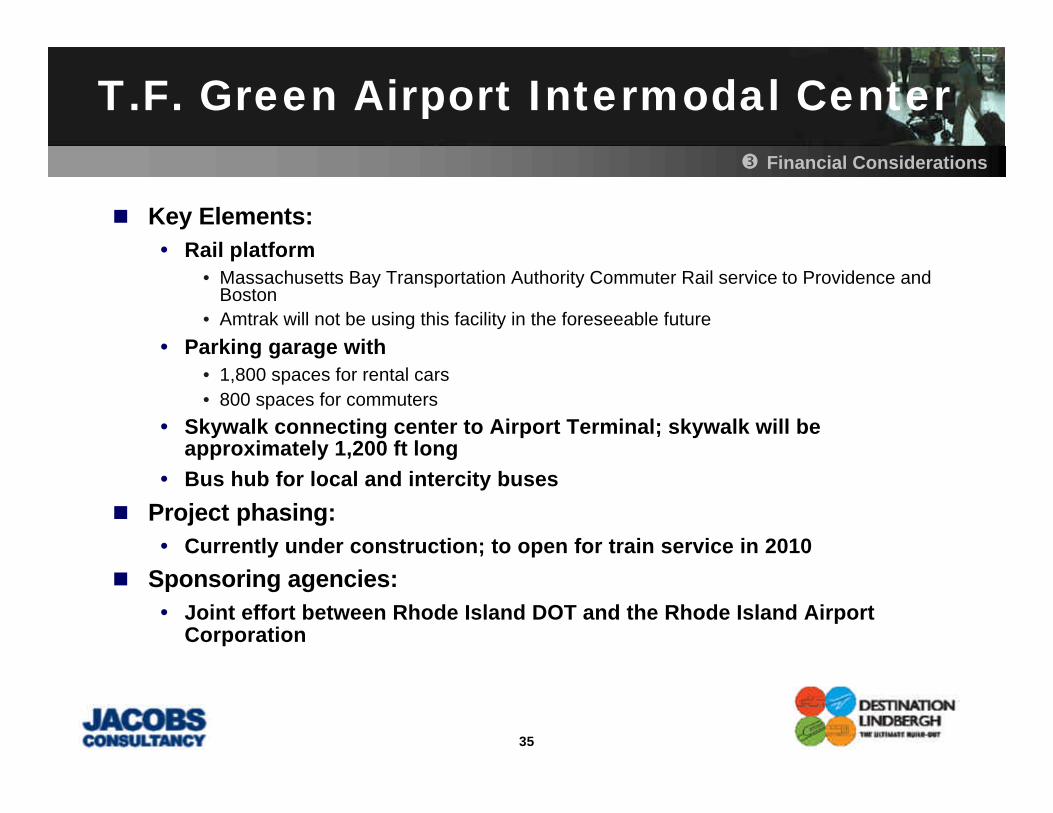
T.F. Green Airport Intermodal Center
n Key Elements: • Rail platform
• Massachusetts Bay Transportation Authority Commuter Rail service to Providence and Boston
• Amtrak will not be using this facility in the foreseeable future
• Parking garage with• 1,800 spaces for rental cars• 800 spaces for commuters
• Skywalk connecting center to Airport Terminal; skywalk will be approximately 1,200 ft long
• Bus hub for local and intercity buses
n Project phasing: • Currently under construction; to open for train service in 2010
n Sponsoring agencies: • Joint effort between Rhode Island DOT and the Rhode Island Airport
Corporation
� Financial Considerations

36
T.F. Green Airport Intermodal Center
n Project cost:•$267 million (most recent data)
n Plan of finance:
•Possible revenue streams include CFCs, rentals revenues and parking revenues.
26Other
28.1Commuter Parking42TIFIA
221.7
39.6
88.9
22.2
29.0
Amount ($millions)
40.2Rental Car - OtherState Grants
22.9Train PlatformFederal Highway Grant
57.6SkywalkEconomic Dev. Corp.
(EDC) Bond
221.7Total
46.9Rental Car - GarageCFCs
Amount ($millions)UseSource
Uses of FundsProject Financing
Note: Plan of finance only available for a previous project total estimate.
� Financial Considerations

37
March Joint Powers Authority
n Location: • March Air Reserve Base (formerly March Air Force Base) is
located in the western Riverside County region of Southern California
n Composition of the Authority:• The March Joint Powers Authority was created through a joint use
agreement in 1993, and is comprised of four jurisdictions whose boundaries touch March Air Force Base
• County of Riverside• City of Moreno Valley• City of Perris• City of Riverside
• Each jurisdiction selects two of its elected officials to serve on the March Joint Powers Commission, the governing body of the Authority
� Financial Considerations

38
March Joint Powers Authority
n The responsibilities of the Authority include:• Federally recognized reuse authority for the former active duty
base
• Land use authority for the 4,400 acres of on-base land deemed surplus and available for disposal actions, as well as 450 acresadjacent to the base
• March JPA now develops the building codes and standards for buildings constructed within its jurisdiction
• Done as “March Joint Powers Redevelopment Authority”
• Development and execution of General Plan, Master Environmental Impact Report and the Final Reuse Plan
• Operation of the Airport (now a joint-use military/civilian aviation facility)
• Named the “March Inland Port Airport Authority”
� Financial Considerations

39
March Joint Powers Authority Organization
� Financial Considerations

40
Pease Development Authority
n Location:• Portsmouth International Airport at
Pease (formerly Pease Air Force Base) is located in Portsmouth, NH
n Composition of the Authority:• Originally called the “Pease
Redevelopment Commission”, which was charged to redevelop the base after it was closed in 1989
• Governed by a seven member Board, which serves 3-year terms
Speaker of the House (State)
1
City of Portsmouth
1.5
Town of Newington
1.5
County of Stratford
1
Total7
Senate President
(State)
1
Governor1 (Chairman)
Who Selects Them
Board Members
� Financial Considerations

41
Pease Development Authority
n Responsibilities of the Authority include:• Implementation of the Redevelopment Plan created by the Pease
Redevelopment Commission
• Oversight of the Maintenance, Operations and Development of:• Pease Airport• Beginning Nov 1, 2009, the Pease Development Authority also began
operating Skyharbor Airport in Rochester, NH • The Port of Portsmouth
• Has the authority to levy PFCs and is eligible for AIP funds
� Financial Considerations

42
Potential Project Management Structure
n Attributes:• Inclusive
All agencies and public/private contributors need to be part of the team
• Meet grant obligation requirements Conform to requirements of each funding source (e.g., AIP/PFC funded projects must have airport as the lead)
• Authoritative Agencies and contributors must delegate authority to project team—requires high level participation
• Simple Project management structure should be easy to set up and not turn into a separate bureaucracy
n A Portland or Warwick-style project management structure would allow for diverse agencies and private interests to be represented and conforms to federal grant obligation requirements
42
� Financial Considerations
43
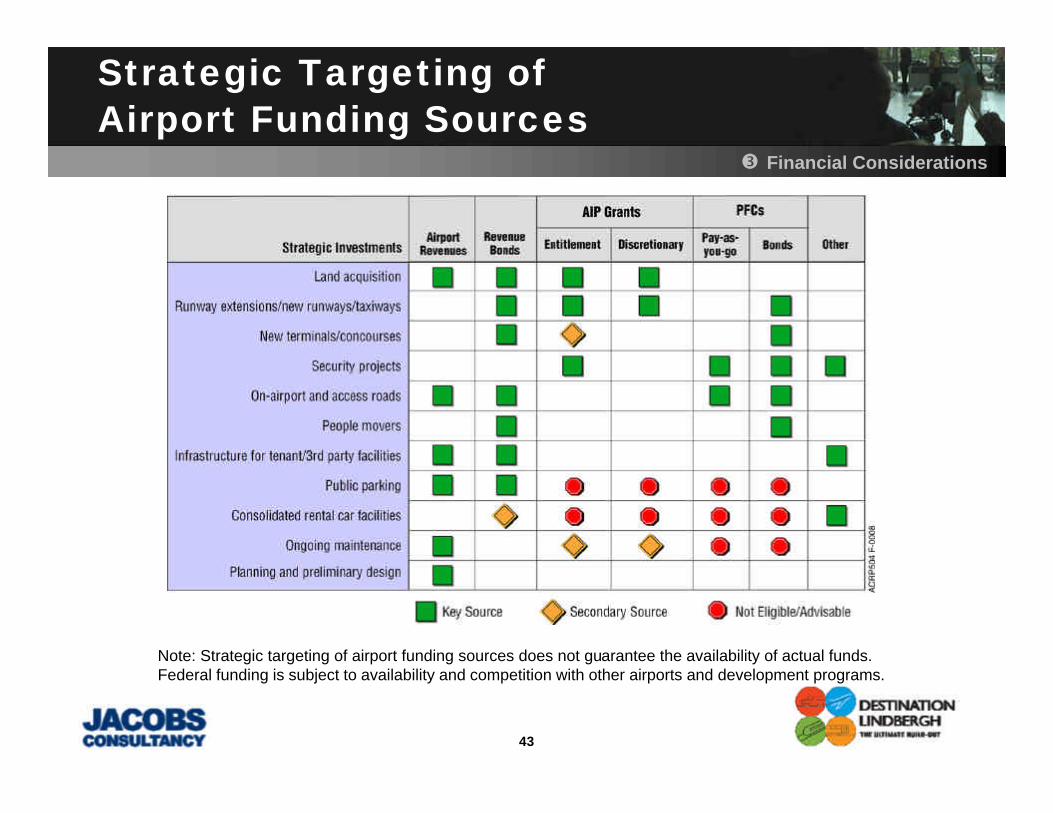
Strategic Targeting of Airport Funding Sources
� Financial Considerations
Note: Strategic targeting of airport funding sources does not guarantee the availability of actual funds. Federal funding is subject to availability and competition with other airports and development programs.

44
Federal Rules and Priorities for Airport Funding
n On-Airport/aviation purpose• Federal eligibility for grant funds limited to on-airport projects. • PFC and airport revenue limited to on-airport and facilities that serve
exclusively airport purposes (only “incidental use” by non-aviation interests permitted). Some exceptions for pro-rating airport share of total traffic (or purpose) may be available.
• Conclusion: on-airport projects easier to justify; if federal sources a large part of project financing, acquisition of property should be a priority.
n Airside needs receive priority• The National Airspace System’s runways and airside infrastructure receive
the vast majority of federal discretionary grant funding.• Use of PFCs requires at a $3.00 level showing of a capacity, noise, or
competition benefit. A PFC greater than $3.00 requires that a “significant contribution” be made to safety, noise or reduction of congestion. PFCs above $3.00 very challenging for access projects.
• Conclusion: Justifying the use of PFCs will require modeling of benefits to demonstrate system benefits.
44
� Financial Considerations

45
Phoenix Sky Harbor People Mover –Additional Discussion
� Financial Considerations
46
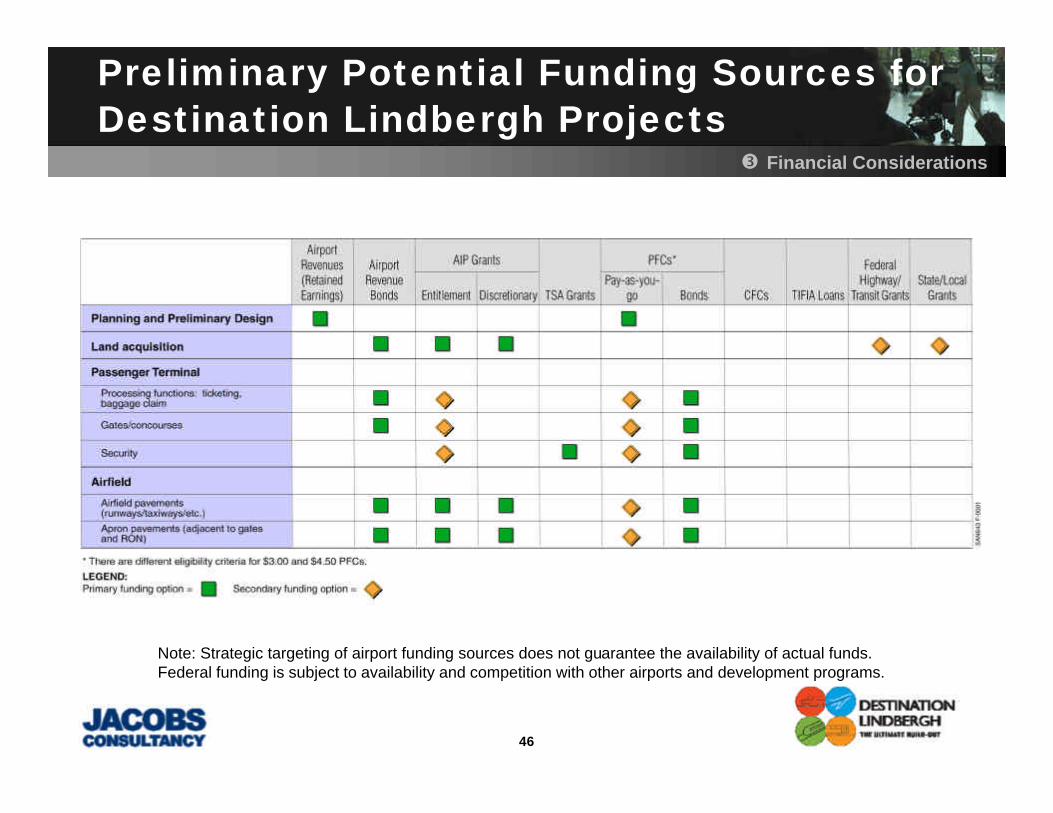
Preliminary Potential Funding Sources for Destination Lindbergh Projects
� Financial Considerations
Note: Strategic targeting of airport funding sources does not guarantee the availability of actual funds. Federal funding is subject to availability and competition with other airports and development programs.

47
Preliminary Potential Funding Sources for Destination Lindbergh Projects (continued)
� Financial Considerations
Note: Strategic targeting of airport funding sources does not guarantee the availability of actual funds. Federal funding is subject to availability and competition with other airports and development programs.

48
Other Funding Opportunities
n Federal Transportation Policy in Flux• New surface authorization legislation provides opportunities
(current authorization expires 9/3/2009)
• Climate change and emission reduction strategies may create new federal eligibilities for transit, rail, airport, and congestionmanagement projects
• Airport sponsors should inventory airport based emissions (including induced emissions on the landside)
• Federal credit programs such as TIFIA, SIBs and development banks may provide additional funding opportunities for multimodal projects
48
� Financial Considerations

49
Other Funding Opportunities (continued)
n Be opportunistic: take advantage of policy opportunities --• Collaborate with transit, planning, and other federal, state, and
local agencies to ensure project is part of all planning efforts, thereby increasing eligibility and funding options
• Inventory airport based emissions (including induced emissions on the landside) to demonstrate project’s net environmental benefits
• Investigate myriad of public-private-partnership (PPP) programs to take advantage of best credit opportunities
49
� Financial Considerations

50
Development Alternatives Evaluation
n Refined concept review
n Methodology and assumptions
�

51
Refined Concept Review
n Four remaining alternative concepts• A2 – North processing, south gates
• A3 – North and south processing, south gates
• A8 – South processing, south gates
• B7 – North processing, north gates
n Support facilities added to concepts• Air cargo
• General aviation
• Fuel farm
• Airport traffic control tower
� Alternatives Evaluation
52
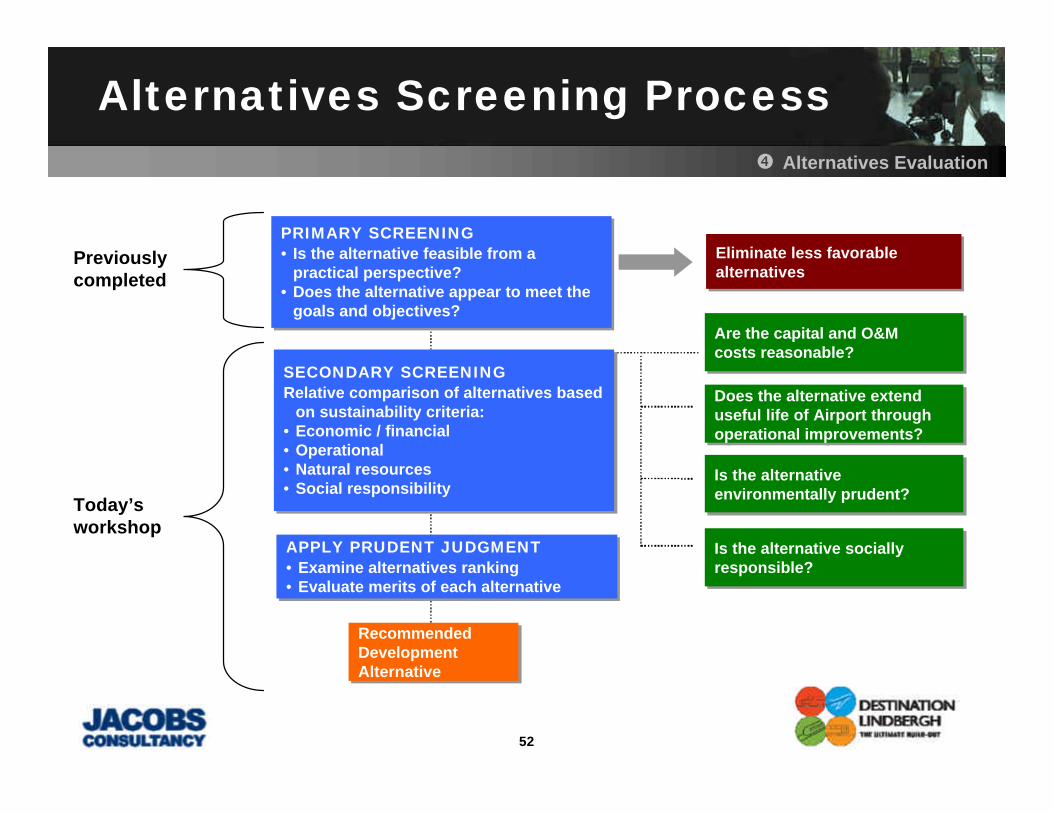
Alternatives Screening Process
PRIMARY SCREENING• Is the alternative feasible from a
practical perspective?• Does the alternative appear to meet the
goals and objectives?
PRIMARY SCREENING• Is the alternative feasible from a
practical perspective?• Does the alternative appear to meet the
goals and objectives?
Eliminate less favorable alternativesEliminate less favorable alternatives
SECONDARY SCREENINGRelative comparison of alternatives based
on sustainability criteria:• Economic / financial• Operational• Natural resources• Social responsibility
SECONDARY SCREENINGRelative comparison of alternatives based
on sustainability criteria:• Economic / financial• Operational• Natural resources• Social responsibility
Recommended Development Alternative
Recommended Development Alternative
Are the capital and O&Mcosts reasonable?Are the capital and O&Mcosts reasonable?
Does the alternative extenduseful life of Airport throughoperational improvements?
Does the alternative extenduseful life of Airport throughoperational improvements?
Is the alternativeenvironmentally prudent?Is the alternativeenvironmentally prudent?
Is the alternative sociallyresponsible?Is the alternative sociallyresponsible?
APPLY PRUDENT JUDGMENT• Examine alternatives ranking• Evaluate merits of each alternative
APPLY PRUDENT JUDGMENT• Examine alternatives ranking• Evaluate merits of each alternative
Previously completed
Today’s workshop
� Alternatives Evaluation

53
Alternatives Evaluation Process
Each alternative is evaluated for each
criteria
Each alternative is evaluated for each
criteria
Alternatives are ranked from1 to 4 for each criteria, with
1 representing the best score
Alternatives are ranked from1 to 4 for each criteria, with
1 representing the best score
In case of a tie ranking, the next lower ranking value is skipped
In case of a tie ranking, the next lower ranking value is skipped
Rankings are summed for all criteria; lowest score represents the best
alternative(s)
Rankings are summed for all criteria; lowest score represents the best
alternative(s)
� Alternatives Evaluation

54
Screening Results
58695846TOTAL SCORE1610108Social responsibility
18201411Environmental factors
14252216Operational factors
10141211Economic/financial factors
B1A8A3A2SUMMARY MATRIX
� Alternatives Evaluation
Note:Lowest score represents the best alternative(s)

55
Performance Metrics
n Intermodal transit center cost per daily trip*
• Alternative A2: $126 – $217 per annual trip
• Alternative B1: $133 – $229 per annual trip
• With lower transit ridership, Alternatives A3 and A8ratios would be greater
n Total capital cost per annual airline passenger • Alternative A2: $287 per annual passenger
• Alternative A3: $265 per annual passenger
• Alternative A8: $314 per annual passenger
• Alternative B1: $304 per annual passenger
*Calculation based on high ITC cost allowance; range accounts for trips estimated with and without high-speed rail.
� Alternatives Evaluation
Uses ITC costs only
Uses total capital cost, including ITC costs

56
Economic Criteria
$0.3 –$0.4
$0.1 –$0.1
$0.1 –$0.1
$0.1 –$0.1Support facilities (billions)
Capital cost allowances1
1qual3qual3qual1qualDuplication of passenger processing functions
10141211Rankings subtotal
4qual3qual1qual1qualEnvironmental mitigation cost
0qual0qual0qual0qualRevenue evaluation
0#0#0#0#Funding source(s)
1length2length4length3lengthBaggage transport
1length2length3length4lengthAPM operational cost
Operational costs
3$6.1 –$8.34$6.4 –
$8.71$5.4 –$7.32$5.8 –
$7.9Total capital cost allowance
$4.0 –$5.4
$3.5 –$4.8
$3.6 –$4.9
$3.8 –$5.2Landside (billions)2
$1.1 –$1.5
$2.1 –$2.8
$1.0 –$1.3
$0.9 –$1.3Terminal (billions)
$0.7 –$1.0
$0.7 –$1.0
$0.7 –$1.0
$1.0 –$1.3Airside (billions)
RankDataRankDataRankDataRankDataECONOMIC CRITERIA
B1A8A3A2
1. Capital costs are for comparative purposes only. Refined capital costs will be developed for preferred concept(s).
2. includes cost of ITC (including modifications to rail lines) ranges from $1.7B – $2.4 B
� Alternatives Evaluation

57
Operational Criteria
Airport operations
Traffic criteria
1qual4qual2qual3qualComplexity of phasing – duration
3qual2qual3qual1qualRunway crossings
0n/a0n/a0n/a0n/aImpacts to Interstate 5
14252216Rankings subtotal
3traffic1traffic4traffic2trafficOverall roads level of service
1transit4transit3transit1transitCompetitive position auto v. transit
1traffic4traffic3traffic1trafficReduction in VMT
1qual4Qual2Qual3qualComplexity of phasing – passenger service
3~2,4004~3,8002~1,6001~1,300Average walking distance (ft)
0n/a0n/a0n/a0n/aLong-term parking
0n/a0n/a0n/a0n/aShort-term parking
Passenger experience
1qual2qual3qual4qualComplexity of baggage system
RankDataRankDataRankDataRankDataOPERATIONAL CRITERIA
B1A8A3A2
� Alternatives Evaluation

58
Environmental Criteria
Air Quality
4qual3qual1qual1qualAesthetics (view shed)
1VMT4VMT3VMT1VMTTotal emissions
18201411Rankings subtotal
1qual2qual2qual2qualHistoric properties
1qual3qual3qual2qualEffect on T&E species
4qual3qual1qual1qualHazardous materials
3area4area2area1areaImpervious surface area
4123Concentration of emissions near residential areas
RankDataRankDataRankDataRankDataENVIRONMENTAL CRITERIA
B1A8A3A2
� Alternatives Evaluation

59
Social Responsibility Criteria
4qual1qual1qual1qualEnhance mission of MCRD
1area3area4area1areaOpportunities for off-airport land redevelopment
Land acquisition
1610117Rankings subtotal
1n/a1n/a1n/a1n/aChange in revenue to governmental entities
4qual2qual2qual1qualPotential community controversy*
436191919Institutional (acres)
112112112112Commercial (acres)
10.210.210.210.2Residential (acres)
RankDataRankDataRankDataRankDataSOCIAL RESPONSIBILITY CRITERIA
B1A8A3A2
*Includes assessment of traffic on public roadways, concentration of air emissions, and viewshed impacts on residential areas of Point Loma and Mission Hills neighborhoods.
� Alternatives Evaluation

60
Traffic Analysis Results Summary
n Alternative A8 results in the best average LOS* for all roadway segments analyzed
n Alternative A3 results in the worst average LOS for all roadway segments analyzed due to 30% of terminal processing remaining on North Harbor Drive
n Alternatives A2 and B1 result in an acceptable LOS on North Harbor Drive
n Pacific Highway remains at an acceptable LOS in all alternatives
n India Street remains at an unacceptable LOS F in all alternatives due to the high volume of background (non-airport) traffic
*Acceptable Level of Service (LOS) defined as C or better
� Alternatives Evaluation

61
Traffic Analysis Assumptions
n Traffic Analysis Assumptions• Airport traffic increases relative to passenger, cargo and general
aviation growth
• Airport traffic was redistributed to roadway links corresponding to the location of terminal processing, parking, rental car, cargo and general aviation facilities in each alternative
• “Regional” background (non-airport) traffic growth was based on SANDAG regional transportation forecast model
• Terminal traffic vehicle mode share and volumes adjusted in accordance with SANDAG’s airport transit ridership forecasts
• Alternatives A2 and B1: PAL 2 Transit Ridership = 19% (includes shared-ride vans)
• Alternatives A-3 and A-8: PAL 2 Transit Ridership = 11% (includes shared-ride vans)
� Alternatives Evaluation

62
Traffic Analysis Results (1 of 2)
40404539Subtotal
3333Kettner – I-5
4544Pacific – Kettner
1111Harbor – Pacific
Laurel Street
6666Kettner – I-5
3232Pacific – Kettner
4354Harbor – Pacific
Hawthorn Street
6666Kettner – I-5
North Harbor Drive
3563Rental Car Rd –Laurel
6666Pacific – Kettner
4354Harbor – Pacific
Grape Street
B1A8A3A2TRAFFIC SEGMENTS
Key:LOA A = 1, LOS B =2, LOS C =3, LOS D = 4, LOS E = 5, LOS F =6
n Harbor Drive • LOS F for A3 and without project
• Improves to acceptable LOS with A2 and B1 (from F to C)
• Slight improvement but still unacceptable LOS with A8 (from F to E)
n Grape Street• LOS F on all segments without project
• Harbor/Pacific segment improves to acceptable LOS with A8 (from F to C)
• Pacific/Kettner and Kettner/I-5 segments remain LOS F with all alternatives
n Hawthorn Street• LOS F on all segments without project
• Harbor/Pacific segment improves to acceptable LOS with A8 (from F to C)
• Pacific/Kettner and Kettner/I-5 segments remain LOS F with all alternatives
n Laurel Street• Unacceptable LOS on all segments without
project
• Harbor/Pacific segment improves to LOS A under all alternatives
• Pacific/Kettner segment improves but remains at unacceptable LOS under all alternatives
• Kettner/I-5 segment improves to LOS C under all alternatives
� Alternatives Evaluation

63
Traffic Analysis Results (2 of 2)
3142OVERALL RANKING
83808882TOTAL
43404343Subtotal
4444Nimitz – Quimby
4444Quimby – Barnett
3433Barnett – Sport Arena
Rosecrans
6666Sassafras – Washington
6666Palm – Sassafras
6666Laurel – Palm
India Street
3333Hawthorn – Grape
Pacific Highway
2222Washington –Sassafras
3333Laurel – Hawthorn
3133Palm – Laurel
3133Sassafras – Palm
B1A8A3A2TRAFFIC SEGMENTSn Pacific Highway
• LOS acceptable for all segments with or without project
• Slightly higher use with A2, A3 and B1
• Slight improvement to LOS with A8 on select segments
n India Street –LOS F on all segments with or without project
n Rosecrans• LOS unacceptable on all segments without
project
• Barnett/Sport Arena segment improves to acceptable LOS with A2, A, and B1; remains unacceptable LOS with A8
• Quimby/Barnett segment remains at unacceptable LOS with all alternatives
• Nimitz/Quimby segment improves slightly with all alternatives but remains at unacceptable LOS (from E to D in all cases)
Key:LOA A = 1, LOS B =2, LOS C =3, LOS D = 4, LOS E = 5, LOS F =6
� Alternatives Evaluation

64
Conclusions and Next Steps
n Project schedule
n Next steps
�

65
Schedule
6. Intermodal ConceptDevelopment
Dec2009 Jan
9. Final Vision and Concept
8. Community Input C
7. Preliminary Vision
5. Community Input B
4. Context andOpportunities
3. Forecasting
2. Goal Setting/Community Input A
1. Vision Structure
Task FebNovOctSeptAugJulyJuneMay2008 April
Legend
Project Task
MeetingReport
Time now
� Conclusions and Next Steps

66
Next Steps
n Act on Policy Committee direction regarding alternatives• Concept refinement and further development
n Initiate financial plans• Cost estimate refinement
n Begin project conclusion activities• Summary report
� Conclusions and Next Steps

67
Thank You!
n Questions
n Comments
n Discussion

68
Appendices
n Alternatives analysis ranking rationale
n Additional traffic analysis information

69
Economic Ranking Rationale
n Capital cost “allowances” – unit costs and order of magnitude cost estimates for the project can be used to compare one alternative to another
n Operational cost • Automated People Mover (APM): based on length of system, secure vs.
non-secure control, and number of stations• Baggage system: length of conveyance system to move
inbound/outbound baggage from check-in to gate; from gate to baggage carousels
• Duplication of passenger functions: consolidated processing area involve lower operational cost
n Key findings• While Alternative A3 has lowest capital cost, it has the highest operational
costs• Alternative B1 and A2 perform best under economic criteria
� Alternatives Evaluation

70
Operational Ranking Rationale
n Airfield operations criteria• Runway crossings relative to location of RON parking; RON parking
ideally on same side of runway as terminal
• Baggage system complexity: optimal alternative minimizes distance required to move baggage
• Phasing duration: optimal alternative would require least amount of time to construct
n Passenger experience criteria• Equivalent amount of parking provided in each alternative
• Walking distance is reflected by average distance to gate
• Phasing complexity: optimal alternative would provide more seamless transition from existing to new facilities
n Key findings• Alternative B1 performs best due to consolidation of facilities
� Alternatives Evaluation

71
Environmental Ranking Rationale
n Key considerations included:• Air quality emissions• Impact to natural resources, hazardous materials, historic
properties, and aesthetics (viewshed)
n Distinguishing factors:• A2 ranks best overall due to emissions, aesthetics, and
impervious area• A3 ranks second best due to emissions, T&E and impervious area• B1 ranks worst on concentration of emissions, impact to views,
and potential for disturbance of hazardous materials• B1 may not impact historic ASIG building or the California Least
Tern nest sites; others do• A8 ranks worst on impervious area and total emissions
� Alternatives Evaluation

72
Social Ranking Rationale
n Key considerations included:• Enhance mission of MCRD• Land acquisition• Potential community controversy• Opportunities for off-airport land redevelopment for public use
n Distinguishing factors:• A2 ranks best on all factors• B1 ranks worst regarding MCRD, land acquisition, and potential
for community controversy• A2 and B1 rank best on opportunity for off-airport land
redevelopment for public use
� Alternatives Evaluation

73
Traffic Changes Due to Alternatives
n North Harbor Drive• Alternatives A2 and B1 place all passenger processing on the
north removing terminal traffic from North Harbor Drive• Alternative B1 would incur slightly greater traffic than Alternative
A2 on North Harbor Drive due to relocation of cargo facilities; however both alternatives result in an acceptable LOS
• Alternative A8 places all terminal traffic coming from I-5 and I-8 (66% of total terminal traffic) on an internal airport access roadway removing it from North Harbor Drive; however all local terminal traffic (34% of total terminal traffic) remains on North Harbor Drive; this results in an unacceptable LOS
• Alternative A3 places passenger processing for 70% of the airline gates on the north; however, the remaining 30% of passengers would be processed in a southern terminal facility along North Harbor Drive resulting in an unacceptable LOS

74
Traffic Changes Due to Alternatives
n Grape and Hawthorn Streets• Alternatives A8, A2 and B1 move all terminal traffic arriving from I-5 and
I-8 to direct freeway ramps• Alternatives A2 and B1 funnel Grape and Hawthorn Street airport traffic to
Pacific Highway to access passenger processing in the north (removing airport traffic from Kettner Boulevard and North Harbor Drive)
• Alternative B1 relocates cargo traffic arriving from I-5 south from Washington Street ramps to Grape and Hawthorn ramps to access southern cargo facilities
• Under Alternative A3, 30% of terminal traffic arriving from I-5 south continues to use Grape and Hawthorn Streets to reach southern terminal facilities
n Laurel and India Streets• Alternatives A2 and B1 move all terminal traffic arriving from I-5 and I-8 to
direct freeway ramps reducing traffic along Laurel and India Streets• Alternatives A3 and A8 maintain a portion of terminal traffic along Laurel
to access southern facilities• 30% of terminal traffic in Alternative A3• 34% of terminal traffic (non-freeway traffic) in Alternative A8
• All Alternatives reduce traffic on India Street; however, LOS remains poor due to the overall volume of traffic
75
Traffic Changes Due to Alternatives
n Pacific Highway
• Pacific Highway operates at an acceptable LOS C or better under all alternatives
• Alternative A8 maintains passenger processing in the south and reduces traffic along Pacific Highway by developing an internal on-Airport roadway adjacent to Pacific Highway
• Alternative A3 places passenger processing for 70% of the aircraft gates on the north and utilizes Pacific Highway for local traffic accessing these facilities
• Alternatives A2 and B1 place all passenger processing in the north and utilize Pacific Highway for local traffic accessing these facilities
n Rosecrans Street
• Alternatives A2, A3 and B1 move a portion of terminal traffic to the north reducing traffic along Rosecrans Street
• Alternative A8 maintains all processing facilities in the south and a portion of terminal traffic continues to utilize Rosecrans Street