phlsa study final report appendix iv
TRANSCRIPT
PHLSA Study Report, Appendix IV February 7, 2018
IV-i
PHLSA Study Final Report
Appendix IV
Process Instrumentation Measurement Data, and Storage Tank Mass Balance and Flash Gas-
to-Oil (FGOR) Calculations for the Summer and Winter Three-Pressure Testing
Table of Contents
IV.1 Introduction .................................................................................................................... IV-1
IV.2 Overview of Data Flow and Calculations ........................................................................ IV-1
IV.3 Process Instrumentation Measurements ....................................................................... IV-4
IV.3.1 Storage Tank-to-Burner Pipeline Gas Flow Rate Measurement ................................... IV-18
IV.4 FGOR and Storage Tank Mass Balance Calculations Approach .................................... IV-20
IV.4.1 FGOR Calculations ......................................................................................................... IV-20
IV.4.2 Storage Tank Mass Balance Calculations ...................................................................... IV-25
IV.5 Summary of FGOR and Storage Tank Mass Balance Measurements ........................... IV-28
IV.5.1 Summary of Key Notes and Observations Associated with the FGOR and Storage Tank
Mass Balance Measurements ....................................................................................... IV-31
IV.6 Index of Sub-Appendices .............................................................................................. IV-41
Sub-Appendices
IV.1 Three-pressure testing process data records and summary calculations for each well cycle.
IV.2 Three-pressure testing FGOR and storage tank mass balance calculations, and associated
uncertainty calculations for each well cycle.
IV.3 Fox thermal mass gas flowmeters composition adjustment spreadsheets.
IV.4 Process measurements instrumentation calibration report
PHLSA Study Report, Appendix IV February 7, 2018
IV-1
IV.1 Introduction
This appendix presents the process instrumentation measurement data, and storage tank mass
balance and FGOR calculations for the summer and winter three-pressure testing (Task 9 in the
project work plan, Appendix I). Section IV.2 provides an overview of the data flow from the 3-
pressure testing through final calculations of FGOR and the storage tank mass balance for each
well cycle. Section IV.3 introduces the instrumentation used to measure the process pressures,
temperatures, and flowrates at the O&G production site, and the equations used to calculate
the FGOR and the storage tank mass balance values are presented in Section IV.4. Section IV.5
summarizes the measured FGOR and the storage tank mass balance values for each well cycle.
Section IV.6 is an index for sub-Appendix IV.1 and sub-Appendix IV.2, which are electronic files
containing the calculation spreadsheets. Sub-Appendix IV.3 is the calibration report for the
measurement instruments.
For the summer 3-pressure testing:
Testing was conducted during three high-pressure separator (i.e., target operating pressure
~ 260 psig) well cycles: S-HP1, S-HP2, and S-HP3.
Testing was conducted during five mid-pressure separator (i.e., target operating pressure ~
225 psig) well cycles: S-MP1, S-MP2, S-MP3, S-MP4, and S-MP5.
Testing was conducted during three low-pressure separator (i.e., target operating pressure
~ 175 psig) well cycles: S-LP1, S-LP2, and S-LP3.
For the winter 3-pressure testing:
Testing was conducted during three high-pressure separator (i.e., target operating pressure
~ 260 psig) well cycles: W-HP1, W-HP3, and W-HP4.
Testing was conducted during three mid-pressure separator (i.e., target operating pressure
~ 225 psig) well cycles: W-MP1, W-MP2, and W-MP3.
Testing was conducted during three low-pressure separator (i.e., target operating pressure
~ 175 psig) well cycles: W-LP1, W-LP2, and W-LP3.
IV.2 Overview of Data Flow and Calculations
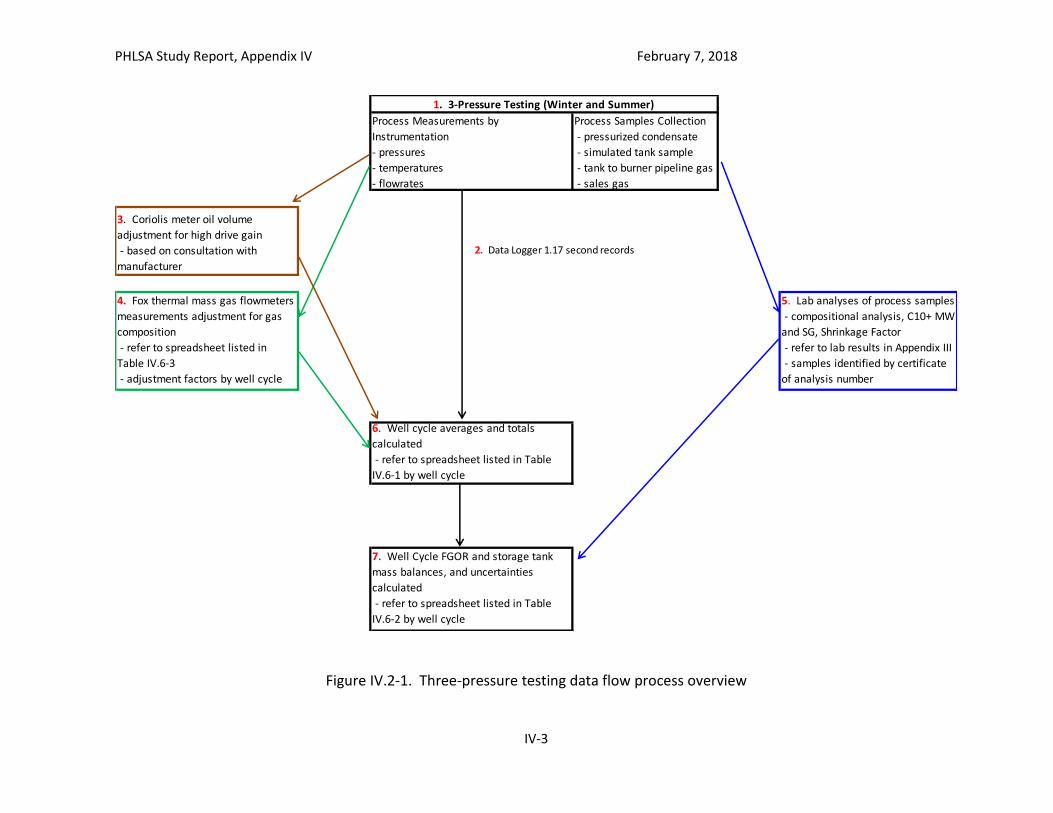
Figure Section IV.2-1 shows the data flow and analysis for the three-pressure testing, and
includes the following primary steps.
PHLSA Study Report, Appendix IV February 7, 2018
IV-2
1. During each 3-pressure test well cycle, instrumentation measurements of process
parameters were recorded by a data logger at 1.17 second intervals and process samples
(e.g., pressurized condensate, tank-to-burner pipeline gas) were collected. Refer to Section
3.2.9 of the Final Report for the three-pressure testing matrix.
2. The data logger records were transferred a spreadsheet that calculated well cycle average
and totals for measured parameters.
3. Coriolis meter measurements of produced oil volumes were reviewed with the
manufacturer for possible adjustment for high drive gain. High drive gain is an indicator of
two-phase flow that can bias oil flow rate measurements. Note that oil volume adjustments
were small, one percent or less.
4. Storage tank-to-burner gas flowrates measured by two Fox thermal mass flowmeters
(identified as instruments “Fox 1 flow” and “Fox 2 flow” in the tables and figures that
follow) were adjusted using a heat transfer model because the process gases had
compositions that differed from the instrument calibration gases. This model is based on
correlations for heat transfer from a heated cylinder in a gas cross flow, and considers the
density, viscosity, thermal conductivity and Prandtl number of the gas. The spreadsheets
listed in Table IV.6-3 perform these calculations in two steps. For example, the “Fox
Flowmeter 21773_Fox 1_Summer pre-test Cal Data” spreadsheet calculates a Reynolds
number exponent “n” for the heat transfer model from calibration data provided by the
manufacturer. The “Fox Meters Summer Tank Gas Composition Adjustment Factors”
spreadsheet then calculates a composition adjustment factor to adjust measured flowrates
for each well cycle using the heat transfer model, the “n” exponent, and the relative
compositions of the well cycle process gas and the flow meter calibration gas. This issue is
discussed in greater detail in Sections IV.3.1 and IV.6.
5. Process samples collected for each well cycle are sent to the laboratory for analysis. The
lab results are in Appendix III and samples are identified by the Certificate of Analysis
number in each spreadsheet.
6. Spreadsheets listed in Table IV.6-1 are used to calculate well cycle average and totals for
measured process parameters.
7. The output from the spreadsheets listed in Table IV.6-1 and the lab results are inputs to the
Spreadsheets listed in Table IV.6-2 which calculates well cycle storage tank mass balance
and FGOR values.
The well cycle ID number and the Certificate of Analysis number for the lab results are used to
track data through the data flow process outlined in Figure IV.2-1.
PHLSA Study Report, Appendix IV February 7, 2018
IV-3
Figure IV.2-1. Three-pressure testing data flow process overview
Process Measurements by
Instrumentation
- pressures
- temperatures
- flowrates
Process Samples Collection
- pressurized condensate
- simulated tank sample
- tank to burner pipeline gas
- sales gas
3. Coriolis meter oil volume
adjustment for high drive gain
- based on consultation with
manufacturer
4. Fox thermal mass gas flowmeters
measurements adjustment for gas
composition
- refer to spreadsheet listed in
Table IV.6-3
- adjustment factors by well cycle
5. Lab analyses of process samples
- compositional analysis, C10+ MW
and SG, Shrinkage Factor
- refer to lab results in Appendix III
- samples identified by certificate
of analysis number
6. Well cycle averages and totals
calculated
- refer to spreadsheet listed in Table
IV.6-1 by well cycle
7. Well Cycle FGOR and storage tank
mass balances, and uncertainties
calculated
- refer to spreadsheet listed in Table
IV.6-2 by well cycle
1. 3-Pressure Testing (Winter and Summer)
2. Data Logger 1.17 second records
PHLSA Study Report, Appendix IV February 7, 2018
IV-4
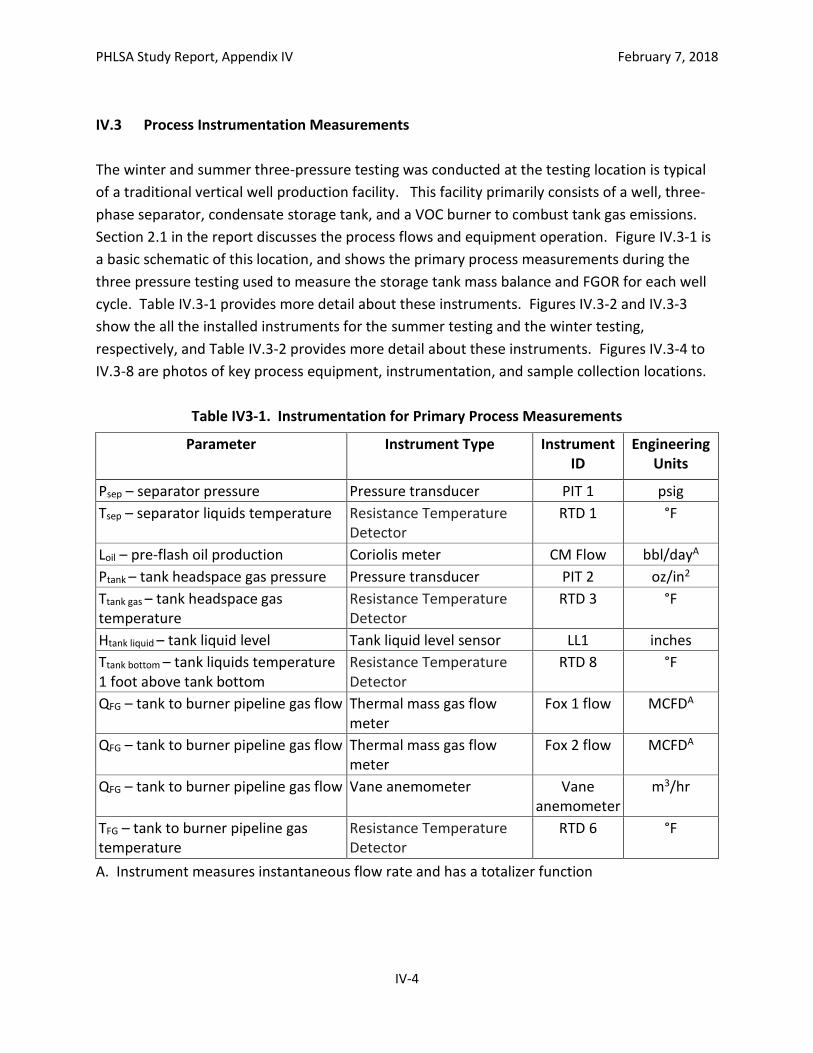
IV.3 Process Instrumentation Measurements
The winter and summer three-pressure testing was conducted at the testing location is typical
of a traditional vertical well production facility. This facility primarily consists of a well, three-
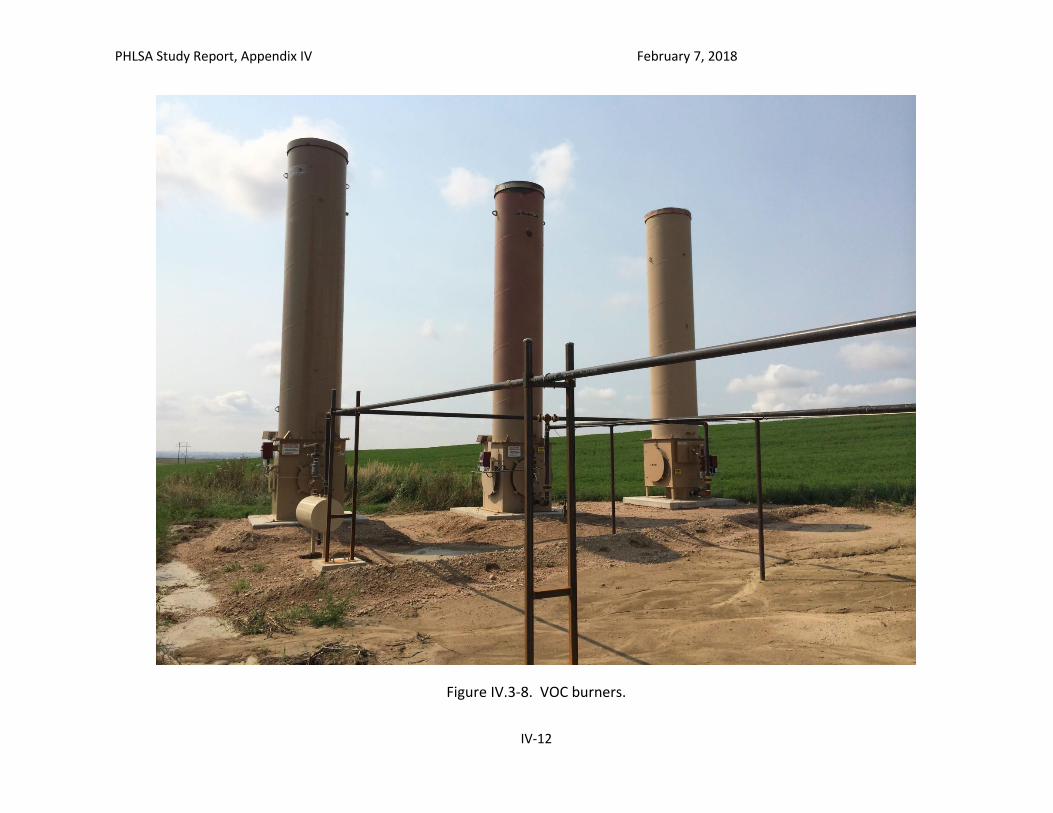
phase separator, condensate storage tank, and a VOC burner to combust tank gas emissions.
Section 2.1 in the report discusses the process flows and equipment operation. Figure IV.3-1 is
a basic schematic of this location, and shows the primary process measurements during the
three pressure testing used to measure the storage tank mass balance and FGOR for each well
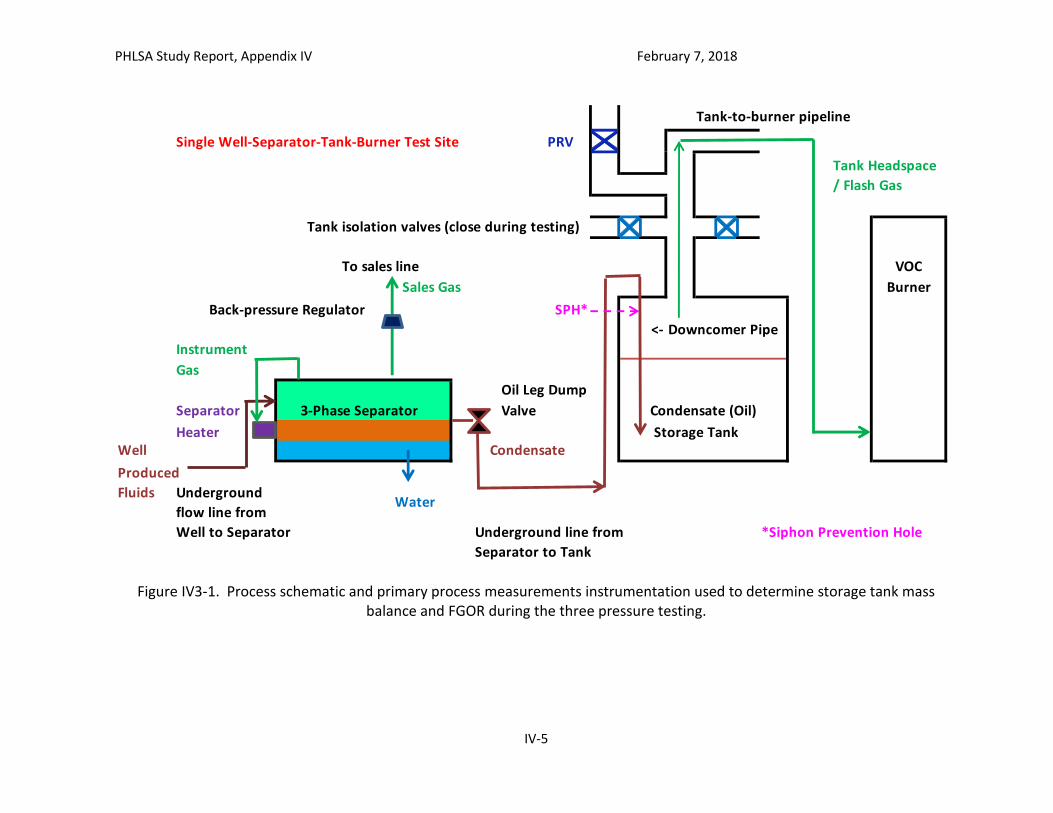
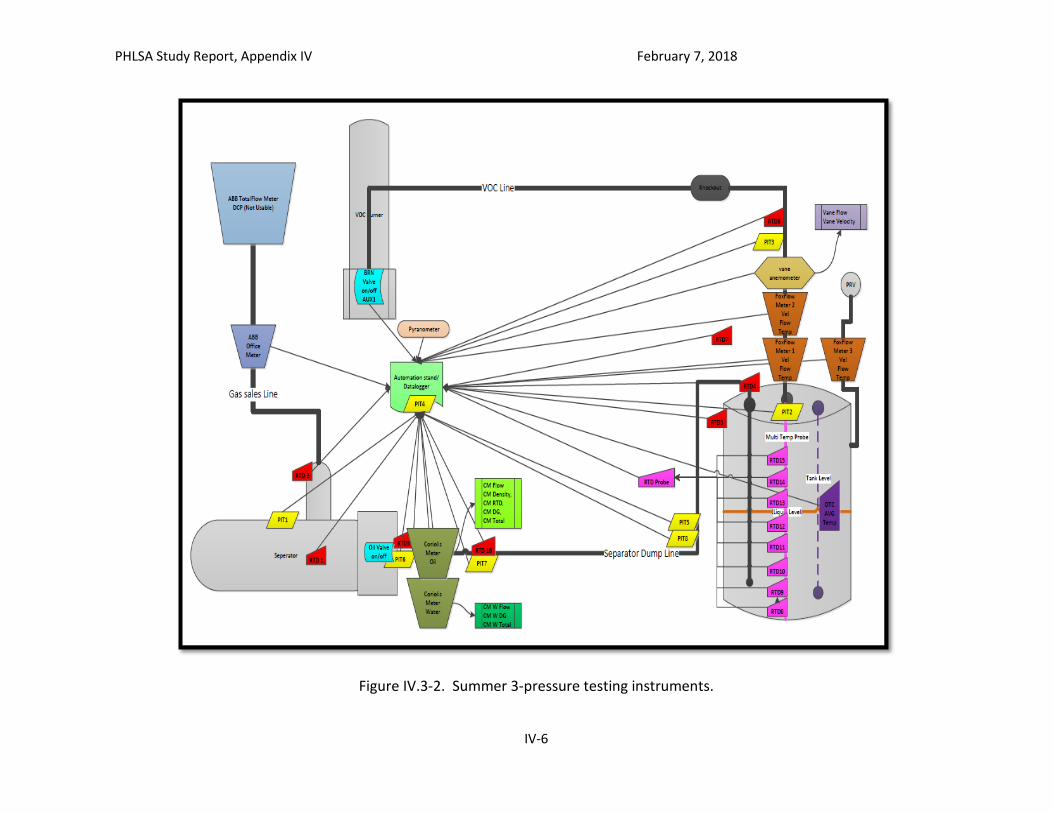
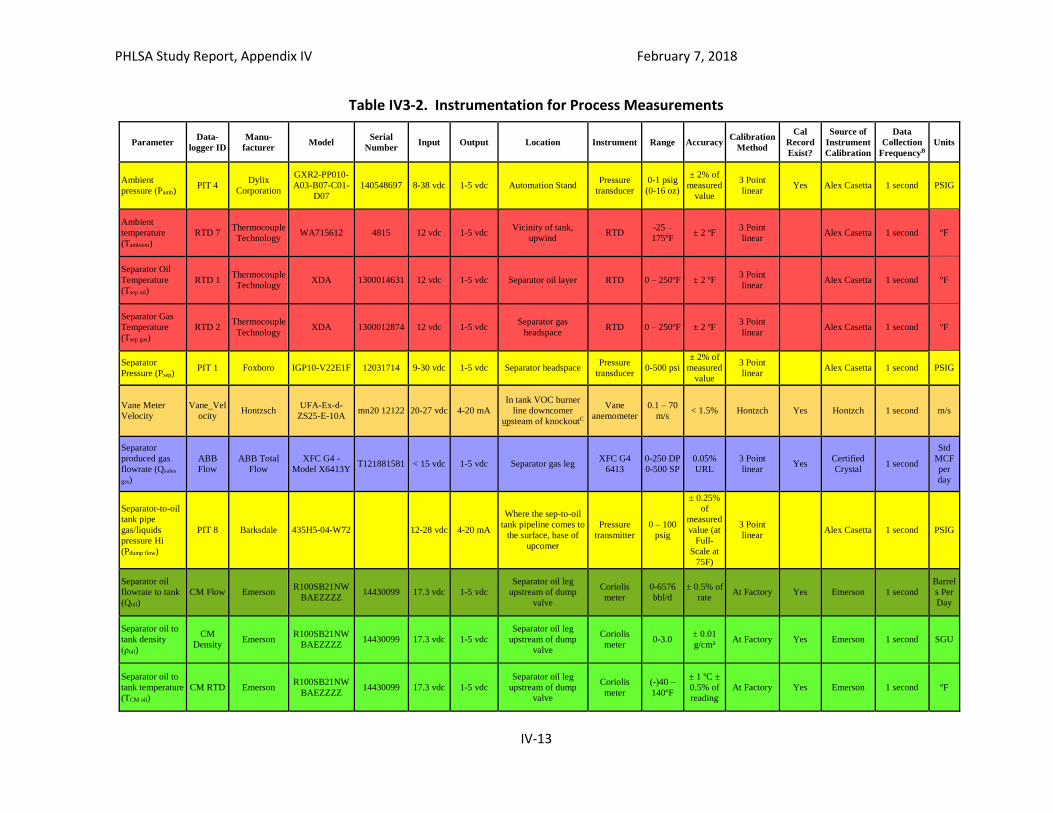
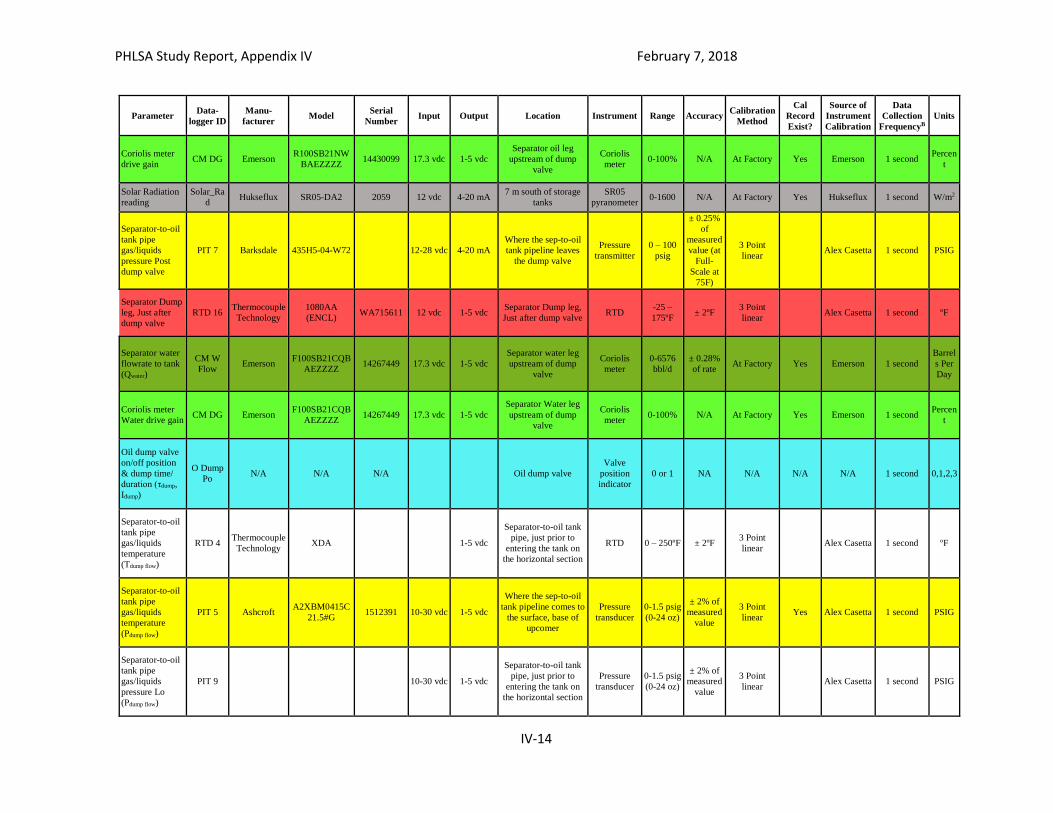
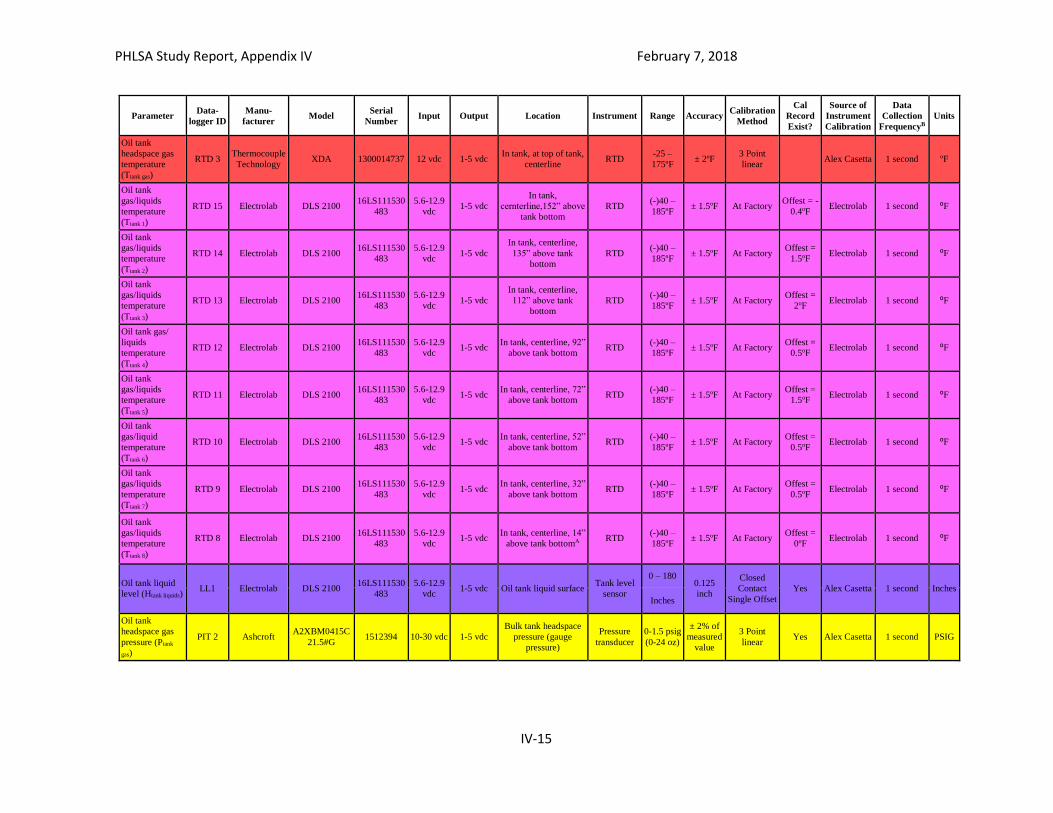
cycle. Table IV.3-1 provides more detail about these instruments. Figures IV.3-2 and IV.3-3
show the all the installed instruments for the summer testing and the winter testing,
respectively, and Table IV.3-2 provides more detail about these instruments. Figures IV.3-4 to
IV.3-8 are photos of key process equipment, instrumentation, and sample collection locations.
Table IV3-1. Instrumentation for Primary Process Measurements
Parameter Instrument Type Instrument ID
Engineering Units
Psep – separator pressure Pressure transducer PIT 1 psig
Tsep – separator liquids temperature Resistance Temperature Detector
RTD 1 °F
Loil – pre-flash oil production Coriolis meter CM Flow bbl/dayA
Ptank – tank headspace gas pressure Pressure transducer PIT 2 oz/in2
Ttank gas – tank headspace gas temperature
Resistance Temperature Detector
RTD 3 °F
Htank liquid – tank liquid level Tank liquid level sensor LL1 inches
Ttank bottom – tank liquids temperature 1 foot above tank bottom
Resistance Temperature Detector
RTD 8 °F
QFG – tank to burner pipeline gas flow Thermal mass gas flow meter
Fox 1 flow MCFDA
QFG – tank to burner pipeline gas flow Thermal mass gas flow meter
Fox 2 flow MCFDA
QFG – tank to burner pipeline gas flow Vane anemometer Vane anemometer
m3/hr
TFG – tank to burner pipeline gas temperature
Resistance Temperature Detector
RTD 6 °F
A. Instrument measures instantaneous flow rate and has a totalizer function
PHLSA Study Report, Appendix IV February 7, 2018
IV-5
Figure IV3-1. Process schematic and primary process measurements instrumentation used to determine storage tank mass balance and FGOR during the three pressure testing.
Tank-to-burner pipeline
Single Well-Separator-Tank-Burner Test Site PRV
Tank isolation valves (close during testing)
To sales line VOC
Sales Gas Burner
Back-pressure Regulator SPH*
<- Downcomer Pipe
Instrument
Gas
Oil Leg Dump
Separator 3-Phase Separator Valve Condensate (Oil)
Heater Storage TankWell Condensate
Produced
Fluids Underground
flow line from Water
Well to Separator *Siphon Prevention HoleUnderground line from
Separator to Tank
Tank Headspace
/ Flash Gas
PHLSA Study Report, Appendix IV February 7, 2018
IV-6
Figure IV.3-2. Summer 3-pressure testing instruments.
PHLSA Study Report, Appendix IV February 7, 2018
IV-7
Figure IV.3-3. Winter 3-pressure testing instruments.
PHLSA Study Report, Appendix IV February 7, 2018
IV-8
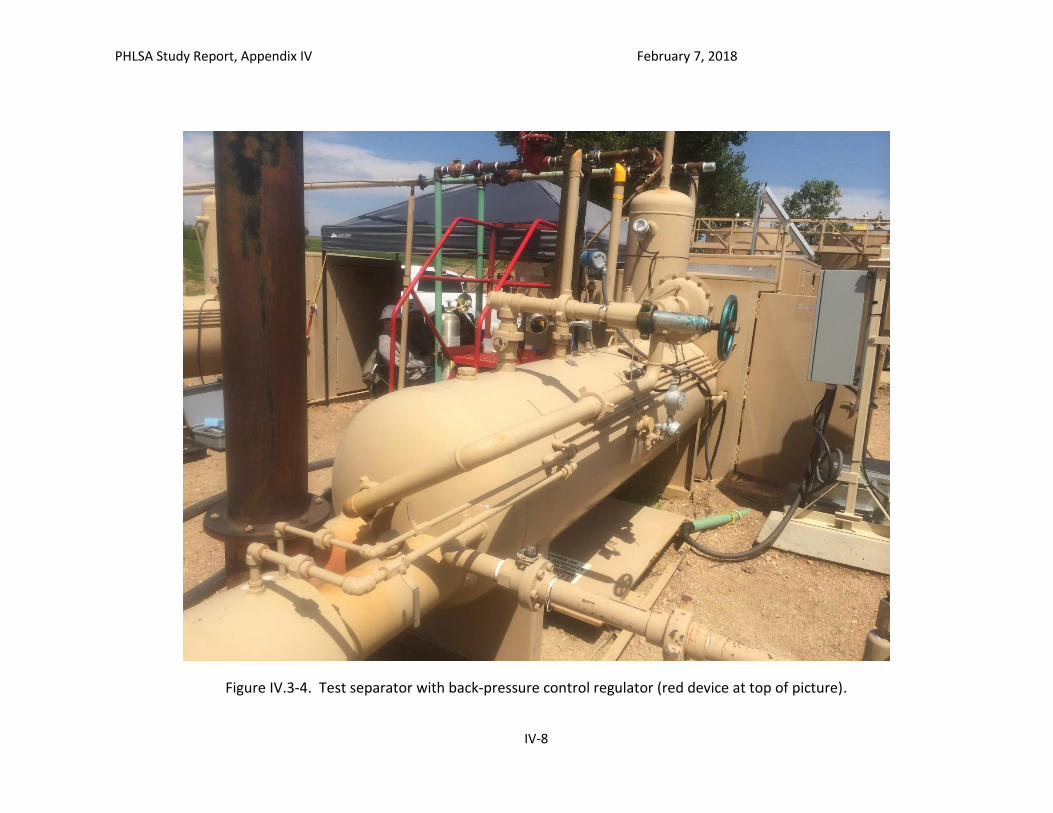
Figure IV.3-4. Test separator with back-pressure control regulator (red device at top of picture).
PHLSA Study Report, Appendix IV February 7, 2018
IV-9
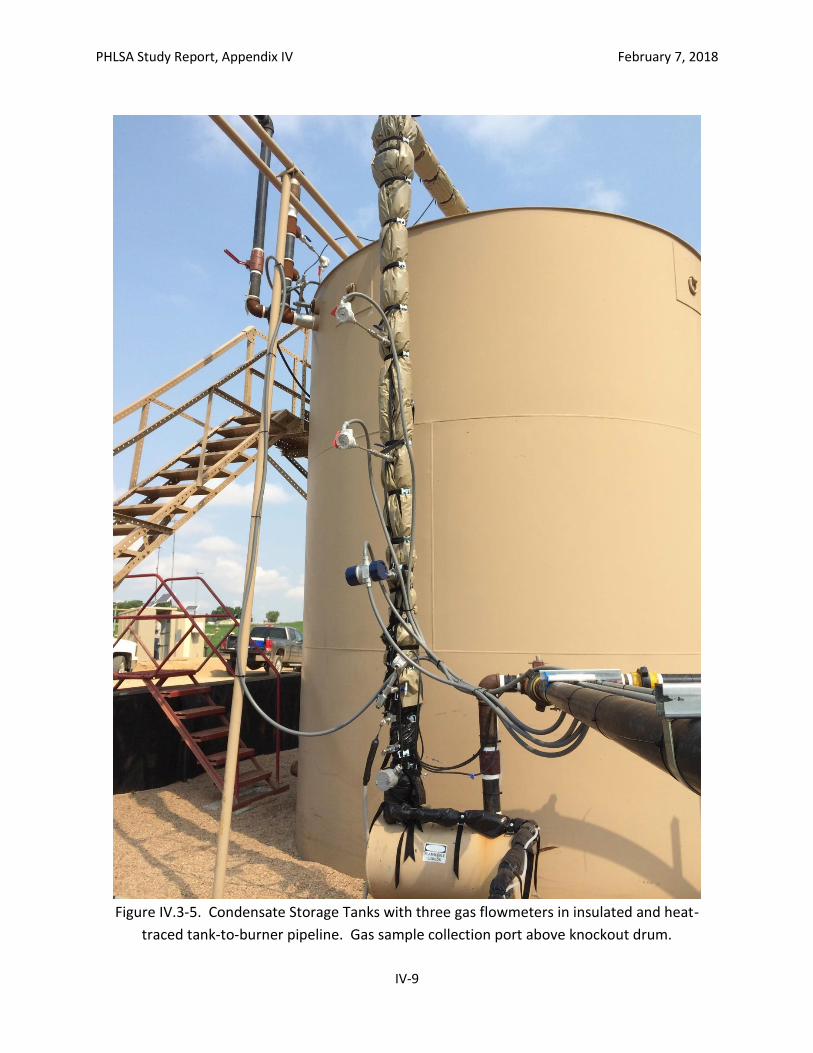
Figure IV.3-5. Condensate Storage Tanks with three gas flowmeters in insulated and heat-
traced tank-to-burner pipeline. Gas sample collection port above knockout drum.
PHLSA Study Report, Appendix IV February 7, 2018
IV-10
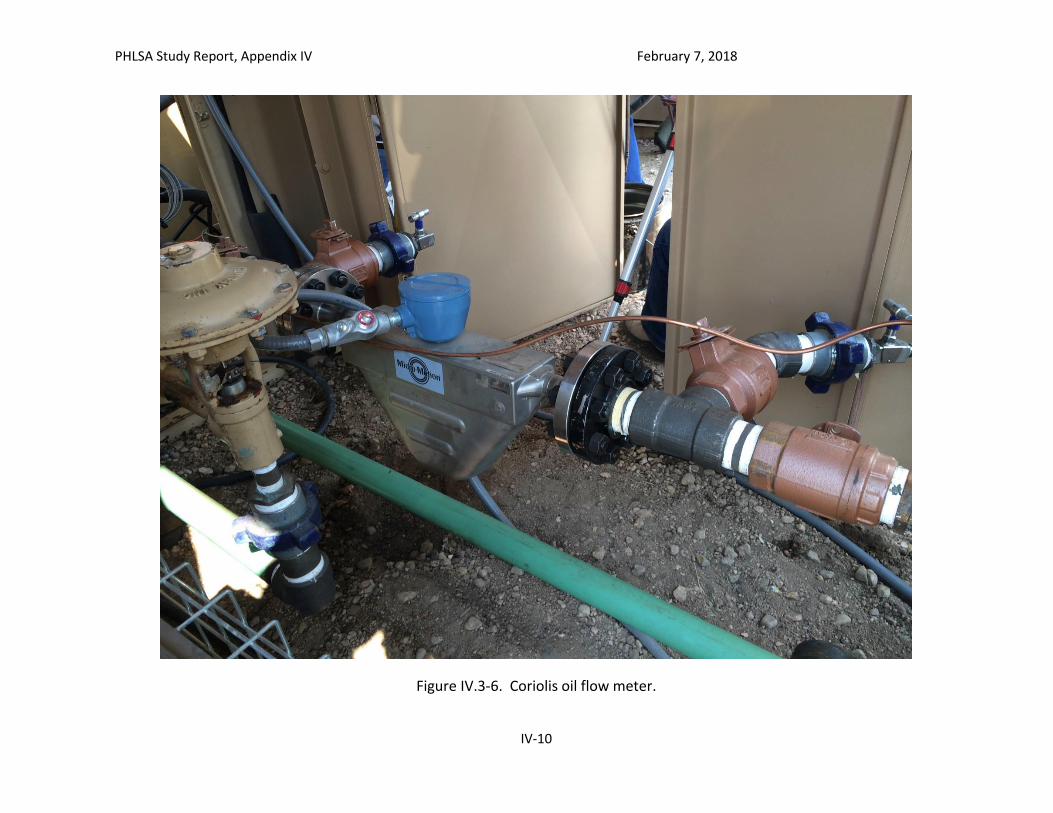
Figure IV.3-6. Coriolis oil flow meter.
PHLSA Study Report, Appendix IV February 7, 2018
IV-11
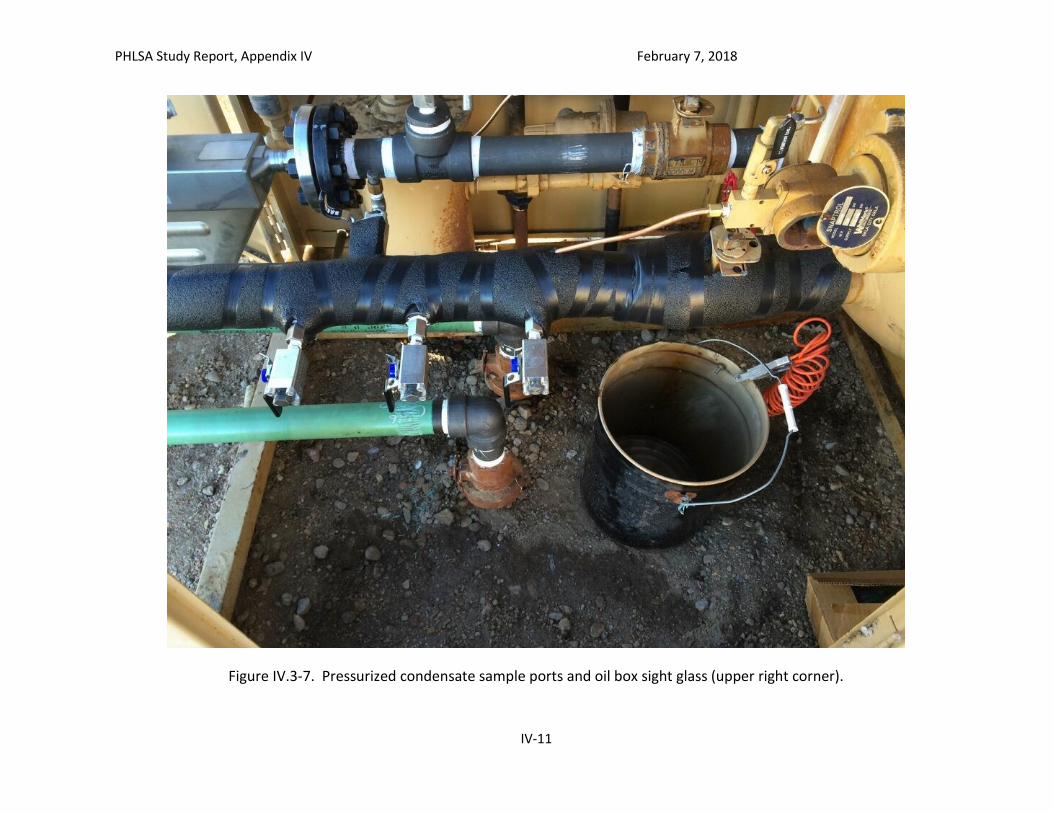
Figure IV.3-7. Pressurized condensate sample ports and oil box sight glass (upper right corner).
PHLSA Study Report, Appendix IV February 7, 2018
IV-12
Figure IV.3-8. VOC burners.
PHLSA Study Report, Appendix IV February 7, 2018
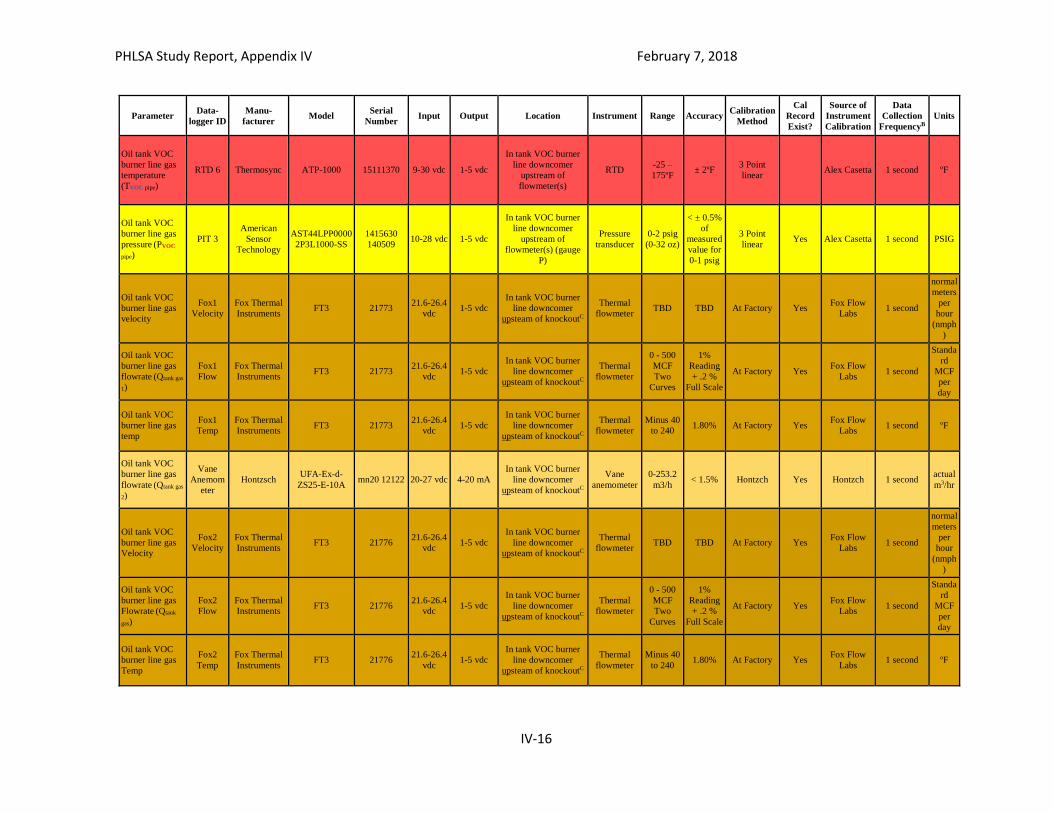
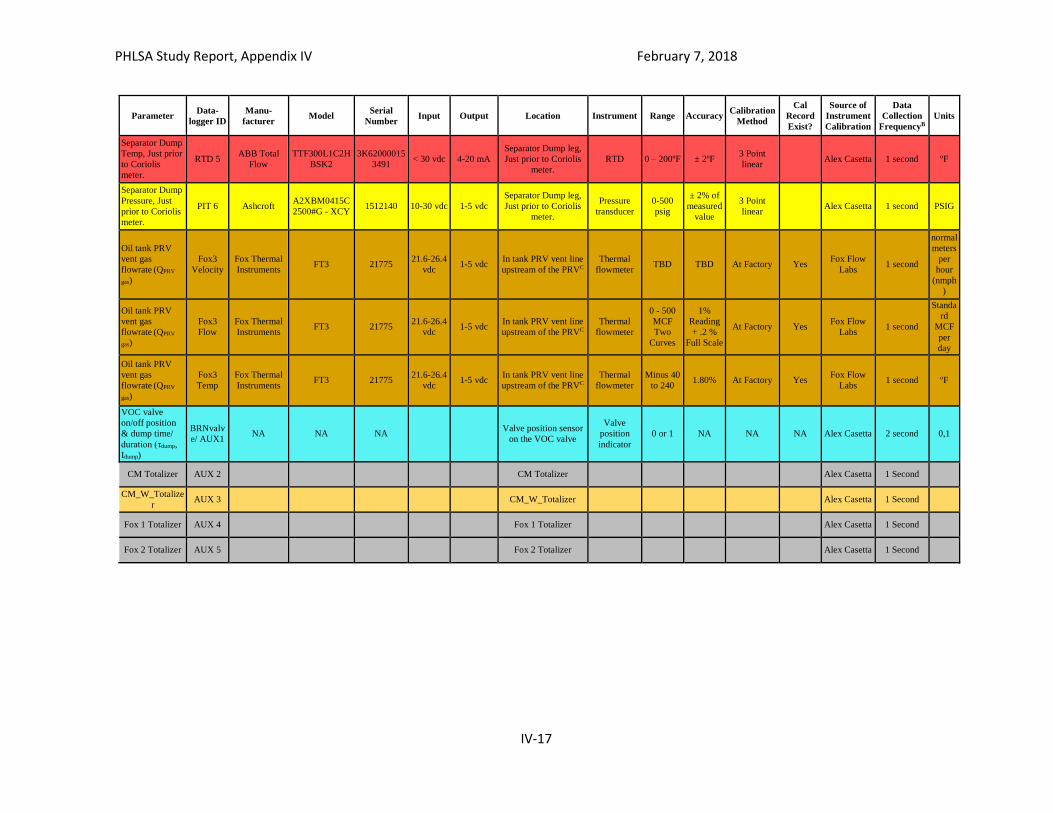
IV-13
Table IV3-2. Instrumentation for Process Measurements
Parameter Data-
logger ID
Manu-
facturer Model
Serial
Number Input Output Location Instrument Range Accuracy
Calibration
Method
Cal
Record
Exist?
Source of
Instrument
Calibration
Data
Collection
FrequencyB
Units
Ambient
pressure (Pamb) PIT 4
Dylix
Corporation
GXR2-PP010-
A03-B07-C01-
D07
140548697 8-38 vdc 1-5 vdc Automation Stand Pressure
transducer
0-1 psig
(0-16 oz)
± 2% of
measured
value
3 Point
linear Yes Alex Casetta 1 second PSIG
Ambient
temperature
(Tambient)
RTD 7 Thermocouple
Technology WA715612 4815 12 vdc 1-5 vdc
Vicinity of tank,
upwind RTD
-25 –
175ºF ± 2 ºF
3 Point
linear Alex Casetta 1 second ºF
Separator Oil
Temperature
(Tsep oil)
RTD 1 Thermocouple
Technology XDA 1300014631 12 vdc 1-5 vdc Separator oil layer RTD 0 – 250ºF ± 2 ºF
3 Point
linear Alex Casetta 1 second ºF
Separator Gas
Temperature
(Tsep gas)
RTD 2 Thermocouple
Technology XDA 1300012874 12 vdc 1-5 vdc
Separator gas
headspace RTD 0 – 250ºF ± 2 ºF
3 Point
linear Alex Casetta 1 second ºF
Separator
Pressure (Psep) PIT 1 Foxboro IGP10-V22E1F 12031714 9-30 vdc 1-5 vdc Separator headspace
Pressure
transducer 0-500 psi
± 2% of
measured
value
3 Point
linear Alex Casetta 1 second PSIG
Vane Meter
Velocity
Vane_Vel
ocity Hontzsch
UFA-Ex-d-
ZS25-E-10A mn20 12122 20-27 vdc 4-20 mA
In tank VOC burner
line downcomer
upsteam of knockoutC
Vane
anemometer
0.1 – 70
m/s < 1.5% Hontzch Yes Hontzch 1 second m/s
Separator
produced gas
flowrate (Qsales
gas)
ABB
Flow
ABB Total
Flow
XFC G4 -
Model X6413Y T121881581 < 15 vdc 1-5 vdc Separator gas leg
XFC G4
6413
0-250 DP
0-500 SP
0.05%
URL
3 Point
linear Yes
Certified
Crystal 1 second
Std
MCF
per
day
Separator-to-oil
tank pipe
gas/liquids
pressure Hi
(Pdump flow)
PIT 8 Barksdale 435H5-04-W72 12-28 vdc 4-20 mA
Where the sep-to-oil
tank pipeline comes to
the surface, base of
upcomer
Pressure
transmitter
0 – 100
psig
± 0.25%
of
measured
value (at
Full-
Scale at
75F)
3 Point
linear Alex Casetta 1 second PSIG
Separator oil
flowrate to tank
(Qoil)
CM Flow Emerson R100SB21NW
BAEZZZZ 14430099 17.3 vdc 1-5 vdc
Separator oil leg
upstream of dump
valve
Coriolis
meter
0-6576
bbl/d
± 0.5% of
rate At Factory Yes Emerson 1 second
Barrel
s Per
Day
Separator oil to
tank density
(ρoil)
CM
Density Emerson
R100SB21NW
BAEZZZZ 14430099 17.3 vdc 1-5 vdc
Separator oil leg
upstream of dump
valve
Coriolis
meter 0-3.0
± 0.01
g/cm³ At Factory Yes Emerson 1 second SGU
Separator oil to
tank temperature
(TCM oil)
CM RTD Emerson R100SB21NW
BAEZZZZ 14430099 17.3 vdc 1-5 vdc
Separator oil leg
upstream of dump
valve
Coriolis
meter
(-)40 –
140ºF
± 1 ºC ±
0.5% of
reading
At Factory Yes Emerson 1 second ºF
PHLSA Study Report, Appendix IV February 7, 2018
IV-14
Parameter Data-
logger ID
Manu-
facturer Model
Serial
Number Input Output Location Instrument Range Accuracy
Calibration
Method
Cal
Record
Exist?
Source of
Instrument
Calibration
Data
Collection
FrequencyB
Units
Coriolis meter
drive gain CM DG Emerson
R100SB21NW
BAEZZZZ 14430099 17.3 vdc 1-5 vdc
Separator oil leg
upstream of dump
valve
Coriolis
meter 0-100% N/A At Factory Yes Emerson 1 second
Percen
t
Solar Radiation
reading
Solar_Ra
d Hukseflux SR05-DA2 2059 12 vdc 4-20 mA
7 m south of storage
tanks
SR05
pyranometer 0-1600 N/A At Factory Yes Hukseflux 1 second W/m2
Separator-to-oil
tank pipe
gas/liquids
pressure Post
dump valve
PIT 7 Barksdale 435H5-04-W72 12-28 vdc 4-20 mA
Where the sep-to-oil
tank pipeline leaves
the dump valve
Pressure
transmitter
0 – 100
psig
± 0.25%
of
measured
value (at
Full-
Scale at
75F)
3 Point
linear Alex Casetta 1 second PSIG
Separator Dump
leg, Just after
dump valve
RTD 16 Thermocouple
Technology
1080AA
(ENCL) WA715611 12 vdc 1-5 vdc
Separator Dump leg,
Just after dump valve RTD
-25 –
175ºF ± 2ºF
3 Point
linear Alex Casetta 1 second ºF
Separator water
flowrate to tank
(Qwater)
CM W
Flow Emerson
F100SB21CQB
AEZZZZ 14267449 17.3 vdc 1-5 vdc
Separator water leg
upstream of dump
valve
Coriolis
meter
0-6576
bbl/d
± 0.28%
of rate At Factory Yes Emerson 1 second
Barrel
s Per
Day
Coriolis meter
Water drive gain CM DG Emerson
F100SB21CQB
AEZZZZ 14267449 17.3 vdc 1-5 vdc
Separator Water leg
upstream of dump
valve
Coriolis
meter 0-100% N/A At Factory Yes Emerson 1 second
Percen
t
Oil dump valve
on/off position
& dump time/
duration (τdump,
Idump)
O Dump
Po N/A N/A N/A Oil dump valve
Valve
position
indicator
0 or 1 NA N/A N/A N/A 1 second 0,1,2,3
Separator-to-oil
tank pipe
gas/liquids
temperature
(Tdump flow)
RTD 4 Thermocouple
Technology XDA 1-5 vdc
Separator-to-oil tank
pipe, just prior to
entering the tank on
the horizontal section
RTD 0 – 250ºF ± 2ºF 3 Point
linear Alex Casetta 1 second ºF
Separator-to-oil
tank pipe
gas/liquids
temperature
(Pdump flow)
PIT 5 Ashcroft A2XBM0415C
21.5#G 1512391 10-30 vdc 1-5 vdc
Where the sep-to-oil
tank pipeline comes to
the surface, base of
upcomer
Pressure
transducer
0-1.5 psig
(0-24 oz)
± 2% of
measured
value
3 Point
linear Yes Alex Casetta 1 second PSIG
Separator-to-oil
tank pipe
gas/liquids
pressure Lo
(Pdump flow)
PIT 9 10-30 vdc 1-5 vdc
Separator-to-oil tank
pipe, just prior to
entering the tank on
the horizontal section
Pressure
transducer
0-1.5 psig
(0-24 oz)
± 2% of
measured
value
3 Point
linear Alex Casetta 1 second PSIG
PHLSA Study Report, Appendix IV February 7, 2018
IV-15
Parameter Data-
logger ID
Manu-
facturer Model
Serial
Number Input Output Location Instrument Range Accuracy
Calibration
Method
Cal
Record
Exist?
Source of
Instrument
Calibration
Data
Collection
FrequencyB
Units
Oil tank
headspace gas
temperature
(Ttank gas)
RTD 3 Thermocouple
Technology XDA 1300014737 12 vdc 1-5 vdc
In tank, at top of tank,
centerline RTD
-25 –
175ºF ± 2ºF
3 Point
linear Alex Casetta 1 second ºF
Oil tank
gas/liquids
temperature
(Ttank 1)
RTD 15 Electrolab DLS 2100 16LS111530
483
5.6-12.9
vdc 1-5 vdc
In tank,
cernterline,152” above
tank bottom
RTD (-)40 –
185ºF ± 1.5ºF At Factory
Offest = -
0.4oF Electrolab 1 second ⁰F
Oil tank
gas/liquids
temperature
(Ttank 2)
RTD 14 Electrolab DLS 2100 16LS111530
483
5.6-12.9
vdc 1-5 vdc
In tank, centerline,
135” above tank
bottom
RTD (-)40 –
185ºF ± 1.5ºF At Factory
Offest =
1.5oF Electrolab 1 second ⁰F
Oil tank
gas/liquids
temperature
(Ttank 3)
RTD 13 Electrolab DLS 2100 16LS111530
483
5.6-12.9
vdc 1-5 vdc
In tank, centerline,
112” above tank
bottom
RTD (-)40 –
185ºF ± 1.5ºF At Factory
Offest =
2oF Electrolab 1 second ⁰F
Oil tank gas/
liquids
temperature
(Ttank 4)
RTD 12 Electrolab DLS 2100 16LS111530
483
5.6-12.9
vdc 1-5 vdc
In tank, centerline, 92”
above tank bottom RTD
(-)40 –
185ºF ± 1.5ºF At Factory
Offest =
0.5oF Electrolab 1 second ⁰F
Oil tank
gas/liquids
temperature
(Ttank 5)
RTD 11 Electrolab DLS 2100 16LS111530
483
5.6-12.9
vdc 1-5 vdc
In tank, centerline, 72”
above tank bottom RTD
(-)40 –
185ºF ± 1.5ºF At Factory
Offest =
1.5oF Electrolab 1 second ⁰F
Oil tank
gas/liquid
temperature
(Ttank 6)
RTD 10 Electrolab DLS 2100 16LS111530
483
5.6-12.9
vdc 1-5 vdc
In tank, centerline, 52”
above tank bottom RTD
(-)40 –
185ºF ± 1.5ºF At Factory
Offest =
0.5oF Electrolab 1 second ⁰F
Oil tank
gas/liquids
temperature
(Ttank 7)
RTD 9 Electrolab DLS 2100 16LS111530
483
5.6-12.9
vdc 1-5 vdc
In tank, centerline, 32”
above tank bottom RTD
(-)40 –
185ºF ± 1.5ºF At Factory
Offest =
0.5oF Electrolab 1 second ⁰F
Oil tank
gas/liquids
temperature
(Ttank 8)
RTD 8 Electrolab DLS 2100 16LS111530
483
5.6-12.9
vdc 1-5 vdc
In tank, centerline, 14”
above tank bottomA RTD
(-)40 –
185ºF ± 1.5ºF At Factory
Offest =
0oF Electrolab 1 second ⁰F
Oil tank liquid
level (Htank liquids) LL1 Electrolab DLS 2100
16LS111530
483
5.6-12.9
vdc 1-5 vdc Oil tank liquid surface
Tank level
sensor
0 – 180 0.125
inch
Closed
Contact
Single Offset
Yes Alex Casetta 1 second Inches
Inches
Oil tank
headspace gas
pressure (Ptank
gas)
PIT 2 Ashcroft A2XBM0415C
21.5#G 1512394 10-30 vdc 1-5 vdc
Bulk tank headspace
pressure (gauge
pressure)
Pressure
transducer
0-1.5 psig
(0-24 oz)
± 2% of
measured
value
3 Point
linear Yes Alex Casetta 1 second PSIG
PHLSA Study Report, Appendix IV February 7, 2018
IV-16
Parameter Data-
logger ID
Manu-
facturer Model
Serial
Number Input Output Location Instrument Range Accuracy
Calibration
Method
Cal
Record
Exist?
Source of
Instrument
Calibration
Data
Collection
FrequencyB
Units
Oil tank VOC
burner line gas
temperature
(TVOC pipe)
RTD 6 Thermosync ATP-1000 15111370 9-30 vdc 1-5 vdc
In tank VOC burner
line downcomer
upstream of
flowmeter(s)
RTD -25 –
175ºF ± 2ºF
3 Point
linear Alex Casetta 1 second ºF
Oil tank VOC
burner line gas
pressure (PVOC
pipe)
PIT 3
American
Sensor
Technology
AST44LPP0000
2P3L1000-SS
1415630
140509 10-28 vdc 1-5 vdc
In tank VOC burner
line downcomer
upstream of
flowmeter(s) (gauge
P)
Pressure
transducer
0-2 psig
(0-32 oz)
< ± 0.5%
of
measured
value for
0-1 psig
3 Point
linear Yes Alex Casetta 1 second PSIG
Oil tank VOC
burner line gas
velocity
Fox1
Velocity
Fox Thermal
Instruments FT3 21773
21.6-26.4
vdc 1-5 vdc
In tank VOC burner
line downcomer
upsteam of knockoutC
Thermal
flowmeter TBD TBD At Factory Yes
Fox Flow
Labs 1 second
normal
meters
per
hour
(nmph
)
Oil tank VOC
burner line gas
flowrate (Qtank gas
1)
Fox1
Flow
Fox Thermal
Instruments FT3 21773
21.6-26.4
vdc 1-5 vdc
In tank VOC burner
line downcomer
upsteam of knockoutC
Thermal
flowmeter
0 - 500
MCF
Two
Curves
1%
Reading
+ .2 %
Full Scale
At Factory Yes Fox Flow
Labs 1 second
Standa
rd
MCF
per
day
Oil tank VOC
burner line gas
temp
Fox1
Temp
Fox Thermal
Instruments FT3 21773
21.6-26.4
vdc 1-5 vdc
In tank VOC burner
line downcomer
upsteam of knockoutC
Thermal
flowmeter
Minus 40
to 240 1.80% At Factory Yes
Fox Flow
Labs 1 second ºF
Oil tank VOC
burner line gas
flowrate (Qtank gas
2)
Vane
Anemom
eter
Hontzsch UFA-Ex-d-
ZS25-E-10A mn20 12122 20-27 vdc 4-20 mA
In tank VOC burner
line downcomer
upsteam of knockoutC
Vane
anemometer
0-253.2
m3/h < 1.5% Hontzch Yes Hontzch 1 second
actual
m3/hr
Oil tank VOC
burner line gas
Velocity
Fox2
Velocity
Fox Thermal
Instruments FT3 21776
21.6-26.4
vdc 1-5 vdc
In tank VOC burner
line downcomer
upsteam of knockoutC
Thermal
flowmeter TBD TBD At Factory Yes
Fox Flow
Labs 1 second
normal
meters
per
hour
(nmph
)
Oil tank VOC
burner line gas
Flowrate (Qtank
gas)
Fox2
Flow
Fox Thermal
Instruments FT3 21776
21.6-26.4
vdc 1-5 vdc
In tank VOC burner
line downcomer
upsteam of knockoutC
Thermal
flowmeter
0 - 500
MCF
Two
Curves
1%
Reading
+ .2 %
Full Scale
At Factory Yes Fox Flow
Labs 1 second
Standa
rd
MCF
per
day
Oil tank VOC
burner line gas
Temp
Fox2
Temp
Fox Thermal
Instruments FT3 21776
21.6-26.4
vdc 1-5 vdc
In tank VOC burner
line downcomer
upsteam of knockoutC
Thermal
flowmeter
Minus 40
to 240 1.80% At Factory Yes
Fox Flow
Labs 1 second ºF
PHLSA Study Report, Appendix IV February 7, 2018
IV-17
Parameter Data-
logger ID
Manu-
facturer Model
Serial
Number Input Output Location Instrument Range Accuracy
Calibration
Method
Cal
Record
Exist?
Source of
Instrument
Calibration
Data
Collection
FrequencyB
Units
Separator Dump
Temp, Just prior
to Coriolis
meter.
RTD 5 ABB Total
Flow
TTF300L1C2H
BSK2
3K62000015
3491 < 30 vdc 4-20 mA
Separator Dump leg,
Just prior to Coriolis
meter.
RTD 0 – 200ºF ± 2ºF 3 Point
linear Alex Casetta 1 second ºF
Separator Dump
Pressure, Just
prior to Coriolis
meter.
PIT 6 Ashcroft A2XBM0415C
2500#G - XCY 1512140 10-30 vdc 1-5 vdc
Separator Dump leg,
Just prior to Coriolis
meter.
Pressure
transducer
0-500
psig
± 2% of
measured
value
3 Point
linear Alex Casetta 1 second PSIG
Oil tank PRV
vent gas
flowrate (QPRV
gas)
Fox3
Velocity
Fox Thermal
Instruments FT3 21775
21.6-26.4
vdc 1-5 vdc
In tank PRV vent line
upstream of the PRVC
Thermal
flowmeter TBD TBD At Factory Yes
Fox Flow
Labs 1 second
normal
meters
per
hour
(nmph
)
Oil tank PRV
vent gas
flowrate (QPRV
gas)
Fox3
Flow
Fox Thermal
Instruments FT3 21775
21.6-26.4
vdc 1-5 vdc
In tank PRV vent line
upstream of the PRVC
Thermal
flowmeter
0 - 500
MCF
Two
Curves
1%
Reading
+ .2 %
Full Scale
At Factory Yes Fox Flow
Labs 1 second
Standa
rd
MCF
per
day
Oil tank PRV
vent gas
flowrate (QPRV
gas)
Fox3
Temp
Fox Thermal
Instruments FT3 21775
21.6-26.4
vdc 1-5 vdc
In tank PRV vent line
upstream of the PRVC
Thermal
flowmeter
Minus 40
to 240 1.80% At Factory Yes
Fox Flow
Labs 1 second ºF
VOC valve
on/off position
& dump time/
duration (τdump,
Idump)
BRNvalv
e/ AUX1 NA NA NA
Valve position sensor
on the VOC valve
Valve
position
indicator
0 or 1 NA NA NA Alex Casetta 2 second 0,1
CM Totalizer AUX 2 CM Totalizer Alex Casetta 1 Second
CM_W_Totalize
r AUX 3 CM_W_Totalizer Alex Casetta 1 Second
Fox 1 Totalizer AUX 4 Fox 1 Totalizer Alex Casetta 1 Second
Fox 2 Totalizer AUX 5 Fox 2 Totalizer Alex Casetta 1 Second
PHLSA Study Report, Appendix IV February 7, 2018
IV-18
IV.3.1 Storage Tank-to-Burner Pipeline Gas Flow Rate Measurement
The storage tank-to-burner pipeline gas flow rate rapidly changes at the start of each separator
liquids dump (and flash gas release) and after the end of the dump, and such rapidly changing
flow rates are difficult to measure. The gas flow measurement was further complicated
because the gas composition and temperature (which impact instrument response and
accuracy) differed for each well cycle, and differed from the calibration gas composition and
temperature. Two thermal mass gas flow meters (Fox Flow 1 and Fox Flow 2 in Figures IV3-1,
IV3-2, and IV3-1) were installed in series in the tank-to-burner pipeline. A third flow meter, a
vane anemometer (also shown in the figures), which has a different measurement principle,
was installed for the summer testing as discussed below.
Thermal mass flowmeters measure gas mass flow using a heated element that losses heat to
flowing gas, and the gas mass flowrate is correlated to the electrical power required to
maintain a constant heated element temperature. The response of these instruments is
impacted by the pipeline gas composition and associated heat transfer properties (e.g., density,
viscosity, thermal conductivity). When the process gas composition deviates from the
calibration gas composition, the measurement accuracy is reduced. Vane anemometers
measure volumetric flow rate and are less impacted by gas composition. Corrections were
needed to account for differences from calibration conditions. Discussion in Section IV.6 and
spreadsheets listed in Table IV-6.3 present the methodologies used to adjust the measured
flowrates for all three flowmeters based on process conditions versus calibration conditions.
Three flow meters were employed with the idea that agreement or differences between the
redundant meters would provide insight into the accuracy of these measurements.
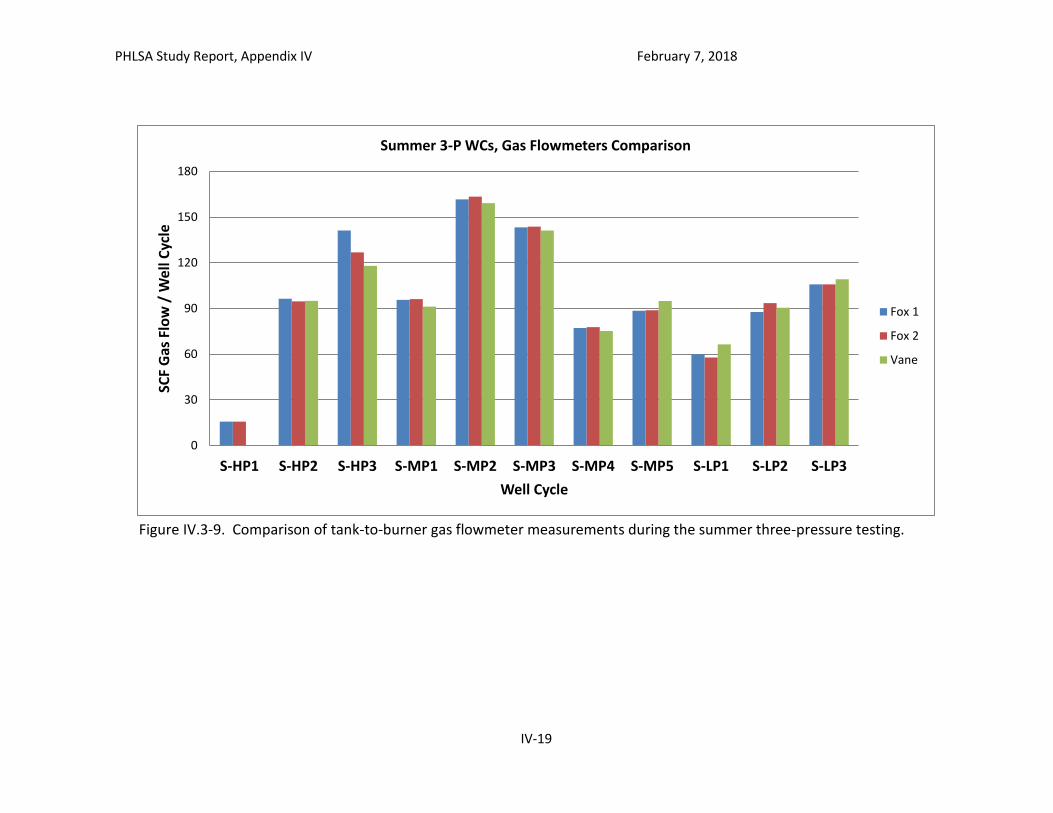
Figure IV.3-9 provides a comparison of the tank-to-burner gas flowmeters measurement during
the summer three-pressure testing. These data include composition adjusted flows for the two
Fox thermal mass meters and the vane anemometer, and the good agreement between the
three measurements for most of the well cycles (e.g., all three measurements within 4% of the
average for 8 of the 10 well cycles) provides some confidence in the measurements.
PHLSA Study Report, Appendix IV February 7, 2018
IV-19
Figure IV.3-9. Comparison of tank-to-burner gas flowmeter measurements during the summer three-pressure testing.
0
30
60
90
120
150
180
S-HP1 S-HP2 S-HP3 S-MP1 S-MP2 S-MP3 S-MP4 S-MP5 S-LP1 S-LP2 S-LP3
SCF
Gas
Flo
w /
Wel
l Cyc
le
Well Cycle
Summer 3-P WCs, Gas Flowmeters Comparison
Fox 1
Fox 2
Vane
PHLSA Study Report, Appendix IV February 7, 2018
IV-20
IV.4 FGOR and Storage Tank Mass Balance Calculations Approach
IV.4-1 FGOR Calculations
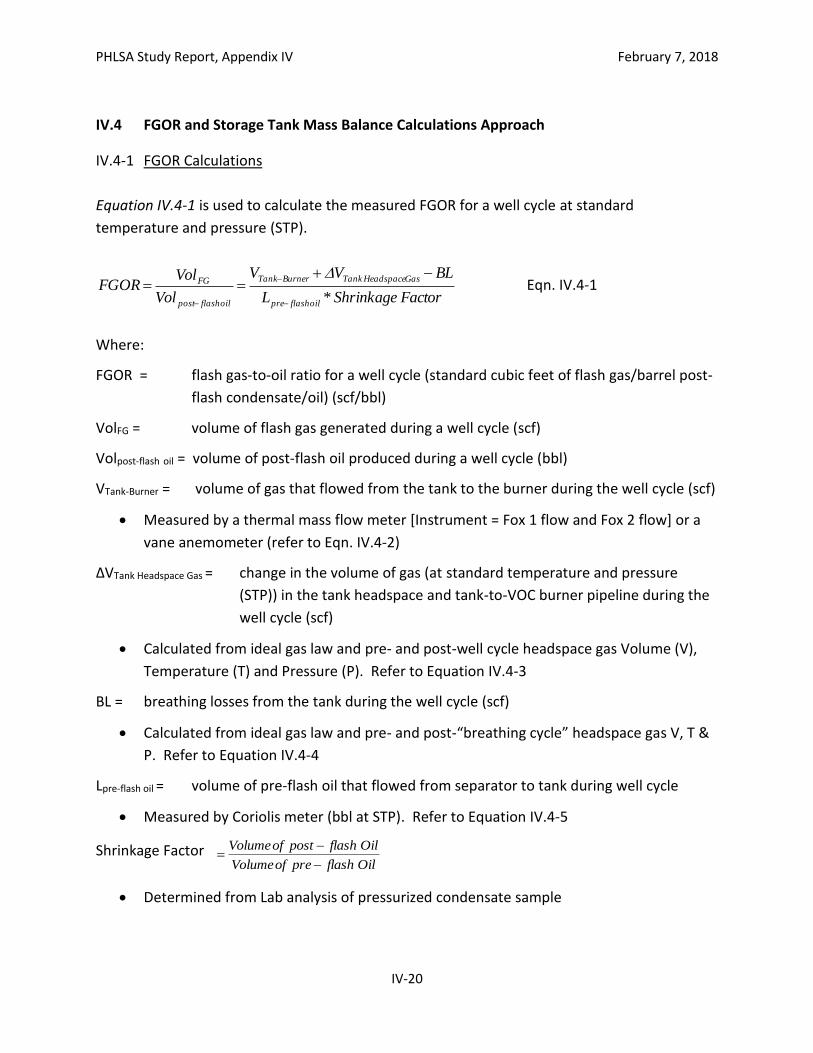
Equation IV.4-1 is used to calculate the measured FGOR for a well cycle at standard
temperature and pressure (STP).
FactorShrinkage*L
BLVV
Vol
VolFGOR
oilflashpre
GasHeadspaceTankBurnerTank
oilflashpost
FG
Eqn. IV.4-1
Where:
FGOR = flash gas-to-oil ratio for a well cycle (standard cubic feet of flash gas/barrel post-
flash condensate/oil) (scf/bbl)
VolFG = volume of flash gas generated during a well cycle (scf)
Volpost-flash oil = volume of post-flash oil produced during a well cycle (bbl)
VTank-Burner = volume of gas that flowed from the tank to the burner during the well cycle (scf)
Measured by a thermal mass flow meter [Instrument = Fox 1 flow and Fox 2 flow] or a
vane anemometer (refer to Eqn. IV.4-2)
ΔVTank Headspace Gas = change in the volume of gas (at standard temperature and pressure
(STP)) in the tank headspace and tank-to-VOC burner pipeline during the
well cycle (scf)
Calculated from ideal gas law and pre- and post-well cycle headspace gas Volume (V),
Temperature (T) and Pressure (P). Refer to Equation IV.4-3
BL = breathing losses from the tank during the well cycle (scf)
Calculated from ideal gas law and pre- and post-“breathing cycle” headspace gas V, T &
P. Refer to Equation IV.4-4
Lpre-flash oil = volume of pre-flash oil that flowed from separator to tank during well cycle
Measured by Coriolis meter (bbl at STP). Refer to Equation IV.4-5
Shrinkage Factor OilflashpreofVolume
OilflashpostofVolume
Determined from Lab analysis of pressurized condensate sample
PHLSA Study Report, Appendix IV February 7, 2018
IV-21
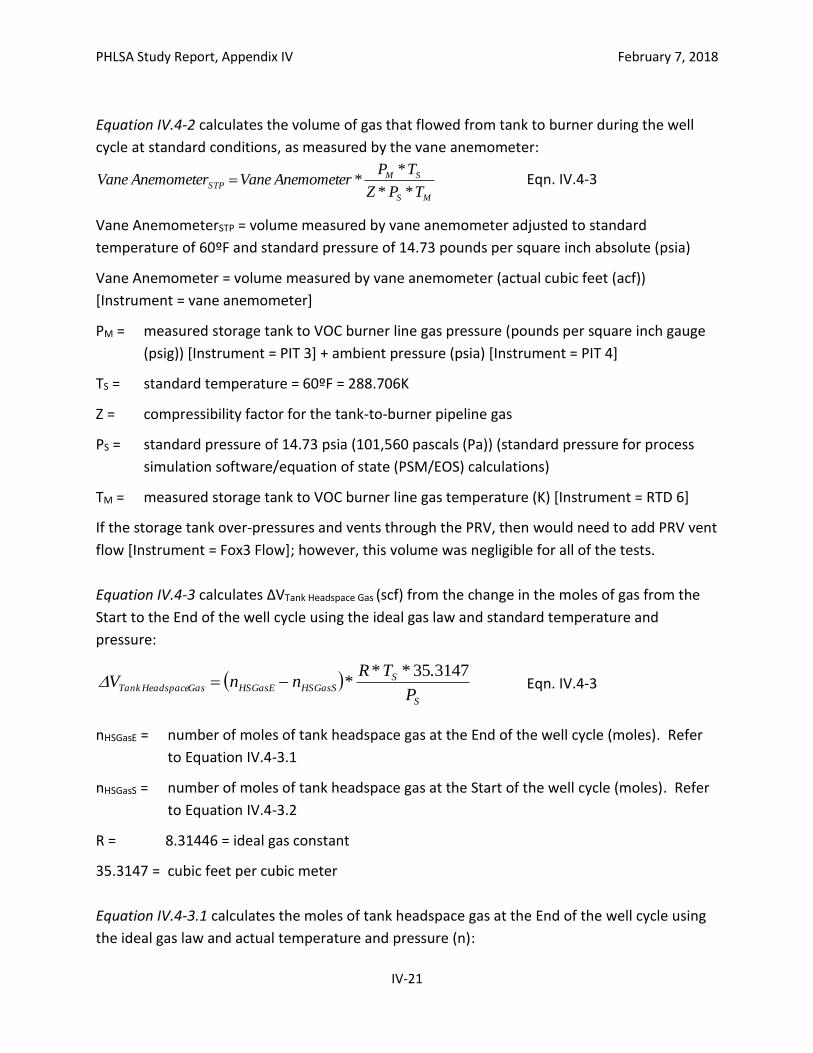
Equation IV.4-2 calculates the volume of gas that flowed from tank to burner during the well
cycle at standard conditions, as measured by the vane anemometer:
MS
SMSTP
T*P*Z
T*P*AnemometerVaneAnemometerVane Eqn. IV.4-3
Vane AnemometerSTP = volume measured by vane anemometer adjusted to standard
temperature of 60ºF and standard pressure of 14.73 pounds per square inch absolute (psia)
Vane Anemometer = volume measured by vane anemometer (actual cubic feet (acf))
[Instrument = vane anemometer]
PM = measured storage tank to VOC burner line gas pressure (pounds per square inch gauge
(psig)) [Instrument = PIT 3] + ambient pressure (psia) [Instrument = PIT 4]
TS = standard temperature = 60ºF = 288.706K
Z = compressibility factor for the tank-to-burner pipeline gas
PS = standard pressure of 14.73 psia (101,560 pascals (Pa)) (standard pressure for process
simulation software/equation of state (PSM/EOS) calculations)
TM = measured storage tank to VOC burner line gas temperature (K) [Instrument = RTD 6]
If the storage tank over-pressures and vents through the PRV, then would need to add PRV vent
flow [Instrument = Fox3 Flow]; however, this volume was negligible for all of the tests.
Equation IV.4-3 calculates ΔVTank Headspace Gas (scf) from the change in the moles of gas from the
Start to the End of the well cycle using the ideal gas law and standard temperature and
pressure:
S
SHSGasSHSGasEGasHeadspaceTank
P
.*T*R*nnV
314735 Eqn. IV.4-3
nHSGasE = number of moles of tank headspace gas at the End of the well cycle (moles). Refer
to Equation IV.4-3.1
nHSGasS = number of moles of tank headspace gas at the Start of the well cycle (moles). Refer
to Equation IV.4-3.2
R = 8.31446 = ideal gas constant
35.3147 = cubic feet per cubic meter
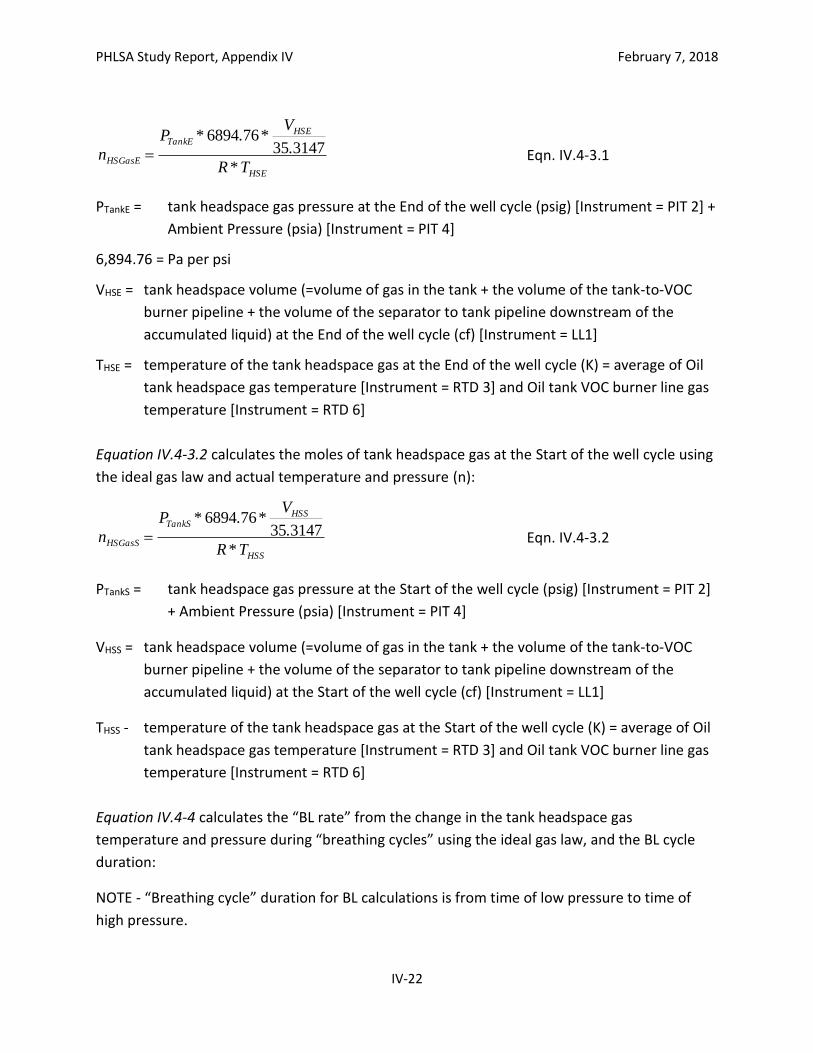
Equation IV.4-3.1 calculates the moles of tank headspace gas at the End of the well cycle using
the ideal gas law and actual temperature and pressure (n):
PHLSA Study Report, Appendix IV February 7, 2018
IV-22
HSE
HSETankE
HSGasET*R
.
V*.*P
n 314735766894
Eqn. IV.4-3.1
PTankE = tank headspace gas pressure at the End of the well cycle (psig) [Instrument = PIT 2] +
Ambient Pressure (psia) [Instrument = PIT 4]
6,894.76 = Pa per psi
VHSE = tank headspace volume (=volume of gas in the tank + the volume of the tank-to-VOC
burner pipeline + the volume of the separator to tank pipeline downstream of the
accumulated liquid) at the End of the well cycle (cf) [Instrument = LL1]
THSE = temperature of the tank headspace gas at the End of the well cycle (K) = average of Oil
tank headspace gas temperature [Instrument = RTD 3] and Oil tank VOC burner line gas
temperature [Instrument = RTD 6]
Equation IV.4-3.2 calculates the moles of tank headspace gas at the Start of the well cycle using
the ideal gas law and actual temperature and pressure (n):
HSS
HSSTankS
HSGasST*R
.
V*.*P
n 314735766894
Eqn. IV.4-3.2
PTankS = tank headspace gas pressure at the Start of the well cycle (psig) [Instrument = PIT 2]
+ Ambient Pressure (psia) [Instrument = PIT 4]
VHSS = tank headspace volume (=volume of gas in the tank + the volume of the tank-to-VOC
burner pipeline + the volume of the separator to tank pipeline downstream of the
accumulated liquid) at the Start of the well cycle (cf) [Instrument = LL1]
THSS - temperature of the tank headspace gas at the Start of the well cycle (K) = average of Oil
tank headspace gas temperature [Instrument = RTD 3] and Oil tank VOC burner line gas
temperature [Instrument = RTD 6]
Equation IV.4-4 calculates the “BL rate” from the change in the tank headspace gas
temperature and pressure during “breathing cycles” using the ideal gas law, and the BL cycle
duration:
NOTE - “Breathing cycle” duration for BL calculations is from time of low pressure to time of
high pressure.
PHLSA Study Report, Appendix IV February 7, 2018
IV-23
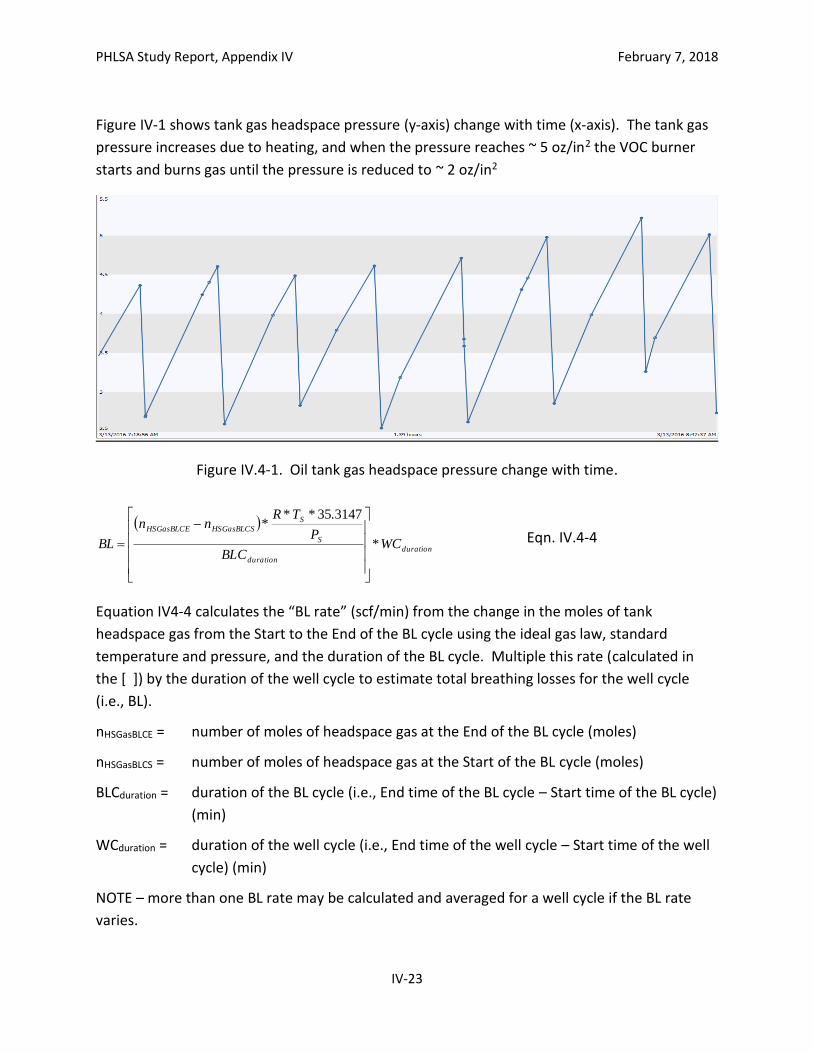
Figure IV-1 shows tank gas headspace pressure (y-axis) change with time (x-axis). The tank gas
pressure increases due to heating, and when the pressure reaches ~ 5 oz/in2 the VOC burner
starts and burns gas until the pressure is reduced to ~ 2 oz/in2
Figure IV.4-1. Oil tank gas headspace pressure change with time.
duration
duration
S
S
HSGasBLCSHSGasBLCE
WC*BLC
P
.*T*R*nn
BL
314735
Eqn. IV.4-4
Equation IV4-4 calculates the “BL rate” (scf/min) from the change in the moles of tank
headspace gas from the Start to the End of the BL cycle using the ideal gas law, standard
temperature and pressure, and the duration of the BL cycle. Multiple this rate (calculated in
the [ ]) by the duration of the well cycle to estimate total breathing losses for the well cycle
(i.e., BL).
nHSGasBLCE = number of moles of headspace gas at the End of the BL cycle (moles)
nHSGasBLCS = number of moles of headspace gas at the Start of the BL cycle (moles)
BLCduration = duration of the BL cycle (i.e., End time of the BL cycle – Start time of the BL cycle)
(min)
WCduration = duration of the well cycle (i.e., End time of the well cycle – Start time of the well
cycle) (min)
NOTE – more than one BL rate may be calculated and averaged for a well cycle if the BL rate
varies.
PHLSA Study Report, Appendix IV February 7, 2018
IV-24
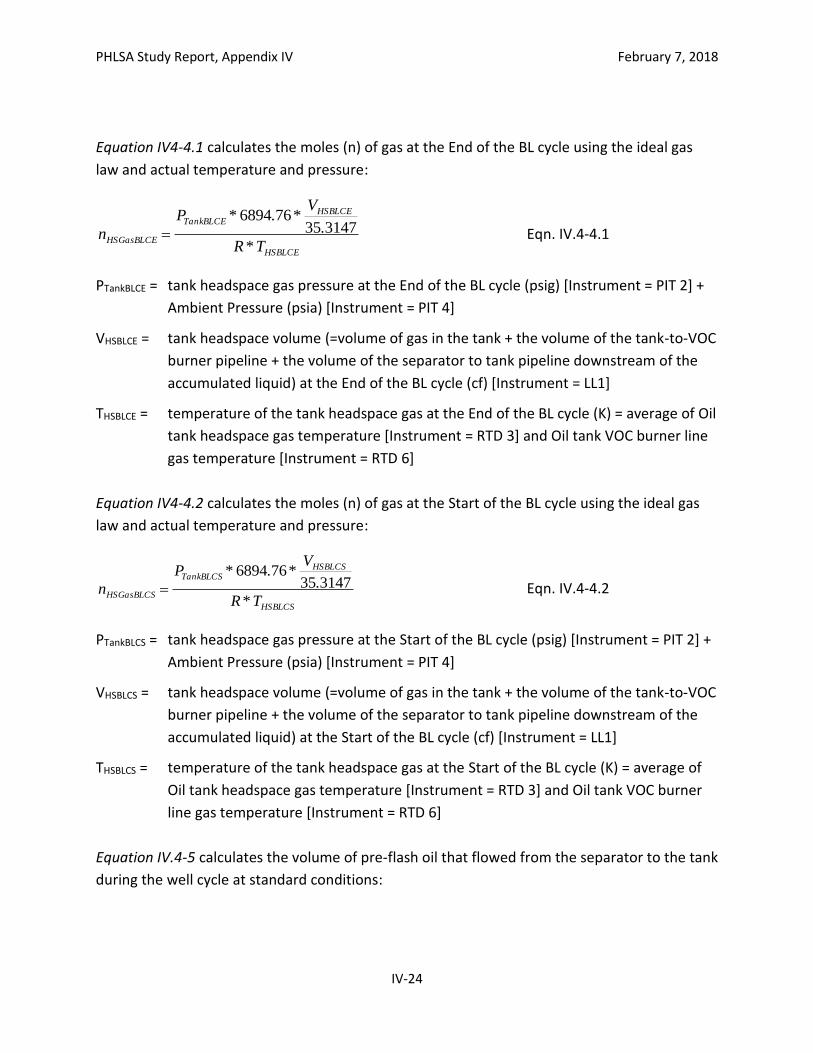
Equation IV4-4.1 calculates the moles (n) of gas at the End of the BL cycle using the ideal gas
law and actual temperature and pressure:
HSBLCE
HSBLCETankBLCE
HSGasBLCET*R
.
V*.*P
n 314735766894
Eqn. IV.4-4.1
PTankBLCE = tank headspace gas pressure at the End of the BL cycle (psig) [Instrument = PIT 2] +
Ambient Pressure (psia) [Instrument = PIT 4]
VHSBLCE = tank headspace volume (=volume of gas in the tank + the volume of the tank-to-VOC
burner pipeline + the volume of the separator to tank pipeline downstream of the
accumulated liquid) at the End of the BL cycle (cf) [Instrument = LL1]
THSBLCE = temperature of the tank headspace gas at the End of the BL cycle (K) = average of Oil
tank headspace gas temperature [Instrument = RTD 3] and Oil tank VOC burner line
gas temperature [Instrument = RTD 6]
Equation IV4-4.2 calculates the moles (n) of gas at the Start of the BL cycle using the ideal gas
law and actual temperature and pressure:
HSBLCS
HSBLCSTankBLCS
HSGasBLCST*R
.
V*.*P
n 314735766894
Eqn. IV.4-4.2
PTankBLCS = tank headspace gas pressure at the Start of the BL cycle (psig) [Instrument = PIT 2] +
Ambient Pressure (psia) [Instrument = PIT 4]
VHSBLCS = tank headspace volume (=volume of gas in the tank + the volume of the tank-to-VOC
burner pipeline + the volume of the separator to tank pipeline downstream of the
accumulated liquid) at the Start of the BL cycle (cf) [Instrument = LL1]
THSBLCS = temperature of the tank headspace gas at the Start of the BL cycle (K) = average of
Oil tank headspace gas temperature [Instrument = RTD 3] and Oil tank VOC burner
line gas temperature [Instrument = RTD 6]
Equation IV.4-5 calculates the volume of pre-flash oil that flowed from the separator to the tank
during the well cycle at standard conditions:

PHLSA Study Report, Appendix IV February 7, 2018
IV-25
STP
M
Moilflashpreoilflashpre *LL
Eqn. IV.4-5
Lpre-flash oil = volume of pre-flash oil that flowed from the separator to the tank during the
well cycle at standard temperature and pressure (bbl)
Lpre-flash oilM = measured volume of pre-flash oil that flowed from the separator to the tank
during the well cycle (bbl) [Instrument = CM Totalizer]
ρM = measured density of pre-flash oil (kg/m3) [Instrument = CM Density]
ρSTP = density of pre-flash oil at 14.73 psi and 60ºF (kg/m3)
Equation IV.4-6 calculates measured FGOR for individual FG hydrocarbons (FGORi) from the
FGOR and the FG composition determined by the on-site GC:
ii FG*FGORFGOR Eqn. IV.4-6
FGORi = FGOR for hydrocarbon “i“ for the well cycle (scf HCi/bbl)
FGOR = FGOR for the well cycle (scf FG/bbl)
FGi = mole fraction of hydrocarbon “i“ in the flash gas for the well cycle (mole i/mole FG)
[Instrument = on-site GC + tedlar bag sample and analysis for C6+ HC species]
IV.4-2 Storage Tank Mass Balance Calculations
Equation IV.4-7 is used to calculate the storage tank hydrocarbon mass balance for a well cycle:
oil flash-postoil flash-pre
FGFG
Mass- Mass
MassMassS
oil
MBMass
T Eqn. IV.4-7
Where:
STMB = storage tank HC mass balance for a well cycle
MassFG = measured mass of flash gas generated during a well cycle (kg)
Refer to Equation IV.4-8
Masspost-flash oil = measured mass of post-flash HC liquid produced during a well cycle (kg)
Refer to Equation IV.4-9
Masspre-flash oil = measured mass of pre-flash HC liquid produced during a well cycle (kg)
Refer to Equation IV.4-10

PHLSA Study Report, Appendix IV February 7, 2018
IV-26
ΔMassoil = Masspre-flash oil - Masspost-flash oil
Equation IV.4-8 is used to calculate the mass of flash as generated during a well cycle:
FG
s
soilflashpreFG MW*
T*R
P*
.*FactorShrinkage*L*FGORMass
314735
1 Eqn. IV.4-8
MWFG = molecular weight of the flash gas (g/gmole)
Refer to SPL lab report (Appendix III)
Equation IV.4-9 is used to calculate the volume of pre-flash oil that flowed from the separator
to the tank during the well cycle:
oilflashpreoilflashpreoilflashpre *.*LMass 1590 Eqn. IV.4-9
0.159 = m3 per bbl
ρpre-flash oil = density of pre-flash oil that flowed from the separator to the tank during the well
cycle (kg/m3) [Analysis = pressurized condensate sample]
Equation IV.4-10 is used to calculate the volume of post-flash oil that flowed from the separator
to the tank during the well cycle:
oilflashpostoilflashpreoilflashpostoilflashpre *.*FactorShrinkage*LLMass 1590 Eqn. IV.4-10
Lpost-flash oil = volume of post-flash oil that flowed from the separator to the tank during the
well cycle (bbl) [Analysis = lab weathered, at flash temperature, pressurized
condensate sample]
ρpost-flash oil = density at flash temperature of post-flash oil that flowed from the separator to
the tank during the well cycle (kg/m3) [Analysis = lab weathered pressurized
condensate sample]
Equation IV.4-11 calculates the storage tank mass balance for individual HCs expressed as the
ratio of the mass of HCi in the flash gas generated and the change in the mass of HCi in the HC
liquid (optimal for mass balance is 1.0):
HCiflashoilpostHCiflashoilpre
iHCFG
MBCHiMFOilFlashPost*MassMFOilFlashePr*Mass
FGMF*MassST
STMBHCi = storage tank mass balance for hydrocarbon “i“ (%)
MassFG = mass of flash gas generated during a well cycle (kg)
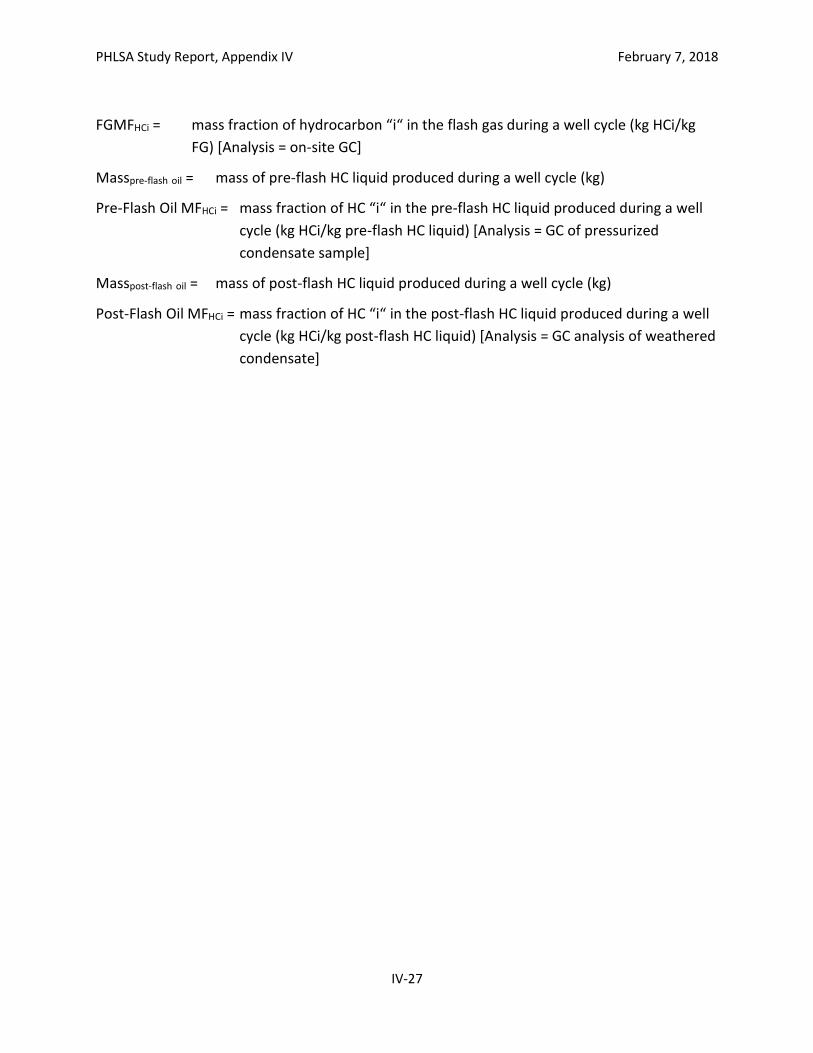
PHLSA Study Report, Appendix IV February 7, 2018
IV-27
FGMFHCi = mass fraction of hydrocarbon “i“ in the flash gas during a well cycle (kg HCi/kg
FG) [Analysis = on-site GC]
Masspre-flash oil = mass of pre-flash HC liquid produced during a well cycle (kg)
Pre-Flash Oil MFHCi = mass fraction of HC “i“ in the pre-flash HC liquid produced during a well
cycle (kg HCi/kg pre-flash HC liquid) [Analysis = GC of pressurized
condensate sample]
Masspost-flash oil = mass of post-flash HC liquid produced during a well cycle (kg)
Post-Flash Oil MFHCi = mass fraction of HC “i“ in the post-flash HC liquid produced during a well
cycle (kg HCi/kg post-flash HC liquid) [Analysis = GC analysis of weathered
condensate]

PHLSA Study Report, Appendix IV February 7, 2018
IV-28
IV.5 Summary of FGOR and Storage Tank Mass Balance Measurements
The following tables summarize the results of the measured storage tank mass balances and
FGORs:
Table IV-1. Summer Testing Process Data, FGOR, and Mass Balance (MB) Results by Well
Cycle: CP Cylinder Sample Collection and GPA 2103M Analysis
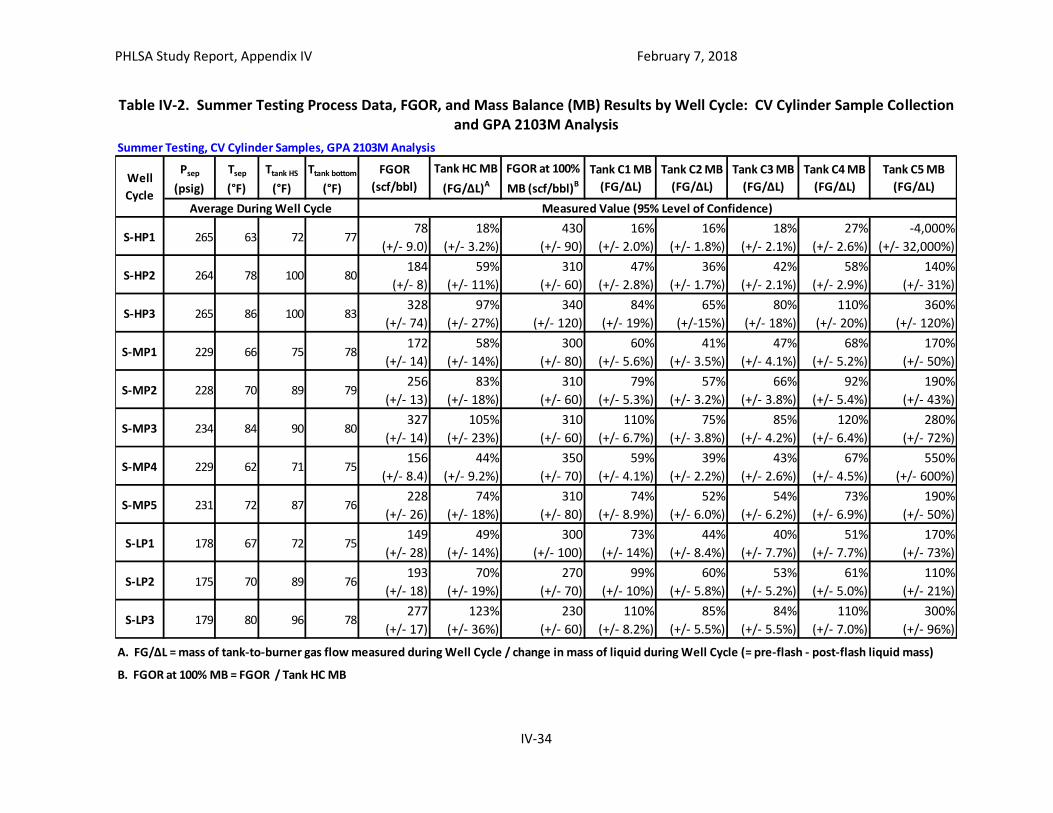
Table IV-2. Summer Testing Process Data, FGOR, and Mass Balance (MB) Results by Well
Cycle: CV Cylinder Sample Collection and GPA 2103M Analysis
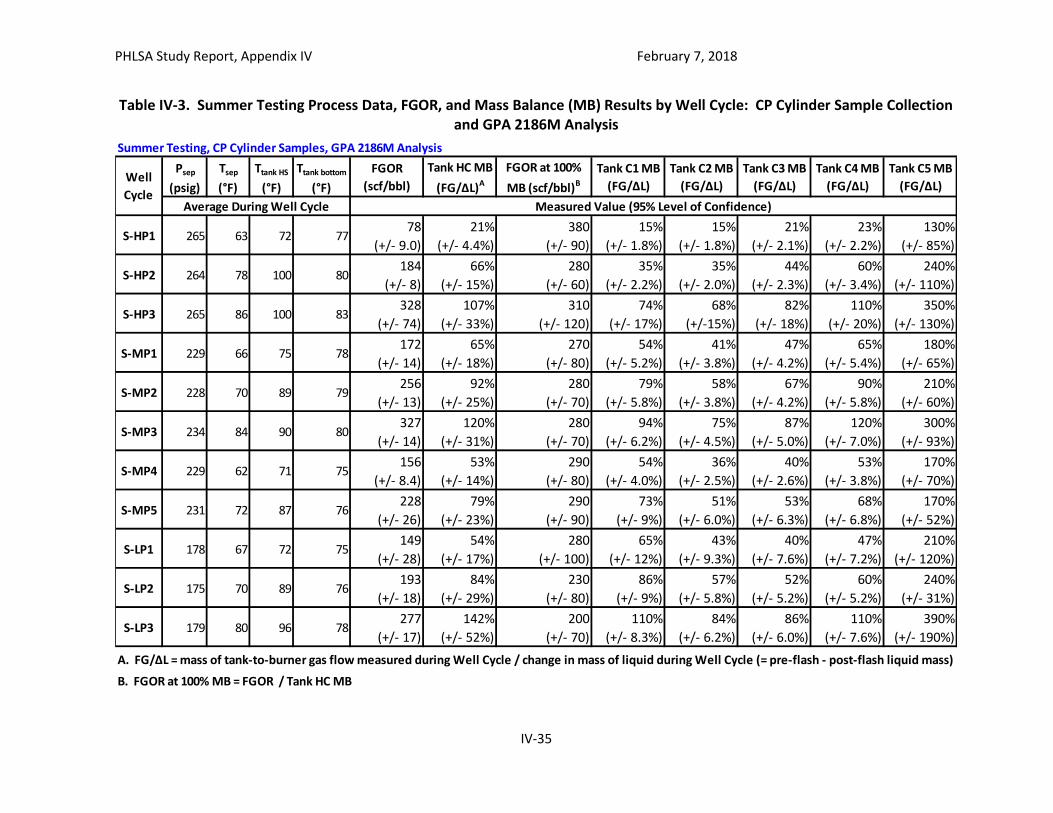
Table IV-3. Summer Testing Process Data, FGOR, and Mass Balance (MB) Results by Well
Cycle: CP Cylinder Sample Collection and GPA 2186M Analysis
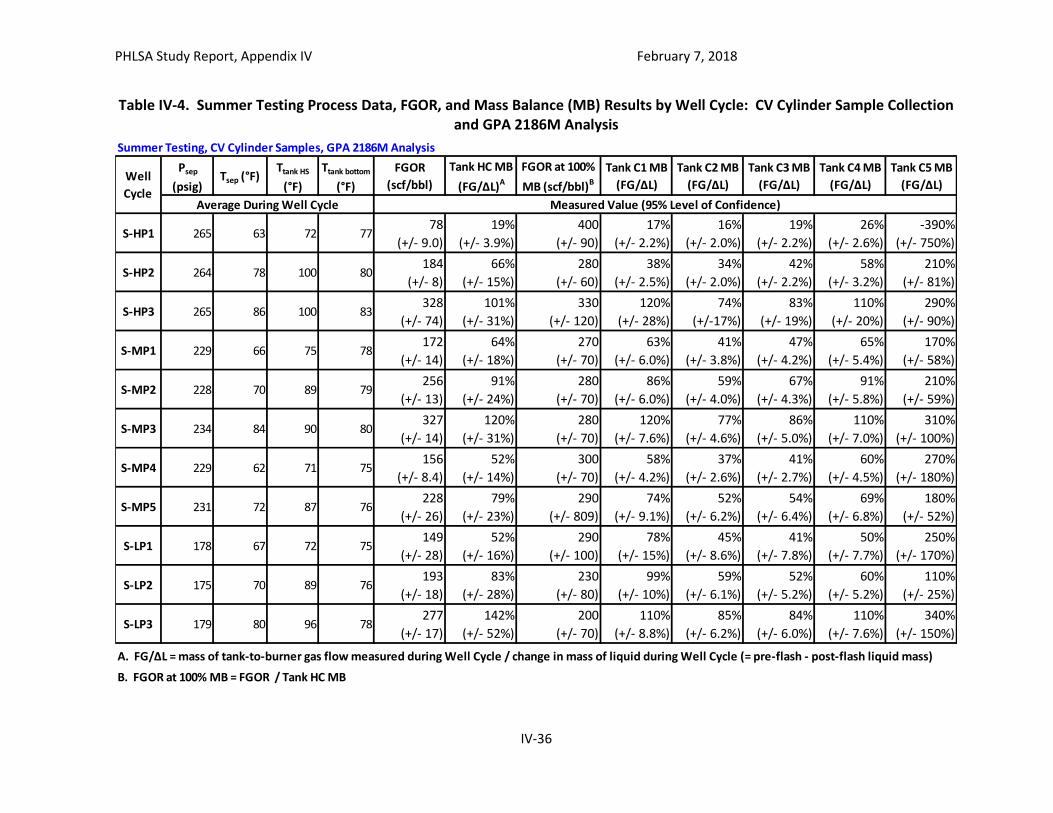
Table IV-4. Summer Testing Process Data, FGOR, and Mass Balance (MB) Results by Well
Cycle: CV Cylinder Sample Collection and GPA 2186M Analysis
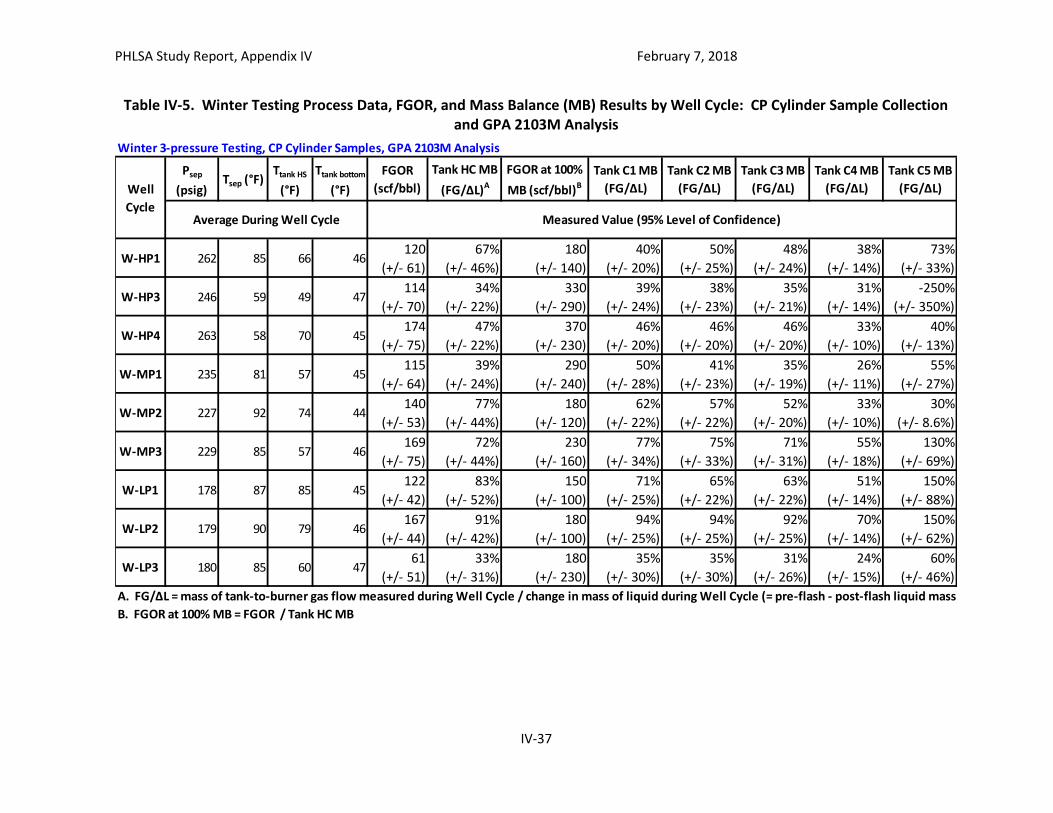
Table IV-5. Winter Testing Process Data, FGOR, and Mass Balance (MB) Results by Well
Cycle: CP Cylinder Sample Collection and GPA 2103M Analysis
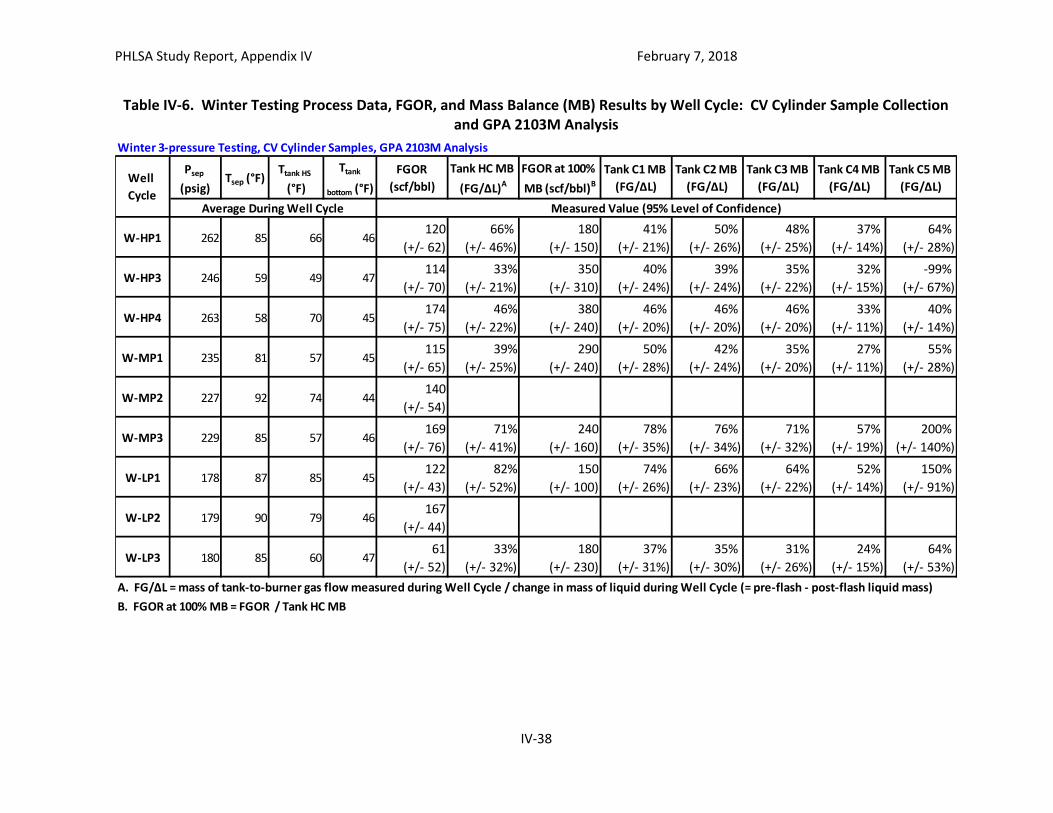
Table IV-6. Winter Testing Process Data, FGOR, and Mass Balance (MB) Results by Well
Cycle: CV Cylinder Sample Collection and GPA 2103M Analysis
Table IV-7. Winter Testing Process Data, FGOR, and Mass Balance (MB) Results by Well
Cycle: CP Cylinder Sample Collection and GPA 2186M Analysis
Table IV-8. Winter Testing Process Data, FGOR, and Mass Balance (MB) Results by Well
Cycle: CV Cylinder Sample Collection and GPA 2186M Analysis
The summary data in these tables were extracted from the spreadsheets listed in Table IV.6-2.
These tables include, for each well cycle:
Key process parameters separator pressure (Psep), separator temperature (Tsep), storage
tank headspace temperature (Ttank HS), and the tank liquids temperature one foot from the
bottom in the vicinity of the down-comer exit (Ttank bottom).
The FGOR measured during the well cycle (Eqn. IV.4-1).
The storage tank mass balance measured during the well cycle (Eqn. IV.4-7).
- The mass of tank-to-burner gas flow measured during the well cycle is an estimate of
the mass of flash gas generated during the well cycle; however, it is believed to be
biased slightly high. The volume of tank-to-burner gas flow measured during the well
cycle is believed to be a good estimate of the volume of flash gas generated during the
PHLSA Study Report, Appendix IV February 7, 2018
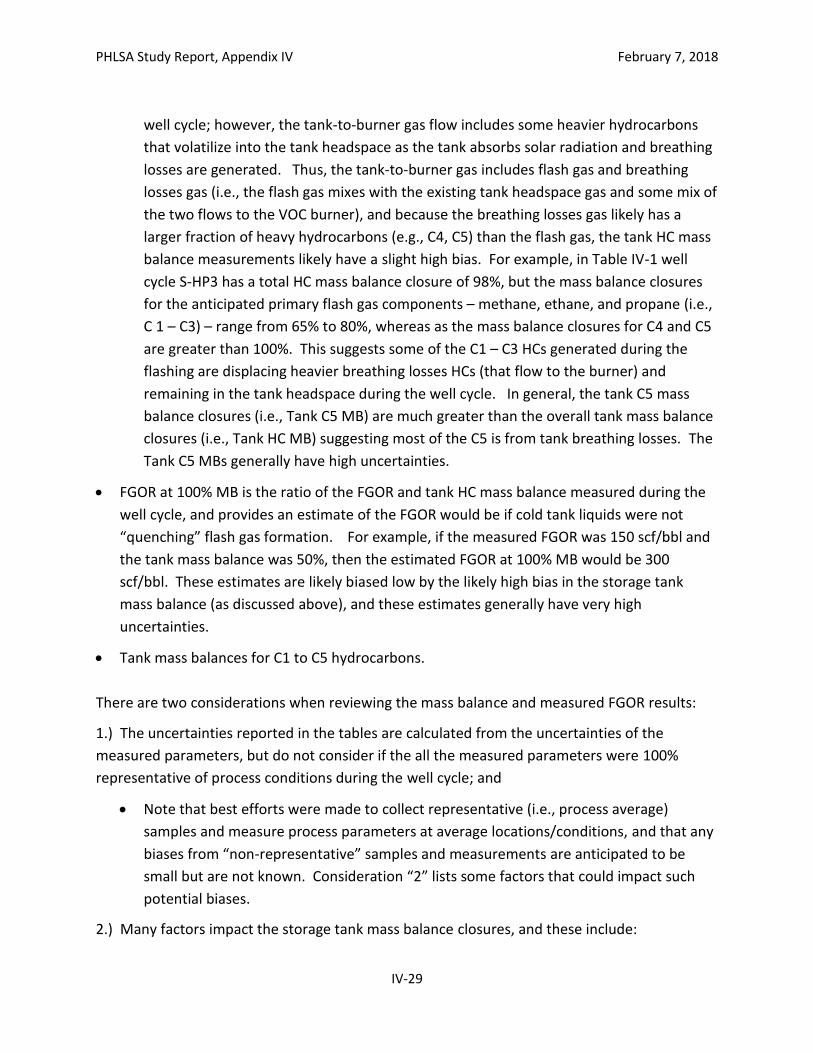
IV-29
well cycle; however, the tank-to-burner gas flow includes some heavier hydrocarbons
that volatilize into the tank headspace as the tank absorbs solar radiation and breathing
losses are generated. Thus, the tank-to-burner gas includes flash gas and breathing
losses gas (i.e., the flash gas mixes with the existing tank headspace gas and some mix of
the two flows to the VOC burner), and because the breathing losses gas likely has a
larger fraction of heavy hydrocarbons (e.g., C4, C5) than the flash gas, the tank HC mass
balance measurements likely have a slight high bias. For example, in Table IV-1 well
cycle S-HP3 has a total HC mass balance closure of 98%, but the mass balance closures
for the anticipated primary flash gas components – methane, ethane, and propane (i.e.,
C 1 – C3) – range from 65% to 80%, whereas as the mass balance closures for C4 and C5
are greater than 100%. This suggests some of the C1 – C3 HCs generated during the
flashing are displacing heavier breathing losses HCs (that flow to the burner) and
remaining in the tank headspace during the well cycle. In general, the tank C5 mass
balance closures (i.e., Tank C5 MB) are much greater than the overall tank mass balance
closures (i.e., Tank HC MB) suggesting most of the C5 is from tank breathing losses. The
Tank C5 MBs generally have high uncertainties.
FGOR at 100% MB is the ratio of the FGOR and tank HC mass balance measured during the
well cycle, and provides an estimate of the FGOR would be if cold tank liquids were not
“quenching” flash gas formation. For example, if the measured FGOR was 150 scf/bbl and
the tank mass balance was 50%, then the estimated FGOR at 100% MB would be 300
scf/bbl. These estimates are likely biased low by the likely high bias in the storage tank
mass balance (as discussed above), and these estimates generally have very high
uncertainties.
Tank mass balances for C1 to C5 hydrocarbons.
There are two considerations when reviewing the mass balance and measured FGOR results:
1.) The uncertainties reported in the tables are calculated from the uncertainties of the
measured parameters, but do not consider if the all the measured parameters were 100%
representative of process conditions during the well cycle; and
Note that best efforts were made to collect representative (i.e., process average)
samples and measure process parameters at average locations/conditions, and that any
biases from “non-representative” samples and measurements are anticipated to be
small but are not known. Consideration “2” lists some factors that could impact such
potential biases.
2.) Many factors impact the storage tank mass balance closures, and these include:
PHLSA Study Report, Appendix IV February 7, 2018
IV-30
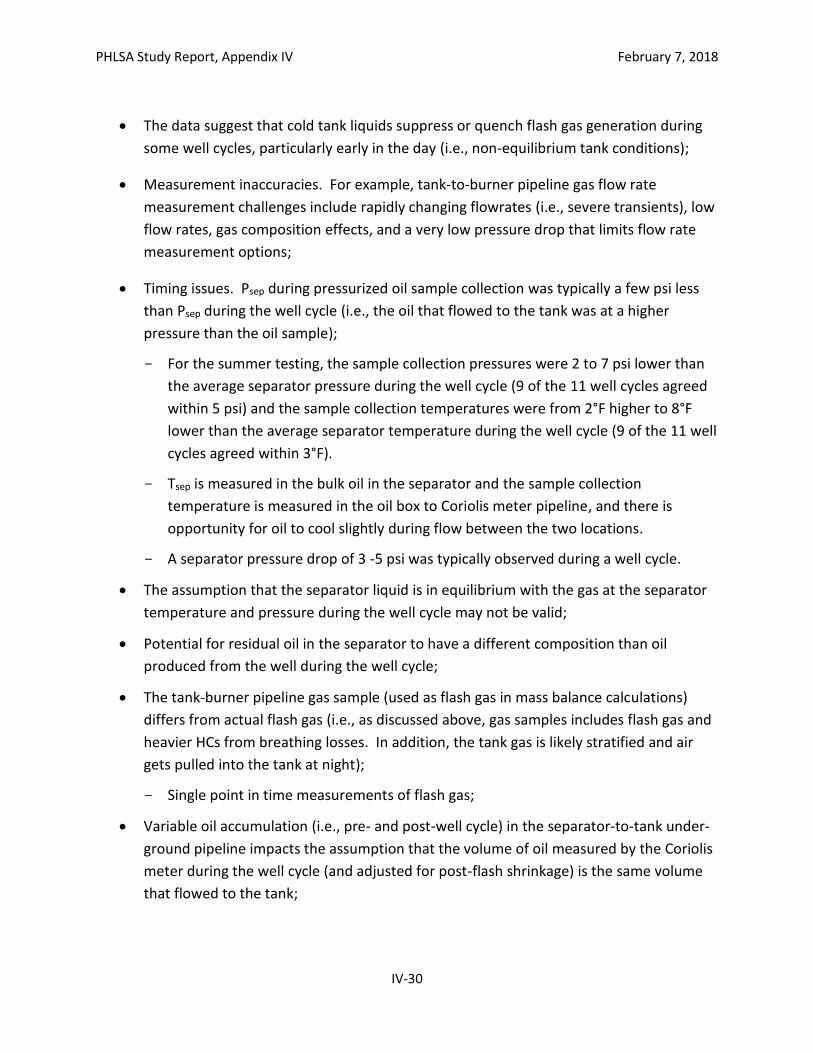
The data suggest that cold tank liquids suppress or quench flash gas generation during
some well cycles, particularly early in the day (i.e., non-equilibrium tank conditions);
Measurement inaccuracies. For example, tank-to-burner pipeline gas flow rate
measurement challenges include rapidly changing flowrates (i.e., severe transients), low
flow rates, gas composition effects, and a very low pressure drop that limits flow rate
measurement options;
Timing issues. Psep during pressurized oil sample collection was typically a few psi less
than Psep during the well cycle (i.e., the oil that flowed to the tank was at a higher
pressure than the oil sample);
- For the summer testing, the sample collection pressures were 2 to 7 psi lower than
the average separator pressure during the well cycle (9 of the 11 well cycles agreed
within 5 psi) and the sample collection temperatures were from 2°F higher to 8°F
lower than the average separator temperature during the well cycle (9 of the 11 well
cycles agreed within 3°F).
- Tsep is measured in the bulk oil in the separator and the sample collection
temperature is measured in the oil box to Coriolis meter pipeline, and there is
opportunity for oil to cool slightly during flow between the two locations.
- A separator pressure drop of 3 -5 psi was typically observed during a well cycle.
The assumption that the separator liquid is in equilibrium with the gas at the separator
temperature and pressure during the well cycle may not be valid;
Potential for residual oil in the separator to have a different composition than oil
produced from the well during the well cycle;
The tank-burner pipeline gas sample (used as flash gas in mass balance calculations)
differs from actual flash gas (i.e., as discussed above, gas samples includes flash gas and
heavier HCs from breathing losses. In addition, the tank gas is likely stratified and air
gets pulled into the tank at night);
- Single point in time measurements of flash gas;
Variable oil accumulation (i.e., pre- and post-well cycle) in the separator-to-tank under-
ground pipeline impacts the assumption that the volume of oil measured by the Coriolis
meter during the well cycle (and adjusted for post-flash shrinkage) is the same volume
that flowed to the tank;

PHLSA Study Report, Appendix IV February 7, 2018
IV-31
Temperature and pressure of the lab weathered pressurized condensate sample
(relative to actual tank/flash conditions), and relative duration of condensate
weathering;
- Tank fluids could be slow to reach equilibrium.
Tank liquids recent temperature history;
Estimation of breathing losses; and
Other factors.
IV.5.1 Summary of Key Notes and Observations Associated with the FGOR and Storage Tank
Mass Balance Measurements
The following are some key notes and observations associated with the FGOR and storage tank
mass balance measurements:
Before the winter testing and before the summer testing the thief hatch, PRV, and other
tank connections were checked for leaks.
During the winter testing, the Fox thermal mass meters totalizers were updating at 15 cf
increments, which was a large fraction of the total flow for some of the well cycles.
Therefore, the instantaneous flowmeter measurements were integrated for the duration of
the well cycle. The totalizer increment was adjusted to 1 cubic foot prior to the summer
testing.
Winter testing LP#3. The separator oil temperature dropped from 95.8 to 76.2°F during the
well cycle. The separator gas temperature dropped also, and these temperature drops
suggest the oil entering the separator was much colder than and different than the residual
oil. Thus, the oil flowing to the tank and collected as a sample may not have been at
equilibrium if for no other reason than incomplete mixing.
The separator dump valve trim size was reduced between the winter testing (0.5” trim) and
the summer testing (3/8” trim).
The separator heater did not operator during the summer testing.
A practice of emptying the oil box before well cycle and at the end of each well cycle was
adopted such the volume of oil produced during the well cycle passed through the Coriolis
meter.
A compressor was operated during the low pressure tests and some mid-pressure tests to
control the separator pressure. Starting up the compressor typically caused the separator
PHLSA Study Report, Appendix IV February 7, 2018
IV-32
pressure to fluctuate for a few minutes, but there was no evidence that this impacted
pressurized condensate results.
API 11.1 was used to adjust measured oil volumes to standard temperature and pressure.
After well cycle S-HP1 it was determined that the vane anemometer had a resistor installed
for communication and that this resistor dampened the output. The resistor was removed
and the vane anemometer measurements for this well cycle were discarded.

PHLSA Study Report, Appendix IV February 7, 2018
IV-33
Table IV-1. Summer Testing Process Data, FGOR, and Mass Balance (MB) Results by Well Cycle: CP Cylinder Sample Collection and GPA 2103M Analysis
Summer Testing, CP Cylinder Samples, GPA 2103M Analysis
Well
Cycle
Psep
(psig)Tsep (°F)
Ttank HS
(°F)
Ttank bottom
(°F)
FGOR
(scf/bbl)
Tank HC MB
(FG/ΔL)A
FGOR at 100%
MB (scf/bbl)B
Tank C1 MB
(FG/ΔL)
Tank C2 MB
(FG/ΔL)
Tank C3 MB
(FG/ΔL)
Tank C4 MB
(FG/ΔL)
Tank C5 MB
(FG/ΔL)
S-HP1 265 63 72 7778
(+/- 9.0)
19%
(+/- 3.6%)
410
(+/- 87)
14%
(+/- 1.7%)
14%
(+/- 1.7%)
17%
(+/- 2%)
23%
(+/- 2.3%)
77%
(+/- 27%)
S-HP2 264 78 100 80184
(+/- 8)
61%
(+/- 12%)
300
(+/- 58)
32%
(+/- 2.0%)
34%
(+/- 1.7%)
43%
(+/- 2.2%)
60%
(+/- 3%)
190%
(+/- 61%)
S-HP3 265 86 100 83328
(+/- 74)
98%
(+/- 28%)
330
(+/- 120)
69%
(+/- 16%)
65%
(+/-15%)
80%
(+/- 18%)
110%
(+/- 20%)
290%
(+/- 87%)
S-MP1 229 66 75 78172
(+/- 14)
58%
(+/- 13%)
300
(+/- 70)
53%
(+/- 5.0%)
41%
(+/- 3.5%)
47%
(+/- 4.1%)
67%
(+/- 5.2%)
160%
(+/- 47%)
S-MP2 228 70 89 79256
(+/- 13)
83%
(+/- 17%)
310
(+/- 70)
77%
(+/- 5.2%)
57%
(+/- 3.3%)
66%
(+/- 3.8%)
91%
(+/- 5.1%)
180%
(+/- 37%)
S-MP3 234 84 90 80327
(+/- 14)
105%
(+/- 23%)
310
(+/- 64)
96%
(+/- 6.0%)
74%
(+/- 3.7%)
84%
(+/- 4.2%)
120%
(+/- 6.0%)
260%
(+/- 62%)
S-MP4 229 62 71 75156
(+/- 8.4)
47%
(+/- 10%)
330
(+/- 68)
50%
(+/- 3.4%)
36%
(+/- 2.1%)
39%
(+/- 2.2%)
55%
(+/- 3.4%)
160%
(+/- 55%)
S-MP5 231 72 87 76228
(+/- 26)
71%
(+/- 16%)
320
(+/- 80)
70%
(+/- 8.4%)
51%
(+/- 5.8%)
53%
(+/- 6.1%)
71%
(+/- 6.7%)
150%
(+/- 34%)
S-LP1 178 67 72 75149
(+/- 28)
49%
(+/- 14%)
300
(+/- 100)
63%
(+/- 12%)
43%
(+/- 8.0%)
39%
(+/- 7.4%)
49%
(+/- 7.5%)
150%
(+/- 53%)
S-LP2 175 70 89 76193
(+/- 18)
71%
(+/- 19%)
270
(+/- 77)
88%
(+/- 9.1%)
59%
(+/- 5.7%)
53%
(+/- 5.2%)
64%
(+/- 5.2%)
140%
(+/- 33%)
S-LP3 178 80 96 78277
(+/- 17)
121%
(+/- 35%)
230
(+/- 67)
110%
(+/- 7.8%)
84%
(+/- 5.4%)
84%
(+/- 5.6%)
110%
(+/- 7.0%)
300%
(+/- 96%)
A. FG/ΔL = mass of tank-to-burner gas flow measured during Well Cycle / change in mass of liquid during Well Cycle (= pre-flash - post-flash liquid mass)
B. FGOR at 100% MB = FGOR / Tank HC MB
Average During Well Cycle Measured Value (95% Level of Confidence)
PHLSA Study Report, Appendix IV February 7, 2018
IV-34
Table IV-2. Summer Testing Process Data, FGOR, and Mass Balance (MB) Results by Well Cycle: CV Cylinder Sample Collection and GPA 2103M Analysis
Summer Testing, CV Cylinder Samples, GPA 2103M Analysis
Psep
(psig)
Tsep
(°F)
Ttank HS
(°F)
Ttank bottom
(°F)
FGOR
(scf/bbl)
Tank HC MB
(FG/ΔL)A
FGOR at 100%
MB (scf/bbl)B
Tank C1 MB
(FG/ΔL)
Tank C2 MB
(FG/ΔL)
Tank C3 MB
(FG/ΔL)
Tank C4 MB
(FG/ΔL)
Tank C5 MB
(FG/ΔL)
S-HP1 265 63 72 7778
(+/- 9.0)
18%
(+/- 3.2%)
430
(+/- 90)
16%
(+/- 2.0%)
16%
(+/- 1.8%)
18%
(+/- 2.1%)
27%
(+/- 2.6%)
-4,000%
(+/- 32,000%)
S-HP2 264 78 100 80184
(+/- 8)
59%
(+/- 11%)
310
(+/- 60)
47%
(+/- 2.8%)
36%
(+/- 1.7%)
42%
(+/- 2.1%)
58%
(+/- 2.9%)
140%
(+/- 31%)
S-HP3 265 86 100 83328
(+/- 74)
97%
(+/- 27%)
340
(+/- 120)
84%
(+/- 19%)
65%
(+/-15%)
80%
(+/- 18%)
110%
(+/- 20%)
360%
(+/- 120%)
S-MP1 229 66 75 78172
(+/- 14)
58%
(+/- 14%)
300
(+/- 80)
60%
(+/- 5.6%)
41%
(+/- 3.5%)
47%
(+/- 4.1%)
68%
(+/- 5.2%)
170%
(+/- 50%)
S-MP2 228 70 89 79256
(+/- 13)
83%
(+/- 18%)
310
(+/- 60)
79%
(+/- 5.3%)
57%
(+/- 3.2%)
66%
(+/- 3.8%)
92%
(+/- 5.4%)
190%
(+/- 43%)
S-MP3 234 84 90 80327
(+/- 14)
105%
(+/- 23%)
310
(+/- 60)
110%
(+/- 6.7%)
75%
(+/- 3.8%)
85%
(+/- 4.2%)
120%
(+/- 6.4%)
280%
(+/- 72%)
S-MP4 229 62 71 75156
(+/- 8.4)
44%
(+/- 9.2%)
350
(+/- 70)
59%
(+/- 4.1%)
39%
(+/- 2.2%)
43%
(+/- 2.6%)
67%
(+/- 4.5%)
550%
(+/- 600%)
S-MP5 231 72 87 76228
(+/- 26)
74%
(+/- 18%)
310
(+/- 80)
74%
(+/- 8.9%)
52%
(+/- 6.0%)
54%
(+/- 6.2%)
73%
(+/- 6.9%)
190%
(+/- 50%)
S-LP1 178 67 72 75149
(+/- 28)
49%
(+/- 14%)
300
(+/- 100)
73%
(+/- 14%)
44%
(+/- 8.4%)
40%
(+/- 7.7%)
51%
(+/- 7.7%)
170%
(+/- 73%)
S-LP2 175 70 89 76193
(+/- 18)
70%
(+/- 19%)
270
(+/- 70)
99%
(+/- 10%)
60%
(+/- 5.8%)
53%
(+/- 5.2%)
61%
(+/- 5.0%)
110%
(+/- 21%)
S-LP3 179 80 96 78277
(+/- 17)
123%
(+/- 36%)
230
(+/- 60)
110%
(+/- 8.2%)
85%
(+/- 5.5%)
84%
(+/- 5.5%)
110%
(+/- 7.0%)
300%
(+/- 96%)
A. FG/ΔL = mass of tank-to-burner gas flow measured during Well Cycle / change in mass of liquid during Well Cycle (= pre-flash - post-flash liquid mass)
B. FGOR at 100% MB = FGOR / Tank HC MB
Average During Well Cycle
Well
CycleMeasured Value (95% Level of Confidence)
PHLSA Study Report, Appendix IV February 7, 2018
IV-35
Table IV-3. Summer Testing Process Data, FGOR, and Mass Balance (MB) Results by Well Cycle: CP Cylinder Sample Collection and GPA 2186M Analysis
Summer Testing, CP Cylinder Samples, GPA 2186M Analysis
Psep
(psig)
Tsep
(°F)
Ttank HS
(°F)
Ttank bottom
(°F)
FGOR
(scf/bbl)
Tank HC MB
(FG/ΔL)A
FGOR at 100%
MB (scf/bbl)B
Tank C1 MB
(FG/ΔL)
Tank C2 MB
(FG/ΔL)
Tank C3 MB
(FG/ΔL)
Tank C4 MB
(FG/ΔL)
Tank C5 MB
(FG/ΔL)
S-HP1 265 63 72 7778
(+/- 9.0)
21%
(+/- 4.4%)
380
(+/- 90)
15%
(+/- 1.8%)
15%
(+/- 1.8%)
21%
(+/- 2.1%)
23%
(+/- 2.2%)
130%
(+/- 85%)
S-HP2 264 78 100 80184
(+/- 8)
66%
(+/- 15%)
280
(+/- 60)
35%
(+/- 2.2%)
35%
(+/- 2.0%)
44%
(+/- 2.3%)
60%
(+/- 3.4%)
240%
(+/- 110%)
S-HP3 265 86 100 83328
(+/- 74)
107%
(+/- 33%)
310
(+/- 120)
74%
(+/- 17%)
68%
(+/-15%)
82%
(+/- 18%)
110%
(+/- 20%)
350%
(+/- 130%)
S-MP1 229 66 75 78172
(+/- 14)
65%
(+/- 18%)
270
(+/- 80)
54%
(+/- 5.2%)
41%
(+/- 3.8%)
47%
(+/- 4.2%)
65%
(+/- 5.4%)
180%
(+/- 65%)
S-MP2 228 70 89 79256
(+/- 13)
92%
(+/- 25%)
280
(+/- 70)
79%
(+/- 5.8%)
58%
(+/- 3.8%)
67%
(+/- 4.2%)
90%
(+/- 5.8%)
210%
(+/- 60%)
S-MP3 234 84 90 80327
(+/- 14)
120%
(+/- 31%)
280
(+/- 70)
94%
(+/- 6.2%)
75%
(+/- 4.5%)
87%
(+/- 5.0%)
120%
(+/- 7.0%)
300%
(+/- 93%)
S-MP4 229 62 71 75156
(+/- 8.4)
53%
(+/- 14%)
290
(+/- 80)
54%
(+/- 4.0%)
36%
(+/- 2.5%)
40%
(+/- 2.6%)
53%
(+/- 3.8%)
170%
(+/- 70%)
S-MP5 231 72 87 76228
(+/- 26)
79%
(+/- 23%)
290
(+/- 90)
73%
(+/- 9%)
51%
(+/- 6.0%)
53%
(+/- 6.3%)
68%
(+/- 6.8%)
170%
(+/- 52%)
S-LP1 178 67 72 75149
(+/- 28)
54%
(+/- 17%)
280
(+/- 100)
65%
(+/- 12%)
43%
(+/- 9.3%)
40%
(+/- 7.6%)
47%
(+/- 7.2%)
210%
(+/- 120%)
S-LP2 175 70 89 76193
(+/- 18)
84%
(+/- 29%)
230
(+/- 80)
86%
(+/- 9%)
57%
(+/- 5.8%)
52%
(+/- 5.2%)
60%
(+/- 5.2%)
240%
(+/- 31%)
S-LP3 179 80 96 78277
(+/- 17)
142%
(+/- 52%)
200
(+/- 70)
110%
(+/- 8.3%)
84%
(+/- 6.2%)
86%
(+/- 6.0%)
110%
(+/- 7.6%)
390%
(+/- 190%)
A. FG/ΔL = mass of tank-to-burner gas flow measured during Well Cycle / change in mass of liquid during Well Cycle (= pre-flash - post-flash liquid mass)
B. FGOR at 100% MB = FGOR / Tank HC MB
Average During Well Cycle
Well
CycleMeasured Value (95% Level of Confidence)
PHLSA Study Report, Appendix IV February 7, 2018
IV-36
Table IV-4. Summer Testing Process Data, FGOR, and Mass Balance (MB) Results by Well Cycle: CV Cylinder Sample Collection and GPA 2186M Analysis
Summer Testing, CV Cylinder Samples, GPA 2186M Analysis
Psep
(psig)Tsep (°F)
Ttank HS
(°F)
Ttank bottom
(°F)
FGOR
(scf/bbl)
Tank HC MB
(FG/ΔL)A
FGOR at 100%
MB (scf/bbl)B
Tank C1 MB
(FG/ΔL)
Tank C2 MB
(FG/ΔL)
Tank C3 MB
(FG/ΔL)
Tank C4 MB
(FG/ΔL)
Tank C5 MB
(FG/ΔL)
S-HP1 265 63 72 7778
(+/- 9.0)
19%
(+/- 3.9%)
400
(+/- 90)
17%
(+/- 2.2%)
16%
(+/- 2.0%)
19%
(+/- 2.2%)
26%
(+/- 2.6%)
-390%
(+/- 750%)
S-HP2 264 78 100 80184
(+/- 8)
66%
(+/- 15%)
280
(+/- 60)
38%
(+/- 2.5%)
34%
(+/- 2.0%)
42%
(+/- 2.2%)
58%
(+/- 3.2%)
210%
(+/- 81%)
S-HP3 265 86 100 83328
(+/- 74)
101%
(+/- 31%)
330
(+/- 120)
120%
(+/- 28%)
74%
(+/-17%)
83%
(+/- 19%)
110%
(+/- 20%)
290%
(+/- 90%)
S-MP1 229 66 75 78172
(+/- 14)
64%
(+/- 18%)
270
(+/- 70)
63%
(+/- 6.0%)
41%
(+/- 3.8%)
47%
(+/- 4.2%)
65%
(+/- 5.4%)
170%
(+/- 58%)
S-MP2 228 70 89 79256
(+/- 13)
91%
(+/- 24%)
280
(+/- 70)
86%
(+/- 6.0%)
59%
(+/- 4.0%)
67%
(+/- 4.3%)
91%
(+/- 5.8%)
210%
(+/- 59%)
S-MP3 234 84 90 80327
(+/- 14)
120%
(+/- 31%)
280
(+/- 70)
120%
(+/- 7.6%)
77%
(+/- 4.6%)
86%
(+/- 5.0%)
110%
(+/- 7.0%)
310%
(+/- 100%)
S-MP4 229 62 71 75156
(+/- 8.4)
52%
(+/- 14%)
300
(+/- 70)
58%
(+/- 4.2%)
37%
(+/- 2.6%)
41%
(+/- 2.7%)
60%
(+/- 4.5%)
270%
(+/- 180%)
S-MP5 231 72 87 76228
(+/- 26)
79%
(+/- 23%)
290
(+/- 809)
74%
(+/- 9.1%)
52%
(+/- 6.2%)
54%
(+/- 6.4%)
69%
(+/- 6.8%)
180%
(+/- 52%)
S-LP1 178 67 72 75149
(+/- 28)
52%
(+/- 16%)
290
(+/- 100)
78%
(+/- 15%)
45%
(+/- 8.6%)
41%
(+/- 7.8%)
50%
(+/- 7.7%)
250%
(+/- 170%)
S-LP2 175 70 89 76193
(+/- 18)
83%
(+/- 28%)
230
(+/- 80)
99%
(+/- 10%)
59%
(+/- 6.1%)
52%
(+/- 5.2%)
60%
(+/- 5.2%)
110%
(+/- 25%)
S-LP3 179 80 96 78277
(+/- 17)
142%
(+/- 52%)
200
(+/- 70)
110%
(+/- 8.8%)
85%
(+/- 6.2%)
84%
(+/- 6.0%)
110%
(+/- 7.6%)
340%
(+/- 150%)
A. FG/ΔL = mass of tank-to-burner gas flow measured during Well Cycle / change in mass of liquid during Well Cycle (= pre-flash - post-flash liquid mass)
B. FGOR at 100% MB = FGOR / Tank HC MB
Average During Well Cycle
Well
CycleMeasured Value (95% Level of Confidence)
PHLSA Study Report, Appendix IV February 7, 2018
IV-37
Table IV-5. Winter Testing Process Data, FGOR, and Mass Balance (MB) Results by Well Cycle: CP Cylinder Sample Collection and GPA 2103M Analysis
Winter 3-pressure Testing, CP Cylinder Samples, GPA 2103M Analysis
Psep
(psig)Tsep (°F)
Ttank HS
(°F)
Ttank bottom
(°F)
FGOR
(scf/bbl)
Tank HC MB
(FG/ΔL)A
FGOR at 100%
MB (scf/bbl)B
Tank C1 MB
(FG/ΔL)
Tank C2 MB
(FG/ΔL)
Tank C3 MB
(FG/ΔL)
Tank C4 MB
(FG/ΔL)
Tank C5 MB
(FG/ΔL)
W-HP1 262 85 66 46120
(+/- 61)
67%
(+/- 46%)
180
(+/- 140)
40%
(+/- 20%)
50%
(+/- 25%)
48%
(+/- 24%)
38%
(+/- 14%)
73%
(+/- 33%)
W-HP3 246 59 49 47114
(+/- 70)
34%
(+/- 22%)
330
(+/- 290)
39%
(+/- 24%)
38%
(+/- 23%)
35%
(+/- 21%)
31%
(+/- 14%)
-250%
(+/- 350%)
W-HP4 263 58 70 45174
(+/- 75)
47%
(+/- 22%)
370
(+/- 230)
46%
(+/- 20%)
46%
(+/- 20%)
46%
(+/- 20%)
33%
(+/- 10%)
40%
(+/- 13%)
W-MP1 235 81 57 45115
(+/- 64)
39%
(+/- 24%)
290
(+/- 240)
50%
(+/- 28%)
41%
(+/- 23%)
35%
(+/- 19%)
26%
(+/- 11%)
55%
(+/- 27%)
W-MP2 227 92 74 44140
(+/- 53)
77%
(+/- 44%)
180
(+/- 120)
62%
(+/- 22%)
57%
(+/- 22%)
52%
(+/- 20%)
33%
(+/- 10%)
30%
(+/- 8.6%)
W-MP3 229 85 57 46169
(+/- 75)
72%
(+/- 44%)
230
(+/- 160)
77%
(+/- 34%)
75%
(+/- 33%)
71%
(+/- 31%)
55%
(+/- 18%)
130%
(+/- 69%)
W-LP1 178 87 85 45122
(+/- 42)
83%
(+/- 52%)
150
(+/- 100)
71%
(+/- 25%)
65%
(+/- 22%)
63%
(+/- 22%)
51%
(+/- 14%)
150%
(+/- 88%)
W-LP2 179 90 79 46167
(+/- 44)
91%
(+/- 42%)
180
(+/- 100)
94%
(+/- 25%)
94%
(+/- 25%)
92%
(+/- 25%)
70%
(+/- 14%)
150%
(+/- 62%)
W-LP3 180 85 60 4761
(+/- 51)
33%
(+/- 31%)
180
(+/- 230)
35%
(+/- 30%)
35%
(+/- 30%)
31%
(+/- 26%)
24%
(+/- 15%)
60%
(+/- 46%)
A. FG/ΔL = mass of tank-to-burner gas flow measured during Well Cycle / change in mass of liquid during Well Cycle (= pre-flash - post-flash liquid mass)
B. FGOR at 100% MB = FGOR / Tank HC MB
Well
CycleAverage During Well Cycle Measured Value (95% Level of Confidence)
PHLSA Study Report, Appendix IV February 7, 2018
IV-38
Table IV-6. Winter Testing Process Data, FGOR, and Mass Balance (MB) Results by Well Cycle: CV Cylinder Sample Collection and GPA 2103M Analysis
Winter 3-pressure Testing, CV Cylinder Samples, GPA 2103M Analysis
Psep
(psig)Tsep (°F)
Ttank HS
(°F)
Ttank
bottom (°F)
FGOR
(scf/bbl)
Tank HC MB
(FG/ΔL)A
FGOR at 100%
MB (scf/bbl)B
Tank C1 MB
(FG/ΔL)
Tank C2 MB
(FG/ΔL)
Tank C3 MB
(FG/ΔL)
Tank C4 MB
(FG/ΔL)
Tank C5 MB
(FG/ΔL)
W-HP1 262 85 66 46120
(+/- 62)
66%
(+/- 46%)
180
(+/- 150)
41%
(+/- 21%)
50%
(+/- 26%)
48%
(+/- 25%)
37%
(+/- 14%)
64%
(+/- 28%)
W-HP3 246 59 49 47114
(+/- 70)
33%
(+/- 21%)
350
(+/- 310)
40%
(+/- 24%)
39%
(+/- 24%)
35%
(+/- 22%)
32%
(+/- 15%)
-99%
(+/- 67%)
W-HP4 263 58 70 45174
(+/- 75)
46%
(+/- 22%)
380
(+/- 240)
46%
(+/- 20%)
46%
(+/- 20%)
46%
(+/- 20%)
33%
(+/- 11%)
40%
(+/- 14%)
W-MP1 235 81 57 45115
(+/- 65)
39%
(+/- 25%)
290
(+/- 240)
50%
(+/- 28%)
42%
(+/- 24%)
35%
(+/- 20%)
27%
(+/- 11%)
55%
(+/- 28%)
W-MP2 227 92 74 44140
(+/- 54)
W-MP3 229 85 57 46169
(+/- 76)
71%
(+/- 41%)
240
(+/- 160)
78%
(+/- 35%)
76%
(+/- 34%)
71%
(+/- 32%)
57%
(+/- 19%)
200%
(+/- 140%)
W-LP1 178 87 85 45122
(+/- 43)
82%
(+/- 52%)
150
(+/- 100)
74%
(+/- 26%)
66%
(+/- 23%)
64%
(+/- 22%)
52%
(+/- 14%)
150%
(+/- 91%)
W-LP2 179 90 79 46167
(+/- 44)
W-LP3 180 85 60 4761
(+/- 52)
33%
(+/- 32%)
180
(+/- 230)
37%
(+/- 31%)
35%
(+/- 30%)
31%
(+/- 26%)
24%
(+/- 15%)
64%
(+/- 53%)
A. FG/ΔL = mass of tank-to-burner gas flow measured during Well Cycle / change in mass of liquid during Well Cycle (= pre-flash - post-flash liquid mass)
B. FGOR at 100% MB = FGOR / Tank HC MB
Well
CycleMeasured Value (95% Level of Confidence)Average During Well Cycle
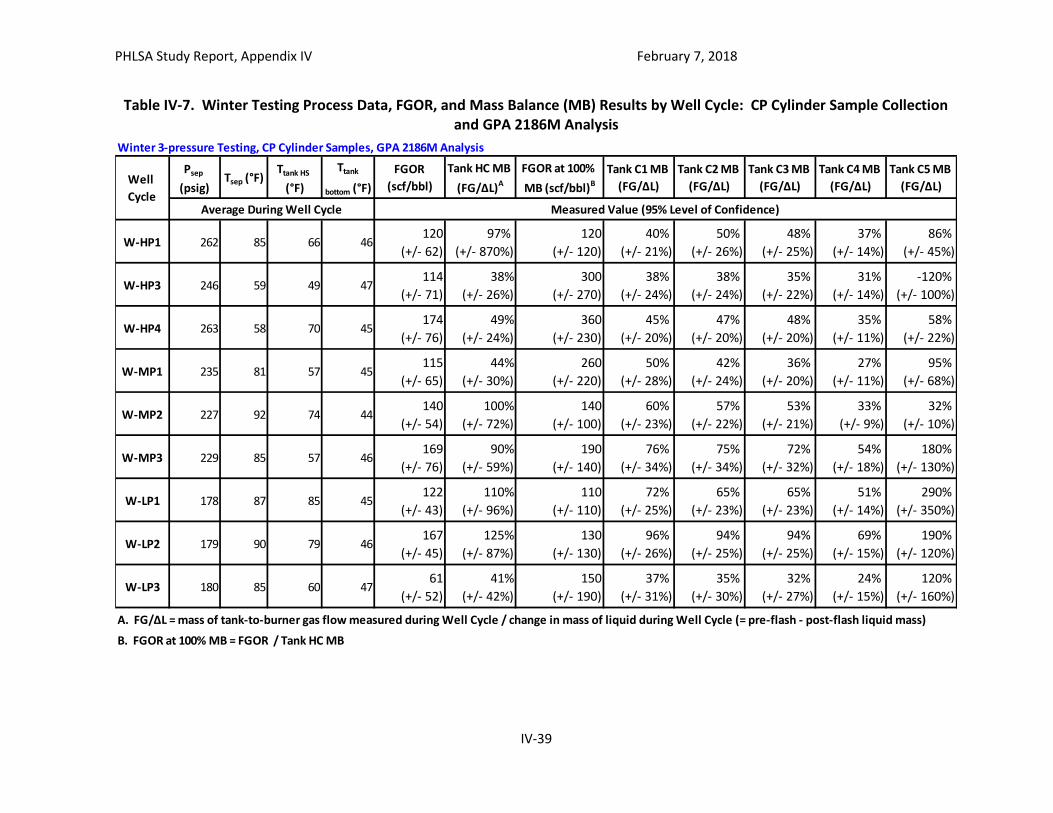
PHLSA Study Report, Appendix IV February 7, 2018
IV-39
Table IV-7. Winter Testing Process Data, FGOR, and Mass Balance (MB) Results by Well Cycle: CP Cylinder Sample Collection and GPA 2186M Analysis
Winter 3-pressure Testing, CP Cylinder Samples, GPA 2186M Analysis
Psep
(psig)Tsep (°F)
Ttank HS
(°F)
Ttank
bottom (°F)
FGOR
(scf/bbl)
Tank HC MB
(FG/ΔL)A
FGOR at 100%
MB (scf/bbl)B
Tank C1 MB
(FG/ΔL)
Tank C2 MB
(FG/ΔL)
Tank C3 MB
(FG/ΔL)
Tank C4 MB
(FG/ΔL)
Tank C5 MB
(FG/ΔL)
W-HP1 262 85 66 46120
(+/- 62)
97%
(+/- 870%)
120
(+/- 120)
40%
(+/- 21%)
50%
(+/- 26%)
48%
(+/- 25%)
37%
(+/- 14%)
86%
(+/- 45%)
W-HP3 246 59 49 47114
(+/- 71)
38%
(+/- 26%)
300
(+/- 270)
38%
(+/- 24%)
38%
(+/- 24%)
35%
(+/- 22%)
31%
(+/- 14%)
-120%
(+/- 100%)
W-HP4 263 58 70 45174
(+/- 76)
49%
(+/- 24%)
360
(+/- 230)
45%
(+/- 20%)
47%
(+/- 20%)
48%
(+/- 20%)
35%
(+/- 11%)
58%
(+/- 22%)
W-MP1 235 81 57 45115
(+/- 65)
44%
(+/- 30%)
260
(+/- 220)
50%
(+/- 28%)
42%
(+/- 24%)
36%
(+/- 20%)
27%
(+/- 11%)
95%
(+/- 68%)
W-MP2 227 92 74 44140
(+/- 54)
100%
(+/- 72%)
140
(+/- 100)
60%
(+/- 23%)
57%
(+/- 22%)
53%
(+/- 21%)
33%
(+/- 9%)
32%
(+/- 10%)
W-MP3 229 85 57 46169
(+/- 76)
90%
(+/- 59%)
190
(+/- 140)
76%
(+/- 34%)
75%
(+/- 34%)
72%
(+/- 32%)
54%
(+/- 18%)
180%
(+/- 130%)
W-LP1 178 87 85 45122
(+/- 43)
110%
(+/- 96%)
110
(+/- 110)
72%
(+/- 25%)
65%
(+/- 23%)
65%
(+/- 23%)
51%
(+/- 14%)
290%
(+/- 350%)
W-LP2 179 90 79 46167
(+/- 45)
125%
(+/- 87%)
130
(+/- 130)
96%
(+/- 26%)
94%
(+/- 25%)
94%
(+/- 25%)
69%
(+/- 15%)
190%
(+/- 120%)
W-LP3 180 85 60 4761
(+/- 52)
41%
(+/- 42%)
150
(+/- 190)
37%
(+/- 31%)
35%
(+/- 30%)
32%
(+/- 27%)
24%
(+/- 15%)
120%
(+/- 160%)
A. FG/ΔL = mass of tank-to-burner gas flow measured during Well Cycle / change in mass of liquid during Well Cycle (= pre-flash - post-flash liquid mass)
B. FGOR at 100% MB = FGOR / Tank HC MB
Average During Well Cycle
Well
CycleMeasured Value (95% Level of Confidence)
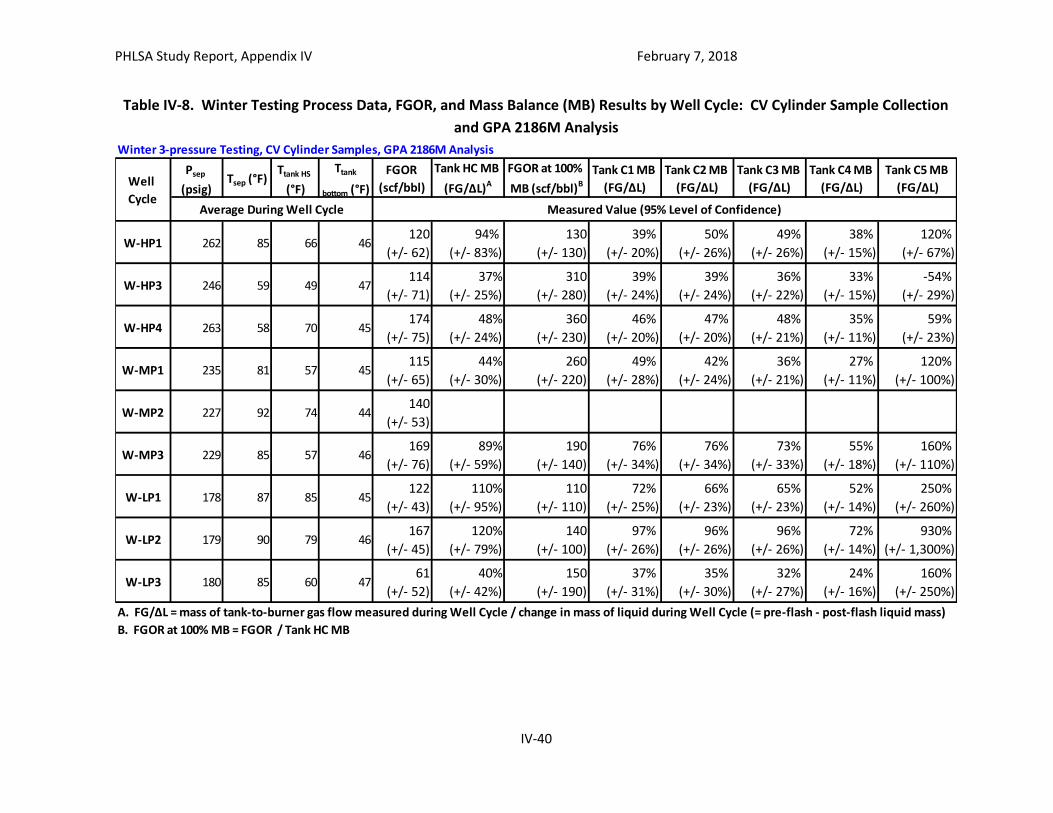
PHLSA Study Report, Appendix IV February 7, 2018
IV-40
Table IV-8. Winter Testing Process Data, FGOR, and Mass Balance (MB) Results by Well Cycle: CV Cylinder Sample Collection
and GPA 2186M Analysis
Winter 3-pressure Testing, CV Cylinder Samples, GPA 2186M Analysis
Psep
(psig)Tsep (°F)
Ttank HS
(°F)
Ttank
bottom (°F)
FGOR
(scf/bbl)
Tank HC MB
(FG/ΔL)A
FGOR at 100%
MB (scf/bbl)B
Tank C1 MB
(FG/ΔL)
Tank C2 MB
(FG/ΔL)
Tank C3 MB
(FG/ΔL)
Tank C4 MB
(FG/ΔL)
Tank C5 MB
(FG/ΔL)
W-HP1 262 85 66 46120
(+/- 62)
94%
(+/- 83%)
130
(+/- 130)
39%
(+/- 20%)
50%
(+/- 26%)
49%
(+/- 26%)
38%
(+/- 15%)
120%
(+/- 67%)
W-HP3 246 59 49 47114
(+/- 71)
37%
(+/- 25%)
310
(+/- 280)
39%
(+/- 24%)
39%
(+/- 24%)
36%
(+/- 22%)
33%
(+/- 15%)
-54%
(+/- 29%)
W-HP4 263 58 70 45174
(+/- 75)
48%
(+/- 24%)
360
(+/- 230)
46%
(+/- 20%)
47%
(+/- 20%)
48%
(+/- 21%)
35%
(+/- 11%)
59%
(+/- 23%)
W-MP1 235 81 57 45115
(+/- 65)
44%
(+/- 30%)
260
(+/- 220)
49%
(+/- 28%)
42%
(+/- 24%)
36%
(+/- 21%)
27%
(+/- 11%)
120%
(+/- 100%)
W-MP2 227 92 74 44140
(+/- 53)
W-MP3 229 85 57 46169
(+/- 76)
89%
(+/- 59%)
190
(+/- 140)
76%
(+/- 34%)
76%
(+/- 34%)
73%
(+/- 33%)
55%
(+/- 18%)
160%
(+/- 110%)
W-LP1 178 87 85 45122
(+/- 43)
110%
(+/- 95%)
110
(+/- 110)
72%
(+/- 25%)
66%
(+/- 23%)
65%
(+/- 23%)
52%
(+/- 14%)
250%
(+/- 260%)
W-LP2 179 90 79 46167
(+/- 45)
120%
(+/- 79%)
140
(+/- 100)
97%
(+/- 26%)
96%
(+/- 26%)
96%
(+/- 26%)
72%
(+/- 14%)
930%
(+/- 1,300%)
W-LP3 180 85 60 4761
(+/- 52)
40%
(+/- 42%)
150
(+/- 190)
37%
(+/- 31%)
35%
(+/- 30%)
32%
(+/- 27%)
24%
(+/- 16%)
160%
(+/- 250%)
A. FG/ΔL = mass of tank-to-burner gas flow measured during Well Cycle / change in mass of liquid during Well Cycle (= pre-flash - post-flash liquid mass)
B. FGOR at 100% MB = FGOR / Tank HC MB
Average During Well Cycle
Well
CycleMeasured Value (95% Level of Confidence)
PHLSA Study Report, Appendix IV February 7, 2018
IV-41
IV.6 Overview of Sub-Appendices
Table IV.6-1 lists the spreadsheets with the process instrumentation data records and summary
calculations for the winter and summer 3-pressure testing for the indicated well cycle.
Summary calculations include well cycle averages and totals for measured process parameters
(e.g., total flash gas generation volume, well cycle average separator temperature and
pressure). Indicated adjustments to measured tank-to-burner gas flowrates are calculated.
These spreadsheets are included in sub-Appendix IV.1.
The output from the spreadsheets listed in Table IV.6-1 and the analytical lab results were
inputs to the spreadsheets listed in Table IV.6-2 which calculate well cycle storage tank mass
balance and FGOR values, and associated uncertainties. These spreadsheets are included in
sub-Appendix IV.2.
Flowrates measured by the Fox thermal mass flowmeters of gases with compositions that differ
from the calibration gases were adjusted using a heat transfer model. This model is based on
correlations for heat transfer from a heated cylinder in a gas cross flow, and considers the
density, viscosity, thermal conductivity and Prandtl number of the gas. The spreadsheets listed
in Table IV.6-3 perform these calculations in two steps. For example, the “Fox Flowmeter
21773_Fox 1_Summer pre-test Cal Data_060117_Rev 1” spreadsheet calculates a Reynolds
number exponent “n” for the heat transfer model from calibration data provided by the
manufacturer. The “Fox Meters Summer Tank Gas Composition Adjustment Factors_060117”
spreadsheet then calculates a composition adjustment factor to adjust measured flowrates for
each well cycle using the heat transfer model, the “n” exponent, and the relative compositions
and properties of the well cycle process gas and the flow meter calibration gas.
Spreadsheets include either a “Read Me First” or “Instructions and Data Entry” worksheet that
describes the spreadsheet function and lists and describes all the worksheets in the
spreadsheet. The worksheets include documentation of the calculations.
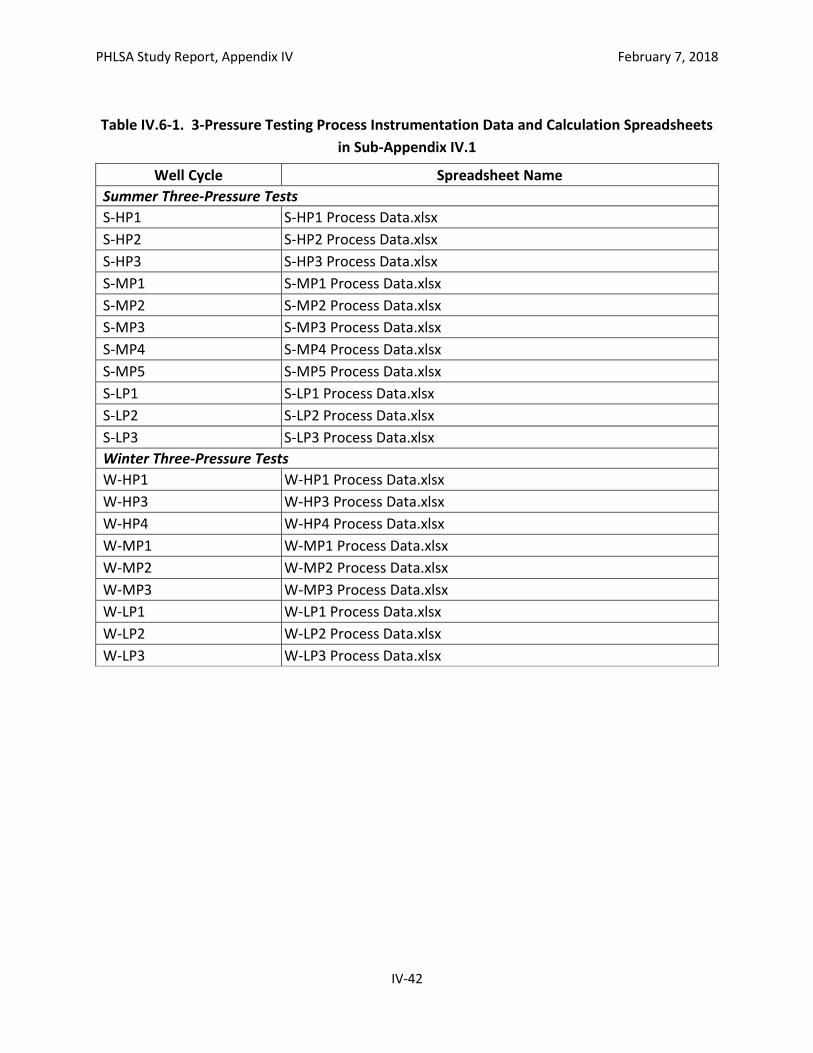
PHLSA Study Report, Appendix IV February 7, 2018
IV-42
Table IV.6-1. 3-Pressure Testing Process Instrumentation Data and Calculation Spreadsheets
in Sub-Appendix IV.1
Well Cycle Spreadsheet Name
Summer Three-Pressure Tests
S-HP1 S-HP1 Process Data.xlsx
S-HP2 S-HP2 Process Data.xlsx
S-HP3 S-HP3 Process Data.xlsx
S-MP1 S-MP1 Process Data.xlsx
S-MP2 S-MP2 Process Data.xlsx
S-MP3 S-MP3 Process Data.xlsx
S-MP4 S-MP4 Process Data.xlsx
S-MP5 S-MP5 Process Data.xlsx
S-LP1 S-LP1 Process Data.xlsx
S-LP2 S-LP2 Process Data.xlsx
S-LP3 S-LP3 Process Data.xlsx
Winter Three-Pressure Tests
W-HP1 W-HP1 Process Data.xlsx
W-HP3 W-HP3 Process Data.xlsx
W-HP4 W-HP4 Process Data.xlsx
W-MP1 W-MP1 Process Data.xlsx
W-MP2 W-MP2 Process Data.xlsx
W-MP3 W-MP3 Process Data.xlsx
W-LP1 W-LP1 Process Data.xlsx
W-LP2 W-LP2 Process Data.xlsx
W-LP3 W-LP3 Process Data.xlsx
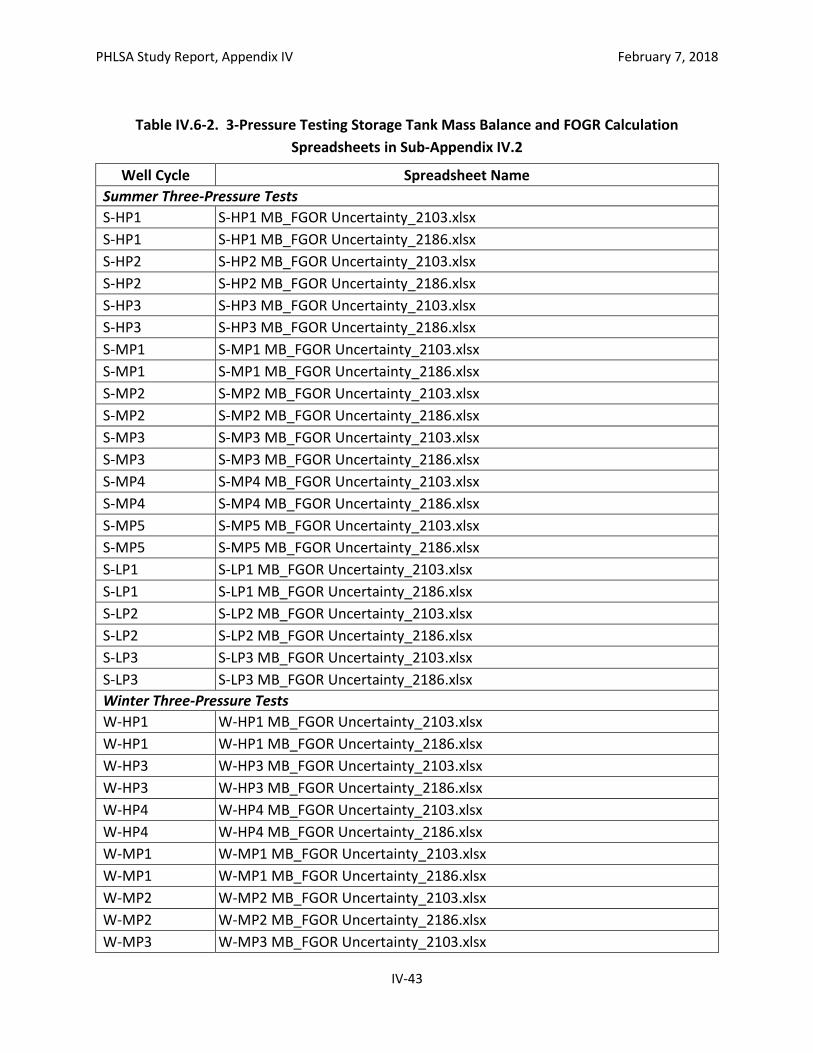
PHLSA Study Report, Appendix IV February 7, 2018
IV-43
Table IV.6-2. 3-Pressure Testing Storage Tank Mass Balance and FOGR Calculation
Spreadsheets in Sub-Appendix IV.2
Well Cycle Spreadsheet Name
Summer Three-Pressure Tests
S-HP1 S-HP1 MB_FGOR Uncertainty_2103.xlsx
S-HP1 S-HP1 MB_FGOR Uncertainty_2186.xlsx
S-HP2 S-HP2 MB_FGOR Uncertainty_2103.xlsx
S-HP2 S-HP2 MB_FGOR Uncertainty_2186.xlsx
S-HP3 S-HP3 MB_FGOR Uncertainty_2103.xlsx
S-HP3 S-HP3 MB_FGOR Uncertainty_2186.xlsx
S-MP1 S-MP1 MB_FGOR Uncertainty_2103.xlsx
S-MP1 S-MP1 MB_FGOR Uncertainty_2186.xlsx
S-MP2 S-MP2 MB_FGOR Uncertainty_2103.xlsx
S-MP2 S-MP2 MB_FGOR Uncertainty_2186.xlsx
S-MP3 S-MP3 MB_FGOR Uncertainty_2103.xlsx
S-MP3 S-MP3 MB_FGOR Uncertainty_2186.xlsx
S-MP4 S-MP4 MB_FGOR Uncertainty_2103.xlsx
S-MP4 S-MP4 MB_FGOR Uncertainty_2186.xlsx
S-MP5 S-MP5 MB_FGOR Uncertainty_2103.xlsx
S-MP5 S-MP5 MB_FGOR Uncertainty_2186.xlsx
S-LP1 S-LP1 MB_FGOR Uncertainty_2103.xlsx
S-LP1 S-LP1 MB_FGOR Uncertainty_2186.xlsx
S-LP2 S-LP2 MB_FGOR Uncertainty_2103.xlsx
S-LP2 S-LP2 MB_FGOR Uncertainty_2186.xlsx
S-LP3 S-LP3 MB_FGOR Uncertainty_2103.xlsx
S-LP3 S-LP3 MB_FGOR Uncertainty_2186.xlsx
Winter Three-Pressure Tests
W-HP1 W-HP1 MB_FGOR Uncertainty_2103.xlsx
W-HP1 W-HP1 MB_FGOR Uncertainty_2186.xlsx
W-HP3 W-HP3 MB_FGOR Uncertainty_2103.xlsx
W-HP3 W-HP3 MB_FGOR Uncertainty_2186.xlsx
W-HP4 W-HP4 MB_FGOR Uncertainty_2103.xlsx
W-HP4 W-HP4 MB_FGOR Uncertainty_2186.xlsx
W-MP1 W-MP1 MB_FGOR Uncertainty_2103.xlsx
W-MP1 W-MP1 MB_FGOR Uncertainty_2186.xlsx
W-MP2 W-MP2 MB_FGOR Uncertainty_2103.xlsx
W-MP2 W-MP2 MB_FGOR Uncertainty_2186.xlsx
W-MP3 W-MP3 MB_FGOR Uncertainty_2103.xlsx
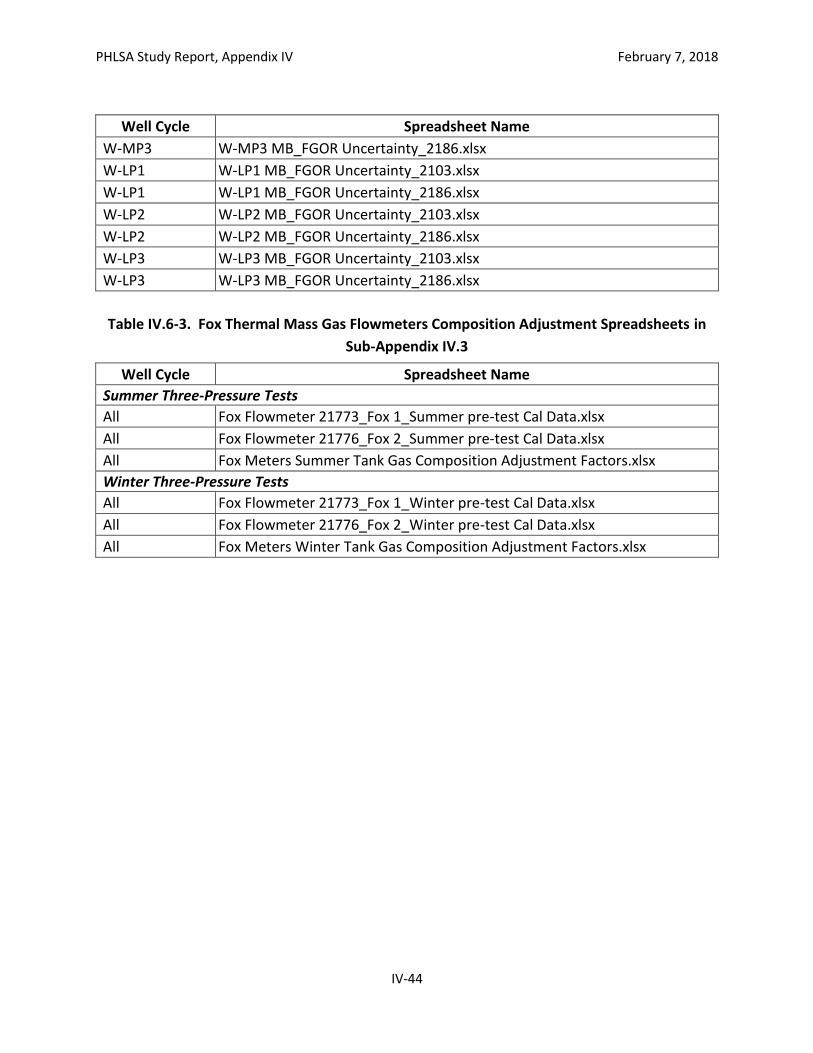
PHLSA Study Report, Appendix IV February 7, 2018
IV-44
Well Cycle Spreadsheet Name
W-MP3 W-MP3 MB_FGOR Uncertainty_2186.xlsx
W-LP1 W-LP1 MB_FGOR Uncertainty_2103.xlsx
W-LP1 W-LP1 MB_FGOR Uncertainty_2186.xlsx
W-LP2 W-LP2 MB_FGOR Uncertainty_2103.xlsx
W-LP2 W-LP2 MB_FGOR Uncertainty_2186.xlsx
W-LP3 W-LP3 MB_FGOR Uncertainty_2103.xlsx
W-LP3 W-LP3 MB_FGOR Uncertainty_2186.xlsx
Table IV.6-3. Fox Thermal Mass Gas Flowmeters Composition Adjustment Spreadsheets in
Sub-Appendix IV.3
Well Cycle Spreadsheet Name
Summer Three-Pressure Tests
All Fox Flowmeter 21773_Fox 1_Summer pre-test Cal Data.xlsx
All Fox Flowmeter 21776_Fox 2_Summer pre-test Cal Data.xlsx
All Fox Meters Summer Tank Gas Composition Adjustment Factors.xlsx
Winter Three-Pressure Tests
All Fox Flowmeter 21773_Fox 1_Winter pre-test Cal Data.xlsx
All Fox Flowmeter 21776_Fox 2_Winter pre-test Cal Data.xlsx
All Fox Meters Winter Tank Gas Composition Adjustment Factors.xlsx