philosop~...the transient mass flow through a given orifice, and the corresponding discharge...
TRANSCRIPT

MAR 2 5 1969
TRANSIENT EFFECTS IN THE DISCHAJ\GE OF COMPRESSED AIR
FROM A CYLINDER THROUGH AN ORIFICE
A Thesis
Submitted to the Faculty of Graduate Studies
in Partial Fulfilment of the Requirements
for the Degree of
Doctor of Philosop~
in the Department of Mechanical Engineering
University of Saskatchewan
by
Yung Fen Chang
Saskatoon, Saskatchewan
May, 1968
Copyright Yung Fen Chang 1968
423984
The author has agreed that the Libra~, University of Saskatchewan, may make this thesis freely available for inspection. Moreover, the author has agreed that permission for extensive copying of this thesis for scholarly purposes may be granted by the professor or professors who supervized the thesis work recorded herein or, in their absence, by the Head of the Department or the Dean of the College in which the thesis work was done. It is understood that due recognition will be given to the author of this thesis and to the University of Saskatchewan in any use of material in this thesis. Copying or publication or any other use of the thesis for financial gain without approval by the University of Saskatchewan and the author's written permission is prohibited.
Requests for permission to copy or to make other use of material in this thesis in whole or in part should be addressed to:
Head of the Department of Mechanical Engineering
University of Saskatchewan
SASKATOON, Canada
,.
TRANSIENT EFFECT IN THE DISCHfillGE OF COHPRESSED AIR FROM
A CYLINDER THROUGH AN ORIFICE
Yung Fen Chang
SYNOPSIS
The thesis describes the expansion process in a cylinder
and the accompanying transient flow through an orifice when com
pressed air is discharged from the cylinder. The orifice which is
located at one end of the cylinder is small enough to prevent the
development of significant wave action.
The aim of the investigation is to study the behaviour of
flows through circular orifices under transient upstream conditions
and to compare such flows with those through similar orifices under
steady state conditions.
A critical review of previous work is included from which
it is evident that further experimental work is necessary both for
a better understanding of the nature of transient flow and to obtain
results of practical value. The experiments in the present investi
gation have been designed from-dimensional considerations. The main
conclusions that have been made are as follows:
The expansion of the air in the cylinder is not reversible.
Gradients of temperature in the radial and axial directions are
quickly established after the commencement of discharge and heat is
transferred from the cylinder wall to the residual air. In practice
it is impossible to achieve a truly adiabatic wall.
An experimental correlation between the pressure and
weighted average temperature of the air in the cylinder during ex
pansion has been obtained. This relationship can be used to predict
the transient average temperature of the air from the instantaneous
pressure in the cylinder.
iii

The transient mass flow through a given orifice, and the
corresponding discharge coefficient, have been found to be functions
of the length-diameter ratio of the orifice, the pressure ratio
across it and the heat transferred to the residual air. The latter
involves a consideration of the temporal sequence of the discharge
which makes it impossible to obtain general statements about
transient flows.
From dimensional considerations, and from experiments, it
has been possible to obtain hypothetical transient mass flows with
out heat transfer. These flows are consistently lower than those
under steady state conditions when geometrical and physical
similarity is preserved.
Heat transfer to the residual air in the cylinder during
discharge increases the instantaneous mass flow through the orifice.
Its effect on the mass flow may be quite pronounced for relatively
slow discharges.
The effect on the transient mass flow of the length
diameter ratio of an orifice has been found to be similar to that
for steady state conditions.
iv
ACKNOWLEDGEMENTS
The work reported in this thesis was supervised by Dr.
B.E.L. Deckker to whom the author wishes to express his thanks for
his valuable advice and encouragement throughout the course of the
investigation and in the preparation of the thesis. His constant
interest in the work is also highly appreciated.
Thanks are also due l"ir. A. Dixon for his help with some
of the electronic equipment and to Mr. G.N. Rice for his assist
ance in the laboratory.
This project was supported b.1 the National Research
Council of Canada under Grant No. A-1618. Grateful acknowledgement
is also due the National Research Council of Canada for financial
support in the form of a Scholarship.
The author also wishes to record his thanks to the
University of Saskatchewan for the provision of laboratory and
computation facilities.
v
TABLE OF CONTENTS
Pa~
SYNOPSIS iii
ACKNOWLEDGEMENTS v
TABLE OF CONTENTS vi
LIST OF TABLES x
LIST OF ILLUSTRATIONS AND FIGURES xi
LIST OF SYMBOLS xiv
1. INTRODUCTION 1
1.1 Nature and Scope of the Work 1
1.2 Statement of the Problem 3
1.3 Brief Description of the Investigation 4
2. REVIEW OF PREVIOUS WORK 6
2.1 Introduction 6
2.2 The Expansion of Gas in a Vessel During Discharge 6
2.2.1 The therm~amic nature of expansion
process 6
2.2.2 Prediction of pressure in the cylinder
during discharge 11
2.3 Transient Flow Through an Orifice 13
2.3.1 Flow through an orifice in the absence
of wave action in the cylinder 13
2.3.2 Flow through an orifice due to passage of
a pressure-wave 16
2.3.3 Pulsating flow through an orifice 18
3. DESIGN AND DlMENSIONAL CONSIDERATIONS 22
vi

s.
TABLE OF CONTENTS (CONT'D)
3.1 Introduction
3.2 Expansion of Air in the Qylinder During Discharge
3.3 Transient Flow Through an Orifice
APPARATUS AND EXPERIMENTAL PROCEDURE
4.1 General Description of Apparatus
4.2 The Cylinder and Test Orifices
4.3 Experimental Procedure
TRANSIENT PRESSURE AND TEMPERATURE MEASUREMENTS
5.1 Pressure-Time Record
5.2 Transient Temperature Measurement
5.2.1 Introduction
5.2.2 Choice of the thermocouple
5.2.3 Design of thermocouple
5.2.4 Thermocouple error - Conduction and
Patm
22
22
26
32
32
32
41
44
44
44
44
48
IJ3
radiation ;o 5.2.; Determination of the time constant for the
thermocouple and the error due to con
vective heat transfer
5.3 Calibrations
5.4 Measurement of Transient Pressure and Temperature
Records
54
58
59
6. DISCUSSION OF RESULTS 61
6.1 The Expansion of Air in Cylinder During Discharge 61
6.1.1 Pressure distribution in the cylinder 61
vii
TABLE OF CONTENTS (CONT 1D)
Pa~
6.1.2 Temperature distribution in the cylinder 62
6.1.3 Weighted average temperature of the air
in cylinder during expansion
6.1.4 Pressure-temperature correlation and the
prediction of the temperature for the air
in the cylinder during discharge
66
68
6.1.5 Index of expansion 77
6.1.6 Effect of heat transfer on the pressure-
time relationship of the air in the
cylinder during discharge 82
6.2 Transient Flow Through Orifices 84
6.2.1 Introduction 84
6.2.2 Experimental considerations 87
6.2.3 Dependence of transient mass flow number
on the pressure ratio 90
6.2.4 Effect on the transient mass flow of heat
transfer to the air in the cylinder 97
6.2.5 Effect of length-diameter ratio of orifice
on the transient mass now number 100
6.2.6 The transient mass flow number 103
6.2.7 Remark on the hysteresis in transient flow
through orifices 106
6.2.8 Discussion of the error of the calculated
results 106
viii
a.
9.
TABLE OF CONTHITS (CONT 1D)
CONCLUSIONS
SUGGESTIONS OF FURTHER INVESTIGATION
LIST OF REFERENCES
Pa~
108
113
115
APP»{DIX A: Dimensional Analysis 120
APPN'IDIX B: The Mass Flow Numbers Through an Orifice 127
APPENDIX C: Some Typical Pressure-Time and Temperature-
Time Records During Discharge from Cylinder 135
ix
LIST OF TABLES
Table Pa~
1. Leading Dimensions of Test Orifices 39
2. Coefficients for Equations of Pressure-
Temperature Correlation 76
A-1 Theoretical Mass Flow Number 131
A-2 Mass Flow Number from Steady Flow Experiments 132
A-3 Transient Isentropic Mass Flow Number 133
A-4 Ratio of Transient Mass Flow Number to
Transient Isentropic Mass Flow Number 134
X

Fi~
4.1
4.2
4·3
5.1
5.2(a-c)
5.2(d-f)
5.6
6.1
6.2
LIST OF ILLUSTRATIONS ~~D FIG~S
Photograph of apparatus
Schematic layout of apparatus
Cross-sectional view of cylinder and test
orifice
Geometr,y of test orifices
Diaphragm cutter and orifice mounting flange
Early apparatus using shock-operated cut-off
valve
Installation of pressure transducer
Typical pressure and temperature records
measured at radial position, r, in the cylinder
Typical pressure and temperature records
b~
33
34
40
45
measured at radial position, r, in the cylinder 47
Temperature-electromotive force relationsip for
thermocouple materials 49
Arrangement of miniature thermocouple 51
Apparatus for determination of the time constant
for thermocouple
Micrometer device for the measurement of pressure
and temperature record 60
Typical pressure-temperature, relationships of the
air at six radial positions in cylinder during
discharge 64
Average pressure-temperature relationships of the
air in three axial planes and of the air in the
xi
Figure
6.6
6.7
6.8
6.9
LIST OF ILLUSTRATIONS AND FIGURES (CONT 1Q2
cylinder
Pressure and weighted average temperature of the
residual air in cylinder during discharge for a
given initial pressure
Average pressure and temperature correlation of
the air in cylinder during discharge
Straight line transformation of the temperature
correlation for discharges
Straight line transformation of the temperature
correlation for early stage.s of discharge
Comparison of predicted temperature in cylinder
during discharge with experimental values
Variation of the index of expansion
Comparison of temperatures calculated using
constant indices of expansion with experimental
values
6.10 Pressure-time relationships for discharges with
6.11
6.12
different rates of heat transfer to the residual
air in the cylinder
(a) No heat during discharge
(b) Heat added from the commencement of discharge
(c) Heat added for some time before discharge
Effect of pressure ratio, p /p (1/d = 2.0) a o
Effect of pressure ratio, pa/p0
(1/d = 1.5)
xii
67
70
72
74
75
78
81
83
85
91
92
6.13
6.14
6.15
LIST OF ILLUSTRATIONS &~ FIGURES (CONT'D)
Effect of pressure ratio, p /p (1/d = 1.0) a: 0
Effect of pressure ratio, p /p (1/d = 0.5) a o
Effect of pressure ratio, p /p (sharp-edge a o
orifices)
93
94
95
6.16 Effect of heat transfer to the residual air
on discharge 98
6.17 Effect of length-diameter ratio of orifice on
the transient mass flow through an orifice 102
6.18 Carpet diagram showing the variation of transient
mass flow number through sharp-edge orifices
with p /p , and Z for different initial pressures 104 a o
6.19 Carpet diagram showing the variation of transient
A-1
mass flow number through thick orifices with
p /p , and Z for an initial pressure of 60 psig. 105 a o
Pressure and Temperature Records
xiii
a, b, c, and d
cd
D
d
G
h
k
L
1
M
M a • m
N
p
R
Re
T
T s
LIST OF SYMBOLS
Constant coefficient
Discharge coefficient (~ m/mtheo' from same upstream conditions)
Diameter of cylinder
Diameter of orifice
Mass flow number (= (m 'kRT0)/(p
0d
2))
Roughness of flow passage
Ratio of specific heats (Cp/Cv)
Length of cylinder
Length of orifice
l'tlach number
Mass of residual air in cylinder
Mass flow rate
Bulk modulus
Pressure
Characteristic gas constant
Reynolds number
Temperature
Temperature of residual air corresponding
to isentropic expansion
t Time
t Thermocouple time constant c
V Volume of cylinder
v Mean velocity at orifice
X Dimensionless group (= 1/(Z- 0.04))
Y Dimensionless group (= x2)
xiv
z
LIST OF SYMBOLS (CONT 1D)
Dimensionless group (= 1/(p /p )(t/;)t) a o
Coefficient of viscosity
Density
Characteristic time(= L/V kRT') 00
Subscripts:
0 Stagnation condition
00 Initial condition
a Atmospheric condition
s Steady flow
t Transient flow
ts Isentropic transient now
XV
1. INTRODUCTION
1.1 Nature and Scope of the Work
The transient flow of a compressible fluid through an
orifice when the pressure and temperature upstream of the orifice
change with time occurs in many processes in mechanical engineering.
The rapid ·and efficient evacuation of burned gas from the cylinder
of an internal combustion engine, and the associated problem of port
design, and the measurement of pulsating flow are two examples which
appear to be of continuing interest to· mechanical engineers.
For over a century, the flow of a compressible fluid through an
orifice, or a nozzle, under steady conditions has been studied
intensively both experimentally and theoretically. The study of
compressible flow under transient upstream conditions has a more
recent history and has been accelerated by the development of high
speed reciprocating internal combustion engines. It is only since
1949 that many details of the transient flows that occur in the air
exchange process in high speed internal combustion engine have been
revealed by analyses using the method of eharacteristies(l)( 2 )~ How-
ever, considering the discharge process alone, agreement between the
integrated mass flow obtained from the results of such an analysis
and that calculated from the initial and final thermodynamic states
of the gas in the cylinder has been unsatisfactory( 2). It is
believed that the reason for this discrepancy is the lack of suitable
values of the discharge coefficient for the exhaust ports. Unlike a
* Numbers in brackets refer to references listed on page 115.
1.

2.
steady flow through an orifice, or port, a transient flow depends not
only on the instantaneous upstream conditions but also on the previous
history of the flow. This factor has not been considered by previous
investigators although it is clear that changing upstream conditions
involve a thermodynamic process which is associated with the passage
of time. Experimental approaches to the problem of transient flow
have been mainly concerned with correctly evaluating the area of the
engine ports and, since the flow conditions are always complex, such
treatments can hardly be expected to clarify the physical aspects
associated with transient flows.
To the knowledge of the author, it is impossible in an
analytical treatment to take account of all the factors that might
affect a transient flow under the conditions prevailing during a
practical discharge process. Even in the relatively simple case of
steady flow through an orifice, mathematical, or semi-empirical,
solutions which have been obtained for either one or two dimensional
compressible flows(3)(4)(5) are applicable only to sharp edge
orifices(6 ). No analytical treatment has yet been proposed which
can take into account the geometry of the orifice or the effects
of entrainment downstream. The accurate measurement of steady flow,
therefore, still relies on empirical formulae such as those specified
in National Codes. The purpose of the investigation reported in this
thesis is to systematically study the behaviour of relatively slow
transient flows under controlled experimental conditions. It is
believed that data obtained in this way will help towards an under-
standing of the more difficult problem of pulsating flow.
1.2 statement of the Problem
The term 'slow transient' flow as used in the preceding
paragraph is intended to distinguish such a flow from a transient
flow in which pronounced wave action during discharge generates an
appreciable bulk velocity of the gas in the cylinder towards the
orifice, and which gives rise to a nonuniformity in the thermo
dynamic state in the cylinder. Wave action occurs when the diameter
of the orifice is relatively large and when the contents of a
cylinder are suddenly released. For a long cylinder, the flow, as
a result of wave action, m~ be treated as a succession of quasi
steady flows. A slow transient flow through an orifice applies
specifically to a discharge process in which the cylinder contents
ana suddenly released but no finite amplitude waves are generated so
that the approach velocity of the gas towards the orifice is
negligible. In such a case any nonuniformity in the pressure of
the gas cannot be detected anywhere in the cylinder, except in a
narrow region near the orifice where the flow is accelerated to
comply with the bound~ conditions associated with the orifice.
Thus, the contents of the cylinder m~ be considered to be in a
state of virtual stagnation. These conditions are encountered in an
orifice-cylinder configuration in which the ratio of the orifice
area to that of the cylinder cross-section normal to the axis of the
orifice is made small enough. Therefore, the discharge of gas from
the cylinder may be considered, for practical purposes, to be a free
expansion and changes in the thermodynamic state of the gas in the
cylinder occur in a smooth and continuous manner.

Although wave action in the cylinder must be regarded as
the mechanism qy which the pressure of the gas in the cylinder is
reduced both in the case of a fast transient and in the case of a
slow transient discharge, it is clearly incorrect to treat the latter
as a quasi-steady process. However, at ~ instant during discharge,
similarity of the stagnation pressure, the stagnation temperature
and the local acceleration of the flow near the upstream face of the
orifice provide a basis for comparison between the instantaneous
upstream conditions in a transient flow and those found in a steady
flow through a geometrically similar orifice. Although it is not
certain that for given values of the stagnation pressure and
temperature in the cylinder there is dynamic similarity between the
two flows through the orifice, the arguments presented in reference
(6) lead to the conclusion that the state of virtual stagnation and
equality of the pressure are sufficient to compare transient and
steady flows. It is on this basis that the transient effects may
be determined.
1.3 Brief Descri~tion of the Investigation
Instead of a complex engine configuration, a cylinder is
used as an expansion chamber and compressed air is discharged to the
atmosphere through an orifice mounted co-axially at one end. At a
given instant the actual flow through the test orifice is calculated
from a mass balance of the residual air in the cylinder. For this
reason, it is important to establish the thermodynamic state of the
residual air at every instant during the expansion process.
In the course of the present investigation, it has beea

s.
found that the assumption of isentropic expansion which is usually
made in discharge calculations is not generally valid. Although
the inner surface of the cylinder was insulated from the air in
the cylinder, heat transfer to the air during expansion indicates
that, for a practical cylinder configuration, it would be im
possible to achieve an adiabatic wall. From the measurement of
the temperature of the residual air during the expansion, an
empirical correlation between the weighted average temperature and
the pressure of the gas in the cylinder has been obtained. The
temperature predicted b,y this correlation at any instant during a
discharge has been found to be satisfactory for all the experiments.
Using dimensional arguments, fluid dynamical effects and
the effects of heat transfer to the residual air on the flow through
an orifice have been examined both together and separately. For a
given orifice the overall discharge coefficient has been found to
be different from that of a steady flow. Further, more detailed,
investigationsinto the effect of the starting process of the dis
charge and the adjustment of the flow pattern in the orifice to
changes in the upstream conditions appear to be worthwhile.
2. REVIEW OF PREVIOUS WORK
2.1 Introduction
In order to place the present study of slow transient flows
through orifices in its eorrect perspective, it is necessar.y to review
the previous contributions which relate either directly or indirectly
to it.
When a compressed gas is discharged from a cylinder through
an orifice, the expansion of the gas in the cylinder is of direct
interest since a precise knowledge of the thermodynamic properties
of the gas in the cylinder at any instant is necessary for calculating
the transient mass flow through the orifice. Although the present
investigation is confined only to those discharges in which wave
action in the cylinder is negligible, nevertheless, with further
investigations into transient flows in view, published ~rk dealing
with expansion processes which are accompanied by the discharge of a
gas from a vessel both with and without wave action has been reviewed.
For the same reason, a review of the literature on transient flows
through orifices includes not only transient flows associated with a
relatively slow discharge but also those flows in which wave action
is present upstream of the orifice.
2.2 The Expansion of Gas in a Vessel During Dischar~
2.2.1 The thermodynamic nature of the expansion process
Perhaps the earliest experimental investigation into the
thermodynamic behaviour of a gas in a vessel during expansion was
6.
7.
that of Clement and Desormes (1819)(7) for the determination of the
ratio or the two specific heats, c~cv, or the index or isentropic
expansion, k. Later, Gay-Lus sac and Welter ( 7 ) modified Clement' s and
Desormes' experiment by changing the compression process into an
expansion. In the modified experiment, a small quantity of gas at
room temperature and at a pressure, p., slightly greater than the l.
atmospheric pressure, pa' was allowed to expand from a vessel during
the rapid opening and closing of a stopcock. Under this condition,
the expansion of the gas in the vessel was regarded as reversible and
adiabatic. After the expansion, the gas remaining in the vessel was
allowed to attain its initial temperature at constant volume by" the
transfer of heat from the atmosphere through the vessel, the final
pressure being pf. The index of isentropic expansion was calculated
from the relationship:
ln(pi/pa) k = ln(pi/pf) •
Some years later, Lummer and Pringsheim ( 7) carried out an
experiment in which the change of temperature of the gas during
expansion was measured. Partington ( 8 ) modified their temperature
measurement technique and obtained values of the specific heat ratio,
k, more accurately, using the relationship:
Both in the original experiment of Clement and Desormes
and in the subsequent modifications, the important feature was the
small initial pressure difference across the orifice and, therefore,
the small amount of gas which flowed out of the vessel. The small
8.
initial difference which resulted in an expansion of short duration
was designed to obtain a good approximation to an adiabatic process.
Also, since the kinetic energy of the gas leaving the vessel was a
ver.y small fraction of the initial internal energy of the gas, any
error due to irreversibility was minimised.
There is little information on the expansion of a com-
pressible fluid in a practical discharge process in which the initial
pressure difference across the orifice, or port, is high. Weaving(9 )
carried out experiments which simulated the discharge of gas from
an engine cylinder. To determine the index of expansion, he used a
method of calculation similar to that of Clement and Desormes
substituting the values of three pressures obtained b,y measurement,
thus:
ln(p.)- ln(p. ) 1. m1.n
where pi and pf are the initial and final pressures in the cylinder
and p . is the minimum pressure at the end of discharge. Weaving m1.n
found that value of the index of expansion was always lower than the
ratio of the two specific heats for the different gases used in his
experiments. In explaining this result, he stated that the principal
factors which contributed to the low values of the index of expansion
were the heat transfer b,y forced convection from the cylinder wall to
the gas during expansion, and the degeneration of energy qy tur-
bulence, particularly towards the end of the discharge.
Using Weaving's experimental data for air, Cole(lO)
calculated the rate of heat transfer to the air for the duration of

9.
the discharge. By comparing the calculated rate of heat transfer
with the estimated rate for a two-stroke cycle engine of the same
cylinder capacity under full load conditions, he concluded that
Weaving's value of the index of expansion,equal to 1.25,was too low.
Weaving's conclusions regarding the values of the index
of expansion were criticized also b.r Kestin and Glass(ll). They
pointed out that Weaving assumed the expansion of the gas in the
cylinder was polytropic, which implied that the process was
reversible. Therefore, his explanation that the reduction of the
value of the index of expansion was due to the degeneration of
kinetic energy by turbulence was a contradiction.
In an analysis of the time of discharge, Geyer(l2) also
assumed that the expansion of the gas in the cylinder during dis
charge was polytropic. He assumed that heat would be transferred
from the cylinder wall to the gas, since a high temperature
difference would be created during the expansion. He accordingly
chose a value of the index of expansion which was considerably
lower than the ratio of the two specific heats. However, neither
Weaving's nor Geyer's assumption has been confirmed experimentally,
such as the measurement of the temperature of the gas in the
cylinder during expansion.
Potter and Brown(l3) were the first to measure the trans-
ient temperature of a gas in a vessel during expansion. In their
experiments, Argon, Nitrogen and Carbon dioxide were discharged
from a spherical vessel into the atmosphere through an orifice.
Using a number of thermocouples arranged in the form of a 'tree' on
10.
the vertical axis of symmetry in the spherical vessel, they measured
the transient temperature during expansion. Only average values of
the temperatures measured were presented in their report. They-
observed that the average temperature departed from that correspond
ing to an isentropic expansion, and they attributed this difference
to radiation heat transfer from the wall of the vessel to the thermo-
couples. However, when vessels with different radiative properties
were used they found that the thermocouple radiation errors were
very small so that their earlier explanation for the differences
between the measured temperatures and the isentropic values was not
correct.
Some years later, Potter and Levy(l4) measured the trans-
ient temperature at four positions on the axis of a cylinder from
which air was discharged to the atmosphere through a relatively
small orifice. In their experiments, only small differences in
temperature at the four positions were found. However, about ten
seconds after the commencement of the discharge, the temperature
reached a minimum and then increased, while the pressure in the
cylinder continued to fall. They believed that this behaviour was
due to heat transfer b.1 convection from the wall to the air during
expansion. Differences between the measured temperatures and the
isentropic values corresponding to a given expansion ratio were
expressed in the form, liT/!:::.T , where flT is the actual temperature s
drop at any instant after the commencement of the discharge and
!:::.T is the corresponding temperature drop for an isentropic exs
pansion to the same pressure. Their results were in general
11.
agreement with those found earlier by Potter and Brown(l3). Potter
and Lev,y apparently did not measure the radial temperature gradient
in the cylinder during expansion. They assumed the temperature
distribution to be uniform, presumably because they found no
appreciable differences of temperature in the four axial positions.
The average value of the temperature at these four positions was,
therefore, taken to be the temperature of the air in the cylinder.
In spite of the conclusion reached by Weaving that the
expansion in a cylinder during discharge was diabatic(9), in the
case of discharge from an engine cylinder it is customar,y to assume
that the expansion of the gas in the cylinder is isentropic(lS)(l6)
(17) (18) However, to the knowledge of the author no measurements
to confirm this assumption have been reported.
2.2.2 Prediction of pressure in the cylinder during discharge
A number of investigators have predicted the pressure-
time relationship in a cylinder during a rapid discharge. The ex-
pansion of the gas in the vessel was always assumed to be isentropic.
Giffen(l9) analysed the discharge of a compressed gas from
a cylinder directly to the atmosphere through an orifice mounted
coaxially at one end. He applied the one-dimensional pressure-wave
theory due to Earnshaw( 20) to the gas in the cylinder and the quasi
steady one-dimensional equation of St. Venant and Wantzel(2l) to the
flow through the orifice. From these equations he predicted the
rate of fall of pressure of the gas in the cylinder and was also able
to account for the pressure in the cylinder being less than that of
the atmosphere near the end of discharge. Giffen' s analysis was the

12.
first to reveal the role o£ wave action in the evacuation of a
cylinder. Later, a more detailed theoretical and experimental
analysis of wave action and of the vacuum found in a cylinder was
given by Bannister and Mucklow(22}. In their analysis, they
considered the discharge from a cylinder directly to the atmosphere,
and also into a pipe of the same diameter as that of the cylinder.
The predicted pressures and those measured have been found to be in
good agreement. The results of Bannister and Mucklow may be con-
sidered to be exact since there was no need to make ~ assumption
concerning the value of discharge coefficient.
Deckker( 2) predicted the pressure-time curve in the
cylinder of a motored engine on the assumption that the expansion
was isentropic and taking into account the effect of wave motion in
the exhaust and induction pipe systems as determined by the method
of characteristics. In his experiments, the release pressure was
boosted to a value comparable to that in a running engine. He used
the discharge coefficients derived by t~allace and lfttchell (lS) and
obtained good agreement between the theoretical pressure-time
curve and the indicator diagram. Benson(2J)(24 ) used the method of
characteristics to analyse the discharge from a cylinder under
conditions similar to those treated by Giffen(l9). In this
investigation a constant discharge coefficient was assumed.
The prediction of the pressure in a cylinder during dis-
charge cannot by itself be expected to reveal the nature of the
expansion process. For discharge through an orifice, or port, whose
area is smaller than that of the cylinder, the pressures obtained
lJ.
analytically by using either a constant or a variable coefficient of
discharge and those measured,would likely be in agreement with the
indicator diagram for the cylinder. For example, Deckker(2) found
that, in spite of the agreement between the predicted and measured
values of the pressure in the cylinder, the integrated mass dis-
charged obtained from his analysis was substantially different from
that calculated from the initial and final thermodynamic states of
the gas and the volume of the cylinder. It would appear, therefore,
that the pressure in the cylinder is not a sensitive enough index
of the correctness of the values of the discharge coefficient used
in the calculations. It should also be noted that, in view of
Weaving's(9) results, although these were not conclusive, the
assumption of polytropic expansion in the cylinder may be open to
doubt. It is certain that for a discharge occupying a longer time
than that from an engine cylinde~the assumption of isentropic
expansion would not be valid because of irreversible transfer of
heat between the gas and the cylinder wall.
2.3 Transient Flow Through an Orifice
2.3.1 Flow through an orifice in the absence of wave action in
the cylinder
There is little published work that can be said to be
directly related to the aims of the present investigation of trans-
ient flow through an orifice.
In Weaving's(9) experiments simulating the discharge from
an engine cylinder, wave action was not observed and values of the

discharge coefficient for the port were obtained from the condition
that the pressure in the cylinder decreased smoothly. It was
unfortunate, for the reasons stated in the previous section, that
his method of determination of the index of expansion was open to
doubt. From the results of his experiments Weaving also deduced
that the discharge coefficients were constants, although as he has
stated (page 105 of reference 9), he was aware that in a steady
flow, the discharge coefficient of an orifice varied with the
pressure ratio across the orifice. While an overall average dis-
charge coefficient may be relevant in the case of port design, it
is of no value in the present study.
Wallace and Mitchell (l5) obtained values of discharge
coefficients from pressure measurements in the cylinder and in the
exhaust pipes during the discharge of air from the ported cylinder
of an opposed-piston engine. The cylinder had a ring of rhomboidal-
shaped ports which were connected symmetrically to two exhaust pipes
by means of a belt. The calculation of the mass flow through the
ports was based on the smoothed pressure-time curves for the ex-
pansion in the cylinder, the consideration of wave motion in the
exhaust pipes, and quasi-steady flow from the cylinder to the
exhaust pipes through the restriction caused by the port. The
expansion of the air in the cylinder was assumed to be adiabatic and
reversible. In order to extend their results to other gases at high
temperatures, as would be found in a firing engine, they introduced
a 'modified' Reynolds number based on the acoustic velocity in the
cylinder. In this way, they were able to present their experimental
15.
results as a function of the pressure ratiq across the ports, the
height of the opened ports and the temperature of the gas in the
cylinder.
Considering the conventional definition of the discharge
coefficient, it is not clear why Wallace and Hitchell sought to
obtain a dependence of the coefficient on the temperature of the gas
in the cylinder. Further, the smoothed pressure curve in the
cylinder derived by them was based on a one-dimensional model in
which a port was located coaxially at the end of the cylinder. The
configuration of the ported cylinder used in their experiments was,
however, much more complicated.
Benson(l6) applied the method of characteristics to the
discharge process of an idealised engine cylinder, that is a cylinder
with a port at one end, and claimed a high degree of accuracy for the
prediction of the pressure in the cylinder. He also showed that the
approach velocity towards the orifice was small. Therefore, in
calculating the discharge under dynamic, or engine condi tiona, wave
action in the cylinder was neglected. In Benson's experiments,
dynamic discharge coefficients were obtained from the analysis of
the indicator diagram of a motored engine cylinder under the assumpt-
ion that the air in the cylinder expanded isentropically. The
dynamic values were compared with those obtained from steady flow
tests in which air was passed through the cylinder of the engine and
the exhaust ports. In a communication, Deckker(25 ) pointed out that
the accuracy of the prediction of the pressure in the cylinder
during discharge depended on the use of the correct values of dis-
charge coefficient and these were not available. In fact, as it
16.
appeared later, in Benson 1 s analysis the coefficient had been taken
to be unity. Thus, it is clear that, within limits, the pressure
time relationship in the cylinder is insensitive to the value of the
discharge coefficient, and eannot be used as a check on the correct-
ness of the discharge coefficient. This observation applies equally
to the method adopted by Wallace and Mitchell ( 15) to calculate the
discharge coefficient. Deckker{25 ) also referred to the lack of
dynamical similarity in Benson's steady and dynamic tests. The
importance of dynamical similarity in comparing steady and unsteady
flows has been discussed by Deckker( 26 ) in a recent paper.
It may be noted that the published work ia this area is
concerned usually with the average value of the discharge coefficient
for the purpose of port design. No attempt has been made to analyse
the behaviour of the flow or the effects of the independent variables
on the transient flow through the port, or orifice.
2.3.2 Flow through an orifice due to the passage of a pressure-wave
The application of the method of characteristics to the
solution of problems involving a non-steady flow in a duct is now
well established. B,y this method one can determine either graphi-
cally or numerically the state and motion of the gas, and the
propagation of the pressure waves in a duct, when the initial a.D.d
boundar.y conditions are given. The flow behind the front of the
wave is usually considered to be steady so that ste~ flow boundar,y
conditions, which in many cases can easily be found analytically,
are used in the method of characteristics.
The boundary condition is usually assumed to be established
17.
immediately after the arrival of a wave front at the section
considered. However, Rudinger( 2?) has found that at the open end
of a duct steady conditions were established only some time after
the arrival of the incident wave, provided the wave was of suffic-
iently long duration. He derived an expression for the time-lag
required for a flow to become adjusted to the steady state and
verified his predicted values experimentally. Later, Rudinger(2S)
used the expression for the time-lag to modify the boundar.y con-
ditions for an orifice located at the end of a circular duct and
analysed the reflection process when a pressure wave was incident
at the orifice. This 'relaxation' time, which is required when
conditions change rapidly, is an interesting concept. It may account
for the differences that have been observed between steady and trans-
ient flows through an orifice, since in the latter, conditions up-
stream of the orifice are changing continuously.
Recently, Trengrouse, Imrie and }la.le (29 ) used a shock tube
to examine the discharge coefficient for an orifice located at the
end of the tube. They compared their results with steady flow
values obtained by the method of flow measurement prescribed in the
British Standard Code(30). Their steady flow tests were carried out
using the same diameter ratio for the orifice-pipe configuration and
for the same pressure ratios across the orifice as in the shock tube
experiments. The differences found by them in the two cases may be
a result of neglecting equality of the approach velocity, which, from
the point of view of dynamical similarity, is more important than the
diameter ratio. In fact, as had been pointed out by Rudinger(3l),

18.
the losses determined by the shock tube technique are steady flow
values.
2.3.3 Pulsating flow through an orifice
The problem of pulsating flow has attracted the attention
of investigators for a long time. The main emphasis of much of the
earlier work has been on the use of orifices, particularly a sharp-
edged orifice, for the measurement of pulsating flows, since the
orifice meter is a convenient and economical method of flow
measurement.
An extensive review of published work on the measurement
of pulsating incompressible and compressible flows prior to 1955
has been given by Oppenheim and Chilton (32 ). For the most part,
the earlier work was concerned with incompressible flows.
When an orifice meter is used in the measurement of
pulsating now, the general method of approach is to treat the flow
as being one-dimensional and quasi-steadT. Two approaches have
been made to improve the accuracy of the measurement. The first
method seeks to eliminate, or to reduce, the influences due to
pulsation in the measurement of flow. For example, 'critical
nozzle 1 flow and air box methods(33)(34) have been introduced for
this purpose. The second approach which, in general, is more
favoured by investigators is to obtain an overall correction factor
which m~ be applied to the results obtained from considerations of
one-dimensional steady flow. In order to do this, a limit must be
found for the amplitude and frequency of pulsation for which the
steady flow measuring technique can be used w:i thout serious error.
19.
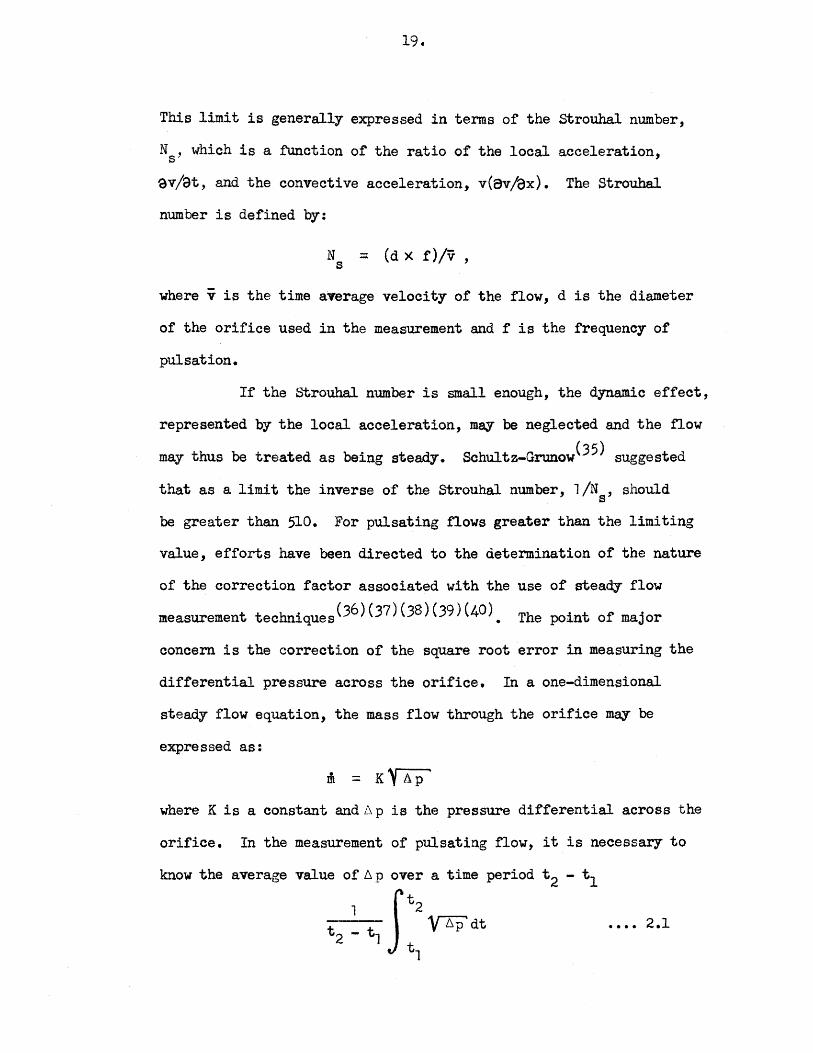
This limit is generally expressed in terms of the strouhal number,
N6
, which is a function of the ratio of the local acceleration,
av/at, and the convective acceleration, v(av)8x). The Strouhal
number is defined by:
N = (d X f)/V , s
where v is the time average velocity of the flow, d is the diameter
of the orifice used in the measurement and f is the frequency of
pulsation.
If the &"'trouhal number is small enough, the dynamic effect,
represented by the local acceleration, may be neglected and the flow
may thus be treated as being steady. Schultz-Grunow<35) suggested
that as a limit the inverse of the Strouha.l number, 1 /N , should s
be greater than 510. For pulsating flows greater than the limiting
value, efforts have been directed to the determination of the nature
of the correction factor associated with the use of stea~ flow
measurement techniques(36)(3?)(3S)(39)(40). The point of major
concern is the correction of the square root error in measuring the
differential pressure across the orifice. In a one-dimensional
steady flow equation, the mass flow through the orifice may be
expressed as:
m = KVhP"' where K is a constant and D. p is the pressure differential across the
orifice. In the measurement of pulsating flow, it is necessar,y to
know the average
•••• 2.1

20.
However, a damped manometer would indicate a value given b.1
J t2 t,p dt
t, •••• 2.2
The difference between the two averaged quantities in 2.1 and 2.2
is considered an important source of error in pulsating flow
measurement. Some attention has also been given to purely physical
aspects of pulsating flows, such as, the correlation of the Strouhal
number and the Reynolds number of the flow, and the form and
amplitude of the wave. Experimental aspects, such as the design of
the manometer and its attachments, the calibration of the manometer,
and the geometry and the arrangement of the metering orifice have
also been considered in some detail. However, in spite of the
effort in this field which is reflected in the large number of
published investigations, little agreement among investigators has
yet been reached (41) and no firm conclusions can be draw. about the
best method of measuring a compressible pulsating flow.
A theoretical approach to pulsating flow through an orifice
has been given by Hall(42) on the basis of the application of the
one-dimensional flow equations to instantaneous conditions. Baird
and Bechtold (43) introduced an electrical analogy for the orifice
metering problem. Earles and Zarek (44) have atte.mpted to relate the
results obtained from experiments on the passage of pressure waves
through an orifice to the correction factor for pulsating flow
measurement that had been determined by them in earlier experiments(JS).
Benson and El Shafie(45) used the one-dimensional quasi-steady flow
theory to predict wave action in the pipe-orifice configuration.

21.
It was claimed that this was a promising approach to the calculation
of instantaneous mass flows through an orifice under pulsating
conditions. The general validity of the statement is open to doubt
as the question of dynamical similarity is involved. Some
remarks on the validity of the application of the results of steady
flow experiments to transient flows have already been given. It
m~ be noted that neither a theoretical nor an experimental approach
has yet been developed which enables the accurate measurement of
pulsating flows to be made.
It is hoped that a more extensive study of slow transient
flows through an orifice along the lines undertaken in this thesis
will lead to a better understanding of the transient behaviour of
pulsating flows.
3. DESIGN Ae~D DIM]UfSIONA1 CONSIDERATIONS
3.1 Introduction
In the present state of art, analytical methods applied
to a transient flow through an orifice would yield solutions only
under simplifying assumptions. The results from such an analysis
would, therefore, have a limited usefulness, particularly since
the aim of the present investigation is to differentiate between
transient and steady flows. Because the relative importance of
the independent variables in the problem is not known, the omission
of ~ term for the sake of simplification is not justified. For
this reason it is necessar,y to rely on the analysis of data from
systematic experiments designed on the basis of dimensional
analysis. Although it is recognized that this method of analysis
is circumscribed by the ability of the experimenter to predict
·correctly the quantities that influence the problem, nevertheless,
it is felt that this approach would give a better insight into the
p~sical nature of the expansion in the cylinder and the transient
flow through the orifice.
3.2 Exp&~sion of Air in the Cylinder During Disch~~
The problem of the expansion of air in a cylinder during
discharge is a basic one in thermodynamics. However, as may be
inferred from the literature review, little information cambe found
about the nature of a practical expansion process during which heat
transfer between the gas and the cylinder occurs. It is impossible
22.
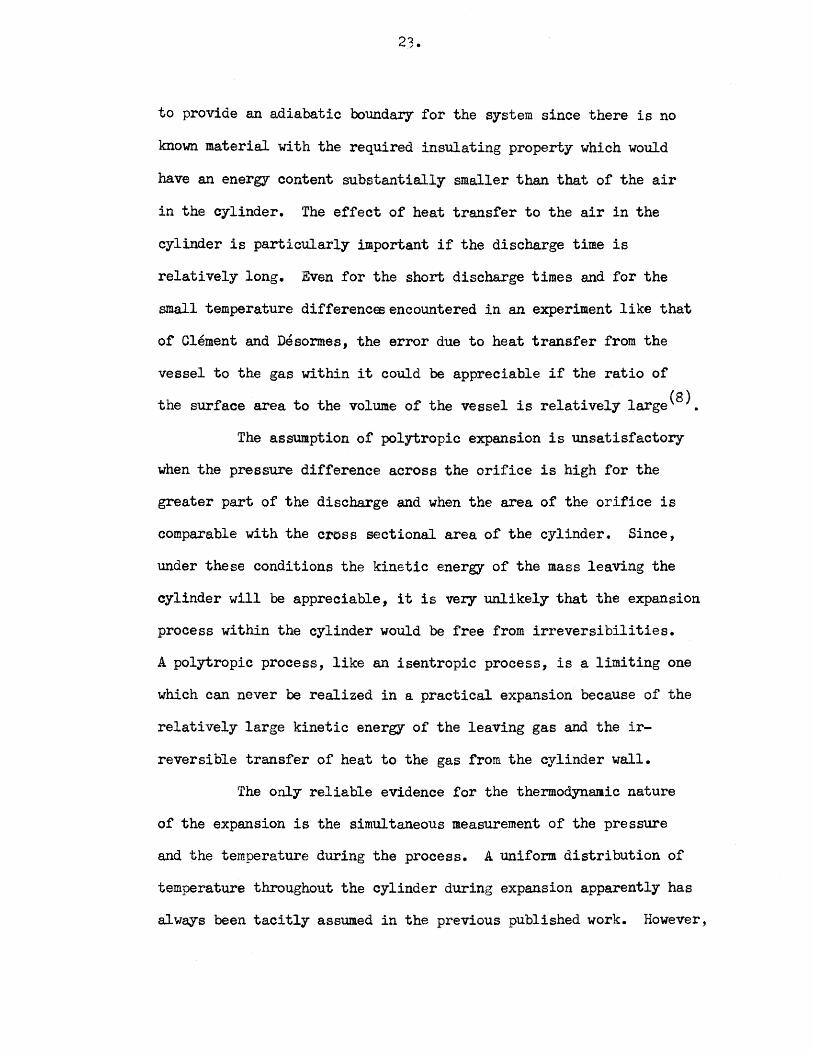
to provide an adiabatic boundar.y for the s.ystem since there is no
known material with the required insulating property which would
have an energy content substantially smaller than that of the air
in the cylinder. The effect of heat transfer to the air in the
cylinder is particularly important if the discharge time is
relatively long. Even for the short discharge times and for the
small temperature differences encountered in an experiment like that
of Clement and Desormes, the error due to heat transfer from the
vessel to the gas within it could be appreciable if the ratio of
the surface area to the volume of the vessel is relatively large(B).
The assumption of polytropic expansion is unsatisfactory
when the pressure difference across the orifice is high for the
greater part of the discharge and when the area of the orifice is
comparable with the cross sectional area of the cylinder. Since,
under these conditions the kinetic energy of the mass leaving the
cylinder will be appreciable, it is very unlikely that the expansion
process within the cylinder would be free from irreversibilities.
A polytropic process, like an isentropic process, is a limiting one
which can never be realized in a practical expansion because of the
relatively large kinetic energy of the leaving gas and the ir-
reversible transfer of heat to the gas from the cylinder wall.
The only reliable evidence for the thermodynamic nature
of the expansion is the simultaneous measurement of the pressure
and the temperature during the process. A uniform distribution of
temperature throughout the cylinder during expansion apparently has
alw~s been tacitly assumed in the previous published work. However,
24.
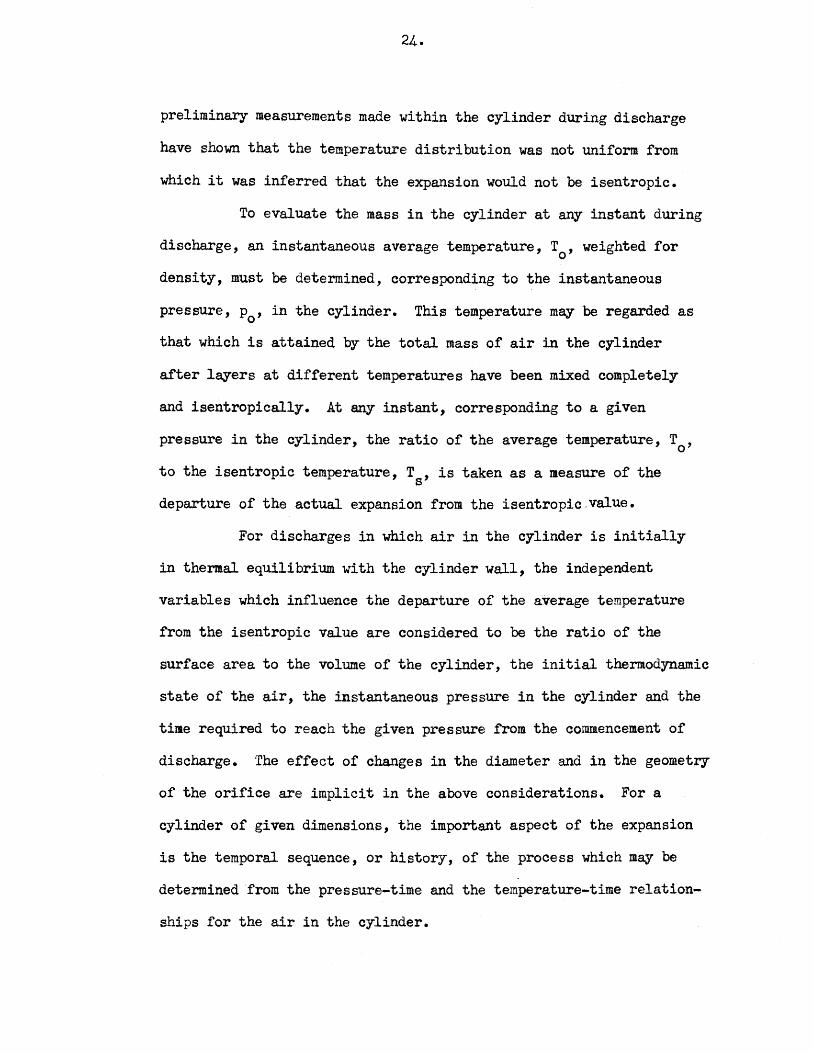
preliminar.y measurements made within the cylinder during discharge
have shown that the temperature distribution was not uniform from
which it was inferred that the expansion would not be isentropic.
To evaluate the mass in the cylinder at any instant during
discharge, an instantaneous average temperature, T , weighted for 0
density, must be determined, corresponding to the instantaneous
pressure, p0
, in the cylinder. This temperature m~ be regarded as
that which is attained by the total mass of air in the cylinder
after layers at different temperatures have been mixed completely
and isentropically. At any instant, corresponding to a given
pressure in the cylinder, the ratio of the average temperature, T0
,
to the isentropic temperature, T , is taken as a measure of the s
departure of the actual expansion from the isentropic . value.
For discharges in which air in the cylinder is initially
in thermal equilibrium with the cylinder wall, the independent
variables which influence the departure of the average temperature
from the isentropic value are considered to be the ratio of the
surface area to the volume of the cylinder, the initial thermodynamic
state of the air, the instantaneous pressure in the cylinder and the
time required to reach the given pressure from the commencement of
discharge. The effect of changes in the diameter and in the geometr,y
of the orifice are implicit in the above considerations. For a
cylinder of given dimensions, the important aspect of the expansion
is the temporal sequence, or history, of the process which may be
determined from the pressure-time and the temperature-time relation-
ships for the air in the cylinder.

25.
The quantities on which the departure of the actual
expansion from the isentropic one are considered to depend, are
listed with their dimensions as follows:
1 (L) length of the cylinder,
D (L) diameter of the cylinder,
Po (ML-lT-2) instantaneous pressure in the cylinder,
Poo (ML-lT-2) initial pressure in the cylinder,
T {Q) 00
initial temperature of the air in the
cylinder,
t (T) duration of the expansion from the
commencement of the discharge to the
instant considered,
R (L2T-2o-l) gas constant of the fluid under expansion,
N (ML-lT-2) bulk modulus of the fluid, and
Pa (ML-lT-2) atmospheric pressure.
The functional relationship may be written:
T /T = f 1(L, D, p , p , T , t, R, N, p ) o s o oo oo a
B.y applying Buckingham's Pi-Theorem {detail procedures are given in
Appendix A), a relationship between the relevant dimensionless groups
is obtained :
where 7' = L/V kRT ' is a characteristic time. Since L/D and N/p0
= k 00
are constant in the present experiments, the relationship is reduced
to:
•••• 3.1
26.
Equation 3.1 enables the effect of heat transfer from the cylinder
wall on the average thermodynamic state of the air in the cylinder
to be examined. The heat transferred cannot be evaluated in detail,
since the modes of heat transfer, the variation of the thermal
properties of the system and the transient temperature distribution
in the cylinder wall are not lmown. In any case, an investigation
involving these quantities is outside the scope of the present
study. Equation 3.1 serves as a basis for the design of experiments
for obtaining data required in the calculation of the residual mass
of air in the cylinder during the discharge.
3.3 Transient Flow Through an Orifice
This thesis is mainly concerned with the flow through a
circular orifice under the relatively slow transient conditions
generated b.Y the discharge of compressed air from a cylinder in
which wave action is negligible. Although the results of earlier
published work are reasonable, nevertheless, some of the assumpt
ions concerning the expansion process in the cylinder are open to
doubt and comparison between flows under steady and unsteady
conditions cannot be wholly justified because of the lack of
dynamical similarity. Intuitively, it is to be expected that flow
through an orifice under transient conditions will be different
from that in the steady state and this is also the general
conclusion that may be drawn from the work of other investigators.
However, from systematic experiments and by paying particular
attention to the requirements for dynamical similarity, it is hoped
that more definite conclusions can be drawn about the nature of
27.
transient flows. The impossibility of achieving absolute dynamical
similarity between the present experiments and those for the steaQy
state reported earlier(6) has already been the subject of some
comment. However, it is believed that overall similarity of the
flow pattern upstream of the orifice in the two sets of experiments
is an adequate basis of comparison between them.
The transient mass flow through an orifice is considered
to depend on the instantaneous conditions upstream of the orifice
and the pressure differential across the orifice, except when the
orifice is choked and the flow is independent of the down-stream
pressure. It is also necess~ to take into account the 1histor.y'
of the discharge which, in the present investigation, has been
correlated by the initial thermodynamic state of the cylinder
contents and by the time taken to reach the instantaneous pressure.
The independent variables that are considered to affect
the transient mass flow through an orifice and their dimensions are
as follows:
1. Orifice and cylinder geometr,y:
D (L) cylinder diameter,
L (L) cylinder length,
d (L) orifice diameter,
1 (L) orifice length, and
h (L) roughness of the flow passage.
2. Flow conditions across and at the orifice:
instantaneous upstream pressure,
instantaneous upstream temperature,
28.
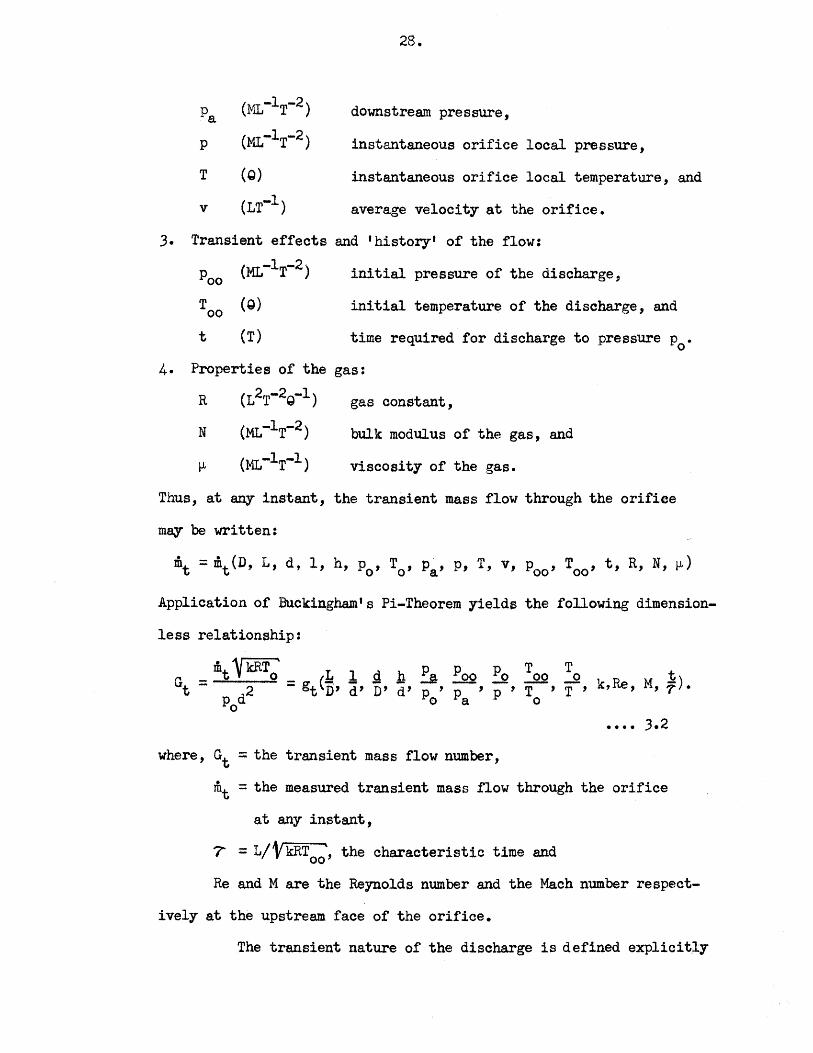
p (ML-lT-2) downstream pressure, ·a
p (ML-lT-2) instantaneous orifice local pressure,
T (0) instantaneous orifice local temperature, and
v (LT-1 ) average velocity at the orifice.
3. Transient effects and 1 histor,y' of the flow:
(ML-lT-2) P00
initial pressure of the discharge,
initial temperature of the discharge, and Too (0)
t (T) time required for discharge to pressure p0
•
4· Properties of the gas:
R (L2T-2g-l) gas constant,
N (ML-lT-2) bulk modulus of the gas, and
~ (ML-lT-1) viscosity of the gas.
Thus, at any instant, the transient mass flow through the orifice
may be written:
mt = mt(D, L, d, 1, h, p , T , p , p, T, v, p , T , t, R, N, ~) o o a oo oo
Application of Buckingham's Pi-Theorem yields the following dimension-
less relationship:
mt ~ L 1 d .b ~ Poo Po Too To t Gt = 2 = gt(D, d' D' d' p ' p ' p ' T
0 ' T ' k,Re, M, 7).
p0d o a
•••• 3.2
where, Gt =the transient mass flow number,
rot = the measured transient mass flow through the orifice
at any instant,
7 = L/ '\! kRT00
', the characteristic time and
Re and M are the Reynolds number and the Mach number respect-
ively at the upstream face of the orifice.
The transient nature of the discharge is defined explicitly

29.
by the dimensionless time, t/7, and by those groups which specify the
chronological aspects (or the histor,y) of such a process, namely, the
initial temperature ratio, T /T , and the initial pressure ratio, 00 0
p00
/pa' and the ratio L/D which is proportional to the surface area
for a given volume of the cylinder. In a steady flow, these groups
need not be considered and Equation 3.2 reduces to:
rn.~ P T P G = s o _ (1 d h a o o k u "'"")
s d2 - gs d' D' d' p0
' T' p' , . .;~..e, u ' Po
•••• 3·3
where G is the steady mass flow number and m is the measured s s
steady mass flow.
It is only on the basis of systematic experiments designed
in accordance with Equations 3.2 and 3.3 that flows under steady and
transient conditions can be compared.
To keep the experimental work within reasonable limits, it
is necessary to reduce the number of variables in Equations 3.2 and
3.3. It has been established(6) that in a steady flow the effect of
the Reynolds numbe~ based on the mass flow and on the orifice
diameter, is constant for ~ flow in the range of the present
investigation. From p~sical considerations, there does not appear
to be any reason why the effect of Reynolds number would be different
in the case of transient flow, so that there is no need to treat the
Reynolds number as an independent quantity. Further, using the
arguments presented in reference (6}, the pressure ratio, p0/p, the
temperature ratio, T /T, and the Mach number, M, at entry to the 0
orifice may be expressed as functions of p /p , the pressure ratio a o
across the orifice. The effect of the velocity approaching the up-

30.
stream face of the orifice is negligible if the value of the diameter
ratio, d/D, is kept small, while the effect of roughness of the
orifice wall, h/d, YOuld be essentially constant if the procedure
for the manufacture and inspection of the test orifices is adhered
to rigorously. In this investigation, each orifice was examined
under a low power microscope in order to maintain a uniform quality.
Since dry air only was used in this investigation, the
properties of the fluid, k and R, can also be regarded as constants.
Now, the temperature ratio, T /T , in Equation 3.2 may be 00 0
expressed as:
•••• 3.4
where Ts is the temperature corresponding to a pressure, p0
, during
an isentropic expansion from the initial conditions, p00
and T06
•
Thus, the temperature ratio, T /T , is a unique function of the 00 s
pressure ratio, p /p , or the product of the pressure ratios 00 0
P00
/Pa and Pa/p0
, and along an isentrope,
T _QQ T s
p (k- 1 )/k p (k- 1 )/k p (k- 1)/k = (_Q,Q) = (_QQ) • (_g)
Po Pa Po
The ratio, T /T is a measure of the departure of the temperature 0 s
in the actual expansion from the isentropic value, as discussed in
the previous section. From Equation 3.1, the temperature ratio,
T /T , is a function of the pressure ratios, p 0/p and Pa/p
0, and o s o a ~
the dimensionless time, t/?-. Thus, Equation 3.4 may be written:
Too/To= Fl(PalPo' Poo/Pa.' To/Ts) or
Too/To = F2(pa/Po' Poo/Pa' t/7'") •

31.
Using the arguments presented in the preceding paragraph,
Equations 3.2 and 3.3 are reduced to the following forms:
For transient flow,
•••• 3.5a
or
Gt = gt2(1/d, Pa/Po' Poo/Pa' t/?). • ••• 3.5b
For steady flow, the equation is,
•••• 3.6
Thus, on the basis of the similarity of the flow pattern upstream
of the orifice and for the same thermodynamic state of the air in
the cylinder, it is possible to distinguish experimentally those
independent quantities, which may give rise to differences between
steady and transient flows through an orli.fice. It is the purpose
of this investigation to examine the effect of the different
independent groups in Equation 3.5 on transient flows and to compare
the results with those obtained for steady flows on the basis of
Equation 3.6(6).
4. APPARATUS AND EXPER:nvJENTAL PROCEDURE
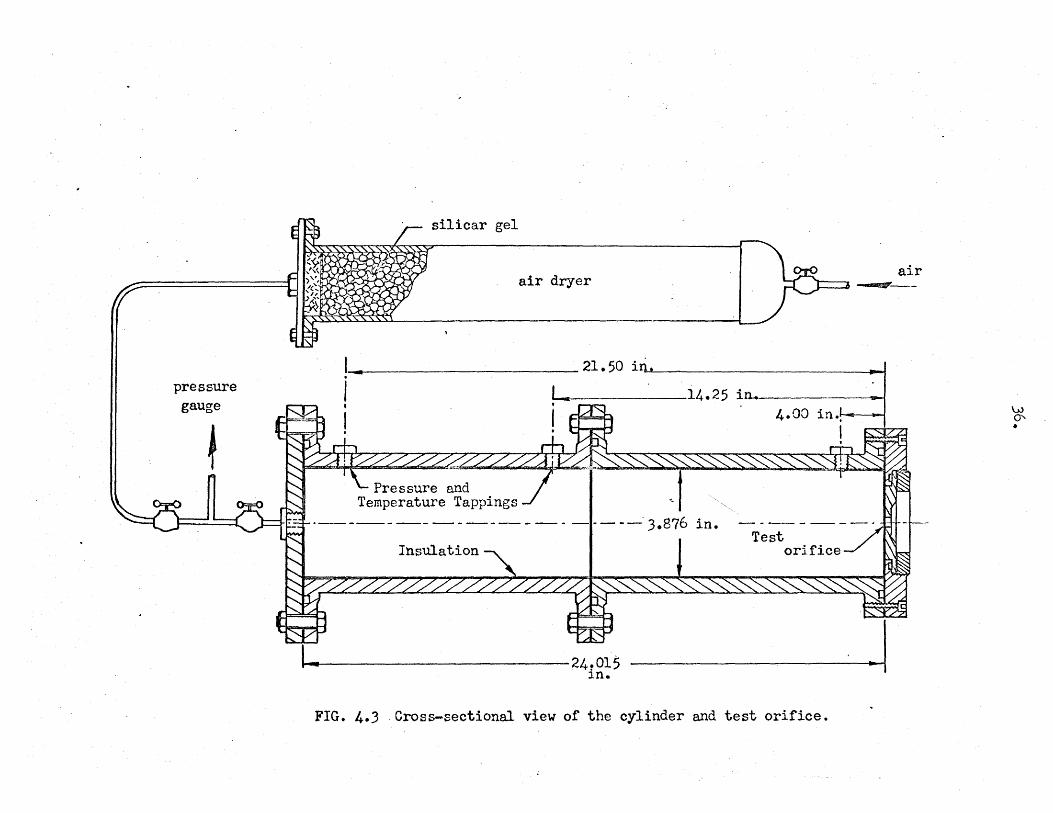
4.1 General Description of Apparatus
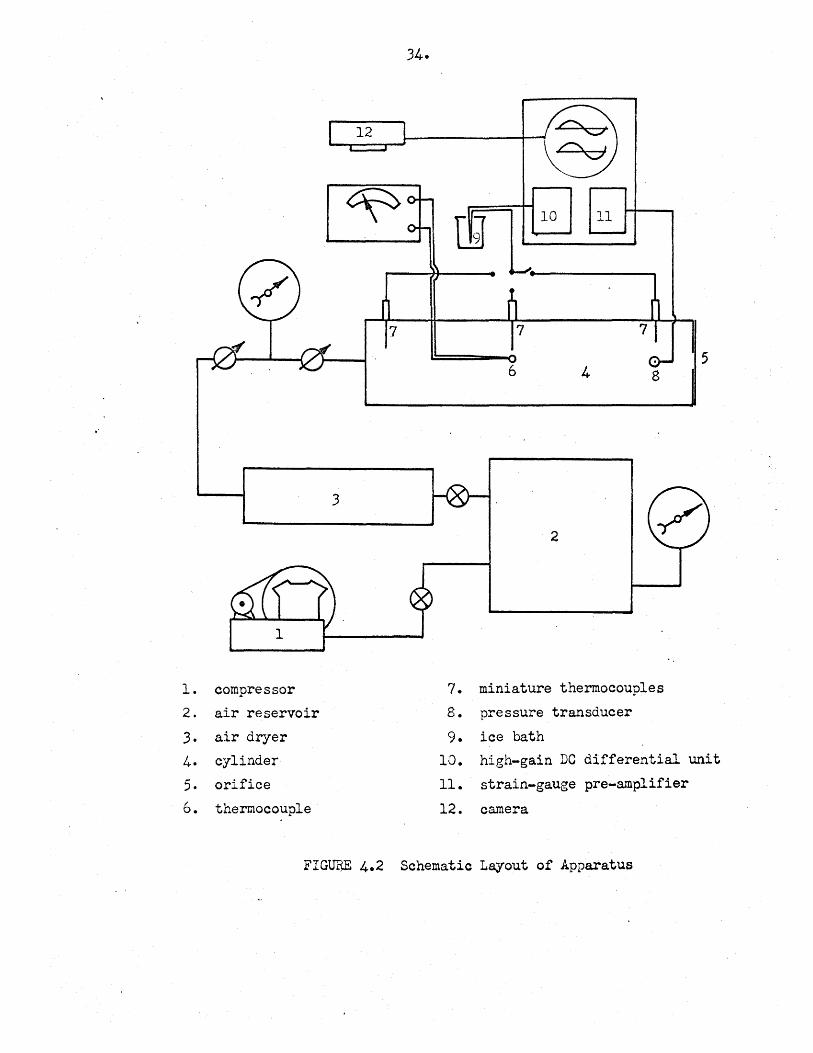
.A photograph of the apparatus is shown in Figure 4.1 and
a schematic layout is given in Figure 4.2. The apparatus consists
essentially of a cylinder which is used as the expansion chamber
with the test orifice mounted coaxially at one end, and the
associated presssure and temperature recording equipment.
Air from a reservoir is first passed through a container
filled with silica-gel. The moist air is passed slowly through the
gel at such a rate that sufficient water vapour is extracted to
depress the dew point temperature of the air to a value lower than
the minimum temperature expected to occur in the cylinder during
expansion.
A calibrated Bourdon pressure gauge and a copper-constantan
thermocouple, with a temperature potentiometer, are used to measure
the steady initial pressure and temperature, respectively, before
the commencement of the discharge. The transient pressure in the
cylinder during discharge is measured by a strain gauge-type pressure
transducer and a pre-amplifier. The transient temperature is
measured by means of a miniature chromel-constantan thermocouple
and a high-gain D.C. differential pre-amplifier. Outputs from the
thermocouple and pressure transducer as displayed on an oscillo
scope were recorded photographically using high speed Polaroid film.
4.2 The Cylinder and Test Orifices
The cylinder and the test orifice constitute the most
32.

34.
7 7
5 6 4 8
3
2
1. compressor 7. miniature thermocouples
2. air reservoir 8. pressure transducer
3· air dryer 9. ice bath
4. cylinder 10. high-gain DC differential unit
5. orifice 11. strain-gauge pre-amplifier I o. thermocouple 12. camera
FIGURE 4.2 Schematic Layout of Apparatus
35.
important parts of the experimental apparatus. A circular c1linder
of 4 in. internal diameter and 24 in. long is mounted horizojtally
and used as the expansion chamber from which compressed air 's dis
charged through the test orifice. A cross-sectional view of the
cylinder and orifice configuration is given in Figure 4.3. The
test orifice is mounted coaxially at one end of the cylinder by
flanges of suitable design. The expansion chamber is comprised of
two steel tubes each 12 in. long, joined by standard steel flanges.
This enable~ the cylinder length to be changed if necessary although,
in the present experiments, the length of the cylinder has been
kept constant. In order to minimize the heat transfer from the wall
to the air in the cylinder, the inner surface of the cylinder is
insulated by a la,yer of fiberfrax 0#035 in. thick which is over-
laid by a layer of aluminium foil 0.0006 in. thick. The foil is
used to reduce the radiation error of the thermocouple. Tappings
were provided in the cylinder wall at distances of 4.00, 14.25 and
21.50 inches from the upstream face of the orifice to allow the
pressure and temperature to be measured during the discharge.
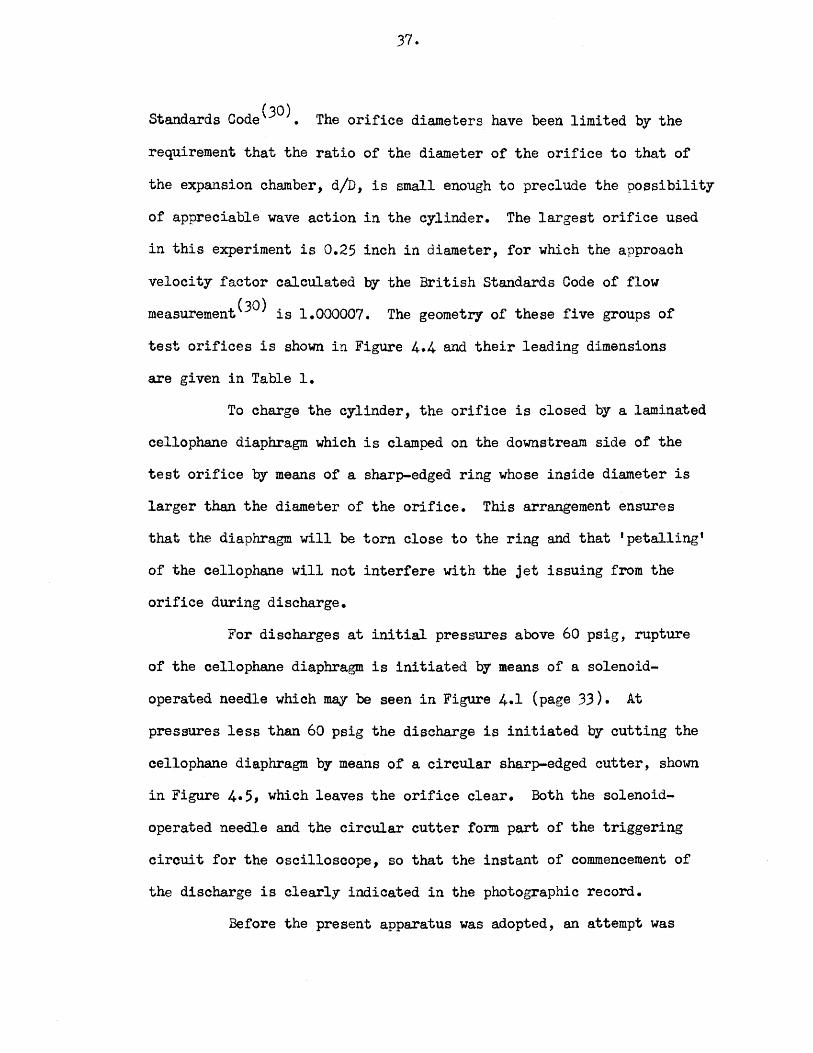
Thirteen orifices, geometrically similar to those used in
the earlier investigation under conditions of steady flow(b) have
been used in the experiments described in this thesis. Consider-
able care was given to the manufacture and inspection of these
orifices to ensure that the flow passages and the upstream faces of
the orifice plates were smooth and square with one another, and
that the edge was free from burrs. The length-diameter ratios of
these orifi?es are 2.0, 1.5, 1.0, 0.5 and 0.05, the latter
corresponding to sharp edge orifices prescribed by the British
pressure gauge
~
silicar gel
air dryer
21.50 in.
14.25 ~n. 4 00 in.~~ • I
Pressure and Temperature Tappings
-- ·-------------- -'-----3.876 in.
I
Test Insulation ~ I I orifice
~----------------------------------------------24,01$ 1n.
FIG. 4.3 Cross-sectional view of the cylinder and test orifice.
~,
air
w 0' •
37.
Standards Code ( 30) • The orifice diameters have been limited by' the
requirement that the ratio of the diameter of the orifice to that of
the expansion chamber, d/D, is small enough to preclude the possibility
of appreciable wave action in the cylinder. The largest orifice used
in this experiment is 0.25 inch in diameter, for which the approach
velocity factor calculated by the British Standards Code of flow
measurement(JO) is 1.000007. The geometry of these five groups of
test orifices is shown in Figure 4.4 and their leading dimensions
are given in Table 1.
To charge the c;rlinder, the orifice is closed by a laminated
cellophane diaphragm which is clamped on the downstream side of the
test orifice b,y means of a sharp-edged ring whose inside diameter is
larger than the diameter of the orifice. This arrangement ensures
that the diaphragm will be torn close to the ring and that 1 petalling'
of the cellophane will not interfere with the jet issuing from the
orifice during discharge.
For discharges at initial pressures above 60 psig, rupture
of the cellophane diaphragm is initiated by means of a. solenoid
operated needle which may be seen in Figure 4.1 (page 3.3). At
pressures less than 60 psig the discharge is initiated b.r cutting the
cellophane diaphragm by means of a circular sharp-edged cutter, shown
in Figure 4.5, which leaves the orifice clear. Both the solenoid
operated needle and the circular cutter form part of the triggering
circuit for the oscilloscope, so that the instant of commencement of
the discharge is clearly indicated in the photographic record.
Before the present apparatus was adopted, an attempt was
38.
1 d = 2.0
I I . 1.5
1.0
0.5
• I
I
FIG. 4.4 Geometr.y of test orifices

39.
TABLE I
Leading Dimensions of Test Orifices
DIAMETER, d LENGTH (in.) DIAMETER
LELlGTH, 1 RATIO Nominal Exact (in.) (1/d)
1/4 0.2504 0.5000 2.0
3/16 0.1875 0.3750 2.0
1/4 0.2504 0.7500 1.5
3/16 0.1877 o. 5625 1.5
1/4 0.2504 0.2500 1.0
3/16 0.1876 0.1875 1.0
1/4 0.2505 0.1250 0.5
3/16 0.1875 0.0938 0.5
9/32 0.2828 0.0141 sharp edge
1/4 0.2488 0.0125 sharp edge
7/32 0.2196 0.0110 sharp edge
3/16 0.1875 0.0094 sharp edge
1/8 0.1238 O.Oo62 sharp edge

cam
I \ ----e--,..,.,..
0 -- I
! I
I
I
--$--
-- '
''®"
FIG. 4.5 Diaphragm cutter and orifice mounting flange
'
""' '(9-\
\
\ I
--$-I
I I
I '0 I

41.
made to initiate the transient flow from a steady state b,y using
arrangement shown in Figure 4.6. This was accomplished by means of
a shock-operated cut-off valve. While such a design produced very
satisfactory starting conditions for the discharge, it was found
that random disturbances were introduced into the transient pressure
and temperature signals, particularly during the later stages of
the discharge. The apparatus was designed to avoid the possibility
of interference with the initiation of the transient flow by the use
of a mechanical device for the opening of the orifice. However, it
was established that the use of a conventional shock tube gave
equally satisfactory starting conditions while the overall discharge
was not disturbed by random fluctuations in the pressure.
4·3 Experimental Procedure
Prior to an actual test, the cylinder is first purged of
moist air b.r filling and emptying it several times with dry air.
The cylinder is then charged to the required initial pressure slowly
enough to ensure that the air is adequately dried during its passage
through the silica-gel before entering the cylinder. The temperature
of the air in the cylinder is allowed to attain equilibrium with the
cylinder wall before initiating the discharge at the selected initial
pressure. The rupture of the cellophane diaphragm and the trigger
ing of the two beams of the oscilloscope occur simultaneously, the
transient pressure and temperature being recorded photographically.
Datum lines for the temperature and pressure are superimposed on the
photographic record before and after each discharge.
Because of the difficulty in recording the transient

42,.
Air from compressor
1. plenum chamber 6. high pressure air
2. air dryer 7. diaphragm
3. shock-operated valve 8. needle
4· cylinder 9. silica-gel
5. test orifice 10. baffle
FIGURE 4.6 Early Apparatus using Shock-Operated Cut-off Valve
43·
temperature at more than one position in the cylinder, it is
necessar.y to repeat the discharge. In each case the thermocouple
is located in a different predetermined position in the cylinder in
order to obtain a meaningful average of the temperature during
discharge.
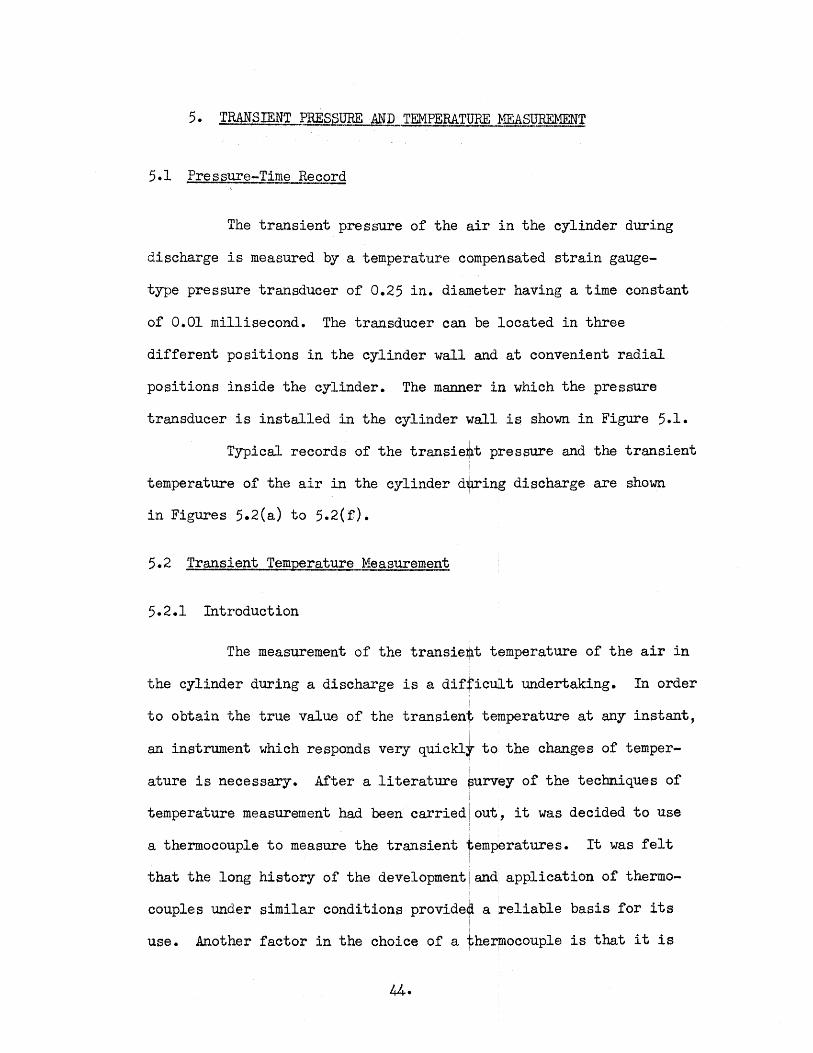
5. TRANSIENT PRESSURE AND TEMPERATURE lvlEASUREMENT
5.1 Pressure-Time Record
The transient pressure of the air in the cylinder during
discharge is measured by a temperature compensated strain gauge
type pressure transducer of 0.25 in. diameter having a time constant
of 0.01 millisecond. The transducer can be located in three
different positions in the cylinder wall and at convenient radial
positions inside the cylinder. The manner in which the pressure
transducer is installed in the cylinder wall is shown in Figure 5.1.
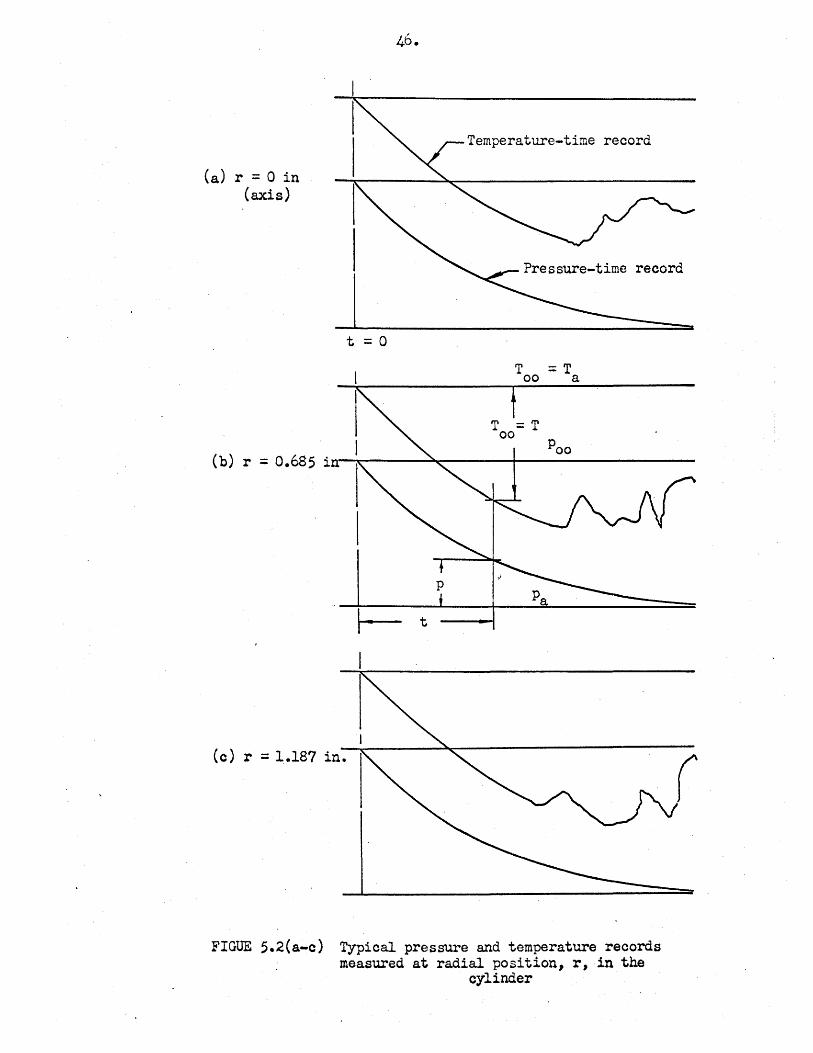
Typical records of the transie~t pressure and the transient
temperature of the air in the cylinder d~ing discharge are shown
in Figures 5.2(a) to 5.2(f).
5.2 Transient Temperature Measurement
5.2.1 Introduction
The measurement of the transierjlt t1emperature of the air in
the cylinder during a discharge is a difficult undertaking. In order
to obtain the true value of the transient temperature at any instant,
an instrument which responds very quickly to the changes of temper
ature is necessary. After a literature ~urvey of the techniques of
temperature measurement had been carried out, it was decided to use
a thermocouple to measure the transient ~emperatures. It was felt
that the long history of the development and application of thermo
couples under similar conditions provide<il a reliable basis for its
use. Another factor in the choice of a ~he~ocouple is that it is

pressure transducer
45.
FIGURE 5.1 Installation of Pressure Transducer
0-rings
(a) r = 0 in (axis)
(c) r = 1.187 in.
t = 0
t
Temperature-time record
Pressure-time record
T = T oo a
T = T 00
FIGUE 5.2(a-c) Typical pressure and temperature records measured at radial position, r, in the
cylinder

47.
/Temperature-time record
(d) r :::: 1.532 in.
1
t :::: 0
(e) r = 1.813 in~
(f) r = 1.9)8 in. (wall)
t------= t
I ~~--------~,--~-
FIGURE 5.2(d-f) Typical pressure and temperature records measured at radial position, r, in the
cylinder
48.
relatively cheap, easy to construct and simple to use.
5.2.2 Choice of the thermocouple
Owing to the wide spread use of thermocouples in the
laboratory and in industr.y, a number of combinations of materials
have been developed over the years for different applications. The
choice of a thermocouple depends on such factors as the range of
temperature for which it is to be u,sed, the linearity of the temp
erature-electromotive force relationship, the response time., the
wire sizes and the chemical and mechanical properties of the avail
able materials.
In the present investigation, the primary consideration
was a rapid response of the thermocouple to a temperature change,
a property associated with a small wire diameter. The second
consideration was that the thermocouple output should be a maximum
having regard to the performance of the available recording equip
ment and the temperature range that was expected during the dis
charge. The temperature-emf relationship of several common
combinations of thermocouples are given in Figure 5.3, and in view
of the conditions likely to be encountered in the present experi
ments, it is clear that a chromel-constantan thermocouple meets the
stipulated requirements.
5.2.3 Design of thermocouple
A chromel-constantan thermocouple with wire diameter of
0.0005 inch is used for the measurement of transient temperatures
in the cylinder. The design and the installation of the thermo-

/ /
/
/ /
/
49.
chromel-constantan
iron-constantan
chromel-alumel
copper-constantan
FIGURE 5.3 Temperature-electromotive force relationship for cow~on thermocouple materials
50.
couple is shown in Figure 5.4. Thermocouple wires are carried in a
two-hole ceramic tube, 1/32 in. outside diameter, which is supported
in a stainless steel tube, which is 1/16 in. outside diameter and 6
inches long. The end of the steel tube is sealed with cement to
prevent leakage of air from the cylinder through either the ceramic
tube or the stainless steel tube. The junction of the thermocouple
is left bare outside of the tube as shown in Figure 5.4.
B,y the use of block adaptors, the thermocouple junction
can be located in the cylinder at any one of six predetermined
radial positions whose distances measured from the axis of the
cylinder are 0.000, 0.658, 1.187, 1.532, 1.813 and 1.938 inches.
The four intermediate positions correspond to the mean radii of four
co-axial annulli which divide the cylinder cross-section into four
equal areas. The two remaining posi tiona correspond to the cylinder
axis and the wall, respectively. The reason for the choice of these
positions are discussed in a later section.
To increase the accuracy of the measurement, a cold
junction maintained at 32 deg. F. in an ice bath is used.
5.2.4 Thermocouple error - conduction and radiation
There are a number of publications(4b)(4?)(48) on errors
in temperature measurement arising from the use of thermocouples.
In general, errors in the measurement of the temperature of a gas
stream are due to: (a) heat conduction away from the thermocouple
junction, (b) the heat loss due to radiation, (c) the time lag due
to convection and (d) the error due to stream velocity. That is,
the true temperature, 6, of the gas can be expressed as:
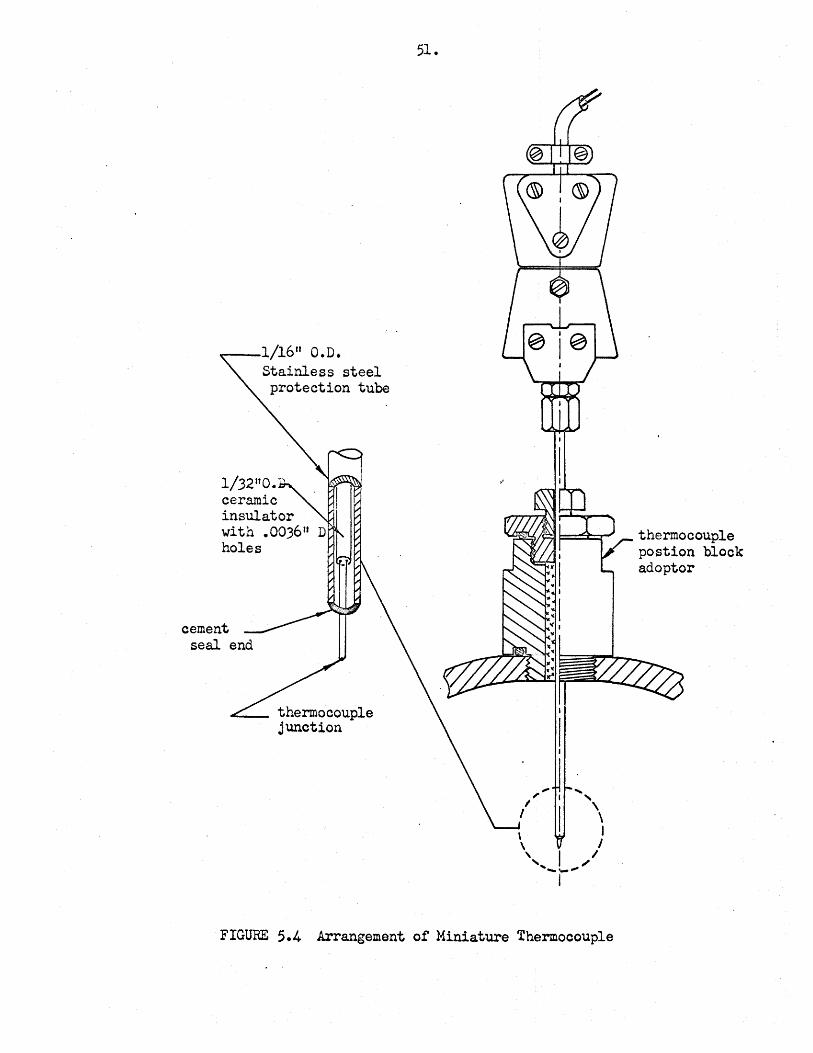
--1/16" O.D. Stainless steel protection tube
ceramic insulator with .0036 11
holes
thermocouple junction
51.
.... ' \
\ \ I \ I ' I I '... , __ ,.,
I
FIGURE 5.4 Arrangement of Miniature Thermocouple
thermocouple postion block adopter

52.
Q = Q + !conduction.~.+ lradiatio~ + lconvectio~ +[veloci ti] w L error J L error J L error J error j '
where Qw is the wire, or indicated, temperature. The velocity
contribution to the error need not be considered since, in the
present investigation, the air velocity in the cylinder is zero. In
this section, errors that arise in the measurement of transient
temperatures due to heat conduction and radiation are discussed.
The difference between the temperature, Q , indicated b.y w
the thermocouple junction and the true temperature, Q, depends on a
very complicated heat transfer process occurring at the junction.
For the steady state, and for negligible radiation between the gas
and the thermocouple junction, an approximate analysis based on an
energy balance(4S) gives the following results for the radiation
error and the conduction error:
Radiation error
Conduction error
= (rn;r"l] l/J
= 1 - l/J (Tw - TB)
where, 6 w = thermocouple wire emis si vi ty,
" = Stefan-Boltzmann constant,
h =film coefficient of thermocouple wire,
TD = absolute temperature of cylinder wall,
T = absolute temperature of wire, w
= absolute temperature of thermocouple support,
= sech f(h12)/(k D ~, ~ w w w'J
k =thermal conductivity of thermocouple wire, w
D = diameter of thermocouple wire and w
L =~thermocouple wire loop length. w
5.1
5.2
53.
It is recognized that heat transfer under transient
conditions may be different from that of steady state, although
transient heat transfer data are not available. Therefore, in a
qualitative sense, the magnitude of the errors due to radiation and
conduction may be estimated for the transient case from quasi-steady
considerations.
It has been found(4S) that if the ratio of the thermocouple
wire loop length to the wire diameter, LwfDw' is greater than 30, the
error due to heat conduction becomes insignificant. The design of
the thermocouple used in the present investigation fulfills this
criterion, and,thus, the conduction error of the thermocouple may be
neglected.
It is difficult to estimate the error due to radiation
under the present experimental conditions, owing to a lack of the
necessary heat transfer data, namely, the thermocouple wire emissivity,
the film coefficient and the exact temperature of the cylinder wall
during discharge. To estimate the maximum possible error due to
radiation in the temperature measurement, the most favourable conditions
for radiation heat transfer are assumed, namely, black body radiation
with wire emissivity equal to unity, and the maximum temperature
difference which is expected to occur between the cylinder wall and
the thermocouple junction during the discharge.
To estimate the maximum temperature difference! the minimum
indicated temperature, T , of the thermocouple is assumed to be equal w
to the minimum temperature of the gas in the cylinder, while the
maximum temperature, TD' is assumed to be equal to that of the

54.
cylinder wall at the beginning of the discharge. The minimum
temperature, Tw' occurs at a pressure of about 10 psig during the
discharge while the temperature, TD' which is that of the aluminium
foil will, in fact, be lower than the initial temperature. Thus,
under the extreme conditions, the minimum temperature is 400°R, the
maximum temperature is 530°R, the absolute pressure p0
in the cylinder
is approximately 2 atmospheres and the Mach number in the cylinder is
zero. Extrapolating from the nomogram given in reference (48), the 0
maximum error due to radiation is estimated to be 0.3 F. This
error is within the accuracy of the experimental observations and may
be neglected.
It follows from the preceding arguments that the errors due
to heat conduction and radiation in the measurement of transient
temperatures in the cylinder during discharge are negligible.
It is evident that caution must be exercised in the use of
correction factors in the absence of precise data on heat transfer.
If inaccurate data are used to estimate errors in temperature measure-
ment they may lead to erroneous results. For example, in the over
corrected value of the temperature obtained by Potter and Levy(l4),
after corrections had been made for the radiation error, some of the
air temperatures were estimated to be lower than those corresponding
to isentropic expansion.
5.2.5. Determination of the time constant for the thermocouple and
the error due to the convective heat transfer
The response time of the thermocouple is of considerable
importance. The time lag in the· respont::re of the thermocouple
55.
and the correction for this error may be found in the literature
( 4 7) ( 4 9 ) ( 50) ( 51 ) It may be shown that, when a thermocouple is
subjected to a step change of temperature from T1 to T2
, the change
of the indicated temperature of the thermocouple, T , follows an w
exponential law,
• • • • 5.3
where B depends on the properties of the thermocouple, namely, the
wire diameter, the density of the material of the wire, the heat
capacity and film coefficient of the wire. The time constant of the
thermocouple, tc' is usually defined as the time when tc = t = B
(Equation 5.3), so that t is the time required for the thermoc
couple to indicate 63.2 percent of the step change of the temperature.
Because of the lack of heat transfer data for thermocouple
materials, it is often necessary to determine the time constant
experimentally. The apparatus used for this purpose in the present
experiments is shown in Figure 5.5. A step change of the temperature
is obtained by suddenly releasing the spring, to withdraw the heating
coil which initially enveloped the thermocouple junction. The
variation of the indicated temperature is recorded photographically
by means of an oscilloscope and camera.
From a number of records obtained from the test, the time
constant of the thermocouple was determined to be 9.91 milliseconds.
For the maximum initial pressure and for the orifices used
in the present experiments, the maximum rate of temperature change 0
is about 40 F per second during the discharge. If the thermocouple
is subjected to a step change of temperature of 40°F, the minimum
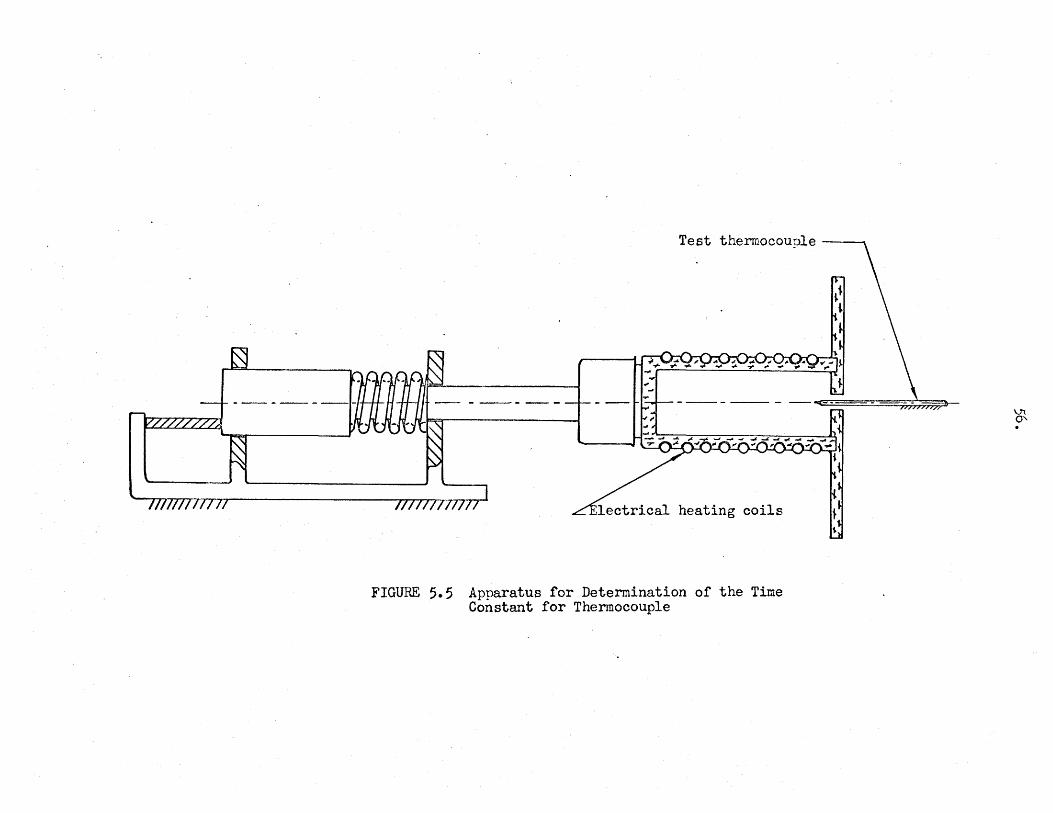
Test thermocou9le ---
lectrical heating coils
FIGURE 5.5 Apparatus for Determination of the Time Constant for Thermocouple
V1 0'

57.
time required to indicate 98.2 percent of the temperature change
within one second m~ be found from Equation 5.3 when t = 4B.
The corresponding time constant is given qy,
t = (1/4)(1/40)(10)3 = 6.25 milliseconds. c
Clearly, the chromel-constantan thermocouple of wire diameter 0.0005
in. is not fast enough for the rates of temperature change likely to
be encountered in the temperature measurements. Since the diameter
of the wire is already ve~ small, the response of the thermocouple
cannot be further improved by reducing its wire diameter. An
attempt was, therefore, made to reduce the time constant by means of
a phase advance circuit and an additional D.C. amplifier as suggested
qy Sirs( 52). This attempt did not prove successful due to the noise
introduced by the phase advance circuit and the preamplifier. When
the preamplifier was removed, the thermocouple output was reduced by
the presence of the phase advance circuit.
To correct the error due to the time lag in the response of
the thermocouple, it was decided to adopt the correction formula
given by Moffat( 5l), namely,
T = T + t ( dT I d t) , w c w'
where T is the true instantaneous temperature of the air at the
position measured in the cylinder. Equation 5.4 is true only if the
following assumptions are fulfilled, namely:
(a) The relationship of the temperature-emf of the thermocouple
is linear.
(b) The temperature measurement is free from errors due to
~-
conduction, radiation and velocity.
(c) The temperature of the gas is uniform at the junction of
the thermocouple.
The first two assumptions are approximately true in the present
experiments. With regard to the last assumption, it is known that
the temperature distribution in the cylinder during discharge is
not uniform throughout. Nevertheless, since the junction of the
thermocouple is small and the radial temperature variation in the
cylinder, not too large, it is reasonable to assume uniformity of
temperature in the vicinity of the thermocouple junction.
5.3 Calibrations
Before and after each experiment, comprising eighteen dis-
charges from the same conditions which were usually completed within
15 hours, the instruments were calibrated directly against standard
equipment of the required accuracy. The direct calibration serves
both to eliminate errors due to the nonlinear characteristics of the
instrumentation and to allow the maximum beam deflection of the
oscilloscope to be used. The oscilloscope-transducer system was
calibrated statically by means of dead-weight gauge-tester. Calib-
ration of thermocouple-oscilloscope system was also made statically
against the millivolt output of a standard Cambridge potentiometer.
The temperature-millivolt relationship of the thermocouple was
obtained from the National Bureau of Standards Circular No. 561
recommended by the thermocouple manufacturer. Interpolation data
have been calculated by the second degree Lagrange equation< 53 ).

59.
Each of the calibration records was measured at least ten
times using the micrometer device described later. The mean value
of these ten measurements was used to evaluate the pressure or the
temperature from the photographic records obtained during the dis
charge.
The sweep time of the oscilloscope was also checked by
means of an accurate time-mark generator and was corrected accordingly.
5·4 Measurement of Transient Pressure and Temperature Records
The micrometer device used in the calibration of the
transient pressure and temperature traces is shown in Figure 5.6.
The sharp-pointed scri ber can be moved in two perpendicular
directions on the surface of the table b.1 the two micrometers. The
transient pressure and temperature record is placed on the table and
their ordinates are measured by means of the micrometers. The
minimum resolution of the micrometers is 0.0005 inch. However, due
to the uncertainty of locating the exact centre of a trace the last
decimal place of the readings from the micrometers are not considered
to be significant.
It may be seen from Figure 5.2 (page 46) that instantaneous
values of the pressure have been measured with reference to the
atmospheric line taken during each test. Temperatures have been
measured with reference first to the initial temperature of the air
in the cylinder and then to the ice point. This procedure was
adopted since it is difficult to obtain the zero millivolt datum
line qy placing the hot junction of the thermocouple in an ice bath
during the test.
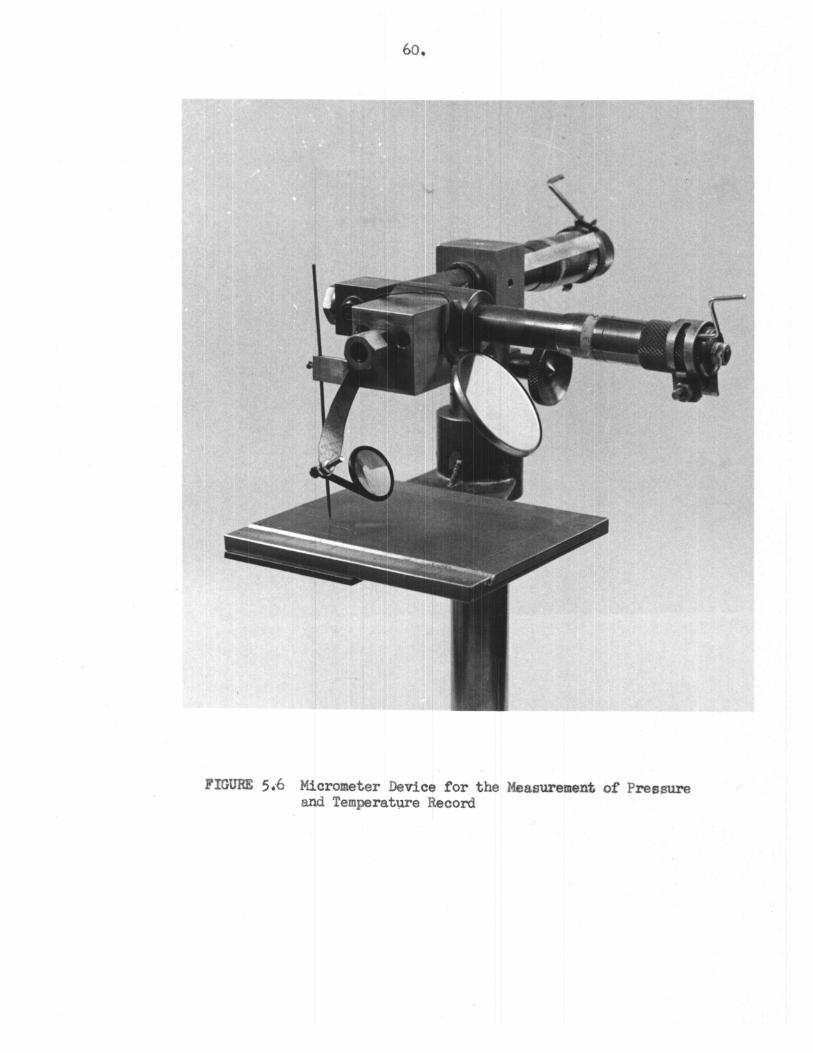
FIGURE 5.~ Micrometer Device for the Measurement of Pressure and Temperat~e Record

6. DISCUSSION OF RESULTS
6.1 The Expansion of Air in the Cylinder During Dischar~
The results presented in this chapter have been obtained
from experimental measurements. Values of the recorded instantaneous
pressures and temperatures have been fitted into polynomial equations
of the order compatible with the required accuracy. The curve fitting,
the correction of temperature, the temperature averaging procedure,
and the calculations have been obtained by' means of a digital
computer.
Measurements of the instantaneous pressure and the
instantaneous average temperature for several discharges have been
incorporated into a general relationship, (Equation 3.1, page 25),
which can be used for the prediction of the instantaneous value of
the transient temperature in the cylinder during discharge.
6.1.1 Pressure distribution in the cylinder
It was stated earlier that in a slow transient discharge
the pressure is uniform in the cylinder, except in a narrow region
close to the orifice where local acceleration- of the air occurs.
The uniform pressure in the cylinder has been verified by locating
the pressure transducer at the wall, and at the axis of the cylinder
at three different positions. For discharges from a given initial
pressure through the same orifice, identical pressure-time records
have been obtained at these different positions in the cylinder.
61.

62.
f~o attempt has been made to measure the dis·tribution of
pressure in the region where acceleration occurs close to the
orifice. Since the space occupied by this region is small compared
with the volume of the cylinder, nonuniformity in the pressure and
temperature can have only a ver,r small effect on the J~ass in the
cylinder as calculated on the uniform pressure and weighted average
temperature in the cylinder.
6.1.2 Temperature distribution in the cylinder
Typical photographic records of the variati~on of temp
erature at different radial positions in the cylinder have been
presented in Figure 5.2 (page 46). Measurement of the transient
temperature was first made on the axis of the cylinder and, during
the discharge, it was observed that the temperature decreased to a
minimum and then increased, although the pressure of the air continued
to decrease. This behaviour was similar to that which had been
observed by Potter and Lev,y(l4) in their experiments except that the
minimum temperature was reached after a longer interval of time from
the commencement of discharge. The difference in time can be
attributed to the larger volume and larger diameter of the cylinder
used in their experiments. Potter and Levy concluded that during
expansion of the air convective heat transfer became predominant
after some time and was responsible for the increase in temperature
of the air at the cylinder axis.
Measurements of the transient temperature 'W'ere then made
at different radial positions in the cylinder. As can be seen in
Figure 5.2 (page 46), it is clear that the distribution of the

temperature in the cylinder at any instant during the discharge
is not uniform. Nonuniformity of the temperature in the axial
direction is much smaller.
During discharge it is not known whether the radial
distribution of temperature is continuous or whether there is some
form of stratification, at least in the early stages of the dis
charge. However, it appears reasonable that once radial and axial
gradients of temperature occu.r convection currents will be set up
which, because of asymmetry, lead to the random fluctuations of'
temperature that have been observed towards the end of the dis
charge. It may also be seen that these fluctuations occur earlier
when the position of the thermocouple is nearer to the cylinder
wall. The instant~"leous temperatures are measured from the mean
curve drawn through thefluctuating part of the temperature-time
records.
For a discharge from a given initial pressure and for a
given orifice, typical relationships between transient pr,essures and
the temperatures at six radial positions in the cylinder are re
produced in Figure 6.1 in the form of the logarithmic values of the
pressure and temperature ratios. The six radial positions measured
from the cylinder axis are 0.000, 0.685, 1.187, 1.532, 1.813 and
1.938 inches. Since the pressure-time relationships for the six
curves shown in Figure 6.1 are identical, the pressure ratio ordinate
is also a measure of time as given by the scale included in the
Figure. For any pressure ratio in the cylinder, differences of
temperature among the six radial positions give the radial temper-

2.00
1.90
1.80
1.70
1.60
1.50
1.30
1.20
1.10
1.00
-' '1$ '
~ 0.90 0
P.
- 0.80 s:: H
0.70
0.60
0.50
0.40
0.30
0.20
0.10
---------- isentropic expansion
---0--- r = 0.00 in.
-- -L:::r --- r = 0.685 in.
----D---- r = 1.187 in.
---4---- r = 1. 532 in.
-- -o---- r = 1.813 in.
---<>---- r = 1.938 in.
\ 1
? J
9 I
~ 1
1 1
0 0.1 Ln (T
00/T)
FIGURE 6.1 Typical Pressure-Temperature Relationships of the Air at Six Radial Positions in Cyli~der during Discharge
o.o
·0.1
0.2
-'8 0 () (!)
U) -

ature distribution at that instant.
In Figure 6.1, the straigh1i line corresponds to isentropic
expansion. Along a line of constant pressure ratio, corresponding
to an instant during the discharge, 1;he horizontal intercept between
the curve f'or each of the six positions in the cylinder and the
straight line is a measure of the departure of the temperature of'
the air in the cylinder from the isentropic value. The departure
becomes greater as the cylinder wall is approached. Near the axis
of the cylinder, the transient temperatures follow closely" the
isentropic values for the greater pcu~ of the discharge; at the wall,
after a small decrease initially, the~ temperature is almost constant.
As at the a¥is of the cylirlder, the temperature at each of'
the other five radial positions decrE~ases to a minimum and then
increases as the pressure continues t;o fall during the discharge.
The time at which the minimum temperature is reached occurs earlier
at positions closer to the wall. This behaviour indicates that the
main reason for the departure of the expansion from the isentropic
law is the transfer of' heat to 1:ilne air from the cylinder wall.
For a given radial position on the three axial planes,
differences o f temperature are not as pronounced as those in the
radial direction. The distances of t;hese three planes from the up
stream face of the orifice are 4.00, 14.25 and 21.50 inches. At
each plane the temperaturesmeasured at the six different radial
positions have been averaged on the basis of the weighted density.
Details of the temperature averaging procedure are discussed in the
following section. The typical relat;ionship between the average
66.
temperature and the corresponding pressure for each of the three
axial planes is shown in Figure 6.2 as the three broken lines
drawn through the experimental points. The solid line represents
the weighted average temperature of the air in the cylinder.
6.1.3 Weighted average temperature of the air in the cylinder
during expansion
The relationship between the instantaneous pressure, p0
,
and the weighted average instantaneous temperature, T , of the air 0
in the cylinder during a discharge is shown as the solid line in
Figure 6.2. The average temperatures of the air in the cylinder
are obtained by a double averaging procedure in the radial and
axial directions weighted on the basis of the density of the air.
It is with the object of weighting for the density that the radial
positions of the thermocouple junction have been located at the mean
radii of the concentric annulli which divide the cylinder cross-
sectional area into four equal parts. The temperature corresponding
to the arithmetic mean of the densities obtained at the different
radial positions is, therefore, the average temperature of a plane.
The average temperature of the air in the cylinder has also been
obtained on the basis of the weighted density which is dependent on
the axial temperature distribution at the three sections. The average
temperature obtained in this way represents the uniform temperature
that would be attained throughout the cylinder at any instant during
the discharge if the air is mixed completely and isentropically.
B.1 using a relationship between the instantaneous pressure
and the instantaneous average temperature such as that in Figure 6.2,
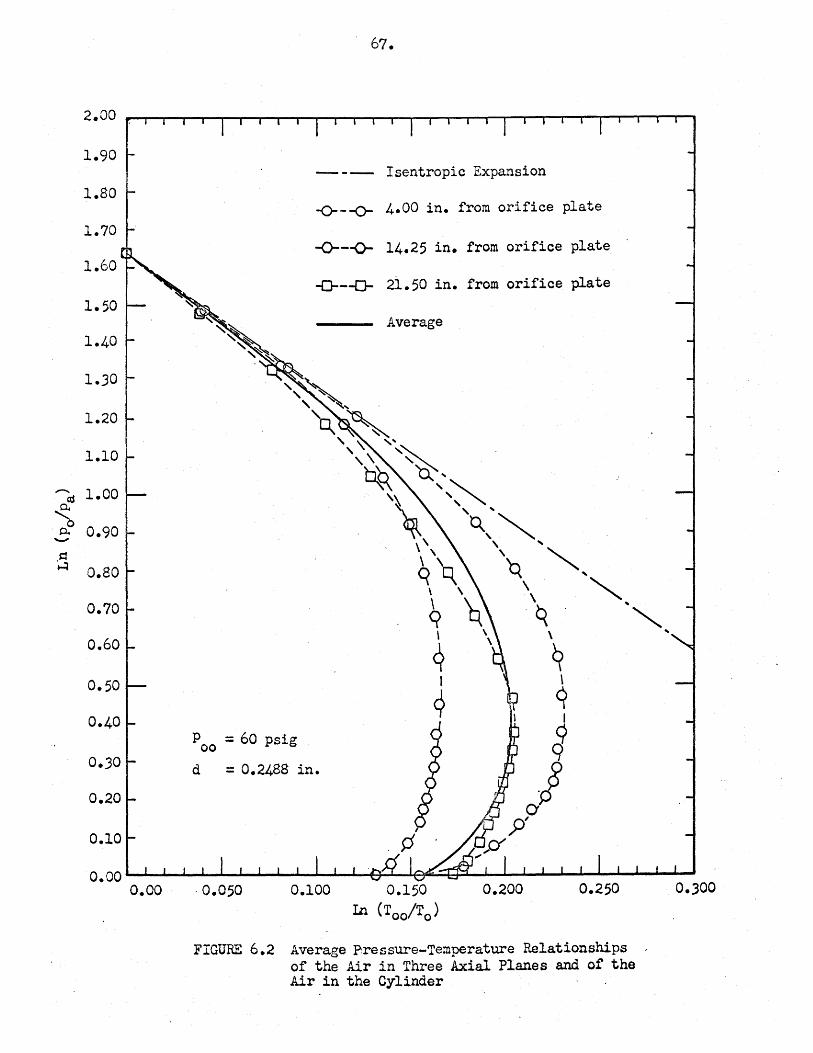
2.00
1.90
1.80
1.70
1.60
1.50
1.40
1.30
1.20
1.10
......... 1.00 cd
~ 0..0 0.90 -.s:: ~ 0.80
0.70
0.60
0.50
0.40
0.30
0.20
0.10
o.oo o.oo
P = 60 psig 00
67.
--- Isentropic Expansion
-o---o- 4.00 in. from orifice plate
-o---o- 14.25 in. from orifice plate
-D---D- 21.50 in. from orifice plate
Average
d = 0.2488 in.
. 0.050 0.100 0.150 0.200 0.250
In (Too/To)
FIGURE 6.2 Average Pressure-Temperature Relationships , of the Air in Three Axial Planes and of the Air in the Cylinder
0.300

68.
the average thermodynamic state of the air at any instant during the
expansion may be obtained from the indicator diagram in the cylinder.
At any instant, the residual mass of the air in the cylinder is cal-
culated from the equation of state using instantaneous values of the
pressure and the average temperature in the cylinder. The transient
mass flow through the orifice is found from the equation of the con-
servation of mass flow.
It may be seen from Figure 6.2 that departure of the weighted
average temperature of the air from the corresponding isentropic
value begins a ver.y short time after the commencement of discharge.
The extent of the departure gradually increases as the discharge pro-
ceeds and reaches a point when the change of temperature with respect
to the change of pressure is zero, that is,
d(ln(T00
/T0
))/d(ln(p0/pa)) = 0,
corresponding to a turning point in the curve of the pressure-temp-
erature relationship. Further decrease of the pressure is then ac-
companied by an increase in the average temperature of the air in the
cylinder.
6.1.4 Pressure-temperature correlation and the prediction of the
temperature for the air in the cylinder during discharge
Relationships between the transient pressure and the
average temperature of the air in the cylinder, similar to those in
Figures 6.1 and 6.2, have been obtained for discharges from initial
pressure,, p , of 18, 30, 60, 80 and 100 psig. and for a constant 00
initial temperature, T , (equal to room temperature) using sharp 00
edge orifices of diameters 0.2828, 0.2488, 0.2196, 0.1875 and 0.1238
inches. For example, the relationship between the pressure and the
average temperature for an initial pressure of 60 psig. using three
different orifices is shown in Figure 6.3 in which it is seen that
the extent of the departure from the isentropic law is dependent on
the orifice diameter.
The magnitude of the departure from the isentropic law may
be expressed by the following relationship:
T oo T T ln(-T-) = ln{Too·f)'
0 s 0
The first term on the right hand side of the above equation is the
isentropic temperature ratio corresponding to the expansion ratio,
p /p , and is represented by the straight line in Figure 6.3. The 00 0
second term is a measure of the departure from the isentropic value
and is equal to the distance between the actual curve and the isentrope.
It is clearly desirable to derive a simple expression which
would correlate the transient pressures and temperatures obtained
experimentally and which would also be valid for any discharge under
the conditions of the present investigation.
Equation 3.1 of the dimensional analysis, shows that the
temperature ratio, T /T , is a function of p /p , p /p and t/~ • o s oo a a o
It has been found by trial and error that, for a given initial
pressure ratio, p /p , the temperature ratio, T /T , can be cor-oo a o s
related with p /p and with t/~by a functional expression of the a o
form:

-QS
< 0 p. -c: ~
1.8
1.7
1.5
1.4
1.3
1.2
1.1
1.0
0.9
o.s
0.7
0.6
0.5
0.4
0.3
0.2 .
0.1
o.o
70.
-·-·- Isentropic expansion
0 d = 0.2488 in.
\7 d = 0.2196 in.
0 d = 0.1875 in.
o8 . o \7o
0
0\7 0
o\7
0\7 0 0 0 \7
0 '\7 0 '\7
0 0 \I
0 \7 0
0 \/ '\7
0
o.oo 0.050 0.100 0.150 0.200 Ln (T
00/T0 )
FIGURE 6.3 Pressure and Weighted Average Temperature of the Residual Air in Cylinder During Discharge for a Given Initial Pressure

T0/Ts = f(Z),
where z = 1 /(p /p ) ( t/irt • a o
It follows that, in general,
71.
T /T = F ( z, p I p ) o s oo a •••• 6.1
The results of this correlation for different initial pressures and
for orifices of different diameters are shown in Figure 6.4 where
T0/Ts is plotted against Z with the initial pressure ratio as ·
parameter. Each curve has been obtained from the pressure-time and
temperature-time records for discharges using orifices of different
diameters.
The accuracy of this correlation has been analysed by the
method of the least square polynomial regression and the standard
error of the temperature ratio, T /T , has been found to be about 0 s
0.0057, which is considered to be satisfactory.
For practical purposes, the curves shown in Figure 6.4
m~ be used to calculate the rate of change of the mass of air in
the cylinder. However, it is generally difficult to obtain the slope
of any one of these curves with sufficient accuracy , particularly
in those regions where the curves are relatively flat. The
determination of the slope is simplified by a suitable transformation
of the coordinates. The transformation is carried out in two steps
in order to achieve the maximum accuracy. In the first step, when
the Z-coordinate is transformed into
X = 1/(Z - 0.04),
a major segment of each curve becomes a straight line whose equation
is:

1. 40 • 1 '\/1 1 1 1 1 1 1 1 1 1 1 1 1 1 • 1 1 --r VI
1.351- ~0
1.30
(ll
~ 1.25 ~
... 0 ..,...,
~ ,... 1.20
~ ~ J..c
2L 1.15 s Q) ~
1.10
1.05
1.0 -0 o.
~0 ~ VJ¢
~0 'i0
0VJ0 \:?o 0~
0 ·¢ 0 tl /;\ Q) v 0 8 oEJ
~ ~ 8 Os
. ' 0El 0 <&:, '\1 0 El
~ A. El 0 ~ ¢El
G) ~ El 0~(:} El .C)~ OEl
0 '\:l El
0 P00
= lOO.psig
O p = 80 psig ' 00
6 Poo- 60 psig
0 p00
= 30 psig
0 p = 18 psig QO
QC0 -~ 8EJ. Q. 0 VII EJ.EJ '0 % 'Q~ v ElEl .
ED Ql n. '\J<'B4- ~ El El El El <0 '>" (!t)V <h ~ 0 00~(; 0 6' 0'~ ffi_ ~ <B 0J cf:> I ~ }F,Q "F.i':)
FIGURE 6.4 Average Pressure and TemperatUre Correlation of the Air in Cylinder During Discharge
-...J l\)
•
73.
T /T =aX + b, 0 s •••• 6.2
where, a and b are constant coefficients whose values depend on the
initial pressure of the discharge. The results of the transformation
are shown plotted in Figure 6.5. The loci of the terminal points of
straight lines is given by the equation:
T /T =-0.1543 X + 1.080. 0 s
The lines represented by equation 6.2 corresponds to the later part
of the discharge. In the second step of the transformation, those
segments of the curves which correspond to the earlier stage of a
discharge became straight lines when the X-coordinate is transformed
by
2 y =X '
as in Figure 6.6. The equation of this family of lines is given by
T0/Ts = c Y + d,
= c x2 + d, •••• 6.3
where, c and d are constant coefficients.
The coefficients in the equations 6.2 and 6.3 have been
established by means of a lea.st square fit through the experimental
points, and their values are given in Table 2.
The relationship between the transient pressure and the
average temperature established in this section not only serves
for the calculation of the nnass of the air in the cylinder but also
gives an insight into the thermodynamics of the expansion process
during a relatively slow disc:harge. The measurement of the transient
pressure in the cylinder during discharge is clearly an easier
experimental task than the measurement of a meaningful temperature.
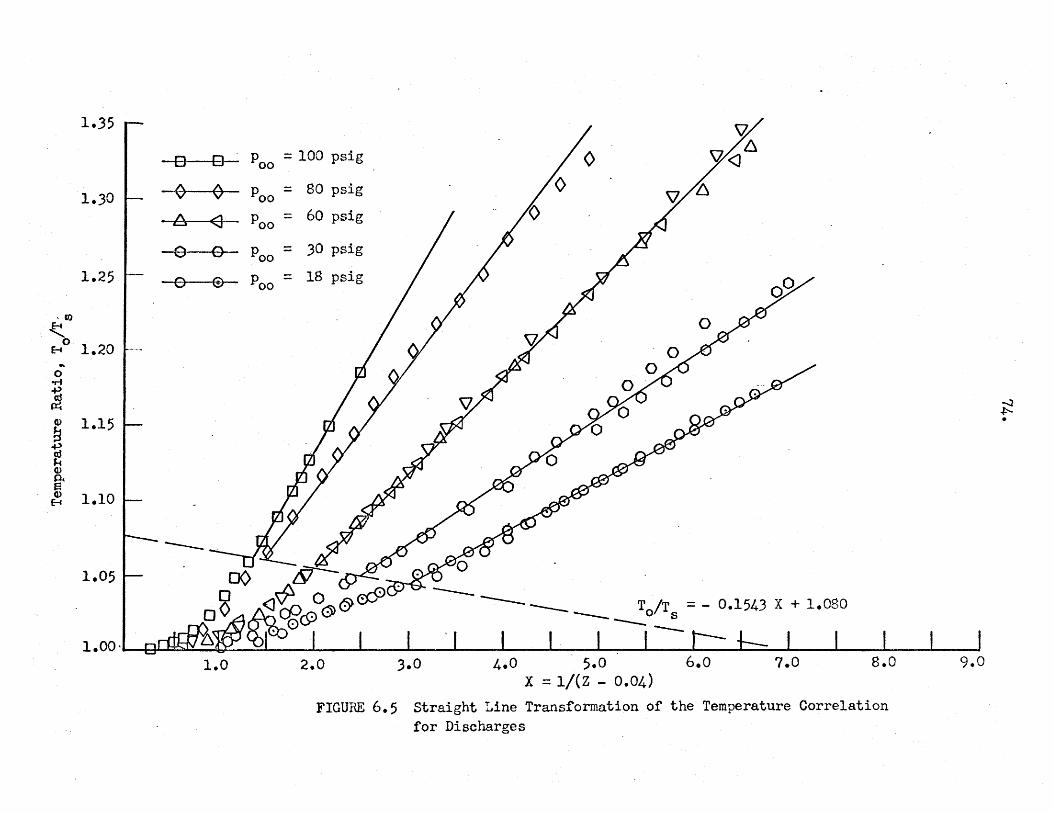
1.35
1.30
1.25
·{/.)
~ 0
E-4 1.20 ...
0 ori
~ C1) 1.15 ~ 1tl ~ C1) P. s C1) 1.10 (-i
1.05
~ ~ p =lOOpsig /0 o/<JL\
00
-0 0 p = 80 psig 00
-8 <3 p = 60 psig 00
0 o-- Poo = 30 psig
--e--s- p = 18 psig 00
------- ------ T /T = - 0.1543 X + 1.080
--- 0 s -----1.0 2.0 J.O 4.0 5.0 6.0 7.0 8.0
X = 1/(Z - 0.04)
FIGURE 6.5 Straight Line Transformation of the Temperature Correlation for Discharges
9.0
-..J ~ •
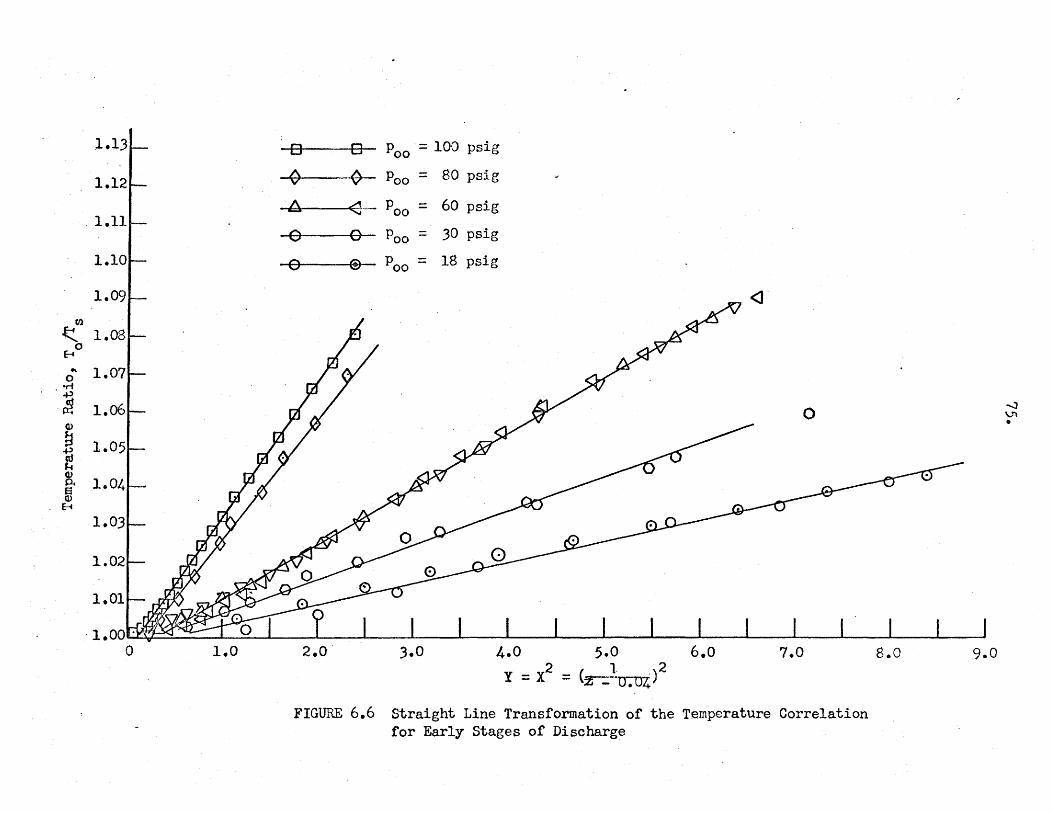
til
~ 0
8 .. 0 .,...,
·~
~ 1d J..c & s Q)
8
1.01
1.0
n n p00
·= 100 psig
(} () P00 = 80 psig
-~ <l·- poo = 60 psig
-e 0 Poo = 30 psig
e ® Poo = 18 psig
<1
0
2.0 J.O 4.0 5.0 6.0 7.0 2 { l )2 y =X = z-::-~
FIGURE 6.6 Straight Line Transformation of the Temperature Correlation for Early Stages of Discharge
8.0 9.0
.....:J \)"\
•
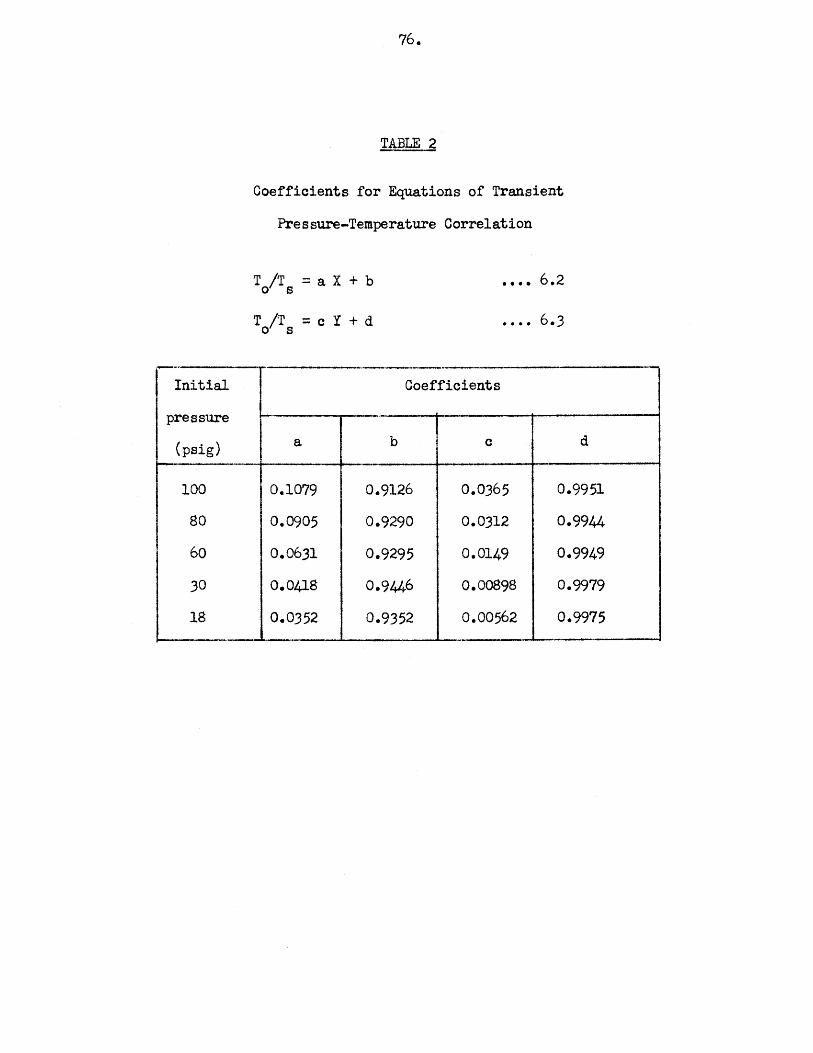
76.
TABLE 2
Coefficients for Equations of Transient
Pressure-Temperature Correlation
T/T =aX+b 0 s
T /T = c Y + d 0 s
•••• 6.2
•••• 6.3
__ ::1 __ _ --~
Initial Coefficients
pressure
(psig) a b c d
100 0.1079 0.9126 0.0365 0.9951
80 0.0905 0.9290 0.0312 0.9944
60 0.0631 0.9295 0.0149 0.9949
30 0.0418 0.9446 0.00898 0.9979
18 0.0352 0.9352 0.00562 0.9975
l
77.
The use of the empirical relationship, Equations 6.2 and 6.3, to
predict the average temperature of the air from values of the
instantaneous pressure obtained from an indicator diagram is
illustrated in Figure 6.7 in which the predicted and measured values
of the temperature have been compared. In that figure, the solid
lines represent the calculated values obtained from the pressure-
time records using Equations 6.2 and 6.3, while the experimental
values obtained by the double averaging procedure outlined earlier
are given by the points. It is evident that agreement between the
measured and the predicted values is very good, the maximum error
being less than one percent.
6.1.5 Index of expansion
In the review of literature presented in Chapter 2, the
limiting nature of a polytropic process has been discussed. It is
doubtful whether the use of a constant index of expansion to relate
the pressure and temperature in a practical discharge process is
meaningful, particularly under the conditions associated with a
relatively slow discharge.
At a given instant during a discharge, the thermodynamic
state of the air in the cylinder defined ~f p0
and T0
can be related
to the initial state by an equation of the form:
T /T - ( / )~' -~1 ) /n' 00 0 - p QQ p 0 I '
•••• 6.4
where n1 is a numerical value.
It follows that:
(n 1 - 1)/n' = ln(T /T )/ln(p /p ), 00 0 00 0
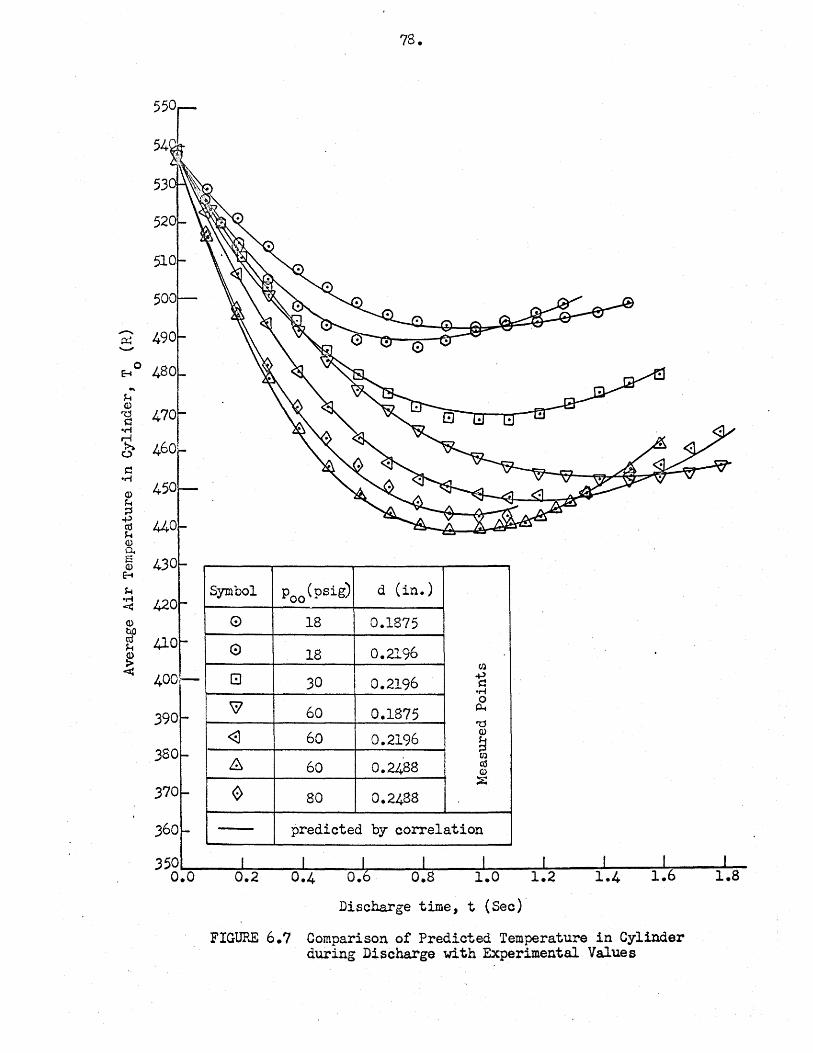
0 8
400r-
I
78.
Symbol Poo (psig) d (in.)
0 18 0.1875
0 18 0.2196 (Jl
(!] 30 0.2196 ~ -n
w 0
60 0.1875 P-.
'0 <:] 60 0.2196
Q)
~ &
Cll
60 0.2488 t\S (l)
::E: 0 80 0.2488
- predicted by correlation
Discharge time, t (Sec)
FIGURE 6.7 Comparison of Predicted Temperature in Cylinder during Discharge with Experimental Values

79.
= ln ~ T /T ) ( T /T )1 /ln ( p /p ) , ~ 00 s s 0 ~ . 00 0
= ln(T /T )/ln(P /p ) - ln(T /T )/ln(p /p ) , 00 s 00 0 0 s 00 0
or,
1/n' = 1/k + ln(T /T )/ln(p /p ) . 0 s . 00 0
• ••• 6.5
Clearly n' is not constant throughout the expansion process since
the term T /T is a function of the initial pressure ratio, p /p , o s oo a
and the dimensionless group, z =1/(p /p )(t/;rt, (Figure 6.4). Thus, a o
n 1 will also be a. function of the two groups, p /p and Z. In a oo a
practical expansion process, n' is always less than k since the last
term of Equation 6.5 is always positive. In the limiting case of
an isentropic expansion, T = T , and n' becomes constant and equal 0 s
to the ratio of the specific heats, k.
The index n' in Equations 6.4 and 6.5 is different from
the index n associated with a polytropic process. Although the
values of n' found from Equation 6.5 may be substituted into
Equation 6.4 to relate the instantaneous pressure, p , and tempera
ature, T0
, to their initial values, nevertheless, it cannot be
regarded as an index of expansion. It must be noted that n1 as
calculated from Equation 6.5 can neither be used to relate the
instantaneous conditions at different points during a process to
the initial state, nor can it be used to calculate any quantity
which depends on the path of the process.
A number of values of the index, n' have been calculated
by means of Equation 6.4, from pressure and temperature measurements

80.
obtained in the course of the present investigation and the results
have been plotted against Z = 1/(p /p ) (t/?"")t as shown in Figure 6.8. a o
In this Figure, it is seen that values of n' for the different dis-
charges considered in the analysis fall approximately on a single
curve. The dependence of n' on the initial pressure, p00
/pa' appears
to be insignificant. In the earlier stages of the expansion,
corresponding to large values of z, n' approaches the value of the
ratio of the two specific heats and, towards the end of the discharge,
corresponding to small values of Z, n' decreases to a value less than
unity. In a very rapid discharge, however, it is not known whether
the assumption of isentropic expansion is a valid one although the
value of Z for the whole of the expansion will be large. The amount
of heat transferred to the air in the cylinder during an expansion
process evidently depends both on the duration of the expansion and
on the temperature difference between the air and the cylinder wall.
In Figure 6.e, conditions associated with large values of Z
correspond to short discharge times and small temperature differences.
In a rapid discharge, however, although the duration of the ex-
pansion is small, nevertheless, during the later stages the
temperature difference between the cylinder wall and the air is
large. At any rate, if heat is transferred to the air in the
cylinder, the index n' in Equations 6.4 and 6.5 will no longer be
constant. Therefore, it would appear that the assumption made qy
Geyer(l2) and b,y Weaving(9) that the expansion is polytropic, is
clearly incorrect.
Values of the temperature obtained from the present

.........
~0 0
~ -d
~ ......... Cll
~ 0
E-4 -s:l ....:t +
~ M
II
~ ,....
1.00
0.90
0.80
0.70
0,60
o.
\------------------L------------------------, \ \
\ . \. Isothermal expans1.on
·.$
·-t :t· *-· .... ·,.~. ·: ·.
::"J .• ••• .=-\• ••
-~~=~:~....... . . · ..... . . . ·: ... · i ...... · .... : .. . .. . . . . . ... . ·-----------,-z----. ----------. -
Isentropic expansion 1/k = 1/1.4 = 0.71429
z
FIGURE 6.8 Variation of the Index of Expansion
3.5
00 ~ •
82.
experiments and those calculated from the initial conditions py
means of a constant index of expansion are compared in Figure 6.9.
The broken lines through the points represent the locus of the quasi
static states obtained from pressure and temperature measurements
while the solid lines correspond to calculations using the constant
value of n found from the conditions at the points marked. Dif
ferences between the two temperatures indicate the errors when a
constant exponent is used. It is clear that the results calculated
in this way are not satisfactory.
6.1.6 Effect of heat transfer on the pressure-time relationship
of air in the cylinder during discharge
The effect of heat transfer on the transient temperature
of the air in the cylinder during expansion has already been dis
cussed in previous sections. The question may be raised whether
the transfer of heat affects the pressure in the cylinder during the
expansion process. Under the conditions of the present investigation,
heat is transferred spontaneously from the cylinder wall to the air
when the temperature difference between them is increasing during
expansion. It is believed that the magnitude and the rate of heat
transfer do not have an appreciable effect on the pressure-time
relationship for the air in the cylinder. Heat transferred to the
air tends to increase the pressure but, at the same time, the
increase in pressure will be balanced b.1 an increase in the dis
charge rate, so that the pressure-time record in the cylinder
remains unchanged. To verify this hypothesis, an experiment has
been carried out with different rates of heat transfer to the air
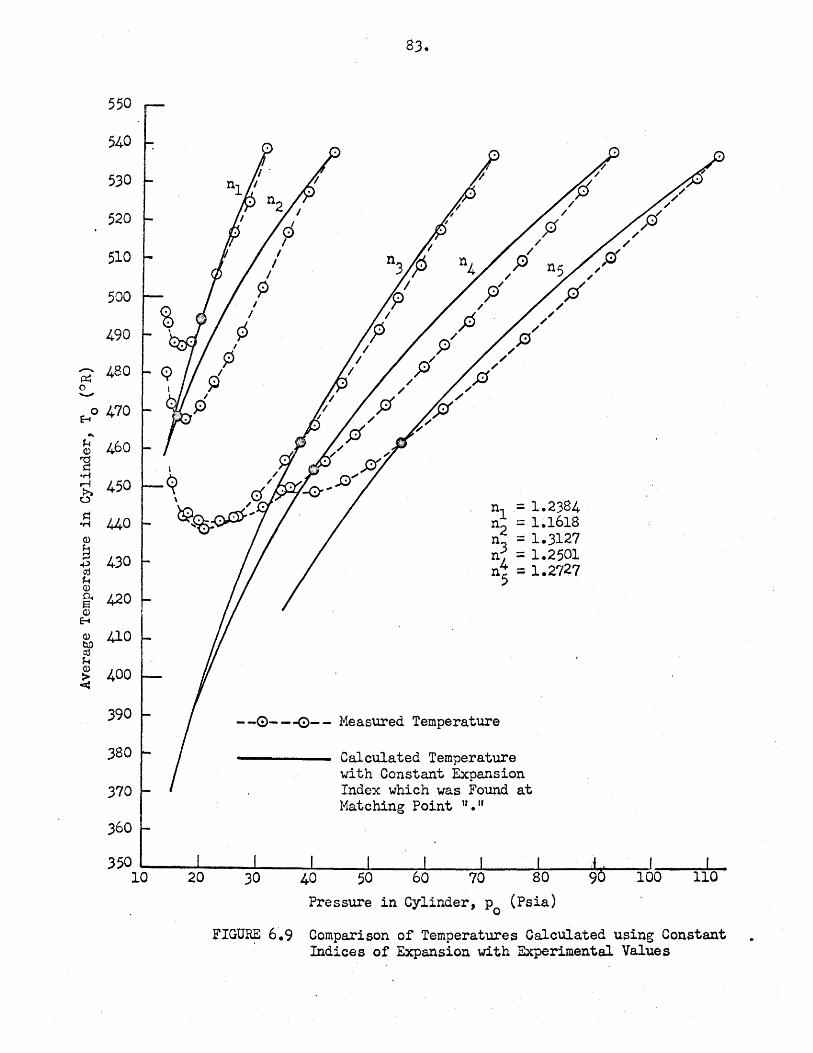
550 r-
540
530
520
510
500
490
- 480 ~ 0 -80 470
... f-1 460 (!)
"d ~
•M r-i 450 6 ~ 440 -M
(j) s 430 ~ clj f-1 Q)
0.. 420 s Q)
E-t Q) 410 ~ M Q) 400 ~
390
380
370
360
350 10
I
):) >1
¢ I
p
I I
I I
I
~
83.
I
0 I
--0---0-- Measured Temperature
Calculated Temperature with Constant Expansion Index which was Found at Matching Point 11 • 11
Pressure in Cylinder, p (Psia) 0
FIGU~ 6.9 Comparison of Temperatures Calculated using Constant Indices of Expansion with Experimental Values
using an electric heating coil.
An electrical heater of 700 watts maximum output was
installed inside the cylinder to provide di~ferent rates of heat
transfer during the expansion process. The pressure-time records
obtained from such experiments are given in Figure 6.10. Figure
6.10a is for a discharge under normal conditions, that is without
an additional supply of heat. Figure 6.10b shows the result
obtained when the addition of heat starts simultaneously with the
commencement of discharge. Figure 6.10c shows the result of an
experiment in which heat is added to the air in the cylinder prior
to the commencement of the discharge. The discharge is initiated
when an increase of pressure due to the addition of heat is first
observed. When these records are superimposed on one another, no
differences in the rate of change of pressure can be observed.
Although the results of this simple experiment can only be regarded
as being qualitative, nevertheless, it is reasonable to conclude
that when heat is transferred spontaneously between the air and the
wall of the cylinder, the rate of change of pressure in the cylinder
is unaffected.
6.2 Transient Flow Through Orifices
6.2.1 Introduction
To obtain the transient mass flow through an orifice during
the discharge of air from a cylinder, the instantaneous residual mass
of the air in the cylinder is first determined in terms of known
values of the pressure and the average temperature from the

(a)
85.
pi ~,-------
1
I I I
PI I I I
t
(b) I
(c)
I
Poo P~-----------------------------------
FIGURE 6.10 Pressure-time Relationships for Discharges with Different Rates of Heat Transfer to the Residual Air in the Cylinder ,
p = 60 psig, d = 0.1875 in., t = 0.49784 sec./in~ 00
(a) No heat during discharge (b) Heat adO.ed from the commencement of discharge (c) Heat added for some time before discharge
86.
equation of state.
The conservation of mass flow gives the following relation:
•••• 6.6
where, mt is the transient mass flow through the orifice, edt is the
transient coefficient of discharge and M is the residual mass of the a
air in the cylinder at the instant considered.
From the equation of state, the mass of the air, M , in the a
cylinder is given by:
M = f V = p V/RT a o o o •••• 6.7
where V is the volume of the cylinder, which is constant, p and T 0 0
are respectively the instantaneous pressure and the weighted
average temperature of the air in the cylinder. Substituting 6.7
into 6.6, the transient mass flow, mt, through the orifice becomes:
_ -poV 1 dpo l dTo mt - RT <p- dt - F dt )
0 0 0
•••• 6.8
The pressure, p , in the cylinder can be measured accurately from 0
the pressure-time record of the discharge. The temperature, T0
, of
the air may be calculated if the nature of the expansion process is
known. For isentropic expansion, the transient temperature is
related to the instantaneous pressure and the initial conditions by:
For an actual expansion process under the conditions specified in
the present investigation, the average temperatures of the residual
air in the cylinder can be predicted satisfactorily from the
pressure-time record for the discharge by means of the relationship
87.
derived in Section 6~(page 73). The only limitation in the accuracy
of the method of estimating the instantaneous mass flow rate from the
equation of conservation of mass flow lies in the evaluation of the
slope, dp0/dt, from the pressure-time record, (Equation 6.8).
Although the polynomial equation obtained by curve fitting can
accurately reproduce the pressure at any instant, it does not give
the corresponding gradient to the same accuracy. Difficulties in
herent in the curve fitting process are encountered at the beginning
and towards the emd of the discharge. However, in spite of the
limitations of this approach it appears to be the most practical
method of calculating the transient mass flow through an orifice
during discharge. The accuracy of the calculated results are dis
cussed in a later section.
6.2.2 Experimeatal considerations
Before discussing the transient mass flow through an
orifice, it is desirable, for practical purposes , to separate the
effects on the flow due to orifice geometr,r, to the transfer of heat
and to the transient fluid dynamic factors.
The effect of orifice geometrr can be eliminated by keeping
constant the appropriate group which is characteristic of the
orifice. The relevant geometrical group which has to be taken into
account in the present experiments is the length-diameter ratio of
the orifice.
The effect of heat transfer to the air in the cylinder
during expansion cannot actually be isolated from the other independ
ent variables since it is not possible in practice to achieve a

88.
truly adiabatic cylinder wall. However, it has been fo1md that,
within limits, the rate of heat transfer to the residual air in the
cylinder during expansion does not affect, in ~ wa,, the relation-
ship between the pressure of the air and the time during discharge.
It may be argued, therefore, that the same relationship between
pressure and time will hold in the absence of heat transfer. Since
it is difficult to postulate a significant dissipative mechanism
during the expansion of the residual air in the cylinder, such an
expansion may be regarded as being isentropic. Thus, using the
isentropic relationship between the pressure at any instan~ as
given by the pressure-time record,, and the temperature, the equation
of conservation of mass flow, Equation 6.8, gives a ~pathetical mass
flow rate, mts' through the orifice.
For an isentropic expansion, T = T , and the relationship 0 s
between the mass flow number, Gts' and the other independent
variables, Equation J.5a,is reduced to:
•••• 6.9
The functional dependence of Gts on these independent variables will
be discussed in later sections. For a given discharge, the effect
of orifice geometry and of fluid dynamical variables on Gts will be
the same as those on the actual mass flow number, Gt.
Two sets of experiments may be carried out on the basis of
the results of dimensional analysis, namely, Equation 6.9 for isen
tropic conditions and Equation 3.5a for diabatic conditions, namely,
•••• 3.5a.
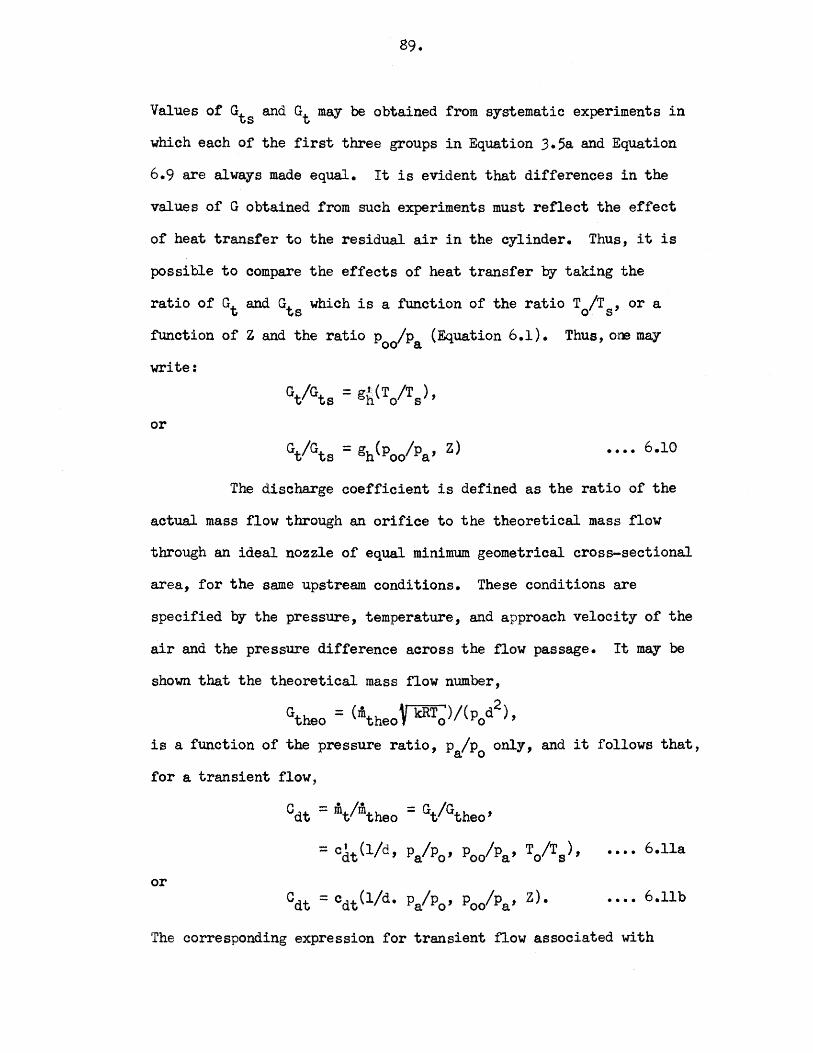
Values of Gts and Gt may be obtained from systematic experiments in
which each of the first three groups in Equation 3.5a and Equation
6.9 are always made equal. It is evident that differences in the
values of G obtained from such experiments must reflect the effect
of heat transfer to the residual air in the cylinder. Thus, it is
possible to compare the effects of heat transfer by taking the
ratio of Gt and Gt which is a function of the ratio T /T , or a s 0 s
function of Z and the ratio p /p (Equation 6.1). Thus, ore may oo a write:
or
•••• 6.10
The discharge coefficient is defined as the ratio of the
actual mass flow through an orifice to the theoretical mass flow
through an ideal nozzle of equal minimum geometrical cross-sectional
area, for the same upstream conditions. These conditions are
specified by the pressure, temperature, and approach velocity of the
air and the pressure difference across the now passage. It may be
shown that the theoretical mass flow number,
Gtheo = (mtheo V kRT~)/(pod2 )' is a function of the pressure ratio, p /p only, and it follows that, a o
for a transient flow,
0dt = mt/mtheo = Gt/Gtheo'
= cdt(l/d, PalPo' Poo/Pa' To/Ts)' •••• 6.lla
or •••• 6.llb
The corresponding expression for transient flow associated with
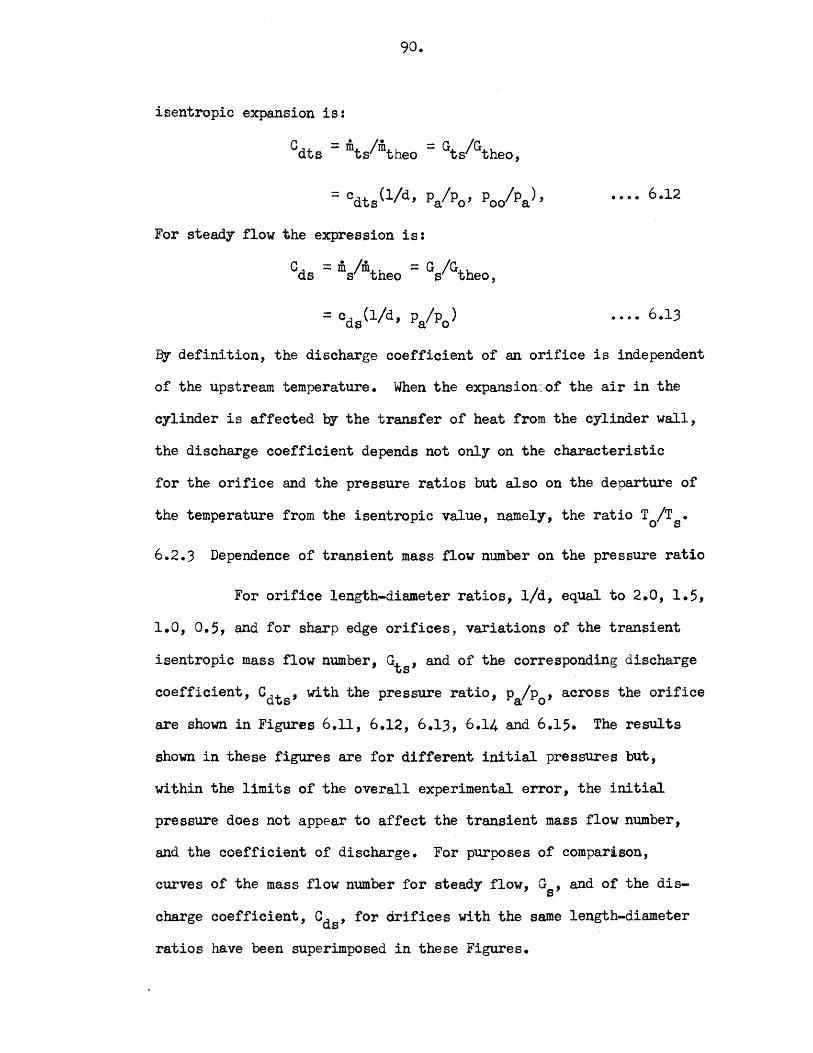
90.
isentropic expansion is:
c = m /m = G /G dts ts theo ts theo,
•••• 6.12
For steady flow the expression is:
cds = m /m = G /G s theo s theo,
= cd {1/d, p /p ) s a o •.•• 6.13
B.r definition, the discharge coefficient of an orifice is independent
of the upstream temperature. When the expansion: of the air in the
cylinder is affected by the transfer of heat from the cylinder vall,
the discharge coefficient depends not only on the characteristic
for the orifice and the pressure ratios but also on the departure of
the temperature from the isentropic value, namely, the ratio T0/Ts.
6. 2. 3 Dependence of transient mass flow number on the pressure ratio
For orifice length-diameter ratios, 1/d, equal to 2.0, 1.5,
1.0, 0.5, and for sharp edge orifices, variations of the transient
isentropic mass flow number, Gts' and of the corresponding discharge
coefficient, edt , with the pressure ratio, p /p , across the orifice s a o
are shown in Figures 6.11, 6.12, 6.13, 6.14 and 6.15. The results
shown in these figures are for different initial pressures but,
within the limits of the overall experimental error, the initial
pressure does not appear to affect the transient mass flow number,
and the coefficient of discharge. For purposes of comparison,
curves of the mass flow number for steady flow, G8
, and of the dis
charge coefficient, Cds' for drifices with the same length-diameter
ratios have been superimposed in these Figures.

1.00
0.90
0.80
0.70
d ... ~ 0.60
...0
~ ;3 0 0 .50 c;! U) U)
-... ~ 0.40 "'~
0.30
0.20
0.10
------------- .,.,.--
--c ds
.... --------------.------------------------------------------
',, 0ctts
...... _ -----
/ /
-----G theo
------------------------------------G·
s ------------------------------------------ .. ,...- • • • • . G ~ • ~ • ts / ~~ _.._,_ ________ ................. .
0.90
o.so
0.70
--~ 0.50
• Experimental points thought to be associated with starting process
0.40
o.oo I I I I I I I I I I I I I I I I J__--'-_ _.___.L-__, 1.00 0.90 0.80 0.70 0.60 o.so 0.40 0.30 0.20 0.10 o.o
Pressure Ratio, p fp . a o
FIGURE 6.11 Effect of Pressure Ratio, (1/d = 2.0)
<d 0 .. ~ <D ..... 0
•ri
~ (1) 0
0
"'· ....., (1) t\0 • ~ 0 Ul
•rf t:l

1.00
0.90
o.so
0.70
c~
"' 0.60 H a>
ro s 7. o. 50 ~ 0
r--4 Iii
(f) 0.40 (f)
... "1 ,..:: ....
0.30
0.20
0.10
_..,_ ... -----
/·' /,
,
/
/ /~ .
Gdts
G theo _......-....---------- ------- . -~~--------- -~---- - ----------- ----
-CPrG-l,,.~ ~~~,~t.""f-r*.!
• Experimental points thought to be associated . with starting process
.9o
.so
.7o
0. 00 I I I I I I I I I I I I I I I I . I I I I I. JO 1.oo 0.90 o.8o o.7o o.6o o.so o.1~o o.3o o.2o 0.10 o,o
Pressure ratio~ p /p ·a o
FIGUIKE 6.12 Effect of Pressure Ratio (1/d = 1.5)
"d (.)
~
~ -rl C)
...... ft..t ~ a> 0
0
&'a
~ 0
.ttl ·ri Q•
·.
~ l\)
•
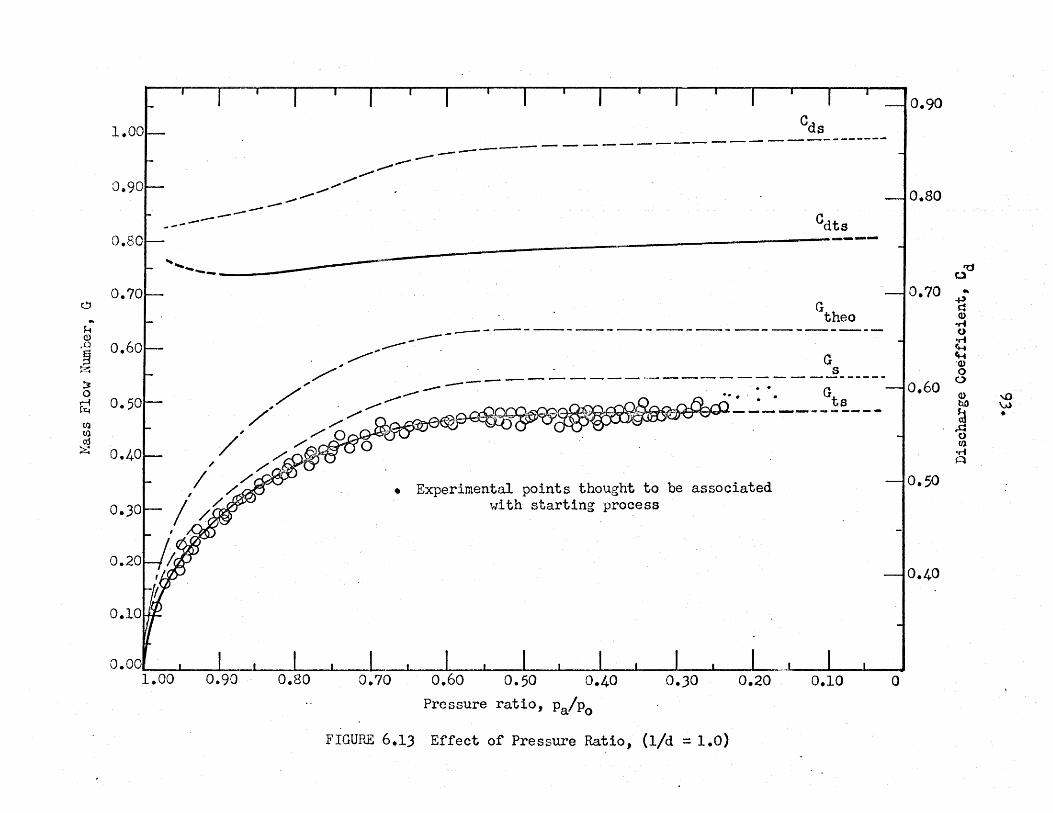
0 ...
H 0)
ro
~ ~ 0 rl f"C.t
til Ul oj ~
-
o.oo 1.00
~---...,....,..., ----cds
-----------------------------------------
_......,., --------
/' ,
/
0.90
cdts
--------------------------------------------------~-----------------------------------------------
/"
0.80
~~
/'
___ ... ---G theo
--------------------------------G
s ------------ -·------- ---------------- . . Gts
- ..-.lli'VVl~~ .. ¥,_~.4:~. -----------~~~~~- ~~--
• Experimental points thought to be associated with starting process
0.70 0.60 0.50 0.40 0.30 0.20 0.10
Pressure ratio, pafp0
FIGURE 6.13 Effect of Pressure Ratio, (1/d = 1.0)
0.90
0.80
orr:J
0.70 .. ...., ~ Q) ..... 0 •ri lH tt--4 'G) 0
0.60 0
(]) '-'> bO
] '-'> •
0 {/)
•ri Q
o.so
0.40
0
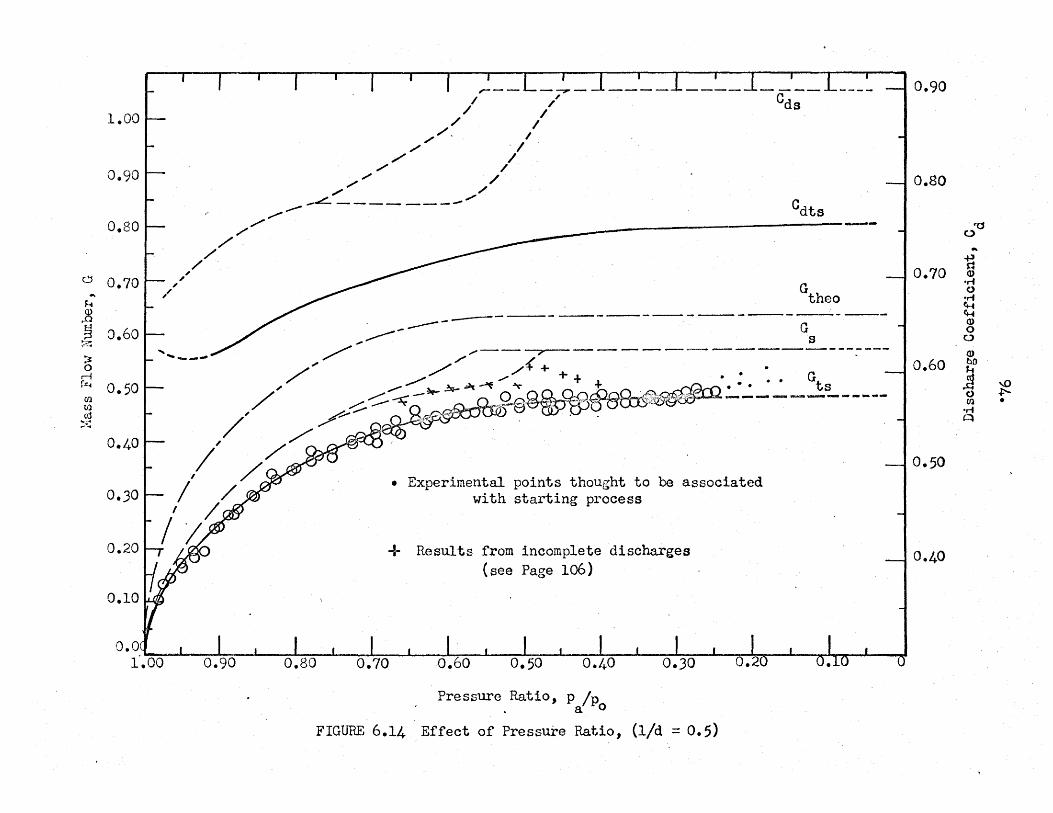
Cl ...
H $ ~ ~~
~ 0
r-{ r:c~
Ul (I)
cd ~~
1.00
0.90
0.80
0.70
0.60
0.50
0.40
0.30
0.20
0.10
, ,'
//
//
//
//
// / .
,.---
/1
//
--
_L-/ --- / /..... _____ ..... Gdts
G theo
..,-----------------------------------
0.90
0.80
0.70
/' /-- G /' / ~ ---------- s / / /( + . -----------:----
,.,.~ ..,., + + • I .---- -~~..,-'f .,. + • • G _ 0.60
/? ---.-:: Q£~.~_,Qe.QJ;6._Qoc.OoO-drs:.~ • • • • • ts ...,..,.. "~ - -:-""w->:cPtl 0~------------
• Experimental points thought to be associated with starting process
+ Results from incomplete discharges (see Page lo6)
Pressure Ratio, p fp a o
FIGURE 6.14 .Effect of Pressure Ratio, (1/d = 0.5)
o.so
0.40
'U (.) .. ~ (J) •rf () ..... ~ «'H (J) 0 (.)
Q) bO J..t
11 '-'> +"'-()
(ll • ·rf Q
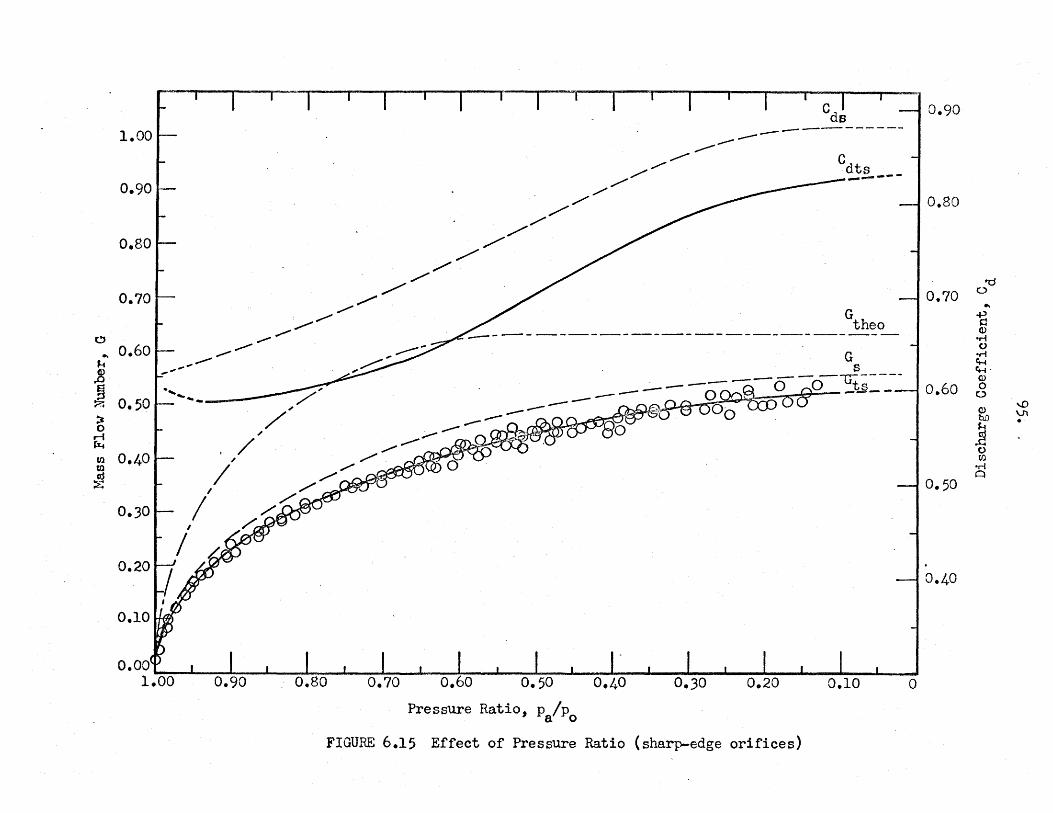
0.70
~
.. 0.60 f..i
.8 § ~ 0.50 :t 0
&! Cfl 0.40 C1l
~
0.30
0.20
0.10
_..,...,...... ,........,.....,.
_, ... '--. / ,..........,..,..
//
/,.,
//
// //
// .,..,.,..,
---------- ------c dts _______ ..
G theo ----------------------------------------
Pressure Ratio, p /p a o
FIGURE 6.15 Effect of Pressure Ratio {sharp-edge orifices)
0.90
0.80
0.70 oro
.. ~ Cl)
•r-t t>
•r-f 4-4 ~· (l)
o.6o 0 0
Q) \,.()
bD Vl
~ •
() tr.l
•r-t ~
0.50
0.40
0

96.
It is clear from Figures 6.11 to 6.15 that the mass flow
numbers, Gs and Gts' and the corresponding coefficients of discharge,
ads and cdts' are functionsof the length-diameter ratio, 1/d, and
the pressure ratio, p /p , across the orifice. Their functional a o
dependence on the pressure ratio, p /p , represented by g and gt a o s s
in Equations 3.6 and 6.9 on the one hand, and by cds and cdts in
Equations 6.12 and 6.13 on the other, reveal the transient effects.
In Figures 6~11, 6.13, 6.14 and 6.15, the mass flow number
for transient flow, Gt , and the corresponding discharge coefficient, s
cdts' are alway-s smaller than those for steady flows {about 10 to 15
percent in the case of mass flow number), except at the end of the
discharge when the flow approaches the steady state. It may also be
seen that at the beginning of the discharge, especially at high
initial pressures, some of the experimental points lie above the
mean curve. These points are considered to be associated with the
process of starting the transient flow through the orifice but may
well be the effect of the particular experimental technique employed.
In this technique, before the discharge is initiated, the orifice
and a small region downstream of it, due to the stretching of the
diaphragm material, is filled with air at the initial pressure. If
this explanation is correct, the anomalous points ca1'}!lot be regarded
as describing the transient flow behaviour which is of interest in
the present investigation. In order to understand the mechanism by
which a transient flow is adjusted to changing upstream conditions,
a more detailed study of the starting process alone may be worthwhile.
For a given length-diameter ratio, the pressure ratio
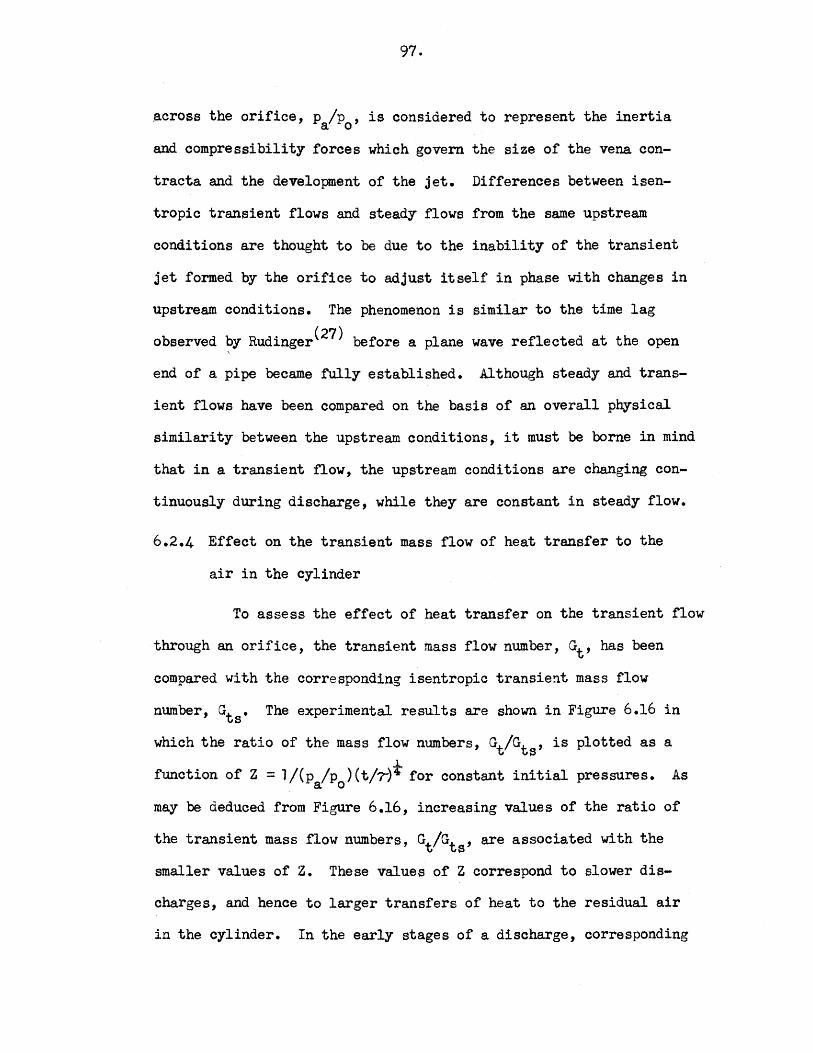
97.
across the orifice, p /p , is considered to represent the inertia a o
and compressibility forces which govern the size of the vena con-
tracta and the development of the jet. Differences between isen-
tropic transient flows and steady flows from the same upstream
conditions are thought to be due to the inability of the transient
jet formed by the orifice to adjust itself in phase with changes in
upstream conditions. The phenomenon is similar to the time lag
observed ?Y Rudinger( 2?) before a plane wave reflected at the open
end of a pipe became fully established. Although steady and trans-
ient flows have been compared on the basis of an overall pnysical
similarity between the upstream conditions, it must be borne in mind
that in a transient flow, the upstream conditions are changing con-
tinuously during discharge, while they are constant in steady flow.
6.2.4 Effect on the transient mass flow of heat transfer to the
air in the cylinder
To assess the effect of heat transfer on the transient flow
through an orifice, the transient mass flow number, Gt' has been
compared with the corresponding isentropic transient mass flow
number, Gts. The experimental results are shown in Figure 6.16 in
which the ratio of the mass flow numbers, Gt/Gts' is plotted as a
function of Z = l/(p /p ) (t/7)t for constant initial pressures. As a; 0
may be deduced from Figure 6.16, increasing values of the ratio of
the transient mass flow numbers, Gt/Gts' are associated with the
smaller values of Z. These values of Z correspond to slower dis-
charges, and hence to larger transfers of heat to the residual air
in the cylinder. In the early stages of a discharge, corresponding
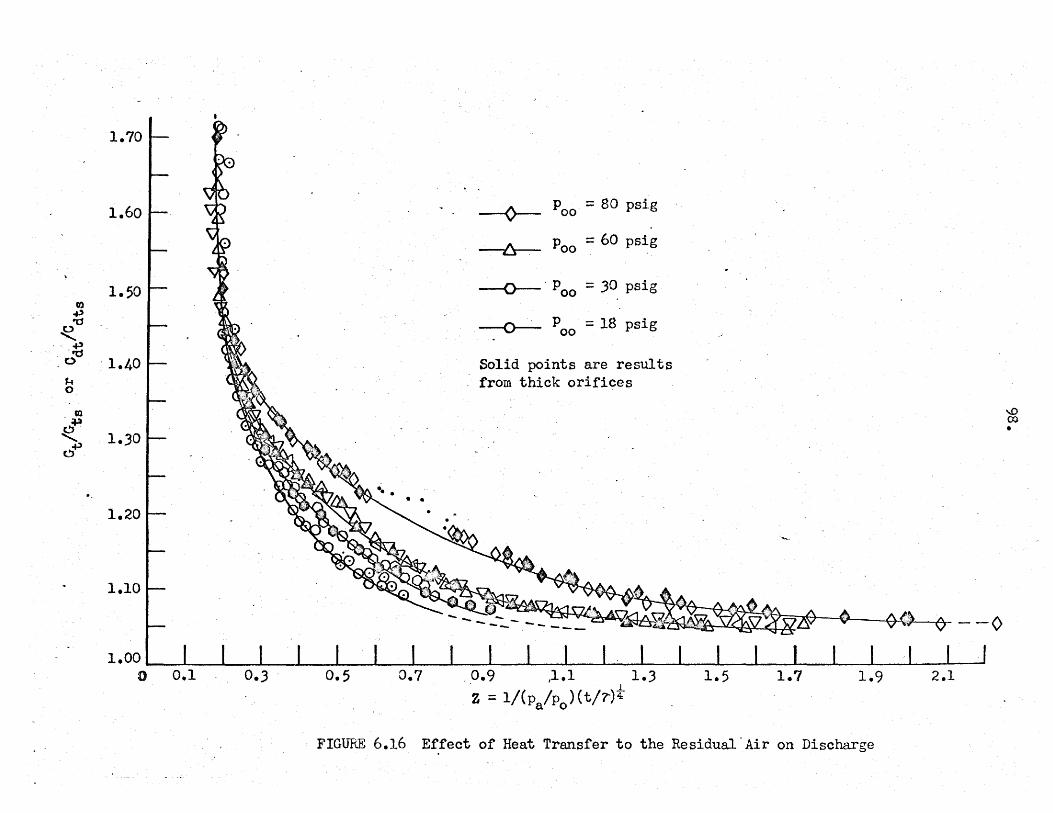
1.70
1.60 1- '\IQ . --o-- p = 80 psig 00
~ p =60 psig 00
1.50 r- II --o- · P 00
= .30 psig ft.) ...., r- ~ --o----:.- P = 18 psig ~
~ 00 .. ....,
orr:$
1.40~
~ Solid points are results
J..t from thick orifices 0
fll ...0
'a~ 00 •
' 1.30 a""'
~ r- .~, ·' ~· ...
1.20 I ~WA ~·-~. --
1.10
0 • .3 0.5 0.7 0.9 ,1.1 1 • .3 1.5 1.7 1.9 2.1 . l
z = 1/(p /p )(t/£)4 a o
FIGURE 6.16 Effect of Heat Transfer to the Residual'Air on Discharge

99.
to large values of Z, heat transfer increases the mass flow number
by about five percent above the corresponding isentropic values.
For the present, only those results after 0.1 second from
the beginning of the discharge can be used with confidence owing to
the difficulties inherent in the curve fitting process. However,
in the very early stages of a discharge the numerical value of Z
will be very large since both p /p and t/r- are small. In Figure a; 0
6.16, from the trend of the curves it appears that the very early
stages of the discharge m~ be considered to be isentropic. For
discharges longer than 0.1 second the heat transfer effect becomes
increasingly important and cannot be neglected, even when the inner
surface of the cylinder is insulated thermally as in the experiments
described in this thesis. However, it cannot be deduced with any
certainty from the results obtained in this investigation that in a
fast discharge occup,ying much less than 0.1 second flow through the
orifice is free from the effects of heat transfer to the residual
air in the cylinder. Clearly, in the early stages of such a dis-
charge it would be valid to assume that the expansion is approx-
imately isentropic. In the later stages, when the residual pressure
will be small, a relatively large temperature difference will exist
between the air and the cylinder wall although t/?- would be small.
If the results in Figure 6.16 can be extrapolated to fast transient
discharges without wave action, in the later stages of the discharge
both p /p and t/1'- would approach a value of unity. Therefore, a a o
five percent increase of the mass flow number from the corresponding
isentropic value may be expected to occur on the basis of the
100.
weighted average temperature. However, no firm conclusion can be
drawn at present concerning the effects of heat transfer in very
rapid discharges.
The points on each curve of Figure 6.16 were obtained from
orifices of different diameters and of different length-diameter
ratios. It appears that the effect of heat transfer to the air in
the cylinder on transient mass flow through an orifice, therefore,
is independent of the geometry of the orifice. The discrepancy
between the experimental points and the mean curve drawn through
them, and which is particularly marked in the case of an initial
pressure of 80 psig., is due to a limitation of the straight line
correlation between the transient pressure· and average temperature
(Equations 6.2 and 6.3, page 73). While the temperature is
correctly predicted by the correlation, it is evident that the rate
of change of temperature in the region of the intersection of the
two straight lines (Figure 6.5, page 74) cannot be determined with
the same degree of accuracy.
6.2.5 Effect of length-diameter ratio of orifice on the transient
mass flow
It has been established experimentally that the length
diameter ratio, 1/d, of the orifice plays an important role in
steady flow through orifices(6). Other geometrical characteristics
of an orifice, such as the shape and the direction of the flow
passage(S4), also affect steady flows. Geometrical factors m~ also
beexpected to influence the transient flaw through an orifice. In
the present investigation only circular square-edge orifices have

101.
been examined. Apart from the orifice diameter the only geometrical
variable is the length-diameter ratio of the orifice.
For a discharge from given initial conditions and for the
same orifice diameter, the effect of the length-diameter ratio on
the flow through the orifice would be reflected in the pressure-time
relationship for the discharge. The most convenient method of
exaaining this effect is to compare the transient isentropic mass
flow numbers, calculated from the experimental pressure-time curves
for different length-diameter ratios. Five length-diameter ratios,
namely, 2.0, 1.5, 1.0, 0.5 and sharp edge orifices have been used
for this purpose. The results are shown in Figure 6.17. As anti-
cipated, the effect of the length-diameter ratio on transient mass
flow is similar to that observed in steady flow( 6 ). No appreciable
difference in the mass flow numbers, or in the discharge coefficients,
can be found for thick orifices when the pressure ratios across
the orifice are less than 0.5283. When the pressure ratio is
greater than the critical value, the flow rate appears to be higher
for thicker orifices at a given pressure ratio, p /p • The be-a o
haviour of sharp edge orifices is also similar to that observed in
steady flows. While sharp edge orifices consistently give the
lowest values of the mass flow number for pressure ratios, pa/p0
,
* greater than 0.5283, the mass flow number does not become constant
*The use of the term 'area choking' for orifices is of doubtful significance. When the pressure ratio, Pafp0 , is equal to, or less than, the critical value the acoustic velocity is reached at the vena-contracta. However, in sharp edge orifices the area of the vena-contraota, and the mass flow, increases as the pressure ratio is decreased. The analogy to choking is valid only when the acoustic velocity is reached at the geometrical throat.
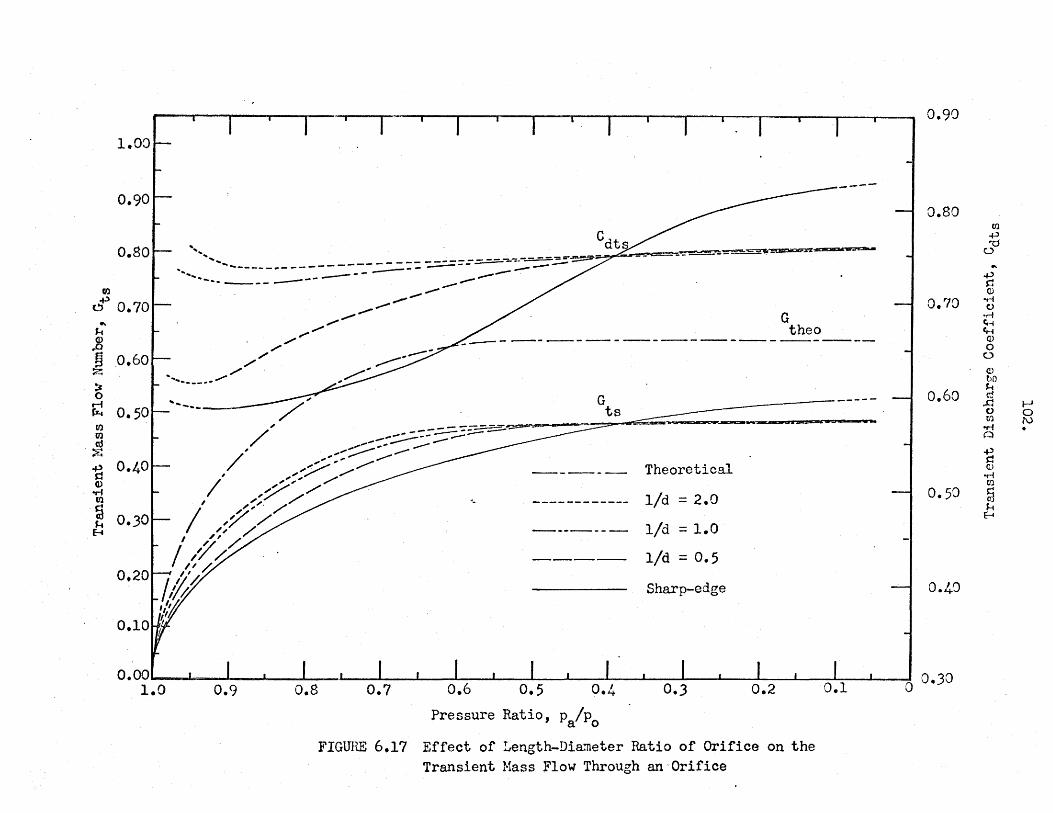
... J..i $ § ~
~ 0
&! ttl Ol (lj ~
"'d G)
or{ Ol a J-i
f-4
, I
..... ,, ...... ......... ... ______ ,.._ ------------ == -::.=.::===-- ---:..-:::.----:.:;::::~-.. ___________________ ---------,.------
~" G
._...~--
.,..,---- L . ,""""' ___ -------------------- theo / --------
...... ____ ........ "'
........ - ... -- --=::;:::.::::..-: :;-- --=_,/::;.----~-------_.,._, .... -:,..-,... .,....., .......
,.................. .........
~, ,' .,..., ........ , /
"~ / "-
Theoretical
1/d = 2.0
1/d = 1.0
1/d = 0.5
Sharp-edge
0.90
0.80
0.70
0.60
0.5C>
0.40
Q.QQl I I I I I I I I I I I 11
I I r I I I I I 0.30 1.0 o.9 o.8 o.? o.6 0.5 o.~ 0.3 0.2 o.1 o
Pressure Ratio, p /p a o
FIGURE 6.17 Effect of Length-Dia~eter Ratio of Orifice on the Transient Mass Flow Through an·Orifice
(I)
+' "0
0
"' +' s:: CJ)
•rl ()
.,.; CH ~
Q)
0 0
~ hD H C'd
,.q ~ () 0 til l\)
-rl . Q
.p s:: (l)
•rl t'l
§ H ~
103.
when the pressure ratios are less than the critical value, but
continuously increase as the pressure ratio is decreased.
6.2.6 The transient mass flow number
The effect on the transient mass flow of the combination
of the independent dimensionless groups given by the functional
relationship, Equation 3.5b, can be obtained by cross plotting the
results shown in Figures 6.11 to 6.16. The results have been
presented in three dimensions in the form of a number of 11 carpets"(SS)
for a single length-diameter ratio and for different initial
pressures in Figure 6.18. In this Figure the two families of inter
secting lines represent constant values of pressure ratios, pa/p0
,
on the one hand, and the dimensionless group Z = 1/f /p )(t/r·)t on 't'a o
the other. A similar plot for several length-diameter ratios but
for one initial pressure is shown in Figure 6.19. This method of
presentation of the results emphasizes the effect of initial
pressure (Figure 6.18) and the effect of the length-diameter ratio
of the orifice (Figure 6.19). However, for most practical purposes,
the information found in Figures 6.11 to 6.16 is adequate for the
determination of either the transient mass flow number, or the co-
efficient of discharge, for a given orifice when the pressure-time
relationship of the air in the cylinder during discharge is known.
The hatched area of each carpet in Figures 6.18 and 6.19
is a region which cannot be attained under the heat transfer
conditions of the present experiments. Small values of the pressure
ratio and the small values of Z are associated with large departures
of the temperature of the air expanding in the cylinder, T0
, from

~
(!)
0:: w en ~ ::> z 3: 0 ..J LL.
(/) (/)
<! ~
l-z w (/)
z <! a:: l- .70
.60
.50
FIGURE 6.18
.95
P00
= 80 PSJG .975
1.00
p =·60 PSIG 00
1.10
.95
= 30 PSIG .975
1.00
Ca~pet Diagram Showing the Variation of Tr.msient Mass Flow Number through Sharp Edge Orifices with PaiPo ~~d Z for Different J~itial Pressures

;: 0 ...J LL
en CJ) <C :E
1-z w CJ)
z <( 0:: ....
105.
.95
.975
.1./d =2.0
-1/d = 1.0
.95
.i./d =0.5 .975
1.00
FIGURE 6.19 Ce.rpet Diagram ~.ho\oring the Variation of Transient Hass Flow Number through Thick Orifices vTith
P~P0 and Z for an Initial Pres~~~ of 60 psig.

lo6.
the corresponding isentropic ~alues, T , in the early stages of a s discharge. Such conditions are not likely to be encountered in the
relatively slow discharges ex~ined in this thesis.
6.2.7 Remark on "hysteresis" :phenomenon in transient flow through
an orifice
In steady flows through orifices having a length-diameter
ratio of 0.5(6 ), a neysteresi$u loop, shown superimposed in Figure
6.14, was observed. At the t~me, it was suspected that this be-
haviour might be due to the e~fect of jet reattachment associated
with the particular geometrical configuration of the orifice. How-
ever, a similar effect was observed when the downstream geometr,y of
the orifice was changed. In transient flow experiments through
orifices with a length-diameter ratio of 0.5, there was no definite
evidence for the existence of ~steresis. Although, as may be seen
in Figure 6.14 a few experimeJtal points obtained for a discharge
from an initial pressure of 8~ psig. have been found to give higher
values than the mean curve, n~ar the critical pressure ratio, it is
not certain whether the higher values are an effect of ~steresis
or whether they are due to in~ccuracies in the gradients of the
pressure-time records. Such $ behaviour has not been found in dis
charges from initial pressuref of 60 psig. or less.
6.2.S Discussion of the errot of the calculated results
The accuracy of the instrumentation and some of the
limitations of the experiments have already been discussed in the
appropriate sections. The er~or which will be discussed in this
107.
section is, perhaps, the most serious because of the uncertainty of
its source. In analysing the experimental results, a polynomial
equation for the pressure variation was obtained qy a curve fitting
process using a number of points measured from the pressure-time
record. Although the curve generated by the polynomial equation
passes very nearly through the selected points, it is uncertain
whether the generated curve will coincide with the actual pressure
time record with the same degree of accuracy. The approximation can
be improved by increasing the order of the polynomial equation, but
coincidence of every point can never be achieved. For this reason,
while the pressure calculated ey the polynomial equation may be
regarded as satisfactor,y, a relatively larger error in the gradient
may occur randomly along the curve.
Since the errors incurred in this manner are randomly
distributed along the generated pressure-time curve, an estimate of
the overall error in the results may be made by means of statistical
methods. A hundred points were taken randomly along the curve in
Figure 6.15 and analysed by means of a polynomial least square re-
gression. The standard error for the isentropic mass flow number,
Gts' has been found to be 0.0124. It follows that the limits of
the 95 percent confidence level is ·~ 0.0183 along the mean curve.
These limits are considered to be satisfactory.

108.
7. COiiCLUSIONS
A systematic experimental investigation of slow transient
flows through circular square-edge orifices has been carried out.
Transient flow is initiated b,y the sudden release of dr,y compressed
air from a cylinder whose inner surface is insulated thermally.
The test orifice is mounted coaxially at one end of the cylinder.
The following conclusions have been drawn from the results of the
investigation.
1. It is impossible to provide a containing vessel with an
adiabatic wall for the air which undergoes expansion during
discharge. During the expansion of the air, temperature
gradients in both the radial and the axial directions in the
cylinder are established due to the transfer of heat from the
cylinder wall. The primar.y mode of the heat transfer is
convection. Clearly, under these conditions, the expansion
process of the residual air in.the c,ylinder is not isentropic.
2. In order to determine the mass of the residual air in the
cylinder, it is necessary to define a weighted average temp
erature of the air. At any instant during discharge the
average temperature is obtained, on the basis of weighted
density, by a double averaging procedure from the instantaneous
temperature distributions in the radial and axial directions in
the cylinder. This weighted average temperature is the temperature
when the residual air is mixed completely and isentropically. From
the same initial conditions, the ratio of the weighted average

109.
temperature, T , to the temperature, T , corresponding to an 0 s
isentropic expansion to the same instantaneous pressure, p , 0
at a given instant, is taken to represent the departure of
the actual expansion process from the isentropic law. This
departure has been found to depend on the instantaneous
pressure of the air and histor.y of the process. As far as
the expansion process is concerned, the geometry of the
orifice appears to be unimportant. From a given initial
pressure and temperature of the air, the instantaneous
temperature ratio, T /T , has been found to be a function of 0 s
the instantaneous pressure and the duration of the discharge
to this pressure, combined in the dimensionless form
Z = 1/(pa/p0
) (t/?"")t. This empirical relationship may be used
to predict, to an accuracy within one percent, the instant-
aneous average temperature of the air in the cylinder from the
pressure-time record of the discharge.
3· The nature of the empirical relationship between the instant-
aneous pressure and temperature of the air in the cylinder
during discharge invalidates the assumption of a polytropic
expansion and a constant index of expansion. A polytropic
expansion, as in the isentropic case, is a limiting one which
can never be achieved in a practical discharge process.
4• Moderate heat transfer from the wall to the residual air in
the cylinder, as in this investigation, does not affect the
pressure-time relationship of the air in the cylinder during
discharge. However, it is not certain whether this relation-

110.
ship will remain unchanged under high rates of heat transfer,
as in the heat release due to chemical reaction in the cylinder
of an internal combustion engine.
5. When the ratio of the diameter of the orifice to that of the
cylinder, d/D, is small, wave action .and non-uniformity in the
properties of the air in the cylinder during the discharge are
negligible. Except in a narrow region near the orifice there
is no bulk motion of the air which. is, therefore., in a state of
virtual stagnation. The decrease of pressure in the cylinder
during discharge is consistent with a free expansion. Simil-
arity in the conditions upstream of a given orifice at any
instant providm a suitable basis for the comparison of transient
and steady flows.
6. The transient mass flow through an orifice is affected b.Y the
following:
a. The transfer of heat to the residual air in the cylihder,
b. The pressure ratio across the orifice, and
c. The geometry of the orifice.
7. From dimensional considerations, inertia and compressibility
forces which govern the development of the jet issuing from an
orifice may be represented by the pressure ratio across the
orifice, p /p • In the absence of heat transfer these forces a: 0
alone determine the transient flow through a given orifice.
Thus, under isentropic conditions, the mass flow number, Gts'
or the coefficient of discharge, Cdts' is a function only of
the pressure ratio, p /p • The mass flow number, or the co-a: 0

111.
efficient of discharge, under these conditions is lower than
that for steady flow through geometrically similar orifices,
at the same pressure ratio. The difference is attributed to
the effect of the transient upstream pressure and temperature.
Under continuously changing upstream conditions, the jet can
not become adjusted to the instantaneous upstream pressure so
that it is never fully developed, and the minimum area of the
jet is, therefore, smaller than that under steady conditions.
8. The effect of heat transfer on transient flow is represented
by the ratio of 'the two mass flow numbers, Gt/Gts• This is
dependent on the initial conditions of the discharge and the
dimensionless group, Z, which correlates the history of the
process. For discharges through a given orifice from the same
initial conditions, the mass discharged in a given time
depends on the heat transferred to the residual air.
9. As in the case of steady flows, the length-diameter ratio of
an orifice affects the mass flow under transient conditions,
particularly when the pressure ratio is less than the critical
value. The now is higher the greater the length-diameter ratio,
1/d, up to a limiting value of 2.0. For pressure ratios less than
the critical value, the transient mass flow number through thick
orifices approaches a constant value, while through sharp edge
orifices it increases continuously as the pressure ratio is
decreased. For orifices of length-diameter ratio equal to 0.5
there is no firm evidence to indicate that there is a 'hysteresis'
in transient flow, as has been observed in the steady state.
112.
10. A flow through an orifice under continuously changing up
stream conditions is different from the flow through an
orifice due to the passage of a flat-topped shock wave.
Discharge coefficients derived from quasi-steady conditions
established after the reflection of the shock wave are, in
fact, steady state values. Differences between these dis
charge coefficients and steady state values may be due to
the lack of dynamical similarity in the conditions upstream
of the orifice. It is thought that similarity of the
geometrical configuration only is insufficient as a basis
of comparison between steady and non-steady flows.
113.
8. SUGGESTION3 OF FURTHER INVESTIGATION
The present investigation has mainly been concerned with
the following problems:
(a) The nature of the expansion process of the air in a cylinder
during a relatively slow discharge.
(b) The behaviour of a slow transient flow through an orifice,
generated by the discharge of compressed air in a cylinder.
(c) Differences between transient and steady flows through an
orifice on the basis of upstream dynamical similarity.
The study of the expansion process of the air in a
cylinder during discharge has been carried out with initial
temperatures which are nearly constant. The results obtained may
also be valid for other initial temperatures provided that the air
in the cylinder is initially in thermal equilibrium with the
cylinder wall. An extension of the present work to different
initial temperatures, therefore, appears to be desirable.
The correlation between the pressure and temperature of
the air in the cylinder during discharge needs to be examined
s.ystematically for different conditions of heat transfer and for
cylinders of different surface/volume ratios in order to generalize
the equations already o bta.ined. The form of the correlation is
expected to be similar to that derived in the present investigation.
Although the pressure-temperature correlation proposed is
adequate to determine the residual mass of the air in the cylinder
during discharge, it is of considerable practical interest to
examine in detail, the,nature of the heat transfer.
113.

114.
While flows through an orifice both under transient and
steaqy conditions have been examined, certain details which have
not been treated in the present investigation appear to be worthy
of further consideration. These are:
(a) The starting process of a jet
In order to fully understand the behaviour of transient
flow through an orifice and the mechanism of the readjustment
of the flow to continuously changing of upstream conditions, a
study of the process of development of the jet issuing from
the orifice is necessary.
(b) Flow with a finite approach velocity towards the orifice
The two investigations into steady and transient flows
through an orifice have been limited to stagnant upstream
conditions. It is likely that transient and steady flows
through an orifice will be strongly affected qy the approach
velocity of the flow. In these cases, particular care must be
given to satisfying the requirements of dynamical similarity.
(c) Orientation and grouping of orifices
The effects of orifice geometry, including their grouping
and the direction of the meridional axis, on transient flow are
also interesting subjects for more detailed studies.

9. LIST OF REFERENCES
(1) Jenny, E.: Unidimensional Transient Flow with Consideration of Friction, Heat Transfer, and Change of Section, Brown Boveri Review, Vol. 57, No. 11, 1950, P• 447.
(2) Deckker, B.E.L.: Air Flow in the Pipe S,ystem of a Motored 2-Stroke Cycle Engine by the Method of Characteristics, M.Sc. Thesis under special regulations for Ph.D., University of Birmingham, 1951.
(3) Chaplygin, S.A.: On Gas Jets, N.A.C.A. (Translation) T.M. 1063, 1944. Doctoral Thesis, Moscow University, 1902. Also, Sci. Annals, ~1oscow University Phys-Math Publication, No. 21, 1904.
(4) Bragg, S.L. : Effect of Compressibility on the Discharge Coefficient of Orifices and Convergent Nozzles, Journal of Mechanical Engineering Science, Vol. 2, 1960, p.35.
(5) Benson, R.S.: Compressible Flow through a Two-Dimensional Slit, International Mechanical Science, Vol. 7, 1965, p. 315.
(6) Deckker, B.E.L. and Chang, Y.F.: An Investigation of steady Compressible Flow through Thick Orifices, Proceedings of Institution of Mechanical Engineers, London, Vol. 180, Part 3j, 1965-66. Chang, Y .F.: The Flow of Air through Square-Edged Orifices, M.Sc. Thesis, University of Saskatchewan, 1965.
(7) Allen, H.s. and Maxwell, R.s.: A Text-Book of Heat, Macmillan and Co. Ltd., London, 1939, Vol. 1 , p. 3 52 •
Clement, M.and Desormes, G.B.: Observations sur la Physique, Vol. 89, 1819, p. 321.
(8) Partington, J.R.: The Ratio of the Specific Heats of Air and Carbon Dioxide, Proceedings of Royal Society, London, (A) Vol. 100, 1922, p.27.
(9) Weaving, J.H.: Discharge of Exhaust Gases in Two-Stroke Engines, Proceedings of Institution of Mechanical Engineers, London, Vol. 161, No. 49, 1949, p. 98.
115.

116.
(10) Cole, B.N.: Communication to Weaving, J.H., Proceedings of Institution of Mechanical Engineers, London, Vol. 161, No. 49, 1949, p. 112.
(11) Kestin, J. and Glass, J.S.: Communication to Weaving, J.H., Proceedings of Institution of Mechanical Engineers, London, Vol. 161, No. 49, 1949, p. 116.
(12) Geyer, E.W.: Time of Discharge of High Pressure Gases, The Engineer, London, Vol. 168, 1939, p.'6o. Communication to Weaving, J.H., Proceedings of Institution of Mechanical Engineers, London, Vol. 161, No. 49, 1949, p. 112.
(13) Potter, J.H. and Brown, L.G.: Transient Pressure and Temperatures in Gases during Free Expansion, Report, Office of Ordnance Research Project No. N-26, 1959.
(14) Potter, J.H. and Levy, M.J.: The Free Expansion of Dr.y and Moist Air, Transactions of A.S.M.E., Vol. 83, 1961, p. 97.
(15) Wallace, F.J. and Mitchell, R.w.s.: Wave Action Following the Sudden Release of Air through an Engine Port System, Proceedings of Institution of Mechanical Engineers, London, Vol. lB, 1952-53, p. 343.
(16) Benson, R.S.: Experiments on Two-Stroke Engine Exhuast Ports under Steady and Unsteady Conditions, Proceedings of Institution of Mechanical Engineers, London, Vol. 173, No. 19, 1959, p. 511.
(17) Horlock, J.H. and Woods, W.A.: The Thermodynamics of Charging and Discharging Processes, Proceedings of Institution of Mechanical Engineers, London, Vol. 180, Part 3j, 1965-66.
(18) Cole, B.N. and Mills, B.: The Theory of SUdden Enlargements Applied to the Poppet Exhaust-Valve with Special Reference to Exhaust-Pulse Scavenging, Proceedings of Institution of Mechanical Engineers, London, Vol. lB, 1952-53, P• 364.
(19) Giffen, E.: Rapid Discharge of Gas from a Vessel into the Atmosphere, Engineering, London, Vol. 150, pp. 134-136, 154-155 and 181-183.
(20) Earnshaw, S.: On the Mathematical Theory of Sound, Philosophical Transaction, Royal Society, London, Vol. 150, 1860, p. 133.
117.
(21) St. Venant, A.J.C. and Wantzel, L.: Journal de l'Ecole Royale Polytichnique, Series 1, Vol. 16, 1839.
(22) Bannister, F.K. and Mucklow, G.F.: Wave Action Following Sudden Release of Compressed Gas from a Cylinder, Proceedings of Institution of Mechanical Engineers, London, Vol. 159, 1948, p.269.
(23) Benson, R.s.: Discharge of Gas from Cylinder to Atmosphere, The Engineer, London, Vol. 199, 1955, pp. 546-548, 582-584 and 618-620.
(24) Benson, R.S.: Discharge from an Engine Cylinder to Atmosphere, The Engineer, London, Vol. 203, 1957, pp. 946-949 and 976-978.
(25) Deckker, B.E.L.: Communication to Benson, R.s., Proceedings of Institution of Mechanical Engineers, London, Vol. 173, No. 19, 1959, p. 537.
(26) Deckker, B.E.L.: Effect of an Exhaust Ejector on Engine Performance, A.S.M.E. Paper No 66-WA/DGP-3, 1966.
(27) Rudinger, G: On the Reflection of Shock Waves from an Open End of a Duct, Journal of Applied P~sics, Vol. 26, No. 8, 1955, p. 981.
( 28) Rudinger, G.: The Reflection of Shock Waves from an Orifice at the End of a Duct, Zeitschrift fur Angewandte Mathematik und P~sik, Vol. 9b, 1958, P• 570.
(29) Trengrouse, G.H., Imrie, B.W. and Male, D.H.: Comparison of Unsteady Flow Discharge Coefficients for SharpEdged Orifices with Steady Flow Values, Journal of Mechanical Engineering Science, Vol. 8, No. 3, 1966, p. 332.
(30) British Standares Institution: Flow Measurement, British Standard, B.S. 1042, 1943.
(31) Rudinger, G.: A Shock Tube Technique to Determine Steady Flow Losses of Orifices and Other Duct Elements, Transactions of A.S.M.E., Vol. 82, 1960, p. 159.
(32) Oppenheim, A.K. and Chilton, E.G.: Pulsating Flow Measurement - A Literature Survey, Transactions of A.S.H.E., Vol. 77, 1955, p. 231.
118.
(33) Bailey, W.E.: Pulsating Air Velocity Measurement, Transactions of A.S.M.E., Vol. 61, 1938.
(34) Kastener, L.J.: An Investigation of Air Box Method of Hetering the Air Consumption of Internal Combustion Engines, Proceedings of Institution of Mechanical Engineers, London, Vol. 157, 1947, p. 387.
(35) Schultz-Grunow, F.: Durchflussmessverfahren rttr Pulsierende Stromungen, Forschung auf dem Gebiete des Ingenieurewesens, Vol. 12, No. 3, 1941, P• 117.
(36) Williams, T.J.: Pulsation Error in Manometer Gauges, Transactions of A.S.M.E. Vol. 78, 1956, p. 1461.
(37) Zarek, J .H.: Metering Pulsating Flow, Engineering, London, Vol. 179, 1955, p. 17.
(38) Earles, S.W.E. and Zarek, J.M.: Use of Sharp-Edged Orifices for Metering Pulsating Flow, Proceedings of Institution of Mechanical Engineers, London, Vol. 177, No. 37, 1963, P• 997.
(39) Jeffer.y, B.J.: Pulsating Flow Through Orifices, Ph.D. Thesis in The Faculty of Engineering, King's College, University of London, 1965.
(40) Sparks, C.R.: A Study of Pulsation Effects on Orifice Metering of Compressible Flow, The Flow Measurement Symposium (Edited b,y Cotton, K.C.), Flow Measurement Conference, Pittsburgh, Pennsylvania, U.S.A., September 26-28, 1966, A.S.M.E. United Engineering Centre, New York, p. 124.
(41) Zarek, J.M.: The Neglected Parameters in Pulsating Flow Measurement, The Flow Measurement Symposium, (Edited b,y Cotton, K.C.), Flow Measurement Conference, Pittsburgh, Pennsylvania, U.S.A., September 26-28, 1966, A.S.M.E. United Engineering Centre, New York, p. 14.
(42) Hall, N.A.: Orifice and Flow Coefficient in Pulsating Flow, Transactions of A.S.M.E., Vol. 74, 1952, p. 925.
(43) Baird, R.c. and Bechtold, I.C.: The Dynamics of Pulsative Flow through Sharp-Edged Restrictions, Transactions of A.S.M.E., Vol. 74, 1952, P• 1381.

119.
(44) Earles, S.ltJ.E. and Zarek, J .M.: Reflection of Pressure Waves at Sharp-Edged Orifice, The Engineer, London, Februar,r 26, 1965, p. 383.
(45) Benson, R.s. and El Shafie, H.M.F.: Non steady Flow through a Square-Edged Orifice, Journal of Hechanical Engineering Science, Vol. 7, No. 4, 1965, p. 482.
(46) Dahl, A.I. (Editor): Temperature, Its Measurement and Control in Science and Industry, Vol. 3, Part 2, Applied Method and Instruments, Reinhold, New York, 1962.
(47) Benedict, R.P.: Temperature and Its Measurement, Electro-Technology, Vol. 72, 1963, P• 73.
(48) Society of Automotive Engineers, U.S.A.: S.A.E. Aero-Space Applied Thermodynamics Manual, 1962, Part G, Test Instrumentation and Measurement, Sec. 3, pp. G-21-28.
(49) Bailey, N.P.: The Response of Thermocouples, Mechanical Engineering, A.S.M.E., Vol. 53, No. 11, 1931, P• 797.
(50) Carbon, M.W., Kutsch, H.J. and Hawkins, G.A.: The Response of Thermocouple to Rapid Gas-Temperature Changes, Transactions of A.S.M.E., Vol. 72, 1950, p. 655.
(51) Moffat, R.J.: Designing Thermocouple for Response Rate, Transactions of A.S.M.E., Vol. 80, 1958, p. 257.
(52) Sirs, J.A.: Measurement of Rapid Temperature Changes by Thermocouples, Journal of Scientific Instruments, Vol. 38, 1961, p. 489.
(53) Benedict, R.P.: The Generation of the Thermocouple Reference Tables, ElectroTechnology, Vol. 72, 1963, p. 80.
(54) Unpublished Work, Gas Gynamics Laboratory, University of Saskatchewan, Saskatoon, Saskatchewan, Canada.
(55) Yates, A.H.: Carpets and Lattices, Aircraft Engineering, Vol. 18, 1946, p. 8.

APPENDIX A: DIMENSIONAL ANALYSIS
1. Transient Flow Throygh an Orifice
v D =0 0
Po
T 0
L
f d
t p v
,T - p a
Consider the transient flow through an orifice, initiated
from the discharge of compressed gas in a cylinder to atmosphere
with an initial pressure p and temperature T and with the flow 00 00
configuration as shown above, the instantaneous mass flow through
the orifice depends on the following variables:
1.
2.
The geometrical configuration
(a) the diameter of the cylinder, D,
(b) the length of the cylinder, L,
(c) the diameter of the orifice, d,
(d) the length of the orifice, 1, and
(e) the roughness of the flow passage, h.
Instantaneous conditions of flow
(a)
(b)
(c)
the upstream pressure, p0
, and temperature, T0
,
the downstream pressure, p , and a
the pressure, p, the temperature, T, and the mean velocity,
v, at the orifice.
120.

121.
3. Properties of the gas
(a) characteristic gas constant, R,
(b) the bulk modulus of the gas, N (compressibility), and
(c) the coefficient of viscosity, ~ •
4· The flow histor,y
(a) the initial pressure, p00
, and temperature, T00
, and
(b) the time, t, from the commencement of the discharge.
The functional relationship for the mass flow is
mt = F(D, L, d, 1, h, p0
, T0
, Pa' p, T, v, ~' R, N, p00
, T00 , t)
There are eighteen variables in the above equation. If the dimen
sions chosen are the mass, length, time, and temperature (MLTQ),
then, according to the Pi-Theorem, there are at least 18 -·4 = 14
dimensionless groups. The variables and their dimensions are given
below:
• mt
D, 1, d, 1 and h
Po' Pa' Poo' P and N
T , T and T 0 00
v
t
... •••
...
... •••
...
...
(MT-1 )
(L)
(ML-1T-2)
(0)
(ML-lT-1)
(L2T-20-l)
(LT-1)
(T)
Some of the required groups may be obtained b.r observation, since
they are the simple ratios of the variables with the same dimensions,
thus:
122.
rr 2 = L/D,
1T = 1/d, 3
rr = d/D, 4
rr 5 = h/d,
7T6 = P/P0 ,
rr? = Poo/Pa'
7Tg = P0/P,
7T9 = T /T oo o'
7Tl0 = T /T, 0
rr11 = N/p = k.
If the primar,r quantities p , d, R, and T are chosen, the remain-a oo
ing dimensionless groups may be obtained in the following manner:
rr. = m ( )a (d)b (R)c (T )d 1 t Pa oo
=1
The exponents a, b, c and d are solved from:
M: 1 + a = 0
L: -a + b + 2c = 0
T: -1 - 2a - 2c = 0 and
Q: -c + d = 0 and their solutions are:
Therefore,
a= -1,
b = -2,
c = 1/2,
d = 1/2.
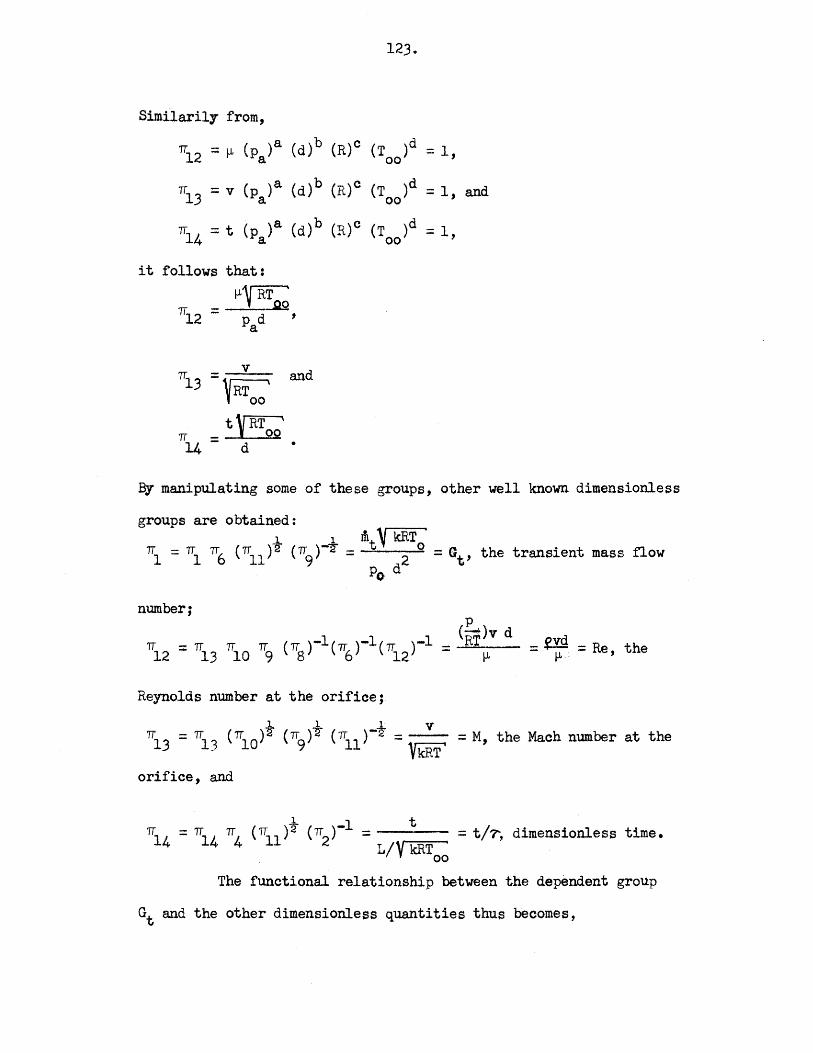
123.
Simila.rily from,
rr.l2 = ~ ( p ) a (d) b ( R) c ( T ) d = 1 ' a oo
rrl3 = v (pa)a (d)b (R)c (Too)d = 1, and
rr.l4 = t ( p ) a ( d ) b ( R) c ( T ) d = 1 ' a oo
it follows that:
~~ 1T. - __ _..Q.Q 12 - p d ' a
rr13 =,~ and ,.n"'oo
rr _t~ 14- d •
B.1 manipulating some of these groups, other well known dimensionless
groups are obtained:
rr = rr rr (rr )t (rr )-i - lilt v kRTo - G the transient mass flow 1 1 6 11 9 - d2 - . t'
Po
number; (E-. )v d
rr = rr rr rr (rr )-1 (1T )-1 (rr )-1 = RT - ~vd = Re, the 12 13 10 9 8 6 12 ~ - ~ .
Reynolds number at the orifice;
.l. l .1:. v 1T = 1T (rr )2 (rr )2 (rr )-2- - -- - M the Mach number at the 13 13 10 9 11 - VkRT I - '
orifice, and
.1. 1 t rr14 = 17
14 rr4
(rr11 )2 (rr2)- = = t/'1, dimensionless time.
L/V kRToo
The functional relationship between the dependent group
Gt and the other dimensionless quantities thus becomes,
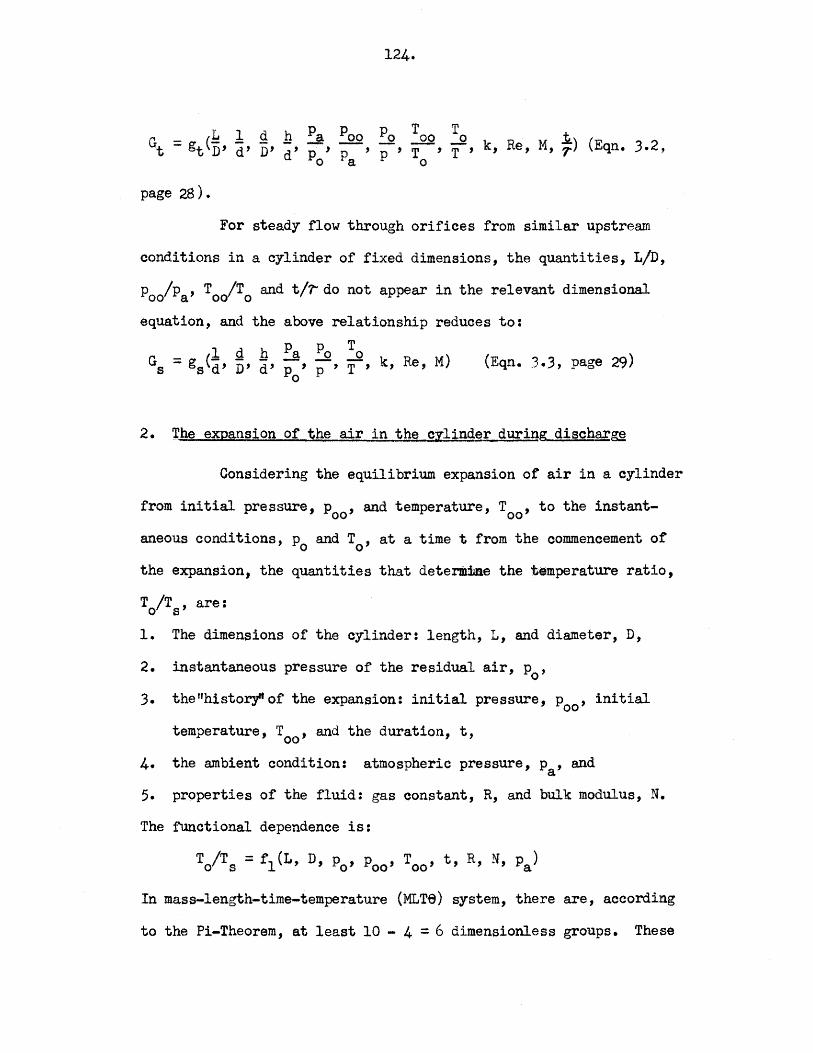
124.
page 28).
For steady flow through orifices from similar upstream
conditions in a cylinder of fixed dimensions, the quantities, L/D,
p00
/pa' T00
/T0
and t/~do not appear in the relevant dimensional
equation, and the above relationship reduces to:
1 d h Pa Po To G - g (- - ~ --, --, --T , k, Re, M) (Eqn. 3.3, page 29) s - s d' D' d' p
0 p
2. The expansion of the air in the cylinder during discharrua
Considering the equilibrium expansion of air in a cylinder
from initial pressure, p , and temperature, T , to the instant-oo 00
aneous conditions, p0
and T0
, at a time t from the commencement of
the expansion, the quantities that determine the temperature ratio,
T /T , are: 0 s
1.
2.
The dimensions of the cylinder: length, L, and diameter, D,
instantaneous pressure of the residual air, p0
,
the"histocy" of the expansion: initial pressure, p , initial 00
temperature, T , and the duration, t, 00
4. the ambient condition: atmospheric pressure, p , and a
5. properties of the fluid: gas constant, R, and bulk modulus, N.
The functional dependence is:
T /T = f 1(L, D, p , p , T , t, R, N, pa) 0 s 0 00 00
In mass-length-time-temperature (MLTe) system, there are, according
to the Pi-Theorem, at least 10 - 4 = 6 dimensionless groups. These
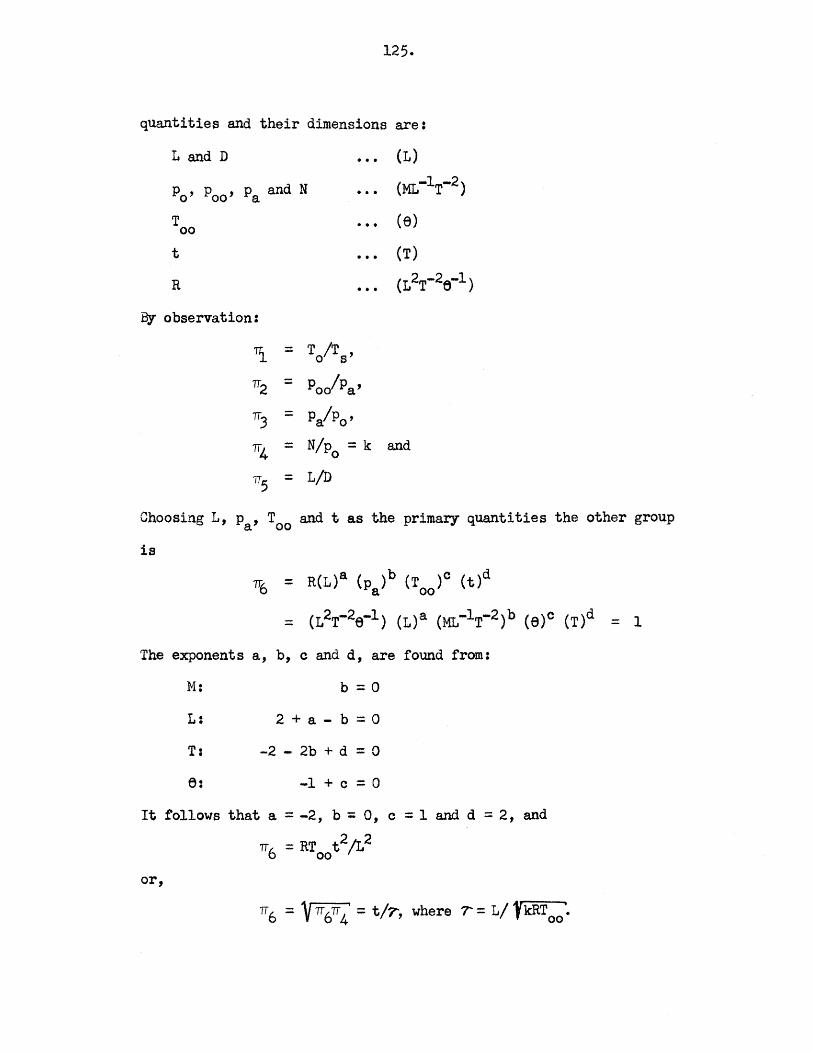
125.
quantities and their dimensions are:
Land D ... (L)
Po' Poo' Pa and N ... (ML-lT-2)
T ... (e) 00
t ... (T)
R ... (L2T-26-l)
By observation:
1. ::: T /T , 0 s
7T2 = Poo/Pa'
7T3 ::: P/P0 ,
7T4 = N/p ::: k and 0
7T5 ::: L/D
Choosing L, pa' T00
and t as the primar,y quantities the other group
is
7T6 = R(L)a ( )b (T )c (t)d Pa oo
::: (L2T-2e-l) (L)a (ML-1T-2)b (e}c (T)d
The exponents a, b, c and d, are found from:
M: b = 0
L: 2 + a - b ::: 0
T: -2 - 2b + d = 0
6: -1 + 0 = 0
It follows that a = -2, b ;: 0, o = 1 and d = 2, and
rr6 = RToot2/L2
or,
::: 1

126.
Therefore, the relevant dimensional equation is:
T /T = t 2(L/D, p /p , p /o , k, t/r). o s oo a a ~o

APPENDIX B: THE MASS FLOW NUMBERS THROUGH AN ORIFICE
Po tJ d
T r_: .. Pa 0
v =0 0
~ For flows through an orifice with a configuration as shown
in the above figure, the mass flow number, G, through the orifice is
defined as:
where,
G = (m ~ kRT ')/(p d2) 0 0
G = the mass flow number,
m =mass flow rate through the orifice,
k = ratio of specific heats,
T0 = upstream stagnation temperature,
p0
= upstream stagnation pressure,
d =diameter of the orifice, and
R = characteristic gas constant
The mass flow numbers under theoretica4and steady and transient
conditions are obtained in the following manner:
1. Theoretical Mass Flow Number, Gtheo
The theoretical mass flow, mtheo' through an orifice is
127.

128.
calculated from the equation for isentropic flow through an ideal
convergent nozzle with a throat section. It is assumed that the air
in the cylinder is a perfect gas and the coefficient of discharge
of the nozzle is unity. Since the approach velocity or the air
towards the nozzle is zero, it can be shown that,
m = theo Tf 2/k[ (k-1) /kl - d2 ~ p Pc (..12.) 1 - (.lL. ) 4 k-1 o o p
0 P
0
p d2
Tr 2k2 2/k [ . n (k-1)/kJ ::: _Q_ - (.lL) 1 - ( ~) ~ 4 k-1 p0 P0
It follows that the theoretical mass flow number is,
• ~ kRT ' 1/k G = mtheo o = '!!. k ( .Jl.) theo d2 4 P
0 Po
2 ~ (k-1)/k] k-1 1 - <:->
0
••• B-1
When the pressure ratio, p/p is less than 0.52828, the nozzle is 0
choked and the flow is independent of the downstream pressure. The
pressure at the throat of the nozzle is constant, and is given by:
- ~ k/(k-1) pfp
0 - (k_1 ) = 0.52828
Thus, from Equation B-1, r----r-~~-~
Tr 2 (k+l)/(k-1) Gtheo ::: 4 k (k-1) = 0.63543
For flow in which the pressure ratio across the nozzle is greater
than the critical value, the pressure at the exit of the nozzle is
equal to the ambient pressure, p • Equation B-1 becomes: a
JL p a 1/k _L [ ~ k-1 ] Gtheo = 4 k ( p} k-1 1 - ( p )
0 0
Values of Gtheo as function of pressure ratio, pa/p0
, are given in
Table A-1.
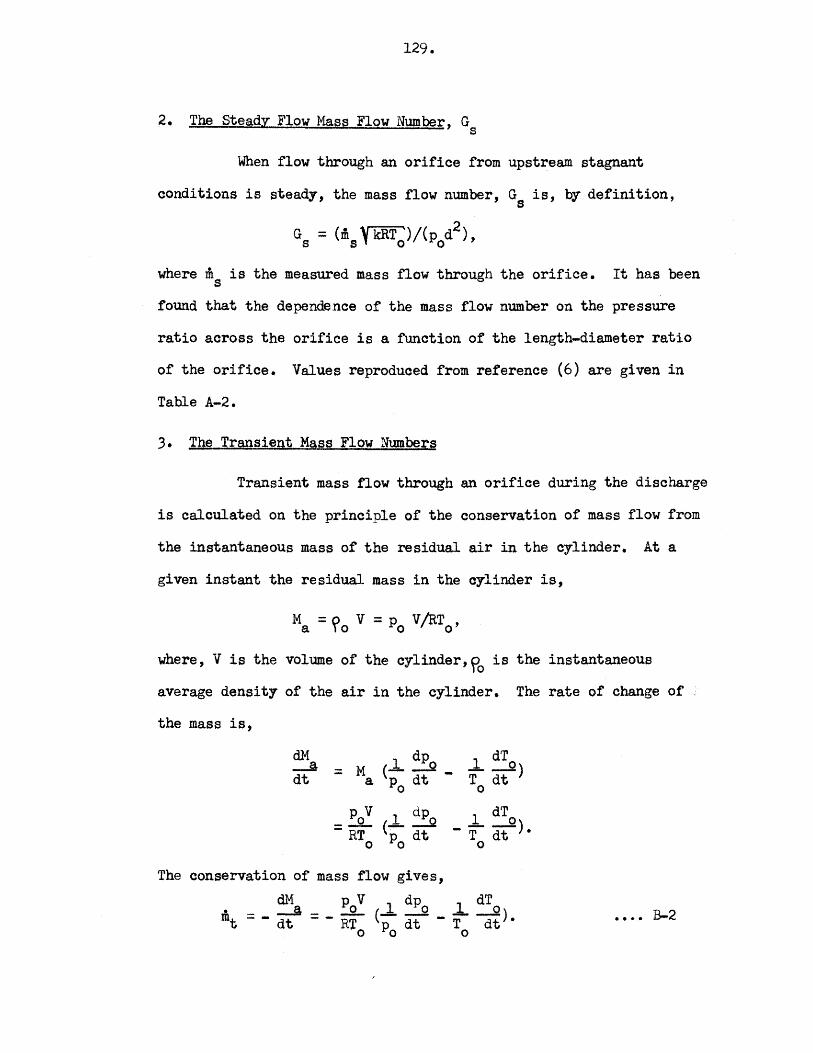
129.
2. The steady Flow Mass Flow Number, G s
When flow through an orifice from upstream stagnant
conditions is steady, the mass flow number, G is, b,y definition, s
G = (m ~ kRT ')/(p d2), s s 0 0
where m is the measured mass flow through the orifice. It has been s
found that the dependence of the mass flow number on the pressure
ratio across the orifice is a function of the length-diameter ratio
of the orifice. Values reproduced from reference (6) are given in
Table A-2.
3. The Transient Mass Flow Numbers
Transient mass flow through an orifice during the discharge
is calculated on the principle of the conservation of mass flow from
the instantaneous mass of the residual air in the cylinder. At a
given instant the residual mass in the cylinder is,
M = o V = p V /RT , a 1 o o o
where, V is the volume of the cylinder, fo is the instantaneous
average density of the air in the cylinder. The rate of change of
the mass is,
dM 1 dp0
..l. dT <it = Ma (-. dt - T dt
0)
Po o
p V l dp l dT0 - _.Q_ (- ...:..2 - -) - RT p dt - T dt •
0 0 0
The conservation of mass flow gives,
dMa _ p0 V (..l. dp0 .l. ~) mt = - dt - - RT dt - T dt •
o Po o •••• B-2
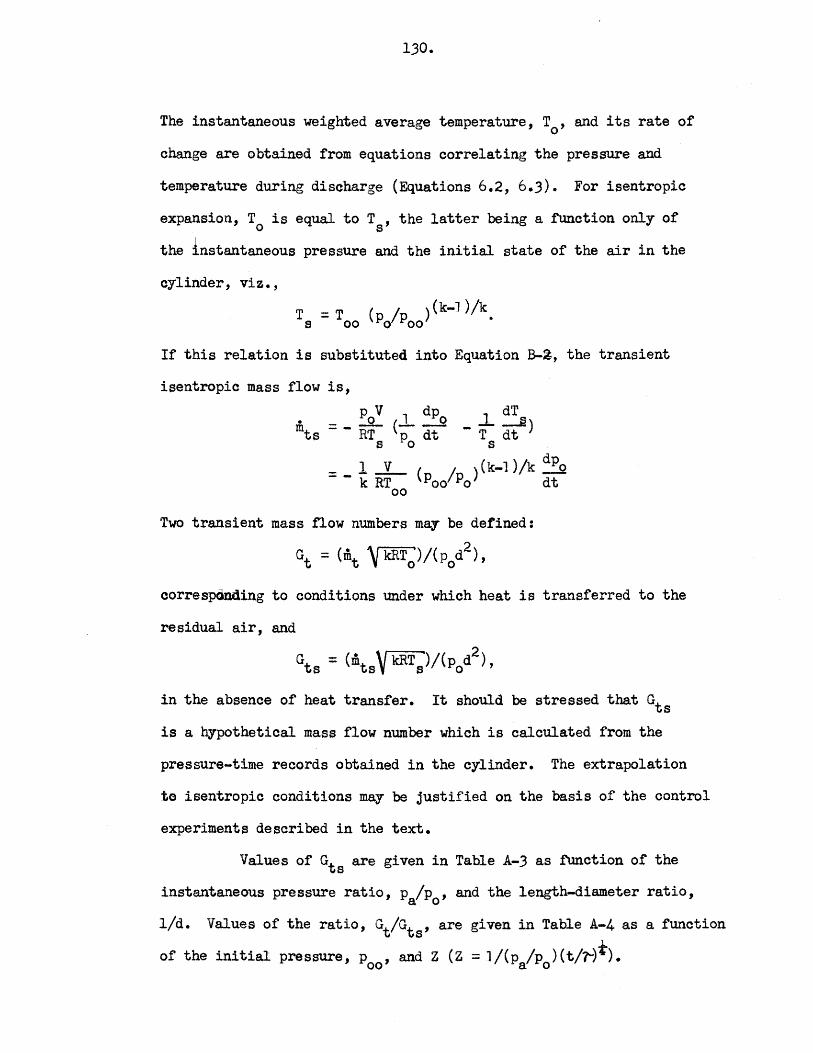
130.
The instantaneous weighted average temperature, T , and its rate of 0
change are obtained from equations correlating the pressure and
temperature during discharge (Equations 6.2, 6.3). For isentropic
expansion, T is equal to T , the latter being a function only of 0 s
the instantaneous pressure and the initial state of the air in the
cylinder, viz.,
T = T (po/Poo) (k-1 )/k. s 00
If this relation is substituted into Equation B-~, the transient
isentropic mass flow is,
p V l dp l dT = - R~ ('p- dt
0 - T 'd:t)
s . 0 s
= _1 _y_ < I >(k-1)/k ~ k RT Poo Po dt
00
Two transient mass flow numbers may be defined:
Gt = (mt 'J kRTo)/(pod2)'
correspOnding to conditions under which heat is transferred to the
residual air, and
at = (mt \fkRT)/(p d2
), s sV ·-··s o
in the absence of heat transfer. It should be stressed that Gts
is a Q1pothetical mass flow number which is calculated from the
pressure-time records obtained in the cylinder. The extrapolation
te isentropic conditions may be justified on the basis of the control
experiments described in the text.
Values of Gts are given in Table A-3 as fUnction of the
instantaneous pressure ratio, p /p , and the length-diameter ratio, a o
1/d. Values of the ratio, Gt/Gts' are given in Table A-4 as a function
of the initial pressure, p , and z (Z = 1 /(p /p ) ( t/r)t). oo a o

131.
TABLE A-1
Theoretical Mass Flow Number
Pressure ratio Theoretical mass flow nuaber
P/P0 Gtheo· 'theo V~:R'.l'~
d2 Po
o.ooo - 0.52828 0.63543 0.52828 0.63543 0.550 . 0.63469 0.575 0.63325 0.600 0.62905 0.625 0.62302 0.650 0.61509 0.675 0.60518 0.700 0.59319 0.725 0.57896 0.750 0.56237 0.775 0.54314 0.800 0.52101 0.825 0.49559 o.a5o 0.46632 0.875 0.43242 0.900 0.39270 0.925 0.34515 0.950 0.28589
0.975 0.20499 1.000 o.ooooo
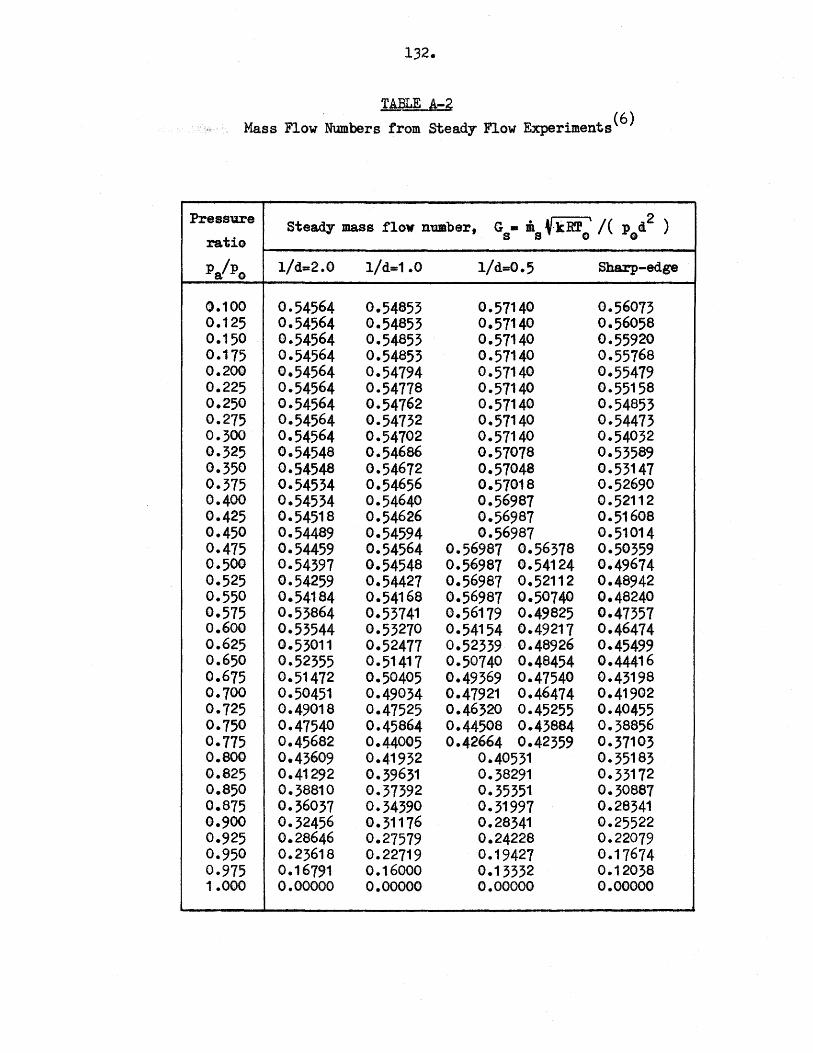
132.
TABLE A-2 " (6)
Mass Flow Numbers from Steady Flow Experiments
Pressure Steady mass flow nuaber, G • i ~-k!r! ' /( p 42 )
ratio S S 0 G
Pa/Po 1/d-2.0 1/d-1.0 1/d-0.5 Sharp-edge
0.100 0.54564 0.54853 0.57140 0.56073 0.125 0.54564 0.54853 0.57140 0.56058 0.150 0.54564 0.54853 0.57140 0.55920 0.175 0.54564 0.54853 0.57140 0.55768 0.200 0.54564 0.54794 0.57140 0.55479 0.225 0.54564 0.54778 0.57140 0.55158 0.250 0.54564 0.54762 0.57140 0.54853 0.275 0.54564 0.54732 0.57140 0.54473 0.300 0.54564 0.54702 0.57140 0.54032 0.325 0.54548 0.54686 0.57078 0.53589 0.350 0.54548 0.54672 0.57048 0.53147 0.375 0.54534 0.54656 0.57018 0.52690 0.400 0.54534 0.54640 0.56987 0.52112 0.425 0.54518 0.54626 0.56987 0.51608 0.450 0.54489 0.54594 0.56987 0.51014 0.475 0.54459 0.54564 0.56987 0.56378 0.50359 o.soo 0.54397 0.54548 0.56987 0.54124 0.49674 0.525 0.54259 0.54427 0.56987 0.52112 0.48942 0.550 0.54184 0.54168 0.56987 0.50740 0.48240 0.575 0.53864 0.53741 0.56179 0.49825 0.47357 o.6oo 0.53544 0.53270 0.54154 0.49217 0.46474 0.625 0.53011 0.52477 0.52339 0.48926 0.45499 0.650 0.52355 0.51417 0.50740 0.48454 0.44416 0.675 0.51472 0.50405 0.49369 0.47540 0.43198 0.700 0.50451 0.49034 0.47921 0.46474 0.41902 0.725 0.49018 0.47525 0.46320 0.45255 0.40455 0.750 0.47540 0.45864 0.44508 0.43884 0.38856 0.775 0.45682 0.44005 0.42664 0.42359 0.37103 o.soo 0.43609 0.41932 0.40531 0.35183 0.825 0.41292 0.39631 0.38291 0.33172 0.850 0.38810 0.37392 0.35351 o.3ose7 0.875 0.36037 0.34390 0.31997 0.28341 0.900 0.32456 0.31176 0.28341 0.25522 0.925 0.28646 0.27579 0.24228 0.22079 0.950 0.23618 0.22719 0.19427 0.17674 0.975 0.16791 0.16000 0.13332 0.12038 1.000 0.00000 o.ooooo 0.00000 0.00000

133·
TABLE A-J
Transient Isentropic Mass Flow Number
Pressure Transient isentropic mass flow number
ratio Gt • (Ji.t f kRT ')j(p d2) s s s 0
(P/P0 ) 1/d-2.0 l/d=1.5 l/d=1.0 1/d-0.5 SJlarp-edge
0.100 0.4825 0.4848 0.4604 0.4813 0.5236 0.125 0.4825 0.4848 0.4804 0.4813 0.5219 0.150 0.4825 0.4831 0.4804 0.4813 0.5201 0.175 0.4815 0.4831 0.4804 0.4813 0.5175 0.200 0.4804 0.4831 0.4795 0.4813 0.5148 0.225 0.4799 0.4831 0.4795 0.4808 0.5120 0.250 0.4795 0.4831 0.4795 0.4804 0.5083 0.275 0.4795 0.4831 0.4791 0.4801 0.5042 0.300 0.4795 0.4831 0.4788 0.4795 0.5004 0.325 0.4795 0.4831 0.4785 0.4791 0.4963 0.350 0.4795 0.4830 0.4778 0.4787 0.4887 0.375 0.4795 0.4830 0.4774 0.4778 0.4813 0.400 0.4787 0.4830 0.4764 0.4760 0.4755 0.425 0.4776 0.4823 0.4760 0.4751 0.4681 0.450 0.4774 0.4816 0.4751 0.4734 0.4628 0.475 0.4771 0.4775 0.4739 0.4725 0.4549 0.500 0.4769 0.4758 0.4728 0.4707 0.4478 0.525 0.4767 0.4743 0.4721 0.4681 0.4399 0.550 0.4760 0.4725 0.4707 0.4646 0.4319 0.575 0.4728 0.4699 0.4681 0.4610 0.4233 0.600 0.4716 0.4654 0.4637 0.4545 0.4138 0.625 0.4690 0.4619 0.4593 0.4460 0.4036 0.650 0.4654 0.4557 0.4540 0.4372 0.3940 0.675 0.4584 0.4495 0.4448 0.4252 0.3843 0.700 0.4513 0.4404 0.4355 0.4117 0.3720 0.725 0.4399 0.4314 0.4249 0.3981 0.3588 0.750 0.4291 0.4192 0.4161 0.3826 0.3456 0.775 0.4134 0.4034 o. 3981 0.3664 0.3297 0.800 0.3949 0.3861 o. 3791 0.3484 0.3156 0.825 0.3720 0.3685 0.3600 0.3262 0.2978 0.850 0.3491 0.3445 9.3367 0.3015 0.2768 0.875 0.3203 0.}173 0.3129 0.2750 0.2551 0.900 0.2909 0.2856 0.2830 0.2442 0.2292 0.925 0.2574 0.2500 0.2459 0.2089 0.2022 0.950 0.2186 0.2063 0.2019 0.1675 0.1657 0.975 0.1587 0.1499 0.1446 0.1199 0.1164 1.000 o.oooo o.oooo o.oooo o.oooo o.oooo
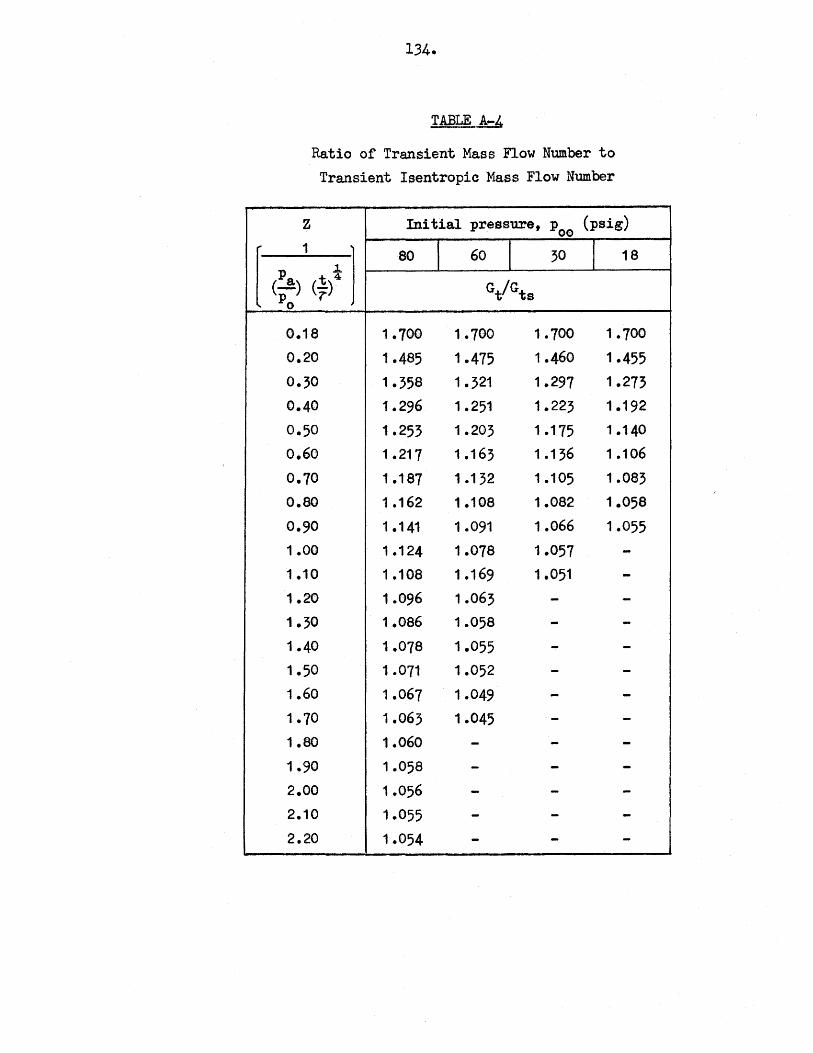
[
134.
TABLE A-4
Ratio of Transient Mass Flow Number to Transient Isentropic Mass Flow Number
z Initial pressure, p (psig) 00
1 eo I 60 I 30 f
18
(Pa) ! I c;) Gt/Gts Po
0.18 1.700 1.700 1.700 1.700
0.20 1.485 1.475 1.460 1.455
0.30 1.358 1 .321 1.297 1.273
0.40 1.296 1.251 1.223 1.192
0.50 1.253 1.203 1 .175 1.140
0.60 1 .217 1 .163 1 .136 1.106
0.70 1 .187 1 .132 1.105 1.083
o.ao 1.162 1.108 1.082 1.058
0.90 1.141 1 .091 1.066 1.055
1.00 1.124 1.078 1.057 -1.10 1.108 1.169 1.051 -1.20 1.096 1.063 - -1.30 1.086 1.058 - -1.40 1.078 1.055 - -1.50 1 .071 1.052 - -1.60 1.067 1.049 - -1. 70 1.063 1.045 - -1.80 1.060 - - -1.90 1.058 - - -2.00 1.056 - - -2.10 1.055 - - -2.20 1.054 - - -
135.
APPENDIX C
SOME TYPICAL PRESSURE-TlliE AND
TEMPERATURE-TIME RECORDS DURING
DISCHARGE FROM CYLINDER
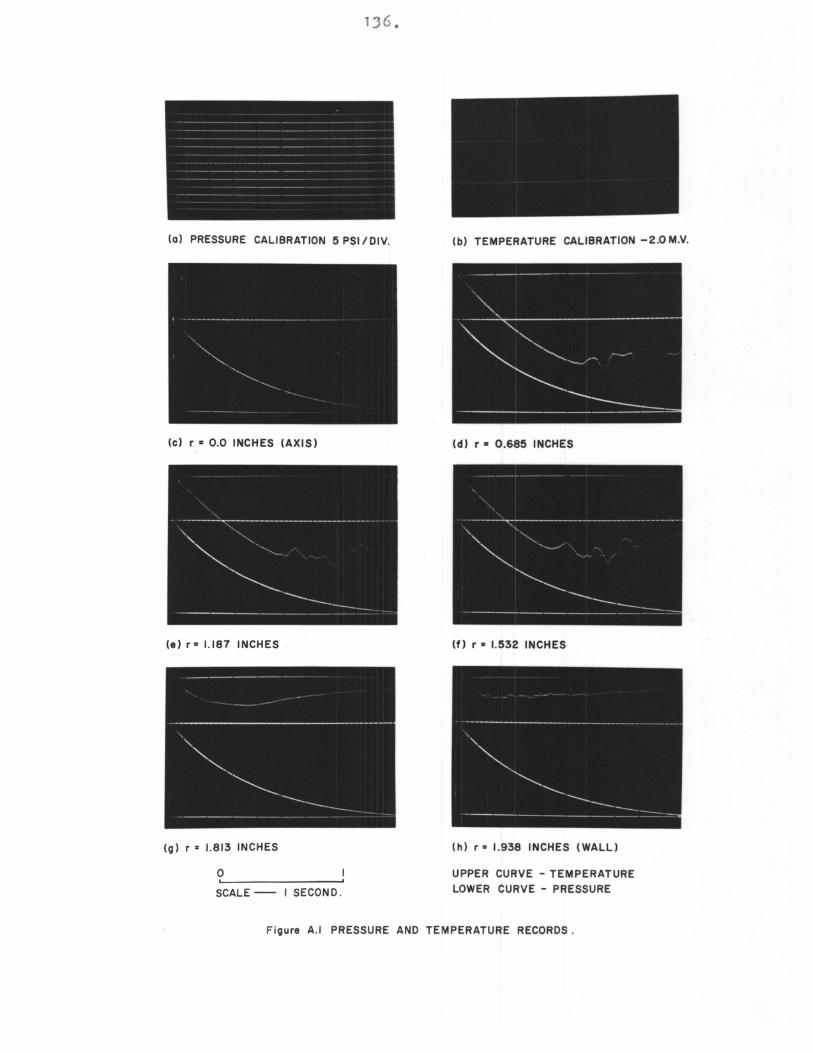
136.
(a) PRESSURE CALIBRATION 5 PSI I DIV.
(c) r • 0.0 INCHES (AXIS)
(e) r = 1.187 INCHES
(g) r = 1.813 INCHES
0
SCALE- I SECOND .
(b) TEMPERATURE CALIBRATION -2.0 M.V.
(d) r • 0.685 INCHES
(f) r • 1.532 INCHES
(h) r = 1.938 INCHES (WALL)
UPPER CURVE - TEMPERATURE LOWER CURVE - PRESSURE
Figure A.l PRESSURE AND TEMPERATURE RECORDS .