phillip treasury fund - phillip...
TRANSCRIPT

PHILLIP TREASURY FUND
Annual Report Year ended 31 March 2015

PHILLIP TREASURY FUND
Contents
Page
Directory 1
Manager's Investment Report 2
Report to Unitholders 3
Report of the Trustee 8
Statements by the Manager 9
Independent auditors' report 10
Statement of Total Return FS1
Statement of Financial Position FS2
Statement of Movements in Unitholders' Funds FS3
Statement of Portfolio FS4
Notes to the Financial Statements FS9
Important Information FS18

PHILLIP TREASURY FUND
1
DIRECTORY
MANAGER
Phillip Capital Management (S) Ltd
250 North Bridge Road
#06-00 Raffles City Tower
Singapore 179101
(Company Registration No. 199905233W)
DIRECTORS OF THE MANAGER
Lim Hua Min
Loh Hoon Sun
Jeffrey Lee Chay Khiong
Linus Lim Wen Sheong
Lee Ken Hoon
TRUSTEE & REGISTRAR
BNP Paribas Trust Services Singapore Limited
20 Collyer Quay, #01-01
Singapore 049319
(Company Registration Number: 200800851W)
CUSTODIAN
BNP Paribas Securities Services, Singapore Branch
20 Collyer Quay, #01-01
Singapore 049319
(Company Registration Number: T08FC7287D)
AUDITORS
KPMG LLP
16 Raffles Quay, #22-00 Hong Leong Building
Singapore 048581
SOLICITORS TO THE MANAGER
Chan & Goh LLP
50 Craig Road, #03-01
Singapore 089688
SOLICITORS TO THE TRUSTEE
Rodyk & Davidson LLP
80 Raffles Place, #33-00, UOB Plaza I
Singapore 048624

PHILLIP TREASURY FUND
2
MANAGER'S INVESTMENT REPORT
The Fund’s yield of 0.61% over the one year period ended 31 March 2015 compares favourably to a yield of
0.56% over the same period last year. The yield is higher than its 1 week US$ Libor benchmark yield of 0.13%.
During the period under review, short term 6-month and 1-year US treasury yields increased marginally by 3
basis points (bp) and 10 bp respectively. As at 31 March 2015, the Fund’s liquidity was good with 21% of its
portfolio maturing within 30 days and with portfolio weighted average maturity (“WAM”) of 136 days.
OUTLOOK
For the 2nd
quarter of 2015, we saw an increase in interest rate volatility, with a quick correction in the European
bond market in May 2015. This led to a spike in the yields for US Treasuries, and a steepening of the yield curve
between two and five year maturities by 10bp, with no change of the overnight rate. The pick-up in US
Treasury yields was also driven by protracted negotiations over the Greek debt crisis and improving US
economic data during the period. Economic activity has improved from its weak first quarter, and momentum
should gradually accelerate through the second half-year as the headwinds in the energy sector recede. The
Federal Reserve is expected to tighten policy in September 2015 and the pace of tightening is expected to be
slow and gradual.
Our liquidity strategy will focus on investing in cash deposits with 3-month maturities and debt securities of one
year maturities, which have attractive yields relative to 1 year deposit rates. Our strategy is to have a target
WAM in the range of 120 days, with overnight and monthly liquidity of 10% and 20% respectively, for the
portfolio.
We will continue to invest in high-quality counterparties and debt securities by focusing on issuers with robust
business models, strong balance sheets and steady operating cash flows.
Our aim for capital and liquidity preservation while striving to achieve returns in line with prevailing money
market rates remains a hallmark for the Fund.
PHILLIP TREASURY FUND
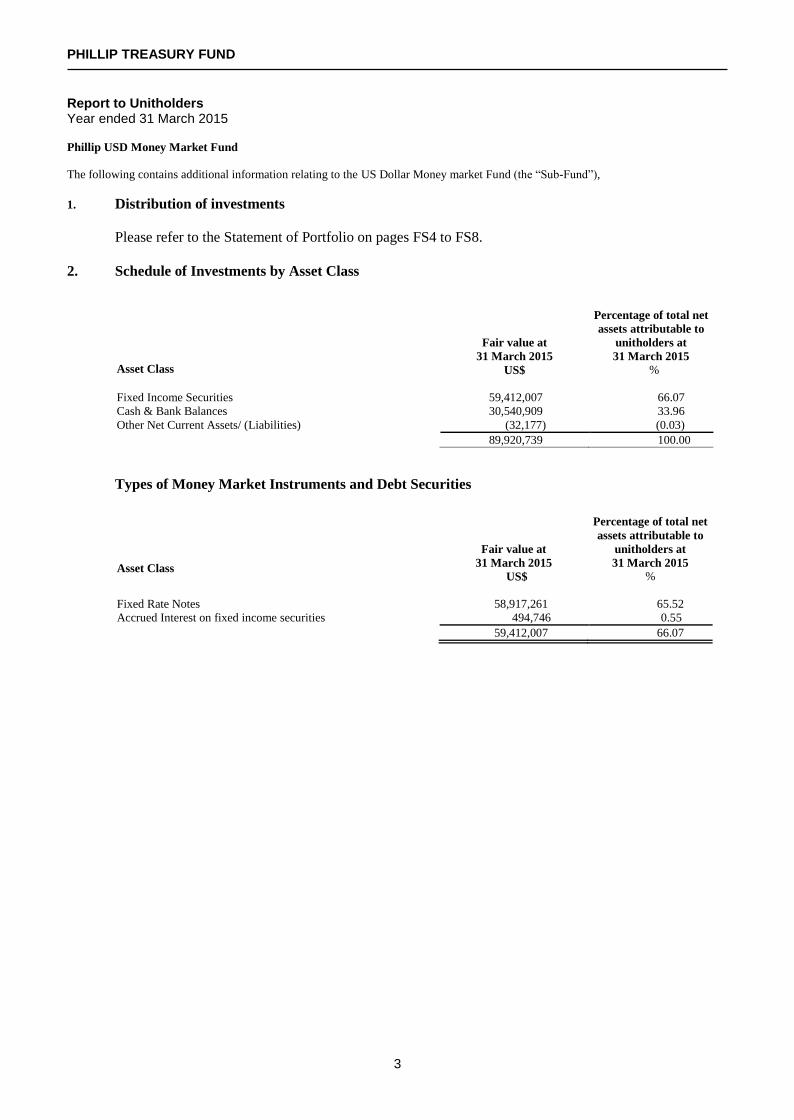
Report to Unitholders Year ended 31 March 2015
3
Phillip USD Money Market Fund
The following contains additional information relating to the US Dollar Money market Fund (the “Sub-Fund”),
1. Distribution of investments
Please refer to the Statement of Portfolio on pages FS4 to FS8.
2. Schedule of Investments by Asset Class
Asset Class
Fair value at
31 March 2015
US$
Percentage of total net
assets attributable to
unitholders at
31 March 2015
%
Fixed Income Securities 59,412,007 66.07
Cash & Bank Balances 30,540,909 33.96
Other Net Current Assets/ (Liabilities) (32,177) (0.03)
89,920,739 100.00
Types of Money Market Instruments and Debt Securities
Asset Class
Fair value at
31 March 2015
US$
Percentage of total net
assets attributable to
unitholders at
31 March 2015
%
Fixed Rate Notes 58,917,261 65.52
Accrued Interest on fixed income securities 494,746 0.55
59,412,007 66.07

PHILLIP TREASURY FUND
Report to Unitholders Year ended 31 March 2015
4
3. Credit rating of debit securities
Credit Ratings
Fair value at
31 March 2015
US$
Percentage of total net
assets attributable to
unitholders at
31 March 2015
%
A 45,998,612 51.15
A* 13,413,395 14.92
Total 59,412,007 66.07
Source of the credit rating is from Standard & Poor’s except the
following:
* Credit rating is from Moody’s
4. Top 10 holdings
10 Largest holdings as at 31 March 2015
Fair value at
31 March 2015
US$
Percentage of total net
assets attributable to
unitholders at
31 March 2015
%
Korea Exchange Bank 1.75% Due 27 September 2015 5,017,350 5.58
Hutchison Whampoa International 4.625% Due 11 September
2015 4,267,519 4.75
Bank of China Ltd/Hong Kong 1.68% Due 16 July 2015 4,000,581 4.45
Sarawak International 5.5% Due 03 August 2015 3,926,560 4.37
Cmt Mtn Pte Ltd 4.321% Due 08 April 2015 3,750,600 4.17
Hana Bank 1.375% Due 05 February 2016 3,505,600 3.89
Shinhan Bank 4.125% Due 04 October 2016 3,120,720 3.47
Cnpc General Capital Ltd 1.45% Due 16 April 2016 3,002,670 3.34
Kookmin Bank 1.375% Due 15 January 2016 2,054,448 2.28
Korea Hydro & Nuclear Power Co Ltd 6.25% Due 17 June 2014 2,019,940 2.25
34,665,988 38.55

PHILLIP TREASURY FUND
Report to Unitholders Year ended 31 March 2015
5
10 Largest holdings at 31 March 2014
Fair value at
31 March 2014
US$
Percentage of total net
assets attributable to
unitholders at
31 March 2014
%
Sarawak International Inc 5.5% Due 03 March 2015 6,169,002 6.79
Hutchison Whampoa International 09/16 Ltd 4.625%
Due 11 September 2015 4,416,590 4.86
Korea Exchange Bank 1.75% Due 27 September 2015 4,031,400 4.44
Kookmin Bank 7.25% Due 14 May 2014 4,030,000 4.44
Petronas Global Sukuk Ltd 4.25% Due 12 August 2014 3,712,609 4.09
Hongkong Land Finance Cayman Island Co Ltd/The 5.5%
Due 28 April 2014 3,556,346 3.92
CMT MTN Pte Ltd 4.321% Due 08 April 2015 3,197,433 3.52
Korea Gas Corp 6% Due 15 July 2014 3,044,160 3.35
TDC Finance Ltd 6.5% Due 02 July 2014 3,035,760 3.34
Qatar Government International Bond 5.15% Due 09 April
2014 2,997,960 3.30
38,191,260 42.05
5. Maturity Profile of Investments
Fair value at
31 March 2015
US$
Percentage of total net
assets attributable to
unitholders at
31 March 2015
%
Up to 30 days 4,843,842 5.39
31 - 90 days 9,322,469 10.37
91 - 180 days 26,118,057 29.05
181 - 365 days 7,836,136 8.71
366 - 732 days 11,291,503 12.55
59,412,007 66.07
6. i) Exposure to derivatives as at 31 March 2015
Nil
(ii) Gain/Loss on derivative contracts realised for the year ended 31 Mar 2015
Nil
(iii) Net gain/loss on outstanding derivative contracts marked to market as at 31 Mar 2015
Nil
7. Amount and percentage of total fund size invested in other unit trusts, mutal funds and collective
investment
Nil

PHILLIP TREASURY FUND
Report to Unitholders Year ended 31 March 2015
6
8. Amount and percentage of borrowings of total fund size as at 31 March 2015
Nil
9. Amount of units created and cancelled for the year
2015
US$
Units created 401,134,500
Units cancelled (402,570,290)
10. Portfolio turnover ratio
2015 2014
Lower of total value of purchases or sales US$ 3,147,940 14,686,930
Average daily net asset value US$ 91,451,484 84,348,584
Total turnover ratioNote % 3.44 17.41
Note: The portfolio turnover ratio is calculated in accordance with the formula stated in the Code on Collective Investment
Schemes. The calculation of the portfolio turnover ratio was based on the lower of the total value of purchases or sales of the
underlying investments, divided by the weighted average daily net asset value. The total value of bonds matured during the year
is not included in the computation of portfolio turnover ratio.
11. Expense ratio
2015 2014
Total operating expenses US$ 460,918 428,550
Average daily net asset value US$ 91,451,484 84,348,584
Total expense ratioNote % 0.50 0.51
Note: The expense ratio has been computed based on the guidelines laid down by the Investment Management Association of
Singapore ("IMAS"). The calculation of the expense ratio at financial year end was based on total operating expenses divided
by the average net asset value for the year. The total operating expenses do not include (where applicable) bokerage and other
transactions costs, performance fee, interest expense, distribution paid out to unitholders, foreign exchange gains/losses, front
or back end loads arising from the purchase or sale of other funds and tax deducted at source or arising out of income received.
The Sub Fund does not pay any performance fee. The average net asset value is based on the daily balances.
12. Performance of the Fund
As at 31 March 2015 Performance of the Fund
(bid-to-bid)
Benchmark
performance
Cumulative (%)* US$ US$
3 months 0.16 0.03
6 months 0.29 0.07
1 year 0.61 0.13
3 years 1.87 0.27
5 years 3.17 0.90
Since inception (6 May 2009) 4.22 1.12
Annualised (%) US$ US$
3 years 0.62 0.09
5 years 0.63 0.18
Since inception (6 May 2009) 0.70 0.19
Note:*Cumulative returns are in US dollars calculated on a bid to bid basis, with net dividends reinvested Benchmark : 1-week
US$ Libor (Source: Bloomberg)

PHILLIP TREASURY FUND
Report to Unitholders Year ended 31 March 2015
7
13. Related party transactions
In the normal course of the business of the Sub-Fund, trustee fees and management fees have been paid
or are payable to the Trustee and the Manager respectively as noted in the Statement of Total Return.
In addition, the bank holding company and related parties of the Trustee have also provided custodian,
banking, foreign exchange, fund adminstration and brokerage services to the Sub-Fund in the normal
course of business at terms agreed between the parties and within the provisions of the Trust Deed.
The following significant transactions took place between the Fund and its related parties during the
period:
2015 2014
US$
US$
Bank balances held with related party of the Trustee 10,495,632 5,538,083
14. Any other material information that will adversely impact the valuation of the Fund
Nil
15. Soft dollar commissions
The Manager shall be entitled to and intends to receive or enter into soft-dollar commissions or
arrangements. The Manager will comply with applicable regulartory and industry standards on
soft-dollars. The soft-dollar commissions which the Manager may receive include research and advisory
services, economic and political analyses, portfolio analyses including valuation and performance
measurements, market analyses, data and quotation services, computer hardware and software or any
other information facilities to the extent that they are used to support the investment decision making
process, the giving of advice, or the conduct of research or analysis and custodial service in relation to
the investments managed for clients. The soft dollar credits utilised are not allocated on a specific client
baiss. The brokers also execute trades for other funds mananged by the Manager.
The Manager will not accept or enter into soft dollar commissions or arrangements unless such
soft-dollar commissions/arrangements would, in the opinion of the Manager, assist the Manager in its
management of clients' funds, provided that the Manager shall ensure at all times that transactions are
executed on the best available terms taking into account the relevant market at the time for transactions
of the kind and size concerned, and that no unnecessary trades are entered into in order to qualify for
such soft-dollar commissions/arrangements.
The Manager does not, and is not entitled to, retain cash rebates for its own account in respect of rebates
earned when transacting in securities for account of clients' funds.
The Manager did not receive any soft dollar commissions during the period.

PHILLIP TREASURY FUND
8
REPORT OF THE TRUSTEE
Year ended 31 March 2015
The Trustee is under a duty to take into custody and hold the assets of Phillip Treasury Fund in trust for the
unitholders. In accordance with the Securities and Futures Act (Chapter 289), its subsidiary legislation and the
Code on Collective Investment Schemes, the Trustee shall monitor the activities of the Manager for compliance
with the limitations imposed on the investment and borrowing powers as set out in the Trust Deed in each
annual accounting period and report thereon to unitholders in an annual report.
To the best knowledge of the Trustee, the Manager has, in all material respects, managed Phillip Treasury Fund
during the period covered by these financial statements, set out on pages FS1 to FS17, in accordance with the
limitations imposed on the investment and borrowing powers set out in the Trust Deed.
For and on behalf of the Trustee
BNP Paribas Trust Services Singapore Limited
Authorised signatory
Date: 23 June 2015
PHILLIP TREASURY FUND
9
STATEMENT BY THE MANAGER
Year ended 31 March 2015
In the opinion of the directors of Phillip Capital Management (S) Ltd, the accompanying financial statements set
out on pages FS1 to FS17, comprising the Statement of Total Return, Statement of Financial Position, Statement
of Movements of Unitholders’ Funds, Statement of Portfolio and Notes to the Financial Statements are drawn up
so as to present fairly, in all material respects, the financial position of Phillip Treasury Fund as at 31 March
2015, and the total return and changes in unitholders’ funds for the year then ended in accordance with the
recommendations of Statement of Recommended Accounting Practice 7 “Reporting Framework for Unit Trusts”
issued by the Institute of Singapore Chartered Accountants. At the date of this statement, there are reasonable
grounds to believe that Phillip Treasury Fund will be able to meet its financial obligations as and when they
materialise.
For and on behalf of the Manager
Phillip Capital Management (S) Ltd
Authorised signatory
Date: 23 June 2015
PHILLIP TREASURY FUND
10
INDEPENDENT AUDITOR’S REPORT TO THE UNITHOLDERS OF PHILLIP TREASURY FUND
(Constituted under a Trust Deed registered in the Republic of Singapore)
We have audited the financial statements of Phillip Treasury Fund (the “Fund”), which comprise the Statement
of Financial Position and Statement of Portfolio as at 31 March 2015, the Statement of Total Return and
Statement of Movements of Unitholders’ Funds for the year then ended, and a summary of significant
accounting policies and other explanatory information, as set out on pages FS1 to FS17.
Manager’s responsibility for the financial statements
The Fund’s Manager (the “Manager”) is responsible for the preparation and fair presentation of these financial
statements in accordance with the recommendations of Statement of Recommended Accounting Practice 7
“Reporting Framework for Unit Trusts” issued by the Institute of Singapore Chartered Accountants, and for
such internal controls as the Manager determines is necessary to enable the preparation of financial statements
that are free from material misstatements, whether due to fraud or error.
Auditors’ responsibility
Our responsibility is to express an opinion on these financial statements based on our audit. We conducted our
audit in accordance with Singapore Standards on Auditing. Those standards require that we comply with
ethical requirements and plan and perform the audit to obtain reasonable assurance about whether the financial
statements are free from material misstatement.
An audit involves performing procedures to obtain audit evidence about the amounts and disclosures in the
financial statements. The procedures selected depend on the auditor’s judgement, including the assessment of
the risks of material misstatement of the financial statements, whether due to fraud or error. In making those
risk assessments, the auditor considers internal control relevant to the Fund’s preparation and fair presentation of
the financial statements in order to design audit procedures that are appropriate in the circumstances, but not for
the purpose of expressing an opinion on the effectiveness of the Fund’s internal control. An audit also includes
evaluating the appropriateness of accounting policies used and the reasonableness of accounting estimates made
by the Manager, as well as evaluating the overall presentation of the financial statements.
We believe that the audit evidence we have obtained is sufficient and appropriate to provide a basis for our audit
opinion.
Opinion
In our opinion, the financial statements present fairly, in all material respects, the financial position of the Fund
as at 31 March 2015 and the total return and movement in unitholders’ funds for the year then ended, in
accordance with the recommendations of Statement of Recommended Accounting Practice 7 “Reporting
Framework for Unit Trusts” issued by the Institute of Singapore Chartered Accountants.
KPMG LLP
Public Accountants and
Chartered Accountants
Singapore
Date: 23 June 2015

PHILLIP TREASURY FUND ____________________________________________________________________________
FS1
Statement of Total Return
Year ended 31 March 2015
Phillip USD Money Market
Fund
Note 2015 2014
US$ US$
Income
Dividends – 469
Interest 281,943 188,612
281,943 189,081
Less:
Expenses
Management fees 365,040 338,045
Trustee and administration fees 59,323 54,935
Custody fees (424) 401
Audit fee 8,611 9,767
Other expenses 28,368 25,402
460,918 428,550
Net income (178,975) (239,469)
Net gains or losses on value of investments
Net gains on investments 706,873 700,396
Net (losses)/gains on foreign exchange (2,715) 126
704,158 700,522
Total return for the year before income tax 525,183 461,053
Less: Income tax 7 – –
Total return for the year after income tax
before distribution 525,183 461,053

PHILLIP TREASURY FUND ____________________________________________________________________________
FS2
Statement of Financial Position
Year ended 31 March 2015
Phillip USD Money Market
Fund
Note 2015 2014
US$ US$
Assets
Portfolio of investments 59,412,007 63,301,652
Receivables 3 75,734 43,861
Cash and cash equivalents 4 30,540,909 27,560,149
Total assets 90,028,650 90,905,662
Liabilities
Payables 5 107,911 74,316
Total liabilities 107,911 74,316
Equity
Net assets attributable to unitholders 6 89,920,739 90,831,346

PHILLIP TREASURY FUND ____________________________________________________________________________
FS3
Statement of Movements of Unitholders’ Funds
Year ended at 31 March 2015
Phillip USD Money Market
Fund
Note 2015 2014
US$ US$
Net assets attributable to unitholders at the
beginning of financial year 90,831,346 65,607,574
Operations
Change in net assets attributable to unitholders
resulting from operations 525,183 461,053
Unitholders’ contributions/(withdrawals)
Creation of units 401,134,500 358,243,752
Cancellation of units (402,570,290) (333,481,033)
Change in net assets attributable to unitholders
resulting from net creation and cancellations of
units (1,435,790) 24,762,719
Total (decrease)/increase in net assets attributable
to unitholders (910,607) 25,223,772
Net assets attributable to unitholders at the
end of financial year 6 89,920,739 90,831,346

PHILLIP TREASURY FUND ____________________________________________________________________________
FS4
Statement of Portfolio
As at 31 March 2015
Holdings
as at
Fair value
as at
Percentage of
total net assets
attributable to
unitholders
as at
31/3/2015 31/3/2015 31/3/2015
US$ %
Phillip USD Money Market Fund
By Geography (Primary)
Quoted debt securities
Australia
Macquarie Bank Ltd 3.45%
Due 27 July 2015 1,000,000 1,008,420 1.12
1,008,420 1.12
British Virgin Islands
Cnpc General Capital Ltd 1.45%
Due 16 April 2016 3,000,000 3,002,670 3.34
Cnpc Hk Overseas Capital Ltd 3.125%
Due 28 April 2016 1,950,000 1,986,211 2.21
4,988,881 5.55
Cayman Islands
Hutchison Whampoa International Ltd 4.625%
Due 11 September 2015 4,198,000 4,267,519 4.75
Tencent Holdings Ltd 1.86%
Due 10 September 2015 1,400,000 1,404,252 1.56
Tencent Holdings Ltd 4.625%
Due 12 December 2016 1,000,000 1,048,230 1.17
6,720,001 7.48
China
Agricultural Bank of China Ltd/Hong Kong
1.61% Due 29 June 2015 2,000,000 1,999,712 2.22
Agricultural Bank of China Ltd/Singapore
1.67% Due 30 April 2015 1,000,000 999,968 1.11
Bank of China Ltd/Hong Kong 1.68%
Due 16 July 2015 4,000,000 4,000,581 4.45
Bank of China Ltd/Singapore 1.45%
Due 13 August 2015 2,000,000 1,999,633 2.22
Carried forward 8,999,894 10.00

PHILLIP TREASURY FUND ____________________________________________________________________________
FS5
Holdings
as at
Fair value
as at
Percentage of
total net assets
attributable to
unitholders
as at
31/3/2015 31/3/2015 31/3/2015
US$ %
Phillip USD Money Market Fund
By Geography (Primary)
China (continued)
Brought forward 8,999,894 10.00
Bank of Communications Co Ltd/Hong Kong
2.125% Due 15 January 2017 1,000,000 1,003,540 1.12
Industrial & Commercial Bank of China
Ltd/Luxembourg % Due 26 June 2015 1,500,000 1,494,671 1.66
11,498,105 12.78
Malaysia
1Malaysia Sukuk Global Bhd 3.928%
Due 04 June 2015 2,000,000 2,009,440 2.23
Sarawak International Inc 5.5%
Due 03 August 2015 3,880,000 3,926,560 4.37
5,396,000 6.60
Singapore
CMT MTN Pte Ltd 4.321%
Due 08 April 2015 3,750,000 3,750,600 4.17
3,750,600 4.17
South Korea
Export-Import Bank of Korea 1.12065%
Due 17 September 2016 1,000,000 1,004,420 1.11
Hana Bank 1.375%
Due 5 February 2016 3,500,000 3,505,600 3.89
Kookmin Bank 1.375%
Due 15 January 2016 2,050,000 2,054,448 2.28
Korea Development Bank 4.375%
Due 10 August 2015 1,000,000 1,012,530 1.13
Korea Exchange Bank 1.75%
Due 27 September 2015 5,000,000 5,017,350 5.58
Korea Expressway Corp 5.125%
Due 20 May 2015 1,582,000 1,590,400 1.77
Carried forward 14,184,748 15.76

PHILLIP TREASURY FUND ____________________________________________________________________________
FS6
Holdings
as at
Fair value
as at
Percentage of
total net assets
attributable to
unitholders
as at
31/3/2015 31/3/2015 31/3/2015
US$ %
Phillip USD Money Market Fund
By Geography (Primary)
South Korea (continued)
Brought forward 14,184,748 15.76
Korea Hydro & Nuclear Power Co Ltd 3.125%
Due 16 September 2015 2,000,000 2,019,940 2.25
Korea National Oil Corp 2.875%
Due 9 November 2015 1,000,000 1,012,180 1.13
Korea Resources Corp 4.125%
Due 19 May 2015 614,000 616,456 0.69
Shinhan Bank 4.125%
Due 4 October 2016 3,000,000 3,120,720 3.47
Shinhan Bank 4.375%
Due 15 September 2015 1,310,000 1,330,265 1.48
Woori Bank Co Ltd 4.75% Due 20 January 2016 1,195,000 1,228,125 1.37
23,512,434 26.15
United States of America
Goldman Sachs Group Inc 3.3% Due 03 May 2015 1,500,000 1,502,820 1.67
1,502,820 1.67
Accrued interest on debt securities 494,746 0.55
Portfolio of investments 59,412,007 66.07
Other net assets 30,508,732 33.93
Net assets attributable to unitholders 89,920,739 100.00

PHILLIP TREASURY FUND ____________________________________________________________________________
FS7
Fair value
as at
Percentage of
total net assets
attributable to
unitholders
as at
Percentage of
total net assets
attributable to
unitholders
as at
31/3/2015 31/3/2015 31/3/2014
Phillip USD Money Market Fund US$ % %
By Geography (Summary)
Australia 1,008,420 1.12 1.14
Bermuda – – 2.22
British Virgin Islands 4,988,881 5.55 –
Cayman Islands 6,720,001 7.48 12.12
China 11,498,105 12.78 –
Hong Kong – – 2.66
Malaysia 5,936,000 6.60 14.27
Qatar – – 3.86
Singapore 3,750,600 4.17 3.52
South Korea 23,512,434 26.15 26.23
United States of America 1,502,820 1.67 2.84
58,917,261 65.52 68.86
Accrued interest on debt securities 494,746 0.55 0.83
Portfolio of investments 59,412,007 66.07 69.69
Other net assets 30,508,732 33.93 30.31
Net assets attributable to unitholders 89,920,739 100.00 100.00

PHILLIP TREASURY FUND ____________________________________________________________________________
FS8
Fair value
as at
Percentage of
total net assets
attributable to
unitholders
as at
Percentage of
total net assets
attributable to
unitholders
as at
31/3/2015 31/3/2015 31/3/2014
Phillip USD Money Market Fund US$ % %
By Industry (Secondary)
Communications 2,452,482 2.73 2.22
Consumer, Non-cyclical 1,590,400 1.77 4.09
Diversified 4,267,517 4.74 5.98
Energy 6,617,518 7.36 5.35
Financial 38,955,544 43.32 40.28
Government agency 3,013,860 3.35 5.57
Utilities 2,019,940 2.25 5.37
58,917,261 65.52 68.86
Accrued interest on debt securities 494,746 0.55 0.83
Portfolio of investments 59,412,007 66.07 69.69
Other net assets 30,508,732 33.93 30.31
Net assets attributable to unitholders 89,920,739 100.00 100.00

PHILLIP TREASURY FUND ____________________________________________________________________________
FS9
Notes to the Financial Statements
These notes form an integral part of the financial statements.
1 Domicile and activities
Phillip Treasury Fund (the “Fund") is an open ended umbrella unit trust constituted pursuant to
a Trust Deed dated 17 February 2009 together with its Amended and Restated Deeds thereon
(thereafter referred to as the “Trust Deed”) between Phillip Capital Management (S) Ltd (the
“Manager") and BNP Paribas Trust Services Singapore Limited (the “Trustee”). The Trust
Deed is governed by and construed in accordance with the laws of the Republic of Singapore.
The Fund currently comprises one sub-fund, Phillip USD Money Market Fund (the
“Sub-Fund”), which was launched on 4 May 2009.
The investment objective of the Sub-Fund is to provide liquidity and manage risk while looking
to provide a return which is comparable to that of USD short-term deposits.
The Sub-Fund invests in high quality short-term money market instruments and debt securities.
Some of the investments may include government and corporate bonds, commercial bills and
deposits with financial institutions.
2 Significant accounting policies
2.1 Basis of financial statements preparation
The financial statements, expressed in United States Dollars, have been prepared under the
historical cost basis, as modified by the revaluation of investments, and in accordance with the
Statement of Recommended Accounting Practice 7 “Reporting Framework for Unit Trusts”
issued by the Institute of Singapore Chartered Accountants.
For the purposes of preparation of these financial statements, the basis used for calculating the
expense ratio and turnover rate ratio are in accordance with the guidelines issued by the
Investment Management Association of Singapore (“IMAS”) and the Code on Collective
Investment Schemes under the Securities and Futures Act (Cap 289) (“Code”) respectively.
2.2 Basis of valuation of investments
Quoted investments are stated at fair value based on the bid prices at the reporting date.
Unrealised gains/losses on investments are represented by the difference between the fair value
and the carrying value of investments and are recognised in the Statement of Total Return.
Realised gains and losses upon disposal of investments are computed on the basis of the
difference between the carrying value and the selling price of investments on trade date and are
taken to the Statement of Total Return.

PHILLIP TREASURY FUND ____________________________________________________________________________
FS10
2.3 Recognition of income
Dividend income is recognised when declared and is stated gross of tax credits.
Interest income is recognised using the effective interest method.
2.4 Foreign currency translation
Transactions in foreign currencies are translated at the exchange rate at the date of transaction.
Monetary assets and liabilities denominated in foreign currencies at the reporting date are
translated at exchange rates at the reporting date. All exchange differences are recognised in
the Statement of Total Return.
2.5 Cash and cash equivalents
Cash and cash equivalents comprise term deposits and bank balances. Cash equivalents are
short-term highly liquid investments that are readily convertible to known amounts of cash and
are subject to an insignificant risk of changes in value.
2.6 Net assets attributable to unitholders
Net assets attributable to unitholders are classified as equity.
3 Receivables Phillip USD Money Market Fund
2015 2014
US$ US$
Receivable from unitholders for creation of units 36,378 –
Accrued interest receivable 39,356 43,861
75,734 43,861
4 Cash and cash equivalents Phillip USD Money Market Fund
2015 2014
US$ US$
Term deposits 20,045,277 22,022,066
Bank balances 10,495,632 5,538,083
30,540,909 27,560,149
The bank balances are placed with a financial institution related to the Trustee.

PHILLIP TREASURY FUND ____________________________________________________________________________
FS11
5 Payables Phillip USD Money Market Fund
2015 2014
US$ US$
Payable to unitholders for cancellation of units 8,011 –
Accrued expenses 99,900 74,316
107,911 74,316
6 Units in issue
During the year the number of shares issued, redeemed and outstanding were as follows:
Phillip USD Money Market Fund
2015 2014
US$ US$
Units at beginning of the year 87,654,758 63,645,167
Units created 385,987,827 346,832,141
Units cancelled (387,366,149) (322,822,550)
Units at end of the year 86,276,436 87,654,758
Net assets attributable to unitholders – US$ 89,920,739 90,831,346
Net asset value per unit – US$ 1.0422 1.0362
For subscriptions and redemptions and for various fee calculations, investments are stated at the
last traded price on the valuation day for the purpose of determining net asset value per unit
while for reporting purpose, the investments are valued at the relevant bid market prices as at
the reporting date.
The effect of bid market prices in the net assets attributable to unitholders is as follows:
Phillip USD Money Market Fund
2015 2014
US$ US$
Net assets attributable to unitholders per financial
statements 89,920,739 90,831,346
Effect of adopting bid prices at fair value 3,771 (27,949)
Net assets attributable to unitholders for
issuing/redeeming 89,924,510 90,803,397

PHILLIP TREASURY FUND ____________________________________________________________________________
FS12
7 Income tax
The Fund was approved for the Enhanced-Tier Fund Tax Incentive Scheme under Section 13X
of the Income Tax Act by the Monetary Authority of Singapore (“MAS”) with effect from 16
August 2010. The tax exemption status will be for the life of the Fund, provided the Fund
continues to meet all the terms and conditions set out by MAS and the relevant Income Tax
legislations.
8 Financial risk management
The Sub-Fund’s activities expose it to a variety of market risks (including price risk, interest
rate risk and currency risk), liquidity risk and credit risk. The Sub-Fund’s overall risk
management programme seeks to minimise potential adverse effects on the Sub-Fund’s
financial performance. The Sub-Fund may use financial derivative instruments, subject to the
terms of the Trust Deed to moderate certain risk exposures. Specific guidelines on exposures
to individual securities and certain industries are in place for the Sub-Fund at any time as part of
the overall financial risk management to reduce the Sub-Fund’s risk exposures.
a) Market risks
Market risk is the risk of potential adverse change to the value of financial instruments because
of changes in market conditions such as interest rate movements and volatility in securities’
prices. The Manager manages the Sub-Fund’s exposure to market risk through the use of risk
management strategies and various analytical monitoring techniques.
i. Price risk
Price risk is the risk that the fair values of equities or future cash flows of a financial
instrument will fluctuate because of changes in market prices (other than those arising
from interest rate risk or currency risk).
The investments of the Sub-Fund are subject to normal market fluctuations and the risks
inherent in investing in securities markets and there can be no assurance that
appreciation will occur. It is the policy of the Manager to maintain a diversified
portfolio of investments so as to minimise the risk.
ii. Interest rate risk
Interest rate risk is the risk that the value of a financial instrument will fluctuate due to changes
in market interest rates.
The tables below summarise the Sub-Fund's exposure to interest rate risks. They include the
Sub-Fund’s assets and trading liabilities at fair value, categorised by interest rate types.

PHILLIP TREASURY FUND ____________________________________________________________________________
FS13
Fixed rate
Floating
rate
up to
1 year 1-5 years
Non-interest
bearing Total
2015 US$ US$ US$ US$ US$
Assets
Portfolio of
investments – 48,120,503 11,291,504 – 59,412,007
Receivables – – – 75,734 75,734
Cash and bank balances – 20,045,277 – 10,495,632 30,540,909
– 68,165,780 11,291,504 10,571,366 90,028,650
Liabilities
Payables – – – 107,911 107,911
– – – 107,911 107,911
2014
Assets
Portfolio of
investments – 35,914,918 27,384,004 2,730 63,301,652
Receivables – – – 43,861 43,861
Cash and bank balances – 22,022,066 – 5,538,083 27,560,149
– 57,936,984 27,384,004 5,584,674 90,905,662
Liabilities
Payables – – – 74,316 74,316
– – – 74,316 74,316
The duration, a measure of the sensitivity of the price of a fixed income security to a change in
interest for the 12 month period is as disclosed below. As of 31 March, should interest rates
rise or lower by 1% with all other variables remaining constant, the increase/decrease in net assets attributable to unitholders would be as follows:
Interest rates rise/lower by 1%
Increase/Decrease in net assets
attributable to unitholders
2015 2014 US$ US$
Increase/Decrease in net assets attributable to
unitholders 307,544 446,090
iii. Currency risk
The Sub-Fund’s assets and liabilities are held in United States Dollars, which is also its
functional currency, therefore no sensitivity analysis and currency exposure table are presented.
In addition, the Sub-Fund invests in underlying securities which are denominated in its
functional currency where the fluctuations in the relevant exchange rates would not have an
impact on the income and value of the Sub-Fund.

PHILLIP TREASURY FUND ____________________________________________________________________________
FS14
b) Liquidity risk
The Sub-Fund is exposed to daily redemption of units in the Sub-Fund. Therefore the majority
of its assets are invested in investments that are traded in an active market and can be readily
disposed of.
c) Credit risk
Credit risk is the risk that counterparty will fail to perform contractual obligations, either in
whole or in part, under a contract.
The main credit risk to which the Sub-Fund is exposed arises from the Sub-Fund’s investments
in debt securities. The Sub-Fund is also exposed to counterparty credit risk on cash and bank
balances and other receivable balances.
The Sub-Fund invests mostly in financial assets, which have an investment grade as rated by
international credit rating agencies.
All transactions in listed securities are settled/paid upon delivery using approved brokers. The
risk of default is considered minimal, as delivery of securities is only made once the broker has
received payment. Payment is made on a purchase once the securities have been received by
the broker. The trade will fail if either party fails to meet its obligation.
The table below analyses the Sub-Fund’s debt investments by credit ratings.
Debt securities by rating category
Percentage of
total net assets
attributable to
unitholders at
31 March 2015
Percentage of
total net assets
attributable to
unitholders at
31 March 2014
% %
AAA – 2.68
AA – 6.78
A 51.15 52.08
Aa* – 4.56
A* 14.92 3.59
Total 66.07 69.69
Source of the credit rating is from Standard & Poor’s except the following:
* Credit rating is from Moody’s
d) Fair value estimation
Except for investments which are measured at fair value, at 31 March 2015 and 2014, the fair
values of assets and liabilities approximate their carrying values on the Statement of Financial
Position.

PHILLIP TREASURY FUND ____________________________________________________________________________
FS15
The fair value of financial assets and liabilities traded in active markets (such as publicly traded
securities) are based on quoted market prices at the close of trading on the reporting date. The
quoted market price used for financial assets held by the Sub-Fund is the current bid price; the
appropriate quoted market price for financial liabilities is the current asking price.
The Sub-Fund classifies fair value measurements using a fair value hierarchy that reflects the
significance of the inputs used in making the measurements. The fair value hierarchy has the
following levels:
Quoted prices (unadjusted) in active markets for identical assets or liabilities (Level 1).
Inputs other than quoted prices included within level 1 that are observable for the asset or
liability, either directly (that is, as prices) or indirectly (that is, derived from prices) (Level 2).
Inputs for the asset or liability that are not based on observable market data (that is,
unobservable inputs) (Level 3).
The following table analyses within the fair value hierarchy the Sub-Fund’s financial assets and
liabilities (by class) measured at fair value at 31 March 2015 and 2014:
Phillip USD Money Market
Fund Level 1 Level 2 Level 3 Total
US$ US$ US$ US$
2015
Assets
Debt securities 48,811,771 10,600,236 – 59,412,007
2014
Assets
Debt securities 62,260,363 1,038,559 – 63,298,922
Investment fund 2,730 – – 2,730
Investments whose values are based on quoted market prices in active markets, and therefore
classified within level 1, include active listed equities and quoted debt securities. The
Sub-Fund does not adjust the quoted price for these instruments.
Financial instruments that trade in markets that are not considered to be active but are valued
based on quoted market prices, dealer quotations or alternative pricing sources supported by
observable inputs are classified within level 2.
Investments classified within level 3 have significant unobservable inputs, as they trade
infrequently.
PHILLIP TREASURY FUND ____________________________________________________________________________
FS16
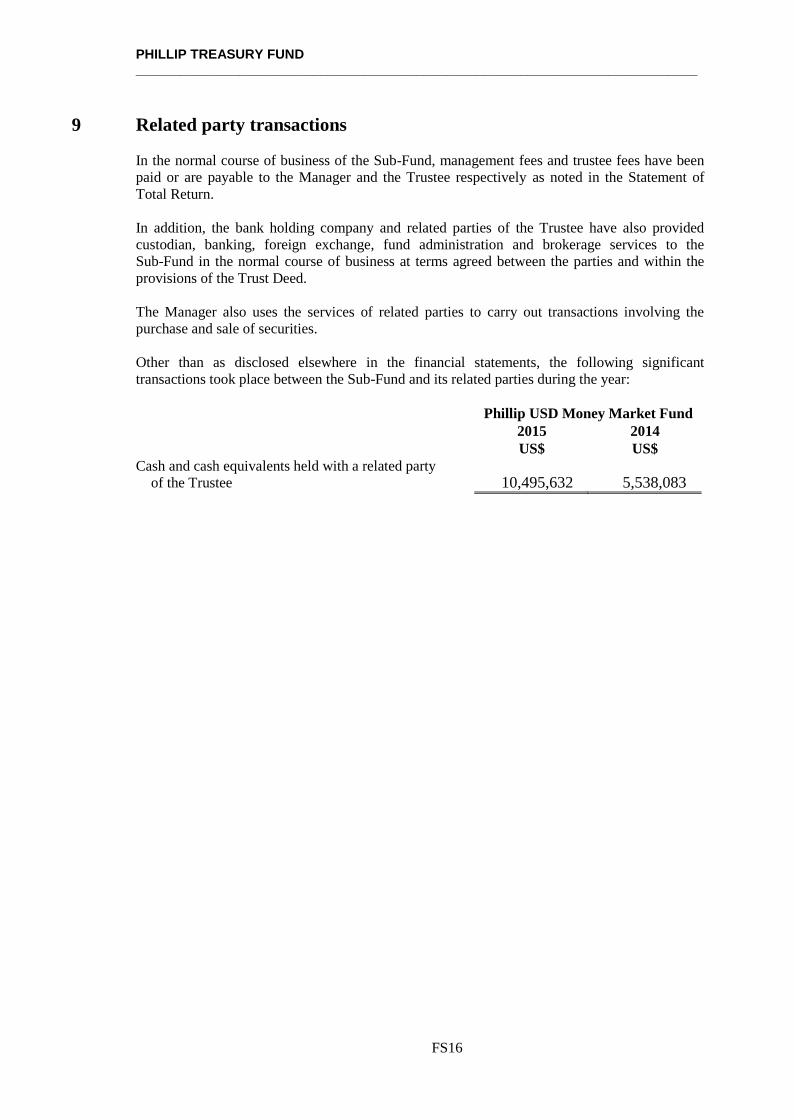
9 Related party transactions
In the normal course of business of the Sub-Fund, management fees and trustee fees have been
paid or are payable to the Manager and the Trustee respectively as noted in the Statement of
Total Return.
In addition, the bank holding company and related parties of the Trustee have also provided
custodian, banking, foreign exchange, fund administration and brokerage services to the
Sub-Fund in the normal course of business at terms agreed between the parties and within the
provisions of the Trust Deed.
The Manager also uses the services of related parties to carry out transactions involving the
purchase and sale of securities.
Other than as disclosed elsewhere in the financial statements, the following significant
transactions took place between the Sub-Fund and its related parties during the year:
Phillip USD Money Market Fund
2015 2014
US$ US$
Cash and cash equivalents held with a related party
of the Trustee 10,495,632 5,538,083

PHILLIP TREASURY FUND ____________________________________________________________________________
FS17
10 Financial ratios
Phillip USD Money Market Fund
Expense Ratio 2015 2014
Total operating expenses US$ 460,918 428,550
Average daily net asset value US$ 91,451,484 84,348,584
Expense ratio1 % 0.50 0.51
Turnover Ratio
Lower of total value of purchases or sales US$ 3,147,940 14,686,930
Average daily net asset value US$ 91,451,484 84,348,584
Turnover ratio2 % 3.44 17.41
Note 1: The expense ratio has been computed based on the guidelines laid down by the IMAS.
The calculation of the expense ratio was based on total operating expenses divided by
the average net asset value for the year. The total operating expenses do not include
(where applicable) brokerage and other transaction costs, performance fees, interest
expenses, distributions paid out to unitholders, foreign exchange gains/losses, front or
back end loads arising from the purchase or sale of other funds and tax deducted at
source or arising out of income received. The Sub-Fund does not pay performance fee.
The average net asset value is based on the daily balances.
Note 2: The portfolio turnover ratio is calculated in accordance with the formula stated in the
Code. The calculation of the portfolio turnover ratio was based on the total value of
purchases (or sales) of the underlying investments divided by the weighted average
daily net asset value. The total value of bonds matured during the year is not
included in the computation of portfolio turnover ratio.
PHILLIP TREASURY FUND ____________________________________________________________________________
FS18
IMPORTANT INFORMATION
Phillip USD Money Market Fund (the “Sub-Fund”) is a sub-fund of Phillip Treasury Fund (the
“Fund”), an open-ended umbrella unit trust authorised under the Securities and Futures Act,
Chapter 289, by the Monetary Authority of Singapore.
This document is published by Phillip Capital Management (S) Ltd, the manager of the Fund
(the “Manager”), for information only and it does not constitute a prospectus nor form part of
any offer or invitation to subscribe for or to purchase, or solicitation of any offer to subscribe for
or to purchase, any units in the Fund. All applications for units in the Fund must be made on the
application forms accompanying the latest prospectus of the Fund (the “Prospectus”).
The information and opinions contained in this document have been obtained from public
sources which the Manager believes to be reliable and accurate. However, no representation or
warranty, express or implied, is made as to the fairness, accuracy, completeness or correctness of
the information and it should not be relied upon as such. Opinions included herein constitute the
judgement of the Manager at the time specified and may be subject to change without notice,
they are not to be relied upon as authoritative or taken in substitution for the exercise of
judgment by any recipient and are not intended to provide the sole basis of evaluation of any
investment. Neither the Manager nor the Fund, nor any of their respective associates, directors,
officers or employees, accepts any liability whatsoever for any loss arising directly or indirectly
from any use of this document or any information contained herein.
Given the economic and market risks, there can be no assurance that the Fund will achieve its
investment objectives. Investments in the Fund are not deposits or other obligations of, or
guaranteed, or insured by the Manager or the distributors or their affiliates and are subject to
investment risks, including the possible loss of the full principal amount invested. Returns may
be affected by, among other things, the investment strategies or objectives of the Fund and
material market and economic conditions. The value of the units and the income from them can
fall as well as rise. Past performance is not necessarily indicative of the future performance of
the Fund.
This document should not be taken as a recommendation to buy or sell since it does not take into
account the specific investment objectives, financial situation and the particular needs of any
particular recipient of this document. Investors should seek advice from a financial advisor
before purchasing units in the Fund. In any case, investors should read the Prospectus and
consider the risks as well as suitability of the Fund before deciding whether to subscribe for
units in the Fund. Copies of the Prospectus are available and may be obtained from the Manager.