philips quarterly report 2010 › main › corpcomms › resources … · quarterly report and...
TRANSCRIPT
Quarterly report and Semi-annual reportQ2 2010, Royal Philips Electronics
Philips reports second-quarterEBITA of EUR 527 million and salesof EUR 6.2 billion
• Comparable sales up 12%, led by double-digit growth atLighting and Consumer Lifestyle
• Emerging markets sales growth accelerates to 29%, nowrepresenting over one-third of Group sales
• EBITA of EUR 527 million, or 8.5% of sales• EBITA, excluding EUR 93 million restructuring and
acquisition-related charges, at 10% of sales• Net income of EUR 262 million
“In Q2, Philips delivered another strong quarter, with good top-line growth andstrong profitability in all three operating sectors. Sales performance wasespecially strong in emerging markets. We are particularly pleased to havereached an adjusted profitability level of 10% in the quarter.
It is encouraging to see that our performance continues to improve, despiteongoing weakness in many global markets and economic uncertainty – a cleartestimony to the soundness of our strategy and the strength of our portfolio. Ibelieve we remain well on our way to becoming the leading company in healthand well-being and consider this quarter another clear step in the rightdirection.”
Gerard Kleisterlee, President and CEO of Royal Philips Electronics
Forward-looking statements This document contains certain forward-looking statements withrespect to the financial condition, results of operations andbusiness of Philips and certain of the plans and objectives ofPhilips with respect to these items, in particular the paragraphs“Looking ahead” and “Outlook”. Examples of forward-lookingstatements include statements made about our strategy,estimates of sales growth, future EBITA and future developmentsin our organic business. By their nature, these statements involverisk and uncertainty because they relate to future events andcircumstances and there are many factors that could cause actualresults and developments to differ materially from thoseexpressed or implied by these statements. These factors include but are not limited to domestic and globaleconomic and business conditions, the successful implementationof our strategy and our ability to realize the benefits of thisstrategy, our ability to develop and market new products,changes in legislation, legal claims, changes in exchange andinterest rates, changes in tax rates, pension costs and actuarialassumptions, raw materials and employee costs, our ability toidentify and complete successful acquisitions and to integratethose acquisitions into our business, our ability to successfullyexit certain businesses or restructure our operations, the rate oftechnological changes, political, economic and otherdevelopments in countries where Philips operates, industryconsolidation and competition. As a result, Philips’ actual futureresults may differ materially from the plans, goals andexpectations set forth in such forward-looking statements. For adiscussion of factors that could cause future results to differ fromsuch forward-looking statements, see the Risk managementchapter included in our Annual Report 2009 and the “Risk anduncertainties” section in our semi-annual financial report for thesix months ended July 4, 2010.
Third-party market share dataStatements regarding market share, including those regardingPhilips’ competitive position, contained in this document arebased on outside sources such as research institutes, industry anddealer panels in combination with management estimates. Whereinformation is not yet available to Philips, those statements mayalso be based on estimates and projections prepared by outsidesources or management. Rankings are based on sales unlessotherwise stated.
Use of non-GAAP informationIn presenting and discussing the Philips Group’s financial position,operating results and cash flows, management uses certain non-GAAP financial measures. These non-GAAP financial measuresshould not be viewed in isolation as alternatives to the equivalentIFRS measures and should be used in conjunction with the mostdirectly comparable IFRS measures. A reconciliation of suchmeasures to the most directly comparable IFRS measures iscontained in this document. Further information on non-GAAPmeasures can be found in our Annual Report 2009.
Use of fair-value measurementsIn presenting the Philips Group’s financial position, fair-values areused for the measurement of various items in accordance withthe applicable accounting standards. These fairvalues are basedon market prices, where available, and are obtained from sourcesthat are deemed to be reliable. Readers are cautioned that thesevalues are subject to changes over time and are only valid at thebalance sheet date. When quoted prices or observable marketdata do not exist, we estimated the fairvalues using appropriatevaluation models and unobservable inputs. They requiremanagement to make significant assumptions with respect tofuture developments, which are inherently uncertain and maytherefore deviate from actual developments. Criticalassumptions used are disclosed in our 2009 financial statements.Independent valuations may have been obtained to supportmanagement’s determination of fairvalues.
All amounts in millions of euros unless otherwise stated; dataincluded are unaudited. Financial reporting is in accordance withIFRS, unless otherwise stated. This document comprisesregulated information within the meaning of the Dutch FinancialMarkets Supervision Act ‘Wet op het Financieel Toezicht’.

2 Quarterly report and Semi-annual report
Philips GroupNet incomein millions of euros unless otherwise stated
Q2 Q2
2009 2010
Sales 5,230 6,191
EBITA 118 527 as a % of sales 2.3 8.5
EBIT 8 404 as a % of sales 0.2 6.5
Financial expenses (3) (71)
Income taxes 15 (82)
Results investments inassociates 25 11
Net income 45 262
Net income -shareholders per commonshare (in euros) - basic 0.05 0.28
Sales by sectorin millions of euros unless otherwise stated
Q2 Q2 % change
2009 2010 nominal comparable
Healthcare 1,872 2,068 10 4
ConsumerLifestyle 1,735 2,183 26 20
Lighting 1,550 1,859 20 13
GM&S 73 81 11 11 Philips Group 5,230 6,191 18 12
Sales per market clusterin millions of euros unless otherwise stated
Q21) Q2 % change
2009 2010 nominal comparable
Western Europe 1,803 1,986 10 8
North America 1,633 1,745 7 0
Other mature markets 290 370 28 12
Total mature markets 3,726 4,101 10 5
Emerging markets 1,504 2,090 39 29 Philips Group 5,230 6,191 18 12
1) Revised to reflect an adjusted market cluster allocation
Net income• Net income was EUR 217 million higher than in Q2
2009, driven by substantially higher earnings in theoperating sectors, notably Lighting and ConsumerLifestyle, partially offset by higher income taxes andfinancial expenses.
• Financial income and expenses in Q2 2010 wasimpacted by unfavorable fair-value adjustments of theTPV bond option, whereas Q2 2009 included a EUR 48million gain on the sale of Pace shares.
• The decline in Results from investments in associateswas largely attributable to last year’s EUR 25 millionfavorable reversal of the accumulated value adjustmentof Philips’ shareholding in TPV.
• Income tax was higher than in Q2 2009 due to higherearnings and lower non-taxable income, mainlyreflecting last year's EUR 48 million gain on the sale ofPace shares.
Sales per sector• Sales amounted to EUR 6,191 million, an increase of
12% on a comparable basis.• Healthcare sales improved by 4% on a comparable basis,
driven by growth in all businesses, notably solid growthat Patient Care and Clinical Informatics and atCustomer Services.
• Consumer Lifestyle comparable sales grew by 20%year-on-year, driven by growth in almost all businesses,including double-digit growth at Television and Health& Wellness.
• Lighting sales grew by 13% on a comparable basis,driven by double-digit growth at Lamps andAutomotive, while Lumileds sales almost tripled.Professional Luminaires reported moderate salesgrowth, whereas Consumer Luminaires showed amodest decline.
Sales per market cluster• Comparable sales in the mature markets grew by 5%
compared to Q2 2009, driven by Consumer Lifestyle.• Led by the BRIC countries, the emerging markets
showed strong double-digit growth, predominantlydriven by Lighting and Consumer Lifestyle. Emergingmarkets accounted for 34% of Group sales, up from29% last year.

Quarterly report and Semi-annual report 3
EBITAin millions of euros
Q2 Q2
2009 2010
Healthcare 153 216
Consumer Lifestyle (7) 173
Lighting (21) 210
Group Management &Services (7) (72)Philips Group 118 527
EBITAas a % of sales
Q2 Q2
2009 2010
Healthcare 8.2 10.4
Consumer Lifestyle (0.4) 7.9
Lighting (1.4) 11.3
Group Management &Services (9.6) (88.9)Philips Group 2.3 8.5
Restructuring and acquisition-related chargesin millions of euros
Q2 Q2
2009 2010
Healthcare (24) (46)
Consumer Lifestyle (30) (10)
Lighting (82) (37)
Group Management &Services (12) − Philips Group (148) (93)
EBITin millions of euros unless otherwise stated
Q2 Q2
2009 2010
Healthcare 88 148
Consumer Lifestyle (12) 164
Lighting (61) 166
Group Management &Services (7) (74)
Philips Group 8 404 as a % of sales 0.2 6.5
Earnings• EBITA amounted to EUR 527 million, an increase of
EUR 409 million compared to Q2 2009, driven byimproved earnings across all operating sectors.Restructuring and acquisition-related charges of EUR93 million were recorded, EUR 55 million lower than inQ2 2009. Excluding these charges, EBITA amounted toEUR 620 million, or 10% of sales. Last year’srestructuring and acquisition-related charges andproduct recall provision of EUR 17 million were partlyoffset by legal settlements and insurance recoveriestotaling EUR 90 million.
• EBIT improved by EUR 396 million, reflecting higherEBITA in all operating sectors. Amortization chargeswere EUR 13 million higher than in Q2 2009.
• Healthcare EBITA increased by EUR 63 million year-on-year, despite a EUR 22 million increase in restructuringand acquisition-related charges. Improvements inearnings were seen across all businesses, notablyImaging Systems, Patient Care and Clinical Informaticsand Customer Services.
• Consumer Lifestyle EBITA increased by EUR 180million year-on-year, with improved earnings in mostbusinesses, notably Television. Restructuring andacquisition-related charges were EUR 20 million lowerthan in Q2 2009; the latter quarter included a EUR 17million product recall provision.
• Lighting EBITA increased by EUR 231 million year-on-year, driven by higher sales and an improved margin,largely attributable to Lamps, Lumileds andAutomotive. Restructuring and acquisition-relatedcharges were EUR 45 million lower than in Q2 2009.
• GM&S EBITA declined by EUR 65 million to a net costof EUR 72 million. Earnings in Q2 2009 were favorablyimpacted by EUR 57 million of insurance recoveries andEUR 33 million from legal settlements.

4 Quarterly report and Semi-annual report
Financial income and expensesin millions of euros
Q2 Q2
2009 2010
Net interest expenses (57) (64)
Sale of Pace shares 48 −
TPV option fair valueadjustment 14 (12)
Other (8) 5
(3) (71)
Results relating to investments in associatesin millions of euros
Q2 Q2
2009 2010
TPV value adjustment 25 −
Other − 11
25 11
Financial income and expenses• Q2 2010 was impacted by unfavorable fair-value
adjustments of the TPV bond option.• Q2 2009 included a EUR 48 million gain on the sale
of shares of Pace and favorable fair-value adjustments ofthe TPV bond option.
Investments in associates• Results in Q2 2010 were mainly attributable to earnings
from Philips’ holding in Intertrust.• In Q2 2009, the accumulated value adjustment of the
shareholding in TPV recognized in December 2008 waspartially reversed by EUR 25 million following recoveryof the TPV share price.

Quarterly report and Semi-annual report 5
Cash balancein millions of euros
Q2 Q2
2009 2010
Beginning cash balance 4,000 4,388
Free cash flow 251 348
Net cash flow fromoperating activities 446 562 Net capital expenditures (195) (214)
Acquisitions of businesses (55) (21)
Other cash flow frominvesting activities 65 (15)
Treasury sharestransactions 6 19
Changes in debt/other (44) 70
Dividend paid (634) (296)Ending cash balance 3,589 4,493
Cash flows from operating activitiesin millions of euros
600
400
200
0
446
Q2 2009
28
Q1 2010
562
Q2 2010
Gross capital expenditures1)
in millions of euros
200
150
100
50
0
140
Q2 2009
138
Q1 2010
167
Q2 20101) Capital expenditures on property, plant and equipment only
Cash balance• The Group cash balance increased to EUR 4.5 billion,
mainly driven by EUR 348 million free cash inflow, partlyoffset by a EUR 296 million cash dividend payment.
• In Q2 2009, the cash balance declined by EUR 411million. Free cash inflow of EUR 251 million was morethan offset by a EUR 634 million cash dividend payment.
Cash flows from operating activities• Operating activities led to a cash inflow of EUR
562 million, compared to an inflow of EUR 446 millionin Q2 2009. The year-on-year increase was driven byhigher earnings, partly offset by lower working capitalinflow.
Gross capital expenditure• Gross capital expenditures on property, plant
and equipment were EUR 27 million higher than in Q22009, due to higher investments, mainly at Lighting andHealthcare.

6 Quarterly report and Semi-annual report
Inventoriesas a % of moving annual total sales
20
15
10
5
0
13.7
Q2 2009
13.9
Q1 2010
15.9
Q2 2010
Net debt and group equityin billions of euros
■-group equity--■-net debt20
15
10
5
0
13.4
0.8
6 : 94
Q2 2009
14.7
0.1
1 : 99
Q1 2010
15.8
0.3
2 : 98
Q2 2010
ratio:
Number of employeesin FTEs
120,000
115,000
110,000
105,000
100,000
116,023
Q2 2009
116,186
Q1 2010
116,590
Q2 2010
Inventories• Inventories as a % of sales were 2.2 percentage
points higher than in Q2 2009, representing a EUR 0.6billion year-on-year value increase, more than half ofwhich was due to currency effects. Higher inventoriescompared to last year were seen across all sectors,notably at Consumer Lifestyle.
• Inventories as a % of sales increased by 2.0 percentagepoints compared to Q1 2010. Inventory value increasedacross the operating sectors to EUR 3.9 billion at theend of Q2 2010.
Net debt and group equity• At the end of Q2 2010, Philips had a net debt position
of EUR 306 million, compared to EUR 840 million at theend of Q2 2009. During the quarter, the net debtposition increased by EUR 233 million, mainly due tocurrency translation effects on debt.
• Group equity increased by EUR 1.1 billion in thequarter to EUR 15.8 billion. The increase was largelythe result of higher net income, a lower cash dividendfollowing 50% shareholder election for payout inshares, and currency translation effects.
Employees• During Q2 2010, the number of employees
increased by 404, primarily due to increases at Lightingand GM&S, partly offset by declines at ConsumerLifestyle and Healthcare.
• Compared to Q2 2009, the number of employeesincreased by 567, as reductions at Healthcare andGM&S were more than offset by increases at ConsumerLifestyle (mainly as a result of the Saeco acquisition) andLighting.

Quarterly report and Semi-annual report 7
HealthcareKey datain millions of euros unless otherwise stated
Q2 Q2
2009 2010
Sales 1,872 2,068
Sales growth
% nominal 4 10 % comparable (5) 4
EBITA 153 216 as a % of sales 8.2 10.4
EBIT 88 148 as a % of sales 4.7 7.2
Net operating capital (NOC) 8,738 9,545
Number of employees (FTEs) 35,094 34,344
Salesin millions of euros
3,000
2,250
1,500
750
0
1,872
Q2 2009
1,821
Q3 2009
2,405
Q4 2009
1,821
Q1 2010
2,068
Q2 2010
EBITA
■-EBITA in millions of euros----EBITA as a % of sales500
375
250
125
0
40%
30%
20%
10%
0
8.2153
Q2 2009
9.6175
Q3 2009
18.8452
Q4 2009
9.1166
Q1 2010
10.4216
Q2 2010
Business highlights• Philips and Electron announced a partnership for the
development and production of healthcare solutionsspecifically designed for the Russian healthcare market,initially focusing on imaging modalities.
• To further its capabilities in leading-edge imagingsolutions, Philips is collaborating with the University ofWashington (Seattle, USA) on research to extend theuse of molecular imaging for radiotherapy planning.
• Philips signed a five-year multi-million-euro contractwith the Ministry of Health in Zambia to upgrade andmaintain diagnostic imaging equipment for 71government hospitals.
• Philips and RXi Pharmaceuticals entered a researchagreement to explore innovative ways of usingultrasound to trigger the delivery of new drug therapiesthat may treat conditions such as cancer andcardiovascular disease.
Financial performance• Currency-comparable equipment order intake
increased by 10% year-on-year, with improvementsacross all businesses, notably at Patient Care andClinical Informatics. In North America, equipmentorders were 11% higher on a comparable basis.
• Comparable sales increased by 4% year-on-year, withhigher sales in all businesses. From a regionalperspective, comparable sales in North America werein line with Q2 2009, while in markets outside NorthAmerica they grew by 6%.
• EBITA increased by EUR 63 million year-on-year toEUR 216 million, or 10.4% of sales. Excludingrestructuring and acquisition-related charges of EUR 46million, EBITA amounted to EUR 262 million, or 12.7%of sales, compared to EUR 177 million, or 9.5% of sales,in Q2 2009. The improvement was driven by ImagingSystems, Customer Services and Patient Care andClinical Informatics as a result of higher margins fromimproved sales and ongoing cost management.
Looking ahead• Philips will introduce its Healthcare Consulting
Solutions to help healthcare providers improveproductivity, reduce costs, grow revenue and deliverbetter patient care.
• Philips expects to introduce innovations in cardiacultrasound in the second half of 2010, designed toprovide clinicians with the versatility of 2D or 3Dimaging, or a combination of both.
• Restructuring and acquisition-related charges in Q32010 are expected to total around EUR 15 million.

8 Quarterly report and Semi-annual report
Consumer LifestyleKey datain millions of euros unless otherwise stated
Q2 Q2
2009 2010
Sales 1,735 2,183 of which Television 587 846
Sales growth
% nominal (36) 26 % comparable (30) 20
Sales growth excl. Television
% nominal (20) 16 % comparable (19) 6
EBITA (7) 173
of which Television (99) (8)as a % of sales (0.4) 7.9
EBIT (12) 164
of which Television (99) (9)as a % of sales (0.7) 7.5
Net operating capital (NOC) 903 1,055 of which Television (338) (266)
Number of employees (FTEs) 17,018 18,408 of which Television 4,955 4,519
Salesin millions of euros
3,750
3,000
2,250
1,500
750
0
1,735
Q2 2009
2,073
Q3 2009
2,903
Q4 2009
1,942
Q1 2010
2,183
Q2 2010
EBITA
■-EBITA in millions of euros----EBITA as a % of sales300
200
100
0
(100)
30%
20%
10%
0
(10)%
(0.4)(7)
Q2 2009
6.2129
Q3 2009
9.2266
Q4 2009
8.5166
Q1 2010
7.9173
Q2 2010
Business highlights• Philips AVENT extended the target age range for its
products with the launch of its toddler feeding range,designed for use by children aged up to 24 months.
• Philips introduced its range of Full HD 3D Ready LEDTVs, delivering a truly immersive 3D Ambilight cinemaexperience in the home.
• Philips’ latest TV campaign won the Grand Prix for FilmCraft at the Cannes Lions International AdvertisingFestival, making Philips the first brand to win the jury’shighest accolade for two consecutive years.
Financial performance• On a comparable basis, sales grew 20%, led by 35%
growth in emerging markets, particularly driven byTelevision in Latin America. Mature markets showedlow-double-digit growth.
• Most businesses saw single-digit comparable salesgrowth, while Television grew by 48%, despite somecomponent supply constraints, in particular for high-end TVs.
• EBITA improved significantly, driven by double-digitsales growth, structural cost improvements, higherlicense income and lower restructuring charges.Excluding restructuring and acquisition-related chargesand last year’s product recall-related charges, EBITAimproved from 2.3% to 8.4%.
• Net operating capital and headcount increased, mainlydue to the Saeco acquisition.
Looking ahead• Further building its global leadership position in the
male electric shaving market, Philips will, in Q3 2010,launch its most advanced premium electric shaver todate, the SensoTouch 3D, which allows men to choosebetween a dry and a wet shave.
• At IFA 2010, Europe’s largest consumer lifestyle tradeshow, Philips will launch a range of products that deliversimplicity to consumers, including coffee appliances,televisions, blu-ray players and domestic appliances.
• Consumer Lifestyle expects to incur restructuring andacquisition-related charges of around EUR 30 million inQ3 2010.
• Following an increase in license revenues in Q2, incomefrom licenses in Q3 is expected to be lower.

Quarterly report and Semi-annual report 9
LightingKey datain millions of euros unless otherwise stated
Q2 Q2
2009 2010
Sales 1,550 1,859
Sales growth
% nominal (14) 20 % comparable (18) 13
EBITA (21) 210 as a % of sales (1.4) 11.3
EBIT (61) 166 as a % of sales (3.9) 8.9
Net operating capital (NOC) 5,676 5,934
Number of employees (FTEs) 51,627 52,031
Salesin millions of euros
2,250
1,500
750
0
1,550
Q2 2009
1,646
Q3 2009
1,846
Q4 2009
1,810
Q1 2010
1,859
Q2 2010
EBITA
■-EBITA in millions of euros----EBITA as a % of sales300
200
100
0
(100)
30%
20%
10%
0
(10)%(1.4)(21)
Q2 2009
4.879
Q3 2009
4.482
Q4 2009
13.5245
Q1 2010
11.3210
Q2 2010
Business highlights• Philips and Cree signed a comprehensive worldwide
patent cross-licensing agreement designed toaccelerate growth of the LED lighting market.
• Further strengthening its outdoor lighting portfolio,Philips announced the acquisition of the street lightingcontrols activities of Amplex A/S, a Danish provider ofenergy-efficient infrastructure solutions.
• At the 2010 Light & Building fair in Frankfurt, Philipspresented a breakthrough 12-watt LED lamp to replace60-watt incandescent bulbs.
• Philips expanded its existing relationship with LEDlighting components provider Future Lighting Solutions.
• Philips will partner with Somfy, a specialist in automatedsun protection systems for buildings, to developintelligent solutions for more comfortable and energy-efficient working environments.
• Six of South Africa’s top sports stadiums were equippedwith Philips’ new ArenaVision sports lighting systems.
Financial performance• Comparable sales were 13% higher year-on-year,
driven by growth across most businesses, mainlyLamps, Automotive and Lumileds, which tripled salescompared to Q2 2009. From a geographic perspective,significant growth was seen in emerging markets, led byChina.
• In Q2 2010, EBITA excluding restructuring andacquisition-related charges of EUR 37 million (Q2 2009:EUR 82 million) amounted to EUR 247 million, or 13.3%of sales. The substantial year-on-year EBITAimprovement was largely driven by strong sales growth,a favorable product mix notably reflecting the transitionto energy-saving lamps and LED, and ongoing costmanagement.
• Net operating capital increased by EUR 258 million toEUR 5,934 million. Excluding currency impact, netoperating capital decreased compared to Q2 2009.
Looking ahead• Restructuring and acquisition-related charges in Q3
2010 are expected to total around EUR 40 million.

10 Quarterly report and Semi-annual report
Group Management & ServicesKey datain millions of euros unless otherwise stated
Q2 Q2
2009 2010
Sales 73 81
Sales growth
% nominal (47) 11 % comparable (46) 11
EBITA Corporate Technologies (44) (22)
EBITA Corporate & Regional Costs (30) (35)
EBITA Pensions 23 (9)
EBITA Service Units and Other 44 (6)
EBITA (7) (72)
EBIT (7) (74)
Net operating capital (NOC) (3,513) (2,451)
Number of employees (FTEs) 12,284 11,807
Salesin millions of euros
150
100
50
0
73
Q2 2009
81
Q3 2009
109
Q4 2009
104
Q1 2010
81
Q2 2010
EBITAin millions of euros
0
(50)
(100)
(150)
(200)
(7)
Q2 2009
(39)
Q3 2009
(138)
Q4 2009
(73)
Q1 2010
(72)
Q2 2010
Business highlights• Forbes magazine named Philips as one of the world’s
most reputable companies, following the release of theGlobal Reputation Pulse 2010 by the ReputationInstitute.
• The Philips Livable Cities Award program was launchedin May, with a total prize fund of EUR 125,000, tosupport simple solutions that improve people’s healthand well-being in cities.
• Amsterdam Airport Schiphol opened an innovativeboarding gate, co-created with Philips Design andPhilips Applied Technologies, using lighting andinfotainment to enhance the traveler experience.
Financial performance• Sales increased from EUR 73 million in Q2 2009 to
EUR 81 million in Q2 2010, driven by improved licenserevenues.
• EBITA amounted to a net cost of EUR 72 million, a costincrease of EUR 65 million year-on-year, as last year’sresults were favorably impacted by EUR 57 millioninsurance recoveries and a EUR 33 million legalsettlement.
• Excluding the aforementioned items, EBITA improvedEUR 25 million year-on-year, driven by higher earningsfrom licenses and lower R&D expenses.
Looking ahead• Philips Design will receive eight iF communication
design awards in September, in recognition ofexceptional design in the areas of digital media andpackaging.
• Net costs for the Group Management & Services sectorin Q3 2010 are expected to total EUR 80 million.

Quarterly report and Semi-annual report 11
OutlookAfter the strong rebound in the first half of the year, weexpect comparable sales growth in the remainder of theyear to moderate towards mid-single-digit level. Thisreflects continued but slow recovery in the US andEurope, different seasonality for our Television businessfollowing soccer's World Cup, and the improved salesperformance in the second half of 2009.
We will continue to drive further improvements,including, where necessary, taking the required actions tooffset the effects of rising commodity and componentprices. Having achieved an EBITA before restructuringand acquisition-related charges of 9.9% in the first half-year, and assuming that the current economic climate willcontinue, we are confident that we can exceed 10% forthe full-year 2010.
At our Capital Markets Day in London on September 14we will update the markets on the medium-termprospects for our businesses in the context of our Vision2015 plan.
Amsterdam, July 19, 2010 Board of Management

12 Quarterly report and Semi-annual report
Semi-annual financial reportIntroduction
This report contains the semi-annual financial report ofKoninklijke Philips Electronics N.V. (‘the Company’), acompany with limited liability, headquartered inAmsterdam, the Netherlands. The principal activities ofthe Company and its group companies (the Philips Group)are described in note 4.
The semi-annual financial report for the six months endedJuly 4, 2010 consists of the condensed consolidated semi-annual financial statements, the semi-annual managementreport and responsibility statement by the Company’sBoard of Management. The information in this semi-annual financial report is unaudited.
The condensed consolidated semi-annual financialstatements do not include all the information anddisclosures required in the annual financial statements,and should be read in conjunction with the Company’sconsolidated IFRS financial statements for the year endedDecember 31, 2009.
The Board of Management of the Company herebydeclares that to the best of their knowledge, the semi-annual financial statements, which have been prepared in
accordance with the applicable financial reportingstandards for interim financial reporting, give a true andfair view of the assets, liabilities, financial position andprofit or loss of the Company and the undertakingsincluded in the consolidation taken as a whole, and thesemi-annual management report gives a fair review of theinformation required pursuant to section 5:25d(8)/(9) ofthe Dutch Financial Markets Supervision Act (Wet op hetFinancieel toezicht).
Amsterdam, July 19, 2010
Board of Management
Gerard Kleisterlee Pierre-Jean Sivignon
Gottfried Dutiné Andrea Ragnetti
Rudy Provoost Steve Rusckowski

Quarterly report and Semi-annual report 13
Management reportThe 1st six months of 2010
• The results for the first half of 2010 comparedfavorably to the recession-impacted results in thefirst half of 2009. Group sales were some EUR 1.6billion above 2009, with strong contributionsfrom all operating sectors.
• On a comparable basis, sales grew 12%, driven by25% growth in the emerging markets, particularlyChina and Latin America, while high-single-digitgrowth was visible in mature markets.
• EBITA improved EUR 1 billion year-on-year,driven by top-line growth, fixed costs savings fromrestructuring programs and continued sound costmanagement. Philips has continued to focus oncost optimization and organizationaleffectiveness, spending EUR 111 million onrestructuring, EUR 49 million below last year'slevel.
Net incomein millions of euros unless otherwise stated
January-June 2009 2010
Sales 10,305 11,868
EBITA 44 1,031 as a % of sales 0.4 8.7
EBIT (178) 793 as a % of sales (1.7) 6.7
Financial expenses (44) (140)
Income taxes 186 (208)
Results investments inassociates 24 18
Net income (loss) (12) 463
Net income (loss) -shareholders per commonshare (in euros) - basic (0.02) 0.49
Performance of the Group• Group sales were some EUR 1.6 billion above the level
of the first half of 2009, driven by higher sales across alloperating sectors, notably Consumer Lifestyle andLighting. Adjusted for currency impacts and portfoliochanges, sales were 12% above last year’s level.
• Group EBITA improved by EUR 987 million comparedto the first half of 2009, largely driven by higher sales inthe three operating sectors, notably ConsumerLifestyle and Lighting.
• Net income was EUR 475 million higher than in the firsthalf of 2009, mainly driven by higher sector earnings,partly offset by lower net gains on the sale of stakes andhigher income tax expenses.
• Cash flow from operating activities was EUR 450 millionhigher than in the first half of 2009, driven by higherearnings, partly offset by higher provision payments andhigher working capital outflow from inventories andaccounts receivable.
Philips sectors
Healthcare• Equipment order intake at Healthcare increased 14%
compared to the first half of 2009, with improvementsseen across all businesses, notably at Imaging Systems.In North America, orders increased by 9%, whilemarkets outside of North America showed orderintake growth of 14%.
• Nominal sales at Healthcare grew by 8%. Excludingcurrency effects and portfolio changes, comparablesales increased by 5% year-on-year, with improved salesacross all businesses, notably at Customer Services andat Patient Care and Clinical Informatics. Sales outside ofNorth America, particularly in emerging markets,continued to show double-digit growth.
• EBITA amounted to EUR 382 million, or 9.8% of sales,EUR 161 million higher than in the first half of 2009.Improvements were mainly driven by higher volumeand fixed cost savings as a result of ongoing costmanagement programs. EBITA included restructuringand acquisition-related charges of EUR 75 million in thefirst half of 2010, compared to EUR 39 million in thefirst half of 2009.

14 Quarterly report and Semi-annual report
Sales by sectorin millions of euros unless otherwise stated
January-June % change 2009 2010 nominal comparable
Healthcare 3,613 3,889 8 5
ConsumerLifestyle 3,491 4,125 18 15
Lighting 3,054 3,669 20 15
GM&S 147 185 26 30 Philips Group 10,305 11,868 15 12
EBITAin millions of euros
January-June 2009 2010
Healthcare 221 382
Consumer Lifestyle (56) 339
Lighting (16) 455
Group Management &Services (105) (145)Philips Group 44 1,031
EBITAas a % of sales
January-June 2009 2010
Healthcare 6.1 9.8
Consumer Lifestyle (1.6) 8.2
Lighting (0.5) 12.4
Group Management &Services (71.4) (78.4)Philips Group 0.4 8.7
Consumer Lifestyle• Sales amounted to EUR 4,125 million, a nominal
increase of 18% compared to the first half of 2009,driven by Saeco and higher sales in most businesses.Excluding currency effects and portfolio changes,comparable sales grew 15%, led by 29% growth atTelevision, double-digit growth at Health & Wellness,higher license income, and single-digit growth in mostother businesses.
• EBITA improved significantly compared to the first halfof 2009, driven by double-digit sales growth, structuralcost improvements, higher license income, EUR 20million lower restructuring and acquisition-relatedcharges, and last year’s EUR 47 million of product recallcharges.
Lighting• Sales in the first half of 2010 amounted to EUR 3,669
million, an increase of 15% on a comparable basiscompared to last year. Sales were higher across allregions, notably in emerging markets, with 33% year-on-year comparable sales growth.
• EBITA increased by EUR 471 million compared to thefirst half of 2009, mainly driven by higher sales and grossmargin improvements in most businesses. Resultsincluded restructuring and acquisition-related chargesof EUR 46 million, compared to EUR 101 million in thefirst half of 2009.
Group Management & Services• EBITA declined EUR 40 million compared to the first
half of 2009, as last year’s results were favorablyimpacted by EUR 57 million insurance recoveries and aEUR 33 million legal settlement. Excluding those items,EBITA increased by EUR 50 million year-on-year,driven by higher revenue from licenses and lower R&Dcosts.

Quarterly report and Semi-annual report 15
Risks and uncertaintiesIn our Annual Report 2009 we have extensively describedcertain risk categories and risk factors which could have amaterial adverse effect on our financial position andresults. Those risk categories and risk factors are deemedincorporated and repeated in this report by reference.
For the remainder of 2010, we see the risk of growthstagnation due to government deficits in our markets, inparticular in our activities that cater to the consumermarkets and the healthcare market.
Additional risks not known to us, or currently believednot to be material, could later turn out to have a materialimpact on our businesses, objectives, revenues, income,assets, liquidity or capital resources.

16 Quarterly report and Semi-annual report
Consolidated statements of incomeall amounts in millions of euros unless otherwise stated
2nd quarter January-June 2009 2010 2009 2010
Sales 5,230 6,191 10,305 11,868
Cost of sales (3,455) (3,910) (6,900) (7,409)
Gross margin 1,775 2,281 3,405 4,459
Selling expenses (1,209) (1,265) (2,414) (2,488)
General and administrative expenses (211) (231) (424) (425)
Research and development expenses (384) (398) (790) (773)
Other business income 56 17 64 27
Other business expenses (19) − (19) (7)
Income (loss) from operations 8 404 (178) 793
Financial income 76 17 173 28
Financial expenses (79) (88) (217) (168)
Income (loss) before taxes 5 333 (222) 653
Income taxes 15 (82) 186 (208)
Income (loss) after taxes 20 251 (36) 445
Results relating to investments in associates 25 11 24 18
Net income (loss) for the period 45 262 (12) 463
Attribution of net income for the period
Net income (loss) attributable to shareholders 44 259 (15) 459
Net income attributable to non-controlling interests 1 3 3 4
Weighted average number of common shares outstanding (after deduction of treasury shares) during the period (in thousands):
- basic 925,244 939,690 924,271 933,714
- diluted 927,918 948,708 926,413 941,817
Net income (loss) attributable to shareholders
per common share in euros:
- basic 0.05 0.28 (0.02) 0.49
- diluted1) 0.05 0.27 (0.02) 0.49
Ratios
Gross margin as a % of sales 33.9 36.8 33.0 37.6
Selling expenses as a % of sales (23.1) (20.4) (23.4) (21.0)
G&A expenses as a % of sales (4.0) (3.7) (4.1) (3.6)
R&D expenses as a % of sales (7.3) (6.4) (7.7) (6.5)
EBIT 8 404 (178) 793 as a % of sales 0.2 6.5 (1.7) 6.7
EBITA 118 527 44 1,031 as a % of sales 2.3 8.5 0.4 8.7
1) the incremental shares from assumed conversion are not taken into account in the periods for which there is a loss attributable to shareholders, as the effect would be antidilutive.
Quarterly report and Semi-annual report 17
Consolidated statements of comprehensive incomeall amounts in millions of euros
2nd quarter January-June 2009 2010 2009 2010
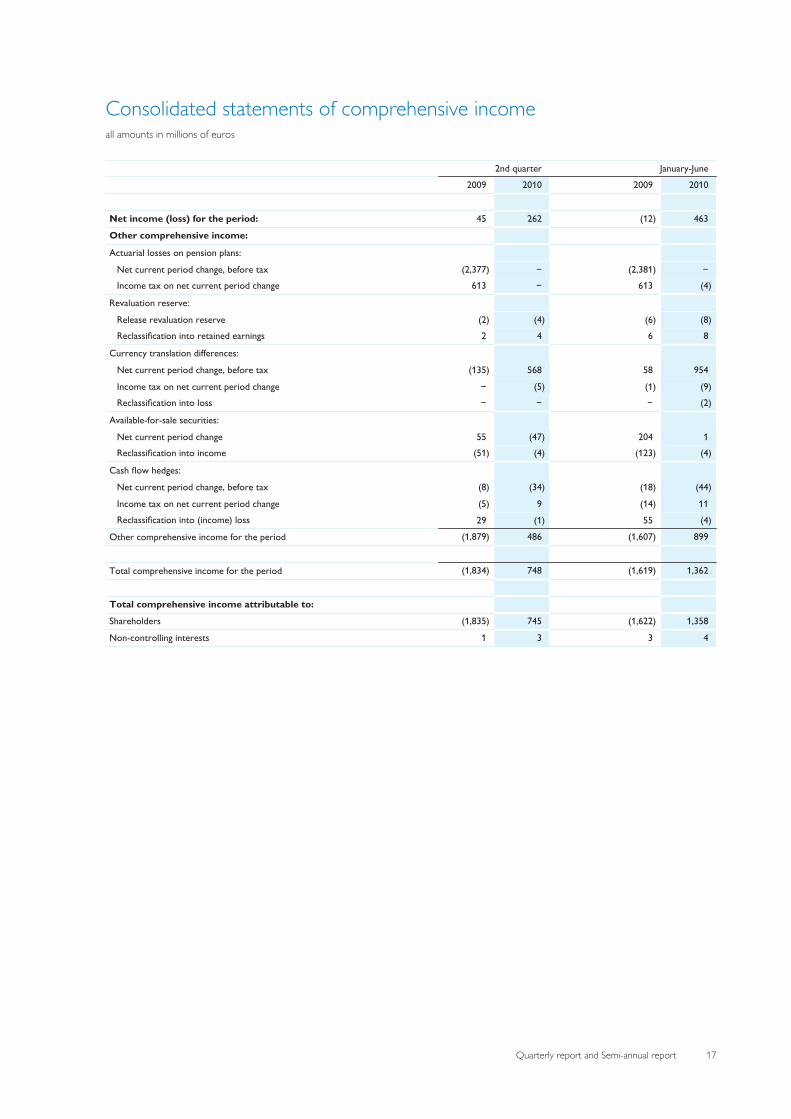
Net income (loss) for the period: 45 262 (12) 463
Other comprehensive income:
Actuarial losses on pension plans:
Net current period change, before tax (2,377) − (2,381) − Income tax on net current period change 613 − 613 (4)
Revaluation reserve:
Release revaluation reserve (2) (4) (6) (8)Reclassification into retained earnings 2 4 6 8
Currency translation differences:
Net current period change, before tax (135) 568 58 954
Income tax on net current period change − (5) (1) (9)Reclassification into loss − − − (2)
Available-for-sale securities:
Net current period change 55 (47) 204 1 Reclassification into income (51) (4) (123) (4)
Cash flow hedges:
Net current period change, before tax (8) (34) (18) (44)
Income tax on net current period change (5) 9 (14) 11 Reclassification into (income) loss 29 (1) 55 (4)
Other comprehensive income for the period (1,879) 486 (1,607) 899
Total comprehensive income for the period (1,834) 748 (1,619) 1,362
Total comprehensive income attributable to:
Shareholders (1,835) 745 (1,622) 1,358
Non-controlling interests 1 3 3 4

18 Quarterly report and Semi-annual report
Consolidated balance sheetsin millions of euros unless otherwise stated
June 28, December 31, July 4,
2009 2009 2010
Non-current assets:
Property, plant and equipment 3,423 3,252 3,430
Goodwill 7,449 7,362 8,589
Intangible assets excluding goodwill 4,358 4,161 4,612
Non-current receivables 80 85 104
Investments in associates 245 281 191
Other non-current financial assets 822 691 764
Deferred tax assets 1,365 1,243 1,390 Other non-current assets 59 1,543 1,714
Total non-current assets 17,801 18,618 20,794
Current assets:
Inventories 3,330 2,913 3,928
Other current financial assets 125 191 195
Other current assets 518 436 636
Receivables 3,796 3,983 4,268 Cash and cash equivalents 3,589 4,386 4,493
Total current assets 11,358 11,909 13,520
Total assets 29,159 30,527 34,314
Shareholders’ equity 13,325 14,595 15,736 Non-controlling interests 47 49 61
Group equity 13,372 14,644 15,797
Non-current liabilities:
Long-term debt 3,745 3,640 3,053
Long-term provisions 1,853 1,734 1,803
Deferred tax liabilities 149 530 519 Other non-current liabilities 1,943 1,929 2,307
Total non-current liabilities 7,690 7,833 7,682
Current liabilities:
Short-term debt 684 627 1,746
Accounts and notes payable 2,560 2,870 3,462
Accrued liabilities 3,217 3,134 4,132
Short-term provisions 1,057 716 732 Other current liabilities 579 703 763
Total current liabilities 8,097 8,050 10,835
Total liabilities and group equity 29,159 30,527 34,314
Number of common shares outstanding (after deduction of treasury shares) at the endof period (in thousands) 926,041 927,457 945,312
Ratios
Shareholders’ equity per common share in euros 14.39 15.74 16.65
Inventories as a % of sales 13.7 12.6 15.9
Net debt : group equity 6:94 (1):101 2:98
Net operating capital 11,804 12,649 14,083 Employees at end of period 116,023 115,924 116,590

Quarterly report and Semi-annual report 19
Consolidated statements of cash flowsall amounts in millions of euros
2nd quarter January to June 2009 2010 2009 2010
Cash flows from operating activities:
Net income (loss) 45 262 (12) 463
Adjustments to reconcile net income to net cash provided by (used for) operating activities:
Depreciation and amortization 346 349 678 687
Impairment of other non-current financial assets and (reversal of) impairment of investments in associates (25) 4 24 4
Net gain on sale of assets (51) (12) (124) (18)
Income from investments in associates − (14) (1) (16)
Dividends received from investments in associates 5 5 34 13
Decrease (increase) in working capital: 229 132 (96) (220)
Decrease (increase) in receivables and other current assets 98 (127) 621 (35)
Decrease (increase) in inventories 130 (354) 232 (593)
Increase (decrease) in accounts payable, accrued and other liabilities 1 613 (949) 408
Increase in non-current receivables/other assets/other liabilities (123) (57) (402) (144)
Increase (decrease) in provisions 32 (29) 25 (71)Other items (12) (78) 14 (108)
Net cash (used for) provided by operating activities 446 562 140 590
Cash flows from investing activities:
Purchase of intangible assets (22) (18) (45) (26)
Expenditures on development assets (52) (55) (86) (109)
Capital expenditures on property, plant and equipment (140) (167) (252) (305)
Proceeds from disposals of property, plant and equipment 19 26 27 47
Cash from (to) derivatives and securities (12) (20) (10) (42)
Purchase of other non-current financial assets − (6) (6) (12)
Proceeds from other non-current financial assets 77 11 706 14
Purchase of businesses, net of cash acquired (55) (21) (90) (24)Proceeds from sale of interests in businesses − − − 98
Net cash provided by (used for) investing activities (185) (250) 244 (359)
Cash flows from financing activities:
Decrease (increase) in short-term debt (59) 11 (98) 23
Principal payments on long-term debt (13) (23) (24) (37)
Proceeds from issuance of long-term debt 26 19 289 29
Treasury shares transactions 6 19 15 43 Dividend paid (634) (296) (634) (296)
Net cash provided by financing activities (674) (270) (452) (238)
Net increase (decrease) in cash and cash equivalents (413) 42 (68) (7)
Effect of change in exchange rates on cash positions 2 63 37 114
Cash and cash equivalents at beginning of period 4,000 4,388 3,620 4,386
Cash and cash equivalents at end of period 3,589 4,493 3,589 4,493
Ratio
Cash flows before financing activities 261 312 384 231
Net cash paid during the period for
Pensions (98) (105) (204) (220)
Interest (62) (62) (136) (138)Income taxes (34) (47) (108) (108)
For a number of reasons, principally the effects of translation differences, certain items in the statements of cash flows do not correspond to the differences between the balance sheet amounts for the
respective items.

20 Quarterly report and Semi-annual report
Consolidated statements of changes in equityin millions of euros
January to June 2010
other reserves
com-mon
shares
capitalin ex-
cess ofpar val-
ue
re-tainedearn-
ings
revalu-ation
re-serve
curren-cy
transla-tion dif-
feren-ces
unreal-ized gain(loss) onavailable-
for-salefinancial
assets
changesin fair
value ofcashflow
hedges total
treas-ury
sharesat cost
totalshare-hold-
ers’equity
non-con-
trollinginter-
ests total
equity
January-June 2010
Balance as of December 31, 2009 194 − 15,947 102 (591) 120 10 (461) (1,187) 14,595 49 14,644
Total comprehensive income 463 (8) 943 (3) (37) 903 1,358 4 1,362
Dividend distributed 3 343 (650) (304) (304)
Non-controlling interest movement 8 8
Re-issuance of treasury shares (46) 8 86 48 48
Share-based compensation plans 29 29 29
Income tax share-based compensationplans 10 10 10
3 336 (642) 86 (217) 8 (209)
Balance as of July 4, 2010 197 336 15,768 94 352 117 (27) 442 (1,101) 15,736 61 15,797
January-June 2009
Balance as of December 31, 2008 194 − 17,101 117 (527) (25) (28) (580) (1,288) 15,544 49 15,593
Total comprehensive income (1,777) (6) 57 81 23 161 (1,622) 3 (1,619)
Dividend distributed (647) (647) (647)
Non-controlling interest movement (5) (5)
Re-issuance of treasury shares (35) (21) 71 15 15
Share-based compensation plans 35 35 35 − (668) 71 (597) (5) (602)
Balance as of June 28, 2009 194 − 14,656 111 (470) 56 (5) (419) (1,217) 13,325 47 13,372

Quarterly report and Semi-annual report 21
Sectorsall amounts in millions of euros unless otherwise stated
Sales and income (loss) from operations2nd quarter
2009 2010
Salesincluding
inter-company sales income from operations
Salesincluding
inter-company sales income from operations
amount as a % of
sales amount as a % of
sales
Healthcare 1,873 1,872 88 4.7 2,072 2,068 148 7.2
Consumer Lifestyle* 1,739 1,735 (12) (0.7) 2,188 2,183 164 7.5
Lighting 1,552 1,550 (61) (3.9) 1,864 1,859 166 8.9
Group Management & Services 121 73 (7) (9.6) 123 81 (74) (91.4)
Inter-sector eliminations (55) (56) 5,230 5,230 8 0.2 6,191 6,191 404 6.5
* of which Television 588 587 (99) (16.9) 848 846 (9) (1.1)
Sales and income (loss) from operationsJanuary to June
2009 2010
Salesincluding
inter-company sales income from operations
Salesincluding
inter-company sales income from operations
amount as a % of
sales amount as a % of
sales
Healthcare 3,616 3,613 89 2.5 3,896 3,889 251 6.5
Consumer Lifestyle* 3,500 3,491 (65) (1.9) 4,134 4,125 321 7.8
Lighting 3,058 3,054 (97) (3.2) 3,676 3,669 370 10.1
Group Management & Services 238 147 (105) (71.4) 265 185 (149) (80.5)
Inter-sector eliminations (107) (103) 10,305 10,305 (178) (1.7) 11,868 11,868 793 6.7
* of which Television 1,270 1,270 (182) (14.3) 1,550 1,546 (29) (1.9)

22 Quarterly report and Semi-annual report
Sectors and main countriesin millions of euros
Sales and total assetssales total assets
January to June June 28, July 4,
2009 2010 2009 2010
Healthcare 3,613 3,889 11,297 12,550
Consumer Lifestyle 3,491 4,125 3,137 3,904
Lighting 3,054 3,669 7,100 7,766
Group Management & Services 147 185 7,625 10,094 10,305 11,868 29,159 34,314
Sales and long-lived assetssales long-lived assets1)
January to June June 28, July 4,
20092) 2010 20092) 2010
Netherlands 400 399 1,264 1,206
United States 3,003 3,061 10,154 11,007
China 787 952 362 452
Germany 834 928 289 286
France 650 693 132 117
Brazil 354 555 114 140
Japan 304 423 448 605
Other countries 3,973 4,857 2,467 2,818 10,305 11,868 15,230 16,631
1) Includes property, plant and equipment, intangible assets excluding goodwill, and goodwill2) Revised to reflect an adjusted country allocation

Quarterly report and Semi-annual report 23
Pension costsin millions of euros
Specification of pension costs2nd quarter
2009 2010
Netherlands other total Netherlands other total
Costs of defined-benefit plans (pensions)
Service cost 27 22 49 23 21 44
Interest cost on the defined-benefit obligation 133 100 233 131 110 241
Expected return on plan assets (189) (86) (275) (186) (93) (279)
Prior service cost − 1 1 − (1) (1)
Net periodic cost (income) (29) 37 8 (32) 37 5
Costs of defined-contribution plans
Costs 1 29 30 2 29 31
Total 1 29 30 2 29 31
Costs of defined-benefit plans (retireemedical)
Service cost − 1 1 − − −
Interest cost on the defined-benefit obligation − 9 9 − 6 6
Prior service cost − − − − (1) (1)Net periodic cost − 10 10 − 5 5
Specification of pension costsJanuary to June
2009 2010
Netherlands other total Netherlands other total
Costs of defined-benefit plans (pensions)
Service cost 54 44 98 46 39 85
Interest cost on the defined-benefit obligation 266 201 467 261 211 472
Expected return on plan assets (379) (173) (552) (372) (176) (548)
Prior service cost − 2 2 − (1) (1)
Net periodic cost (income) (59) 74 15 (65) 73 8
Costs of defined-contribution plans
Costs 3 53 56 4 58 62
Total 3 53 56 4 58 62
Costs of defined-benefit plans (retireemedical)
Service cost − 1 1 − 1 1
Interest cost on the defined-benefit obligation − 18 18 − 11 11
Prior service cost − − − − (2) (2)Net periodic cost − 19 19 − 10 10

24 Quarterly report and Semi-annual report
Reconciliation of non-GAAP performance measuresall amounts in millions of euros unless otherwise stated.
Certain non-GAAP financial measures are presented when discussing the Philips Group’s performance. In the following tables, areconciliation to the most directly comparable IFRS performance measure is made.
Sales growth composition (in %)2nd quarter January to June
comparablegrowth
currencyeffects
consolid-ation
changes nominalgrowth
comparablegrowth
currencyeffects
consolid-ation
changes nominalgrowth
2010 versus 2009
Healthcare 4.1 6.5 (0.1) 10.5 5.3 2.4 (0.1) 7.6
Consumer Lifestyle 19.6 6.5 (0.3) 25.8 15.2 3.7 (0.7) 18.2
Lighting 12.9 6.9 0.1 19.9 15.4 3.6 1.1 20.1
GM&S 11.2 5.9 (6.1) 11.0 29.8 3.2 (7.1) 25.9 Philips Group 11.9 6.6 (0.1) 18.4 12.0 3.2 0.0 15.2
EBITA (or Adjusted income from operations) to Income from operations (or EBIT)
Philips Group Healthcare Consumer
Lifestyle Lighting GM&S
January to June 2010
EBITA (or Adjusted income from operations) 1,031 382 339 455 (145)
Amortization of intangibles1) (238) (131) (18) (85) (4)
Income from operations (or EBIT) 793 251 321 370 (149)
January to June 2009
EBITA (or Adjusted income from operations) 44 221 (56) (16) (105)
Amortization of intangibles1) (222) (132) (9) (81) − Income from operations (or EBIT) (178) 89 (65) (97) (105)
1) Excluding amortization of software and product development
Composition of net debt to group equityJune 28, December 31, July 4,
2009 2009 2010
Long-term debt 3,745 3,640 3,053
Short-term debt 684 627 1,746
Total debt 4,429 4,267 4,799
Cash and cash equivalents 3,589 4,386 4,493
Net debt (cash) (total debt less cash and cash equivalents) 840 (119) 306
Shareholders’ equity 13,325 14,595 15,736
Non-controlling interests 47 49 61
Group equity 13,372 14,644 15,797
Net debt and group equity 14,212 14,525 16,103
Net debt divided by net debt and group equity (in %) 6 (1) 2
Group equity divided by net debt and group equity (in %) 94 101 98

Quarterly report and Semi-annual report 25
Reconciliation of non-GAAP performance measures (continued)all amounts in millions of euros
Net operating capital to total assets
Philips Group Healthcare Consumer
Lifestyle Lighting GM&S
July 4, 2010
Net operating capital (NOC) 14,083 9,545 1,055 5,934 (2,451)
Exclude liabilities comprised in NOC:
- payables/liabilities 10,664 2,521 2,358 1,443 4,342
- intercompany accounts − 49 94 76 (219)- provisions 2,535 355 396 290 1,494
Include assets not comprised in NOC:
- investments in associates 191 80 1 23 87
- other current financial assets 194 − − − 194
- other non-current financial assets 764 − − − 764
- deferred tax assets 1,390 − − − 1,390 - cash and cash equivalents 4,493 − − − 4,493
Total assets 34,314 12,550 3,904 7,766 10,094
December 31, 2009
Net operating capital (NOC) 12,649 8,434 625 5,104 (1,514)
Exclude liabilities comprised in NOC:
- payables/liabilities 8,636 2,115 2,155 1,247 3,119
- intercompany accounts − 32 85 62 (179)- provisions 2,450 317 420 324 1,389
Include assets not comprised in NOC:
- investments in associates 281 71 1 11 198
- other current financial assets 191 − − − 191
- other non-current financial assets 691 − − − 691
- deferred tax assets 1,243 − − − 1,243 - cash and cash equivalents 4,386 − − − 4,386
Total assets 30,527 10,969 3,286 6,748 9,524
June 28, 2009
Net operating capital (NOC) 11,804 8,738 903 5,676 (3,513)
Exclude liabilities comprised in NOC:
- payables/liabilities 8,299 2,133 1,872 1,116 3,178
- intercompany accounts − 48 59 44 (151)- provisions 2,910 305 301 251 2,053
Include assets not comprised in NOC:
- investments in associates 245 73 2 13 157
- other current financial assets 125 − − − 125
- other non-current financial assets 822 − − − 822
- deferred tax assets 1,365 − − − 1,365 - cash and cash equivalents 3,589 − − − 3,589 Total assets 29,159 11,297 3,137 7,100 7,625

26 Quarterly report and Semi-annual report
Reconciliation of non-GAAP performance measures (continued)all amounts in millions of euros
Composition of cash flows2nd quarter January to June
2009 2010 2009 2010
Cash flows provided by operating activities 446 562 140 590
Cash flows (used for) provided by investing activities (185) (250) 244 (359)
Cash flows before financing activities 261 312 384 231
Cash flows provided by operating activities 446 562 140 590
Purchase of intangible assets (22) (18) (45) (26)
Expenditures on development assets (52) (55) (86) (109)
Capital expenditures on property, plant and equipment (140) (167) (252) (305)
Proceeds from disposals of property, plant and equipment 19 26 27 47
Net capital expenditures (195) (214) (356) (393)
Free cash flows 251 348 (216) 197

Quarterly report and Semi-annual report 27
Philips quarterly statisticsall amounts in millions of euros unless otherwise stated
2009 2010 1st
quarter 2nd
quarter 3rd
quarter 4th
quarter 1st
quarter 2nd
quarter 3rd
quarter 4th
quarter
Sales 5,075 5,230 5,621 7,263 5,677 6,191 % increase (15) (19) (11) (5) 12 18
EBITA (74) 118 344 662 504 527 as a % of sales (1.5) 2.3 6.1 9.1 8.9 8.5
EBIT (186) 8 237 555 389 404 as a % of sales (3.7) 0.2 4.2 7.6 6.9 6.5
Net income (loss) - shareholders (59) 44 174 251 200 259 per common share in euros - basic (0.06) 0.05 0.19 0.27 0.22 0.28
January- March
January- June
January- September
January- December
January- March
January- June
January- September
January- December
Sales 5,075 10,305 15,926 23,189 5,677 11,868 % income (15) (17) (15) (12) 12 15
EBITA (74) 44 388 1,050 504 1,031 as a % of sales (1.5) 0.4 2.4 4.5 8.9 8.7
EBIT (186) (178) 59 614 389 793 as a % of sales (3.7) (1.7) 0.4 2.6 6.9 6.7
Net income (loss) - shareholders (59) (15) 159 410 200 459 per common share in euros - basic (0.06) (0.02) 0.17 0.44 0.22 0.49
Net income (loss) from continuingoperations as a % of shareholders’ equity (1.6) (0.2) 1.5 2.7 5.9 6.7
period ended 2009 period ended 2010
Inventories as a % of sales 13.6 13.7 14.5 12.6 13.9 15.9
Net debt : group equity ratio 3:97 6:94 4:96 (1):101 1:99 2:98
Total employees (in thousands) 116 116 118 116 116 117
Information also available on Internet, address:www.philips.com/investorrelations

28 Quarterly report and Semi-annual report
Notes overview
Notes to the unaudited semi-annualconsolidated financial statements 1 Significant accounting policies 292 Estimates 293 Financial risk management 304 Segment information 305 Seasonality 306 Acquisitions and divestments 307 Investments in associates 308 Income taxes 319 Property, plant and equipment 3110 Goodwill 3111 Intangible assets excluding goodwill 3212 Other non-current financial assets 3213 Inventories 3314 Shareholders’ equity 3315 Short-term and long-term debt 3316 Provisions 3317 Accrued liabilities 3318 Pensions 3319 Contingent liabilities 3420 Related-party transactions 3521 Share-based compensation 35

Quarterly report and Semi-annual report 29
Notes to the unaudited semi-annual consolidated financial statements
This report contains the semi-annual financial report ofKoninklijke Philips Electronics N.V. (‘the Company’), acompany with limited liability, headquartered inAmsterdam, the Netherlands. The principal activities ofthe Company and its group companies (the Philips Group)are described in note 4.
The semi-annual financial statements have been preparedin accordance with IAS 34 ‘Interim Financial Reporting’ asadopted by the European Union.
1 Significant accounting policies
The significant accounting policies applied in these semi-annual financial statements are consistent with thoseapplied in the Company’s consolidated IFRS financialstatements for the year ended December 31, 2009,except for the adoption of the following new standards,amendments to standards and interpretations, which havebeen adopted as relevant to the Company for the firsttime:
Accounting for business combinationsOn January 1, 2010, the Company applied IFRS 3 ‘BusinessCombinations’ (revised standard 2008) in accounting forbusiness combinations. This revised standard has beenapplied prospectively and since there were no significantacquisitions during the first half of 2010, the change didnot have a material impact on the Company’sconsolidated financial statements.
For acquisitions on or after January 1, 2010, the Companymeasures goodwill as the fair value of the considerationtransferred (including the fair value of any previously-heldequity interest in the acquiree) and the recognisedamount of any non-controlling interests in the acquiree,less the net recognised amount (generally fair value) of theidentifiable assets acquired and liabilities assumed, allmeasured as of the acquisition date. When the excess isnegative, a bargain purchase gain is recognisedimmediately in the statements of income.
Transaction costs, other than those associated with theissue of debt or equity securities, that the Company incursin connection with a business combination, are expensedas incurred.
Accounting for acquisitions of non-controlling interestsFrom January 1, 2010, the Company has applied IAS 27‘Consolidated and Separate Financial Statements’(amendment 2008) in accounting for acquisitions of non-
controlling interests. The change in accounting policy hasbeen applied prospectively; there was no impact on theCompany’s consolidated financial statements.
From January 1, 2010, acquisitions of non-controllinginterests are accounted for as transactions with equityholders in their capacity as equity holders and thereforeno goodwill is recognized. Previously, goodwill arising onthe acquisition of non-controlling interests in a subsidiarywas recognized and represented the excess of the cost ofthe additional investment over the carrying amount of theinterest in the net assets acquired at the date of thetransaction.
Distribution of non-cash assets to ownersFrom January 1, 2010, the Company applied ‘IFRIC 17Distributions of Non-cash Assets to Owners’ inaccounting for distribution of non-cash assets to owners.This accounting policy has been applied prospectively anddid not have a material impact on the Company’sconsolidated financial statements.
The Group measures a liability to distribute non-cashassets to owners as the fair value of the assets to bedistributed. The carrying amount of the liability ismeasured at each reporting period and the settlementdate, with any changes recognized in equity as adjustmentsto the amount of the distribution.
Upon settlement of the transaction, the Companyrecognizes the difference, if any, between the carryingamount of the assets distributed and the carrying amountof the liability in the statements of income.
Other IFRS standards and interpretations effective fromJanuary 1, 2010 did not have a material impact on theCompany.
2 Estimates
The preparation of the semi-annual financial statementsrequires management to make judgments, estimates andassumptions that affect the application of accountingpolicies and the reported amounts of assets and liabilities,income and expense. Actual results may differ from theseestimates.
In preparing these condensed consolidated semi-annualfinancial statements, the significant estimates andjudgments made by management in applying the Group’saccounting policies and the key sources of estimation
30 Quarterly report and Semi-annual report
uncertainty were the same as those that applied to theconsolidated financial statements as at and for the yearended December 31, 2009.
3 Financial risk management
The Group’s financial risk management objectives andpolicies are consistent with those disclosed in theconsolidated financial statements as at and for the yearended 31 December 2009.
4 Segment information
Philips’ activities are organized on a sector basis, withoperating sectors – Healthcare, Consumer Lifestyle andLighting – each being responsible for the management ofits business worldwide, and Group Management &Services (GM&S). A short description of these sectors isas follows:
• Healthcare: in May 2010, the organizational structure ofthe Healthcare sector changed. Healthcare nowconsists of the following businesses – Imaging Systems,Home Healthcare Solutions, Patient Care and ClinicalInformatics, and Customer Services.
• Consumer Lifestyle: consists of the followingbusinesses – Television, Personal Care, Audio & VideoMultimedia, Domestic Appliances, Accessories, Health& Wellness, and Licenses.
• Television: contained within the Consumer Lifestylesector, Television results are reported separately dueto the large impact the results have on ConsumerLifestyle and the Philips Group.
• Lighting: consists of the following businesses – Lamps,Professional Luminaires, Consumer Luminaires,Lighting Electronics, Automotive, Special LightingApplications and Solid-State Lighting Components &Modules.
• GM&S: consists of various activities and businessesincluding the Corporate center, Countries & Regions,Global Service Units, Pensions, Research, IntellectualProperty & Standards, Applied Technologies, NewVenture Integration, and Design.
Reportable segments for the purpose of the segmentaldisclosures required by IAS 34 Interim FinancialStatements are: Healthcare, Consumer Lifestyle,Television and Lighting.
Significant segment information can be found in theSectors, Sectors and main countries and Reconciliation ofnon-GAAP performance measures sections of thisdocument.
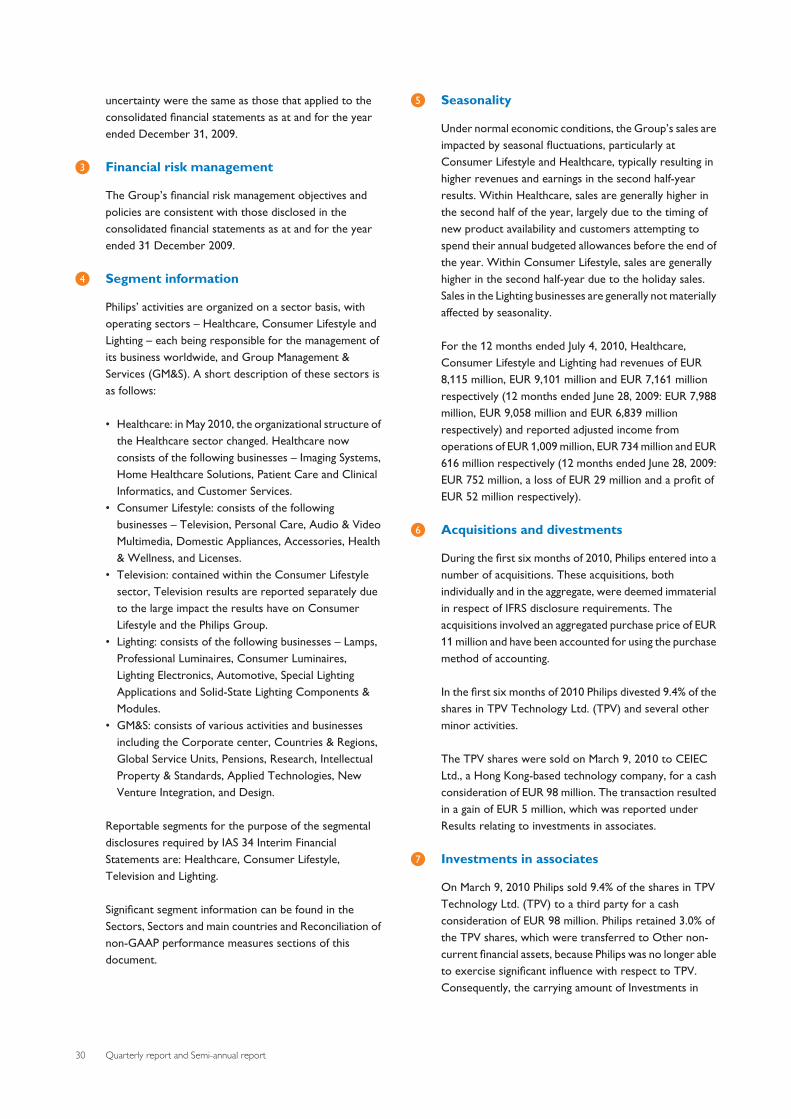
5 Seasonality
Under normal economic conditions, the Group’s sales areimpacted by seasonal fluctuations, particularly atConsumer Lifestyle and Healthcare, typically resulting inhigher revenues and earnings in the second half-yearresults. Within Healthcare, sales are generally higher inthe second half of the year, largely due to the timing ofnew product availability and customers attempting tospend their annual budgeted allowances before the end ofthe year. Within Consumer Lifestyle, sales are generallyhigher in the second half-year due to the holiday sales.Sales in the Lighting businesses are generally not materiallyaffected by seasonality.
For the 12 months ended July 4, 2010, Healthcare,Consumer Lifestyle and Lighting had revenues of EUR8,115 million, EUR 9,101 million and EUR 7,161 millionrespectively (12 months ended June 28, 2009: EUR 7,988million, EUR 9,058 million and EUR 6,839 millionrespectively) and reported adjusted income fromoperations of EUR 1,009 million, EUR 734 million and EUR616 million respectively (12 months ended June 28, 2009:EUR 752 million, a loss of EUR 29 million and a profit ofEUR 52 million respectively).
6 Acquisitions and divestments
During the first six months of 2010, Philips entered into anumber of acquisitions. These acquisitions, bothindividually and in the aggregate, were deemed immaterialin respect of IFRS disclosure requirements. Theacquisitions involved an aggregated purchase price of EUR11 million and have been accounted for using the purchasemethod of accounting.
In the first six months of 2010 Philips divested 9.4% of theshares in TPV Technology Ltd. (TPV) and several otherminor activities.
The TPV shares were sold on March 9, 2010 to CEIECLtd., a Hong Kong-based technology company, for a cashconsideration of EUR 98 million. The transaction resultedin a gain of EUR 5 million, which was reported underResults relating to investments in associates.
7 Investments in associates
On March 9, 2010 Philips sold 9.4% of the shares in TPVTechnology Ltd. (TPV) to a third party for a cashconsideration of EUR 98 million. Philips retained 3.0% ofthe TPV shares, which were transferred to Other non-current financial assets, because Philips was no longer ableto exercise significant influence with respect to TPV.Consequently, the carrying amount of Investments in

Quarterly report and Semi-annual report 31
associates was reduced by EUR 123 million. Thetransaction resulted in a gain of EUR 5 million, which wasrecognized under Results relating to investments inassociates.
8 Income taxes
Income tax expense is recognized based on management’sbest estimate of the weighted average annual income taxrate expected for the full financial year applied to the pre-tax income of the interim period. This year’s income taxexpense is higher, mainly due to higher earnings in 2010and EUR 95 million of net tax benefits in 2009, includingthe recognition of a deferred tax asset for Lumileds and anumber of tax settlements partly offset by additionalliabilities for uncertain tax positions.
9 Property, plant and equipment
Acquisitions and disposalsDuring the first six months ended July 4, 2010, there wereno significant movements in property, plant andequipment. Apart from currency translation-relateddifferences of EUR 243 million (six months ended June 28,2009: EUR 18 million), the addition of EUR 305 million (sixmonths ended June 28, 2009: EUR 252 million) was morethan offset by depreciation and impairment charges ofEUR 324 million (six months ended June 28, 2009: EUR324 million).
10 Goodwill
Goodwillin millions of euros
Balance as of December 31, 2009
Cost 8,021 Amortization / Impairments (659)
Book value 7,362
Changes in book value:
Acquisitions 6
Impairments -
Translation differences 1,221
Balance as of July 4, 2010:
Cost 9,359 Amortization / Impairments (770)
Book value 8,589
Respiratory Care and Sleep Management and ProfessionalLuminaires remain sensitive to fluctuations in the keyassumptions used in the impairment tests as set outbelow. In addition, Home Monitoring is sensitive tohealthcare reform in the United States.
In 2010, the organizational structure of the Healthcaresector changed, as referenced in note 4. As a result of thechange, part of the goodwill of Clinical Care Systems wasallocated to Imaging Systems and the other part to PatientCare and Clinical Informatics (former HealthcareInformatics). Furthermore, Respiratory Hospital andrelated goodwill were transferred to Patient Care andClinical Informatics. Applicable goodwill balances arereflected in the table below.
For impairment testing, goodwill is allocated to (groupsof) cash-generating units (typically one level below sectorlevel), which represent the lowest level at which goodwillis monitored for internal management purposes. Asignificant part of goodwill is allocated to the followingbusinesses:
July 4, 2010
Respiratory Care and Sleep Management 2,359
Professional Luminaires 1,608
Imaging Systems 1,549
Patient Care and Clinical Informatics 1,409
Key assumptions used in the annual impairment tests(performed in the second quarter) for the businesses inthe table above were sales growth rates and the ratesused for discounting the projected cash flows. For the2010 annual test, cash flow projections, reflecting value inuse, were determined using management’s internalforecasts that cover an initial period from 2010 to 2015and were extrapolated with stable or declining growthrates for a period of no more than 5 years, after which aterminal value was calculated, for which growth rateswere capped at a historical long-term average growthrate.
The projected cash flows rely on the experience of themanagement teams of the cash-generating units and arebased on market growth assumptions and industry long-term growth averages. Cash flow projections ofRespiratory Care and Sleep Management, ProfessionalLuminaires, Imaging Systems, and Patient Care and ClinicalInformatics for 2010 were based on the following keyassumptions:

32 Quarterly report and Semi-annual report
• during the initial forecast period a compound salesgrowth of 9.4%, 11.3%, 5.2% and 6.5% respectively wasused;
• during the period beyond the initial forecast period,stable and declining growth was considered, withcompound rates of 5.0%, 7.2%, 4.0% and 5.4%respectively; and
• a terminal value for all four units was based on a growthrate of 2.7%.
Income from operations in all four units is expected toincrease over the projection period as a result of volumegrowth and cost efficiencies. The respective pre-taxdiscount rates applied to the most recent cash flowprojections were 10.2%, 14.0%, 11.1% and 12.1%respectively. Based on this analysis, management did notidentify impairment for these (groups of) cash-generatingunits.
The value in use of Respiratory Care and SleepManagement in the annual impairment test wasapproximately EUR 100 million above its carrying value.An increase of 30 basis points in the pre-tax discount rate,a 50 basis points decrease in the compound long-termsales growth rate, or a 5% decrease in terminal valuewould cause its value in use to fall to the level of itscarrying value.
The value in use of Professional Luminaires in the annualtest was approximately EUR 600 million above its carryingvalue. An increase of 250 basis points in the pre-taxdiscount rate, a 280 basis points decrease in thecompound long-term sales growth rate, or a 34%decrease in terminal value would cause its value in use tofall to the level of its carrying value.
The results of the annual impairment test of ImagingSystems and Patient Care and Clinical Informatics haveindicated that a reasonably possible change in keyassumptions would not cause the value in use to fall to thelevel of the carrying value.
11 Intangible assets excluding goodwill
Intangible assets excluding goodwillin millions of euros
Book value as of December 31, 2009 4,161
Changes in book value:
Additions 194
Acquisitions 11
Amortization/deductions (359)
Impairment losses (4)Translation differences 609
Total changes 451
Book value as of July 4, 2010 4,612
12 Other non-current financial assets
The changes during 2010 are as follows:
Other non-current financial assetsin millions of euros
Balance as of December 31, 2009 691
Changes:
Reclassifications 34
Acquisitions/additions 20
Sales/redemptions/reductions (15)
Value adjustments − Translation and exchange differences 34
Balance as of July 4, 2010 764
Other non-current financial assets mainly consist ofavailable-for-sale financial assets.
Reclassifications relate to the 3.0% retained interest inTPV Technology Ltd. (TPV) which was reclassified fromInvestments in associates subsequent to the sale of 9.4% ofthe TPV shares to a third party. For further details, pleaserefer to note 7.
The available-for-sale financial assets include a 19.8%interest in NXP Semiconductors N.V. (NXP) with acarrying value of EUR 207 million. NXP is treated as acost-method investment.
Triggered by the net losses incurred by NXP, Philipsperformed impairment reviews on the carrying value ofthe investment in NXP during the first six months of 2010.The impairment review was approached consistent withthe methodology outlined in our Annual Report 2009.
Quarterly report and Semi-annual report 33
In accordance with IAS 39, Financial Instruments:Recognition and Measurement, paragraph 66, if there isobjective evidence that an impairment loss has beenincurred for an unquoted equity investment carried atcost, the amount of the impairment loss is measured asthe difference between the carrying amount of theinvestment and the present value of the discountedestimated future cash flows.
Based on the impairment reviews performed during thefirst six months of 2010, we concluded that no impairmentwas necessary.
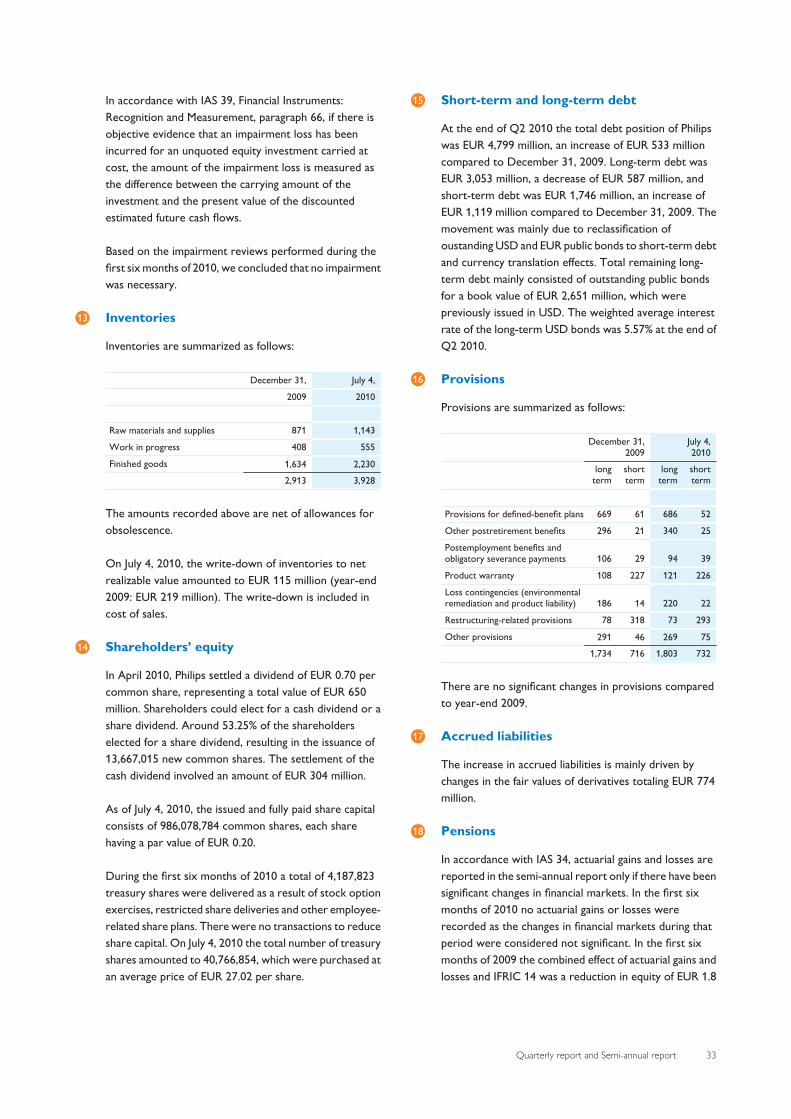
13 Inventories
Inventories are summarized as follows:
December 31, July 4,
2009 2010
Raw materials and supplies 871 1,143
Work in progress 408 555
Finished goods 1,634 2,230 2,913 3,928
The amounts recorded above are net of allowances forobsolescence.
On July 4, 2010, the write-down of inventories to netrealizable value amounted to EUR 115 million (year-end2009: EUR 219 million). The write-down is included incost of sales.
14 Shareholders’ equity
In April 2010, Philips settled a dividend of EUR 0.70 percommon share, representing a total value of EUR 650million. Shareholders could elect for a cash dividend or ashare dividend. Around 53.25% of the shareholderselected for a share dividend, resulting in the issuance of13,667,015 new common shares. The settlement of thecash dividend involved an amount of EUR 304 million.
As of July 4, 2010, the issued and fully paid share capitalconsists of 986,078,784 common shares, each sharehaving a par value of EUR 0.20.
During the first six months of 2010 a total of 4,187,823treasury shares were delivered as a result of stock optionexercises, restricted share deliveries and other employee-related share plans. There were no transactions to reduceshare capital. On July 4, 2010 the total number of treasuryshares amounted to 40,766,854, which were purchased atan average price of EUR 27.02 per share.
15 Short-term and long-term debt
At the end of Q2 2010 the total debt position of Philipswas EUR 4,799 million, an increase of EUR 533 millioncompared to December 31, 2009. Long-term debt wasEUR 3,053 million, a decrease of EUR 587 million, andshort-term debt was EUR 1,746 million, an increase ofEUR 1,119 million compared to December 31, 2009. Themovement was mainly due to reclassification ofoustanding USD and EUR public bonds to short-term debtand currency translation effects. Total remaining long-term debt mainly consisted of outstanding public bondsfor a book value of EUR 2,651 million, which werepreviously issued in USD. The weighted average interestrate of the long-term USD bonds was 5.57% at the end ofQ2 2010.
16 Provisions
Provisions are summarized as follows:
December 31,2009
July 4,2010
longterm
shortterm
longterm
shortterm
Provisions for defined-benefit plans 669 61 686 52
Other postretirement benefits 296 21 340 25
Postemployment benefits andobligatory severance payments 106 29 94 39
Product warranty 108 227 121 226
Loss contingencies (environmentalremediation and product liability) 186 14 220 22
Restructuring-related provisions 78 318 73 293
Other provisions 291 46 269 75 1,734 716 1,803 732
There are no significant changes in provisions comparedto year-end 2009.
17 Accrued liabilities
The increase in accrued liabilities is mainly driven bychanges in the fair values of derivatives totaling EUR 774million.
18 Pensions
In accordance with IAS 34, actuarial gains and losses arereported in the semi-annual report only if there have beensignificant changes in financial markets. In the first sixmonths of 2010 no actuarial gains or losses wererecorded as the changes in financial markets during thatperiod were considered not significant. In the first sixmonths of 2009 the combined effect of actuarial gains andlosses and IFRIC 14 was a reduction in equity of EUR 1.8

34 Quarterly report and Semi-annual report
billion net of tax. For the whole of 2009 the combinedeffect of actuarial gains and losses and IFRIC 14 was areduction in equity of EUR 0.9 billion net of tax due tofavorable developments in the second half of 2009.
The half-year estimates are limited to the principal plans,i.e. the defined-benefit plans in the Netherlands,Germany, the UK and the US, which together representmore than 90% of the defined-benefit pension assets andliabilities for the Group as a whole. Estimated changes inrecognized prepaid pension costs are in accordance withIFRIC 14.
Actuarial gains or losses, if any, are reported under Othercomprehensive income and against the respective balancesheet items.
19 Contingent liabilities
GuaranteesPhilips’ policy is to provide guarantees and other letters ofsupport only in writing. Philips does not stand by otherforms of support. At the end of Q2 2010, the total fairvalue of guarantees recognized on the balance sheet wasEUR 14 million (December 31, 2009: EUR 14 million).Remaining off-balance-sheet business and credit-relatedguarantees provided to third parties and associatesdecreased by EUR 3 million during the first half of 2010 toEUR 305 million.
Environmental remediationThe Company and its subsidiaries are subject toenvironmental laws and regulations. Under these laws, theCompany and/or its subsidiaries may be required toremediate the effects of the release or disposal of certainchemicals on the environment. A number of subsidiaries of the Company have beenidentified for further investigation of possibleenvironmental obligations. In the United States,subsidiaries of the Company have been named aspotentially responsible parties in state and federalproceedings for the clean-up of various sites. TheCompany accrues for losses associated withenvironmental obligations when such losses are probableand reliably estimable.
Legal proceedingsThe Company and certain of its group companies andformer group companies are involved as a party in legalproceedings, including regulatory and other governmentalproceedings, including discussions on potential remedialactions, relating to such matters as competition issues,commercial transactions, product liability, participationsand environmental pollution. In respect of antitrust laws,
the Company and certain of its (former) group companiesare involved in investigations by competition lawauthorities in several jurisdictions and are engaged inlitigation in this respect. Since the ultimate disposition ofasserted claims and proceedings and investigations cannotbe predicted with certainty, an adverse outcome couldhave a material adverse effect on the Company’sconsolidated financial position and consolidated results ofoperations for a particular period. For certain legalproceedings information required under IAS 37 is notdisclosed, if the Company concludes that the disclosurecan be expected to prejudice seriously the outcome of thelegal proceeding.
For information regarding legal proceedings in which theCompany is involved, please refer to our Annual Report2009. Significant developments regarding legalproceedings that have occurred since the publication ofour Annual Report 2009 are described below:
CRTOn March 30, 2010, the District Court adopted theSpecial Master’s Report and Recommendation denyingthe bulk of the motions to dismiss filed on behalf of allPhilips entities in response to both the direct and indirectpurchaser actions in the federal class actions pending inthe Northern District of California. These cases have nowproceeded to discovery. The Court has not set a trial dateand there is no timetable for the resolution of these cases.
LG DisplayOn April 15, 2010, Philips Electronics North AmericaCorporation moved to dismiss the Nokia complaint onthe ground that Nokia has failed to state a claim uponwhich relief can be granted. This motion was granted onJune 29, 2010 with leave to amend. Nokia has until July 23,2010 to amend its complaint.
Optical Disc Drive (ODD)On April 7, 2010, a class action proceeding was institutedin the Province of Quebec on behalf of all Canadianresidents (or alternatively Quebec residents only) whopurchased, used and/or received an ODD or purchasedany products which contained an ODD, sinceapproximately January 2001 through to the present. Theclass action named, amongst others, as defendants,Koninklijke Philips Electronics N.V., Philips ElectronicsNorth America Corporation, Philips Canada Ltd., Lite-OnIT Corporation, Philips & Lite-On Digital SolutionCorporation and Philips & Lite-On Digital Solutions USA,Inc. The petitioner seeks both compensatory and punitivedamages and all applicable interest, but they have notquantified the value of these damages in their claim.

Quarterly report and Semi-annual report 35
20 Related-party transactions
In the normal course of business, Philips purchases andsells goods and services from/to various related parties inwhich Philips typically holds a 50% or less equity interestand has significant influence. These transactions aregenerally conducted with terms comparable totransactions with third parties.
Related-party transactionsin millions of euros
January-June 2009 2010
Purchases of goods and services 119 151
Sales of goods and services 73 68
Balance outstanding June 28, 2009 July 4, 2010
Receivables from related parties 13 11
Payables to related parties 47 13
21 Share-based compensation
Share-based compensation expense amounted to EUR 29million and EUR 35 million in the first six months of 2010and 2009 respectively.
During the first six months of 2010 the Company granted5,028,436 stock option rights on its common shares and1,258,122 rights to receive common shares in the future(restricted share rights).
A total of 1,812,948 restricted shares were issued toemployees. 686,274 EUR-denominated options and796,839 USD-denominated options were exercised at aweighted average exercise price of EUR 19.52 and USD23.88 respectively.
Under the employee stock purchase plans 1,010,624shares have been purchased at an average price of EUR21.73.
For further information on the characteristics of theseplans, please refer to the Annual Report 2009, note 30.

© 2010 Koninklijke Philips Electronics N.V.All rights reserved.
http://www.philips.com/investorrelations