philippine plan of action for nutrition 2017 · pdf filephilippine plan of action for...
TRANSCRIPT

Philippine Plan of Action for Nutrition 2017-22 Executive Summary 1
Republic of the Philippines
Department of Health
NATIONAL NUTRITION COUNCIL
PHILIPPINE PLAN OF ACTION FOR NUTRITION 2017-2022
A call to urgent action for Filipinos and its leadership
Executive Summary
1. The Philippine Plan of Action for Nutrition (PPAN) 2017-2022 is an integral part of
the Philippine Development Plan 2017-2022. It is consistent with the Duterte
Administration 10-point Economic Agenda, the Health for All Agenda of the
Department of Health (DOH), the development pillars of malasakit (protective
concern), pagbabago (change or transformation), and kaunlaran (development), and
the vision of Ambisyon 2040. It factors in and considers country commitments to the
global community as embodied in the 2030 Sustainable Development Goals, the 2025
Global Targets for Maternal, Infant and Young Child Nutrition, the 2014 International
Conference on Nutrition.
2. It is a results-based plan with SMART results at different levels designed in a results
framework.
3. It consists of 12 programs and 46 projects serving as a framework for actions that
could be undertaken by member agencies of the National Nutrition Council (NNC),
other national government agencies, local government units, non-government
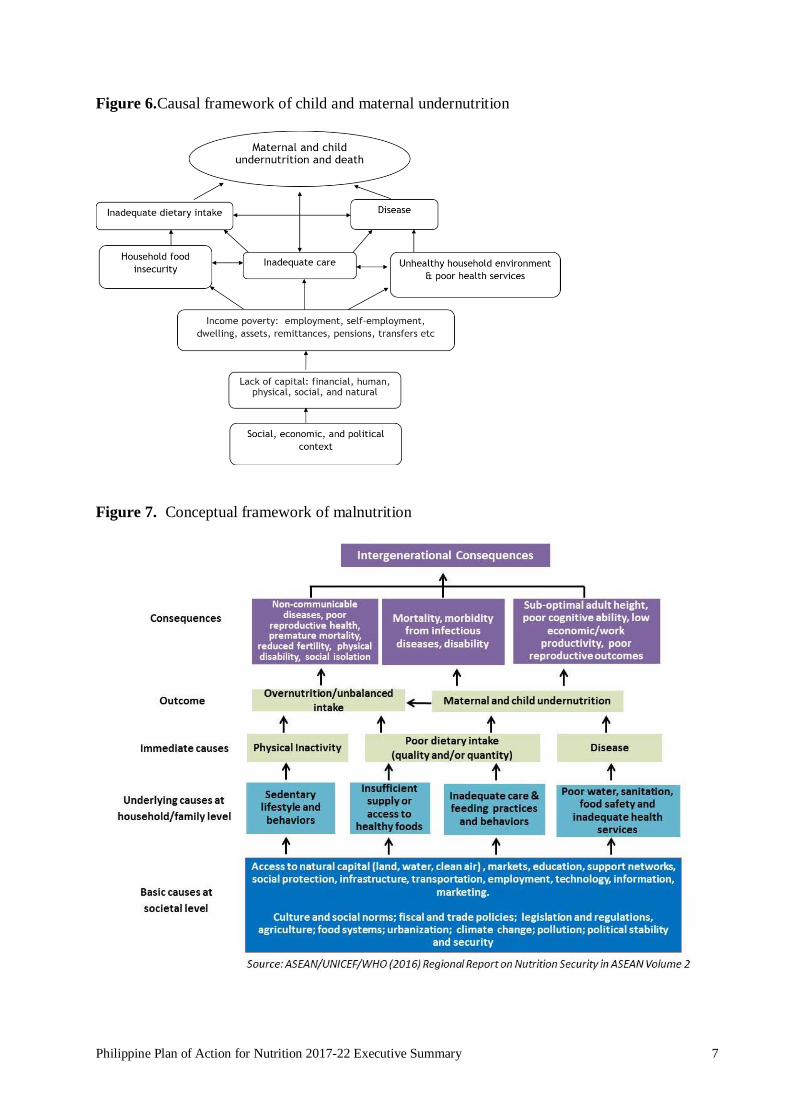
organizations, academic institutions, and development partners. For better
accountability, a member agency of the NNC Governing Board has been designated
as lead for one or more of these programs.
4. Of these 12 programs, 8 are nutrition-specific, one is nutrition-sensitive and three are
enabling support programs. A program for local government mobilization is among
the three enabling programs to ensure their wider participation in delivering
nutritional outcomes.
5. The PPAN 2017-2022 comes with a budget estimate for the entire period of six years.
The plan has a monitoring and evaluation framework showing the plan for progress
monitoring and evaluation through the six-year period.
6. The National Nutrition Council Secretariat led and coordinated plan formulation.
Plan formulation started with the conduct of a nutrition landscape analysis
commissioned by NNC with support from Micronutrient Initiative and the United
Nations Children’s Fund (UNICEF). A team of Filipino consultants conducted the
assessment from August to October 2016 using landscape analysis based on document
reviews, focus group discussions, key informant interviews, inter-sectoral
consultations and validation meetings with a wide range of stakeholders. The results
of the analysis are contained in a separate document “Situation Analysis of Nutrition

Philippine Plan of Action for Nutrition 2017-22 Executive Summary 2
in the Philippines”. However, its key findings are in the first part of the plan
document.
7. Plan formulation was participatory, inter-sectoral, and multi-level. It engaged the
participation of the NNC member agencies and their department senior officials at the
national and regional levels as well as members of provincial and municipal nutrition
committees of LGUs where the FGDs were held, i.e. 6 regions, 5 provinces, and 22
cities and municipalities. Please see Attachment 1 for the list of LGUs and persons
covered by the FGDs.
8. Two consultation meetings, prior to the drafting of the plan and after the plan was
drafted, were convened to ensure a wide participation in the plan formulation. The
first round of consultation with an inter-sectoral group of 16 agencies joined by
development partners and the academe was held in Tagaytay on 12-16 September.
During the consultation, the national nutrition situation was reviewed together with
issues related to policy and program formulation and implementation. The overall
strategy and programs for PPAN 2017-2022 was agreed on during this consultation.
9. The national round of consultation was held in Cebu on 17-18 November. During this
consultation, more specific directions for the programs identified in the Tagaytay
workshop were discussed and refined.
10. This was followed by two more meetings of the NNC Technical Committee on 23
November 2016, and 12 January 2017 before the final approval of the NNC
Governing Board on 21 February 2017.
11. Even as the PPAN 2017-2022, related concerns were brought into discussions of
relevant sectors of the Philippine Development Plan.
12. The PPAN 2017-2022 is divided into two parts: Part 1 consists of a summary of the
situation analysis of nutrition in the country in 2016; and Part 2 presents the plan.
13. Part 2 is divided into section describing the rational for the PPAN, followed by a brief
description of the PPAN, a description of the 11 programs and their classification, the
projects included in each program, the program structure and results framework,
PPAN strategy, the organization for its overall management and coordination, the
monitoring and evaluation framework, and the plan’s budget estimates section
including a resource framework and resource mobilization strategy.
Nutrition problems to be addressed
14. High levels of stunting and wasting among children under-five years of age, with
levels that have remained unchanged over the years (Figure 1). Also stunting is
relatively low among infants 0-11 months old, but is significantly higher among one-
year olds (Figure 2). The prevalence of stunting remains high for the older children.

Philippine Plan of Action for Nutrition 2017-22 Executive Summary 3
Figure 1. Trends in the Prevalence of Malnutrition among Children Under Five
Years Old: NNS, 1989-2015
Source: NNS 1989-2015, FNRI-DOST
Figure 2. Trends in the Prevalence of Stunting in Children from Birth to Three
Years: NNS, 2008 to 2015
15. Deficiencies in vitamin A, iron, and iodine particularly among groups for which the
problem is of public health significance (Table 1)
Table 1. Prevalence rate of micronutrient malnutrition
Micronutrient deficiency/Population
group affected
Prevalence rate
2008 2011 2013
Vitamin A deficiency: % of children 6
mos-6 years old with low to deficiency
serum retinol
15.2 No data 20.4
Anemia: % of anemic women of
reproductive age (20-39 years old)
18.6 No data 11.7
27.3 26.623.8 23.6
25.623
20.7 20 20.6 20.2 2021.5
44.5
40.538.8 40 38.9
35.933.8 32.9 32.2
33.7
30.333.4
6.27.5 7.8
6.2 6.8 6.8 6.1 5.8 6.07.3 8.0 7.1
1.1 1.12.1 1.7 1.7 2.3 1.9 2.9 3.5 4.3 5.1 3.9
0
10
20
30
40
50
1989 1994 1999 2004 2009 2014
Underweight Stunting Wasting Overweight-for-height

Philippine Plan of Action for Nutrition 2017-22 Executive Summary 4
Micronutrient deficiency/Population
group affected
Prevalence rate
2008 2011 2013
Iodine deficiency:
- Median urinary iodine concentration ug/L (Should be 100 ug/L for children 6-
12 years old, and lactating women, and 150 ug/L for pregnant women)
o Children, 6-12 years old 132 No data 168
o Pregnant women 105 No data 105
o Lactating women 81 No data 77
- Percent with iodine excretion concentration <50 mcg/L (should be less than
20%)
o Children, 6-12 years old 19.7 16.4
o Lactating women 34.0 34.3
16. Hunger and food insecurity with 68.3% of Filipino households not meeting their
caloric requirements. While this level is lower than that recorded in1989 (74.1%) it is
higher than the level reported in 1998 (57%) and 2008 (67%).
17. At the same time, overweight and obesity among various population groups should be
addressed, especially among adults (Figure 3).
Figure 3. Overweight and obesity among various population groups
18. Maternal nutrition should also be addressed as survey results have shown that the
prevalence of nutritionally-at-risk women has not improved over the years, with a
prevalence rate between 24-26% since 2008. Furthermore, adolescent pregnant
women, those of poor educational attainment, coming from the poorest wealth
quintile, and are employed have relatively higher levels of undernutrition (Figure 4).
Maternal nutrition could also affect the nutrition of the growing fetus.

Philippine Plan of Action for Nutrition 2017-22 Executive Summary 5
Figure 4. Prevalence of Nutritionally At-Risk Pregnant Women by Age,
Educational Attainment, Place of Residence and Wealth Index
Source: NNS 2015, DOST-FNRI
19. Poor infant and young child feeding in the first two years of life coupled with bouts of
infection can explain the high levels of stunting.
20. Exclusive breastfeeding (EBF) in the first six months of life continues to be a
challenge. EBF increased from 48.9% in 2011 to 52.3% in 2013 but went back to
48.8% in 2015. However, a look at EBF rates by single age group within the 0-5
months-old band would show declining EBF with the lowest rate among the 5-month
olds (Table 3). The low rate of EBF together with the rate of never breastfed
represent sub-optimal breastfeeding practice. These low rates deprive the infant of
needed nutrients for optimum growth at the time when his or her growth is most rapid.
Table 2. Proportion of exclusive breastfeeding among infants 0-5 months old, by
single age. Philippines, 2011 – 2015
Age in months Exclusive breastfeeding, in %
2011 2013 2015
All (0-5) 48.9 52.3 48.8
0 69.1 65.5 68.0
1 55.6 64.3 58.3
2 51.9 54.4 53.7
3 55.0 58.8 45.1
4 39.8 44.2 43.5
5 23.8 28.3 24.7 Source: NNS 2011. 2013, and 2015, DOST-FNRI.
Note: CV of estimates are ≤10% for all the age groups, except for the 5-month old group for which the CV is 10.5 in 2011, 13.2 in 2013 and 12.8 in 2015 and are considered acceptable.
49
30.5
18.3
24.3
28.6
27.7
19.8
20.8
15
39.6
21.9
0 10 20 30 40 50 60
No grade completed
Elem, not completed
Elem graduate
High school undergrad
High school graduate
Vocational undergraduate
Vocational graduate
College, undergradute
College, graduate
Educational attainment
< 20
≥ 20
Age (years)
17.9
26.4
24.8
23.8
29.7
24.4
24.1
22.1
18.6
0 10 20 30 40
Working
non-working
Working/employment status
Urban
Rural
Place of residence
Poorest
Poorest
Middle
Rich
Richest
Wealth index

Philippine Plan of Action for Nutrition 2017-22 Executive Summary 6
21. By the sixth month of life, the infant should receive nourishment from solid and semi-
solid food, in addition to breastmilk. However, only 15.5% of infants 6-23 months
old receive the minimum acceptable diet1.
22. As shown in Figure 11, the age group 6-11 months old are the worst off for this
indicator. Furthermore, while the highest wealth quintile has higher proportion of
children 6-23 months old with minimum acceptable diet, the level is still low at less
than 20%. Thus, the problem for achieving optimum complementary feeding is not
simply rooted on income.
Figure 5. Percent of children consuming minimum acceptable diet, Philippines 2013
Source: NNS 2013, DOST-FNRI
Causality of malnutrition
23. Figure 6 shows a framework for the causality of child and maternal undernutrition.
The framework notes undernutrition to arise from the immediate causes of inadequate
dietary intake and disease. These immediate causes are, in turn, linked with
underlying causes that include food insecurity, poor caring and feeding practices, and
poor home environmental conditions and inadequate health services. However, these
immediate and underlying causes are further linked to basic causes at the society level
that covers among others, low access and control of resources.
24. While the framework in Figure 6 is a globally accepted, and used framework, a
framework that integrates under- and overnutrition in one framework has been
developed for use in the ASEAN region (Figure 7).
25. Thus, addressing both under- and overnutrition should involve actions to eliminate or
reduce the negative impact of the identified causal factors.
1Minimum acceptable diet is based on the minimum requency of feeds and diet diversity or consumption of foods from four groups of a group of seven groups that include grains, roots, and tubers; legumes and nuts; dairy products (milk, yogurt, cheese); flesh foods (meat, fish, poultry and liver/organ meats); eggs; vitamin-A rich fruits and vegetables; and other fruits and vegetables.
Philippine Plan of Action for Nutrition 2017-22 Executive Summary 7
Figure 6.Causal framework of child and maternal undernutrition
Figure 7. Conceptual framework of malnutrition

Philippine Plan of Action for Nutrition 2017-22 Executive Summary 8
1
Goal
26. To improve the nutrition situation of the country as a contribution to:
a. The achievement of Ambisyon 20402 by improving the quality of the human
resource base of the country
b. Reducing inequality in human development outcomes
c. Reducing child and maternal mortality
Objectives
27. PPAN 2017-2022 has two layers of outcome objectives, the outcome targets and the
sub-outcome or intermediate targets. The former refers to final outcomes against
which plan success will be measured. The latter refers to outcomes that will
contribute to the achievement of the final outcomes.
Outcome targets
28. To reduce levels of child stunting and wasting
Indicator Baseline 2022 Target
• Prevalence (in percent) of stunted children
under five years old*
33.4 21.4
• Prevalence (in percent) of wasted children
o Under five years old* 7.1 <5
o 6 – 10 years old 8.6 <5 * Consistent with the 2025 Global Targets for Maternal, Infant and Young Child Nutrition
29. To reduce micronutrient deficiencies to levels below public health significance
Indicator Baseline 2022
Target
Vitamin A deficiency
• Prevalence (in percent) of children 6 months to 5 years
old with vitamin A deficiency (low to deficient serum
retinol)
20.4
<15
Anemia
• Prevalence (in percent) of anemia among women of
reproductive age*
11.7 6.0
Iodine deficiency disorders
• Median urinary iodine concentration, mcg/L
- Children 6-12 years old 168 ≥100
- Pregnant women 105 ≥150
- Lactating women 70 ≥100
2 Ambisyon 2040 is the Philippines’ long-term vision, i.e. “By 2040, the Philippines shall be a prosperous, predominantly middle-class society where no one is poor, our people shall live long and healthy lives, be smart and innovative, and shall live in a high-trust society. The Philippine hereby aims to triple real per capita income, and eradicate hunger and poverty by 2040, if not sooner” (Executive Order 05, October 2017).
Philippine Plan of Action for Nutrition 2017-22 Executive Summary 9
Indicator Baseline 2022
Target
• Percent with urinary iodine concentration <50 mcg/L
- Children 6-12 years old 16.4 <20
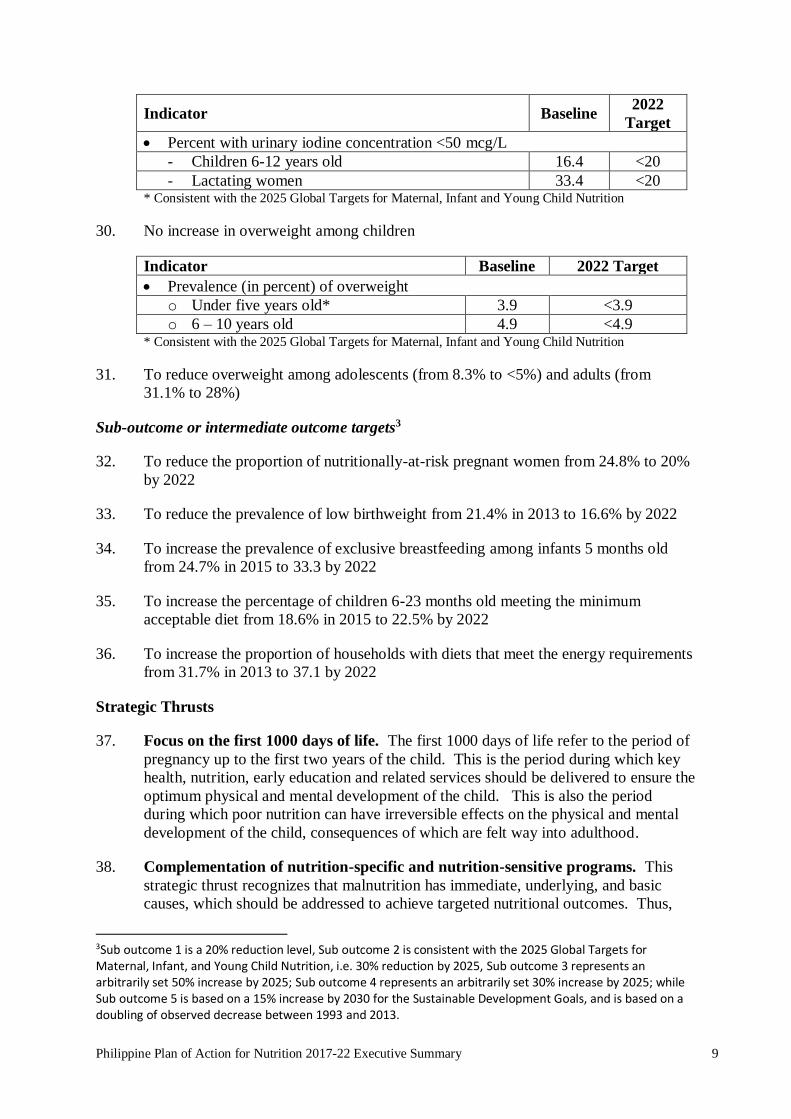
- Lactating women 33.4 <20 * Consistent with the 2025 Global Targets for Maternal, Infant and Young Child Nutrition
30. No increase in overweight among children
Indicator Baseline 2022 Target
• Prevalence (in percent) of overweight
o Under five years old* 3.9 <3.9
o 6 – 10 years old 4.9 <4.9 * Consistent with the 2025 Global Targets for Maternal, Infant and Young Child Nutrition
31. To reduce overweight among adolescents (from 8.3% to <5%) and adults (from
31.1% to 28%)
Sub-outcome or intermediate outcome targets3
32. To reduce the proportion of nutritionally-at-risk pregnant women from 24.8% to 20%
by 2022
33. To reduce the prevalence of low birthweight from 21.4% in 2013 to 16.6% by 2022
34. To increase the prevalence of exclusive breastfeeding among infants 5 months old
from 24.7% in 2015 to 33.3 by 2022
35. To increase the percentage of children 6-23 months old meeting the minimum
acceptable diet from 18.6% in 2015 to 22.5% by 2022
36. To increase the proportion of households with diets that meet the energy requirements
from 31.7% in 2013 to 37.1 by 2022
Strategic Thrusts
37. Focus on the first 1000 days of life. The first 1000 days of life refer to the period of
pregnancy up to the first two years of the child. This is the period during which key
health, nutrition, early education and related services should be delivered to ensure the
optimum physical and mental development of the child. This is also the period
during which poor nutrition can have irreversible effects on the physical and mental
development of the child, consequences of which are felt way into adulthood.
38. Complementation of nutrition-specific and nutrition-sensitive programs. This
strategic thrust recognizes that malnutrition has immediate, underlying, and basic
causes, which should be addressed to achieve targeted nutritional outcomes. Thus,
3Sub outcome 1 is a 20% reduction level, Sub outcome 2 is consistent with the 2025 Global Targets for Maternal, Infant, and Young Child Nutrition, i.e. 30% reduction by 2025, Sub outcome 3 represents an arbitrarily set 50% increase by 2025; Sub outcome 4 represents an arbitrarily set 30% increase by 2025; while Sub outcome 5 is based on a 15% increase by 2030 for the Sustainable Development Goals, and is based on a doubling of observed decrease between 1993 and 2013.

Philippine Plan of Action for Nutrition 2017-22 Executive Summary 10
there is a need to implement and deliver nutrition-specific interventions. These
interventions “address the immediate determinants of fetal and child nutrition and
development, i.e. adequate food intake and nutrient intake, caregiving and parenting
practices, and low burden of infectious diseases.
39. Intensified mobilization of local government units. To ensure that PPAN 2017-
2022 delivers the planned outcomes, 38areas with greater magnitude of the stunting
and wasting will be prioritized for mobilization of local government units.
Mobilization will aim to transform low-intensity nutrition programs to those that will
deliver targeted outcomes. It will involve capacity building and mentoring of LGUs
on nutrition program management to transform them to self-propelling LGUs able to
plan, implement, coordinate, and monitor and evaluate effective nutrition programs.
This strategy is also expected to compliment the interventions in the First 1000 Days.
Table 3. PPAN 2017-2022 Priority Areas
REGION PROVINCE REGION PROVINCE
CAR 1. Abra VII 20. Bohol
2. Apayao 21. Cebu
I 3. Pangasinan 22. Negros Oriental
II 4. Isabela VIII 23. Biliran
III 5. Aurora 24. Leyte
6. Bataan 25. Northern Samar
7. Bulacan IX 26. Zamboanga del Norte
8. Nueva Ecija 27. Zamboanga del Sur
IV - A 9. Quezon X 28. Bukidnon
IV - B 10. Palawan 29. Lanao del Norte
11. Marinduque 30. Misamis Oriental
V 12. Albay XI 31. Davao del Norte
13. Camarines
Norte
32. Davao del Sur
14. Camarines Sur XII 33. North Cotabato
15. Catanduanes 34. South Cotabato
16. Masbate ARMM 35. Sulu
VI 17. Aklan 36. Tawi-tawi
18. Antique CARAGA 37. Agusan del Sur
19. Iloilo NCR 38. CAMANAVA
40. Reaching geographically isolated and disadvantaged areas (GIDAs) and
communities of indigenous peoples. Efforts to ensure that PPAN 2017-2022
programs are designed and implemented to reach out to GIDAs and communities of
indigenous peoples will be pursued. The community of NGOs and development
partners’ resources will be engaged for this purpose.
41. Complementation of actions of national and local governments

Philippine Plan of Action for Nutrition 2017-22 Executive Summary 11
Program Framework
42. Consistent with the recommendations from the Lancet Series on Maternal and Child
Health and Nutrition in 20084, the PPAN 2017-2022 adopts the Nutrition Specific and
Nutrition Sensitive Programs as essential interventions to address the underlying
causes of malnutrition along the life cycle. Thus, PPAN 2017-2022 consists of 12
programs and 45 projects to be implemented by member agencies of the National
Nutrition Council (NNC) in cooperation with local government units. Of these 12
programs, 8 are nutrition-specific, one is nutrition-sensitive and three are enabling
support programs (Figure 8).
Figure 8. PPAN 2017-2022 Program Framework
Nutrition-specific programs
43. Nutrition-specific programs are those that were planned and designed to produce
nutritional outcomes (Table4). The selection of nutrition-specific programs to include
was inspired by already-existing programs, the WHO Essential Nutrition Actions, the
recommendations of the Lancet Maternal and Child Nutrition Series, the International
Conference for Nutrition 2 Framework for Action, among others.
Table 4. Nutrition-specific programs
4 The Lancet Series on Maternal and Child Health Nutrition, 2008

Philippine Plan of Action for Nutrition 2017-22 Executive Summary 12
Program Project/Component Agencies involved
1. Infant and young
child feeding
1. Health systems support DOH, LGUs
2. Community-based health and
nutrition support
DOH, NGOs, LGUs,
Development
Partners (DPs)
3. Maternity Protection and
Improving Capacities of
Workplaces on Breastfeeding
DOLE, Employers,
Employees’ Unions,
NGOs, LGUs, DPs
4. Establishment of breastfeeding
places in non-health
establishments
All agencies, NGOs,
LGUs, DPs, CSC
5. Enforcement of the Milk Code DOH, LGUs
2. Integrated
Management of
Acute Malnutrition
6. Enhancement of Facilities
(Including RUTF and RUSF) and
provision of services
DOH, NGOs, LGUs,
DP
7. Building of Capacity of Local
Implementers DOH, NGOs, LGUs,
DP
3. National Dietary
Supplementation
Program
8. Supplementary feeding of
pregnant women DOH, NGOs, LGUs,
DPs
9. Supplementary feeding of
children 6-23 months old DOH, NGOs, LGUs,
DPs
10. Supplementary feeding of
children 24-59 months old DSWD, NGOs,
LGUs, DPs
11. Supplementary feeding of school
children DepEd, NGOs,
LGUs, DPs
12. Food plants for producing
supplementary foods FNRI, LGUs, SUCs,
NGOs
4. National Nutrition
Promotion Program
for Behavior Change
13. In schools DepEd, NGOs,
LGUs, DPs
14. In communities DOH, DSWD,
NGOs, LGUs, DPs
15. In the workplace DOH, DOLE,
NGOs, LGUs, DPs
16. Resource center NNC (coordinator)
5. Micronutrient
supplementation
(vitamin A, iron-folic
acid, multiple
micronutrient
powder, zinc)
17. In health unit DOH, NGOs, LGUs
18. In schools DepEd, NGOs,
LGUs
19. Communication support DOH, NGOs, LGUs
6. Mandatory food 20. Rice fortification with iron DOH, DSWD,

Philippine Plan of Action for Nutrition 2017-22 Executive Summary 13
Program Project/Component Agencies involved
fortification
(technology
development,
capacity building,
regulation and
monitoring,
promotion)
DepED, NGOs,
LGUs, industry
21. Flour fortification with iron and
vitamin A
DOH, DSWD,
DepED, NGOs,
LGUs, industry
22. Cooking oil fortification with
vitamin A
DOH, DSWD,
DepED, NGOs,
LGUs, industry
23. Sugar fortification with vitamin A DOH, DSWD,
DepED, NGOs,
LGUs, industry
24. Salt iodization DOH, DSWD,
DepED, NGOs,
LGUs, industry
7. Nutrition in
emergencies
25. Capacity building for
mainstreaming nutrition
protection in emergencies
DOH, DSWD,
National/Local
Nutrition Cluster,
National/Local
DRRMC, NGOs,
LGUs, DPs
8. Overweight and
Obesity
Management and
Prevention Program
26. Healthy Food Environment DOH, DSWD,
DOLE, NGOs,
LGUs, industry,
CSC, DPs
27. Promotion of healthy lifestyle DOH, DSWD,
DOLE, NGOs,
LGUs, industry,
CSC, DPs
28. Weight Management Intervention
(for Overweight and Obese
Individuals)
DOH, DSWD,
DOLE, NGOs,
LGUs, industry,
CSC, DPs
Nutrition-sensitive program
44. Complementing these nutrition-specific interventions are nutrition-sensitive projects.
These are development projects that were tweaked to produce nutritional
outcomes/tweaking can be done by targeting households with undernourished
children or nutritionally-vulnerable groups, or targeting areas with high levels of
malnutrition, or being a channel for delivering nutrition-specific interventions. Table
5 shows a list of development programs and projects that will be tweaked to produce
nutritional outcomes in addition to their original objectives. This list in this program
is an initial one and will be updated in the course of plan implementation.
Table 5. Nutrition-sensitive program

Philippine Plan of Action for Nutrition 2017-22 Executive Summary 14
Project Agency involved
1. Farm-to-market roads and child nutrition DA, LGUs
2. Target Actions to Reduce Poverty and Generate Economic
Transformation (TARGET) and child nutrition
DA, LGUs
3. Coconut Rehabilitation Program PCA
4. Gulayan sa Paaralan BPI, DepED
5. Diskwento caravans in depressed areas DTI, LGUs
6. Family development sessions for child and family nutrition
project
DSWD, LGUs
7. Mainstreaming nutrition in sustainable livelihood DSWD, LGUs
8. Public works infrastructure and child nutrition DPWH, LGUs
9. Adolescent Health and Nutrition Development DOH, LGUs
10. Sagana at Ligtas na Tubig sa Lahat(SALINTUBIG) and
other programs on water, sanitation and hygiene
DOH, DILG, LWUA
Enabling programs
45. Mobilization of local government units for nutrition outcomes
a. Mobilization of Local Government Units for Delivery of Nutritional
Outcomes through the NNC Sub-Regional Network
b. Enabling Policy and Legal Framework for LGU Mobilization
c. Development of Continuing Opportunities for LGU Excellence in Nutrition
Programming
d. Mobilization of Rural Improvement Clubs and other community-based
organizations for nutrition action
46. Policy development for food and nutrition
a. Securing policy support for improving nutrition, specifically along the priority
legislative measures
b. Public advocacy for improved support to nutrition
47. Strengthened management support to the PPAN 2017-2022
a. Securing vital nutrition infrastructure and resource requirements for PPAN
b. Strengthening coordination, monitoring, evaluation and management of PPAN
across NNC including member agencies and NNC Secretariat

Philippine Plan of Action for Nutrition 2017-22 Executive Summary 15
Service targets
As a rule, service targets or the percent of the target group that should be reached by a
service, are being targeted at about 90% of the population group. This is based on estimates
of the Lancet Series on Maternal and Child Malnutrition that a 90% coverage of key services
can result to reduced mortality and stunting at significant levels. An exception though is the
program on obesity for which the target has been set to 50% of the target population.
Implementation and Management Mechanism
48. Operationalizing the PPAN 2017-2022 will involve the formulation of the National
PPAN Implementation Plan also for the same time. This implementation plan will
cover specific activities to be undertaken for each program for each year. It will be
updated annually to respond to the evolving situation. The implementation plan will
include a resource framework with explicit estimates of funded and unfunded budgets
and a resource mobilization strategy. This strategy will endeavor to ensure that
needed resources will eventually be available within the plan period.
49. At the regional level, a Regional Nutrition Action Plan (RNAP) will be formulated to
capture initiatives of regional offices of member agencies of the Regional Nutrition
Committee along the PPAN programs for 2017-2022. Like the National PPAN
Implementation Plan, the RNAP will be updated annually.
50. At the local level, local nutrition committees will formulate or reformulate their
respective nutrition action plans (LNAPs). These plans, while formulated along the
PPAN programs, will consider the locality’s nutrition problems and causes. Per
guidelines these LNAPs should cover the three-year term of the local chief executive,
and relevant items integrated in the annual investment plan of the local government
unit.
51. The National Nutrition Council Governing Board will continue to be the policy-
making body for PPAN 2017-2022. It will be assisted by the NNC Technical
Committee and technical working groups that will be established or re-organized for
each program.
52. Monitoring will involve the generation of reports on physical and financial
accomplishments from various stakeholders.
.