philippine pascn apec study center papers/2000/pascndp0012... · philippine apec study center ......
TRANSCRIPT
PASCNPhilippineAPECStudy CenterNetwork
PASCN Discussion Paper No. 2000-12
The State of Competition and Market Structureof the Philippine Air Transport Industry
Myrna S. Austria
The PASCN Discussion Paper Series constitutes studies that are preliminary andsubject to further revisions and review. They are being circulated in a limited num-ber of copies only for purposes of soliciting comments and suggestions for furtherrefinements.
The views and opinions expressed are those of the author(s) and do not necessar-ily reflect those of the Network.
Not for quotation without permission from the author(s).
PASCNP H I L I P P I N E A P E C S T U D Y C E N T E R N E T W O R K
PASCN Discussion Paper No. 2000-12
The State of Competition and Market Structure of the Philippine Air Transport Industry
Myrna S. Austria
Philippine Institute for Development Studies
As revised July 2001
The PASCN Discussion Paper Series constitutes studies that are preliminary and subject to further revisions and review. They are being circulated in a limited number of copies only for purposes of soliciting comments and suggestions for further refinements. The views and opinions expressed are those of the author(s) and do not necessarily reflect those of the Network. Not for quotation without permission from the author(s).
For comments, suggestions or further inquiries, please contact:
The PASCN Secretariat Philippine Institute for Development Studies NEDA sa Makati Building, 106 Amorsolo Street Legaspi Village, Makati City, Philippines Tel. Nos. 893-9588 and 892-5817

i
Abstract This paper examined the regulatory and policy regimes of the Philippine air transport industry and their effects on the state of competition and market structure of the industry. There is no doubt that liberalization and deregulation have brought genuine competition in the domestic air transport industry resulting to lower airfare, improvement in the quality of service and efficiency in the industry in general. The deregulation, however, resulted to the establishment of niche markets, with the big players concentrating on the major routes where traffic demand is heavier while the smaller airlines are flying the secondary and tertiary routes where traffic demand is lighter.
While the country has a policy pronouncement, through EO 219, of liberalizing its international air transport industry, the EO has yet to be implemented given the absence of its implementing guidelines. But EO 219 alone is not enough. The government needs to deepen its liberalization efforts by adopting a more liberal approach to its bilateral air agreements. While other countries are taking on a more flexible approaches to liberalization and regulation to meet the increasing demand for international air services brought about by the increasing integration of economies, the country is keeping to its old restrictive practices and policies. The effect of such restrictive policies is a high degree of concentration in the country’s international aviation industry.
The government needs to act quickly to promote competition in the industry.
As the experiences of other countries have shown, convenient and efficient air services brought about by greater competition are critical to attracting foreign investment, trade and tourism. To this end, the paper has identified areas where competition policy should be defined to introduce competition where there is none and to ensure that competition where it exists is effective.
ii
Executive Summary The regulatory landscape of the air transport industry throughout the world has been changing dramatically since the 1980s to meet the growing density of air traffic as a result of the increasing integration of economies. Reforms were made through deregulation and liberalization, all aimed at reducing the restrictions on competition in order to increase the efficiency of the industry. This study examined the regulatory and policy regimes of the Philippine air transport industry and their effects on the state of competition and market structure of the industry. Until 1995, the country had a one-airline policy. This gave the Philippine Airlines (PAL) the virtual monopoly of the country’s air transport industry. The monopoly, however, created so much inefficiency that the airline was not conscious to keep its service to certain standards. The landmark for reform came in 1995 with the passing of Executive Order 219 establishing the domestic and international civil aviation liberalization policy of the country. For the domestic air transportation, restrictions on domestic routes and frequencies were eliminated and so were government controls on rates and charges. For the international air transportation, the EO allows at least two international carriers to be designated as official carriers for the country. For the negotiation of traffic rights with the country’s bilateral partners, the primary consideration is national interests where it used to be the interest of the flag carrier. In 1999, the government also launched a policy on progressive liberalization of the country’s bilateral air services agreement. Nonetheless, there is really not much liberalization going under EO 219. Several areas remained restricted or regulated. These include ownership and effective control, capacity and frequency, airfares, freedom of rights granted and cabotage. The reforms in the domestic air transport made possible the entry of five new players in the industry, namely, Cebu Pacific Air, Air Philippines, Asian Spirit, Mindanao Express and Grand International Airways). This resulted to unprecedented competition. PAL suffered a significant decline in market shares as the new airlines slowly inched their way in the industry. Air Philippines and Cebu Pacific are providing PAL stiff competition. For the past four years, passenger traffic for these two airlines grew by 72 percent and 60 percent, respectively; and by 1999, the two airlines have captured 46 percent of the passenger traffic.
The deregulation resulted to the establishment of niche markets, with the big players (PAL, Cebu Pacific and Air Philippines) concentrating on the major routes where traffic demand is heavier while the smaller airlines (Asian Spirit and Mindanao Express) are flying the secondary and tertiary routes where traffic demand is lighter. An examination of the Herfindahl-Hirschman Index shows that only the major routes are being fiercely contested, i.e. the number of effective competitors is increasing. On the other hand, the deregulation has yet to create an impact on competition in the secondary and tertiary routes as the airlines servicing these areas have their own niche markets. Nonetheless, the introduction of comfortable high-speed ferries, as a result of the deregulation of the inter-island shipping industry, and the road improvement in the south, have become an important source of competition in the secondary and tertiary routes. This inter-modal competition will likely intensify with the continued improvement in the inter-island shipping industry and road transport and hence, will
iii
have some bearing on the future structure of the air industry, at least in the secondary/tertiary routes. The increased competition in the domestic air industry also provided travelers with lower airfares, and from the travelers’ perspective, the lower airfares are the most important result of the deregulation. The outcome is the rapid growth in domestic travel, at least before the financial crisis and the downsizing of PAL that affected the industry’s seat capacity. PAL, however, still charges the highest fare. The emerging picture shows that competition in the industry enables the more efficient, low-cost airlines to operate at fares lower than pre-competition days and yet keeps them profitable. Only two of the airlines are currently not incurring financial losses. The financial problem besetting the industry is an indication that only a few large efficient airlines may in the long run survive. The continued losses of the unprofitable airlines could drive them to withdraw or exit from the industry or merge with the profitable ones. On the other hand, PAL has remained uncontested as the country’s flag carrier flying the international routes. While other countries are adopting more flexible approaches to liberalization (e.g. elimination of constraints in frequency and capacity) in their air services agreements (ASAs) to meet the increasing demand for international air services, the country is keeping to its old restrictive practices and policies. In particular, the government’s stance on issues concerning its air services agreements is not compatible with its pronouncement of a progressive liberalization policy.
The effect of such restrictive policies is reflected in the high degree of concentration in the country’s international aviation industry. Only the markets for Japan, South Korea, Taiwan, Hong Kong and the USA show a relatively lower concentration and this is due to competition arising form fifth freedom. The degree of concentration worsened in the latter half of the 1990s. Between 1990 and 1995, 25 percent of the country’s markets registered an increase in concentration and this rose to 48 percent between 1995-2000. In almost city/country pairs, it is the airline of the country’s bilateral partners that dominates, especially in 1999 when PAL abandoned most of its international routes as a result of its downsizing arising from its financial and labor problems in 1997 and 1998.
The absence of competition results to poor performance and growth. This could be seen in the inability of PAL to use all the entitlements in the country’s ASAs. In 1996, for example, PAL used only 61 percent of the country’s traffic rights per week compared to 81 percent for the foreign airlines flying in the country. The unused entitlements is an indication that there are opportunities for PAL and other Philippine-based carriers to operate additional international services without the government requesting for greater capacity under existing ASAs. Furthermore, compared to other countries in the region, the Philippines is very much below the ranking in terms of passenger-kilometers performed. Worse yet, the country was demoted in its ranking in the top 30 countries for scheduled air carriers between 1988 (22nd) and 1997 (23rd). The financial crisis in 1997 and 1998 severely affected air travel in the region thereby reducing passenger traffic not only in the Philippines but in other countries as well. The industry is suffering from a major
iv
setback during the past two years. Being the country’s lone designated carrier, PAL’s financial and labor problems severely affected the industry’s seat capacity. The absence of government measures to avert the impact of PAL’s situation is shown by the 57 percent drop in passenger traffic. Had CAB been pro-active by re-negotiating the ASAs and granting additional frequency or seat capacity to foreign airlines, even on a selective basis covering only those with heavy traffic, the decline in traffic could not have been as bad.
In addition, since 98 percent of tourists visiting the country travel by air, the restrictive policies limited the potential of growth of the tourism industry. The annual growth rate of tourist arrivals between 1990 and 1998 had been on declining trend and so are the foreign exchange earnings of the industry. The findings show that the markets with relatively lower concentration are the same markets that generated the most number of tourists (top five) for the country. This implies that the greater competition in these markets gives tourists greater options for seats, flights and airfare, thereby making the Philippines easy to reach and air travel more convenient.
Given the industry’s poor performance and the growing demands for international travel, there is an urgent need to formulate the much delayed implementing rules and guidelines of EO 219. The government also needs to act quickly to promote competition in the industry. As the experience of other countries have shown, convenient and efficient air services brought about by greater competition are critical to attracting foreign investment, trade and tourism. To this end, this study has identified areas where competition policies should be defined to introduce competition where there is none and to ensure that competition, where it exists, is effective.
One area for competition policy is on merger and acquisition. Considering that domestic traffic in the country is relatively small, there is a limit to the number of airlines that would make an efficient domestic airline industry. Considering that only two of the airlines are currently profitable, the fierce competition in the industry could push the airlines into merger and consolidation. Likewise, given the local ownership requirement and the huge capital requirement of the new entrants to be able to fly international routes, merger and consolidation could be an easy solution to the problem. Thus, a policy on this area should be defined in such a way that mergers and consolidation would not result to reduced service and less competition. In short, a merger should be in the interests of the traveling public.
There are areas for competition policy more specific to the domestic air
transport industry. First, considering the archipelagic setting of the country, there are areas where air services are not commercially viable but which are deemed necessary on social grounds or for developmental reasons. The government should set up a system that will give airlines incentives to provide air services that otherwise would be money losers. Second, the system for providing such incentives, however, should be designed in such a way that the efficiency arising from the intermodal competition will not be distorted. Finally, where air services in a route are provided by only one airline, airfares should continue to be regulated. For the international air transport industry, EO 219 alone is not enough. The government needs to deepen its liberalization efforts by adopting a more flexible and
v
liberal approach to its bilateral air agreements. This would involve the gradual removal, within a set time frame, of constraints in capacity and frequency so as to allow airlines greater flexibility in determining the least cost of providing air services. However, a balance has to be struck in setting the time period. If competition is introduced too slowly, the incumbent airline has little incentive to eliminate the monopoly rents. Allowing competition too rapidly, on the other hand, may result in lost opportunity for the new players to gain organizational efficiencies, as they have yet to establish a credible presence in international routes, and fail altogether.
However, a liberal market access if not accompanied by freer access to inputs to the provision of air services will not produce any effect. This is where regional and multilateral actions are needed. Of particular importance under this area is the regulatory reform on how to facilitate the access of new airlines to airport landing slots as these have already been allocated to the incumbents.

vi
Table of Contents Pages Abstract i Executive Summary ii Table of Contents vi List of Tables vii List of Appendices ix 1. Introduction
1
2. Contestability of Markets: Its Applicability to the Air Transport Industry
2
3. Regulatory Framework for International Air Services
3
ASAs: Its Effects on Competition and Efficiency 6 Structural Barriers to Entry 7 Reforms in the Air Transport Industry
9
4. Policy and Regulatory Regimes of the Philippine Air Transport Industry
11
5. Regulatory and Policy Regimes: Their Effects on the State of Competition and Market Structure
16
Domestic Air Services 16 International Air Services
29
6. The Role of CAB in a Deregulated Environment
39
7. Implementing Guidelines for EO 219 40 8. Areas for Competition Policy 40
Domestic Air Industry 41 International Air Industry 42
9. Summary and Conclusion 42 References 44
vii
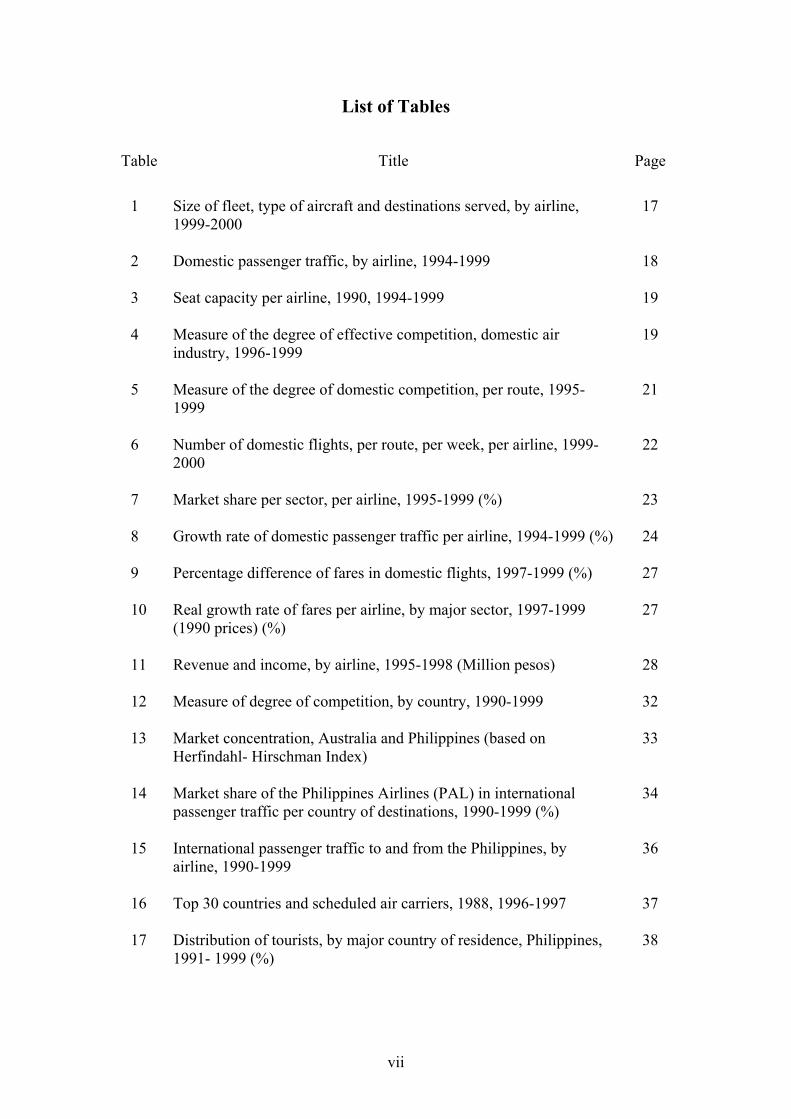
List of Tables
Table Title Page
1 Size of fleet, type of aircraft and destinations served, by airline,
1999-2000
17
2 Domestic passenger traffic, by airline, 1994-1999
18
3 Seat capacity per airline, 1990, 1994-1999
19
4 Measure of the degree of effective competition, domestic air industry, 1996-1999
19
5 Measure of the degree of domestic competition, per route, 1995-1999
21
6 Number of domestic flights, per route, per week, per airline, 1999-2000
22
7 Market share per sector, per airline, 1995-1999 (%)
23
8 Growth rate of domestic passenger traffic per airline, 1994-1999 (%)
24
9 Percentage difference of fares in domestic flights, 1997-1999 (%)
27
10 Real growth rate of fares per airline, by major sector, 1997-1999 (1990 prices) (%)
27
11 Revenue and income, by airline, 1995-1998 (Million pesos)
28
12 Measure of degree of competition, by country, 1990-1999
32
13 Market concentration, Australia and Philippines (based on Herfindahl- Hirschman Index)
33
14 Market share of the Philippines Airlines (PAL) in international passenger traffic per country of destinations, 1990-1999 (%)
34
15 International passenger traffic to and from the Philippines, by airline, 1990-1999
36
16 Top 30 countries and scheduled air carriers, 1988, 1996-1997
37
17 Distribution of tourists, by major country of residence, Philippines, 1991- 1999 (%)
38
viii
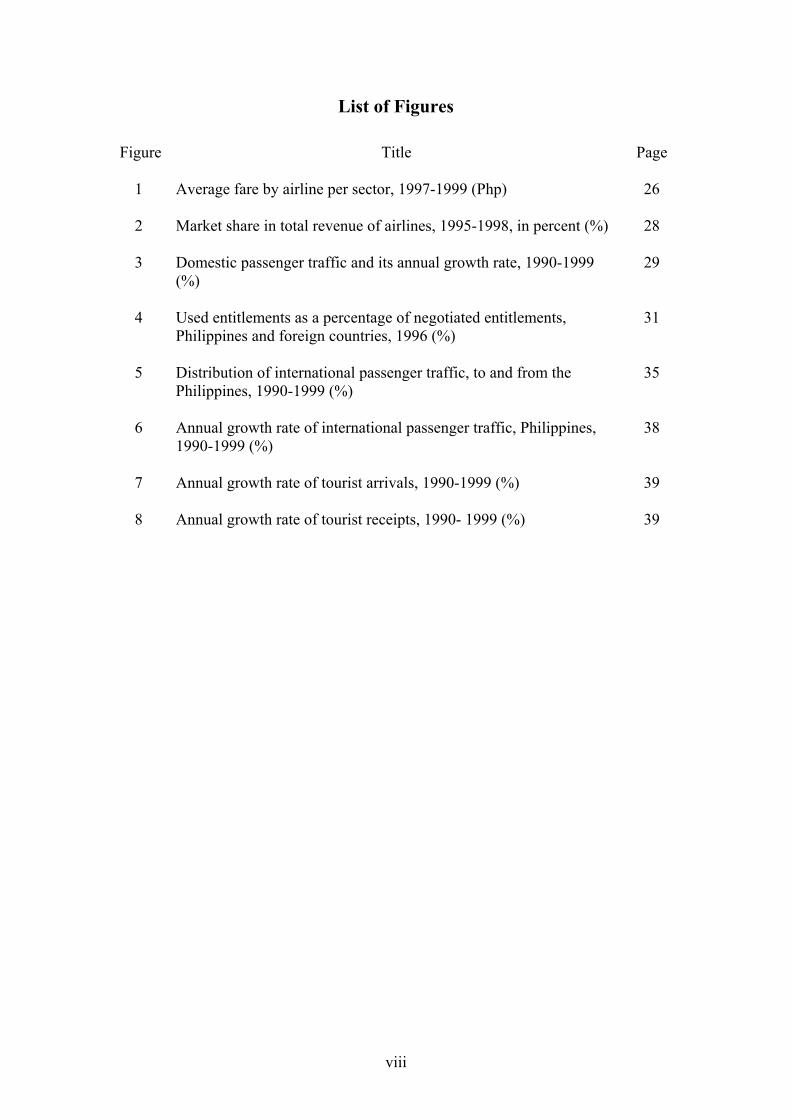
List of Figures
Figure Title Page
1 Average fare by airline per sector, 1997-1999 (Php)
26
2 Market share in total revenue of airlines, 1995-1998, in percent (%)
28
3 Domestic passenger traffic and its annual growth rate, 1990-1999 (%)
29
4 Used entitlements as a percentage of negotiated entitlements, Philippines and foreign countries, 1996 (%)
31
5 Distribution of international passenger traffic, to and from the Philippines, 1990-1999 (%)
35
6 Annual growth rate of international passenger traffic, Philippines, 1990-1999 (%)
38
7 Annual growth rate of tourist arrivals, 1990-1999 (%)
39
8 Annual growth rate of tourist receipts, 1990- 1999 (%)
39
ix
List of Appendices
Appendix Table Title Page
1 List of domestic airports, by type
46
2 Passenger load factor per airline, by sector, 1995-1999 (%)
47
3 Percentage distribution of seat capacity, by major routes, by airlines, 1995-1999 (%)
48
4 Growth rate of passenger traffic per sector, per airline, 1995-1999 (%)
49
5 Measure of degree of competition, per points served, 1990-1999
50
6 PAL’s major destination points, 1990, 1995, 1999
51
7 Spearman rank correlation test for Herfindahl- Hirschman Index and market share to tourist arrival, 1995
52
8 Spearman rank correlation test for Herfindahl- Hirschman Index and market share to tourist arrival, 1999
53

1
The State of Competition and Market Structure of the Philippine Air Transport Industry*
Myrna S. Austria** 1. Introduction Until the late 1970s, air transport throughout the world was a highly regulated industry, both domestically and internationally. There are several reasons advanced for government regulation. The widely held view is that governments traditionally considered air transport as a quasi public utility since the returns from the industry are not limited to those accruing directly to the industry itself, but includes external benefits to the wider economy (Hanlon, 1996). The industry is regarded as (i) an instrument to promote national interests like trade, investment and tourism; (ii) a source of foreign exchange; or (iii) simply a source of prestige and symbol. To avoid the conflict that may arise from the differing objectives of the government (national interests) and the airlines (commercial), governments conferred monopolies to their national airlines. This is the reason why all countries, with the exception of the US, had one flag carrier before deregulation. The airlines are then protected from competition through regulations.
Over the years, however, the merits of regulating the industry have been put into question. The absence of competition resulted to inefficiency, higher cost of travel and the inability of the industry to meet the increasing demand for air services as a result of the growing interdependence of global markets and communities. All these have increasingly put pressure for reform in the industry.
In the Philippines, reforms in the industry were slowly introduced in 1995.
Nevertheless, there is a growing perception that the country’s air transport services, particularly the international air transport services, have not improved. This paper examines the country’s regulatory and policy regimes and their effects on the state of competition and market structure of the industry. The scope of the study, however, is limited only to scheduled air services, i.e. freight and chartered flights are excluded.
The paper is organized as follows: Section 2 examines the applicability of the
contestability of markets to the air transport industry. Section 3 is a discussion on the regulatory framework that governs the operation of the global air transport, including the reforms that are being made in the industry. The policy and regulatory regimes of the Philippines are then discussed in Section 4, followed by their effects on the state of competition and market structure of the industry, both domestic and international,
*This study was made possible through the funding support from the Philippine APEC Study Center Network (PASCN). ** Senior Research Fellow, Philippine Institute for Development Studies and Project Director, PASCN Secretariat. The author wishes to thank Mr. Joselito P. Supangco for his comments and suggestions on an earlier draft of the paper. The excellent research assistance provided by Ms Dorothea C. Lazaro is also gratefully acknowledged.
2
in Section 5. The implications of the deregulation on the role of the Civil Aviation Board (CAB) are briefly examined in Section 6. Section 7 identifies areas that need to be addressed in the implementing guidelines of EO 219. Section 8 identifies areas where competition policy and regulations should be defined to introduce competition where there is none and to ensure that competition where it exists is effective. The summary and conclusions are presented in Section 9. 2. Contestability of Markets: Its Applicability to the Air Transport Industry The literature on contestability of markets points to the importance of the threat of competition, as distinct from actual competition, in enforcing good behavior and conduct among firms in an industry (Hanlon, 1996). This kind of market is characterized by the following: (i) there are no barriers to entry, i.e. no extra cost borne by new entrants that are not borne by the incumbents; (ii) there are no sunk costs, i.e. costs that cannot be recouped when a firm withdraws from the industry; (iii) the time for incumbents to change their prices in respond to the entry is longer than the time for the new entrant to make profits. According to this theory, firms in oligopolistic industries will still price at the same level as they would in a perfectly competitive market so long as the threat of competition exists. In other words, under this market, the incumbents can protect themselves from new competition only by behaving well. A contestable market offers to consumers and the society at large similar benefits from a perfectly competitive market (Baumol and Lee, 1991). Because of the threat of competition, firms cannot charge higher-than-competitive prices or earn excessive profits; any attempt to do so would invite new entrants to undercut the incumbents’ prices to a level that could still give them attractive return. Waste and inefficiency beyond that which are allowed by the current state of technology and level of knowledge are also avoided as these would be reflected in higher costs and prices, the presence of which would invite the entry of efficient firms. Likewise, predatory pricing and cross-subsidy pricing are prevented. Predation becomes unattractive since it can only be done if there is a prospect for making future profits large enough to recoup losses made when prices or profits were kept low to drive competitors or new entrants away; but then, excessive profits would invite entry. Cross-subsidy occurs when a firm charges a price below cost to particular group of customers and the loss is made up for by charging excessive prices to other customers. This is not feasible under a contestable market as the excessive price would invite new entrants who can sell at a lower price level. In effect, the new entrants are capturing from the incumbents the earnings that were previously used for cross-subsidy. Several studies, however, have shown that the air transport industry does not possess the characteristics of a contestable market (Hanlon, 1996) or at least, the industry is less contestable than had been thought at the time of its deregulation in the US (Baumol and Lee, 1991). As will be discussed in the next section, entry to the industry is not costless as there are barriers to entry, some of which are inherent to the incumbents, being the first mover in the industry. Also, while expenditures on aircraft is not a sunk cost in the same way that a fixed plant in manufacturing is since aircrafts can now be leased or they can be disposed of in second-hand markets, costs in
3
advertising and promotion cannot be recouped once the airline withdraws from the industry. Because of deregulation, greater importance is now given to advertising especially if an airline wants to establish an extensive network which is the way to becoming competitive in a deregulated environment. Finally, in a deregulated environment, at least for the domestic air industry, airfares can change anytime and with the advent of information technology, the change is automatically communicated to travel agencies through the computer reservation system. Despite this, however, the recent literature also shows that the contestability framework can be used to design policies and regulations that would enforce competitive behavior among firms when markets cannot do the job. As Baumol and Lee (1991:7) clearly pointed out,
“Note, however, that the analytical power of the theory does not depend on the ubiquity of contestability; indeed, its policy lessons apply primarily to industries that are not contestable, whose regulation can be aided by contestability theory, which provides norms of behavior to which the regulated firms can reasonably be held”.
What is described above is especially applicable when the cost structure of the industry is such that efficiency can only be attained if there are only few large firms in the industry. The air transport industry for one is naturally oligopolistic as there are important advantages in a large firm size in the industry. For example, there are economies of scope when airlines configure their networks in the hub and spoke pattern or when airlines make large-scale marketing campaigns of their network, a strategy that is more efficient than promotions of individual routes. It could also be that where traffic is low, a single carrier with multiple frequencies per week is more commercially viable and efficient than multiple carriers who operate one frequency each per week.
Hence, given the nature and structure of the industry, competition policies and regulations can be designed to allow airlines reap the benefits of their size advantages while at the same time protecting the consumers and smaller airlines from the threat of market power and oligopolistic behavior of large airlines.
3. Regulatory Framework for International Air Services Trade in international air services is unlike trade in goods. Trade in goods is done at all levels (bilateral, regional and multilateral) and where the WTO principle of most favored nation (MFN) is applied, every trading partner is treated equally. In contrast, trade in air services traditionally takes place under a common regulatory framework of bilateral air services agreements (ASAs) between pairs of countries. As will be discussed later, it was only recently that regional regulatory practices have evolved.
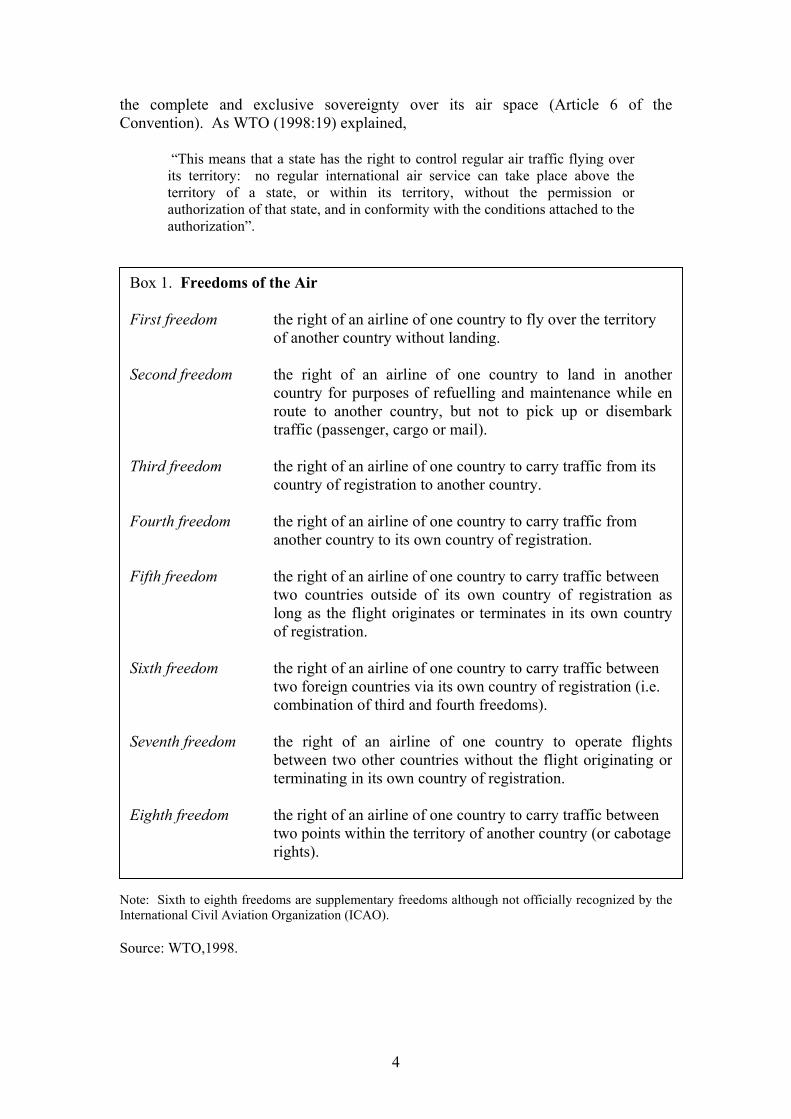
The International Conference on Aviation held in Chicago in 1944 (or simply the Chicago Convention of 1944) provided the foundation for the ASAs by establishing what is commonly referred to as freedoms of the air (Box 1) after it failed to establish a multilateral system in the provision of international air services. The framework of the bilateral system of ASAs is based on the principle that a country has
4
the complete and exclusive sovereignty over its air space (Article 6 of the Convention). As WTO (1998:19) explained,
“This means that a state has the right to control regular air traffic flying over its territory: no regular international air service can take place above the territory of a state, or within its territory, without the permission or authorization of that state, and in conformity with the conditions attached to the authorization”.
Note: Sixth to eighth freedoms are supplementary freedoms although not officially recognized by the International Civil Aviation Organization (ICAO). Source: WTO,1998.
Box 1. Freedoms of the Air First freedom the right of an airline of one country to fly over the territory
of another country without landing.
Second freedom the right of an airline of one country to land in anothercountry for purposes of refuelling and maintenance while enroute to another country, but not to pick up or disembarktraffic (passenger, cargo or mail).
Third freedom the right of an airline of one country to carry traffic from its country of registration to another country. Fourth freedom the right of an airline of one country to carry traffic from another country to its own country of registration. Fifth freedom the right of an airline of one country to carry traffic between
two countries outside of its own country of registration aslong as the flight originates or terminates in its own countryof registration.
Sixth freedom the right of an airline of one country to carry traffic between two foreign countries via its own country of registration (i.e. combination of third and fourth freedoms). Seventh freedom the right of an airline of one country to operate flights
between two other countries without the flight originating orterminating in its own country of registration.
Eighth freedom the right of an airline of one country to carry traffic between two points within the territory of another country (or cabotage rights).
5
To this day, this framework serves as the basis for the global air transport industry. Exchange of air service rights between countries is negotiated bilaterally based on the principle of reciprocity or ‘equality of opportunity’. This means that two countries agree to exchange air rights that would give their respective carriers equal access to each other’s markets.
ASAs set out the terms and conditions under which airlines of the contracting countries can fly. It is a ‘positive list’ of activities that an airline is allowed. Since a country has the exclusive sovereignty over its air space, anything for which there is no specific provision in the ASA is not allowed. Again, this is unlike agreements in trade in goods where traders are able to do anything that is not constrained by a ‘negative list’ of specific restrictions (Productivity Commission, 1998).
A standard ASA has the following provisions:
- Freedoms of air granted for the conduct of international air services; descriptions of the routes, including capacity (number of seats supplied) and frequency (number of flights), and type of aircraft to be used are usually contained in an annex to the ASA;
- Designation of carrier/s by each party and authorization by the other party of carrier/s to operate the agreed air services on the specified routes;
- Conditions of revocation or suspension of operating authorization, one of which is that designated carriers should be substantially owned and effectively controlled by the state or nationals of the contracting parties;
- Principles governing operation of agreed services, one of which is the guarantee of fair and equal opportunity for the designated airlines to operate the agreed services;
- Principles for regulating capacity and tariffs/fares; - Commercial rights or “soft rights” which include the following:
o Exemption from custom duties, excise tax and similar fees or charges by both parties for aircraft fuel, lubricants, spare parts and supplies used by the other airline of the other party;
o Obligation of contracting parties to extend to each other aviation security;
o Agreement to observe the laws and regulations of each party relating entry, clearance, immigration, passports, customs and quarantine;
o Rights for conversion and remittance of revenues; o Rights for airline representation and sales; o Rights to establish offices and entry and residence of non-national
personnel; - Principles/procedures for disputes settlement; - Right of each party to consult the other party for any modification/amendment
to the agreement; and - Right to terminate the agreement and the procedures for terminating the
agreement.
6
ASAs: Its Effects on Competition and Efficiency The bilateral framework has turned the international air transport industry into one of the most regulated industries in the world. Some features of the ASAs have restricted competition by limiting entry and constraining capacity thereby affecting the efficiency of airlines.
Capacity and frequency constraints. Capacity and frequency constraints have the potential to suppress competition in a route since designated carriers cannot operate additional services beyond that which is specified in the ASAs, even if there is unsatisfied demand. This unsatisfied demand could be the result of: (i) the inefficiency of other designated carrier/s in the route that cause them to operate below capacity; or (ii) an increase in traffic demand. A situation like this would enable airlines to charge airfares at a level higher than in a competitive market.
Furthermore, to the extent that the frequency, capacity and type of aircraft for
a particular route are predetermined in the ASAs, the airlines are prevented from making the least cost combination of these in providing services in that route. Hence, the cost of providing services may be higher (technical inefficiency) than if airlines are allowed to make their own decision based on market conditions, like any producer in all other industries (Productivity Commission, 1998). Likewise, to the extent that the choice of routes is limited by the ASAs, airlines are prevented from configuring or developing an efficient network (allocative inefficiency).
Nevertheless, the recent reforms in the ASAs have given designated airlines
some flexibility to change aircraft size and capacity depending on the estimated demand for a particular period or day.
Ownership and control restriction. The bilateral system requires that countries designate their carriers to fly the international routes. Designation of airlines by itself already limits the set of carriers that could compete in individual routes as carriers would not be granted access rights unless they are designated in the ASAs. In other words, the system has bestowed complete market power to designated airlines of bilateral partners while excluding non-designated airlines and third country carriers completely from the market.
However, designation of airlines is vital for technical and safety regulations
because the bilateral system requires that countries are accountable for maintaining the safety of their carriers. Given this, what really hinders competition is the requirement for designation. The bilateral system requires that designated airlines should be substantially owned and effectively controlled by the state or nationals of the bilateral partners. This restriction hinders the entry of foreigners from establishing airlines in countries other than their own.
Traditionally, most countries have a single “flag” carrier which traditionally
also, are state-owned. Single designation would have at most two carriers (one for each bilateral partner) operating in the routes and this creates potential for duopolistic pricing. However, with the recent trends on privatization of airlines and domestic deregulation, more and more countries are having a multiple designation system. Although multiple designation has increased competition in the individual routes, the

7
bilateral framework still limits competition to designated carriers of the bilateral partners. Where fifth or sixth freedom is granted, third country carriers provide an important source of competitive pressure to the routes.
In terms of efficiency, the local ownership requirement has a distorting effect
on the domestic capital market, especially in developing countries where the capital market is small. Since the airline industry is capital intensive, the capital market maybe too small to provide sufficient equity capital for the development of the airline industry. The insufficiency of capital may retard the development of the airline industry. It could also raises the cost of capital not only for the airline industry but also for other industries as well.
In the absence of equity capital, airlines would most likely resort to debt financing. In this sense, the restriction on local ownership limits the flexibility of airlines in their choice between equity and debt capital.
Cabotage. Foreign carriers are not allowed cabotage rights and hence, this
limits competition in the domestic market to domestic airlines. Structural Barriers to Entry Apart from the regulatory barriers arising from the bilateral system, there are structural barriers inherent to the characteristic of the international aviation industry (but which also apply to the domestic air industry). These structural barriers arise from first-mover advantages that give incumbent carriers substantial market power and unless addressed by the appropriate competition policies, they can result to anti-competitive practices (Warren et. al., 1998).
Economies of traffic density. This refers to the fall in average unit cost as the number of passengers traveling on a particular route increases. This is achieved if an airline adds flights in a route or seats on existing flights. If the incumbent airline is realizing economies of density in a route, potential entrants are deterred from entry by the choices available to them. That is, entry can be made either on a small scale but with a significant cost disadvantage or on a large scale that is likely to depress airfares significantly (Warren et. al., 1998).
Incumbent airlines possess some advantages that would prevent potential
entrants from achieving economies of density. One, incumbent airlines generally have established interlining agreements1 with other airlines that could feed connecting traffic into the route at issue. There are significant reductions in transfer costs available for passengers who prefer interline travel. Potential entrants would therefore have difficulty attracting this kind of passengers without interlining arrangements. But making interlining arrangements could also prove difficult and could put the potential entrants at a cost disadvantage. This would require potential entrants to either duplicate the incumbent’s existing arrangement or hire existing airlines who can provide feeder services. Most likely, those who can provide feeder 1 Interlining arrangement allows one airline to carry passengers on behalf of another airline. This type of arrangement becomes particularly important and strategic if an airline has extensive domestic network or if one of the points in the route is an international hub.
8
services are already committed to the incumbent airline and hence, would only be willing to shift loyalty if offered a higher price (Warren, et. al., 1998).
Two, for the business and first class passengers, who are price-insensitive and
considered high-yield2 for airlines, while there are several factors influencing their choice of an airline, what is more important is greater seat availability and greater options of flights, both of which an airline could only realize with increased frequency. Potential entrants cannot attract these passengers unless they can offer flights as frequent as the incumbent carriers.
Three, frequent flyer programs3 (FFP) of incumbent carriers also act as entry
barrier to potential entrants as these programs build passengers’ loyalty to the carriers offering them. Business travelers in particular are heavily influenced by their FFP membership in choosing the flights of a particular airline. A survey done in the US among travel agents shows that more than half of the respondents reported that travelers always or almost always chose their flights in order to build FFP mileage points (Hanlon, 1996). Hence, potential entrants would have difficulty attracting passengers who are already members of the incumbent carrier’s FFP.
Access to essential inputs. Potential entrants could also be deterred from
entry in international routes because of the ability of the incumbent carrier to forestall a competitor’s access to auxiliary services essential in the provision of air services. In many countries, the incumbent airline is also the incumbent supplier of ground handling and aircraft repair and maintenance services. Hence, the incumbent airline can discriminate against new entrants in terms of pricing and quality of service. Some airports, however, have multiple purveyors of groundhandling services that compete with each other for airline customers.
Likewise, incumbent carriers can prevent potential entrants’ access to landing
slots or airport gates since as incumbents, they have the advantage of possessing (as assigned by airport authorities) the peak landing slots4 or best-positioned gates in most airports. The commercial value of slots varies considerably. Slots at the beginning and end of the day are convenient for business, for which business and first class seats are much in demand. As traffic increases and with airports being unable to expand their operations for physical reasons, slots become valuable physical resource. Without access to the priority slots or gates, new entrants would have difficulty attracting business class passengers and perishable freights, both of which are time-sensitive. Since often there is only one airport in most destinations, potential entrants are left with no alternative. Hence, this enhances the power of the incumbent airline to foreclose potential entrants’ access to these inputs.
2 Yield refers to revenue per unit of traffic. 3 Frequent flyer program is a purchase incentive plan which rewards the traveler for repeat patronage of the services of a particular airline. For each ticket bought, a traveler accumulates mileage points according to the distance traveled and class of ticket bought. The traveler can then exchange the mileage points for rewards in the form of free or discount tickets, upgrades from one class of travel or another and other benefits (Hanlon, 1996). 4 Landing slots refer to the specific time allocated for an aircraft to land and take off. These are assigned on a first come first serve basis.

9
The use of the computer reservation system5 (CRS) also has the potential to foreclose potential entrants from the market for ticket sales. When they were first developed in the 1960s and 1970s, CRSs were considered simply as a device to save on time and labor in handling the growing number of flight reservations (Hanlon, 1996). Because airfares and entry to routes were still then highly regulated, airlines did not see any market power advantages from developing their own CRS and even made their system available to travel agencies.
However, with the deregulation in the 1980s, passengers have many
alternatives in terms of airlines, flights and fares in a particular route which any travel agency hooked to a CRS can screen through. About 75 percent of flights made through CRS are made from the first screen page of the CRS (Hanlon, 1996). Hence, access to the first screen page became an important source of competition among airlines. Airlines owning or controlling CRS can therefore program the computer in such a way that their flights appear on the first page of the screen while a competitor’s flights appear on a later screen page.
Potential entrants wishing to sell ticket on its flight through the CRS are
placed at a cost advantage since they have to spend to include their flights in the CRS affiliated with the incumbent carriers; and since CRS usually give priority screen listing to their developers’ own-flights or incumbent carrier’s flights, potential entrants have to give travel agencies incentives big enough for them to scroll through the flights of incumbent carriers or owners of CRSs (Warren, 1998; Hanlon, 1996).
Reforms in the Air Transport Industry
The inflexibility of the bilateral regulatory system to market conditions, together with the structural barriers to entry, has rendered the international air industry inefficient. The inefficiency of the system and the growing density of air traffic as a result of the increasing integration of economies leading to the expansion of business-related travel within and among countries have created intense pressure for liberalization and deregulation. The main goal of the reforms was to reduce the restrictions on competition in order to increase the efficiency of the industry.
The reform process has occurred at all levels: unilateral, bilateral, regional and
multilateral. Nonetheless, the reforms are still in their limited form. They have focused more on removing the regulatory barriers and less of the structural barriers. And for the regulatory reforms, most are limited to the removal of restrictions on market access and frequency, i.e. all other restrictions are retained; and they discriminate against third countries in bilateral agreements or against non-members in regional/multilateral agreements.
The unilateral reforms were directed only to the domestic airline industry.
The reforms came in the form of deregulation and privatization of government-owned airlines. Domestic deregulation first occurred in the United States in 1978 (US ATA,
5 Computer reservation system contains information about carriers’ schedules, availability, fares and fare rules, for which reservations can be made or tickets may be issued.
10
1999), followed by Europe in the late 1980s and Australia and New Zealand in the early 1990s (Productivity Commission, 1998).
In the 1990s, there has been an increasing trend towards the liberalization of
the bilateral agreements. The most common of these, is the bilateral “open skies agreement” of the United States with 35 individual countries that includes Brunei, South Korea, Singapore, Malaysia and Taiwan in Asia (Findlay and Nikomborirak, 1999). Under the agreement, the US and its bilateral partners can fly the third, fourth and fifth freedoms without restrictions, although the latter is subject to the approval of the third country. There is also the Single Aviation Market for Australia and New Zealand where carriers of both countries have unrestricted rights to fly third, fourth and eighth freedoms. The agreement also allows for greater flexibility in foreign ownership as carriers of both countries could be majority-owned and effectively controlled by nationals of either Australia or New Zealand or both (Productivity Commission, 1998).
At the regional level, the EU Common Aviation Market is the most significant
(UNCTAD, 1999). Under the arrangement, the EU member states have, over a period of three phases (1988, 1990 and 1992), established a single market for intra-Europe air services. The reform is more comprehensive as it covers both regulatory and structural barriers. Carriers of member states can fly without restrictions anywhere within the single market. Restrictions on local ownership were also dismantled as any national of EU can establish an airline anywhere within the single market. Common rules on access on ground handling, airport slots, and computer reservations system were also established. But traffic rights between EU members and third countries continue to be governed by bilateral agreements.
Still at the regional level, the Andean Pact of 1991 is also prominent
(UNCTAD, 1999). This covers the open skies agreement among Bolivia, Colombia, Ecuador, Peru and Venezuela where airlines of member states could fly without restrictions on intra-zone traffic.
In 1997, the APEC Transportation Working Group has identified areas for
possible liberalization: air carrier ownership and control, fares/tariffs, air freight, multiple airline designation, charter services, airline cooperative arrangements and market access. In 1999, APEC Leaders committed to identify steps to liberalize air services in the above areas in accordance with the Bogor goals (APEC Leaders Statement, 1999). However, no progress has been achieved so far.
At the multilateral level, reforms are set out in the Annex on the Air Transport Services in the WTO-General Agreement on Trade in Services (GATS). The reforms cover some aspects of the structural barriers to entry, such as aircraft repair and maintenance, selling and marketing of air transport services, and computer reservation system (WTO, 1998). The Annex requires that access to these areas be granted to carriers of WTO members following the principles of national treatment and most favored nation (MFN). The Annex, however, has stayed away from market access, i.e. the agreement does not cover traffic rights, however granted; or services directly related to the exercise of traffic rights6. Nonetheless, the Annex has yet to generate an
6 The Annex does not contain a definition of “services directly related to the exercise of traffic rights”.
11
impact as most WTO members have been granted exemptions from implementing them. It is up for review in 2000. The results of studies on the effects of the reform have been mixed, however. For Australia, the domestic deregulation reduced the average price of air travel by 1 percent and improved the quality of service (in terms of increased flight frequency, expansion of frequent flyer programs and airport club lounges) as a result of the entry of more airlines in the domestic industry. The effects of introducing one more Australian airline in the Asian routes shows an increase in net economic welfare (measured by changes in consumer surplus and airline profits) in Australia and all affected routes (Productivity Commission, 1998). The US experience in domestic deregulation also shows that airfares have fallen in real terms (USATA, 1999) but it was less clear that this was the result of the deregulation (Hanlon, 1996). However, after five years of deregulation, fierce competition pushed a number of airlines into bankruptcy or merger, making the industry marginally more oligopolistic than it was before deregulation. 4. Policy and Regulatory Regimes of the Philippine Air Transport Industry Policy making for the Philippine civil aviation industry started with Republic Act No. 776, known as the Civil Aeronautics Act of the Philippines, passed in 1952. The Act established the policies and laws governing the economic and technical regulation of civil aeronautics in the country. It laid down the guidelines for the operation of two regulatory organizations, the Civil Aeronautics Board (CAB) for economic regulation and the Civil Aeronautics Administration7 (CAA) for technical regulation. The powers and functions of the two bodies were premised on the policies set out for the industry in the Act, two of which dealt in the area of competition as follows:
• Promotion of adequate, economical and efficient service by air carriers at
reasonable charges, without unjust discriminations, undue preferences or advantages, or unfair or destructive competitive practices (Section 4d); and
• Competition between air carriers to the extent necessary to assure the sound development of an air transportation system properly adapted to the need of the foreign and domestic commerce of the Philippines, of the Postal Service, and of the National Defense (Section 4e).
In 1959, the government recognized, as vital for its security and defense and for the enhancement of its international commerce, the need to maintain its own international air operations. However, the attainment of this objective required a national carrier. Hence, Republic Act No. 2232 was passed in June 1959 designating the Philippine Airlines (PAL) as the country’s national flag carrier. Prior to this, the conduct of trade in air services between the Philippines and other countries was exclusively provided by foreign airlines.
7 Presently known as the Air Transportation Office of the Department of Transportation and Communication.

12
One-airline policy, 1973-1987. A major shift in policy came with the passing of Letter of Instructions No. 151 and 151A in December 1973 establishing a one-airline policy in both the international and domestic operations. The two LOIs in effect repealed Section 4 (e) of RA 776. Two airlines (Filipinas Orient Airlines and Air Manila Inc.) were subsequently closed, and PAL, being the flag carrier, had a virtual monopoly of the country’s air transport industry.
The monopoly by PAL was exposed to the possibility of competition when, in June 1978, PAL was given a new franchise for its operations under Presidential Decree No. 1590 which had a provision that the franchise was not to be interpreted as an exclusive grant of privileges to PAL. Despite this provision, however, no other airline joined the industry. Furthermore, another presidential decree (PD No. 1466), also implemented in June 1978, reserved certain categories of traffic to PAL. This includes the transport of persons or cargoes that use government funds or loans and credits that are guaranteed by the government. Hence, even if new players had entered the industry, PAL would have had retained its monopoly over this category of air traffic.
Accreditation system, 1988-1994. The first attempt at reform came during
the Aquino administration who adhered to the policy of allowing a healthy and regulated competition among the airlines in the country. Executive Order No. 333 was issued in August 1988 revoking the one-airline policy. With the change in policy, a number of companies/individuals applied for permits for scheduled domestic combination of passenger and cargo services. Hence in 1989, CAB introduced an accreditation system defining the guidelines for the grant of permits. To a very large extent, the guidelines under the accreditation system defined the country’s domestic air transportation policy as follows:
• Domestic air services are classified into three: (i) rural service – air
transportation to and from rural airports and other ATO rated airports; (ii) secondary service – air transportation between secondary airports, or between secondary and trunkline airports; and (iii) trunkline service – air transportation between trunkline airports (See Appendix 1 for the list of airports falling under the 3 classifications);
• The route structure of an airline shall be that at least 5 percent and 25 percent
of the total monthly available seat kilometer of the proposed base operations shall be allotted for rural and secondary services, respectively;
• Each operator shall provide at least three scheduled services a week on each
trunkline, secondary and rural route; and
• Only two operators shall be allowed to operate on a base initially. However, more operators are allowed if deemed necessary based on traffic demand.
While the above accreditation system for domestic air services was definitely
more liberal than the one-airline policy, the guidelines were still very restrictive. Airline operators were not given full freedom in determining the routes and frequencies they want to fly, both of which depend on traffic demand and profitability. Also, fares are still regulated by CAB.
13
The accreditation system, however, did not succeed in bringing in new players in the industry. The failure was not necessarily due to the system’s restrictive character but to the legislative issue that arose as to the constitutionality of the CAB issuing a permit to an individual or entity to engage in air commerce without the prior granting of a legislative franchise to the person or entity concerned by the Congress. This issue created uncertainty among the domestic operators who do not have a franchise and a hesitation on those wanting to join the industry knowing that the grant of a franchise by the Congress is a lengthy and time consuming process plus the fact that one cannot be certain that a franchise can be granted (DOTC, 1992). In the end, the legislative issue restricted the growth of the industry.
The issue, however, has now been settled by the Court of Appeals which
finally decided that a legislative franchise is not a pre-requisite for the issue of a permit by CAB. On the surface, this ruling of the Court of Appeals looks good as it facilitates the entry of new players in the industry. However, the possession of a legislative franchise by an airline would entitle it to enjoy certain tax concession. This court ruling therefore does not level the playing field for all players in the industry.
Liberalization and deregulation, 1995-present. For 22 long years, PAL was
flying solo. But at the same time, the pressure for the deregulation of the industry was also building up. Many sources contributed to the pressure but the inefficiencies of PAL’s service and its financial losses intensified the pressure and brought the issue to a head. Hence, the supremacy of PAL was finally challenged with the passing of Executive Order 219 in 1995 under the Ramos administration.
The EO established the domestic and international civil aviation liberalization
policy of the country. The change in policy came in response to the government’s “thrust to expand investment and trade, and increase access for Filipino as well as foreign passengers” and hence the “need for the Philippines to improve air service availability, quality and efficiency through exposure to foreign markets and competition” (EO 219, paragraph 3). The policy is also in line with the 1987 constitutional mandate prohibiting monopolies when the public interest requires.
For domestic air transportation:
Restrictions on domestic routes and frequencies were eliminated and so were government controls on rates and charges as follows:
• A minimum of two operators in each route/link shall be encouraged.
Routes/links presently serviced by one operator shall be open for entry for additional operators (Section 2.1). Operators are also free to leave unprofitable/uneconomical routes.
• Airfares shall be deregulated for routes/links operated by more than one
carrier. However, for routes/links serviced by a single operator, airfares will continue to be regulated (Section 2.2). EO 219 signaled the entry of new airlines in the industry. As will be seen in
the next section of the paper, the above provisions of EO 219 make the domestic air
14
industry a market-driven industry, with customer demand determining the levels of service and price. For international air transportation:
Areas where there was a significant change in policy include the number of
carriers that can be designated as the country’s flag carriers and the basis for the negotiation of traffic rights and routes.
• At least two international carriers shall be designated official carrier(s) for the
Philippines. If the designated carrier(s) do not service the total frequency entitlement of the Philippines under existing Air Services Agreements, additional carrier(s) may be designated to operate the unused frequencies (Section 1.1);
• Exchange of traffic rights and routes with other countries shall be based on
national interest and reciprocity between the Philippines and other countries (Section 1.2);
• Exchange of third and fourth freedoms will be based on reciprocity and value
for the Philippines. Fifth freedom is secondary and supplemental to third and fourth freedom traffic, except that the CAB may grant fifth freedom rights to promote the development of routes and destinations. Special flights may be authorized if the designated carriers fail to accommodate a route/link traffic demand (Section 1.3).
The policy is definitely more liberal than what it was before where there was
only one designated flag carrier (PAL); and the interests of the flag carrier, not the interests of the country, were the primary consideration in the negotiation of traffic rights with other countries. However, the implementing rules and regulations (IRR) of EO 219 have not yet been formulated five years since the issuance of the EO.
In 1999, the Estrada administration, through Civil Aviation Consultative
Council Resolution No. 001-98, launched a policy on progressive liberalization of bilateral air services agreements. But what “progressive liberalization” means has not been defined nor the guidelines by which this new policy should be fleshed out. Progressive liberalization would reinforce EO 219 if defined as the gradual reduction of regulations within a set time frame, e.g. programmed increase of seat capacity, routes or frequency.
The absence of the implementing guidelines of EO 219 and of a clear
definition of what progressive liberalization means creates a gap between policy pronouncement and policy implementation. This is evident in the perception in the industry that the re-negotiation of existing Philippine ASAs does not reflect the change in policy. Worse yet, there is a growing perception that the government has reverted to the old days of protectionist policies. This was best illustrated with the dispute over the RP-Taiwan ASAs in 1999 and 2000 where the government’s stance on the issue gave the impression that the country’s aviation policy still predominantly

15
aims to ensure the viability of PAL.8 It appeared like the interests of PAL continue to take precedence over the more important elements of national interest. Hence, unless the gap in policy pronouncement and implementation is addressed, the development of the country’s international air transport industry is left with no clear direction to follow.
Privatization, 1992-1999. Although originally owned by private
entrepreneurs since its establishment in 1941, PAL was under government control from 1977-1991. The move towards the privatization of PAL first came in 1992 in line with the Aquino administration’s policy of privatizing state-owned companies. PR Holdings won the bidding for 67 percent share of the company in that year. By 1999, Lucio Tan held 90 percent ownership of PAL.
Nonetheless, privatization, without regard for effective competition, will only
lead to the privatization of monopoly rents.
What remains regulated?
There is really not much liberalization going under EO 219. Several areas have remained restricted or regulated.
Capacity and frequency. The country’s ASAs put limits to the capacity and frequency that the designated carriers of both contracting countries can use. The limits are specified in terms of the number of flights and seats that the designated carriers can operate each week. Since capacities and frequencies are predetermined, any change in market conditions that require changes in the needed capacities and frequencies would be subject to renegotiation. Under EO 219, the grant of frequencies or increase in existing frequencies is the sole prerogative of CAB subject to the confirmation of the Office of the President.
Tariffs and fares. CAB still regulates the fares, rates and other charges. The
country’s ASAs adopt dual approval, i.e. fares are approved by the aviation authorities of the bilateral partners.
Freedom of rights granted. Only the first four freedoms are granted, with
limitations on capacity and frequency on the third and fourth freedom. Fifth freedom is granted but this is also limited in terms of the third countries to which the freedom applies. The sixth and seventh freedoms are not allowed.
Ownership and effective control. Designated carriers are required to be
substantially owned and effectively controlled by the state or nationals of the contracting countries. The constitution requires 60 percent domestic equity.
Cabotage. Foreign airlines are not allowed to fly the country’s domestic
routes. 8 This is based on the 20 January, 2000 letter of the Manila Economic and Cultural Office (MECO) to the Taipei Economic Cultural Office (TECO) where the former requested the latter to “kindly consider the difficulties facing Philippine Airlines and self-restrain the capacity on the route between Taipei and Manila.”

16
City/point designation. Since 1995, CAB has introduced open points in the route schedule, unless a separate route capacity to points outside Manila is specified in the ASA. For the latter, however, unused entitlements in a particular route cannot be used in another route even if the entitlements in the latter are not enough to meet the traffic demand.
The above regulations have remained, not because the government is restricted by the bilateral system, but because the government has not made any reform in its bilateral ASAs. The developments over the past 30 years in other countries point to the reduction of government control in each of the above areas (WTO, 1998). For capacity determination, the move has been away from predetermination to free determination where bilateral partners agree not to impose unilateral restrictions on the volume of traffic, frequency of service or type of aircraft. For airfares, the move has been away from dual approval to dual disapproval where the airfares enter into force unless disapproved by the aviation authorities of the bilateral partners. The development of open skies agreements is a move towards suppression of capacity and tariff clauses in the ASAs. In place of regulations, these countries use competition policy instruments to counter predatory practices, abuse of dominant position and other unfair competitive behavior of airlines. 5. Regulatory and Policy Regimes: Their Effects on the State of Competition
and Market Structure
Domestic Air Services For 22 long years, PAL was flying solo in the country’s domestic airways. The monopoly created so much inefficiency that the quality of service was not tailored to the demand. In other words, the airline was not conscious to keep its service to certain standards to keep its customers (and attract even more) since it knows that the latter had no alternative. Hence, delays and troubles of PAL flights were more of the rule than the exception. This image created another meaning for the company’s acronym, “Plane Always Late”. Left with no choice, travelers have to contend themselves with whatever PAL can offer.
Furthermore, PAL was beset with financial woes; and being a government-run corporation, the company continuously relied on government subsidies for its operations. The mismanagement of PAL and the inefficiency in the provision of air services was a clear waste of resources that could have been used productively elsewhere in the economy. Also, the riding public and the industries that rely for air services for the transport of their products have suffered.
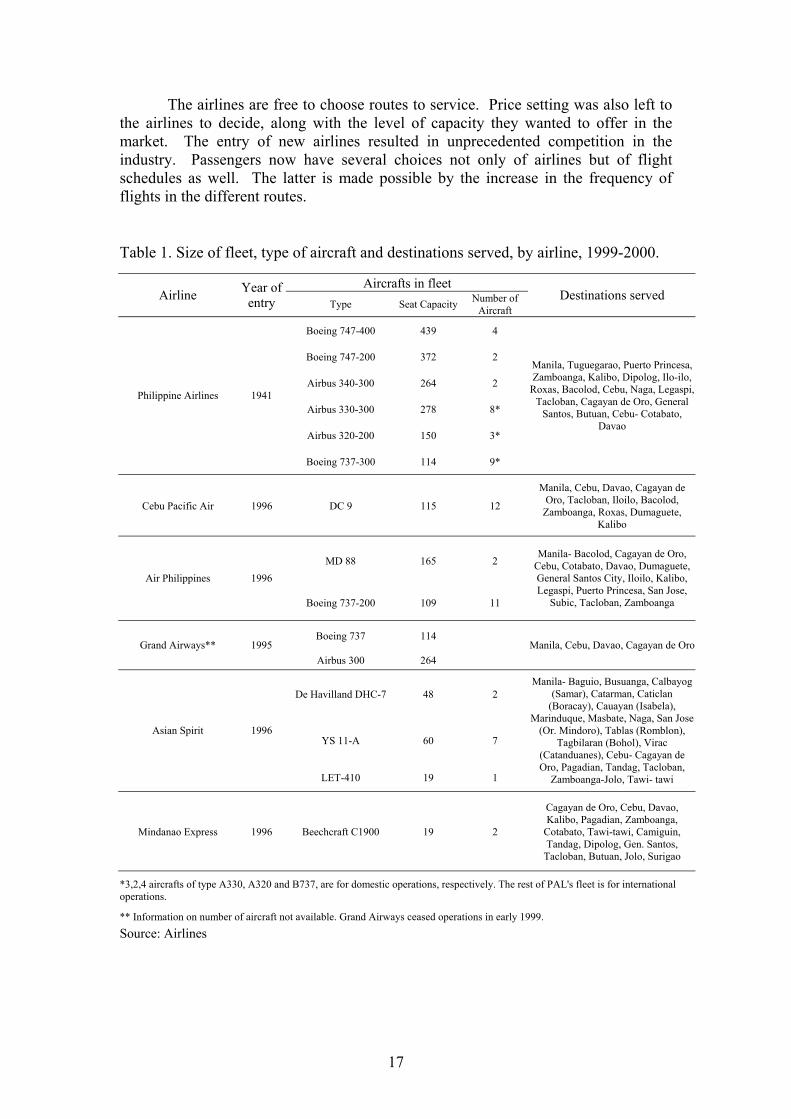
Today’s domestic air transport industry is radically different from what it was prior to the deregulation in 1995. EO 219 made possible the entry of five new players in the industry (Table 1). Each company adopted specific marketing strategies that were geared towards making a difference in the market. For example, Cebu Pacific Air is known for its “low fare, great value” and GrandAir for its “hot meals and on time service”.
17
The airlines are free to choose routes to service. Price setting was also left to the airlines to decide, along with the level of capacity they wanted to offer in the market. The entry of new airlines resulted in unprecedented competition in the industry. Passengers now have several choices not only of airlines but of flight schedules as well. The latter is made possible by the increase in the frequency of flights in the different routes.
Table 1. Size of fleet, type of aircraft and destinations served, by airline, 1999-2000.
Aircrafts in fleet Airline Year of
entry Type Seat Capacity Number of Aircraft
Destinations served
Boeing 747-400 439 4
Boeing 747-200 372 2
Airbus 340-300 264 2
Airbus 330-300 278 8*
Airbus 320-200 150 3*
Philippine Airlines 1941
Boeing 737-300 114 9*
Manila, Tuguegarao, Puerto Princesa, Zamboanga, Kalibo, Dipolog, Ilo-ilo,
Roxas, Bacolod, Cebu, Naga, Legaspi, Tacloban, Cagayan de Oro, General
Santos, Butuan, Cebu- Cotabato, Davao
Cebu Pacific Air 1996 DC 9 115 12
Manila, Cebu, Davao, Cagayan de Oro, Tacloban, Iloilo, Bacolod,
Zamboanga, Roxas, Dumaguete, Kalibo
MD 88 165 2 Air Philippines 1996
Boeing 737-200 109 11
Manila- Bacolod, Cagayan de Oro, Cebu, Cotabato, Davao, Dumaguete, General Santos City, Iloilo, Kalibo, Legaspi, Puerto Princesa, San Jose,
Subic, Tacloban, Zamboanga
Boeing 737 114 Grand Airways** 1995
Airbus 300 264 Manila, Cebu, Davao, Cagayan de Oro
De Havilland DHC-7 48 2
YS 11-A 60 7 Asian Spirit 1996
LET-410 19 1
Manila- Baguio, Busuanga, Calbayog (Samar), Catarman, Caticlan
(Boracay), Cauayan (Isabela), Marinduque, Masbate, Naga, San Jose
(Or. Mindoro), Tablas (Romblon), Tagbilaran (Bohol), Virac
(Catanduanes), Cebu- Cagayan de Oro, Pagadian, Tandag, Tacloban,
Zamboanga-Jolo, Tawi- tawi
Mindanao Express 1996 Beechcraft C1900 19 2
Cagayan de Oro, Cebu, Davao, Kalibo, Pagadian, Zamboanga,
Cotabato, Tawi-tawi, Camiguin, Tandag, Dipolog, Gen. Santos,
Tacloban, Butuan, Jolo, Surigao
*3,2,4 aircrafts of type A330, A320 and B737, are for domestic operations, respectively. The rest of PAL's fleet is for international operations.
** Information on number of aircraft not available. Grand Airways ceased operations in early 1999.
Source: Airlines
18
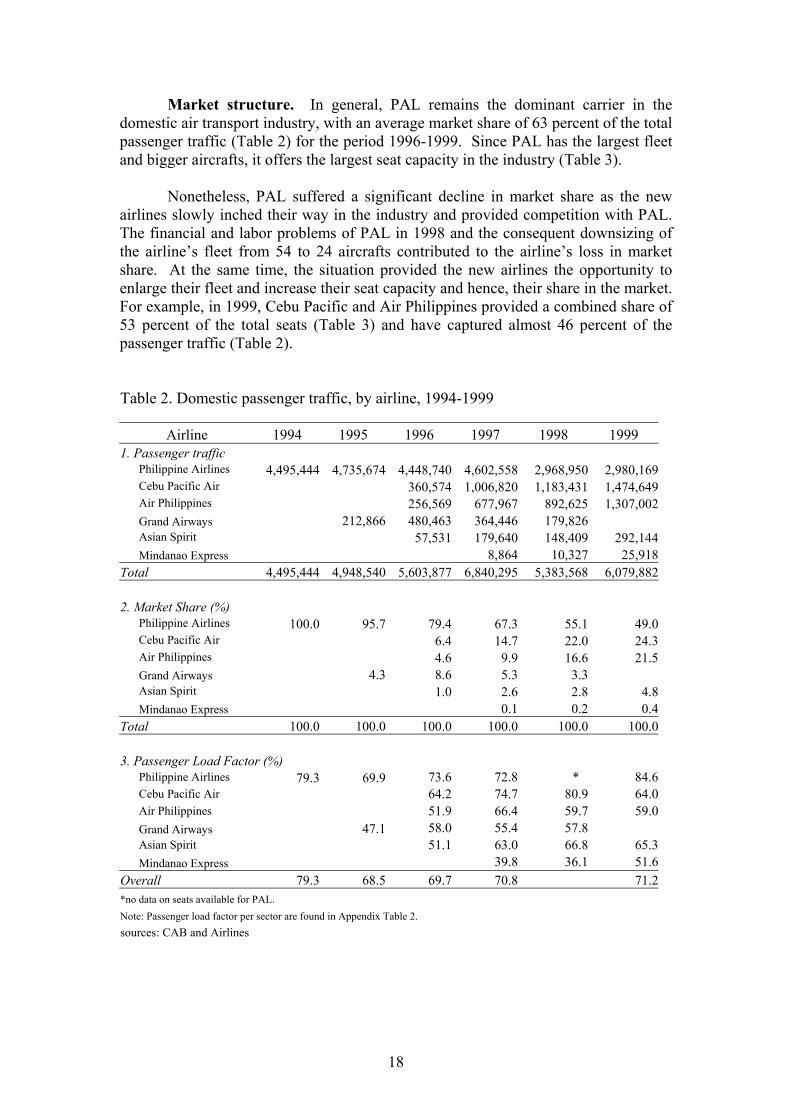
Market structure. In general, PAL remains the dominant carrier in the domestic air transport industry, with an average market share of 63 percent of the total passenger traffic (Table 2) for the period 1996-1999. Since PAL has the largest fleet and bigger aircrafts, it offers the largest seat capacity in the industry (Table 3).
Nonetheless, PAL suffered a significant decline in market share as the new
airlines slowly inched their way in the industry and provided competition with PAL. The financial and labor problems of PAL in 1998 and the consequent downsizing of the airline’s fleet from 54 to 24 aircrafts contributed to the airline’s loss in market share. At the same time, the situation provided the new airlines the opportunity to enlarge their fleet and increase their seat capacity and hence, their share in the market. For example, in 1999, Cebu Pacific and Air Philippines provided a combined share of 53 percent of the total seats (Table 3) and have captured almost 46 percent of the passenger traffic (Table 2).
Table 2. Domestic passenger traffic, by airline, 1994-1999
Airline 1994 1995 1996 1997 1998 1999 1. Passenger traffic
Philippine Airlines 4,495,444 4,735,674 4,448,740 4,602,558 2,968,950 2,980,169 Cebu Pacific Air 360,574 1,006,820 1,183,431 1,474,649 Air Philippines 256,569 677,967 892,625 1,307,002 Grand Airways 212,866 480,463 364,446 179,826 Asian Spirit 57,531 179,640 148,409 292,144 Mindanao Express 8,864 10,327 25,918
Total 4,495,444 4,948,540 5,603,877 6,840,295 5,383,568 6,079,882 2. Market Share (%)
Philippine Airlines 100.0 95.7 79.4 67.3 55.1 49.0 Cebu Pacific Air 6.4 14.7 22.0 24.3 Air Philippines 4.6 9.9 16.6 21.5 Grand Airways 4.3 8.6 5.3 3.3 Asian Spirit 1.0 2.6 2.8 4.8 Mindanao Express 0.1 0.2 0.4
Total 100.0 100.0 100.0 100.0 100.0 100.0 3. Passenger Load Factor (%)
Philippine Airlines 79.3 69.9 73.6 72.8 * 84.6 Cebu Pacific Air 64.2 74.7 80.9 64.0 Air Philippines 51.9 66.4 59.7 59.0 Grand Airways 47.1 58.0 55.4 57.8 Asian Spirit 51.1 63.0 66.8 65.3 Mindanao Express 39.8 36.1 51.6
Overall 79.3 68.5 69.7 70.8 71.2 *no data on seats available for PAL. Note: Passenger load factor per sector are found in Appendix Table 2. sources: CAB and Airlines

19
While the number of players has remained the same since the industry was deregulated, the degree of competition has increasingly intensified. The inverse of the Herfindahl-Hirschman Index9 (HHI), which is used as a measure of effective competition, shows that the number of effective competitors has been increasing since 1996 (Table 4). Table 3. Seat capacity per airline, 1990, 1994-1999
Airline 1990 1994 1995 1996 1997 1998 1999 Seat Capacity
Philippine Airlines 5,543,213 5,670,362 6,773,007 6,044,489 6,323,605 - 3,523,047 Cebu Pacific Air - - - 561,240 1,348,527 1,462,137 2,303,751 Air Philippines - - - 494,764 1,021,565 1,494,297 2,217,060 Grand Airways - - 452,400 828,072 657,817 311,030 - Asian Spirit - - - 112,524 285,051 222,100 447,730 Mindanao Express - 22,273 28,588 50,187 Total 5,543,213 5,670,362 7,225,407 8,041,089 9,658,838 3,518,152 8,541,775
% Distribution
Philippine Airlines 100.0 100.0 93.7 75.2 65.5 41.2 Cebu Pacific Air 7.0 14.0 41.6 27.0 Air Philippines 6.2 10.6 42.5 26.0 Grand Airways 6.3 10.3 6.8 8.8 Asian Spirit 1.4 3.0 6.3 5.2 Mindanao Express 0.2 0.8 0.6 Total 100.0 100.0 100.0 100.0 100.0 100.0 100.0
Notes: (1) There are no available data for PAL for 1998; 1999 data for PAL includes up to 3rd quarter only. (2) Percentage distribution of seat capacity per airline, by major route are found in Appendix Table 3. Sources: CAB and Airlines. Table 4. Measure of the degree of effective competition, domestic air industry, 1996-1999
Year Herfindahl-Hirschman Index (HHI) 1/HHI
1995 0.9177 1.09 1996 0.6439 1.55 1997 0.4878 2.05 1998 0.3818 2.62 1999 0.3476 2.88
Note: Index is based on market share.
9 The index is measured as the sum of the squares of the market shares. It is compared with the ratio 1/n where n is the number of players in the industry. The higher the index relative to 1/n, the less competitive the industry is. The inverse of the index gives the number of equal sized competitors that would provide a degree of competition equivalent to that actually observed in the market share data. Hence, it is used as a measure of the number of effective competitors.

20
The deregulation of the industry resulted to the establishment of niche markets. The bigger players, as defined by the size of their fleet and aircrafts (Grand International Airways, Cebu Pacific Air and Air Philippines), are concentrating on the major trunklines where traffic demand is heavier while the smaller airlines (Asian Spirit and Mindanao Express) are flying the secondary and tertiary/rural routes where traffic demand is lighter (Table 1). PAL was flying all three types of routes until 1998 when it abandoned most of its secondary/tertiary routes because of the downsizing of its fleet and as will be discussed later, cross-subsidization, which used to characterize PAL’s operation of the different types of routes, was no longer feasible in a deregulated environment.
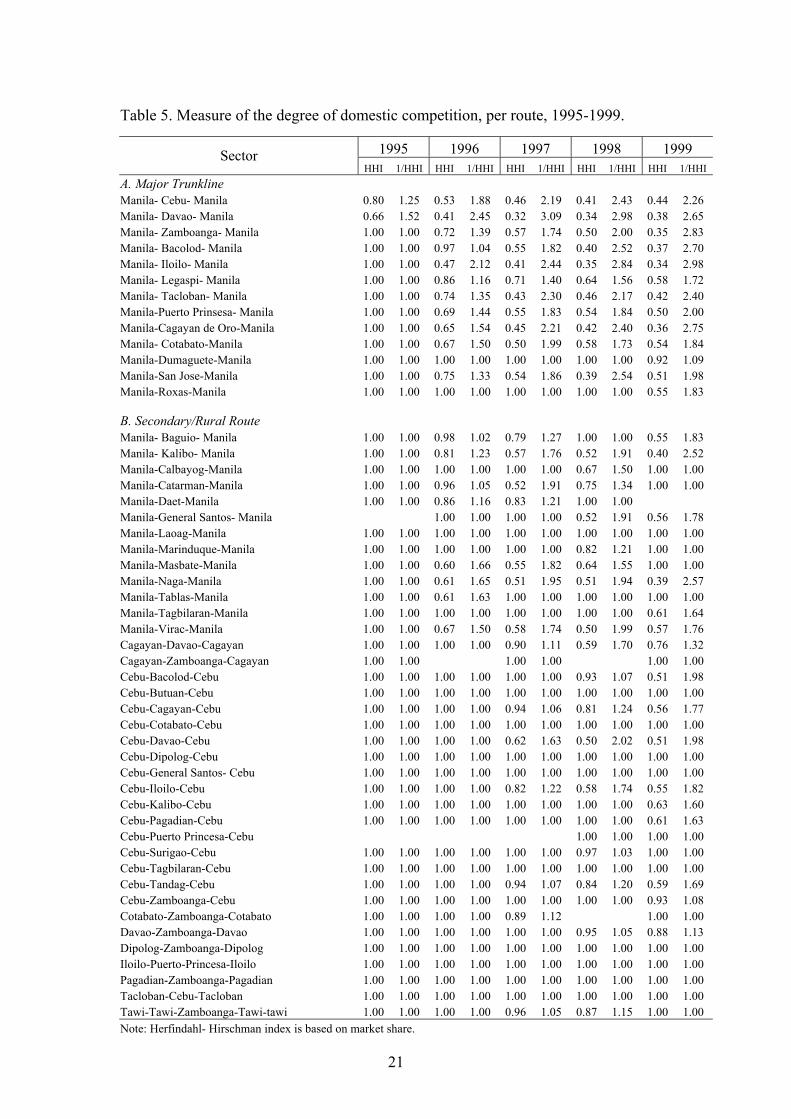
An examination of the Herfindahl-Hirschman Index of the different routes or
sectors shows that only the major trunklines are being fiercely contested, i.e. the number of effective competitors is increasing (Table 5). Except for Grand Airways, the players in these markets have relatively the same frequency of flights per week (Table 6). This implies that no airline dominates the flight frequency and the airlines can fly the said routes as much as traffic demands, although of course, their seat capacity determines the amount of the traffic they can accommodate.
Air Philippines and Cebu Pacific Air are providing PAL stiff competition in
the major trunklines as shown by the annual increases in their market shares since joining the industry in 1996 (Table 2 and Table 7). Passenger traffic for these two airlines grew by 72 percent and 60 percent, respectively, for the past four years (Table 8). Cebu Pacific has succeeded in increasing its share in 1998 despite the crash of one of its aircrafts during the year, dubbed as the country’s biggest air disaster in the 1990s. Grand Airways, on the other hand, failed to improve its share of the market since joining the industry until it ceased operation in early 1999.
In contrast, except for a number of sectors, much of the secondary and tertiary
routes were still monopolized by PAL until 1998 (Table 7). Due to PAL’s downsizing, the airline gave up some of these routes in 1999. While Asian Spirit and Mindanao Express got the markets abandoned by PAL, the two airlines have their own niche markets (as shown by their 100 percent shares), with Mindanao Express concentrating its service in the Mindanao area, particularly Davao, Cagayan de Oro and Zamboanga. Likewise, while Cebu Pacific and Air Philippines are concentrating their operations in the major trunklines, they also have their own niches in some of the secondary/tertiary routes.
An examination of the inverse of the Herfindahl-Hirschman Index for the
secondary and tertiary routes shows that the deregulation has yet to create an impact on competition in these routes (Table 5). As will be discussed below, the smaller airlines are able to charge higher fares, sometimes equivalent to business class fare in bigger airlines, because of the absence of competition.
21
Table 5. Measure of the degree of domestic competition, per route, 1995-1999.
1995 1996 1997 1998 1999 Sector HHI 1/HHI HHI 1/HHI HHI 1/HHI HHI 1/HHI HHI 1/HHI
A. Major Trunkline Manila- Cebu- Manila 0.80 1.25 0.53 1.88 0.46 2.19 0.41 2.43 0.44 2.26 Manila- Davao- Manila 0.66 1.52 0.41 2.45 0.32 3.09 0.34 2.98 0.38 2.65 Manila- Zamboanga- Manila 1.00 1.00 0.72 1.39 0.57 1.74 0.50 2.00 0.35 2.83 Manila- Bacolod- Manila 1.00 1.00 0.97 1.04 0.55 1.82 0.40 2.52 0.37 2.70 Manila- Iloilo- Manila 1.00 1.00 0.47 2.12 0.41 2.44 0.35 2.84 0.34 2.98 Manila- Legaspi- Manila 1.00 1.00 0.86 1.16 0.71 1.40 0.64 1.56 0.58 1.72 Manila- Tacloban- Manila 1.00 1.00 0.74 1.35 0.43 2.30 0.46 2.17 0.42 2.40 Manila-Puerto Prinsesa- Manila 1.00 1.00 0.69 1.44 0.55 1.83 0.54 1.84 0.50 2.00 Manila-Cagayan de Oro-Manila 1.00 1.00 0.65 1.54 0.45 2.21 0.42 2.40 0.36 2.75 Manila- Cotabato-Manila 1.00 1.00 0.67 1.50 0.50 1.99 0.58 1.73 0.54 1.84 Manila-Dumaguete-Manila 1.00 1.00 1.00 1.00 1.00 1.00 1.00 1.00 0.92 1.09 Manila-San Jose-Manila 1.00 1.00 0.75 1.33 0.54 1.86 0.39 2.54 0.51 1.98 Manila-Roxas-Manila 1.00 1.00 1.00 1.00 1.00 1.00 1.00 1.00 0.55 1.83 B. Secondary/Rural Route Manila- Baguio- Manila 1.00 1.00 0.98 1.02 0.79 1.27 1.00 1.00 0.55 1.83 Manila- Kalibo- Manila 1.00 1.00 0.81 1.23 0.57 1.76 0.52 1.91 0.40 2.52 Manila-Calbayog-Manila 1.00 1.00 1.00 1.00 1.00 1.00 0.67 1.50 1.00 1.00 Manila-Catarman-Manila 1.00 1.00 0.96 1.05 0.52 1.91 0.75 1.34 1.00 1.00 Manila-Daet-Manila 1.00 1.00 0.86 1.16 0.83 1.21 1.00 1.00 Manila-General Santos- Manila 1.00 1.00 1.00 1.00 0.52 1.91 0.56 1.78 Manila-Laoag-Manila 1.00 1.00 1.00 1.00 1.00 1.00 1.00 1.00 1.00 1.00 Manila-Marinduque-Manila 1.00 1.00 1.00 1.00 1.00 1.00 0.82 1.21 1.00 1.00 Manila-Masbate-Manila 1.00 1.00 0.60 1.66 0.55 1.82 0.64 1.55 1.00 1.00 Manila-Naga-Manila 1.00 1.00 0.61 1.65 0.51 1.95 0.51 1.94 0.39 2.57 Manila-Tablas-Manila 1.00 1.00 0.61 1.63 1.00 1.00 1.00 1.00 1.00 1.00 Manila-Tagbilaran-Manila 1.00 1.00 1.00 1.00 1.00 1.00 1.00 1.00 0.61 1.64 Manila-Virac-Manila 1.00 1.00 0.67 1.50 0.58 1.74 0.50 1.99 0.57 1.76 Cagayan-Davao-Cagayan 1.00 1.00 1.00 1.00 0.90 1.11 0.59 1.70 0.76 1.32 Cagayan-Zamboanga-Cagayan 1.00 1.00 1.00 1.00 1.00 1.00 Cebu-Bacolod-Cebu 1.00 1.00 1.00 1.00 1.00 1.00 0.93 1.07 0.51 1.98 Cebu-Butuan-Cebu 1.00 1.00 1.00 1.00 1.00 1.00 1.00 1.00 1.00 1.00 Cebu-Cagayan-Cebu 1.00 1.00 1.00 1.00 0.94 1.06 0.81 1.24 0.56 1.77 Cebu-Cotabato-Cebu 1.00 1.00 1.00 1.00 1.00 1.00 1.00 1.00 1.00 1.00 Cebu-Davao-Cebu 1.00 1.00 1.00 1.00 0.62 1.63 0.50 2.02 0.51 1.98 Cebu-Dipolog-Cebu 1.00 1.00 1.00 1.00 1.00 1.00 1.00 1.00 1.00 1.00 Cebu-General Santos- Cebu 1.00 1.00 1.00 1.00 1.00 1.00 1.00 1.00 1.00 1.00 Cebu-Iloilo-Cebu 1.00 1.00 1.00 1.00 0.82 1.22 0.58 1.74 0.55 1.82 Cebu-Kalibo-Cebu 1.00 1.00 1.00 1.00 1.00 1.00 1.00 1.00 0.63 1.60 Cebu-Pagadian-Cebu 1.00 1.00 1.00 1.00 1.00 1.00 1.00 1.00 0.61 1.63 Cebu-Puerto Princesa-Cebu 1.00 1.00 1.00 1.00 Cebu-Surigao-Cebu 1.00 1.00 1.00 1.00 1.00 1.00 0.97 1.03 1.00 1.00 Cebu-Tagbilaran-Cebu 1.00 1.00 1.00 1.00 1.00 1.00 1.00 1.00 1.00 1.00 Cebu-Tandag-Cebu 1.00 1.00 1.00 1.00 0.94 1.07 0.84 1.20 0.59 1.69 Cebu-Zamboanga-Cebu 1.00 1.00 1.00 1.00 1.00 1.00 1.00 1.00 0.93 1.08 Cotabato-Zamboanga-Cotabato 1.00 1.00 1.00 1.00 0.89 1.12 1.00 1.00 Davao-Zamboanga-Davao 1.00 1.00 1.00 1.00 1.00 1.00 0.95 1.05 0.88 1.13 Dipolog-Zamboanga-Dipolog 1.00 1.00 1.00 1.00 1.00 1.00 1.00 1.00 1.00 1.00 Iloilo-Puerto-Princesa-Iloilo 1.00 1.00 1.00 1.00 1.00 1.00 1.00 1.00 1.00 1.00 Pagadian-Zamboanga-Pagadian 1.00 1.00 1.00 1.00 1.00 1.00 1.00 1.00 1.00 1.00 Tacloban-Cebu-Tacloban 1.00 1.00 1.00 1.00 1.00 1.00 1.00 1.00 1.00 1.00 Tawi-Tawi-Zamboanga-Tawi-tawi 1.00 1.00 1.00 1.00 0.96 1.05 0.87 1.15 1.00 1.00 Note: Herfindahl- Hirschman index is based on market share.
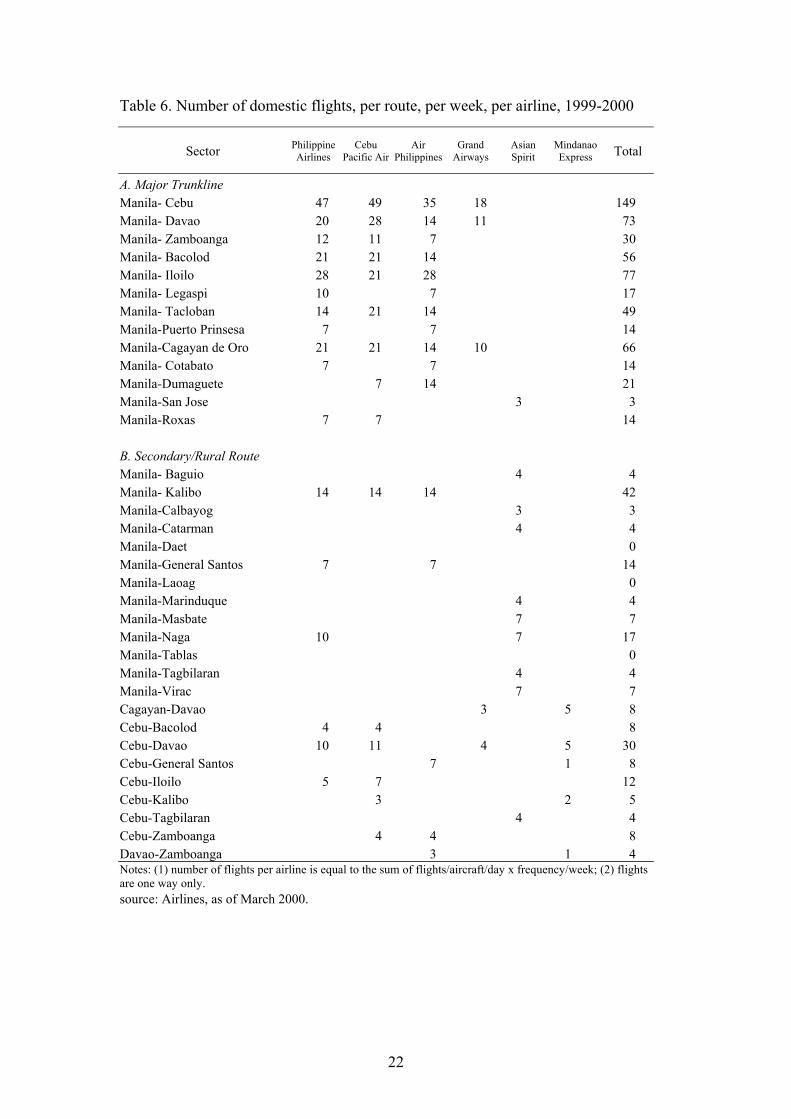
22
Table 6. Number of domestic flights, per route, per week, per airline, 1999-2000
Sector Philippine Airlines
Cebu Pacific Air
Air Philippines
Grand Airways
Asian Spirit
Mindanao Express Total
A. Major Trunkline Manila- Cebu 47 49 35 18 149 Manila- Davao 20 28 14 11 73 Manila- Zamboanga 12 11 7 30 Manila- Bacolod 21 21 14 56 Manila- Iloilo 28 21 28 77 Manila- Legaspi 10 7 17 Manila- Tacloban 14 21 14 49 Manila-Puerto Prinsesa 7 7 14 Manila-Cagayan de Oro 21 21 14 10 66 Manila- Cotabato 7 7 14 Manila-Dumaguete 7 14 21 Manila-San Jose 3 3 Manila-Roxas 7 7 14 B. Secondary/Rural Route Manila- Baguio 4 4 Manila- Kalibo 14 14 14 42 Manila-Calbayog 3 3 Manila-Catarman 4 4 Manila-Daet 0 Manila-General Santos 7 7 14 Manila-Laoag 0 Manila-Marinduque 4 4 Manila-Masbate 7 7 Manila-Naga 10 7 17 Manila-Tablas 0 Manila-Tagbilaran 4 4 Manila-Virac 7 7 Cagayan-Davao 3 5 8 Cebu-Bacolod 4 4 8 Cebu-Davao 10 11 4 5 30 Cebu-General Santos 7 1 8 Cebu-Iloilo 5 7 12 Cebu-Kalibo 3 2 5 Cebu-Tagbilaran 4 4 Cebu-Zamboanga 4 4 8 Davao-Zamboanga 3 1 4 Notes: (1) number of flights per airline is equal to the sum of flights/aircraft/day x frequency/week; (2) flights are one way only. source: Airlines, as of March 2000.

Table 7. Market share per sector, per airline, 1995-1999 (%)
1995 1996 1997 1998 1999* 1996 1997 1998 1999 1996 1997 1998 1999 1995 1996 1997 1998 1996 1997 1998 1999 1996 1997 1998 1999A. Major TrunklineManila- Cebu- Manila 88.6 69.3 63.7 58.3 59.9 10.9 17.4 23.1 24.6 5.5 11.9 15.5 11.4 19.8 13.4 6.7
Manila- Davao- Manila 78.1 54.2 47.5 47.4 50.0 13.3 23.4 24.9 28.4 1.5 17.0 21.2 21.6 21.9 31.0 12.1 6.6
Manila- Zamboanga- Manila 100.0 83.1 69.2 57.3 40.0 1.2 21.8 16.9 30.8 41.6 38.2
Manila- Bacolod- Manila 100.0 98.2 69.9 52.0 39.8 1.8 23.9 31.2 42.5 6.3 16.7 17.7
Manila- Iloilo- Manila 100.0 63.7 56.0 44.6 35.5 16.6 22.0 26.7 29.9 19.4 21.7 28.7 34.6 0.3 0.3
Manila- Legaspi- Manila 100.0 92.3 82.7 76.7 70.0 7.7 17.3 23.3 30.0
Manila- Tacloban- Manila 100.0 85.6 53.9 38.5 26.0 7.1 36.7 55.6 56.5 0.5 17.5 7.3 9.4 5.5
Manila-Puerto Prinsesa- Manila 100.0 81.5 66.4 64.9 48.1 17.7 32.7 35.1 51.9 0.9 0.9
Manila-Cagayan de Oro-Manila 100.0 79.0 58.3 52.1 43.6 15.0 32.2 37.1 36.6 2.3 19.8 6.0 9.5 8.4
Manila- Cotabato-Manila 100.0 78.9 53.3 30.2 35.1 21.1 46.7 69.8 64.9
Manila-Dumaguete-Manila 100.0 100.0 100.0 100.0 4.3 95.7
Manila-San Jose-Manila 100.0 85.6 63.9 53.4 25.1 55.6 14.4 36.1 21.5 44.4
Manila-Roxas-Manila 100.0 100.0 100.0 100.0 65.1 34.9
B. Secondary/Rural RouteManila- Baguio- Manila 100.0 98.8 87.9 100.0 0.0 34.8 1.2 12.1 65.2
Manila- Kalibo- Manila 100.0 89.4 72.9 68.6 53.6 12.8 11.7 20.2 10.6 14.4 19.8 26.2
Manila-Calbayog-Manila 100.0 100.0 78.8 100.0 21.2 100.0
Manila-Catarman-Manila 100.0 97.8 60.7 85.1 2.2 39.3 14.9 100.0
Manila-Daet-Manila 100.0 92.5 90.4 100.0 7.5 9.6
Manila-General Santos- Manila 100.0 100.0 61.1 67.5 38.9 32.5
Manila-Laoag-Manila 100.0 100.0 100.0 100.0 100.0
Manila-Marinduque-Manila 100.0 100.0 100.0 90.3 9.7 100.0
Manila-Masbate-Manila 100.0 72.6 34.1 23.2 27.4 65.9 76.8 100.0
Manila-Naga-Manila 100.0 73.1 65.8 62.3 44.7 26.9 27.4 2.2 14.2 6.9 35.6 41.0
Manila-Tablas-Manila 100.0 73.6 26.4 100.0 100.0 100.0
Manila-Tagbilaran-Manila 100.0 100.0 100.0 100.0 26.7 73.3
Manila-Virac-Manila 100.0 78.9 69.4 59.6 2.2 31.4 21.1 30.6 38.1 68.6
Cagayan-Davao-Cagayan 100.0 100.0 95.0 76.7 14.3 85.7
Cagayan-Zamboanga-Cagayan 100.0 100.0 5.0 23.3 100.0
Cebu-Bacolod-Cebu 100.0 100.0 100.0 96.5 44.3 3.5 55.7 0.1
Cebu-Butuan-Cebu 100.0 100.0 100.0 100.0 100.0
Cebu-Cagayan-Cebu 100.0 100.0 97.1 89.8 68.0 32.0
Cebu-Cotabato-Cebu 100.0 100.0 100.0 100.0 2.9 10.2 100.0
Cebu-Davao-Cebu 100.0 100.0 74.0 44.1 44.4 26.0 54.9 55.6 1.0
Cebu-Dipolog-Cebu 100.0 100.0 100.0 100.0 100.0
Cebu-General Santos- Cebu 100.0 100.0 100.0 100.0 100.0
Cebu-Iloilo-Cebu 100.0 100.0 90.0 69.4 34.5 30.6 65.5 10.0
Cebu-Kalibo-Cebu 100.0 100.0 100.0 100.0 75.2 24.8
Cebu-Pagadian-Cebu 100.0 100.0 100.0 100.0 74.0 26.0
Cebu-Puerto Princesa-Cebu 100.0 100.0
Cebu-Surigao-Cebu 100.0 100.0 100.0 98.6 100.0
Cebu-Tagbilaran-Cebu 100.0 100.0 100.0 100.0 100.0 1.4
Cebu-Tandag-Cebu 100.0 100.0 96.8 91.4 71.5 28.5
Cebu-Zamboanga-Cebu 100.0 100.0 100.0 100.0 3.6 96.4 3.2 8.6
Cotabato-Zamboanga-Cotabato 100.0 100.0 94.5 100.0
Davao-Zamboanga-Davao 100.0 100.0 100.0 97.5 93.8 5.5 100.0 6.2
Dipolog-Zamboanga-Dipolog 100.0 100.0 100.0 100.0 100.0 100.0 100.0
Iloilo-Puerto-Princesa-Iloilo 100.0 100.0 100.0 100.0 2.5 100.0
Pagadian-Zamboanga-Pagadian 100.0 100.0 100.0 100.0 100.0
Tacloban-Cebu-Tacloban 100.0 100.0 100.0 100.0 100.0
Tawi-Tawi-Zamboanga-Tawi-tawi 100.0 100.0 97.8 93.3 100.0
Note: PAL data for 1999 includes first to third quarters only. sources: CAB and Airlines.
Asian SpiritSector Mindanao ExpressPhilippine Airlines Air PhilippinesCebu Pacific Air Grand Airways

24
Table 8. Growth rate of domestic passenger traffic per airline, 1994-1999(%)
Airline 1995 1996 1997 1998 1999 1996-1999
Philippine Airlines 5.3 -6.1 3.5 -35.5 0.4 -12.5 Cebu Pacific Air 179.2 17.5 24.6 59.9 Air Philippines 164.2 31.7 46.4 72.1 Grand Airways 125.7 -24.1 -50.7 Asian Spirit 212.2 -17.4 96.9 71.9 Mindanao Express 16.5 151.0 43.0 Overall 10.1 13.2 22.1 -21.3 12.9 02.8 Note: Growth rate per sector are found in Appendix Table 4. source: CAB, Airlines.
But nonetheless, what is important is that these routes are contestable, i.e.
airlines are free to provide service to any of the routes once they recognized some profits. The emerging picture in the industry shows that the presence of big carriers in the secondary and tertiary routes could kill the small carriers flying the said routes. The experience of the smaller airlines would attest to this as they experienced losing out their markets to the bigger airlines once the latter discover the profitability of the routes. Competition comes in terms of the comfort that a passenger gets by flying a bigger airline and lower fare. Because their cost spread is higher, the bigger airlines could charge lower airfare than smaller airlines. An example would be the case of the Cebu-Bacolod route of Mindanao Express. The airline developed the route and for sometime was flying the route alone. Cebu Pacific Air later joined the route when it saw the profitability of the route. Due to the small size of the market and its bigger planes, Cebu Pacific Air eventually ate up the market of Mindanao Express.
Inter-modal competition. The source of competition in the secondary and tertiary routes is coming not only from the industry itself but also from the alternative modes of travel, that is, water and land. This is particularly true for those traveling between the country’s islands in the south. The introduction of comfortable high-speed ferries, as a result of the deregulation of the inter-island shipping industry, opened up an alternative mode of travel to a market that would previously only consider travel by air. At the same time, however, the lower airfare offered by the new entrants in the industry enabled passengers who, prior to the entry of the new carriers, used to take the boats to travel by plane.
Likewise, the improvement of roads in Mindanao has significantly reduced travel time by land. Since land travel is a lot cheaper than by air, this development become a source of competition for the air transport industry. An example of this is the Davao-General Santos route of Mindanao Express whose load factor was significantly reduced from 90 percent to 20-30 percent when travel time by land in this route was reduced from 6 hours to 2 hours as a result of the road improvement in the area.
This inter-modal competition will likely intensify with the continued
improvement in the inter-island shipping industry and road transport and hence, will
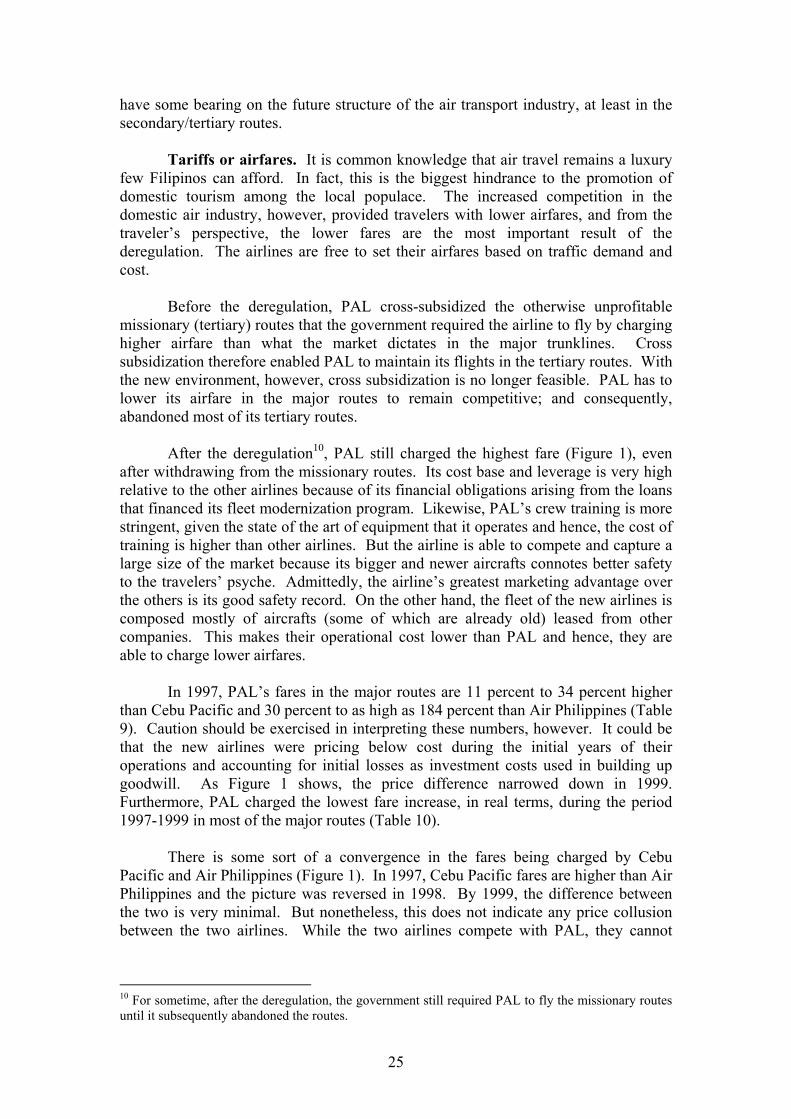
25
have some bearing on the future structure of the air transport industry, at least in the secondary/tertiary routes. Tariffs or airfares. It is common knowledge that air travel remains a luxury few Filipinos can afford. In fact, this is the biggest hindrance to the promotion of domestic tourism among the local populace. The increased competition in the domestic air industry, however, provided travelers with lower airfares, and from the traveler’s perspective, the lower fares are the most important result of the deregulation. The airlines are free to set their airfares based on traffic demand and cost.
Before the deregulation, PAL cross-subsidized the otherwise unprofitable
missionary (tertiary) routes that the government required the airline to fly by charging higher airfare than what the market dictates in the major trunklines. Cross subsidization therefore enabled PAL to maintain its flights in the tertiary routes. With the new environment, however, cross subsidization is no longer feasible. PAL has to lower its airfare in the major routes to remain competitive; and consequently, abandoned most of its tertiary routes.
After the deregulation10, PAL still charged the highest fare (Figure 1), even
after withdrawing from the missionary routes. Its cost base and leverage is very high relative to the other airlines because of its financial obligations arising from the loans that financed its fleet modernization program. Likewise, PAL’s crew training is more stringent, given the state of the art of equipment that it operates and hence, the cost of training is higher than other airlines. But the airline is able to compete and capture a large size of the market because its bigger and newer aircrafts connotes better safety to the travelers’ psyche. Admittedly, the airline’s greatest marketing advantage over the others is its good safety record. On the other hand, the fleet of the new airlines is composed mostly of aircrafts (some of which are already old) leased from other companies. This makes their operational cost lower than PAL and hence, they are able to charge lower airfares.
In 1997, PAL’s fares in the major routes are 11 percent to 34 percent higher
than Cebu Pacific and 30 percent to as high as 184 percent than Air Philippines (Table 9). Caution should be exercised in interpreting these numbers, however. It could be that the new airlines were pricing below cost during the initial years of their operations and accounting for initial losses as investment costs used in building up goodwill. As Figure 1 shows, the price difference narrowed down in 1999. Furthermore, PAL charged the lowest fare increase, in real terms, during the period 1997-1999 in most of the major routes (Table 10).
There is some sort of a convergence in the fares being charged by Cebu Pacific and Air Philippines (Figure 1). In 1997, Cebu Pacific fares are higher than Air Philippines and the picture was reversed in 1998. By 1999, the difference between the two is very minimal. But nonetheless, this does not indicate any price collusion between the two airlines. While the two airlines compete with PAL, they cannot
10 For sometime, after the deregulation, the government still required PAL to fly the missionary routes until it subsequently abandoned the routes.
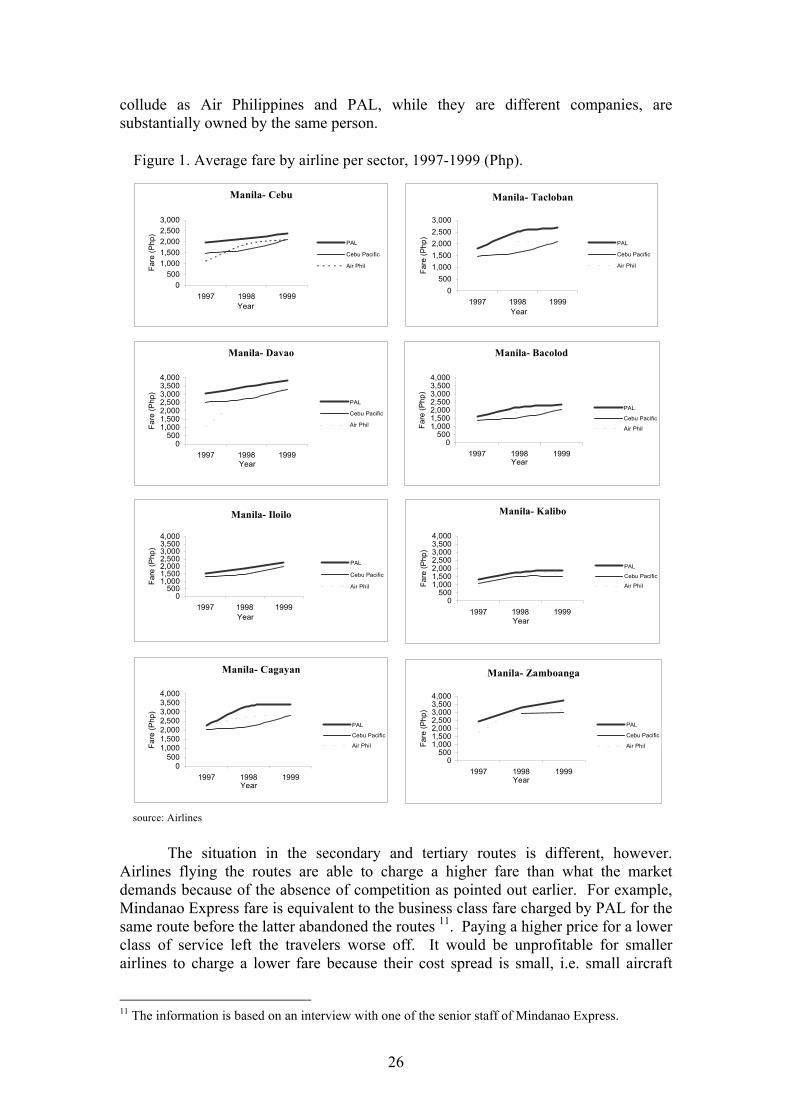
26
collude as Air Philippines and PAL, while they are different companies, are substantially owned by the same person.
source: Airlines
Figure 1. Average fare by airline per sector, 1997-1999 (Php).
Manila- Cebu
0500
1,0001,5002,0002,5003,000
1997 1998 1999Year
Fare
(Php
)
PAL
Cebu Pacific
Air Phil
Manila- Davao
0500
1,0001,5002,0002,5003,0003,5004,000
1997 1998 1999Year
Fare
(Php
)
PAL
Cebu Pacific
Air Phil
Manila- Iloilo
0500
1,0001,5002,0002,5003,0003,5004,000
1997 1998 1999Year
Fare
(Php
)
PAL
Cebu Pacific
Air Phil
Manila- Tacloban
0500
1,0001,5002,0002,5003,000
1997 1998 1999Year
Fare
(Php
)
PAL
Cebu Pacific
Air Phil
Manila- Bacolod
0500
1,0001,5002,0002,5003,0003,5004,000
1997 1998 1999Year
Fare
(Php
)
PAL
Cebu Pacific
Air Phil
Manila- Zamboanga
0500
1,0001,5002,0002,5003,0003,5004,000
1997 1998 1999Year
Fare
(Php
)
PAL
Cebu Pacific
Air Phil
Manila- Kalibo
0500
1,0001,5002,0002,5003,0003,5004,000
1997 1998 1999Year
Fare
(Php
)
PALCebu PacificAir Phil
Manila- Cagayan
0500
1,0001,5002,0002,5003,0003,5004,000
1997 1998 1999Year
Fare
(Php
)
PAL
Cebu Pacific
Air Phil
The situation in the secondary and tertiary routes is different, however. Airlines flying the routes are able to charge a higher fare than what the market demands because of the absence of competition as pointed out earlier. For example, Mindanao Express fare is equivalent to the business class fare charged by PAL for the same route before the latter abandoned the routes 11. Paying a higher price for a lower class of service left the travelers worse off. It would be unprofitable for smaller airlines to charge a lower fare because their cost spread is small, i.e. small aircraft
11 The information is based on an interview with one of the senior staff of Mindanao Express.

27
would only have a small number of passengers to share the flight cost. Hence, as long as the airlines in the secondary and tertiary routes do not see a threat of competition or the entry of a new airline in the routes, they will set their fares at a higher level than they would in a more competitive environment. Table 9. Percentage difference of fares in domestic flights, 1997-1999 (%)
1997 1998 1999 Phil. Airlines- Phil. Airlines- Cebu Pacific- Phil. Airlines- Phil. Airlines- Cebu Pacific- Phil. Airlines- Phil. Airlines- Cebu Pacific- Sector Cebu Pacific Air Phil Air Phil Cebu Pacific Air Phil Air Phil Cebu Pacific Air Phil Air Phil
Manila- Cebu 33.7 77.2 32.5 30.5 12.5 -13.8 14.1 14.1 0.0 Manila- Davao 19.8 184.0 137.0 26.8 14.8 -9.4 15.0 14.9 0.0 Manila-Iloilo 16.7 30.0 11.4 27.1 5.4 -17.1 14.7 15.0 0.3 Manila- Cagayan 11.0 0.0 -9.9 50.3 20.8 -19.6 21.2 24.5 2.7 Manila- Tacloban 21.9 54.3 19.6 -22.5 28.1 27.9 -0.1 Manila-Bacolod 14.9 31.8 14.7 41.0 13.5 -19.6 15.8 15.6 -0.1 Manila- Kalibo 27.5 51.0 18.4 17.3 2.0 -13.0 27.0 15.2 -9.3 Manila-Zamboanga 37.4 13.0 4.6 -7.4 25.2 17.6 -6.1 source: Airlines Table 10. Real growth rate of fares per airline, by major sector, 1997-1999 (1990 prices)(%)
Sector Philippine Airlines Cebu Pacific Air Air Philippines
Manila- Cebu 3.7 12.2 29.2 Manila- Davao 5.5 7.8 65.9 Manila-Iloilo 13.6 14.6 20.8 Manila- Cagayan 15.8 10.9 3.8 Manila- Tacloban 15.1 12.3 Manila-Bacolod 14.0 13.6 21.7 Manila- Kalibo 11.6 11.8 27.8 Manila-Zamboanga 17.5 27.0
Average for all major sectors 12.1 11.9 28.0
source: Airlines Revenues. Since PAL dominates the passenger traffic, it naturally would capture the bulk of the industry’s total revenue (Figure 2). But nonetheless, PAL has been registering a net loss that is becoming bigger every year (Table 11) despite its bigger passenger load than the other airlines (Table 2 and Appendix Table 2). The losses are the manifestation of the inefficiency of PAL brought about by years of government interference and by its monopoly status. PAL could have easily reduced its operating costs when it had financial and labor problems but the government did not allow its restructuring and reengineering. Hence, compared to other foreign and local airlines, PAL has more employees per aircraft, a sure sign of inefficiency, low productivity and higher labor cost. Furthermore, the debt burden of the airline, which was magnified by the depreciation of the peso during the financial crisis in 1997, is also contributing to its losses.

28
In contrast, PAL’s major competitors (Air Philippines and Cebu Pacific) suffered losses during the initial year of operation but were able to recover and registered favorable financial performance thereafter. The emerging picture here shows that competition in the industry enables the more efficient, low-cost airlines to operate at fares lower than pre-competition days but nonetheless profitable.
Asian Spirit and Mindanao Express are also incurring losses. Such financial
standing of the different airlines could affect the future structure of the industry. The financial problem besetting the industry is an indication that only a few large efficient airlines may in the long run survive. The continued losses of the unprofitable airlines could drive them to withdraw or exit from the industry or merge with the profitable ones.
Table 11. Revenue and income, by airline, 1995-1998 (Million pesos).
1995 1996 1997 1998 1999
Net Income Net Income Net Income Net Income Net Income Scheduled Operators Revenues
(Net Loss) Revenues
(Net Loss) Revenues
(Net loss) Revenues
(Net Loss) Revenue
(Net Loss)
Philippine Airlines 5,282 (227) 27,639 (2,182) 31,031 (2,502) 7,992 (1,639) 4,748 (2,854) Cebu Pacific Air 440 (15) 1,297 6 1,705 66 Air Philippines 286 (250) 853 8 1,467 3 Grand Airways 402 (92) 970 (91) 917 (150) Asian Spirit 202 (22) 168 (13) Mindanao Express 6 (1) 39 (2) 81 (12) 131 (11)
Total 5,690 (320) 29,374 (2,541) 34,381 (2,671) 11,464 (1,594) 4,748 (2,854)
Notes: (1) Data excludes revenue from cargo; (2) 1996-1997 data for PAL includes both international and domestic revenue. source: CAB and Airlines
Figure 2. Market share in total revenue of airlines, 1995-1998, in percent (%)
source: CAB and Airlines
����
����������������������������������������������������
��������������������������
��������������������������������������������������������������������������������������������������������������������������������������������������������������������������������������������������������������������������������������������
���������������������������������������������������������������������������������������������������������������������������������������������������������������������������������
1995 Grand Air
7.1%
PAL92.8%
Mindanao Express
0.1%����
����������������������������
���������������������
����������������������������������������
������������������������������
������������������������������������������������
������������������������������������
������������������������������������������������������������������������������������������������������������������������������������������������������������������������������������������
��������������������������������������������������������������������������������������������������������������������������������������������������������������������������������������������������������������������������������������������������������
1996
PAL94.1%
M indanao Express0.1%
Grand Air3.3%
Cebu Pacific1.5%
Air Phil1.0%
��������
����������
����
��������������������������������
����������������
������������������������������������������������
������������������������
����������������������������������������������������������������������������
��������������������������������������
������������������������������������������������������������������������������������������������������������������������������������������������������������������������������������������������������������������������������������������������������������
���������������������������������������������������������������������������������������������������������������������������������������������������������������������������������������������
1997
PAL90.3%
Cebu Pacific3.8%
Grand Air2.7%
Air Phil2.5% Mindanao
Express0.2%
Asian Spirit0.6% ���
���������
���������
��������������������
������������������
���������������������������������������������������������������������������
������������������������������������������������������������������������������
������
���������������������������������������������������������������������������������������
�������������������������������������������������������������������������������������������������������������������������
���������������������������������������������������������������������������������������������������������������������������������������������������������������������������������
���������������������������������������������������������������������������������������������������������������������������������������������������������������������������������
1998
Cebu Pacific14.9%
Air Phil12.8%
Mindanao Express1.1%
Asian Spirit1.5%
PAL69.7%

29
Growth in domestic air travel. With greater competition on the major routes, lower airfares, and more available flights, domestic travel has grown rapidly after the deregulation (Figure 3). Competition arising from promotional and discount fares continues to open the air industry to travelers who previously could not afford to travel by air. The growth of passenger traffic was highest at almost 22 percent during the period 1996-1997. The downsizing of PAL’s operation in 1998 coupled with the Asian financial crisis that affected the inflow of foreign tourists to the country, however, resulted to a decline in passenger traffic of almost equal magnitude as the increase in 1997 (Figure 3). This shows that potential demand for domestic air travel is high, a demand that could only be met if the airlines have enough capacity to provide the required air services.
International air services Five years after the liberalization of the country’s international air services, PAL remained uncontested as the country’s flag carrier flying the international routes. International air services to and from the country are provided by PAL and 39 other foreign airlines. Because these foreign airlines are operating by virtue of their countries’ air services agreements with the Philippines, competition in a particular route is limited between PAL and the designated carrier/s of the country’s bilateral partner in that route, except for the routes where fifth freedom is allowed and in which case, a third country carrier provides competition to those routes. As will be shown later, however, there are not many of this kind of route.
Designation of carriers. While CAB has designated other airlines (apart
from the incumbent PAL) to fly some of the international routes, these Philippine-based carriers have yet to provide PAL the much needed competition. Mindanao Express has been designated second carrier for the BIMP-EAGA in 1998 but the airline has never operated its international routes until it ceased operation towards the end of 2000. Grand Air was designated second flag carrier to Hong Kong and Taipei in 1996 and the airline was servicing this route until its closure in early 1999. But
sources: NSO and CAB.
Figure 3. Domestic passenger traffic and its annual growth rate, 1990-1999 (%)
-1,000,0002,000,0003,000,0004,000,0005,000,0006,000,0007,000,0008,000,000
1990 1991 1992 1993 1994 1995 1996 1997 1998 1999Year
Pass
enge
r
-25.00-20.00-15.00-10.00-5.000.005.0010.0015.0020.0025.00
Gro
wth
rate
Passenger Growth rate

30
during its operation, the airline did not create an impact on competition, as will be shown later, by its negligible market share.
Cebu Pacific Air has been issued in 1999 with a temporary operating permit
(TOP) to fly Indonesia, Singapore, Bangkok, Guam and Kuala Lumpur, but the airline has yet to be designated as second flag carrier to these countries.
The new airlines already foresee a structural barrier to their entry in the
international routes, that is, the difficulty of securing airport slots. The available slots have already been allocated to PAL. Request for additional slots requires a long process and this could curtail the plans of other airlines to fly international. Being designated a carrier therefore does not guarantee market access. Lack of airport slots can render the right to access meaningless in practice. In other countries, some airlines resort to buying the slots of other airlines, just to get over this barrier, but the cost is very high.
Absence of measures to counteract PAL’s downsizing. The immediate
effect of PAL’s downsizing is shortage of seat capacity which in turn limits the airline’s ability to serve the country’s international seat entitlements. Considering that there are no other designated carriers, CAB should have played a pro-active role by installing measures to offset the effects that PAL’s downsizing have on the industry. As Section 1.3 of EO 219 provides, to wit:
“All grants of frequencies or capacity to, any increase of existing frequencies or capacities of and/or grant of new routes or traffic points to any foreign carrier (even if on a provisional basis) shall be the sole prerogative of CAB subject to the confirmation of the Office of the President”.
Given this, the least that CAB can do is to re-negotiate the ASAs and grant
additional frequency or seat capacity to foreign airlines, even on a selective basis covering only those with heavy traffic, in order to meet the demand. On the contrary, CAB renegotiated for a lower seat capacity to the level of PAL, as in the case of the RP-Taiwan air disputes.
Clearly, this move does not serve well the nation’s interests. If the country
would like to attract foreign investment, trade and tourism, convenient air services that has a wide range of flight and schedule options is critical. As discussed earlier, business travelers give greater value to flexibility in flights and frequency. Companies also prefer to locate in areas that are easily connected to destinations around the world. Likewise, tourists prefer to travel to destinations that are easy to reach.
Because PAL’s rehabilitation plan prohibits the airline from acquiring new aircrafts during its rehabilitation period (1999-2003), the situation will likely worsen unless CAB takes the appropriate action.
Use of the country’s seat entitlements. The absence of competition results
to poor performance and growth. PAL is unable to use all the entitlements in the country’s ASAs. In 1996, foreign airlines performed better in using their country’s entitlements than PAL, i.e. PAL used only 61 percent of the country’s traffic rights

31
per week compared to 81 percent for the foreign airlines. PAL was able to use all its entitlements only in five countries (Australia, China, Japan, London and Hong Kong) while twelve countries were able to use all their entitlements (Figure 4). Worse yet, PAL was not able to use any of the country’s entitlements in nine countries. The performance for 1999 and 2000 could be worse considering that there were no new designated airlines when PAL abandoned some of its international flights.
The non-utilization of the country’s entitlements could be due to the following
factors12. One, PAL may not be competitive in some routes given its higher operating costs and poor image. Passengers want a dependable carrier and not one which can fold at any moment and strand them in a foreign land. Two, PAL may actually be operating in a “revenue-sharing pool” with the other designated carrier. It may or may not fly a certain route but would share in the revenues that the two designated carriers may generate in such a route. Or, the two carriers may opt to have only one operate on the route with revenues put in the “pool”. This is difficult to prove but has been recognized to occur. The result of such practice is the generation of monopoly profits in the route.
But nonetheless, the unused entitlements is an indication that there are
opportunities for PAL and other Philippine-based carriers to operate additional international services without the government requesting for greater capacity under existing ASAs.
Market structure. The effects on competition of the restrictive aviation policies of the country is shown by the high degree of concentration in the country’s international aviation industry in the 1990s (Table 12). Only the markets for Japan, South Korea, Taiwan, Hong Kong and the US show a relatively lower concentration and this is due to competition from fifth freedom. Incidentally, Tokyo (Japan), Taiwan, Hong Kong and Seoul (Korea) are the hubs in Asia of airlines flying to and from North America and Europe. A comparison of the country’s market concentration with other countries, like Australia for which data is available, shows
12 This paragraph was taken from the written comments of Mr. Joselito P. Supangco on an earlier draft of the paper.
source: DOTC, 1997 (Table 8.2)
Figure 4. Used entitlements as a percentage of negotiated entitlements, Philippines and foreign countries, 1996 (%).
Foreign Airlines
0 20 40 60 80 100Percentage
AustraliaBruneiChinaEgypt FranceGermanyGulf StatesItalyIndonesiaroute 1route 2JapanSouth KoreaKuwaitMalaysiaroute 1route 2NetherlandsPakistanSaudi ASingaporeroute 1route 2SwitzerlandThailandUKLondonHong KongUSAVietnam
Philippine Airlines
020406080100Percentage

32
that clearly the country’s air policies are not as liberal to promote competition as that of Australia, one of the countries known for its efficient airline industry (Table 13).
The degree of concentration has worsened in the latter half of the 1990s, an
evidence that the liberalization policies of 1995 has not created any impact. Between 1990 and 1995, 25 percent of the country’s markets registered an increase in concentration; and this rose to 48 percent between 1995 and 1999 (Table 12). In almost all the country-pairs, it is the airline of the country’s bilateral partners that dominates, especially in 1999 when PAL abandoned most of its international routes (Table 14). Table 12. Measure of degree of competition, by country, 1990-1999
Herfindahl- Hirschman Index (HHI) 1/HHI Country Points
1990 1995 1999 1990 1995 1999 Australia Brisbane, Melbourne, Sydney 0.63 0.56 1.00 1.58 1.78 1.00
Bahrain Bahrain 1.00 1.00 1.00 1.00 1.00 1.00 Brunei Brunei 0.64 0.61 1.00 1.57 1.64 1.00 Canada Canada 1.00 1.00 China Macau, Peking, Xiamen 1.00 0.50 1.00 1.99 Egypt Cairo 1.00 1.00 1.00 1.00 1.00 1.00 Fed. States of Micronesia Pohnpei 1.00 1.00 France Paris 1.00 0.60 1.00 1.00 1.67 1.00 Germany Frankfurt 0.50 0.53 1.99 1.87 Guam Guam 1.00 0.98 0.87 1.00 1.02 1.15 Hong Kong Hong Kong 0.44 0.41 0.47 2.27 2.43 2.12 India New Delhi 1.00 1.00 Indonesia Jakarta, Menado 1.00 0.50 1.00 1.00 2.00 1.00 Italy Rome 1.00 1.00 1.00 1.00
Japan Fukuoka, Nagoya, Okinawa, Osaka, Tokyo 0.23 0.28 0.28 4.30 3.53 3.62
South Korea Seoul 0.37 0.26 0.41 2.72 3.78 2.43 Kuwait Kuwait 1.00 1.00 1.00 1.00 1.00 1.00
Malaysia Kota Kinabalu, Kuala Lumpur, Kuching 0.57 0.57 0.86 1.75 1.76 1.17
Nauru Republic Nauru 1.00 1.00 1.00 1.00 1.00 1.00 Netherlands Amsterdam 0.59 0.99 1.00 1.70 1.01 1.00 Oman Muscat 1.00 1.00 1.00 1.00 Pakistan Karachi 0.88 1.00 1.14 1.00 Papua New Guinea Port Moresby 1.00 1.00 1.00 1.00 Qatar Doha 1.00 1.00 1.00 1.00 Saudi Arabia Dharan, Jeddah, Riyadh 0.50 0.58 0.71 2.00 1.73 1.40 Singapore Singapore 0.51 0.52 0.52 1.97 1.94 1.94 Switzerland Geneva, Zurich 1.00 1.00 1.00 1.00 1.00 1.00 Taiwan Kaohsiung, Taipei 0.47 0.32 0.42 2.15 3.12 2.39 Thailand Bangkok 0.31 0.27 0.83 3.23 3.71 1.21 United Arab Emirates Abu Dhabi, Dubai 0.39 0.49 0.71 2.57 2.03 1.41 United Kingdom London 0.50 0.50 1.00 1.98 1.99 1.00
United States of America Chicago, Los Angeles, San Francisco, Honolulu 0.35 0.48 0.51 2.88 2.10 1.96
Vietnam Hanoi, Saigon 1.00 1.00 1.00 1.00 Notes: (1) Herfindahl-Hirschman Index is based on market share. (2) Measure of the degree of competition by points served is in Appendix Table 5.
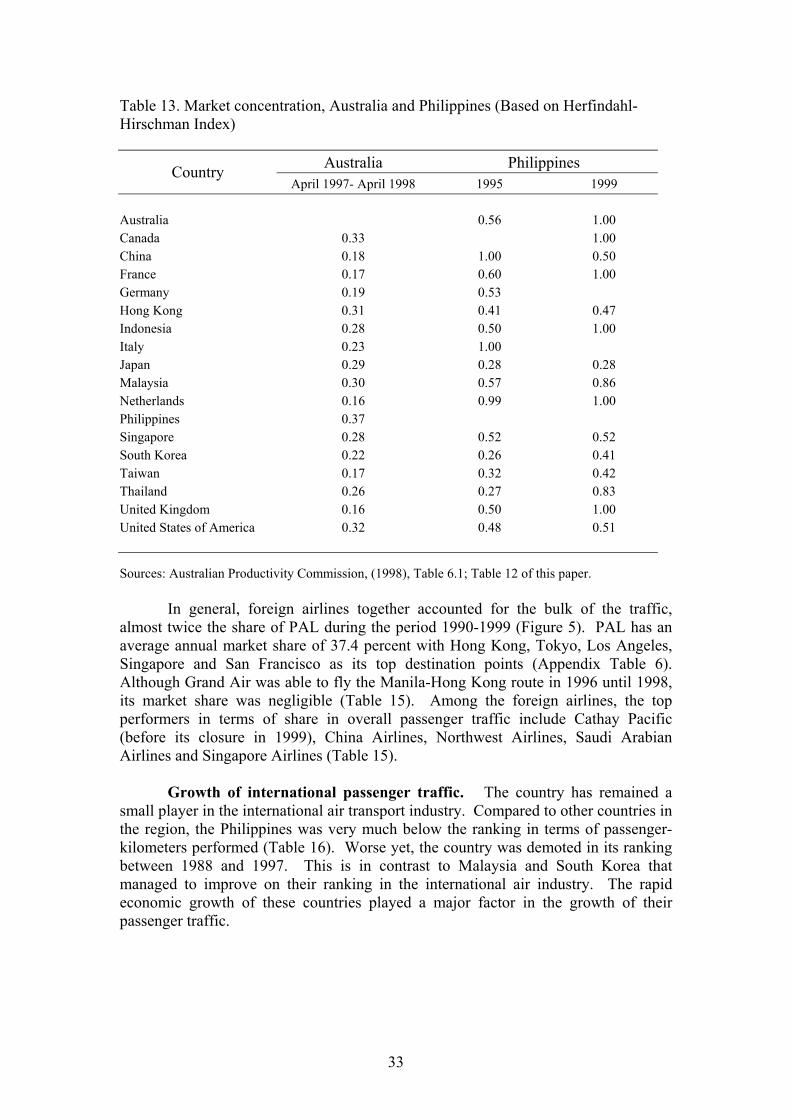
33
Table 13. Market concentration, Australia and Philippines (Based on Herfindahl-Hirschman Index)
Australia Philippines Country April 1997- April 1998 1995 1999
Australia 0.56 1.00 Canada 0.33 1.00 China 0.18 1.00 0.50 France 0.17 0.60 1.00 Germany 0.19 0.53 Hong Kong 0.31 0.41 0.47 Indonesia 0.28 0.50 1.00 Italy 0.23 1.00 Japan 0.29 0.28 0.28 Malaysia 0.30 0.57 0.86 Netherlands 0.16 0.99 1.00 Philippines 0.37 Singapore 0.28 0.52 0.52 South Korea 0.22 0.26 0.41 Taiwan 0.17 0.32 0.42 Thailand 0.26 0.27 0.83 United Kingdom 0.16 0.50 1.00 United States of America 0.32 0.48 0.51 Sources: Australian Productivity Commission, (1998), Table 6.1; Table 12 of this paper.
In general, foreign airlines together accounted for the bulk of the traffic,
almost twice the share of PAL during the period 1990-1999 (Figure 5). PAL has an average annual market share of 37.4 percent with Hong Kong, Tokyo, Los Angeles, Singapore and San Francisco as its top destination points (Appendix Table 6). Although Grand Air was able to fly the Manila-Hong Kong route in 1996 until 1998, its market share was negligible (Table 15). Among the foreign airlines, the top performers in terms of share in overall passenger traffic include Cathay Pacific (before its closure in 1999), China Airlines, Northwest Airlines, Saudi Arabian Airlines and Singapore Airlines (Table 15).
Growth of international passenger traffic. The country has remained a small player in the international air transport industry. Compared to other countries in the region, the Philippines was very much below the ranking in terms of passenger-kilometers performed (Table 16). Worse yet, the country was demoted in its ranking between 1988 and 1997. This is in contrast to Malaysia and South Korea that managed to improve on their ranking in the international air industry. The rapid economic growth of these countries played a major factor in the growth of their passenger traffic.

PAL Foreign Carriers
PAL's share (%) PAL Foreign
CarriersPAL's share
(%) PALForeign Carriers
PAL's share (%)
Australia Brisbane, Melbourne, Sydney 93,712 30,060 75.7 134,413 63,945 67.8 120,532 0.0Bahrain Bahrain 53,504 0.0 35,381 0.0 23,861 0.0Brunei Brunei 7,327 23,383 23.9 17,777 49,070 26.6 34,716 0.0Canada Canada 20,450 0.0China Macau, Peking, Xiamen 37,868 100.0 17,586 15,377 53.4Egypt Cairo 14,802 0.0 8,670 0.0 8,403 0.0Fed. States of Micronesia Pohnpei 573 0.0France Paris 7,386 0.0 9,680 25,403 27.6 24,191 0.0Germany Frankfurt 38,100 42,359 47.4 58,144 99,094 37.0Guam Guam 108,244 0.0 146,133 0.0 155,688 0.0Hong Kong Hong Kong 354,787 50,256 87.6 519,085 966,114 35.0 388,483 194,338 66.7India New Delhi 3,008 0.0Indonesia Jakarta, Menado 31,475 0.0 44,406 24,285 64.6 5,212 0.0Italy Rome 14,087 100.0 7 21,394 0.0
Japan Fukuoka, Nagoya, Okinawa, Osaka, Tokyo 217,502 382,714 36.2 331,312 496,992 40.0 271,849 320,995 45.9
Korea Seoul 144,122 0.0 91,416 350,897 20.7 63,964 361,368 15.0Kuwait Kuwait 30,386 0.0 33,639 0.0 61,671 0.0
Malaysia Kota Kinabalu, Kuala Lumpur, Kuching 24,218 67,473 26.4 50,543 105,682 32.4 160,899 0.0
Nauru Republic Nauru 2,492 0.0 3,144 0.0 6,359 0.0Netherlands Amsterdam 6,698 16,306 29.1 94 27,854 0.3 46,551 0.0Oman Muscat 30,728 0.0 21,119 0.0Pakistan Karachi 8,452 574 93.6 19,475 0.0Papua New Guinea Port Moresby 5,050 0.0 101 11,816 0.8 11,860 0.0Qatar Doha 33,844 0.0 21,289 0.0Saudi Arabia Dharan, Jeddah, Riyadh 121,538 123,651 49.6 130,173 299,932 30.3 47,913 234,752 17.0Singapore Singapore 126,388 161,963 43.8 118,567 275,298 30.1 80,283 414,758 16.2Switzerland Geneva, Zurich 8,240 0.0 12,095 0.0 17,329 0.0Taiwan Kaohsiung, Taipei 126,054 127,514 49.7 204,483 444,925 31.5 72,300 376,919 16.1Thailand Bangkok 71,401 167,190 29.9 69,160 183,719 27.3 147,123 0.0United Arab Emirates Abu Dhabi, Dubai 27,564 24,548 52.9 40,418 45,827 46.9 131,405 0.0United Kingdom London 23,682 19,798 54.5 38,638 44,144 46.7 64,351 0.0
United States of America Chicago, Los Angeles, San Francisco, Honolulu 295,302 327,341 47.4 468,374 323,251 59.2 302,491 230,456 56.8
Vietnam Hanoi, Saigon 938 100.0 30,028 100.0 15,475 0.0source: CAB.
1999
Table 14. Market share of Philippine Airlines (PAL) in international passenger traffic per country of destination, 1990-1999 (%)
Country Points served1990 1995
����
����
����
����
��
��
��
��
���������������������������������������������������������������������������������������������������������������������������������������������������������������������������������������������������������������������������������������������������
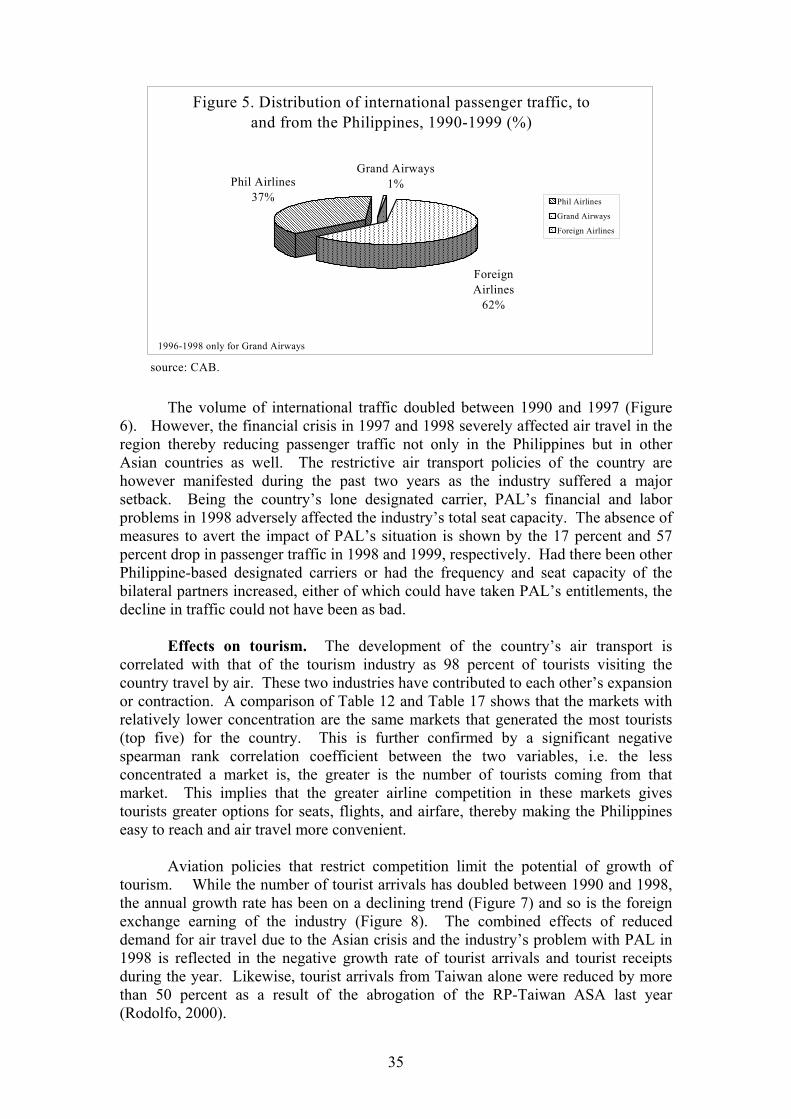
35
The volume of international traffic doubled between 1990 and 1997 (Figure
6). However, the financial crisis in 1997 and 1998 severely affected air travel in the region thereby reducing passenger traffic not only in the Philippines but in other Asian countries as well. The restrictive air transport policies of the country are however manifested during the past two years as the industry suffered a major setback. Being the country’s lone designated carrier, PAL’s financial and labor problems in 1998 adversely affected the industry’s total seat capacity. The absence of measures to avert the impact of PAL’s situation is shown by the 17 percent and 57 percent drop in passenger traffic in 1998 and 1999, respectively. Had there been other Philippine-based designated carriers or had the frequency and seat capacity of the bilateral partners increased, either of which could have taken PAL’s entitlements, the decline in traffic could not have been as bad.
Effects on tourism. The development of the country’s air transport is
correlated with that of the tourism industry as 98 percent of tourists visiting the country travel by air. These two industries have contributed to each other’s expansion or contraction. A comparison of Table 12 and Table 17 shows that the markets with relatively lower concentration are the same markets that generated the most tourists (top five) for the country. This is further confirmed by a significant negative spearman rank correlation coefficient between the two variables, i.e. the less concentrated a market is, the greater is the number of tourists coming from that market. This implies that the greater airline competition in these markets gives tourists greater options for seats, flights, and airfare, thereby making the Philippines easy to reach and air travel more convenient.
Aviation policies that restrict competition limit the potential of growth of
tourism. While the number of tourist arrivals has doubled between 1990 and 1998, the annual growth rate has been on a declining trend (Figure 7) and so is the foreign exchange earning of the industry (Figure 8). The combined effects of reduced demand for air travel due to the Asian crisis and the industry’s problem with PAL in 1998 is reflected in the negative growth rate of tourist arrivals and tourist receipts during the year. Likewise, tourist arrivals from Taiwan alone were reduced by more than 50 percent as a result of the abrogation of the RP-Taiwan ASA last year (Rodolfo, 2000).
1996-1998 only for Grand Airways
source: CAB.
���������������������������
���������������������������������������������������������������������������������������
������������
������������������������������������������������������������������������������������������������������������������������������������������������������������
��������������������
�������������������������������������������������������������������������������
������������������������������������������������������������������������������������������������������������������������������������������������������������������������������������������������
����������������������������������������������������������������������������������������������������������������������������������������������������������������������������������������������������������������������������������������������������������������
Figure 5. Distribution of international passenger traffic, to and from the Philippines, 1990-1999 (%)
Grand Airways1%Phil Airlines
37%
ForeignAirlines
62%
������Phil Airlines������Grand Airways������Foreign Airlines
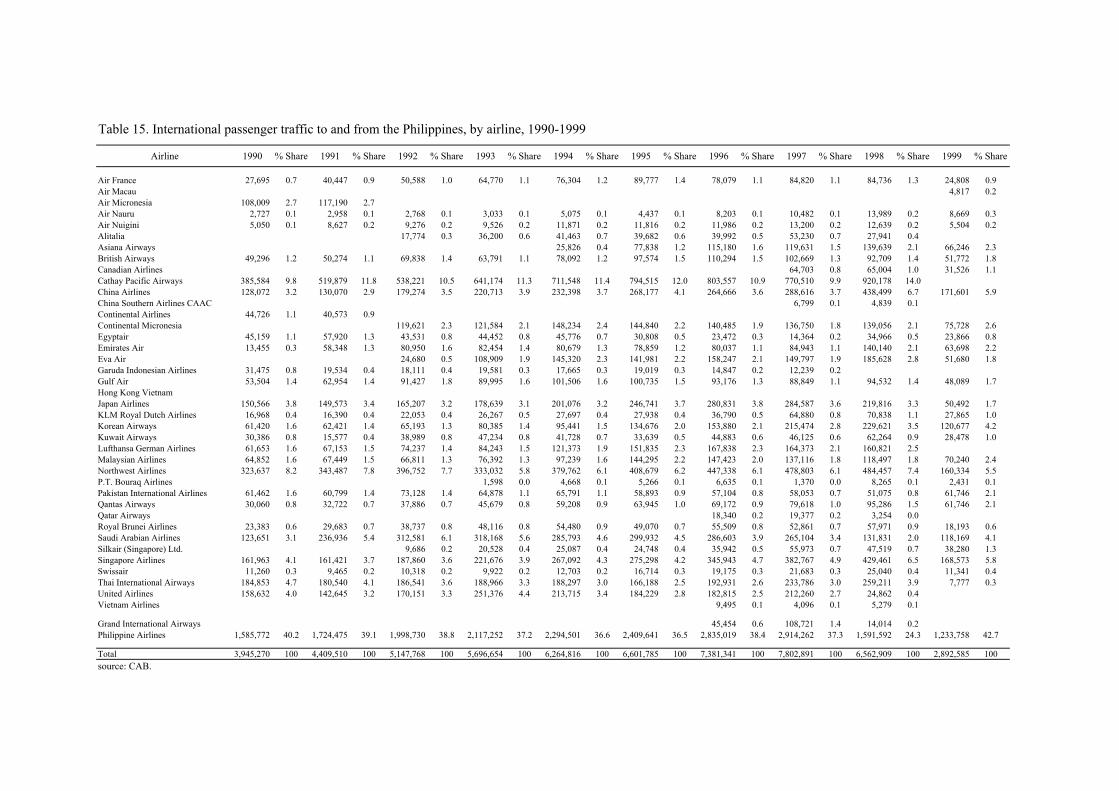
Table 15. International passenger traffic to and from the Philippines, by airline, 1990-1999
Airline 1990 % Share 1991 % Share 1992 % Share 1993 % Share 1994 % Share 1995 % Share 1996 % Share 1997 % Share 1998 % Share 1999 % Share
Air France 27,695 0.7 40,447 0.9 50,588 1.0 64,770 1.1 76,304 1.2 89,777 1.4 78,079 1.1 84,820 1.1 84,736 1.3 24,808 0.9Air Macau 4,817 0.2Air Micronesia 108,009 2.7 117,190 2.7Air Nauru 2,727 0.1 2,958 0.1 2,768 0.1 3,033 0.1 5,075 0.1 4,437 0.1 8,203 0.1 10,482 0.1 13,989 0.2 8,669 0.3Air Nuigini 5,050 0.1 8,627 0.2 9,276 0.2 9,526 0.2 11,871 0.2 11,816 0.2 11,986 0.2 13,200 0.2 12,639 0.2 5,504 0.2Alitalia 17,774 0.3 36,200 0.6 41,463 0.7 39,682 0.6 39,992 0.5 53,230 0.7 27,941 0.4Asiana Airways 25,826 0.4 77,838 1.2 115,180 1.6 119,631 1.5 139,639 2.1 66,246 2.3British Airways 49,296 1.2 50,274 1.1 69,838 1.4 63,791 1.1 78,092 1.2 97,574 1.5 110,294 1.5 102,669 1.3 92,709 1.4 51,772 1.8Canadian Airlines 64,703 0.8 65,004 1.0 31,526 1.1Cathay Pacific Airways 385,584 9.8 519,879 11.8 538,221 10.5 641,174 11.3 711,548 11.4 794,515 12.0 803,557 10.9 770,510 9.9 920,178 14.0China Airlines 128,072 3.2 130,070 2.9 179,274 3.5 220,713 3.9 232,398 3.7 268,177 4.1 264,666 3.6 288,616 3.7 438,499 6.7 171,601 5.9China Southern Airlines CAAC 6,799 0.1 4,839 0.1Continental Airlines 44,726 1.1 40,573 0.9Continental Micronesia 119,621 2.3 121,584 2.1 148,234 2.4 144,840 2.2 140,485 1.9 136,750 1.8 139,056 2.1 75,728 2.6Egyptair 45,159 1.1 57,920 1.3 43,531 0.8 44,452 0.8 45,776 0.7 30,808 0.5 23,472 0.3 14,364 0.2 34,966 0.5 23,866 0.8Emirates Air 13,455 0.3 58,348 1.3 80,950 1.6 82,454 1.4 80,679 1.3 78,859 1.2 80,037 1.1 84,943 1.1 140,140 2.1 63,698 2.2Eva Air 24,680 0.5 108,909 1.9 145,320 2.3 141,981 2.2 158,247 2.1 149,797 1.9 185,628 2.8 51,680 1.8Garuda Indonesian Airlines 31,475 0.8 19,534 0.4 18,111 0.4 19,581 0.3 17,665 0.3 19,019 0.3 14,847 0.2 12,239 0.2Gulf Air 53,504 1.4 62,954 1.4 91,427 1.8 89,995 1.6 101,506 1.6 100,735 1.5 93,176 1.3 88,849 1.1 94,532 1.4 48,089 1.7Hong Kong VietnamJapan Airlines 150,566 3.8 149,573 3.4 165,207 3.2 178,639 3.1 201,076 3.2 246,741 3.7 280,831 3.8 284,587 3.6 219,816 3.3 50,492 1.7KLM Royal Dutch Airlines 16,968 0.4 16,390 0.4 22,053 0.4 26,267 0.5 27,697 0.4 27,938 0.4 36,790 0.5 64,880 0.8 70,838 1.1 27,865 1.0Korean Airways 61,420 1.6 62,421 1.4 65,193 1.3 80,385 1.4 95,441 1.5 134,676 2.0 153,880 2.1 215,474 2.8 229,621 3.5 120,677 4.2Kuwait Airways 30,386 0.8 15,577 0.4 38,989 0.8 47,234 0.8 41,728 0.7 33,639 0.5 44,883 0.6 46,125 0.6 62,264 0.9 28,478 1.0Lufthansa German Airlines 61,653 1.6 67,153 1.5 74,237 1.4 84,243 1.5 121,373 1.9 151,835 2.3 167,838 2.3 164,373 2.1 160,821 2.5Malaysian Airlines 64,852 1.6 67,449 1.5 66,811 1.3 76,392 1.3 97,239 1.6 144,295 2.2 147,423 2.0 137,116 1.8 118,497 1.8 70,240 2.4Northwest Airlines 323,637 8.2 343,487 7.8 396,752 7.7 333,032 5.8 379,762 6.1 408,679 6.2 447,338 6.1 478,803 6.1 484,457 7.4 160,334 5.5P.T. Bouraq Airlines 1,598 0.0 4,668 0.1 5,266 0.1 6,635 0.1 1,370 0.0 8,265 0.1 2,431 0.1Pakistan International Airlines 61,462 1.6 60,799 1.4 73,128 1.4 64,878 1.1 65,791 1.1 58,893 0.9 57,104 0.8 58,053 0.7 51,075 0.8 61,746 2.1Qantas Airways 30,060 0.8 32,722 0.7 37,886 0.7 45,679 0.8 59,208 0.9 63,945 1.0 69,172 0.9 79,618 1.0 95,286 1.5 61,746 2.1Qatar Airways 18,340 0.2 19,377 0.2 3,254 0.0Royal Brunei Airlines 23,383 0.6 29,683 0.7 38,737 0.8 48,116 0.8 54,480 0.9 49,070 0.7 55,509 0.8 52,861 0.7 57,971 0.9 18,193 0.6Saudi Arabian Airlines 123,651 3.1 236,936 5.4 312,581 6.1 318,168 5.6 285,793 4.6 299,932 4.5 286,603 3.9 265,104 3.4 131,831 2.0 118,169 4.1Silkair (Singapore) Ltd. 9,686 0.2 20,528 0.4 25,087 0.4 24,748 0.4 35,942 0.5 55,973 0.7 47,519 0.7 38,280 1.3Singapore Airlines 161,963 4.1 161,421 3.7 187,860 3.6 221,676 3.9 267,092 4.3 275,298 4.2 345,943 4.7 382,767 4.9 429,461 6.5 168,573 5.8Swissair 11,260 0.3 9,465 0.2 10,318 0.2 9,922 0.2 12,703 0.2 16,714 0.3 19,175 0.3 21,683 0.3 25,040 0.4 11,341 0.4Thai International Airways 184,853 4.7 180,540 4.1 186,541 3.6 188,966 3.3 188,297 3.0 166,188 2.5 192,931 2.6 233,786 3.0 259,211 3.9 7,777 0.3United Airlines 158,632 4.0 142,645 3.2 170,151 3.3 251,376 4.4 213,715 3.4 184,229 2.8 182,815 2.5 212,260 2.7 24,862 0.4Vietnam Airlines 9,495 0.1 4,096 0.1 5,279 0.1
Grand International Airways 45,454 0.6 108,721 1.4 14,014 0.2Philippine Airlines 1,585,772 40.2 1,724,475 39.1 1,998,730 38.8 2,117,252 37.2 2,294,501 36.6 2,409,641 36.5 2,835,019 38.4 2,914,262 37.3 1,591,592 24.3 1,233,758 42.7
Total 3,945,270 100 4,409,510 100 5,147,768 100 5,696,654 100 6,264,816 100 6,601,785 100 7,381,341 100 7,802,891 100 6,562,909 100 2,892,585 100source: CAB.
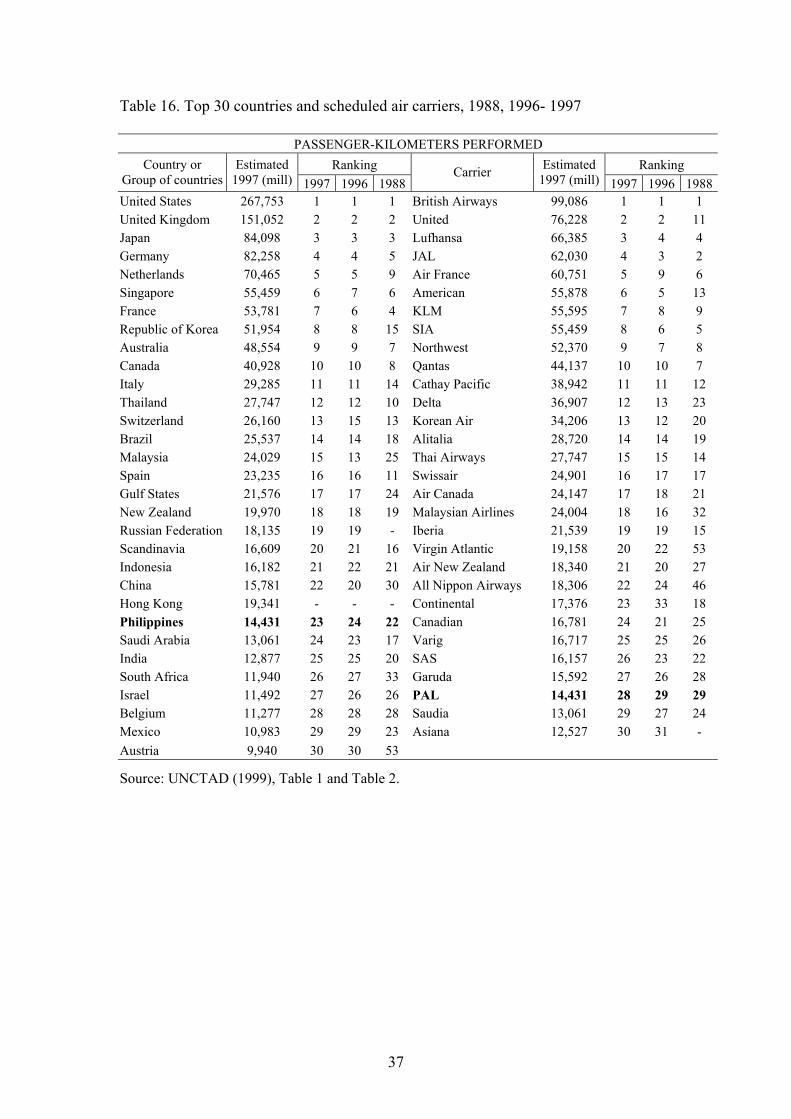
37
Table 16. Top 30 countries and scheduled air carriers, 1988, 1996- 1997
PASSENGER-KILOMETERS PERFORMED Ranking Ranking Country or
Group of countries Estimated
1997 (mill) 1997 1996 1988 Carrier Estimated
1997 (mill) 1997 1996 1988 United States 267,753 1 1 1 British Airways 99,086 1 1 1 United Kingdom 151,052 2 2 2 United 76,228 2 2 11 Japan 84,098 3 3 3 Lufhansa 66,385 3 4 4 Germany 82,258 4 4 5 JAL 62,030 4 3 2 Netherlands 70,465 5 5 9 Air France 60,751 5 9 6 Singapore 55,459 6 7 6 American 55,878 6 5 13 France 53,781 7 6 4 KLM 55,595 7 8 9 Republic of Korea 51,954 8 8 15 SIA 55,459 8 6 5 Australia 48,554 9 9 7 Northwest 52,370 9 7 8 Canada 40,928 10 10 8 Qantas 44,137 10 10 7 Italy 29,285 11 11 14 Cathay Pacific 38,942 11 11 12 Thailand 27,747 12 12 10 Delta 36,907 12 13 23 Switzerland 26,160 13 15 13 Korean Air 34,206 13 12 20 Brazil 25,537 14 14 18 Alitalia 28,720 14 14 19 Malaysia 24,029 15 13 25 Thai Airways 27,747 15 15 14 Spain 23,235 16 16 11 Swissair 24,901 16 17 17 Gulf States 21,576 17 17 24 Air Canada 24,147 17 18 21 New Zealand 19,970 18 18 19 Malaysian Airlines 24,004 18 16 32 Russian Federation 18,135 19 19 - Iberia 21,539 19 19 15 Scandinavia 16,609 20 21 16 Virgin Atlantic 19,158 20 22 53 Indonesia 16,182 21 22 21 Air New Zealand 18,340 21 20 27 China 15,781 22 20 30 All Nippon Airways 18,306 22 24 46 Hong Kong 19,341 - - - Continental 17,376 23 33 18 Philippines 14,431 23 24 22 Canadian 16,781 24 21 25 Saudi Arabia 13,061 24 23 17 Varig 16,717 25 25 26 India 12,877 25 25 20 SAS 16,157 26 23 22 South Africa 11,940 26 27 33 Garuda 15,592 27 26 28 Israel 11,492 27 26 26 PAL 14,431 28 29 29 Belgium 11,277 28 28 28 Saudia 13,061 29 27 24 Mexico 10,983 29 29 23 Asiana 12,527 30 31 - Austria 9,940 30 30 53
Source: UNCTAD (1999), Table 1 and Table 2.

38
Table 17. Distribution of tourists, by major country of residence, Philippines,1991-1999(%)
Country 1990 1991 1992 1993 1994 1995 1996 1997 1998 1999 USA 22.8 22.7 21.2 21.7 21.9 21.3 19.6 20.5 23.7 23.5 JAPAN 22.6 23.3 21.2 19.5 6.6 6.7 18.4 18.0 18.3 19.7 HONGKONG 7.9 6.6 6.3 6.1 19.6 20.1 7.8 7.6 8.2 8.1 TAIWAN 6.3 6.2 11.7 13.6 11.1 11.8 10.8 11.8 9.4 7.3 SOUTH KOREA 4.1 4.8 5.2 5.6 6.9 7.5 9.1 8.1 4.2 6.8 UNITED KINGDOM 3.7 4.2 3.7 4.1 4.3 4.4 4.4 4.6 4.9 4.5 AUSTRALIA 5.3 5.2 4.9 4.8 4.9 4.7 4.6 4.5 4.3 3.9 CANADA 2.3 2.6 2.8 2.9 2.8 2.8 3.0 3.1 3.4 3.3 GERMANY 3.0 3.3 3.5 3.4 3.3 3.2 3.2 3.0 3.3 3.1 SINGAPORE 2.2 1.8 2.0 1.9 2.0 1.7 2.3 2.4 2.4 2.6 MALAYSIA 1.3 1.6 1.4 1.7 2.0 2.2 2.7 2.9 2.5 2.5 FRANCE 1.1 1.2 1.3 1.1 1.0 1.1 1.1 1.2 1.3 1.2 CHINA 0.5 0.6 0.6 0.6 0.7 0.5 0.8 0.9 1.2 1.1 INDIA 0.8 0.8 0.8 0.7 0.8 0.8 0.8 0.8 1.1 0.9 NETHERLANDS 0.7 0.9 0.7 0.7 0.7 0.8 0.8 0.7 0.9 0.9 SWITZERLAND 1.2 1.3 1.2 1.1 1.0 0.9 0.9 0.8 0.9 0.8 INDONESIA 0.7 0.9 0.8 0.8 0.8 0.8 1.0 1.0 0.8 0.8 THAILAND 1.0 1.2 1.0 0.9 0.9 0.9 0.9 0.8 0.8 0.8 ITALY 1.0 0.9 0.9 0.9 0.9 0.8 0.7 0.7 0.7 0.7 DENMARK 0.3 0.4 0.4 0.4 0.4 0.3 0.4 0.4 0.6 0.6 SAUDI ARABIA 1.5 1.5 1.4 1.0 0.9 0.8 0.7 0.5 0.6 0.6 SWEDEN 0.8 0.8 0.6 0.6 0.5 0.5 0.5 0.5 0.6 0.5 NEW ZEALAND 0.4 0.5 0.4 0.5 0.5 0.5 0.5 0.5 0.5 0.5 Sub-total 91.4 93.1 94.0 94.5 94.7 94.9 95.1 95.3 94.5 94.9 Others 8.6 6.9 6.0 5.5 5.3 5.1 4.9 4.7 5.5 5.1 TOTAL 100.0 100.0 100.0 100.0 100.0 100.0 100.0 100.0 100.0 100.0 Sources: NSO and DOT.
source: CAB.
Figure 6. Annual growth rate of international passenger traffic, Philippines, 1990-1999 (%)
-
2,000,000
4,000,000
6,000,000
8,000,000
10,000,000
1990 1991 1992 1993 1994 1995 1996 1997 1998 1999Year
Pass
enge
r
-60-50-40-30-20-100102030
Gro
wth
rate
Passenger Growth rate

39
6. The Role of CAB in a Deregulated Environment Economic regulation for the country’s air transport industry is the responsibility of the Civil Aeronautics Board (CAB) by virtue of RA No. 776. Among other things, the CAB issues certificate of public convenience and necessity or operating permits, approves flight schedules, and determines the routes an air carrier may fly and the fares and charges that an air carrier may collect. The Board is also a member of the panel that negotiates the country’s ASAs.
source: DOT
Figure 8. Annual growth rate of tourist receipts,1990-1999 (%)
0.00
500.00
1,000.00
1,500.00
2,000.00
2,500.00
3,000.00
1989 1990 1991 1992 1993 1994 1995 1996 1997 1998 1999Year
Val
ue in
US$
(mill
)
-20.00-15.00-10.00-5.000.005.0010.0015.0020.0025.0030.0035.00
Gro
wth
rate
Value In Million US$ Growth Rate %
source: NSO and DOT
Figure 7. Annual growth rate of tourist arrivals,1990-1999 (%)
0.00
0.50
1.00
1.50
2.00
2.50
1990 1991 1992 1993 1994 1995 1996 1997 1998 1999
(Mill
ions
)
Year
No
of to
uris
ts
-10.00
-5.00
0.00
5.00
10.00
15.00
20.00
25.00
Gro
wth
rate
Tourist arrival Growth rate

40
Under a deregulated environment, however, the role of CAB is greatly diminished. Its role of determining capacities, frequencies and airfares is now limited to international air transport only. With diminished functions, its continued existence would depend on the regulations that would remain under the new environment. In other countries, like the US, the remaining functions of the economic regulator were absorbed by the transportation department while the economic regulating body itself has been abolished (USATA, 1999). 7. Implementing Guidelines for EO 219
Given the industry’s poor performance and the growing demands for international travel, there is an urgent need to formulate the implementing rules and guidelines of EO 219. Some of the areas that are critical to promoting greater competition and efficiency in the industry that needs to be addressed by the implementing rules and regulations include the following:
National interest. The EO is rather vague on what constitutes national
interest. National interests should include that which provides the maximum benefit to the nation and the public such as: (i) promotion of tourism, trade and investment; (ii) maximization of consumer benefits; and (iii) promotion of competition itself.
Designation of carriers and allocation of entitlements. Multiple
designation under the bilateral system facilitates entry into the market of new airlines and hence, provides potential for greater competition. However, multiple designation needs to be accompanied with sufficient capacity for it to yield competition benefits. But given the capacity constraint under the bilateral system, the number of airlines that will make a route commercially viable depends largely on the size of the market (i.e. capacity available) in question.
Hence, it is important to first establish the number of airlines required by the
market before any designation of carriers is done. But the process and criteria for designating airlines should be established in the guidelines. Other countries have established an approach for allocating capacity to carriers on contested routes13. They have also established a body whose function is solely to allocate capacity14; this body is separate from the body that sits in the negotiation of ASAs.
8. Areas for Competition Policy
This section of the paper identifies areas where competition policy and regulations have remained undefined. Ideally, where effective competition exists, the need for regulation is reduced principally because the strong competition itself constitutes a self-regulating mechanism whereby excess profits and anti-competitive behavior are eliminated (Stewart-Smith, 1999). The role of policies and regulations under a 13 South Korea uses a rule-based approach which involves a pre-determined formula; Canada uses a geographic allocation system; Australia, US and the United Kingdom use public interest approach which involves an adjudicative process using some form of public interest test based on defined policies and criteria (Productivity Commission, 1998). 14 Allocation of capacity in Australia is done by the International Air Services Commission (IASC).

41
liberalized and deregulated environment is therefore to ensure that competition is effective. This becomes more important in an oligopolistic structure where the failure of any one player would have a dramatic impact on the market power of competitors.
One important area for competition policy is on merger and acquisition. The fierce competition that resulted from deregulation in other countries has pushed a number of airlines into bankruptcy or merger and consolidation. Merger and consolidation have both positive and negative effects. On the positive side, efficiency is enhanced as it allows airlines to achieve economies of scale and scope by consolidating airline functions such as ground handling, repair and maintenance, marketing, etc. On the negative side, there is the fear that the end result will be a large airline becoming so dominant that it can exert considerable market power.
The potential of seeing merger and consolidation happening in the country
should not be taken lightly for the following reasons. First, domestic traffic in the country is relatively small and this by itself limits the number of airlines that would make an efficient domestic air transport industry. Second, only two of the airlines are currently profitable. Third, two of the existing airlines are substantially owned by the same person. Fourth, the new entrants will need substantial capital to be able to fly the international routes. Given the local ownership requirement, merger and consolidation could be an easy way out to the huge capital requirement of the industry.
Thus, a policy or regulation on merger should be defined in such a way that
mergers and consolidation would not result to reduced service and less competition. The government should weigh the efficiency enhancing effects as against the market power effects. In short, a merger should be in the interests of the traveling public.
Below are areas for competition policy specific to the domestic and
international air transport industry. Domestic Air Transport Industry
Essential air service. Cross subsidization is no longer feasible under a deregulated environment. However, considering the country’s archipelagic setting, there are remote areas where air services are not commercially viable but which are deemed necessary on social grounds or for developmental reasons. The government should set up a system that would give airlines incentive to provide air services that otherwise would be money losers. Other countries have adopted several approaches in addressing this issue. One approach would be a competitive bidding for government subsidy, i.e. giving the subsidy to the airline that values it the most.
Intermodal competition. The shipping industry has become an important
source of competition for the air transport industry in providing transport services in the country’s islands in the south. The system for providing government subsidy to air services in missionary routes or remote areas should therefore be designed in such a way that the efficiency arising from the intermodal competition will not be distorted.
Tariffs/Fares. Airfares should continue to be regulated in routes where air services are provided by only one airline.
42
International Air Transport Industry
Given the bilateral framework in the provision of air services, there is only a limited scope for the country’s unilateral reform that would enhance efficiency. Any liberalization effort should therefore be done in the context of the bilateral negotiating process and at the multilateral or regional level for some areas.
Market access. Multiple designation under EO 219 is incompatible with
capacity constraints as entry will be limited if there are not sufficient capacity for each carrier to be commercially viable. Hence, multiple designation should be accompanied by the removal of capacity constraints. The country should pursue liberal bilateral agreements aiming for the gradual removal, within a set time frame, of constraints in capacity, frequency and type of aircrafts so as to allow airlines greater flexibility in determining the least cost of providing air services in the routes. This in effect deepens the country’s liberalization efforts.
However, a balance has to be struck in setting the time period. If competition
is introduced too slowly, the incumbent airline (PAL) has little incentive to eliminate monopoly rents. Allowing competition too rapidly, on the other hand, may result in lost opportunity for the new players to gain organizational efficiencies, as they have yet to establish a credible presence in international routes, and fail altogether.
Access to inputs. A liberal market access if not accompanied by a freer access to inputs to the provision of air services will not produce any effect. This is where regional and multilateral actions are needed. Of immediate importance under this area is the regulatory reform on how to facilitate the access of new airlines to airport landing slots that are often hard to contest, particularly the peak landing slots, as these have already been allocated to the incumbent/s.
Alliances. The motivation for the formation of alliances is the need to offer a
global service with connections around the world while restraining costs. Indirectly, however, alliances are formed to overcome constraints in the bilateral agreements, particularly foreign equity restriction. Alliances may come in several forms, one of which is code sharing where one airline uses seats on another airline but employ its own airline designator code. Code sharing has anti-competitive effects as it reduces consumer choice of airlines. 9. Summary and Conclusion There is no doubt that liberalization and deregulation have brought genuine competition in the domestic air transport industry. Although the number of players has remained the same since the industry was deregulated, this paper has shown that the degree of competition has been increasingly intensified, particularly in the major routes, resulting to lower airfare, improvement in the quality of service and efficiency in the industry in general.
On the other hand, while other countries are adopting more flexible approaches to liberalization and regulation to meet the increasing demand for international air services brought about by the increasing integration of economies,
43
the Philippines is keeping to its old restrictive policies and practices. In particular, the government’s stance on issues concerning its air services agreements is not compatible with its pronouncement of a progressive liberalization policy. The effect of such restrictive policies is reflected in the high degree of concentration in the country’s international aviation industry. The outcome is a decline in passenger traffic, tourists and tourist receipts.
EO 219 should be implemented quickly for the liberalization of the country’s
international air transport industry. But even this alone is not enough. The government needs to deepen its liberalization efforts by adopting a more flexible approach to its liberalization efforts.
The government needs to act quickly to promote competition in the industry.
As the experiences of other countries have shown, convenient and efficient air services brought about by greater competition are critical to attracting foreign investment, trade and tourism. To this end, this paper has identified areas where competition policy and new regulations should be defined and pursued to ensure that airlines are able to reap the benefits of their oligopolistic structure while at the same time protecting consumers from the abuse of market power.

44
References Ambidji Group Pty Ltd, 1997. Civil Aviation Master Plan, Department of
Transportation and Communications, Philippines. APEC, 1999. APEC Economic Leaders’ Declaration, Singapore. Baumol, William and Lee, Kyu Sik, 1991. ‘Contestable Markets, Trade and
Development,’ The World Bank Research Observer, vol. 6, no.1. The International Bank for Reconstruction and Development, World Bank.
Demsetz, Harold, 1988. ‘Efficiency, Competition, and Policy’, The Organization of
Economic Activity vol. 2, Blackwell, USA. Department of the Environment, Transportation and the Regions, 1999. GATS 2000
and Air Transport Services, http://www.aviation.detr.gov.uk. Department of the Environment, Transportation and the Regions, United Kingdom.
Department of Transportation and Communications, 1992. Civil Aviation Masterplan
Report, vol. 1. Department of Transportation and Communications. Findlay, Christopher, and Nikomborirak, Deunden, 1999. Air Transport, Paper
prepared for the East Asia Conference on Options for the WTO 2000 Negotiations, Manila.
Hanlon, Pat, 1996. Global Airlines, Competition in a Transnational Industry,
Butterworth-Heinemann, Great Britain. Magdoza, Marlo and Malagar, Leo, 1998. ‘The Implications of the General
Agreement on Trade in Services (GATS) on International Civil Aviation: Should We Do Away with ICAO?,’ in World Bulletin, January-April 1998, UP Law Center, Quezon City.
Ministry of Foreign Affairs, 1983. Philippine Bilateral Agreements, Manila. Needham, Douglas, 1978. The Economics of Industrial Structure Conduct and
Performance, St. Martin’s Press, New York. OECD, 1998.’Competition Policy and International Airport Services,’ Competition
Policy Roundtables No.16,http://www.oecd.org. Onuma, Toshiyuki, 1998. ‘The Future Regulatory Scheme of the International Civil
Aviation Industry’, in World Bulletin, Jan-Apr.1998, UP Law Center, Quezon City.
Pacific Economic Cooperation Council, 1999. Principles for Guiding the
Development of a Competition-Driven Policy Framework for APEC Economies, Singapore.

45
Philippine Airlines, 1999. Amended and Restated Rehabilitation Plan, Makati. Productivity Commission, 1998. International Air Services, Report No. 2, AusInfo,
Canberra. Rodolfo, Cherry Lyn S., 2000. For Whom Shall We Fly, Challenges to the Philippine
Aviation, University of Asia and the Pacific, Pasig City. Schwalbach, Joachim, 1991. ‘Entry, Exit, Concentration, and Market Contestability’
in Geroski, P. and Schwalbach, J. (editors), Entry and Market Contestability, An International Comparison, Blackwell, USA.
Stewart-Smith, Martin, 1999. Industry Structure and Regulation, World Bank. United Nations Conference on Trade and Development, 1999. Air Transport Services:
The Positive Agenda for Developing Countries, Report by the UNCTAD Secretariat.
US Air Transport Association, 1999. Airline Handbook, http://www.air-transport.org. Warren,Tony, Tamms, Vanessa and Findlay, Christopher, 1999. Beyond the Bilateral
System: Competition Policy and Trade in International Aviation Services, PECC Trade Policy Forum, Auckland.
WTO, 1998. Air Transport Services, Background Note by the Secretariat, Council for
Trade in Services.
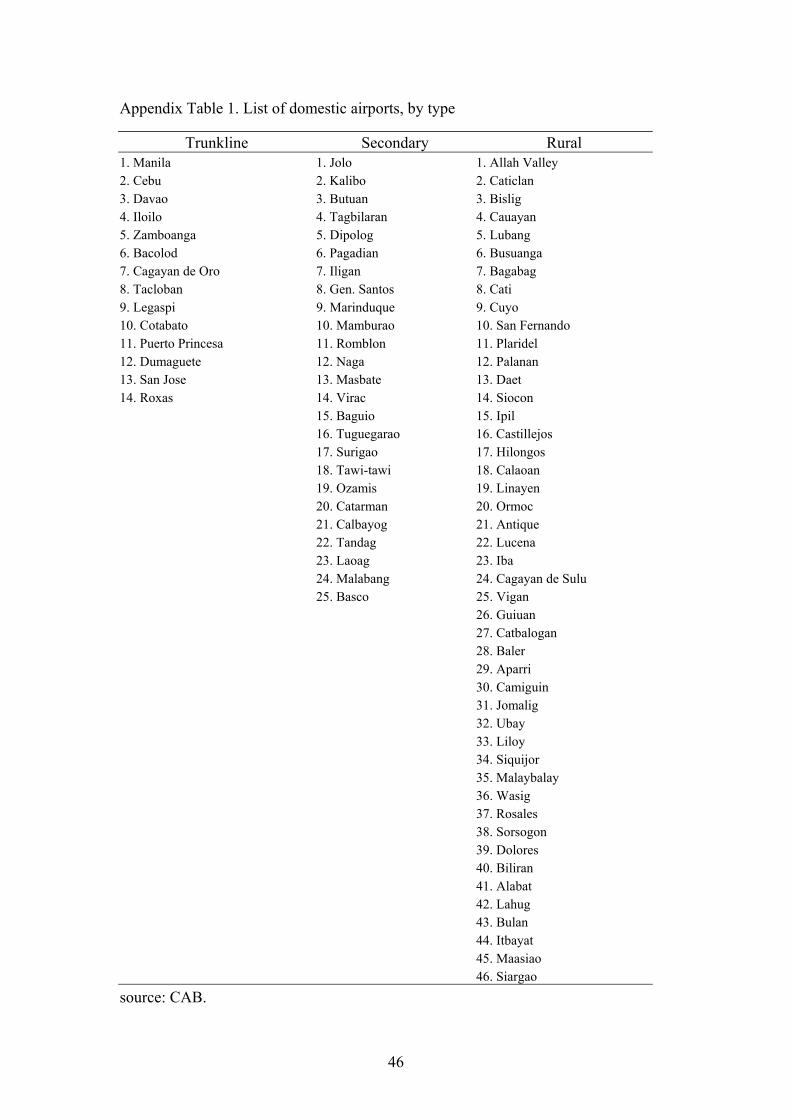
46
Appendix Table 1. List of domestic airports, by type
Trunkline Secondary Rural 1. Manila 1. Jolo 1. Allah Valley 2. Cebu 2. Kalibo 2. Caticlan 3. Davao 3. Butuan 3. Bislig 4. Iloilo 4. Tagbilaran 4. Cauayan 5. Zamboanga 5. Dipolog 5. Lubang 6. Bacolod 6. Pagadian 6. Busuanga 7. Cagayan de Oro 7. Iligan 7. Bagabag 8. Tacloban 8. Gen. Santos 8. Cati 9. Legaspi 9. Marinduque 9. Cuyo 10. Cotabato 10. Mamburao 10. San Fernando 11. Puerto Princesa 11. Romblon 11. Plaridel 12. Dumaguete 12. Naga 12. Palanan 13. San Jose 13. Masbate 13. Daet 14. Roxas 14. Virac 14. Siocon 15. Baguio 15. Ipil 16. Tuguegarao 16. Castillejos 17. Surigao 17. Hilongos 18. Tawi-tawi 18. Calaoan 19. Ozamis 19. Linayen 20. Catarman 20. Ormoc 21. Calbayog 21. Antique 22. Tandag 22. Lucena 23. Laoag 23. Iba 24. Malabang 24. Cagayan de Sulu 25. Basco 25. Vigan 26. Guiuan 27. Catbalogan 28. Baler 29. Aparri 30. Camiguin 31. Jomalig 32. Ubay 33. Liloy 34. Siquijor 35. Malaybalay 36. Wasig 37. Rosales 38. Sorsogon 39. Dolores 40. Biliran 41. Alabat 42. Lahug 43. Bulan 44. Itbayat 45. Maasiao 46. Siargao source: CAB.

Appendix Table 2. Pax load factor per airline, by sector, 1995-2000 (%)
1995 1996 1997 1998 1999 2000 1996 1997 1998 1999 2000 1996 1997 1998 1999 2000 1995 1996 1997 1998 1996 1997 1998 1999 2000 1996 1997 1998 1999A. Major TrunklineManila- Cebu- Manila 65.4 60.7 69.9 66.7 62.8 76.0 84.0 67.4 64.4 57.0 57.0 55.0 55.0 43.3 57.3 61.0 64.0Manila- Davao- Manila 59.2 55.9 64.7 70.0 65.6 77.9 78.0 71.5 69.3 42.0 75.0 67.0 68.4 68.0 52.6 57.7 50.0 57.0Manila- Zamboanga- Manila 71.1 60.6 70.8 59.2 31.0 50.4 45.5 59.0 75.0 53.0 62.0 59.0Manila- Bacolod- Manila 77.0 77.0 73.3 61.7 48.8 67.0 78.0 64.6 64.8 63.0 60.0 50.9 52.7Manila- Iloilo- Manila 85.0 71.5 77.3 61.5 64.0 74.0 76.0 60.0 64.2 66.0 75.0 75.0 66.0 64.0 46.1 42.0Manila- Legaspi- Manila 84.3 82.6 84.7 66.0 65.3 57.0 64.0 60.0 42.9 30.0Manila- Tacloban- Manila 84.7 77.4 78.7 59.0 61.8 76.0 83.0 68.5 64.0 50.4 42.0 56.0 46.0 53.0Manila-Puerto Prinsesa- Manila 75.5 69.0 73.4 63.5 58.2 74.0 66.0 73.8 66.0 39.2 43.0Manila-Cagayan de Oro-Manila 84.8 76.0 80.2 72.0 70.2 77.0 79.0 67.0 63.8 55.0 54.4 59.0 62.4 52.0 47.0Manila- Cotabato-Manila 73.2 61.1 62.2 55.3 44.0 77.0 69.0 64.0 58.0Manila-Dumaguete-Manila 76.8 61.1 73.3 32.0 44.6 72.0 60.0Manila-San Jose-Manila 63.6 70.3 82.7 52.0 56.0 58.0 51.6 50.2 49.0 62.0 68.5Manila-Roxas-Manila 74.0 70.3 74.5 65.4 39.7 44.6
B. Secondary/Rural RouteManila- Baguio- Manila 81.6 76.8 83.4 34.5 30.6 39.0 52.0 60.1Manila- Kalibo- Manila 82.6 81.9 78.2 61.6 61.0 78.0 52.0 45.6 58.2 61.0 66.1 48.7 47.0Manila-Calbayog-Manila 87.7 84.4 42.7 63.1 66.0Manila-Catarman-Manila 88.3 82.6 73.9 61.6 46.8 64.3 73.0 67.3Manila-Daet-Manila 77.4 72.1 68.8 33.6 40.7Manila-General Santos- Manila 59.1 63.0 61.4 54.0 63.0 62.0Manila-Laoag-Manila 66.9 68.5 65.2 41.0 30.0Manila-Marinduque-Manila 84.3 81.5 87.0 63.7 62.0 55.1Manila-Masbate-Manila 82.5 74.8 84.8 45.6 81.3 75.8 82.0 74.6Manila-Naga-Manila 91.6 89.9 89.6 53.6 51.0 64.0 39.0 35.0 41.5 56.4 49.0 43.9Manila-Tablas-Manila 75.2 69.0 47.3 59.7 57.0 66.0 58.7Manila-Tagbilaran-Manila 87.5 77.5 74.5 88.1 62.0 78.6Manila-Virac-Manila 85.6 61.5 79.0 47.0 45.0 26.0 46.3 48.0 65.0 67.0 74.2Cagayan-Davao-Cagayan 76.7 78.2 78.4 48.3 25.0 60.7 48.9 72.6Cagayan-Zamboanga-Cagayan 66.6 100.0 21.0Cebu-Bacolod-Cebu 80.7 84.2 81.8 44.1 43.0 55.0 65.5 21.0Cebu-Butuan-Cebu 84.5 81.4 83.3 32.3Cebu-Cagayan-Cebu 57.6 54.0 57.0 35.7 53.0 44.8 25.0 19.4 50.0Cebu-Cotabato-Cebu 71.8 49.9 81.5 17.9 39.8Cebu-Davao-Cebu 76.4 59.1 61.9 53.7 78.0 88.0 62.0 59.6 23.0Cebu-Dipolog-Cebu 82.3 76.6 68.6 36.5Cebu-General Santos- Cebu 89.2 83.8 79.5 49.0Cebu-Iloilo-Cebu 73.8 78.8 82.5 46.6 75.0 67.0 55.7 38.0Cebu-Kalibo-Cebu 76.7 77.7 80.6 52.0 43.9 56.0Cebu-Pagadian-Cebu 66.2 75.1 77.9 35.0 42.0 35.0Cebu-Puerto Princesa-Cebu 21.0Cebu-Surigao-Cebu 77.2 73.5 71.6 14.8 23.7Cebu-Tagbilaran-Cebu 66.0 42.8 43.5 34.0 21.2Cebu-Tandag-Cebu 83.4 78.6 83.1 44.0 39.5 39.0 37.7 55.1Cebu-Zamboanga-Cebu 69.0 60.7 68.1 34.7 48.9 57.0 47.0 5.0Cotabato-Zamboanga-Cotabato 67.5 43.2 78.3 52.2 48.7 51.0Davao- Gen San- Davao 42.8 35.0Davao-Zamboanga-Davao 75.9 77.5 72.9 51.1 66.0 50.0 48.0 48.3Dipolog-Zamboanga-Dipolog 72.0 59.2 70.1 38.8Iloilo-Puerto-Princesa-Iloilo 74.3 71.3 69.7 17.6Pagadian-Zamboanga-Pagadian 79.1 72.5 75.7 24.7Tacloban-Cebu-Tacloban 61.7 51.0 80.3 36.2 7.0Tawi-Tawi-Zamboanga-Tawi-tawi 81.6 71.2 73.6 43.1 50.3 45.3 60.2Note: No 1998 and 2000 data for PAL.source: CAB and Airlines
ASIAN SPIRIT MINDANAO EXPRESSCEBU PACIFIC AIRPHILIPPINE AIRLINESSECTOR GRAND AIRWAYSAIR PHILIPPINES
��
�
��
�
��
�
��
�
��
�
��
�
��
��
��
��
��
��
��
��
��
��
��
��
��
��
��
��
��
��
��
��
��
��
��
��
��������������������������������������������������������������������������������������������������������������������������������������������������������������������������������������������������������������������������������������������������������������������������������������������������������������������������������������������������������������������������������������������������������������������������������������
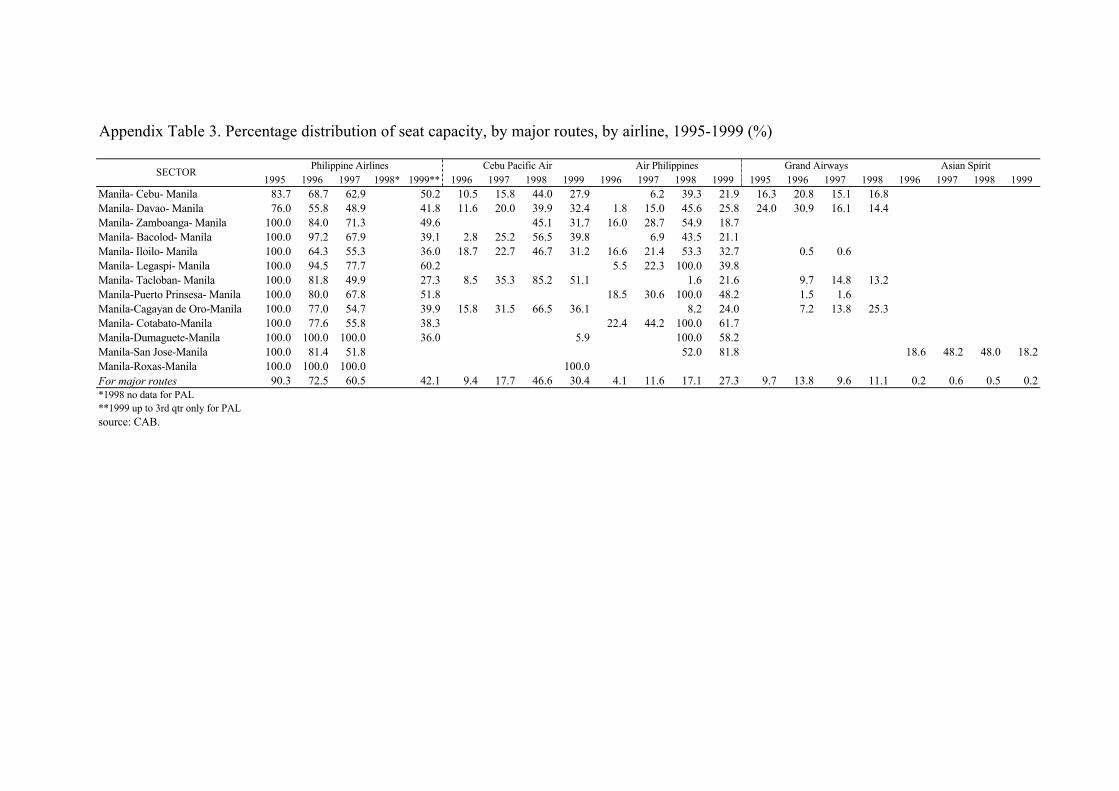
Appendix Table 3. Percentage distribution of seat capacity, by major routes, by airline, 1995-1999 (%)
1995 1996 1997 1998* 1999** 1996 1997 1998 1999 1996 1997 1998 1999 1995 1996 1997 1998 1996 1997 1998 1999Manila- Cebu- Manila 83.7 68.7 62.9 50.2 10.5 15.8 44.0 27.9 6.2 39.3 21.9 16.3 20.8 15.1 16.8Manila- Davao- Manila 76.0 55.8 48.9 41.8 11.6 20.0 39.9 32.4 1.8 15.0 45.6 25.8 24.0 30.9 16.1 14.4Manila- Zamboanga- Manila 100.0 84.0 71.3 49.6 45.1 31.7 16.0 28.7 54.9 18.7Manila- Bacolod- Manila 100.0 97.2 67.9 39.1 2.8 25.2 56.5 39.8 6.9 43.5 21.1Manila- Iloilo- Manila 100.0 64.3 55.3 36.0 18.7 22.7 46.7 31.2 16.6 21.4 53.3 32.7 0.5 0.6Manila- Legaspi- Manila 100.0 94.5 77.7 60.2 5.5 22.3 100.0 39.8Manila- Tacloban- Manila 100.0 81.8 49.9 27.3 8.5 35.3 85.2 51.1 1.6 21.6 9.7 14.8 13.2Manila-Puerto Prinsesa- Manila 100.0 80.0 67.8 51.8 18.5 30.6 100.0 48.2 1.5 1.6Manila-Cagayan de Oro-Manila 100.0 77.0 54.7 39.9 15.8 31.5 66.5 36.1 8.2 24.0 7.2 13.8 25.3Manila- Cotabato-Manila 100.0 77.6 55.8 38.3 22.4 44.2 100.0 61.7Manila-Dumaguete-Manila 100.0 100.0 100.0 36.0 5.9 100.0 58.2Manila-San Jose-Manila 100.0 81.4 51.8 52.0 81.8 18.6 48.2 48.0 18.2Manila-Roxas-Manila 100.0 100.0 100.0 100.0For major routes 90.3 72.5 60.5 42.1 9.4 17.7 46.6 30.4 4.1 11.6 17.1 27.3 9.7 13.8 9.6 11.1 0.2 0.6 0.5 0.2*1998 no data for PAL**1999 up to 3rd qtr only for PALsource: CAB.
Grand Airways Asian SpiritPhilippine AirlinesSECTOR Cebu Pacific Air Air Philippines
��
�
��
�
���
�
��
�
��
�
����������������������������������������������������������������������������������������������������������������������������������������������������������������������������������������������������������������������������������������������������������������������������������������������������������������������������������������������������������������
���������������������������������������������������������������������������������������������������������������������������������������������������������������������������������������������������������������������������������������������������������������������������������������������������������������������������������������������������������������������������������������������������������������������������������������
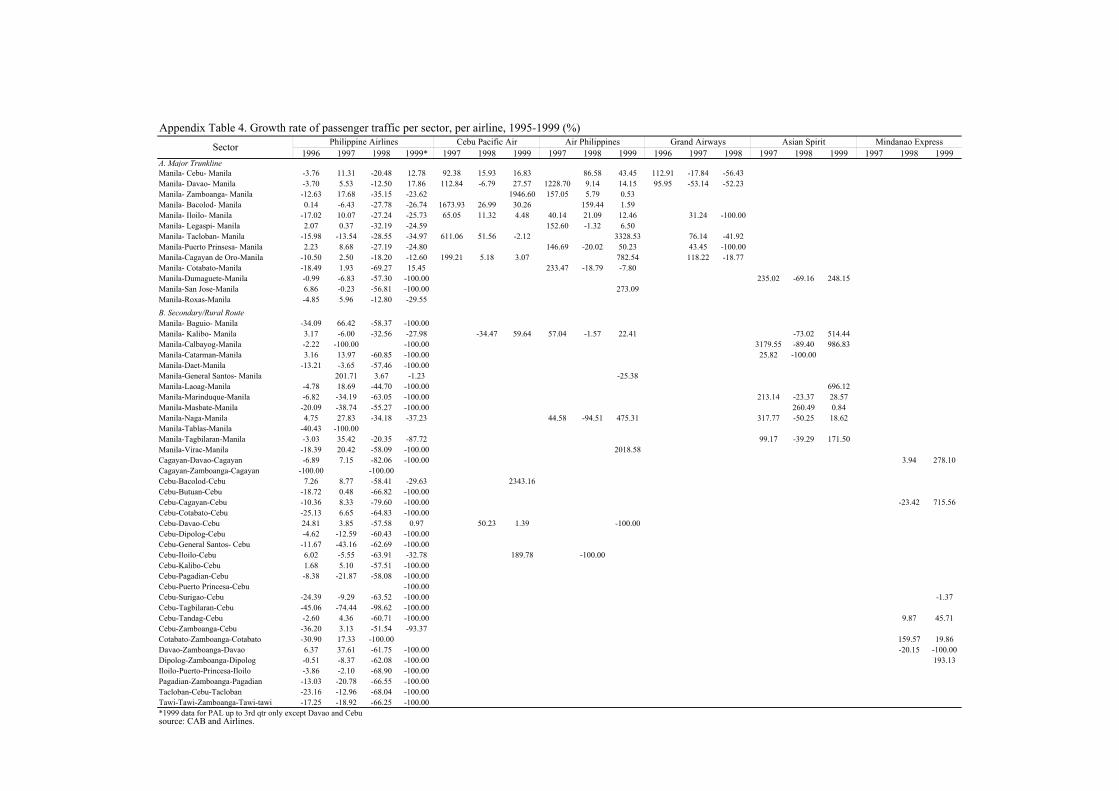
Appendix Table 4. Growth rate of passenger traffic per sector, per airline, 1995-1999 (%)
1996 1997 1998 1999* 1997 1998 1999 1997 1998 1999 1996 1997 1998 1997 1998 1999 1997 1998 1999A. Major TrunklineManila- Cebu- Manila -3.76 11.31 -20.48 12.78 92.38 15.93 16.83 86.58 43.45 112.91 -17.84 -56.43Manila- Davao- Manila -3.70 5.53 -12.50 17.86 112.84 -6.79 27.57 1228.70 9.14 14.15 95.95 -53.14 -52.23Manila- Zamboanga- Manila -12.63 17.68 -35.15 -23.62 1946.60 157.05 5.79 0.53Manila- Bacolod- Manila 0.14 -6.43 -27.78 -26.74 1673.93 26.99 30.26 159.44 1.59Manila- Iloilo- Manila -17.02 10.07 -27.24 -25.73 65.05 11.32 4.48 40.14 21.09 12.46 31.24 -100.00Manila- Legaspi- Manila 2.07 0.37 -32.19 -24.59 152.60 -1.32 6.50Manila- Tacloban- Manila -15.98 -13.54 -28.55 -34.97 611.06 51.56 -2.12 3328.53 76.14 -41.92Manila-Puerto Prinsesa- Manila 2.23 8.68 -27.19 -24.80 146.69 -20.02 50.23 43.45 -100.00Manila-Cagayan de Oro-Manila -10.50 2.50 -18.20 -12.60 199.21 5.18 3.07 782.54 118.22 -18.77Manila- Cotabato-Manila -18.49 1.93 -69.27 15.45 233.47 -18.79 -7.80Manila-Dumaguete-Manila -0.99 -6.83 -57.30 -100.00 235.02 -69.16 248.15Manila-San Jose-Manila 6.86 -0.23 -56.81 -100.00 273.09Manila-Roxas-Manila -4.85 5.96 -12.80 -29.55B. Secondary/Rural RouteManila- Baguio- Manila -34.09 66.42 -58.37 -100.00Manila- Kalibo- Manila 3.17 -6.00 -32.56 -27.98 -34.47 59.64 57.04 -1.57 22.41 -73.02 514.44Manila-Calbayog-Manila -2.22 -100.00 -100.00 3179.55 -89.40 986.83Manila-Catarman-Manila 3.16 13.97 -60.85 -100.00 25.82 -100.00Manila-Daet-Manila -13.21 -3.65 -57.46 -100.00Manila-General Santos- Manila 201.71 3.67 -1.23 -25.38Manila-Laoag-Manila -4.78 18.69 -44.70 -100.00 696.12Manila-Marinduque-Manila -6.82 -34.19 -63.05 -100.00 213.14 -23.37 28.57Manila-Masbate-Manila -20.09 -38.74 -55.27 -100.00 260.49 0.84Manila-Naga-Manila 4.75 27.83 -34.18 -37.23 44.58 -94.51 475.31 317.77 -50.25 18.62Manila-Tablas-Manila -40.43 -100.00Manila-Tagbilaran-Manila -3.03 35.42 -20.35 -87.72 99.17 -39.29 171.50Manila-Virac-Manila -18.39 20.42 -58.09 -100.00 2018.58Cagayan-Davao-Cagayan -6.89 7.15 -82.06 -100.00 3.94 278.10Cagayan-Zamboanga-Cagayan -100.00 -100.00Cebu-Bacolod-Cebu 7.26 8.77 -58.41 -29.63 2343.16Cebu-Butuan-Cebu -18.72 0.48 -66.82 -100.00Cebu-Cagayan-Cebu -10.36 8.33 -79.60 -100.00 -23.42 715.56Cebu-Cotabato-Cebu -25.13 6.65 -64.83 -100.00Cebu-Davao-Cebu 24.81 3.85 -57.58 0.97 50.23 1.39 -100.00Cebu-Dipolog-Cebu -4.62 -12.59 -60.43 -100.00Cebu-General Santos- Cebu -11.67 -43.16 -62.69 -100.00Cebu-Iloilo-Cebu 6.02 -5.55 -63.91 -32.78 189.78 -100.00Cebu-Kalibo-Cebu 1.68 5.10 -57.51 -100.00Cebu-Pagadian-Cebu -8.38 -21.87 -58.08 -100.00Cebu-Puerto Princesa-Cebu -100.00Cebu-Surigao-Cebu -24.39 -9.29 -63.52 -100.00 -1.37Cebu-Tagbilaran-Cebu -45.06 -74.44 -98.62 -100.00Cebu-Tandag-Cebu -2.60 4.36 -60.71 -100.00 9.87 45.71Cebu-Zamboanga-Cebu -36.20 3.13 -51.54 -93.37Cotabato-Zamboanga-Cotabato -30.90 17.33 -100.00 159.57 19.86Davao-Zamboanga-Davao 6.37 37.61 -61.75 -100.00 -20.15 -100.00Dipolog-Zamboanga-Dipolog -0.51 -8.37 -62.08 -100.00 193.13Iloilo-Puerto-Princesa-Iloilo -3.86 -2.10 -68.90 -100.00Pagadian-Zamboanga-Pagadian -13.03 -20.78 -66.55 -100.00Tacloban-Cebu-Tacloban -23.16 -12.96 -68.04 -100.00Tawi-Tawi-Zamboanga-Tawi-tawi -17.25 -18.92 -66.25 -100.00*1999 data for PAL up to 3rd qtr only except Davao and Cebusource: CAB and Airlines.
Sector Mindanao ExpressAsian SpiritPhilippine Airlines Grand AirwaysAir PhilippinesCebu Pacific Air
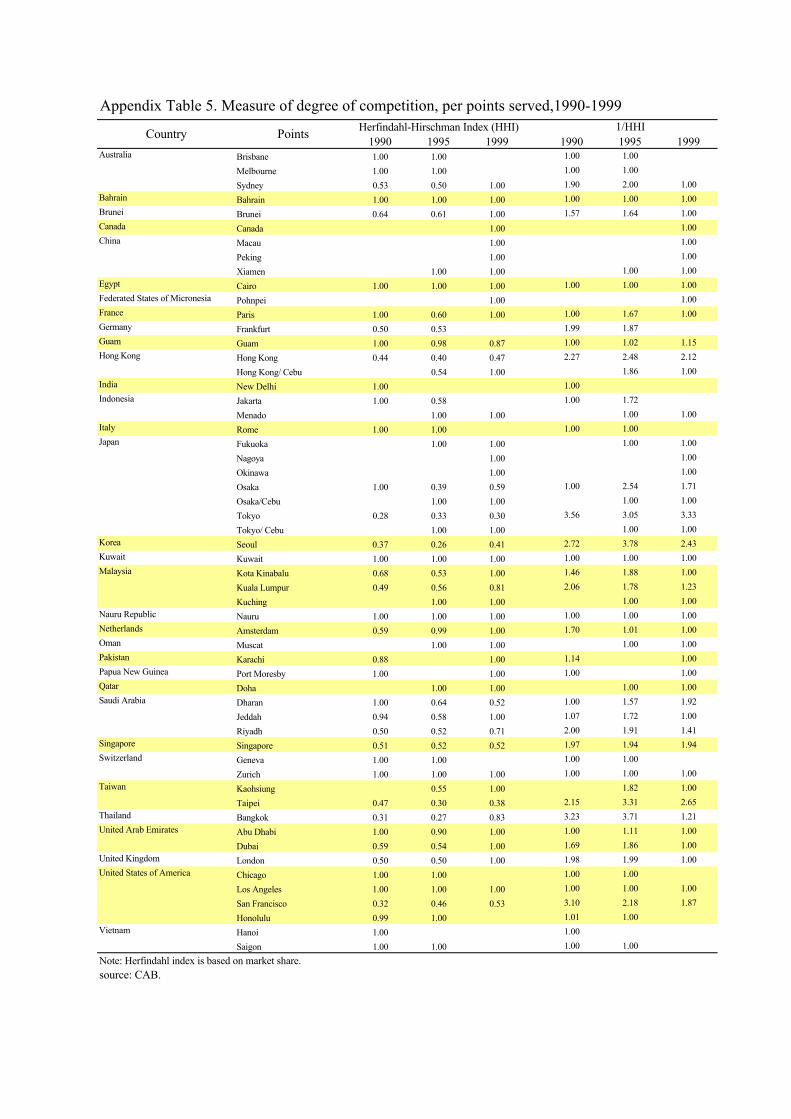
Appendix Table 5. Measure of degree of competition, per points served,1990-1999
1990 1995 1999 1990 1995 1999Brisbane 1.00 1.00 1.00 1.00
Melbourne 1.00 1.00 1.00 1.00
Sydney 0.53 0.50 1.00 1.90 2.00 1.00Bahrain Bahrain 1.00 1.00 1.00 1.00 1.00 1.00Brunei Brunei 0.64 0.61 1.00 1.57 1.64 1.00Canada Canada 1.00 1.00
Macau 1.00 1.00
Peking 1.00 1.00
Xiamen 1.00 1.00 1.00 1.00Egypt Cairo 1.00 1.00 1.00 1.00 1.00 1.00Federated States of Micronesia Pohnpei 1.00 1.00France Paris 1.00 0.60 1.00 1.00 1.67 1.00Germany Frankfurt 0.50 0.53 1.99 1.87Guam Guam 1.00 0.98 0.87 1.00 1.02 1.15
Hong Kong 0.44 0.40 0.47 2.27 2.48 2.12
Hong Kong/ Cebu 0.54 1.00 1.86 1.00India New Delhi 1.00 1.00
Jakarta 1.00 0.58 1.00 1.72
Menado 1.00 1.00 1.00 1.00Italy Rome 1.00 1.00 1.00 1.00
Fukuoka 1.00 1.00 1.00 1.00
Nagoya 1.00 1.00
Okinawa 1.00 1.00
Osaka 1.00 0.39 0.59 1.00 2.54 1.71
Osaka/Cebu 1.00 1.00 1.00 1.00
Tokyo 0.28 0.33 0.30 3.56 3.05 3.33
Tokyo/ Cebu 1.00 1.00 1.00 1.00Korea Seoul 0.37 0.26 0.41 2.72 3.78 2.43Kuwait Kuwait 1.00 1.00 1.00 1.00 1.00 1.00
Kota Kinabalu 0.68 0.53 1.00 1.46 1.88 1.00
Kuala Lumpur 0.49 0.56 0.81 2.06 1.78 1.23
Kuching 1.00 1.00 1.00 1.00Nauru Republic Nauru 1.00 1.00 1.00 1.00 1.00 1.00Netherlands Amsterdam 0.59 0.99 1.00 1.70 1.01 1.00Oman Muscat 1.00 1.00 1.00 1.00Pakistan Karachi 0.88 1.00 1.14 1.00Papua New Guinea Port Moresby 1.00 1.00 1.00 1.00Qatar Doha 1.00 1.00 1.00 1.00
Dharan 1.00 0.64 0.52 1.00 1.57 1.92
Jeddah 0.94 0.58 1.00 1.07 1.72 1.00
Riyadh 0.50 0.52 0.71 2.00 1.91 1.41Singapore Singapore 0.51 0.52 0.52 1.97 1.94 1.94
Geneva 1.00 1.00 1.00 1.00
Zurich 1.00 1.00 1.00 1.00 1.00 1.00
Kaohsiung 0.55 1.00 1.82 1.00
Taipei 0.47 0.30 0.38 2.15 3.31 2.65Thailand Bangkok 0.31 0.27 0.83 3.23 3.71 1.21
Abu Dhabi 1.00 0.90 1.00 1.00 1.11 1.00
Dubai 0.59 0.54 1.00 1.69 1.86 1.00United Kingdom London 0.50 0.50 1.00 1.98 1.99 1.00
Chicago 1.00 1.00 1.00 1.00
Los Angeles 1.00 1.00 1.00 1.00 1.00 1.00
San Francisco 0.32 0.46 0.53 3.10 2.18 1.87
Honolulu 0.99 1.00 1.01 1.00
Hanoi 1.00 1.00
Saigon 1.00 1.00 1.00 1.00
Note: Herfindahl index is based on market share.source: CAB.
Hong Kong
Indonesia
Vietnam
Taiwan
United Arab Emirates
United States of America
Japan
Malaysia
Saudi Arabia
Switzerland
1/HHIHerfindahl-Hirschman Index (HHI)
Australia
China
PointsCountry�������������������������������������������������������������������������������� ��������������������������������������������������������������������������������

App_6.doc c:\PAL_Intl,sheet(4)2
51
Appendix Table 6. PAL's major destination points,1990,1995,1999
1990 1995 1999 Points served Passenger % Share
Points served Passenger % Share
Points served Passenger % Share
Hong Kong 354,787 22.4 Hong Kong 519,330 21.6 Hong Kong 388,483 29.5 Tokyo 217,338 13.7 Los Angeles 249,710 10.4 Tokyo 185,026 14.0 Los Angeles 140,187 8.8 Tokyo 249,108 10.3 Los Angeles 168,376 12.8 Singapore 126,388 8.0 Taipei 179,980 7.5 San Francisco 134,115 10.2 Taipei 126,054 7.9 San Francisco 155,292 6.4 Singapore 80,283 6.1 San Francisco 116,797 7.4 Singapore 118,567 4.9 Taipei 72,300 5.5 Riyadh 76,159 4.8 Seoul 91,416 3.8 Seoul 64,236 4.9 Bangkok 71,401 4.5 Sydney 71,908 3.0 Osaka 38,170 2.9 Sydney 48,235 3.0 Bangkok 69,160 2.9 Fukuoka 34,194 2.6 Dharan 43,571 2.7 Honululu 63,372 2.6 Dharan 24,526 1.9 Others 264,855 16.7 Others 641,798 26.6 Others 128,530 9.8 Total 1,585,772 100.0 Total 2,409,641 100.0 Total 1,318,239 100.0
source: CAB.

App_7.doc c:\ranks,sheet1
52
Appendix Table 7. Spearman rank correlation test for Herfindahl-Hirschman Index and market share to tourists arrival, 1995
Herfindahl-Hirschman Index (HHI)
Share to visitors arrival (%) Country
HHI Rank % share Rank d2
United States of America 0.476 13 21.251 1 144 Hong Kong 0.412 14 20.071 2 144 Taiwan 0.320 15 11.826 3 144 South Korea 0.264 18 7.549 4 196 Japan 0.283 16 6.654 5 121 Australia 0.563 8 4.713 6 4 United Kingdom 0.502 11 4.384 7 16 Germany 0.534 9 3.153 8 1 Malaysia 0.568 7 2.171 9 4 Singapore 0.516 10 1.697 10 0 France 0.600 5 1.121 11 36 Switzerland 1.000 1.5 0.915 12 110 Thailand 0.270 17 0.881 13 16 Italy 0.999 3 0.791 14 121 Indonesia 0.500 12 0.790 15 9 Netherlands 0.993 4 0.758 16 144 Saudi Arabia 0.578 6 0.752 17 121 China 1.000 1.5 0.534 18 272.3 sources: Table 12 and 17.
Spearman rank correlation test: Rs = 1 - [(6Σdi2) / n(n2-1)]
= -0.6548 where di = difference between the ranks; n = number of samples. The test was significant at α = 0.05.
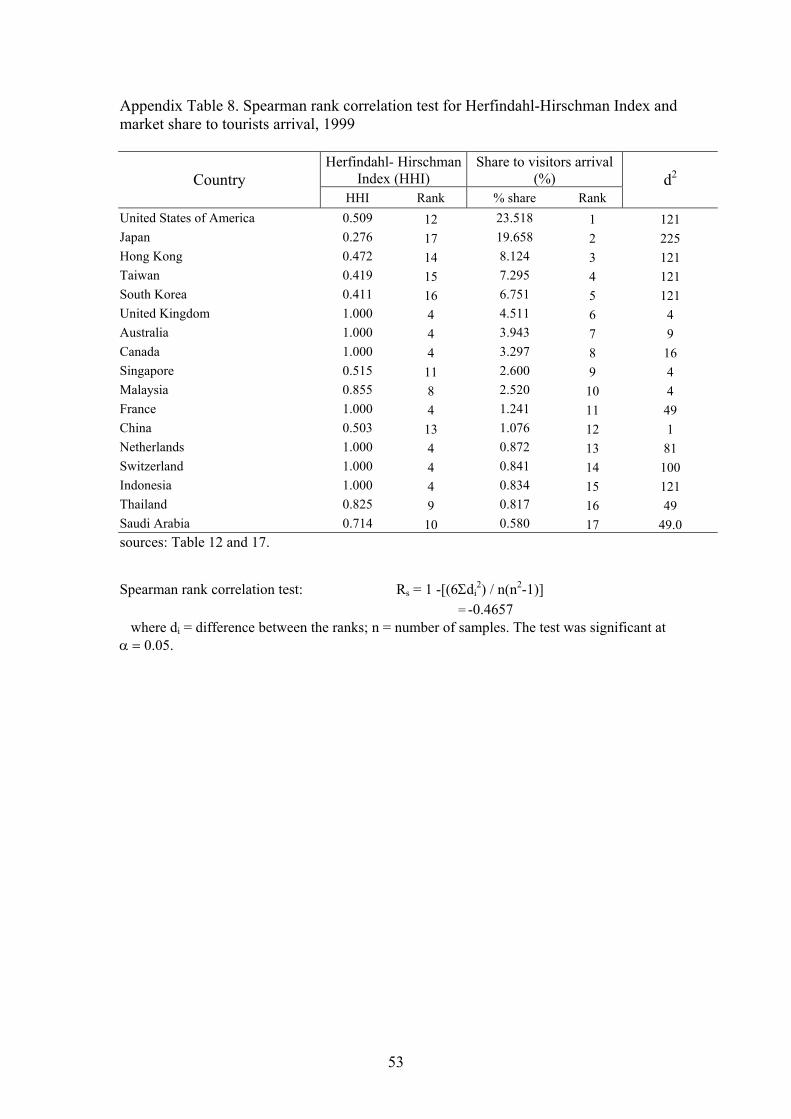
App_8.doc c:\ranks,sheet2
53
Appendix Table 8. Spearman rank correlation test for Herfindahl-Hirschman Index and market share to tourists arrival, 1999
Herfindahl- Hirschman Index (HHI)
Share to visitors arrival (%) Country
HHI Rank % share Rank d2
United States of America 0.509 12 23.518 1 121 Japan 0.276 17 19.658 2 225 Hong Kong 0.472 14 8.124 3 121 Taiwan 0.419 15 7.295 4 121 South Korea 0.411 16 6.751 5 121 United Kingdom 1.000 4 4.511 6 4 Australia 1.000 4 3.943 7 9 Canada 1.000 4 3.297 8 16 Singapore 0.515 11 2.600 9 4 Malaysia 0.855 8 2.520 10 4 France 1.000 4 1.241 11 49 China 0.503 13 1.076 12 1 Netherlands 1.000 4 0.872 13 81 Switzerland 1.000 4 0.841 14 100 Indonesia 1.000 4 0.834 15 121 Thailand 0.825 9 0.817 16 49 Saudi Arabia 0.714 10 0.580 17 49.0 sources: Table 12 and 17.
Spearman rank correlation test: Rs = 1 -[(6Σdi2) / n(n2-1)]
= -0.4657 where di = difference between the ranks; n = number of samples. The test was significant at α = 0.05.