philippine institute of pure and applied chemistry
DESCRIPTION
Philippine Institute of Pure and Applied Chemistry. CONTROL CHARTS. Dr. Ronald M. Fabicon. Learning Objectives The Control Chart Techniques State of Introduction Control Specifications Process Capability Six Sigma Different Control Charts Control Charts in Analytical Laboratories. - PowerPoint PPT PresentationTRANSCRIPT
Philippine Institute of Pure and Applied Chemistry
In partnership with industry, A catalyst for progress
Philippine Institute of Pure and Applied Chemistry
CONTROL CHARTS
Dr. Ronald M. Fabicon
Philippine Institute of Pure and Applied Chemistry
In partnership with industry, A catalyst for progress
Learning Objectives The Control Chart Techniques State of Introduction Control Specifications Process Capability Six Sigma Different Control Charts Control Charts in Analytical Laboratories
OUTLINE

Philippine Institute of Pure and Applied Chemistry
In partnership with industry, A catalyst for progress
LEARNING OBJECTIVESLEARNING OBJECTIVES
When you have completed this part of the training course you should:
Know the three categories of variation and their sources. Understand the concept of the control chart method. Know the purpose of variable control charts. Know how to select the quality characteristics, the rational
subgroup and the method of taking samples

Philippine Institute of Pure and Applied Chemistry
In partnership with industry, A catalyst for progress
When you have completed this part of the training course you should:
Be able to calculate the central value, trial control limits and the revised control limits for X bar and R chart.
Be able to explain what is meant by a process in control and the various out-of-control patterns.
Know the difference between individual measurements and averages; control limits and specifications.
LEARNING OBJECTIVESLEARNING OBJECTIVES

Philippine Institute of Pure and Applied Chemistry
In partnership with industry, A catalyst for progress
When you have completed this training you should:Know the different situations between the process spread and specifications and what can be done to correct the undesirable situation.Be able to calculate process capability.Know the statistical meaning of 6σ
LEARNING OBJECTIVESLEARNING OBJECTIVES

Philippine Institute of Pure and Applied Chemistry
In partnership with industry, A catalyst for progress
The variation concept is a law of nature in that no two natural items in any category are the same.
VARIATIONVARIATION
Philippine Institute of Pure and Applied Chemistry
In partnership with industry, A catalyst for progress
The variation may be quite large and easily noticeable
The variation may be very small. It may appear that items are identical; however, precision instruments will show difference
The ability to measure variation is necessary before it can be controlled
VARIATIONVARIATION

Philippine Institute of Pure and Applied Chemistry
In partnership with industry, A catalyst for progress
VARIATIONVARIATION
There are three categories of variation in piece part production:
1. Within-piece variation: Surface
2. Piece-to-piece variation: Among pieces produced at the same time
3. Time-to-time variation: Difference in product produced at different times of the day

Philippine Institute of Pure and Applied Chemistry
In partnership with industry, A catalyst for progress
Materials
ToolsTools
OperatorsOperators MethodsMethods MeasurementMeasurement InstrumentsInstruments
HumanHumanInspectionInspectionPerformancePerformance
EnvironmentEnvironmentMachinesMachines
INPUTSINPUTS PROCESSPROCESS OUTPUTSOUTPUTS
Sources of Variation in production processes:
VARIATIONVARIATION

Philippine Institute of Pure and Applied Chemistry
In partnership with industry, A catalyst for progress
Sources of variation are:1. Equipment:
1. Toolwear2. Machine vibration3. Electrical fluctuations etc.
2. Material1. Tensile strength2. Ductility3. Thickness4. Porosity etc.
VARIATIONVARIATION

Philippine Institute of Pure and Applied Chemistry
In partnership with industry, A catalyst for progress
Sources of variation are:3. Environment
1. Temperature2. Light3. Radiation4. Humidity etc.
4. Operator1. Personal problem2. Physical problem etc.
VARIATIONVARIATION

Philippine Institute of Pure and Applied Chemistry
In partnership with industry, A catalyst for progress
There is also a reported variation which is due to the inspection activity.
Variation due to inspection should account for one tenth of the four other sources of variation.
VARIATIONVARIATION

Philippine Institute of Pure and Applied Chemistry
In partnership with industry, A catalyst for progress
Variation may be due to chance causes (random causes) or assignable causes.
When only chance causes are present, then the process is said to be in a state of statistical control. The process is stable and predictable.
VARIATIONVARIATION

Philippine Institute of Pure and Applied Chemistry
In partnership with industry, A catalyst for progressCONTROL CHART
• Is a plot of a parameter being monitored (at the y-axis) versus run number (x-axis)
• Lines in the control chart:
Mean line
Warning Limits
Critical/Action Limits

Philippine Institute of Pure and Applied Chemistry
In partnership with industry, A catalyst for progressCONTROL CHART

Philippine Institute of Pure and Applied Chemistry
In partnership with industry, A catalyst for progressCONTROL CHART
Upper Critical Limit (UCL) = x + 3s
Upper Warning Limit (UWL) = x + 2s
Lower Warning Limit (LWL) = x - 2s
Lower Critical Limit (UCL) = x - 3s
Mean = x

Philippine Institute of Pure and Applied Chemistry
In partnership with industry, A catalyst for progress
Variable datax-bar and R-chartsx-bar and s-chartsCharts for individuals (x-charts)
Attribute dataFor “defectives” (p-chart, np-chart)For “defects” (c-chart, u-chart)
CONTROL CHARTSCONTROL CHARTS

Philippine Institute of Pure and Applied Chemistry
In partnership with industry, A catalyst for progress
ControlCharts
RChart
VariablesCharts
AttributesCharts
XChart
PChart
CChart
Continuous Numerical Data
Categorical or Discrete Numerical Data
CONTROL CHARTSCONTROL CHARTS

Philippine Institute of Pure and Applied Chemistry
In partnership with industry, A catalyst for progress
The control chart for variables is a means of visualizing the variations that occur in the central tendency and the mean of a set of observations.
It shows whether or not a process is in a stable state.
CONTROL CHART FOR VARIABLESCONTROL CHART FOR VARIABLES

Philippine Institute of Pure and Applied Chemistry
In partnership with industry, A catalyst for progress
Example of a control chart
CONTROL CHARTSCONTROL CHARTS

Philippine Institute of Pure and Applied Chemistry
In partnership with industry, A catalyst for progressControl ChartsControl Charts
Figure 5-1 Example of a method of reporting inspection results

Philippine Institute of Pure and Applied Chemistry
In partnership with industry, A catalyst for progress
The objectives of the variable control charts are: For quality improvement To determine the process capability For decisions regarding product specifications For current decisions on the production process For current decisions on recently produced items
VARIABLE CONTROL CHARTSVARIABLE CONTROL CHARTS

Philippine Institute of Pure and Applied Chemistry
In partnership with industry, A catalyst for progress
Procedure for establishing a pair of control charts for the average X bar and the range R:
1. Select the quality characteristic
2. Choose the rational subgroup
3. Collect the data
4. Determine the trial center line and control limits
5. Establish the revised central line and control limits
6. Achieve the objective
CONTROL CHART TECHNIQUESCONTROL CHART TECHNIQUES

Philippine Institute of Pure and Applied Chemistry
In partnership with industry, A catalyst for progress
The Quality Characteristic must be measurable. It can expressed in terms of the seven basic units:
1.Length2.Mass3.Time4.Electrical current5.Temperature6.Substance7.Luminosity, etc
QUALITY CHARACTERISTICSQUALITY CHARACTERISTICS

Philippine Institute of Pure and Applied Chemistry
In partnership with industry, A catalyst for progress
A rational subgroup is one in which the variation within a group is due only to chance causes.
Within-subgroup variation is used to determine the control limits.
Variation between subgroups is used to evaluate long-term stability.
RATIONAL SUBGROUPRATIONAL SUBGROUP

Philippine Institute of Pure and Applied Chemistry
In partnership with industry, A catalyst for progress
There are two schemes for selecting the subgroup samples:
1. Select subgroup samples from product or service produced at one instant of time or as close to that instant as possible
2. Select from product or service produced over a period of time that is representative of all the products or services
RATIONAL SUBGROUPRATIONAL SUBGROUP
Philippine Institute of Pure and Applied Chemistry
In partnership with industry, A catalyst for progress
The first scheme will have a minimum variation within a subgroup.The second scheme will have a minimum variation among subgroups.The first scheme is the most commonly used since it provides a particular time reference for determining assignable causes.The second scheme provides better overall results and will provide a more accurate picture of the quality.
RATIONAL SUBGROUPRATIONAL SUBGROUP

Philippine Institute of Pure and Applied Chemistry
In partnership with industry, A catalyst for progress
As the subgroup size increases, the control limits become closer to the central value, which make the control chart more sensitive to small variations in the process average
As the subgroup size increases, the inspection cost per subgroup increases
When destructive testing is used and the item is expensive, a small subgroup size is required
SUBGROUP SIZESUBGROUP SIZE

Philippine Institute of Pure and Applied Chemistry
In partnership with industry, A catalyst for progress
From a statistical basis a distribution of subgroup averages are nearly normal for groups of 4 or more even when samples are taken from a non-normal distribution
When a subgroup size of 10 or more is used, the s chart should be used instead of the R chart. .
SUBGROUP SIZESUBGROUP SIZE

Philippine Institute of Pure and Applied Chemistry
In partnership with industry, A catalyst for progress
It is necessary to collect a minimum of 25 subgroups of data.
A run chart can be used to analyze the data in the development stage of a product or prior to a state of statistical control
DATA COLLECTIONDATA COLLECTION

Philippine Institute of Pure and Applied Chemistry
In partnership with industry, A catalyst for progress
Central Lines are obtained using:
TRIAL CENTRAL LINESTRIAL CENTRAL LINES
Philippine Institute of Pure and Applied Chemistry
In partnership with industry, A catalyst for progress
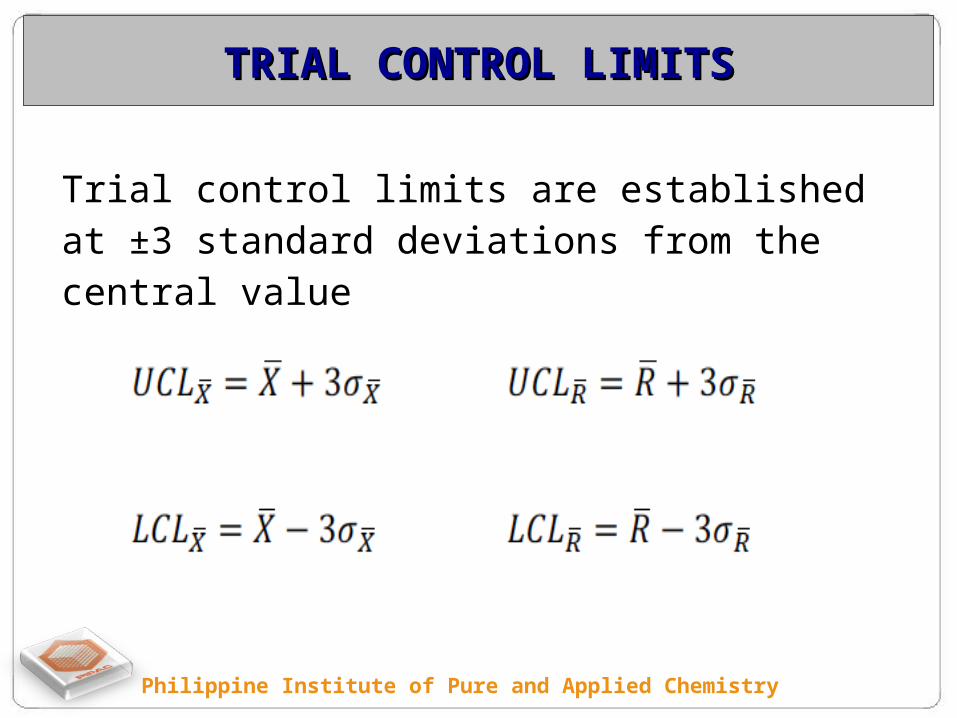
Trial control limits are established at ±3 standard deviations from the central value
TRIAL CONTROL LIMITSTRIAL CONTROL LIMITS

Philippine Institute of Pure and Applied Chemistry
In partnership with industry, A catalyst for progress
2 4
2 3
RX
RX
UCL X A R UCL D R
LCL X A R LCL D R
In practice calculations are simplified by using the following equations where A2,D3 and D4 are factors
that vary with the subgroup size and are found in Table B of the Appendix.
TRIAL CONTROL LIMITSTRIAL CONTROL LIMITS

Philippine Institute of Pure and Applied Chemistry
In partnership with industry, A catalyst for progress

Philippine Institute of Pure and Applied Chemistry
In partnership with industry, A catalyst for progress
2 4
2 3
RX
RX
UCL X A R UCL D R
LCL X A R LCL D R
pH meters in a certain analytical laboratory are calibrated daily at the start of the working day (8:00 AM). A standard pH 7.000 solution was read using the instrument at the end of the day. The following data were collected over a 25 day period. Determine center line and trial control limits.
TRIAL CONTROL LIMITS - SAMPLETRIAL CONTROL LIMITS - SAMPLE

Philippine Institute of Pure and Applied Chemistry
In partnership with industry, A catalyst for progress
2 4
2 3
RX
RX
UCL X A R UCL D R
LCL X A R LCL D R
TRIAL CONTROL LIMITS - SAMPLETRIAL CONTROL LIMITS - SAMPLE
Philippine Institute of Pure and Applied Chemistry
In partnership with industry, A catalyst for progress
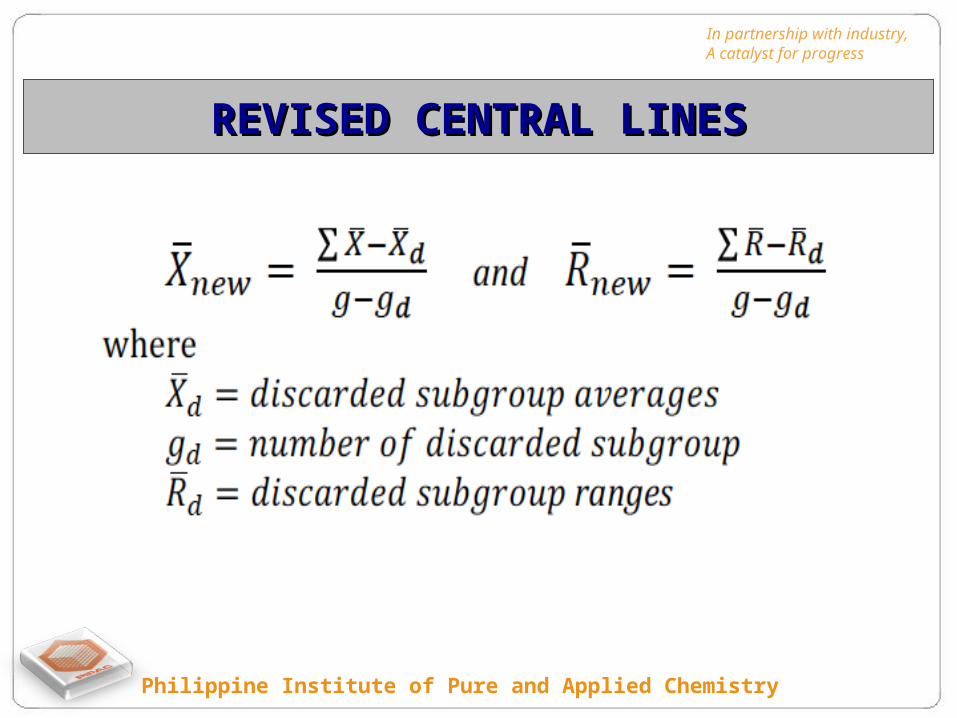
REVISED CENTRAL LINESREVISED CENTRAL LINES

Philippine Institute of Pure and Applied Chemistry
In partnership with industry, A catalyst for progressREVISED CENTRAL LINESREVISED CENTRAL LINES

Philippine Institute of Pure and Applied Chemistry
In partnership with industry, A catalyst for progress
Continuing use of control charts, showing improved quality
ACHIEVING THE QUALITY OBJECTIVEACHIEVING THE QUALITY OBJECTIVE

Philippine Institute of Pure and Applied Chemistry
In partnership with industry, A catalyst for progress
Process in Control When special causes have been eliminated from
the process to the extent that the points plotted on the control chart remain within the control limits, the process is in a state of control
When a process is in control, there occurs a natural pattern of variation
STATE OF CONTROLSTATE OF CONTROL

Philippine Institute of Pure and Applied Chemistry
In partnership with industry, A catalyst for progress
Natural pattern of variation of a control chart
STATE OF CONTROLSTATE OF CONTROL

Philippine Institute of Pure and Applied Chemistry
In partnership with industry, A catalyst for progress
Types of errors:Type I, occurs when looking for a special cause of variation when in reality a common cause is present
Type II, occurs when assuming that a common cause of variation is present when in reality there is a special cause
STATE OF CONTROLSTATE OF CONTROL

Philippine Institute of Pure and Applied Chemistry
In partnership with industry, A catalyst for progress
When the process is in control:
1. Individual units of the product or service will be more uniform
2. Since the product is more uniform, fewer samples are needed to judge the quality
3. The process capability or spread of the process is easily attained from 6ơ
4. Trouble can be anticipated before it occurs
STATE OF CONTROLSTATE OF CONTROL

Philippine Institute of Pure and Applied Chemistry
In partnership with industry, A catalyst for progress
When the process is in control:
5. The % of product that falls within any pair of values is more predictable
6. It allows the consumer to use the producer’s data
7. It is an indication that the operator is performing satisfactorily
STATE OF CONTROLSTATE OF CONTROL

Philippine Institute of Pure and Applied Chemistry
In partnership with industry, A catalyst for progress
Common Common CausesCauses
Special Special CausesCauses
45

Philippine Institute of Pure and Applied Chemistry
In partnership with industry, A catalyst for progress
Frequency Distribution of subgroup averages with control limits
STATE OF CONTROLSTATE OF CONTROL

Philippine Institute of Pure and Applied Chemistry
In partnership with industry, A catalyst for progress
When a point (subgroup value) falls outside its control limits, the process is out of control.
Out of control means a change in the process due to a special cause. A process can also be considered out of control even when the points fall inside the 3ơ limits
STATE OF CONTROLSTATE OF CONTROL

Philippine Institute of Pure and Applied Chemistry
In partnership with industry, A catalyst for progress
It is not natural for seven or more consecutive points to be above or below the central line.
Also when 10 out of 11 points or 12 out of 14 points are located on one side of the central line, it is unnatural.
Six points in a row are steadily increasing or decreasing indicate an out of control situation
STATE OF CONTROLSTATE OF CONTROL
Philippine Institute of Pure and Applied Chemistry
In partnership with industry, A catalyst for progress
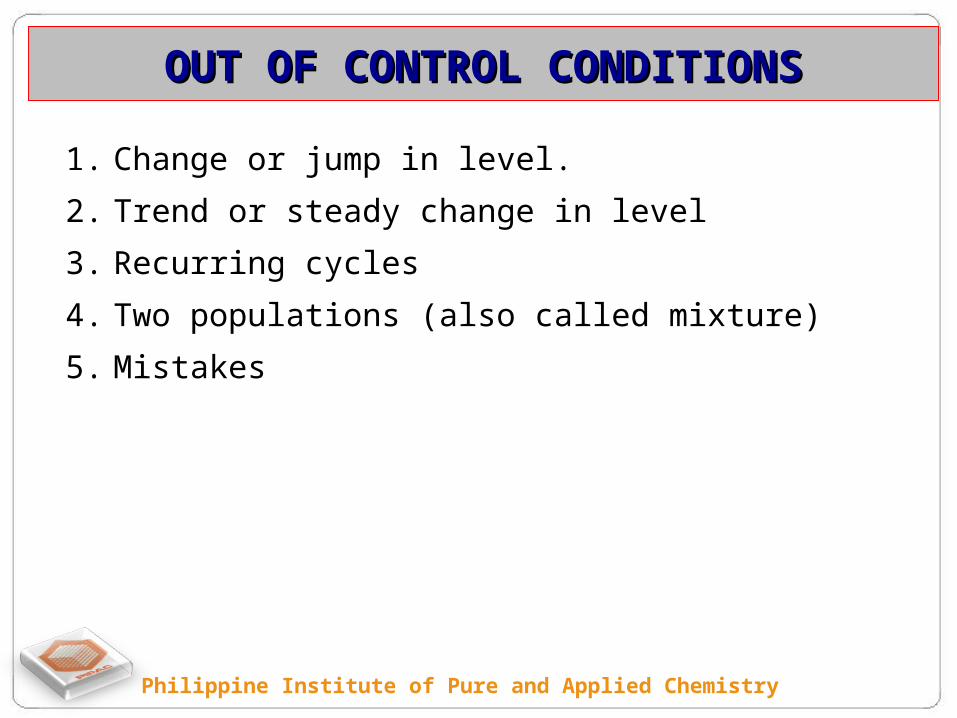
1. Change or jump in level.
2. Trend or steady change in level
3. Recurring cycles
4. Two populations (also called mixture)
5. Mistakes
OUT OF CONTROL CONDITIONSOUT OF CONTROL CONDITIONS

Philippine Institute of Pure and Applied Chemistry
In partnership with industry, A catalyst for progress
Some unnatural runs-process out of control
PATTERNS IN CONTROL CHARTSPATTERNS IN CONTROL CHARTS

Philippine Institute of Pure and Applied Chemistry
In partnership with industry, A catalyst for progress
Simplified rule for out-of-control pattern
PATTERNS IN CONTROL CHARTSPATTERNS IN CONTROL CHARTS

Philippine Institute of Pure and Applied Chemistry
In partnership with industry, A catalyst for progress
Change or jump in level Trend or steady change in level
Recurring cycles Two populations
OUT OF CONTROL PATTERNSOUT OF CONTROL PATTERNS

Philippine Institute of Pure and Applied Chemistry
In partnership with industry, A catalyst for progress
Comparison of individual values compared to averages
SPECIFICATIONSSPECIFICATIONS

Philippine Institute of Pure and Applied Chemistry
In partnership with industry, A catalyst for progress
Calculations of the average for both the individual values and for the subgroup averages are the same. However the sample standard deviation is different.
X
X
nwhere
population standard deviation of subgroup averages
population standard deviation of individual values
n=subgroup size
If we assume normality, then the population standard deviation
can be
4
sestimated from
c
SPECIFICATIONSSPECIFICATIONS

Philippine Institute of Pure and Applied Chemistry
In partnership with industry, A catalyst for progress
If the population from which samples are taken is not normal, the distribution of sample averages will tend toward normality provided that the sample size, n, is at least 4. This tendency gets better and better as the sample size gets larger. The standardized normal can be used for the distribution averages with the modification.
X
X XZ
n
CENTRAL LIMIT THEOREMCENTRAL LIMIT THEOREM

Philippine Institute of Pure and Applied Chemistry
In partnership with industry, A catalyst for progress
Illustration of central limit theorem
CENTRAL LIMIT THEOREMCENTRAL LIMIT THEOREM

Philippine Institute of Pure and Applied Chemistry
In partnership with industry, A catalyst for progress
Figure 5-20 Dice illustration of central limit theorem
CENTRAL LIMIT THEOREMCENTRAL LIMIT THEOREM

Philippine Institute of Pure and Applied Chemistry
In partnership with industry, A catalyst for progress
Relationship of limits, specifications, and distributions
CONTROL LIMITS AND SPECIFICATIONSCONTROL LIMITS AND SPECIFICATIONS

Philippine Institute of Pure and Applied Chemistry
In partnership with industry, A catalyst for progress
The control limits are established as a function of the average Specifications are the permissible variation in the size of the
part and are, therefore, for individual values The specifications or tolerance limits are established by design
engineers to meet a particular function
CONTROL LIMITS AND SPECIFICATIONSCONTROL LIMITS AND SPECIFICATIONS

Philippine Institute of Pure and Applied Chemistry
In partnership with industry, A catalyst for progress
The process spread will be referred to as the process capability and is equal to 6σ
The difference between specifications is called the tolerance When the tolerance is established by the design engineer
without regard to the spread of the process, undesirable situations can result
PROCESS CAPABILITY AND TOLERANCEPROCESS CAPABILITY AND TOLERANCE
Philippine Institute of Pure and Applied Chemistry
In partnership with industry, A catalyst for progress
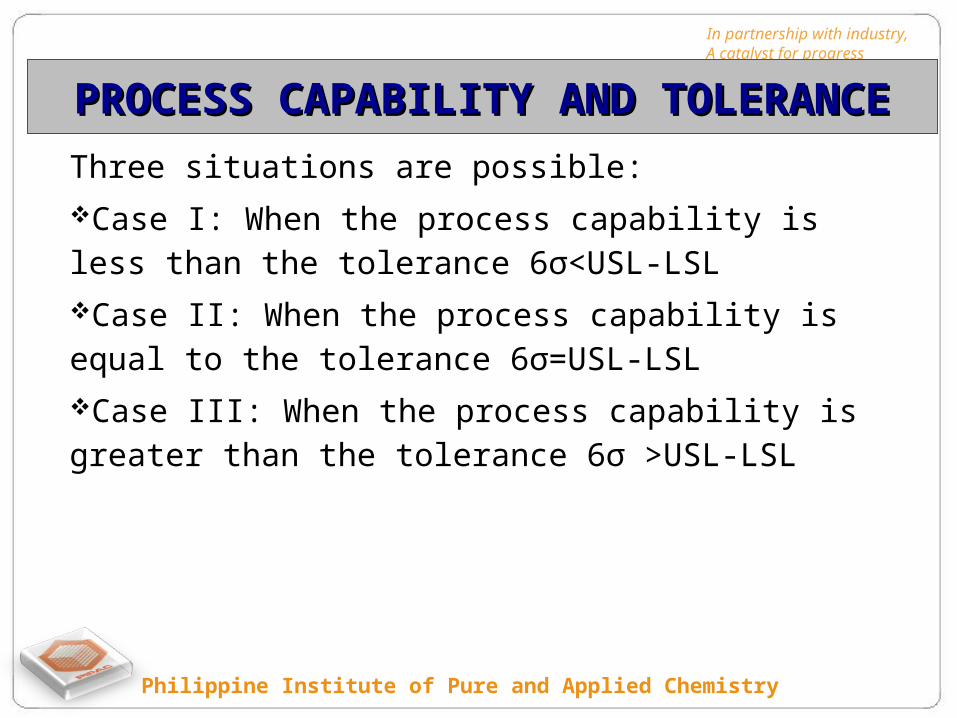
Three situations are possible:Case I: When the process capability is less than the tolerance 6σ<USL-LSLCase II: When the process capability is equal to the tolerance 6σ=USL-LSLCase III: When the process capability is greater than the tolerance 6σ >USL-LSL
PROCESS CAPABILITY AND TOLERANCEPROCESS CAPABILITY AND TOLERANCE

Philippine Institute of Pure and Applied Chemistry
In partnership with industry, A catalyst for progress
Case I: When the process capability is less than the tolerance 6σ<USL-LSL
Case I 6σ<USL-LSL
PROCESS CAPABILITY AND TOLERANCEPROCESS CAPABILITY AND TOLERANCE

Philippine Institute of Pure and Applied Chemistry
In partnership with industry, A catalyst for progress
Case II: When the process capability is less than the tolerance 6σ=USL-LSL
Case I 6σ=USL-LSL
PROCESS CAPABILITY AND TOLERANCEPROCESS CAPABILITY AND TOLERANCE

Philippine Institute of Pure and Applied Chemistry
In partnership with industry, A catalyst for progress
Case III: When the process capability is less than the tolerance 6σ>USL-LSL
Case I 6σ>USL-LSL
PROCESS CAPABILITY AND TOLERANCEPROCESS CAPABILITY AND TOLERANCE
Philippine Institute of Pure and Applied Chemistry
In partnership with industry, A catalyst for progress
The range over which the natural variation of a process occurs as determined by the system of common causes
Measured by the proportion of output that can be produced within design specifications
PROCESS CAPABILITYPROCESS CAPABILITY
Philippine Institute of Pure and Applied Chemistry
In partnership with industry, A catalyst for progress
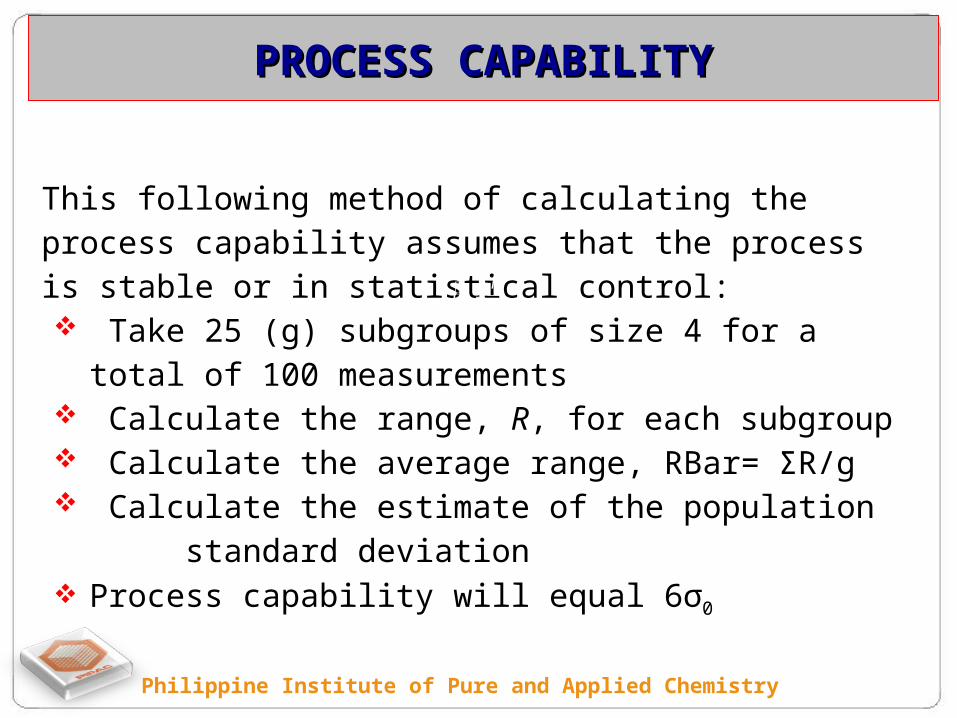
This following method of calculating the process capability assumes that the process is stable or in statistical control: Take 25 (g) subgroups of size 4 for a total of 100
measurements Calculate the range, R, for each subgroup Calculate the average range, RBar= ΣR/g Calculate the estimate of the population standard deviation
Process capability will equal 6σ0
0
2
R
d
PROCESS CAPABILITYPROCESS CAPABILITY

Philippine Institute of Pure and Applied Chemistry
In partnership with industry, A catalyst for progress
Charts for Better Operator Understanding:1. Placing individual values on the chart: This
technique plots both the individual values and the subgroup average. Not recommended since it does not provide much information.
2. Chart for subgroup sums: This technique plots the subgroup sum, ΣX, rather than the group average, Xbar. ( )
( )
X X
X X
UCL n UCL
UCL n LCL
DIFFERENT CONTROL CHARTSDIFFERENT CONTROL CHARTS

Philippine Institute of Pure and Applied Chemistry
In partnership with industry, A catalyst for progress
Charts for Variable Subgroup Size:
Used when the sample size is not the same Different control limits for each subgroup As n increases, limits become narrower As n decreases, limits become wider apart Difficult to interpret and explain To be avoided
DIFFERENT CONTROL CHARTSDIFFERENT CONTROL CHARTS

Philippine Institute of Pure and Applied Chemistry
In partnership with industry, A catalyst for progress
Chart for Trends:
Used when the plotted points have an upward or downward trend that can be attributed to an unnatural pattern of variation or a natural pattern such as tool wear.
The central line is on a slope, therefore its equation must be determined.
DIFFERENT CONTROL CHARTSDIFFERENT CONTROL CHARTS

Philippine Institute of Pure and Applied Chemistry
In partnership with industry, A catalyst for progressDIFFERENT CONTROL CHARTSDIFFERENT CONTROL CHARTS
Chart for Trend

Philippine Institute of Pure and Applied Chemistry
In partnership with industry, A catalyst for progress
Used when we cannot have multiple observations per time period
ValueValue XbarXbar RR
4444
4646
5454 48.0048.00 1010
3838 46.0046.00 1616
4949 47.0047.00 1616
4646 44.3344.33 1111
4545 46.6746.67 44
3131 40.6740.67 1515
5555 43.6743.67 2424
3737 41.0041.00 2424
4242 44.6744.67 1818
4343 40.6740.67 66
4747 44.0044.00 55
5151 47.0047.00 88n here is equal to 12, NOT 14An example
CONTROL CHARTS FOR MOVING AVERAGECONTROL CHARTS FOR MOVING AVERAGE

Philippine Institute of Pure and Applied Chemistry
In partnership with industry, A catalyst for progress
Extreme readings have a greater effect than in conventional charts. An extreme value is used several times in the calculations, the number of times depends on the averaging period.
CONTROL CHARTS FOR MOVING AVERAGECONTROL CHARTS FOR MOVING AVERAGE
Philippine Institute of Pure and Applied Chemistry
In partnership with industry, A catalyst for progress
This is a simplified variable control chart.
Minimizes calculations
Easier to understand
Can be easily maintained by operators
Recommended to use a subgroup of 3, then all data is used.
CONTROL CHARTS FOR MEDIAN AND RANGECONTROL CHARTS FOR MEDIAN AND RANGE

Philippine Institute of Pure and Applied Chemistry
In partnership with industry, A catalyst for progress
CHART FOR INDIVIDUAL VALUESCHART FOR INDIVIDUAL VALUES
Used when only one measurement is taken on quality characteristic
Too expensiveTime consumingDestructiveVery few items

Philippine Institute of Pure and Applied Chemistry
In partnership with industry, A catalyst for progress
Non-Acceptance limits have the same Relationship to averages as specificationshave to individual values. Control Limits tell what the process is capable of doing, and reject limits tell when the product is conforming to specifications.
CONTROL CHARTS with NON-ACCEPTANCE LIMITSCONTROL CHARTS with NON-ACCEPTANCE LIMITS

Philippine Institute of Pure and Applied Chemistry
In partnership with industry, A catalyst for progress
Figure 5-35 Relationship of non-acceptance limits, control limitsand specifications.
CONTROL CHARTS with NON-ACCEPTANCE LIMITSCONTROL CHARTS with NON-ACCEPTANCE LIMITS

Philippine Institute of Pure and Applied Chemistry
In partnership with industry, A catalyst for progress
CONTROL CHARTS IN LABORATORIESCONTROL CHARTS IN LABORATORIES
Philippine Institute of Pure and Applied Chemistry
In partnership with industry, A catalyst for progress
CONTROL CHARTS IN LABORATORIESCONTROL CHARTS IN LABORATORIES
ISO/IEC 17025 (3) 5.9:
“The laboratory shall have quality control procedures for monitoring the validity of tests and calibrations undertaken. The resulting data shall be recorded in such a way that trends are detectable and statistical techniques shall be applied for reviewing the results.
Quality control data shall be analyzed and where they are found to be outside predefined criteria, planned action shall be taken to correct the problem and to prevent incorrect results from being reported.”

Philippine Institute of Pure and Applied Chemistry
In partnership with industry, A catalyst for progress
CONTROL CHARTS IN LABORATORIESCONTROL CHARTS IN LABORATORIES
Internal quality control at the chemical analytical laboratory, involves a continuous, critical evaluation of the laboratory’s own analytical methods and working routines.
The control encompasses the analytical process starting with the sample entering the laboratory and ending with the analytical report.

Philippine Institute of Pure and Applied Chemistry
In partnership with industry, A catalyst for progress
CONTROL CHARTS IN LABORATORIESCONTROL CHARTS IN LABORATORIES
The most important tool in this quality control is the use of control charts. The basis is that the laboratory runs control samples together with the routine samples. The control values are plotted in a control chart.
In this way it is possible to demonstrate that the measurement procedure performs within given limits.
If the control value is outside the limits, no analytical results are reported and remedial actions have to be taken to identify the sources of error, and to remove such errors.

Philippine Institute of Pure and Applied Chemistry
In partnership with industry, A catalyst for progress

Philippine Institute of Pure and Applied Chemistry
In partnership with industry, A catalyst for progress
CONTROL CHARTS IN LABORATORIESCONTROL CHARTS IN LABORATORIES
When the control program encompasses the whole analytical process from the sample entering the laboratory to the analytical report the control results will demonstrate the within-laboratory reproducibility.
The within-laboratory reproducibility will indicate the variation in the analytical results if the same sample is given to the laboratory at different times.

Philippine Institute of Pure and Applied Chemistry
In partnership with industry, A catalyst for progress
CONTROL CHARTS IN LABORATORIESCONTROL CHARTS IN LABORATORIES
The results of the control program may be used in several ways –
The analyst will have an important quality tool in his/her daily work,
The customer can get an impression of the laboratory’s quality
The laboratory can use the results in the estimation of the measurement uncertainty.

Philippine Institute of Pure and Applied Chemistry
In partnership with industry, A catalyst for progress
CONTROL CHARTS IN LABORATORIESCONTROL CHARTS IN LABORATORIES
The QC has to be part of a quality system and should be formally reviewed on a regular basis. Other important elements of the quality system are the participation in interlaboratory comparisons (proficiency test), the use of certified reference materials and method validation.
In practical work it is necessary that the quality control is limited to fulfilling the requirements on the analytical results – a good balance between control work and analyses of samples is essential.
Philippine Institute of Pure and Applied Chemistry
In partnership with industry, A catalyst for progress
CONTROL CHARTS IN LABORATORIESCONTROL CHARTS IN LABORATORIES
Control charting is a powerful and simple tool for the daily quality control of routine analytical work. The basis is that the laboratory runs control samples together with the routine samples in an analytical run.
Material of control samples can be standard solutions, real routine samples, blank samples, in-house control materials and certified reference materials.
Immediately after the analytical run is completed the control values are plotted on a control chart.

Philippine Institute of Pure and Applied Chemistry
In partnership with industry, A catalyst for progress
CONTROL CHARTS IN LABORATORIESCONTROL CHARTS IN LABORATORIES
From the requirement on the analytical results the analyst sets up the control program:
Type of quality control sampleType of quality control chartsControl limits – warning and action limits (or warning and
controllimits)
Control frequency

Philippine Institute of Pure and Applied Chemistry
In partnership with industry, A catalyst for progress
CONTROL SAMPLESCONTROL SAMPLES
Philippine Institute of Pure and Applied Chemistry
In partnership with industry, A catalyst for progress
CONTROL SAMPLESCONTROL SAMPLES
Control samples- should go through the whole measurement
procedure- very similar to test samples- stable over time- suitable analyte concentration

Philippine Institute of Pure and Applied Chemistry
In partnership with industry, A catalyst for progress
CONTROL SAMPLESCONTROL SAMPLES
TYPE SAMPLES
I Certified Reference Materials (CRM)
II Reference Materials, Standard Solutions, In House Material
III Blank Sample
IV Test Sample

Philippine Institute of Pure and Applied Chemistry
In partnership with industry, A catalyst for progress
CONTROL SAMPLES
• Should be representative with respect to matrix and concentration
• Its content should be chosen so that analytically important regions (e.g. limit regions) can be secured
• Should be available in sufficient quantity, so that control analyses can be performed over a long period of time

Philippine Institute of Pure and Applied Chemistry
In partnership with industry, A catalyst for progressCONTROL SAMPLES
• Its stability must be proven and should be at least several months (under defined storage conditions)
• Influence of the containers on the shelf-life must be excluded
• Regular removal of partial samples for control analyses must not lead to changes in the control sample (e.g. evaporation of highly volatile components through opening of the container)

Philippine Institute of Pure and Applied Chemistry
In partnership with industry, A catalyst for progressTYPES of CONTROL SAMPLES
• Standard Solutions– A solution of a standard substance of known purity in
a suitable solvent, a solvent as similar as possible to that of the sample
• Blank Samples– An analysis sample that is presumably free of the
component to be determined
• Natural Samples (Reference Material)– A sample whose matrix best resembles the sample
being analyzed. The content of these actual samples must be analytically determined beforehand through validation studies

Philippine Institute of Pure and Applied Chemistry
In partnership with industry, A catalyst for progressTYPES of CONTROL SAMPLES
• Synthetic Samples– A standard solution that contains other components
(possibly interferring components or components to resemble the matrix)
• Certified Refence Material (CRM) – Are natural or synthetic samples whose content is
determined by various laboratories by means of various methods

Philippine Institute of Pure and Applied Chemistry
In partnership with industry, A catalyst for progress
Control limits may be set according to the performance of the analytical method used irrespectively of the requirement on analytical quality – statistical control limits.
The control limits (X-charts) are set based on the analytical performance of a control sample over a long period of time e. g a year.
Warning limts are: +2s and -2sAction limits are: +3s and -3s
SETTING THE CONTROL LIMITSSETTING THE CONTROL LIMITS

Philippine Institute of Pure and Applied Chemistry
In partnership with industry, A catalyst for progress
For R chartsThe control limits are based on the analytical performance of the control sample over a long period of time
Central Line = Mean Range/d2
SETTING THE CONTROL LIMITSSETTING THE CONTROL LIMITS
Philippine Institute of Pure and Applied Chemistry
In partnership with industry, A catalyst for progress
THE CENTRAL LINETHE CENTRAL LINE
The central line (CL) in the control chart is representing the mean value of the control values or the nominal value of a certified reference material.
In addition to the central line, the control chart normally has four lines. Two of these, the so-called warning limits, are located at a distance of ± two times the standard deviation from the central line (CL ± 2s). Provided that the results are normally distributed, about 95 % of the results should be within these limits.

Philippine Institute of Pure and Applied Chemistry
In partnership with industry, A catalyst for progress
CONTROL LIMITSCONTROL LIMITS
In the control chart two other lines are also drawn at a distance of ± three times the standard deviation from the central line (CL ± 3s).
These lines are called the action limits and 99.7 % of the data normally distributed should be within these limits.
Statistically only three out of 1000 measurements are thus located outside the action limits. If the control value is outside the action limits, there is a high probability that the analysis is in error.

Philippine Institute of Pure and Applied Chemistry
In partnership with industry, A catalyst for progress
CENTRAL LINE and CONTROL LIMITSCENTRAL LINE and CONTROL LIMITS
The control limits can be set based on method performance – statistical control limits or according to the requirement on within-laboratory reproducibility – target control limits.
The central line in the control chart can be the calculated mean value of the control values or a reference value for the control sample. In most cases a mean central line is used.
Philippine Institute of Pure and Applied Chemistry
In partnership with industry, A catalyst for progress
CONTROL CHARTS IN LABORATORIESCONTROL CHARTS IN LABORATORIES
Statistical control limits
The control limits are set based on the analytical performance of the control sample.
From a longer time period, e.g. a year, the standard deviation s is calculated from the control values.
Warning limits will be +2 s and – 2 s. Action limits will be +3 s and – 3 s.

Philippine Institute of Pure and Applied Chemistry
In partnership with industry, A catalyst for progress
CONTROL CHARTS IN LABORATORIESCONTROL CHARTS IN LABORATORIES
Target control limits
The control limits are set based on the requirement on the analytical quality. The standard deviation for the control chart, s, is estimated from the requirement on sRw Warning limits will be +2 s and – 2 s. Action limits will be+3 s and – 3 s.

Philippine Institute of Pure and Applied Chemistry
In partnership with industry, A catalyst for progress
CENTRAL LINECENTRAL LINE
MEAN CENTRAL LINEThe mean value is estimated from control values obtained during a longer time, e.g. a year. The central line is set to this mean value.
REFERENCE CENTRAL LINEThe control sample is a reference material or a well-characterized material. The central line is set to the nominal value.

Philippine Institute of Pure and Applied Chemistry
In partnership with industry, A catalyst for progress
CONTROL CHARTS IN LABORATORIESCONTROL CHARTS IN LABORATORIES
Setting up a quality control programeControl samples typesConcentration rangesFrequency of control analysesPosition of control samples in an analytical run A good balance between QC and test samples is importantDaily interpretation of quality controlLong term evaluation of quality control data
Philippine Institute of Pure and Applied Chemistry
In partnership with industry, A catalyst for progress
DAILY INTERPRETATION OF QUALITY CONTROLDAILY INTERPRETATION OF QUALITY CONTROL
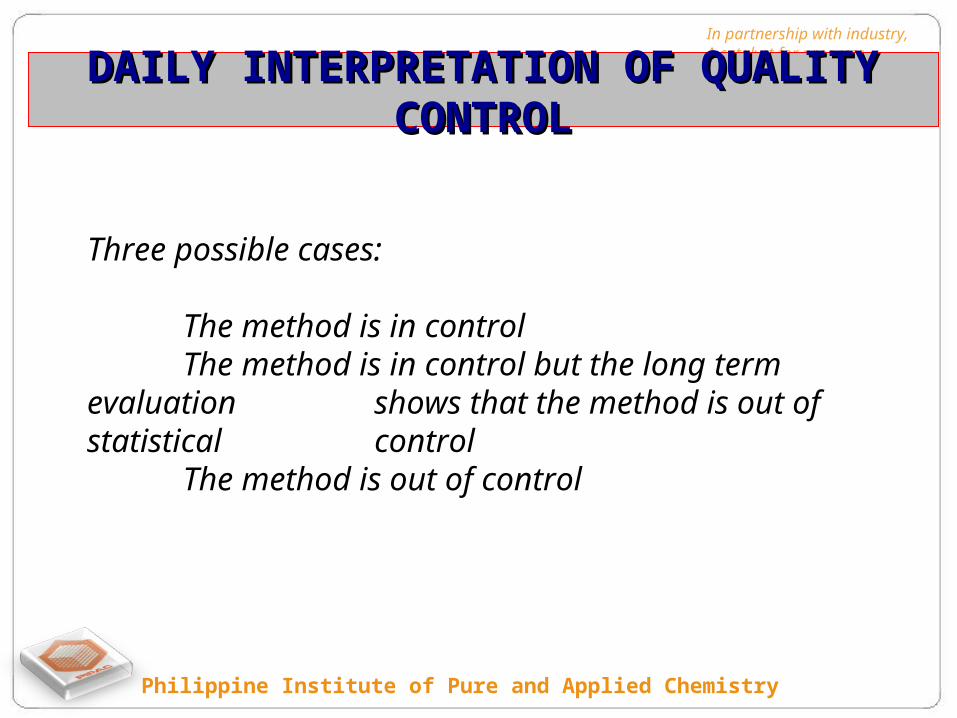
Three possible cases:
The method is in controlThe method is in control but the long term
evaluation shows that the method is out of statistical control
The method is out of control

Philippine Institute of Pure and Applied Chemistry
In partnership with industry, A catalyst for progress
DAILY INTERPRETATION OF QUALITY CONTROLDAILY INTERPRETATION OF QUALITY CONTROL
The method is in control:the control value is within warning limits.the control value is between warning limits and
action limit and the two previous control values are within warning limits.
The Analyst can report the analytical results!!

Philippine Institute of Pure and Applied Chemistry
In partnership with industry, A catalyst for progress
DAILY INTERPRETATION OF QUALITY CONTROLDAILY INTERPRETATION OF QUALITY CONTROL
The method is in control but out of statistical controlseven control values in consecutive order gradually
increase or decrease10 out of 11 values are lying on the same side of the
central line.
In these cases, the Analyst can report the analytical results but a problem may be developing:
Each laboratory has to decide how to treat this trends!

Philippine Institute of Pure and Applied Chemistry
In partnership with industry, A catalyst for progress
DAILY INTERPRETATION OF QUALITY CONTROLDAILY INTERPRETATION OF QUALITY CONTROL
The method is out of control:the control value is outside the control limits.the control value is between warning limits and action
limit and at least one of the two previous control values is also between the warning and action
limit.
All samples analyzed since last control value in control must be reanalyzed.

Philippine Institute of Pure and Applied Chemistry
In partnership with industry, A catalyst for progress
What is the quality currently in the laboratory? Has the quality significantly changed?
Are the control limits and central line in the control chart still optimal for detecting situations out of control?
LONG TERM EVALUATIONLONG TERM EVALUATION

Philippine Institute of Pure and Applied Chemistry
In partnership with industry, A catalyst for progress
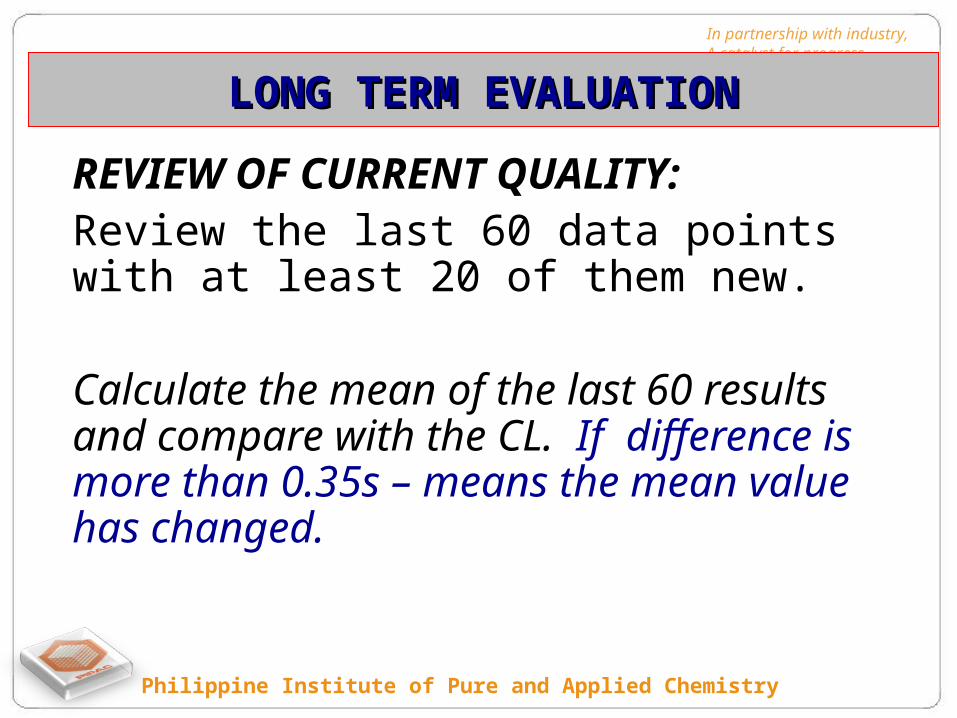
REVIEW OF CURRENT QUALITY:
Review the last 60 data points with at least 20 of them new.
Count the number of cases where the results are outside the warning limits.
If more than 6 or less than 1 – the spread of analysis has changed.
LONG TERM EVALUATIONLONG TERM EVALUATION
Philippine Institute of Pure and Applied Chemistry
In partnership with industry, A catalyst for progress
REVIEW OF CURRENT QUALITY:Review the last 60 data points with at least 20 of them new.
Calculate the mean of the last 60 results and compare with the CL. If difference is more than 0.35s – means the mean value has changed.
LONG TERM EVALUATIONLONG TERM EVALUATION

Philippine Institute of Pure and Applied Chemistry
In partnership with industry, A catalyst for progressEXAMPLE

Philippine Institute of Pure and Applied Chemistry
In partnership with industry, A catalyst for progress
Internal Quality Control, Nordtest Report TR569, 2011

Philippine Institute of Pure and Applied Chemistry
In partnership with industry, A catalyst for progress
Philippine Institute of Pure and Applied Chemistry
In partnership with industry, A catalyst for progress

Philippine Institute of Pure and Applied Chemistry
In partnership with industry, A catalyst for progressCONTROL CHARTS IN LABORATORIESCONTROL CHARTS IN LABORATORIES
How often should control limits be evaluated?
For successful use of control charts it is important that the control limits and the central line remain stable over a long period of time.
The central line and control limits should not be changed frequently since this will make it difficult to detect gradual changes in analytical quality.
The laboratory should have a policy for how often control limits are evaluated and how it is decided if a change is needed.
Philippine Institute of Pure and Applied Chemistry
In partnership with industry, A catalyst for progress
CONTROL CHARTS IN LABORATORIESCONTROL CHARTS IN LABORATORIES
How often should control limits be evaluated?
Control limits and central line should be evaluated every year or after collection of 20 (or 30) data sets as indicated above. But the evaluation does not necessarily mean that the control limits should be changed. A change should only be considered if a significant change in spread or the bias has taken place.

Philippine Institute of Pure and Applied Chemistry
In partnership with industry, A catalyst for progress
CONTROL CHARTS IN LABORATORIESCONTROL CHARTS IN LABORATORIES
Other uses of quality control data and control charts:Measurement uncertaintyMethod validationMethod comparisonEstimation of limit of detection (LOD)Person comparison or qualificationEvaluation of proficiency testsEnvironmental parameters and similar checks
Philippine Institute of Pure and Applied Chemistry
In partnership with industry, A catalyst for progress
Thank You!Thank You!

Philippine Institute of Pure and Applied Chemistry
In partnership with industry, A catalyst for progressSTEPS TO CREATE A CONTROL CHART
Philippine Institute of Pure and Applied Chemistry
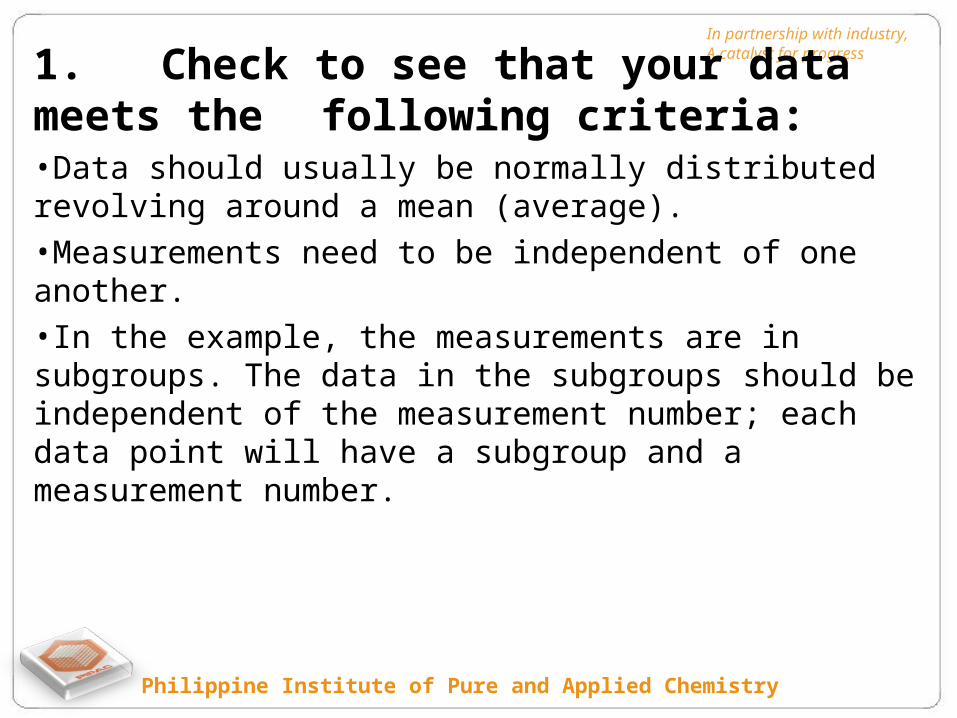
In partnership with industry, A catalyst for progress1. Check to see that your data meets the
following criteria:•Data should usually be normally distributed revolving around a mean (average).•Measurements need to be independent of one another.•In the example, the measurements are in subgroups. The data in the subgroups should be independent of the measurement number; each data point will have a subgroup and a measurement number.

Philippine Institute of Pure and Applied Chemistry
In partnership with industry, A catalyst for progress2. Find the mean of each subgroup.
• To find the mean, add all measurements in the subgroup and divide by the number of measurements in the subgroup.
• In the example, there are 20 subgroups and in each subgroup there are 4 measurements.

Philippine Institute of Pure and Applied Chemistry
In partnership with industry, A catalyst for progress3. Find the mean of all of the means from the
previous step (X).
• This will give you the overall mean of all the data points.
• The overall mean will be the centerline in the graph (CL), which is 13.75 for our example.
Philippine Institute of Pure and Applied Chemistry
In partnership with industry, A catalyst for progress4. Calculate the standard deviation (S) of the data
points.

Philippine Institute of Pure and Applied Chemistry
In partnership with industry, A catalyst for progress5. Calculate the upper and lower control limits
(UCL, LCL) using the following formula:
• UCL = CL + 3*S• LCL = CL – 3*S• The formula represents 3 standard deviations
above and 3 standard deviations below the mean respectively.
Philippine Institute of Pure and Applied Chemistry
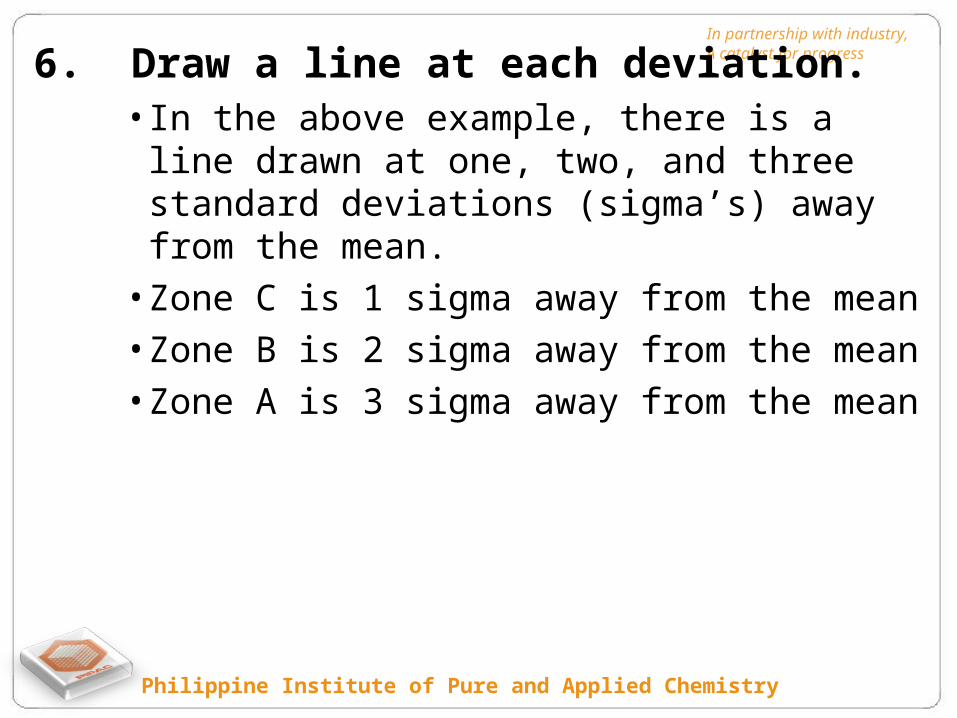
In partnership with industry, A catalyst for progress6. Draw a line at each deviation.
• In the above example, there is a line drawn at one, two, and three standard deviations (sigma’s) away from the mean.
• Zone C is 1 sigma away from the mean• Zone B is 2 sigma away from the mean• Zone A is 3 sigma away from the mean

Philippine Institute of Pure and Applied Chemistry
In partnership with industry, A catalyst for progress
7. Graph the X-bar Control Chart, by graphing the subgroup means (x-axis) versus measurements (y-axis).

Philippine Institute of Pure and Applied Chemistry
In partnership with industry, A catalyst for progress8. Evaluate the graph to see if the process is out-of-
control. The graph is out-of-control if any of the following are true:• Any point falls beyond the red zone (above or below the
3-sigma line).• 8 consecutive points fall on one side of the centerline.• 2 of 3 consecutive points fall within zone A.• 4 of 5 consecutive points fall within zone A and/or zone B.• 15 consecutive points are within Zone C.• 8 consecutive points not in zone C.

Philippine Institute of Pure and Applied Chemistry
In partnership with industry, A catalyst for progress9. State whether the system is in-control or out-
of-control.