philippine institute for development studies comments, suggestions or further inquiries please...
TRANSCRIPT

For comments, suggestions or further inquiries please contact:
Philippine Institute for Development Studies
The PIDS Discussion Paper Seriesconstitutes studies that are preliminary andsubject to further revisions. They are be-ing circulated in a limited number of cop-ies only for purposes of soliciting com-ments and suggestions for further refine-ments. The studies under the Series areunedited and unreviewed.
The views and opinions expressedare those of the author(s) and do not neces-sarily reflect those of the Institute.
Not for quotation without permissionfrom the author(s) and the Institute.
July 2001
The Research Information Staff, Philippine Institute for Development Studies3rd Floor, NEDA sa Makati Building, 106 Amorsolo Street, Legaspi Village, Makati City, PhilippinesTel Nos: 8924059 and 8935705; Fax No: 8939589; E-mail: [email protected]
Or visit our website at http://www.pids.gov.ph
DISCUSSION PAPER SERIES NO. 2001-15
The Dynamics of Housing Demandin the Philippines:
Income and Lifecycle Effects
Marife M. Ballesteros

ABSTRACT This paper examines the housing consumption pattern of households in the Philippines given their socio-economic characteristics and the existing conditions in the land and housing market. Two basic issues are examined: one, how is housing adjustment and expenditure associated with income and demographic changes; and two, do housing consumption in the country suggest the presence of significant housing market imperfections or capital market imperfections. The results point to the lack of housing alternatives specifically for the low-income households in the formal housing market. Housing adjustments and the path toward acceptable housing are thus constrained. Estimates of income elasticity show that for most households, an increase in income will not be spent on housing but to meet other basic household needs. This being the case, there has to be a significant increase in income to bring about a significant change in housing conditions. In the long run, economic development may bring about the needed boost in income, however, in the short-run, government has look into alternative forms of low-cost housing. One option is developing the low-cost rental market. Another option is finding innovative financing schemes that would allow low monthly amortization. Lastly, government has to institute ways to effectively reduce the high cost of housing in the country. Keywords: Housing demand, housing consumption pattern, housing elasticity

1
Preliminary Draft 28 June 2001
The Dynamics of Housing Demand in the Philippines: Income and Lifecycle Effects
Marife M. Ballesteros
Philippine Institute for Development Studies I. Introduction
Housing demand analysis is primarily a question of how households adjust their
housing consumption given factors that place them out of equilibrium. Housing
adjustments maybe done by relocating to another unit, by modifying existing units or
by tenure changes. This decision depends on a number of factors, which stems from
the peculiar attributes of housing as a tradeable good (e.g. location specificity, high
costs viz. income), the characteristic of the households and from the way the housing
market operates. The attributes of housing are inherent thus the adjustment process
varies among households or across cities and countries primarily due to changes in the
characteristics of households and differences in the way the housing and land markets
operate within a city or country.
This investigation of housing demand focuses on the effects of income and lifecycle
on housing adjustments and expenditure pattern given conditions on the land and
housing market. Several issues are examined. First, how is housing adjustment and
expenditure associated with income and demographic changes? Second, do housing
adjustments and expenditure on housing suggest the presence of significant housing
market imperfections or capital market imperfections?
The discussion proceeds as follows. Section 2 presents key characteristics of the
Philippine housing market that may have major influence on housing adjustments and
expenditure pattern. Sections 3 and 4 present evidences of housing consumption using
household surveys conducted from 1985 to 1997. Section 3 provides some
descriptive statistics on household tenure change and housing improvements while
Section 4 discusses the estimates of housing demand parameters using econometric

2
models. In section 5 constraints on housing demand and affordability is discussed.
The last section gives a summary of results and provides some policy implications.
II. Key Features of the Housing Market in the Philippines
The Philippine housing market reveals a tremendous gap between the demand and
supply of housing. At the root of this housing shortage is the fact that the majority of
households are unable to pay for the cost of housing and land. The minimum housing
cost of P150 thousand per unit is 3.8 times the yearly wages of unskilled laborer.
Likewise, a P250 thousand unit housing is 3.1 times the annual income of an
employee earning a median income of P6,700 per month. Compare this to the
standard norm in industrialized countries of 2-2.5%.
The high price of land is the major factor in the high cost of housing in the Philippines
(Strassman and Blunt 1993). Grimes (1976) suggested that as an international rule,
housing for low-income families would require that 100m2 of land would costs as
much as GNP per capita. In Manila, however, the 1990 price (P1000/sq m) of a site
outside the metropolis was 5.2 the national GNP per capita. On the outskirts of the
NCR, raw agricultural land costs only P60 per sq m (0.3% of GNP) but the price rises
by 2.5-3.0 times when the same land is zoned for urban use. It rises further by 5.3-6.7
times the zoned land price when such area is developed (UNCHS and WB 1993).
The high cost of urban land in the country is due to constraints in the supply side of
the market (Ballesteros 2000). First, poor planning and infrastructure developments
limit the supply of housing land. Second, administrative bottlenecks in land and
housing developments due to contradicting land laws, unclear standards and
overlapping turfs cause delays in the conversion of agricultural lands to urban lands.
Third, problems on property rights, e.g. fake titling, delays in agreements of right of
ways, landgrabbing, etc. further increases transaction costs. Fourth, land ownership is
highly concentrated and holding land idle is encouraged by the low land and property
tax in the country. All the above scenarios limit the supply of urban lands, increases
the cost of servicing land thus causing phenomenal rates of increase in urban land
prices.
3
Another feature of the housing market in the country is the lack of long-term
financing for housing, which could provide a way to offset the high unit cost of
housing relative to income. Like most developing economies, the secondary financial
market in the country is undeveloped. Long-term funds for housing are constrained
and highly dependent on funds from government social security systems. Moreover,
housing finance programs of the government have been unsustainable. One reason is
graft and corruption in the approval and release of loans for the low-income sector. It
has been reported that payments have been released to participating housing
developers with no existing household beneficiary. Another reason is poor subsidy
transfer mechanisms. Loans to targeted beneficiaries have been released based on
formula lending (i.e. loan amount is computed as a percentage of income), which does
not recognize borrowers’ probable lack of capacity to pay or incur additional
indebtedness (Llanto 1998). In addition, there is less incentive for developers and
lending institutions to be prudent since the loan is automatically taken out from them
(Llanto 1998). The government thus assumes the full credit risk on the loans.
The rental housing market for low-income households in the Philippines is also not
developed. There is very little information about the rental housing market in the
country. It is, however, observed that government housing programs mainly
emphasized homeownership. Public rental housing then called tenement houses have
been one of the earliest government programs on urban housing in the 1950s but this
scheme did not take-off. There have been attempts during the Marcos government to
revive public rental housing but these houses ended up for homeownership by the
middle and high-income earners. The Marcos administration also tried to boost the
rental housing market specifically in urban areas by encouraging the development of
private “apartments” through the provision of a financing window. However, this
program was given least priority compared to the other government housing programs
such as the sites and services and zonal improvement programs. What occurred
instead was the ratification of the “rent control law” in response to the rising housing
costs in urban areas particularly Metro Manila (Batas Pambansa 877 of 1985). This
rent control law among others provided for the maximum allowable increases in rents
of residential units offered for rent. Since 1985, the effectivity of the law has been
extended to 2001. The implementation of the rent control law may have worked

4
against low-income households, which the law intends to protect since rent controls
tend to crowd out investments for low-income rental housing.
Table 1: Key Features of the Land and Housing Market in the Philippines
Feature Underlying Causes
Influx of population in major urban centers
• Significant socio-economic disparities among regions and between urban and rural areas
High unit housing cost relative to income • Low wages, high unemployment • Construction cost rising faster than
wages • High rate of increase of urban land
prices High rate of increase in urban land prices • Scarcity due to limited infrastructure
developments, • Scarcity due to Institutional problems
(e.g. property rights, bureaucratic bottlenecks)
• Holding of idle lands due to low land and property tax
Lack of long-term financing and unsustainable housing finance
• Undeveloped secondary markets • Graft and corruption • Poor subsidy transfer mechanism
Undeveloped rental housing market for low-income households
• Government bias on homeownership • Rent control law
III. Tenure Change and Housing Improvements: Some Descriptive Statistics
The absence of a panel data for households in the Philippines makes it difficult to give
an accurate measure of the mobility and path toward acceptable housing of
households. Nonetheless, the trends in dwelling conditions and improvements are
provided herein to give some indirect measures.
A. General Trends in Housing Consumption
There has been an increase in homeownership in the Philippines between 1985 and
1997 (Table 2). In 1985, 58.1% of households in the Philippines are homeowners.
This proportion increased to 64.5% in 1997. The increase in homeownership is
observed to be strong in the key urban cities, specifically Metro Manila and Metro

5
Cebu. Comparatively, the trend on homeownership is slow in Davao City and in rural
areas for the same period.
A clear pattern in all areas is the significant proportion of housing by informal means.
This “informal” category encompasses a variety of arrangements, such as living with
relatives, living in place of business or living on a working farm (the last two
examples refer to institutional housing). Also included under this category are the
illegal occupants of dwellings (without permission) and those living in natural habitat.
Those informal dwellers living with relatives or in place of business represent the
tenure condition of one-fifth of households in the Philippines. There has been a
significant increase of these types of informal dwellers in Metro Cebu and Davao City
while the proportion has remained the same in Metro Manila. On the other hand, the
proportion of informal dwellers that occupy housing illegally shows increasing trend
specifically in key urban areas. In NCR, this type of dwellers increased in proportion
from 2.9% in 1985 to 6.9% in 1997. The situation has been worst in Metro Cebu,
whereby illegal dwellers represent 14% of total households in 1997, an increase from
a proportion of 2% in 1991.
Table 2. Tenure Trends in the Philippines, 1985-1997, (in proportion of total households).
1985 1991 1994 1997
Philippines 100.0 100.0 100.0 100.0 Own or owner-like possession of house & lot 58.1 62.9 65.4 64.5 Rent house/room including lot 7.2 6.9 6.0 6.3 Own house, rent lot 6.6 5.5 4.2 4.0 Own/rent-free house, rent-free lot with consent of owner 26.1 22.3 21.6 22.0 Own/rent-free house, rent-free lot without consent of owner 2.0 2.3 2.7 3.2 Urban 100.0 100.0 100.0 100.0 Own or owner-like possession of house & lot 50.1 58.3 61.6 60.1 Rent house/room including lot 17.4 13.2 11.4 12.3 Own house, rent lot 10.3 6.7 5.3 5.0 Own/rent-free house, rent-free lot with consent of owner 19.4 19.0 18.5 18.0 Own/rent-free house, rent-free lot without consent of owner 2.9 2.8 3.2 4.6 Rural 100.0 100.0 100.0 100.0 Own or owner-like possession of house & lot 63.0 67.4 69.1 68.6 Rent house/room including lot 1.0 0.8 0.8 0.9 Own house, rent lot 4.4 4.3 3.2 3.1 Own/rent-free house, rent-free lot with consent of owner 30.1 25.6 24.7 25.6 Own/rent-free house, rent-free lot without consent of owner 1.4 1.9 2.2 1.9 NCR 100.0 100.0 100.0 100.0 Own or owner-like possession of house & lot 41.2 45.5 49.4 50.0 Rent house/room including lot 32.4 30.7 27.6 25.9 Own house, rent lot 9.8 6.6 4.2 3.8 Own/rent-free house, rent-free lot with consent of owner 13.7 13.2 14.0 13.4 Own/rent-free house, rent-free lot without consent of owner 2.9 4.0 4.8 6.9 Metro Cebu 100.0 100.0 100.0 100.0 Own or owner-like possession of house & lot 38.8 45.7 54.5 44.2 Rent house/room including lot 14.8 14.4 12.0 9.3

6
Own house, rent lot 12.8 11.1 13.4 11.9 Own/rent-free house, rent-free lot with consent of owner 11.2 26.1 13.4 20.5 Own/rent-free house, rent-free lot without consent of owner 22.4 2.7 6.7 14.0 Davao City 100.0 100.0 100.0 100.0 Own or owner-like possession of house & lot 53.9 61.5 55.8 54.6 Rent house/room including lot 15.8 11.6 8.0 11.1 Own house, rent lot 9.7 3.9 5.8 8.0 Own/rent-free house, rent-free lot with consent of owner 19.7 19.3 25.8 24.6 Own/rent-free house, rent-free lot without consent of owner 1.0 3.7 4.5 1.7
Source: National Statistic Office (NSO) Family Income and Expenditure Survey (FIES)
Overall, the data indicate a “natural progression” toward obtaining what may be
considered the best tenure status, i.e. homeownership with secure title to
housing/land. However, the path toward homeownership is slow for about 50% of
households. The alternative housing for most families is the informal housing sector-
either occupying dwellings rent-free with or without consent of legal owners. The
rental housing market is observed to be the least alternative for families. This maybe
due to the “undeveloped” rental housing for the low-income sector or that this type of
rental housing is limited.
While housing adjustment by tenure is quite slow, improving or modifying housing
units has been the apparent trend among households. Between 1985 and 1997,
dwelling conditions for most families have improved considerably. Dwellings made
of strong wall materials increased from 38.1% in 1985 to 62% in 1997 (Table 3).
Homes made of makeshift materials have also declined from 4.0% in 1985 to 2.2% in
1997. Improvements in wall material have been significant in both urban and rural
areas including key metropolitan areas.
Toilet facilities has also improved with more than 60% of dwellings using water-
sealed toilet in 1997 compared to only 52% in 1985. Water system, however, has
remained poor with only about 50% of households having their own faucets and
connected to the community water system. This condition is, however, attributed to
poor water infrastructure and institutional problems in the country rather than low
demand for this facility.

7
Table 3. Housing Improvement by Tenure, Philippines, 1985-1997 (change in percentage points).a/
Own or Own/ Own/ owner-like Rent house/ rent-free house, rent-free house, possession room, rent-free lot rent-free lot of house including Own house, w/ consent of w/o consent of and lot lot rent lot owner owner Total
Philippines Strong Wall 21.9 26.8 27.4 23.4 27.1 23.9 Makeshift Wall -1.5 0.8 -2.4 -3.2 -2.5 -1.8 Water-sealed Toilet 10.9 3.7 12.7 15.7 14.7 12.2 No Toilet -1.6 -1.5 -3.4 -2.9 -7.3 -2.5 Own use, Faucet, Community Water System 4.3 -8.3 5.9 2.0 -0.9 2.8 Peddled Water 0.4 0.8 -0.6 1.9 7.9 0.8 Urban Strong Wall 17.4 26.9 27.9 28.4 32.6 23.4 Makeshift Wall -0.5 0.7 -1.6 -4.0 -6.6 -1.3 Water-sealed Toilet 3.6 3.1 10.3 13.7 10.0 6.3 No Toilet -0.2 -1.1 -1.4 -3.1 -8.7 -1.4 Own use, Faucet, Community Water System -0.1 -9.0 5.0 -0.2 -8.9 -1.7 Peddled Water -0.2 0.8 -0.9 2.6 9.5 0.6 Rural Strong Wall 19.8 23.6 26.5 17.8 14.4 20.3 Makeshift Wall -2.1 2.2 -3.5 -3.2 0.0 -2.4 Water-sealed Toilet 10.3 7.7 15.8 12.7 16.0 11.9 No Toilet -1.0 -5.2 -6.2 -1.0 -1.9 -1.8 Own use, Faucet, Community Water System 0.7 -5.8 6.7 -0.1 4.4 0.7 Peddled Water 0.2 -0.1 -0.2 0.9 1.6 0.4 NCR Strong Wall 20.5 27.0 37.2 35.5 47.1 26.8 Makeshift Wall 0.9 1.8 0.1 -0.4 -10.0 1.1 Water-sealed Toilet 3.5 3.9 2.9 13.3 10.7 4.8 No Toilet -0.8 -1.2 -3.1 -3.0 -5.9 -1.4 Own use, Faucet, Community Water System -2.9 -13.4 9.4 -8.8 -19.9 -7.2 Peddled Water -2.1 1.5 -2.0 8.4 12.7 1.2 Metro Cebu Strong Wall 10.9 28.7 16.4 22.1 11.6 15.2 Makeshift Wall -3.8 3.7 -2.4 -10.8 -1.7 -2.9 Water-sealed Toilet -12.1 -0.7 -0.9 6.0 -0.5 -4.6 No Toilet 4.1 3.5 -0.5 -16.9 -6.4 -1.5 Own use, Faucet, Community Water System -17.3 -13.5 -10.5 25.6 -6.7 -7.9 Peddled Water 5.4 3.7 1.1 -8.7 23.0 5.3 Davao City Strong Wall 26.1 38.4 18.2 41.4 76.9 30.5 Makeshift Wall -1.5 -8.2 -4.1 -3.5 0.0 -3.1 Water-sealed Toilet 19.7 5.0 -10.7 17.5 35.8 13.7 No Toilet 4.1 4.4 3.1 14.0 23.1 6.9 Own use, Faucet, Community Water System 19.4 -8.9 -15.2 -2.2 53.3 7.6 Peddled Water -0.9 -16.5 -3.3 6.0 23.6 -1.7
a/ See Appendix 1 for details.
Improvements in dwellings have not been limited to households with secure tenures.
Households occupying informal dwellings have likewise showed much improved
housing conditions. For instance, those households occupying dwellings without

8
consent of owners have homes that are mainly (62%) of strong materials compared to
only 23% in 1985. Toilet facilities also improved with 51% using water-sealed toilets
compared to 36% in 1985. These types of improvements in dwelling conditions have
been more pronounced in key urban cities.
B. Housing Consumption by Income Group
Homeownership as expected is comparatively higher among non-poor households, i.e.
households above the poverty thresholds (Table 4).1 However, poor households
showed greater improvement in tenure status. In 1985, only 51.8% of poor families
were homeowners. This proportion increased by about 10-percentage point in 1997.
Comparatively, only a 2-percentage point increase is noted among non-poor
households for the same period. There has been a decline in total informal dwellings
specifically those who live with relatives and in work areas although the number of
households in illegally occupied dwellings or squatter areas have increased. An
increase in illegal dwellings is noted among the non-poor households, which maybe
indicative of the rising difficulty of obtaining housing from the formal sector even
among non-poor families. This finding is also apparent in urban areas, specifically
Metro Manila.
In Metro Manila although there has been an increase in homeownership for both poor
and non-poor households between 1985 and 1997, the increase in the proportion of
households in illegally occupied dwellings has also been sizeable. Among the poor
households, the proportion of households in illegally occupied dwellings in 1985
increased three times its level in 1997. This trend is also observed among non-poor
households. The increase may have come from new households, from renter-
households (house and lot or lot only) or from households under some informal
dwelling arrangements.
1 Households were grouped based on the computed poverty threshold by region/city. This yielded a better classification of households by income over classification using income deciles. Poverty threshold considers regional differences in terms of prices and consumption patterns.

9
Table 4. Tenure Trends by Income Group, Poor vs. Non-poor Households, Philippines, (in proportion to total households). a/
1985 1997 Own or Own/ Own/ Own or Own/ Own/ owner-like Rent rent-free house, rent-free house, owner-like Rent rent-free house, rent-free house, possession house/room, rent-free lot rent-free lot possession house/room, rent-free lot rent-free lot of house and including Own house, w/ consent of w/o consent of of house and including Own house, w/ consent of w/o consent of Total lot lot rent lot owner owner Total lot lot rent lot owner owner Philippines Poor 100.0 51.8 4.0 7.1 34.7 2.4 100.0 62.0 1.9 3.8 28.9 3.4 Non-poor 100.0 63.1 9.8 6.2 19.2 1.6 100.0 65.7 8.4 4.1 18.7 3.0 Urban Poor 100.0 39.4 12.5 13.3 30.4 4.4 100.0 53.1 5.7 6.6 28.0 6.6 Non-poor 100.0 55.4 19.8 8.8 13.9 2.1 100.0 61.6 13.8 4.7 15.8 4.1 Rural Poor 100.0 56.8 0.6 4.6 36.4 1.6 100.0 65.2 0.5 2.8 29.2 2.3 Non-poor 100.0 69.4 1.5 4.2 23.7 1.2 100.0 71.2 1.2 3.4 22.7 1.5 NCR Poor 100.0 29.3 31.2 12.1 21.3 6.0 100.0 37.4 22.7 2.8 19.8 17.3 Non-poor 100.0 44.7 32.8 9.1 11.4 2.0 100.0 50.9 26.1 3.9 12.9 6.2 Metro Cebu Poor 100.0 20.9 13.4 11.9 20.9 32.8 100.0 39.7 7.0 15.4 19.6 18.3 Non-poor 100.0 48.1 15.5 13.2 6.2 17.1 100.0 44.6 9.5 11.6 20.6 13.7 Davao City Poor 100.0 47.1 10.9 10.3 30.2 1.6 100.0 41.6 6.8 13.4 38.2 - Non-poor 100.0 57.8 18.6 9.3 13.7 0.6 100.0 56.3 11.7 7.3 22.8 1.9
a/ See Appendix 2 for details.

10
The trends for Metro Cebu and Davao City show a decline in the proportion of
homeownership even among the non-poor households, although the decline is
relatively small. In Davao City, we find a comparatively insignificant proportion of
illegal dwellers compared to Metro Cebu and NCR.
Housing improvements has been generally on the upward trend for all households,
whether poor or non-poor (Table 5). There remain, however, poor water supply
connections in all areas, which as earlier indicated, is primarily due to the poor water
infrastructure in the country. Although there has been an increase in water outreach
for poor communities under the privatization program of the MWSS and LGU
initiated water projects, providing households their own piped water through a
community water system would still require much work (ADB 2000).
Table 5. Housing Improvement by Income Group, (in percentage point change).
1985-1997
Wall Material Toilet Facility Source of Water Supply
Own use, faucet,
Strong Makeshift Water-sealed None community water Peddler
system
Philippines
Poor 16.2 -3.1 5.5 -1.0 -2.8 -0.2
Non-poor 21.1 -0.5 9.7 -0.5 1.7 1.3
Urban
Poor 17.4 -2.6 2.2 1.1 -7.2 -1.1
Non-poor 17.2 0.3 1.2 0.3 -6.2 1.3
Rural
Poor 16.1 -3.2 7.3 -2.1 -0.7 0.3
Non-poor 20.5 -1.5 12.8 0.0 1.1 0.5
NCR
Poor 23.1 11.1 5.5 1.0 -14.4 4.9
Non-poor 20.4 3.0 0.8 -0.7 -12.3 2.1
Metro Cebu
Poor 9.0 1.5 -19.8 15.6 -4.3 13.5
Non-poor 5.4 -0.5 -13.9 1.5 -17.9 5.3
Davao City
Poor 45.7 -4.5 9.2 20.2 4.2 -4.8
Non-poor 15.6 -1.1 4.1 5.9 -1.9 -0.6
a/ See Appendix 3 to 5 for details.

11
C. Housing Consumption by Lifecycle
The proportion of homeownership is highest among married households than
households whose heads are unmarried, separated or widowed (Table 6). The
household size is shown to have an impact on tenure where larger-sized households,
whether married or unmarried/separated/widowed, tend to have lesser capacity for
homeownership than smaller-sized households.
The trends in tenure status by lifecycle show increases in the proportion toward
homeownership for different household types. This trend is more pronounced among
married households than single households. However, illegal housing is more
common among married households.
Both single and married households show increasing trend toward illegal dwellings.
Where illegal housing was uncommon among single households, we find a rise in the
proportion of single households in illegal type of dwellings.
The effects of lifecycle are more pronounced in specific localities. In NCR, while the
proportion of homeownership is rising for all types of households, single households
are mainly renter-households. Homeownership is highest among married individuals
where household head is at least 50 years of age.
Informal dwellings without consent of owners are increasing for all types of
households. It is observed that from 1985 to 1997, the conditions of housing by single
households have worsened. Similar conditions are observed in other metropolitan
areas, i.e., Cebu and Davao City. Informal dwellings are on the rise specifically illegal
housing for single and married individuals. It seems that in highly urbanized areas like
Metro Manila, Cebu and Davao, housing options in the formal market have become
limited even among single households with no dependents. The situation could thus
be worst for households with dependents.

12
Table 6. Tenure Trends by Lifecycle, Philippines, (in percentage point change).a/
1985-1997 Own/ Own/ Own or owner- rent-free house, rent-free house, like possession Rent house/ rent-free lot rent-free lot of house and room, including Own house, w/ consent of w/o consent of lot lot rent lot owner owner Philippines single/separated, hhsize=1 -1.2 1.8 3.2 -8.3 4.5 single w/ hhsize>1 -0.6 1.5 -0.9 0.5 -0.5 separated, hhsize>1 13.9 -8.1 -2.2 -5.2 1.5 married, hhead<30, hsize< or =3 2.6 5.0 -1.5 -7.5 1.4 married, hhead<30, 3<hsize<6 9.4 0.4 -5.3 -6.0 1.6 married, hhead<30, hsize 6+ 8.9 -1.7 -3.0 -5.3 1.1 married, hhead 30-39, hsize< or =3 3.2 2.2 -4.2 -0.8 -0.3 married, hhead 30-39, 3<hsize<6 9.3 -2.3 -3.1 -4.9 1.0 married, hhead 30-39, hsize 6+ 11.8 -3.0 -3.1 -7.3 1.7 married, hhead 40-49, hsize< or =3 6.4 -0.6 -1.9 -6.3 2.4 married, hhead 40-49, 3<hsize<6 7.0 -1.9 -2.5 -3.3 0.7 married, hhead 40-49, hsize 6+ 5.0 -1.0 -4.0 -1.9 1.9 married, hhead 50+, hsize< or =3 0.7 0.0 -1.6 -0.6 1.5 married, hhead 50+, 3<hsize<6 3.9 -0.5 -1.0 -2.7 0.4 married, hhead 50+, hsize 6+ 5.4 -1.7 -2.1 -3.3 1.7 Urban single/separated, hhsize=1 -3.3 -4.0 4.3 -2.6 5.6 single w/ hhsize>1 3.8 -3.5 -2.9 2.2 0.5 separated, hhsize>1 22.2 -12.4 -4.2 -8.5 2.8 married, hhead<30, hsize< or =3 11.3 1.8 -5.9 -9.5 2.1 married, hhead<30, 3<hsize<6 13.4 -7.0 -8.8 2.2 0.3 married, hhead<30, hsize 6+ 16.6 -5.3 -7.1 -2.6 -1.6 married, hhead 30-39, hsize< or =3 11.1 0.5 -6.8 -5.3 0.6 married, hhead 30-39, 3<hsize<6 10.8 -7.5 -4.5 -0.4 1.6 married, hhead 30-39, hsize 6+ 14.2 -10.7 -6.3 -0.8 3.7 married, hhead 40-49, hsize< or =3 6.0 -11.8 -4.1 6.6 3.3 married, hhead 40-49, 3<hsize<6 13.9 -6.9 -3.1 -4.7 0.9 married, hhead 40-49, hsize 6+ 9.9 -4.5 -8.1 -0.6 3.3 married, hhead 50+, hsize< or =3 7.9 -3.4 -3.7 -3.2 2.5 married, hhead 50+, 3<hsize<6 7.2 -3.3 -3.3 -0.2 -0.4 married, hhead 50+, hsize 6+ 7.0 -4.6 -4.7 -0.2 2.4 Rural single/separated, hhsize=1 7.8 -1.7 2.4 -11.7 3.1 single w/ hhsize>1 -1.5 1.6 1.1 0.9 -2.0 separated, hhsize>1 2.0 -3.9 1.2 1.4 -0.8 married, hhead<30, hsize< or =3 2.7 -0.2 0.0 -3.3 0.8 married, hhead<30, 3<hsize<6 10.8 0.2 -3.8 -9.1 1.9 married, hhead<30, hsize 6+ 6.0 -3.2 -1.2 -4.7 3.0 married, hhead 30-39, hsize< or =3 0.5 -2.1 -2.3 5.1 -1.3 married, hhead 30-39, 3<hsize<6 9.8 -0.4 -2.1 -7.5 0.2 married, hhead 30-39, hsize 6+ 11.9 -0.7 -1.9 -9.6 0.2 married, hhead 40-49, hsize< or =3 9.9 3.0 -1.1 -12.9 1.1 married, hhead 40-49, 3<hsize<6 3.2 -0.3 -2.2 -0.8 0.2 married, hhead 40-49, hsize 6+ 3.2 -0.1 -2.0 -1.6 0.5 married, hhead 50+, hsize< or =3 -2.2 0.4 -1.2 2.2 0.8 married, hhead 50+, 3<hsize<6 3.1 -0.1 -0.2 -3.3 0.6 married, hhead 50+, hsize 6+ 4.5 -0.1 -0.2 -5.1 0.9 a/ See Appendix 6 for details.

13
Table 6. Tenure Trends by Lifecycle, Philippines, (in percentage point change).a/(con't)
1985-1997 Own/ Own/ Own or owner- rent-free house, rent-free house, like possession Rent house/ rent-free lot rent-free lot of house and room, including Own house, w/ consent of w/o consent of lot lot rent lot owner owner NCR single/separated, hhsize=1 21.4 -32.9 1.1 -2.2 12.6 single w/ hhsize>1 9.3 -11.1 -4.9 4.1 2.7 separated, hhsize>1 23.9 -11.6 -7.9 -8.9 4.4 married, hhead<30, hsize< or =3 14.3 4.2 -11.5 -9.3 2.3 married, hhead<30, 3<hsize<6 6.0 -10.4 -5.2 6.7 2.9 married, hhead<30, hsize 6+ 22.6 -3.8 -6.5 -7.4 -4.9 married, hhead 30-39, hsize< or =3 9.3 2.7 -4.6 -7.7 0.3 married, hhead 30-39, 3<hsize<6 4.5 -5.7 -3.0 3.7 0.5 married, hhead 30-39, hsize 6+ 11.1 -20.4 -4.3 3.7 9.9 married, hhead 40-49, hsize< or =3 22.3 -26.9 -7.6 6.8 5.5 married, hhead 40-49, 3<hsize<6 16.3 -9.2 -2.5 -5.6 1.0 married, hhead 40-49, hsize 6+ 7.3 -5.1 -8.8 -0.1 6.7 married, hhead 50+, hsize< or =3 10.1 -7.6 -3.9 0.3 1.1 married, hhead 50+, 3<hsize<6 6.4 -2.9 -4.4 -2.4 3.3 married, hhead 50+, hsize 6+ 6.7 -6.0 -5.3 -1.2 5.9 Metro Cebu single/separated, hhsize=1 15.0 -18.1 9.2 -6.1 0.0 single w/ hhsize>1 -34.5 6.6 -2.0 3.0 27.0 separated, hhsize>1 8.3 -50.0 0.0 16.7 25.0 married, hhead<30, hsize< or =3 0.9 44.5 3.6 -24.9 -24.1 married, hhead<30, 3<hsize<6 12.7 -17.5 5.6 26.9 -27.7 married, hhead<30, hsize 6+ 25.9 -60.9 0.0 27.1 7.9 married, hhead 30-39, hsize< or =3 20.2 30.1 -20.7 -12.8 -16.8 married, hhead 30-39, 3<hsize<6 3.4 -5.7 -3.1 2.5 2.8 married, hhead 30-39, hsize 6+ 10.1 -20.5 0.6 21.1 -11.3 married, hhead 40-49, hsize< or =3 -44.4 0.0 15.7 25.9 2.8 married, hhead 40-49, 3<hsize<6 -22.2 8.0 9.1 29.6 -24.6 married, hhead 40-49, hsize 6+ 11.8 -4.5 -10.3 8.3 -5.4 married, hhead 50+, hsize< or =3 6.4 -20.0 18.7 -16.3 11.2 married, hhead 50+, 3<hsize<6 17.2 -1.7 9.7 -3.7 -21.5 married, hhead 50+, hsize 6+ -1.8 -6.7 -6.9 15.0 0.5 Davao City single/separated, hhsize=1 -14.1 25.6 0.0 -11.5 0.0 single w/ hhsize>1 -23.9 -5.4 0.0 29.3 0.0 separated, hhsize>1 20.8 -53.8 27.1 5.9 0.0 married, hhead<30, hsize< or =3 -39.4 15.6 9.4 14.3 0.0 married, hhead<30, 3<hsize<6 26.7 -19.9 -8.0 -6.4 7.6 married, hhead<30, hsize 6+ 66.7 -50.0 0.0 -16.7 0.0 married, hhead 30-39, hsize< or =3 5.9 -14.7 0.0 8.8 0.0 married, hhead 30-39, 3<hsize<6 6.0 3.2 -12.2 5.6 -2.6 married, hhead 30-39, hsize 6+ -16.5 -3.4 11.8 11.7 -3.7 married, hhead 40-49, hsize< or =3 16.0 -13.9 -16.7 14.6 0.0 married, hhead 40-49, 3<hsize<6 12.8 -14.3 6.5 -7.4 2.4 married, hhead 40-49, hsize 6+ -16.4 3.2 1.7 10.0 1.5 married, hhead 50+, hsize< or =3 -17.5 -8.5 3.6 18.9 3.6 married, hhead 50+, 3<hsize<6 1.4 -2.2 -8.8 9.6 0.0 married, hhead 50+, hsize 6+ 8.4 -5.0 -1.9 -1.5 0.0
Improvements in housing are the apparent trend in housing consumption for both
single and married households (Table 7). Between 1985 and 1997, housing facilities
are much better, in particular, wall material and toilet facilities.

14
Table 7. Housing Improvement by Lifecycle, (in percentage point change).a/
1985-1997
Source of Water Wall Material Toilet Facility Supply
Strong Water-sealed Own use, faucet, community water system
Philippines single/separated, hhsize=1 24.2 9.2 8.9 single w/ hhsize>1 22.3 14.4 4.2 separated, hhsize>1 19.4 12.0 1.3 married, hhead<30, hsize< or =3 32.3 23.8 5.1 married, hhead<30, 3<hsize<6 24.3 10.3 1.3 married, hhead<30, hsize 6+ 25.7 14.5 1.8 married, hhead 30-39, hsize< or =3 20.4 3.3 0.5 married, hhead 30-39, 3<hsize<6 24.6 11.5 0.4 married, hhead 30-39, hsize 6+ 20.1 9.7 1.5 married, hhead 40-49, hsize< or =3 33.2 17.8 9.4 married, hhead 40-49, 3<hsize<6 26.7 13.9 4.7 married, hhead 40-49, hsize 6+ 20.9 8.1 1.8 married, hhead 50+, hsize< or =3 21.0 14.1 4.7 married, hhead 50+, 3<hsize<6 24.6 12.8 3.6 married, hhead 50+, hsize 6+ 22.8 11.0 0.3 Urban single/separated, hhsize=1 25.4 -7.5 1.8 single w/ hhsize>1 22.8 7.0 -4.9 separated, hhsize>1 24.0 4.8 -1.7 married, hhead<30, hsize< or =3 27.0 11.7 -0.8 married, hhead<30, 3<hsize<6 29.8 8.1 -5.6 married, hhead<30, hsize 6+ 28.9 15.3 -2.7 married, hhead 30-39, hsize< or =3 25.7 4.4 -1.7 married, hhead 30-39, 3<hsize<6 23.3 5.3 -3.8 married, hhead 30-39, hsize 6+ 23.2 4.7 -1.2 married, hhead 40-49, hsize< or =3 27.4 13.1 3.4 married, hhead 40-49, 3<hsize<6 23.9 5.6 1.7 married, hhead 40-49, hsize 6+ 22.8 6.1 -1.0 married, hhead 50+, hsize< or =3 23.2 8.2 2.4 married, hhead 50+, 3<hsize<6 17.2 4.7 -2.7 married, hhead 50+, hsize 6+ 22.8 4.9 -4.7 Rural single/separated, hhsize=1 10.2 6.9 3.4 single w/ hhsize>1 15.5 15.5 3.7 separated, hhsize>1 7.8 19.1 0.2 married, hhead<30, hsize< or =3 28.7 22.9 2.3 married, hhead<30, 3<hsize<6 15.8 5.8 0.3 married, hhead<30, hsize 6+ 18.2 8.1 -0.6 married, hhead 30-39, hsize< or =3 9.4 -4.0 -4.1 married, hhead 30-39, 3<hsize<6 22.2 13.2 -0.1 married, hhead 30-39, hsize 6+ 15.8 8.7 -0.2 married, hhead 40-49, hsize< or =3 32.9 15.5 5.8 married, hhead 40-49, 3<hsize<6 24.6 16.2 0.7 married, hhead 40-49, hsize 6+ 16.4 5.7 -0.4 married, hhead 50+, hsize< or =3 16.0 12.6 0.9 married, hhead 50+, 3<hsize<6 26.1 14.3 2.1 married, hhead 50+, hsize 6+ 21.0 14.1 1.4
a/ See Appendix 7 to 9 for details.

15
Table 7. Housing Improvement by Lifecycle, (in percentage point change).a/(con't.)
1985-1997
Source of Water Wall Material Toilet Facility Supply
Strong Water-sealed Own use, faucet, community water system
NCR single/separated, hhsize=1 25.9 -5.9 -13.1 single w/ hhsize>1 14.9 2.9 -7.0 separated, hhsize>1 21.9 7.1 -19.2 married, hhead<30, hsize< or =3 35.2 9.3 -7.3 married, hhead<30, 3<hsize<6 36.4 1.0 -12.5 married, hhead<30, hsize 6+ 34.0 15.2 2.3 married, hhead 30-39, hsize< or =3 35.9 3.0 -14.8 married, hhead 30-39, 3<hsize<6 24.2 7.8 -8.8 married, hhead 30-39, hsize 6+ 21.3 1.4 -11.0 married, hhead 40-49, hsize< or =3 27.2 16.6 -6.6 married, hhead 40-49, 3<hsize<6 33.1 2.0 -4.9 married, hhead 40-49, hsize 6+ 33.1 7.4 -7.0 married, hhead 50+, hsize< or =3 17.5 -0.6 3.4 married, hhead 50+, 3<hsize<6 14.8 4.7 -6.8 married, hhead 50+, hsize 6+ 29.7 5.1 -4.3 Metro Cebu single/separated, hhsize=1 64.4 -23.3 36.7 single w/ hhsize>1 9.2 -29.6 -10.0 separated, hhsize>1 -32.0 -39.8 -1.7 married, hhead<30, hsize< or =3 19.5 16.1 10.4 married, hhead<30, 3<hsize<6 18.1 -3.2 6.2 married, hhead<30, hsize 6+ 11.6 17.2 15.0 married, hhead 30-39, hsize< or =3 52.4 42.5 23.7 married, hhead 30-39, 3<hsize<6 8.3 -0.2 0.2 married, hhead 30-39, hsize 6+ 28.9 -3.7 -11.7 married, hhead 40-49, hsize< or =3 38.0 -56.3 -39.0 married, hhead 40-49, 3<hsize<6 10.2 11.8 -39.6 married, hhead 40-49, hsize 6+ 14.3 -17.9 -5.3 married, hhead 50+, hsize< or =3 69.6 39.4 16.7 married, hhead 50+, 3<hsize<6 26.5 1.8 2.3 married, hhead 50+, hsize 6+ -1.2 -16.1 -36.2 Davao City single/separated, hhsize=1 0.0 0.0 34.6 single w/ hhsize>1 47.1 24.2 23.9 separated, hhsize>1 20.5 -3.0 -3.8 married, hhead<30, hsize< or =3 37.5 -10.1 -56.4 married, hhead<30, 3<hsize<6 41.3 -1.2 8.0 married, hhead<30, hsize 6+ -23.6 33.3 66.7 married, hhead 30-39, hsize< or =3 41.2 32.4 5.9 married, hhead 30-39, 3<hsize<6 41.2 6.3 8.1 married, hhead 30-39, hsize 6+ 50.6 28.2 7.9 married, hhead 40-49, hsize< or =3 59.0 18.8 -1.4 married, hhead 40-49, 3<hsize<6 48.9 24.8 46.9 married, hhead 40-49, hsize 6+ 27.3 12.5 8.8 married, hhead 50+, hsize< or =3 -4.6 1.2 -17.2 married, hhead 50+, 3<hsize<6 17.4 0.7 -8.4 married, hhead 50+, hsize 6+ 42.3 19.0 7.7

16
IV. Estimates of Housing Demand Parameters
This section provides some quantitative measure of the effects of income and lifecycle
on housing demand. The estimates are obtained from the application of standardized
econometric models.
A. The Model
The econometric analysis on housing demand is based on Alonso’s classic utility
maximization framework whereby a household’s choice of a location and amount of
space consumed depends on income, tastes, and the shape of land and transport
gradients. This utility maximization concept has been extended to analyzing
individual household’s decision in the case of housing services (Strazheim 1975).
Households are assumed to choose a set of housing attributes such as to maximize
utility subject to budget constraint. These housing attributes include both dwelling-
unit characteristics (e.g. tenure choice, housing expenditure, age of structure, size and
number of rooms, etc) and neighborhood characteristics (e.g. racial or ethnic
composition of the area, aesthetic and environmental aspects of the neighborhood,
etc). By simplifying assumptions with regard to the shape of price surfaces (i.e.
ignoring neighborhood effects on prices and spatial discontinuities of housing prices)
and the effect of relocation costs on decisions of households, the utility maximizing
model can be used to derive demand functions for several housing attributes; the
elements of these demand functions are income and the parameters of the utility and
rent surfaces (e.g. tastes, demographic factors, price).
The analysis applied in this study is confined to the characteristics of the housing unit.
Two attributes of dwelling-unit characteristics are analyzed. First, total housing
expenditure, which refers to the amount that households are willing to incur per unit
of time to derive a given amount of housing services. Second, tenure choice, which
provides estimates on the maximum likelihood of households choosing ownership
over renting. The demand equations are represented below. Data is from the Family
Income and Expenditure Survey conducted every three years to a representative
sample of 40,000 households in the Philippines.
17
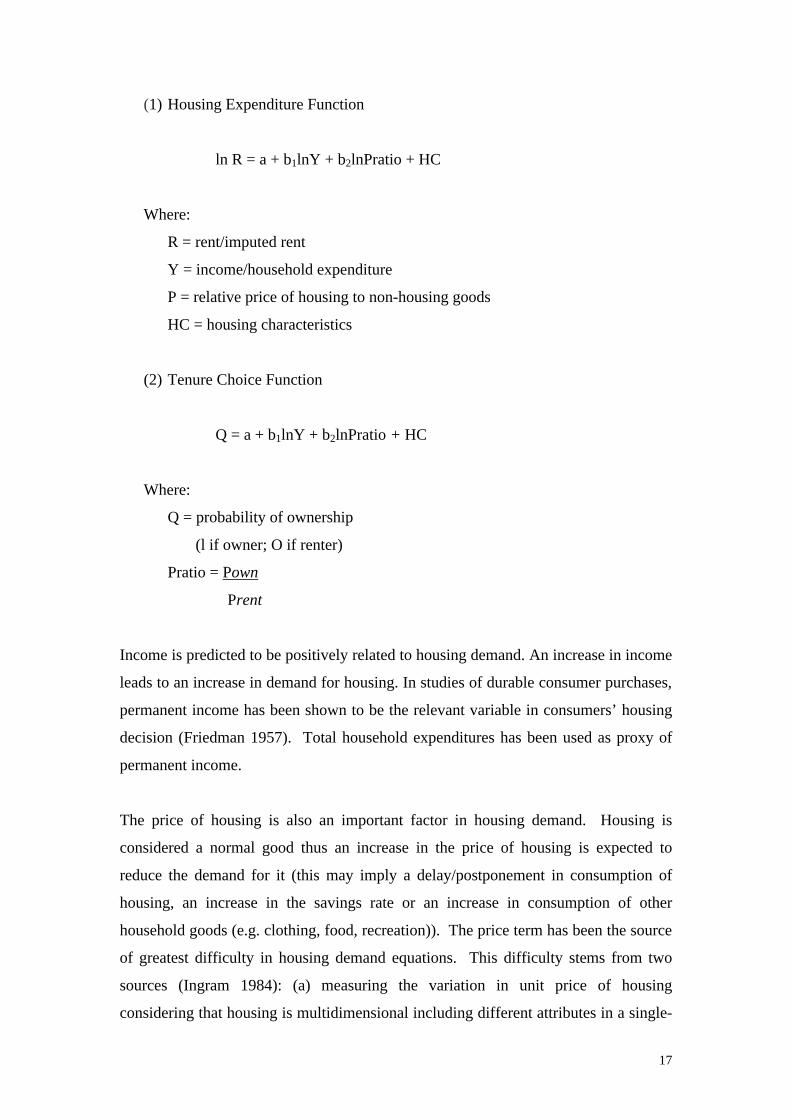
(1) Housing Expenditure Function
ln R = a + b1lnY + b2lnPratio + HC
Where:
R = rent/imputed rent
Y = income/household expenditure
P = relative price of housing to non-housing goods
HC = housing characteristics
(2) Tenure Choice Function
Q = a + b1lnY + b2lnPratio + HC
Where:
Q = probability of ownership
(l if owner; O if renter)
Pratio = Pown
Prent
Income is predicted to be positively related to housing demand. An increase in income
leads to an increase in demand for housing. In studies of durable consumer purchases,
permanent income has been shown to be the relevant variable in consumers’ housing
decision (Friedman 1957). Total household expenditures has been used as proxy of
permanent income.
The price of housing is also an important factor in housing demand. Housing is
considered a normal good thus an increase in the price of housing is expected to
reduce the demand for it (this may imply a delay/postponement in consumption of
housing, an increase in the savings rate or an increase in consumption of other
household goods (e.g. clothing, food, recreation)). The price term has been the source
of greatest difficulty in housing demand equations. This difficulty stems from two
sources (Ingram 1984): (a) measuring the variation in unit price of housing
considering that housing is multidimensional including different attributes in a single-

18
purchased; and (b) household faces a schedule of prices (e.g. price may vary with
quantity of housing but the household can locate anywhere in the city). There have
been different measures of unit price of housing, to wit: indices of construction
materials and rental prices, land and housing values, work place based price index
(i.e. price variation is computed as the variation in expense by workplace for a given
quantity of housing). In this paper, housing prices have been estimated using hedonic
estimation.
(3) Hedonic Equation
lnR = a +ΣbiXi + u
t=1
X1 = type of construction materials
X2= source of water supply
X3= type of toilet facilities
The hedonic estimates assume that variation in housing price is largely explained by
differences in the type of housing within specific regions. However, the prices are
based on rent values, which include both price and quantity. To untangle price and
quantities in the model, we applied Muth’s (1971) methodology that assumes a two-
input homogenous production function for housing, where the price of one input
varies over the sample and the price of the other input is fixed (see also Malpezzi and
Mayo 1987). Here we assume the variable input to be the housing structure and land
as the fixed input. Given this assumption, the housing expenditure function can be
written as follows:
(4) Ln R = a + b1lnY + kS (1 + Ep) ln pS + HC
where kS is the share of structure on housing and Ep is the price elasticity. The other
variable definition follows equation (1) above. To convert the coefficient of the log
of estimated housing values (b2) from equation (1) into price elasticity (price effect),
the following formula is used:

19
(5) Ep = b2/kS – 1
where b2 is the estimated coefficient and the value of kS is based on the standard land-
structure ratio from government housing programs, which is 40% for land and 60%
structure.
With regard to socio-demographic determinants, the following trends are noted. The
age of household head is expected to have a positive influence on demand but the
demand for housing declines as the household head reaches old age. For marital
status, there is a stronger desire for housing due to marriage. Household size is
hypothesized to have a positive impact on housing expenditure. However, for very
large households, housing consumption is assumed to be crowded out by food
consumption, thus a negative relationship results as household size reaches a
threshold level. Household size is the main demographic variable used. This variable
also captures the effects of age and marital status on housing demand.
The above framework is typical of housing demand studies in the Philippines and
elsewhere. The models differ as to how demand variables are represented for analysis
and this is largely influenced by the suitability and extensiveness of housing surveys
in a specific country. In the last decade, econometric analyses of housing demand
specifically in developing countries have grown. This development provided greater
understanding of the variation in data, model specifications and variable definitions in
demand estimations. Comparatively, there are very few of such studies done in the
Philippines. The initial attempt to estimate a demand function for housing in the
Philippines was that of Angeles (1985). Malpezzi and Mayo (1987) estimated a
similar housing demand function using data from a household survey conducted in
Metro Manila in 1984. Geron and Llanto (2001) applied a simple demand model
omitting price variation (i.e. assuming no intra-metropolitan variation in prices and
thus variation is primarily due to quantities) using data from the Family Income and
Expenditures (FIES). Following the demand models used in these studies, the paper
extended analysis to include demand by different categories of households and for
specific housing attributes. This study also takes into consideration locational
variations in demand compared to the aggregate parameters employed in the studies
of Angeles, Geron and Llanto.

20
B. Demand Estimates by Location
Income has been a major determinant of housing demand. Income elasticity of
housing demand is between 1.02 and 1.05 for owners and 0.98 to 1.08 for renters.
(Figures 1&2). There is an observed variation in income elasticity from place to place
but point estimates generally suggest inelastic demand. The variation in estimates
maybe due to data aggregation rather than underlying behavior.

21
Inelastic income suggests that housing expenditure is not highly responsive to a given
change in income. A unit increase in income thus will not be spent largely on housing
but will be used by households for other needs.
The estimates on renters, however, show divergent behavior, which may reflect
different types of renter-households. For instance, there are renters who have their
own houses but rent in another location (usually near their work areas) as alternative
dwelling. On the other hand, there are households who are primarily renters.
Demand for homeownership is generally high in both urban and rural areas in the
Philippines (Table 8). Most households are more likely to be homeowners but this
may arise from the limited alternative housing in the formal sector specifically for
low-income households rather than aversion to renting. Probability estimates by
locality show that the results are different in the case of highly urbanized city of
Metro Manila. Here, we find relatively lower probabilities of homeownership. The
threshold annual income in which households are indifferent with regard to owning or
renting is between P80,000 and P90,000. This implies that a typical household (i.e.
married, age of household head between 39-49, with household size of six) with
annual incomes of at most P80,000 is most likely to be renter than a homeowner. In
other areas, we find that renting is hardly an option even among low-income
households. The ratio of price of homeownership vis-à-vis price of rent shows that in
these areas, price of rent is almost the same or even higher than the price of
homeownership. In Metro Cebu, for instance, the average price ratio is 0.57 and in
rural areas, the price ratio is about 1. These price ratios reflect a rental housing
market that caters largely to higher-income households. Since the alternative housing
in these areas is homeownership, conditions of doubled-up or multi-family dwelling
would be common. The other alternative is that households are amortizing owners
under micro finance housing arrangement (e.g. CMP) whereby loan amortization are
lower than in the formal system.

22
Table 8. Probability of Homeownership.
Annual Philippinesa/ Key Urban Citiesb/ Family Urban Rural NCR Metro Davao Income Cebu City
50,000 0.667 0.994 0.429 0.947 0.946 80,000 0.685 0.994 0.496 0.959 0.958 100,000 0.693 0.995 0.527 0.963 0.960 200,000 0.719 0.995 0.624 0.974 0.971 500,000 0.751 0.996 0.736 0.984 0.985 a/ Based on the following assumptions: Household size: Urban = 5 Rural = 6 Age of HH head: 35-49 Average price ratio b/ Based on the following assumptions:
Household size 5 Age of HH head = 35-49 Average price ratio NCR =1.8 Metro Cebu = 0.57 Davao City = 1.09
C. Demand Estimates by Type of Household
Estimates of income elasticity among different household types show that inelastic
demand is common among poor households rather than non-poor households.2 Poor
households are more likely to spend an increase in income on other household needs
other than housing. On the other hand, the demand for housing by non-poor
households is more responsive to a change in income (Table 9). This finding reflects
the need to raise income levels of households such that significant changes in tenure
or housing conditions maybe undertaken specifically by poor households. It also
provides a rationale for subsidizing housing for the poor.
2 Poor households are households whose incomes fall below a poverty threshold income within a region. The poverty threshold is based on prices and consumption patterns within the region.
ownership Urban = 1.800 renting rural = 0.939

23
We find similar results for renter-households. The findings are also consistent with
estimates in specific localities. The econometric model though was not able to
capture significantly the behavior of renter-households in NCR, Metro Cebu and
Davao City due to lack of representative sample.
Table 9. Income and Price Elasticity by Income Group a/
Owners Renters Intercept Income Price Confidence Adjusted Intercept Income Price Confidence Adjusted (ΕΕy) (ΕΕp) Interval (Ey) R2 (ΕΕy) (ΕΕp) Interval (Ey) R2 (95%) (95%)
Philippines Poor -4.184 0.937 -0.230 0.89 - 0.99 0.455 -3.958 0.977 -0.400 0.72 - 1.24 0.547 (0.214) (0.025) (0.011) (1.080) (0.129) (0.056) Non-Poor -4.612 1.020 -0.330 1.00 - 1.04 0.699 -4.655 1.047 -0.450 0.99 - 1.11 0.583 (0.084) (0.010) (0.007) (0.282) (0.029) (0.021) Urban Poor -4.449 1.039 -0.420 0.96 - 1.12 0.488 -3.605 0.985 -0.500 0.71 - 1.26 0.474 (0.349) (0.041) (0.046) (1.191) (0.136) (0.160) Non-Poor -3.956 1.014 -0.450 0.99 - 1.03 0.684 -4.562 1.057 -0.500 1.00 - 1.12 0.573 (0.095) (0.010) (0.013) (0.291) (0.030) (0.033) Rural Poor -3.729 0.865 -0.170 0.80 - 0.93 0.406 n.s. n.s. n.s. n.s. n.s. (0.277) (0.032) (0.035) Non-Poor -4.256 0.966 -0.290 0.92 - 1.01 0.545 n.s. n.s. n.s. n.s. n.s. (0.185) (0.021) (0.024) NCR Poor -0.990 0.842 -0.690 0.45 - 1.23 0.271 n.s. n.s. n.s. n.s. n.s. (1.912) (0.194) (0.056) Non-Poor -4.478 1.025 -0.380 0.99 - 1.06 0.724 -5.031 1.141 -0.610 1.06 - 1.22 0.549 (0.212) (0.020) (0.023) (0.422) (0.039) (0.031) Metro Cebu Poor n.s. n.s. n.s. n.s. n.s. n.s. n.s. n.s. n.s. n.s. Non-Poor -3.912 1.100 -0.61 0.99 - 1.22 0.714 -3.447 1.058 -0.690 0.79 - 1.33 0.605 (0.515) (0.058) (0.043) (1.337) (0.136) (0.067) Metro Davao Poor n.s. n.s. n.s. n.s. n.s. n.s. n.s. n.s. n.s. n.s. Non-Poor -3.105 0.907 -0.390 0.77 - 1.05 0.689 n.s. n.s. n.s. n.s. n.s. (0.625) (0.069) (0.059)
a/ Income group based on poverty threshold by region. n.s. = not significant due to lack of sample households.
Classifying households by lifecycle, yielded inelastic demand estimates for both
single and married households (Table 10). However, the likelihood of ownership is
higher for married rather than single households. It is also noted that the likelihood of
homeownership is highest when household head is about 40 to 50 years old and with

24
household size of less than 6. On the other hand, the probability of being a
homeowner is low among single individuals. The result also reflects the difficulty of
owning a home for a middle-income earner specifically in highly urbanized areas.
V. Housing Affordability and Housing Options
Housing demand is shown to be largely associated with income. For this reason,
housing affordability has often been measured in terms of the proportion of income
that a household must or is willing to spend on housing. However, the demand
estimates also show that there are underlying factors such as lifecycle (which also
indirectly measures taste and preferences), price of housing and financing availability
(i.e. results have suggested that micro finance may have provided a means to
homeownership) that impacts on housing affordability.
We tried to capture the interaction of these factors by looking into the distribution of
households by average incomes in specific locations. These income levels are
matched with housing expenditure patterns and financing availability to come up with
some indication of housing affordability.
The distribution of households based on average incomes shows that urban
households receive more income than rural households (Figure 3). Metro Cebu and
Davao City approximates the distribution of most urban areas. On the other hand,
households in Metro Manila are apparently richer than households in other location.
About 57% of households in Metro Manila have average annual household income
between P150,000 and P250,000 while in other urban areas about 60% of households
have incomes between P80,000 and P100,000. These income levels are way above the
poverty threshold income in Metro Manila, and urban areas which are P14,000 and
P12,577, respectively. In terms of income thus, we find that in urban areas most
households are middle-income earners.

25
Table 10. Demand for Housing by Lifecycle
Lifecycle Urban Rural Metro Manila Metro Cebu Metro Davao Probability of Income Probability of Income Probability of Income Probability of Income Probability of Income Homeownership Elasticity Homeownership Elasticity Homeownership Elasticity Homeownership Elasticity Homeownership Elasticity
single/separated, hhsize=1 - 0.60 - 0.36 0.05 0.75 - - - - single w/ hhsize>1 - 0.76 - 0.69 0.50 0.78 0.36 - - - separated, hhsize>1 0.39 0.76 0.94 0.73 0.28 0.67 - - - - married, hhead<30, hsize<=3 0.21 0.90 0.92 0.75 0.12 1.00 0.26 - - - married, hhead<30, 3<hsize<6 - 0.84 - 0.74 0.26 0.83 0.24 0.88 - - married, hhead<30, hsize 6+ - 0.74 - 0.76 - 0.62 - - - - married, hhead 30-39, hsize<=3 0.10 0.78 0.91 0.78 0.07 0.78 0.52 - - - married, hhead 30-39, 3<hsize<6 0.18 0.79 0.87 0.72 0.08 0.77 0.43 1.09 - 1.09 married, hhead 30-39, hsize 6+ - 0.88 - 0.72 0.18 0.84 - 0.87 - - married, hhead 40-49, hsize<=3 - 0.94 - 0.75 - 0.97 - - - - married, hhead 40-49, 3<hsize<6 0.25 0.82 0.92 0.77 0.30 0.80 0.55 1.07 - 0.73 married, hhead 40-49, hsize 6+ 0.22 0.84 0.93 0.66 0.26 0.84 0.50 0.88 - 0.71 married, hhead 50+, hsize<=3 0.30 0.79 0.95 0.73 0.75 0.83 - - - - married, hhead 50+, 3<hsize<6 0.25 0.79 0.97 0.80 0.62 0.83 - 1.13 - 1.13 married, hhead 50+, hsize 6+ 0.56 0.90 0.99 0.69 - 0.98 0.81 1.23 - 0.85
- not significant due to lack of sample data.

26
The income available for housing is, however, minimal. The expenditure pattern of
households shows that at least 50% of income is spent on food (Figure 4). Housing
expenditure represents 10 to 20% of total expenditures with low-income households
spending more in proportion to higher-income households. Food and housing
expenditures combined represent 70 to 80% of household income. This leaves only a
small amount of income for expenditures on other basic needs (e.g. clothing, fuel,
transport, education). Households thus would most likely spend increases in incomes
on needs other than housing and their ability to shift other expenses to housing is
limited.
What are the households’ options in terms of available housing in the market? The
minimum low-cost housing unit under government programs costs P150,000. If
households provide an equity of 25%, the loan amount required to obtain the
P150,000 unit house would be about P112,500. Loan amortization for this loan would

27
amount to about P800 per month for 30 years at a subsidized rate of 9% (Table 11).
This leaves out 62.5% of households from the formal housing market for total
Philippines; 40% of households in the urban areas and 81% of households in rural
areas (refer to figure 3). In the case of rural areas, it may be argued that the cost of
housing can be cheaper.
The number of families unable to afford homeownership in the formal sector further
increases when the low savings capacity of households is taken into account.
Providing the required equity portion of housing loans has been a major constraint for
most households. While government programs and other private developers have
waived the equity requirement, the implication is that households have to borrow the
full amount of P150,000 and pay monthly amortization of about P1,206.93 at
subsidized interest rates of 9%. At a market interest rate of 16%, wherein monthly
loan amortization becomes P2,017, a P150,000 unit would then be accessible only to
households with annual incomes of at least P250,000.
Figure 4. Household Expenditure Patter, Philippines, 1985-1997.
Note: See Appendix 11 for details.

28
Table 11. Average Housing Expenditure and Loan Amortization.
Monthly Housing Expenditure Housing Loan (Formal Sector)a/ Income Class Philippines Urban Rural NCR Metro Davao Loan Interest Loan Amortization
Cebu City Amount Rate 25 30b/
under 10,000 66.93 64.85 67.21 - - - 50,000 9 419.60 402.31 10,000-19,999 123.97 151.21 118.21 300.00 338.38 209.46 60,000 9 503.52 482.77 20,000-29,999 175.37 214.71 166.11 493.89 325.58 413.01 70,000 9 587.44 563.23 30,000-39,999 240.15 298.95 221.97 701.05 462.59 243.22 80,000 9 671.36 643.70 40,000-49,999 309.55 370.09 282.67 671.16 454.49 368.75 90,000 9 755.28 724.16 50,000-59,999 416.16 494.77 368.34 784.17 567.85 535.46 100,000 9 839.20 804.62 60,000-79,999 571.02 640.72 477.73 892.71 674.11 537.72 150,000 9 1,258.80 1,206.93 80,000-99,999 786.92 811.83 633.23 1,177.04 932.36 686.73 200,000 12 2,106.44 2,057.22 100,000-149,999 1,181.19 1,177.75 930.49 1,591.23 1,349.15 1,050.43 250,000 12 2,633.05 2,571.53 150,000-249,999 1,944.81 1,859.21 1,348.70 2,583.36 2,013.54 1,754.04 300,000 16 4,076.67 4,034.28 250,000-499,999 3,509.75 3,022.89 2,551.33 4,519.08 3,680.47 2,869.02 350,000 16 4,756.12 4,706.66 500,000 & over 13,873.00 6,142.86 4,345.71 20,462.03 8,962.95 7,224.09 400,000 16 5,435.56 5,379.04 450,000 16 6,115.01 6,051.42 500,000 16 6,794.45 6,723.80
a/ Based on HDMF schedule of loan amortization and interest for housing loan. b/ Monthly loan amortization of a P150,000 loan for 30 years at 16% interest rate computed at P2,017.
29
The situation varies by location. In Metro Manila, we find that only about 3% of
households would be unable to avail of the loan amortization for a P150,000 housing
unit at subsidized rate. The proportion is higher for Metro Cebu and Davao City but
households in these cities are comparatively better off compared to other areas in the
country. This is apparently the result of better income-generating activities of
households in highly urbanized cities.
The above findings show that subsidizing interest rates alone is not sufficient to allow
poor households access to formal and decent housing. There has to be a significant
reduction in the costs of housing or that other low-cost housing alternatives have to be
considered.
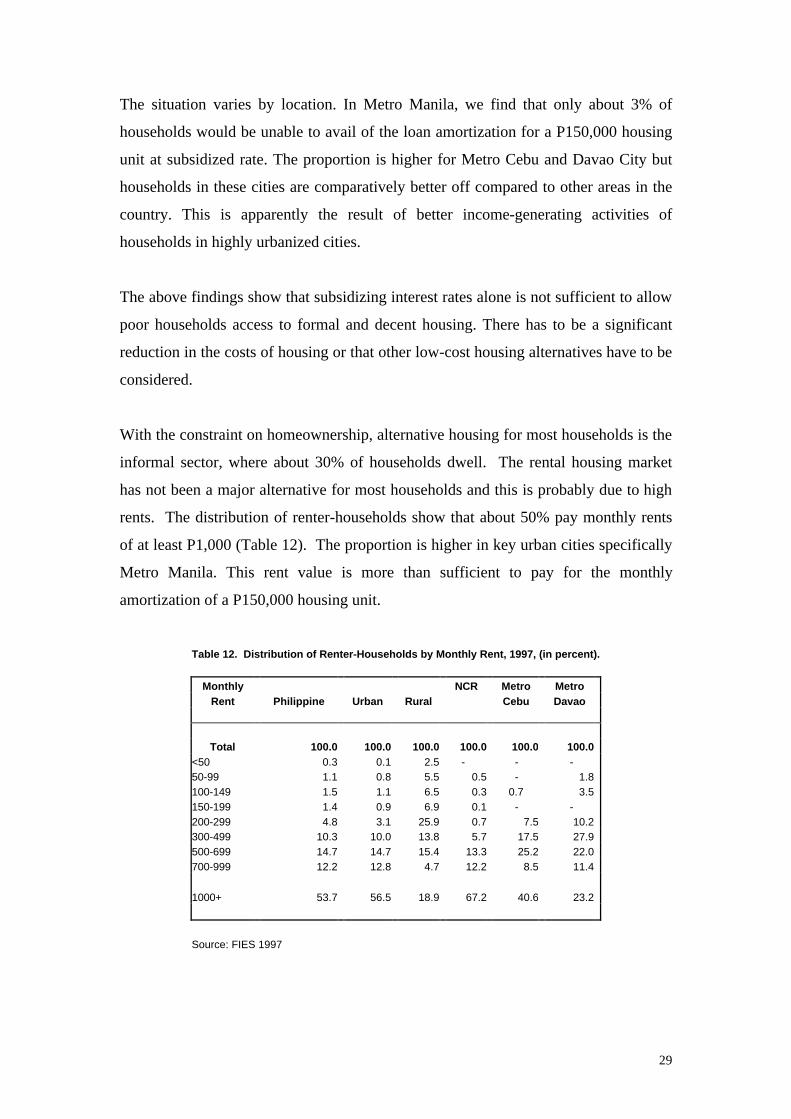
With the constraint on homeownership, alternative housing for most households is the
informal sector, where about 30% of households dwell. The rental housing market
has not been a major alternative for most households and this is probably due to high
rents. The distribution of renter-households show that about 50% pay monthly rents
of at least P1,000 (Table 12). The proportion is higher in key urban cities specifically
Metro Manila. This rent value is more than sufficient to pay for the monthly
amortization of a P150,000 housing unit.
Table 12. Distribution of Renter-Households by Monthly Rent, 1997, (in percent).
Monthly NCR Metro Metro Rent Philippine Urban Rural Cebu Davao
Total 100.0 100.0 100.0 100.0 100.0 100.0
<50 0.3 0.1 2.5 - - - 50-99 1.1 0.8 5.5 0.5 - 1.8 100-149 1.5 1.1 6.5 0.3 0.7 3.5 150-199 1.4 0.9 6.9 0.1 - - 200-299 4.8 3.1 25.9 0.7 7.5 10.2 300-499 10.3 10.0 13.8 5.7 17.5 27.9 500-699 14.7 14.7 15.4 13.3 25.2 22.0 700-999 12.2 12.8 4.7 12.2 8.5 11.4
1000+
53.7 56.5 18.9 67.2 40.6 23.2
Source: FIES 1997

30
Another alternative housing is homeownership through micro finance schemes.
These schemes are showing signs of success in providing homeownership specifically
for the poor. The CMP for instance, provides loan amortization of only P185 per
month, which is well within the capacity to pay of poor households. This is made
possible not only by the available long-term financing but also by the incremental
housing scheme adopted. Incremental housing is a scheme whereby housing is
acquired in progression. The usual mode is to initially secure tenure by buying
undeveloped land and later the household acquires another loan for land and housing
improvements. This scheme has been acceptable specifically among informal urban
dwellers occupying private and public lands illegally. While it has made significant
contributions in terms of security of land tenure, progression to land and housing
development has been very slow. The success of the program has also been slowed
down by conflicts within the community organization (PADCO 1993).
VI. Concluding Statements
Housing demand in the Philippines has been mainly dictated by housing affordability,
which refers not only to a household’s ability to pay but also the price of housing in
the market and the financing schemes available. Housing affordability is low in the
country. This is attributed to several factors: first, the ratio of unit housing cost to
income is very high. Second, housing demand is inelastic since the income received
by most households is barely sufficient to satisfy basic needs (e.g. food, clothing,
education). Third, there is lack of low-cost alternative housing in the formal market.
Next to homeownership, the only recourse of households is informal arrangements
since the rental housing market has not been developed. This leaves a significant
number of households unable to obtain decent housing since homeownership (without
subsidy) is only affordable to about 50% of households in the Philippines. The
situation can be worst in some areas. Fourth, innovative housing finance is limited,
which further makes housing less affordable.
The above conditions are reflected in the consumption pattern of households. The
path toward acceptable housing has been very slow and housing adjustments have
been confined to home improvements with small changes on tenure. Estimates of

31
household demand functions show that expenditures on housing are not highly
responsive to income increases. An increase in income will not necessarily be spent
on housing but on other household needs. This being the case, there has to be a
significant increase in household incomes to bring about a significant change in the
dwelling conditions of households. In the long-run, economic improvements may
bring about the needed boost in income for urban households to obtain access to the
formal housing market. However, in the short-run, alternative forms of housing for
urban households have to be considered. The rental housing market may provide a
potential housing alternative for the low-income families given the increasing cost of
homeownership in urban areas particularly in highly urbanized cities. There is also an
apparent need to come up with innovative financing schemes (e.g. micro financing,
incremental housing schemes) that could provide low monthly amortization.
Moreover, government has to institute ways to effectively reduce the high cost of
housing in the country.

32
References
Asian Development Bank (2000) Philippine Water and Sanitation Sector Study.
Manila: Asian Development Bank.
Angeles, Edna (1985) Public Policy and the Philippine Housing Market. Philippine
Institute for Development Studies Monograph Series No.7. Manila: Philippine
Institute for Development Studies.
Ballesteros, Marife (2000) Land Use Planning in Metro Manila and the Urban
Fringe: Implications on the Land and Real Estate Market. Philippine Institute for
Development Studies Discussion Paper No. 2000-20. Manila: PIDS.
Friedman, Joseph, Emmanuel Jimenez and Stephen Mayo (1988) The Demand for
Tenure Security in Developing Countries. Journal of Development Economics 29
(1988), 185-198.
Geron, Piedad and Gilberto Llanto (2001) Estimating Effective Demand in the
Housing Sector. An Overview of the Philippine Housing Sector. Asian Development
Bank. Draft Report.
Grimes, Orville (1976) Housing for Low Income Urban Families: Economics and
Policy in the Developing World. Baltimore: John Hopkins University.
Hanushek, Eric and John Quigley (1980) What is the Price Elasticity of Housing
Demand? Review of Economics and Statistics March 1980. 449-454.
Ingram, Gregory (1984). Housing Demand in the Developing Metropolis: Estimates
from Bogota and Cali, Colombia. World Bank Staff Working Paper No. 663.
Washington: The World Bank.

33
Llanto, Gilberto , et. al. (1998) A Study of Housing Subsidies in the Philippines,
Philippine Institute for Development Studies Discussion Paper No. 98-42. Manila:
PIDS.
Muth, Richard (1971) The Derived Demand for Urban Residential Land. Urban
Studies 8(October 1971): 243-54.
Malpezzi, Stephen and Stephen Mayo (1987) The Demand for Housing in Developing
Countries: Empirical Estimates from Household Data. Economic Development and
Cultural Change 35(4), 688-721.
__________________________ (1987) User Cost and Housing Tenure in Developing
Countries. Journal of Development Economics 25(1987) 197-220.
Planning and Development Collaborative International, Inc. (PADCO) (1993)
Assessment of the Community Mortgage Program. Manila: USAID.
Strassman, Paul and Alistair Blunt (1993) Land, Income, Mobility and Housing: The
case of Metro Manila. Journal of Philippine Development 20(1). Manila: Philippine
Institute for Development Studies.
Straszheim, Mahlon (1975) An Econometric Analysis of the Urban Housing Market. .
National Bureau of Economic Research, Urban and Regional Studies No.2. New
York: Columbia University Press.
Struyk, Raymond, Michael Hoffman and Harold Katsura (1990) The Market for
Shelter in Indonesian Cities. Washington: The Urban Institute Press.
World Bank and the United Nations Centre for Human Settlements (UNCHS) (1993).
Housing Indicators Program. Nairobi: UNCHS.

Appendix 1. Housing Improvements by Tenure (in proportion of HH).
Own/Amortizing Rent House/ Own House/ Being Occupied Being OccupiedOwners Room Rent free with Consent free without Consent All Households
1985 1997 1985 1997 1985 1997 1985 1997 1985 1997 1985 1997
PhilippinesWall Construction Material 100.0 100.0 100.0 100.0 100.0 100.0 100.0 100.0 100.0 100.0 100.0 100.0 Strong 44.6 66.5 56.8 83.5 29.5 56.9 21.7 45.1 23.2 50.3 38.1 62.0 Light 52.5 32.1 39.9 12.3 66.1 41.0 72.3 52.1 64.1 39.5 57.9 35.8 Makeshift 2.9 1.4 3.3 4.1 4.5 2.1 6.0 2.8 12.6 10.2 4.0 2.2
Type of Toilet Facility 100.0 100.0 100.0 100.0 100.0 100.0 100.0 100.0 100.0 100.0 100.0 100.0 Water-sealed 56.5 67.5 80.8 84.6 55.6 68.3 34.7 50.4 36.5 51.2 52.1 64.3 Closed pit 16.5 12.2 8.4 7.3 18.3 10.3 19.0 12.7 12.5 13.7 16.6 12.0 Open pit 14.5 9.6 2.7 1.6 8.9 6.9 19.0 12.4 20.3 9.0 14.6 9.6 Others (pail system, etc.) 3.1 3.0 4.1 4.3 3.5 4.2 4.8 4.9 4.7 7.5 3.7 3.7 None 9.3 7.7 3.9 2.4 13.6 10.2 22.5 19.6 25.9 18.6 13.0 10.5
Source of Water Supply 100.0 100.0 100.0 100.0 100.0 100.0 100.0 100.0 100.0 100.0 100.0 100.0 Own use, faucet,
community water system 18.0 22.4 54.1 45.9 21.7 27.6 10.4 12.4 15.3 14.4 18.8 21.6 Shared, faucet
community water system 14.8 17.6 20.7 27.2 28.2 28.5 19.2 24.6 26.5 30.1 17.5 20.6 Own use, tubed/piped well 21.9 19.4 7.2 5.3 11.3 7.9 11.1 10.3 8.9 6.5 17.0 15.6 Shared, tubed/piped well 15.4 17.5 8.6 12.4 17.7 19.9 20.9 24.9 19.1 22.2 16.6 19.0 Dugwell 16.8 11.8 2.6 2.3 12.3 7.5 23.4 14.9 19.8 9.6 17.3 11.6 Spring, river, stream, etc. 10.0 9.1 0.9 0.7 3.1 2.7 12.4 9.1 6.6 5.7 9.4 8.2 Rain 1.5 0.4 0.4 0.1 0.3 1.1 1.1 0.3 0.4 0.1 1.2 0.4 Peddler 1.5 1.9 5.5 6.3 5.5 4.9 1.6 3.5 3.5 11.4 2.1 3.0
UrbanWall Construction Material 100.0 100.0 100.0 100.0 100.0 100.0 100.0 100.0 100.0 100.0 100.0 100.0 Strong 62.7 80.2 57.5 84.4 32.6 60.5 31.2 59.6 23.9 56.5 51.5 74.9 Light 34.8 17.9 38.9 11.4 62.6 36.3 60.5 36.2 56.7 30.8 44.0 21.9 Makeshift 2.4 1.9 3.6 4.3 4.8 3.2 8.2 4.2 19.3 12.7 4.5 3.2
Type of toilet facility 100.0 100.0 100.0 100.0 100.0 100.0 100.0 100.0 100.0 100.0 100.0 100.0 Water-sealed 77.5 81.1 82.5 85.6 62.9 73.2 52.5 66.2 45.8 55.7 71.1 77.4 Closed pit 10.3 7.8 7.8 6.9 17.8 9.5 14.6 9.8 10.1 12.3 11.5 8.4 Open pit 5.4 4.2 2.2 1.1 5.7 4.0 12.7 7.2 15.3 7.6 6.6 4.5 Others (pail system, etc.) 2.8 3.2 4.3 4.3 3.8 4.8 5.3 5.1 5.2 9.4 3.7 4.0 None 3.9 3.7 3.2 2.1 9.9 8.5 14.8 11.8 23.7 15.0 7.1 5.7
Source of Water Supply 100.0 100.0 100.0 100.0 100.0 100.0 100.0 100.0 100.0 100.0 100.0 100.0 Own use, faucet,
community water system 41.0 40.9 56.8 47.9 31.5 36.5 24.7 24.5 27.9 18.9 39.2 37.6 Shared, faucet
community water system 15.3 16.5 20.4 27.1 28.7 25.4 28.9 28.3 39.1 32.9 20.9 21.1 Own use, tubed/piped well 19.7 17.5 6.3 5.1 9.5 7.8 9.0 9.4 6.8 4.5 13.9 13.4 Shared, tubed/piped well 12.0 13.5 7.6 11.2 14.2 15.6 19.5 20.3 9.1 21.4 12.8 14.9 Dugwell 6.3 5.6 2.2 1.8 7.3 6.7 10.3 8.1 10.2 5.9 6.6 5.6 Spring, river, stream, etc. 1.5 2.5 0.5 0.3 1.2 1.4 3.1 2.5 0.5 0.4 1.6 2.1 Rain 0.5 0.2 0.3 0.1 0.1 - 0.4 0.1 - 0.1 0.4 0.1 Peddler 3.6 3.4 5.8 6.6 7.6 6.7 4.2 6.8 6.4 15.9 4.6 5.2
RuralWall Construction Material 100.0 100.0 100.0 100.0 100.0 100.0 100.0 100.0 100.0 100.0 100.0 100.0 Strong 35.9 55.6 49.6 73.3 25.0 51.5 18.0 35.8 22.4 36.7 29.9 50.3 Light 61.1 43.4 50.4 24.5 71.0 47.9 76.9 62.3 73.2 58.8 66.3 48.5 Makeshift 3.1 1.0 - 2.2 4.0 0.6 5.1 1.9 4.5 4.4 3.7 1.3
Type of Toilet Facility 100.0 100.0 100.0 100.0 100.0 100.0 100.0 100.0 100.0 100.0 100.0 100.0 Water-sealed 46.4 56.7 63.6 71.3 45.3 61.1 27.7 40.3 25.2 41.2 40.6 52.5 Closed pit 19.5 15.7 14.6 12.3 19.0 11.5 20.7 14.6 15.6 16.9 19.7 15.3 Open pit 18.9 13.9 8.3 7.2 13.6 11.3 21.5 15.7 26.5 11.9 19.5 14.1 Others (pail system, etc.) 3.2 2.8 2.4 3.2 3.2 3.4 4.6 4.7 4.0 3.2 3.6 3.3 None 12.0 11.0 11.1 5.9 18.9 12.7 25.6 24.6 28.7 26.8 16.6 14.8
Source of Water Supply 100.0 100.0 100.0 100.0 100.0 100.0 100.0 100.0 100.0 100.0 100.0 100.0 Own use, faucet,
community water system 6.9 7.6 25.9 20.0 7.8 14.5 4.7 4.6 - 4.4 6.4 7.1 Shared, faucet
community water system 14.7 18.6 24.0 28.2 27.5 33.0 15.3 22.3 11.0 24.1 15.5 20.2 Own use, tubed/piped well 22.9 20.9 16.6 8.3 13.8 8.0 11.9 10.8 11.5 10.9 19.0 17.6 Shared, tubed/piped well 17.0 20.7 18.6 28.4 22.7 26.2 21.4 27.8 31.2 24.1 18.8 22.8 Dugwell 22.0 16.7 6.8 8.1 19.4 8.7 28.6 19.3 31.4 17.6 23.8 17.1 Spring, river, stream, etc. 14.1 14.3 4.8 4.8 5.6 4.6 16.1 13.3 14.1 17.2 14.2 13.7 Rain 2.0 0.5 1.1 - 0.5 2.6 1.3 0.4 0.8 0.1 1.7 0.6 Peddler 0.5 0.7 2.2 2.1 2.6 2.4 0.6 1.5 - 1.6 0.6 1.0

Appendix 1. Housing Improvements by Tenure (in proportion of HH).
Own/Amortizing Rent House/ Own House/ Being Occupied Being OccupiedOwners Room Rent free with Consent free without Consent All Households
1985 1997 1985 1997 1985 1997 1985 1997 1985 1997 1985 1997
NCRWall Construction Material 100.0 100.0 100.0 100.0 100.0 100.0 100.0 100.0 100.0 100.0 100.0 100.0 Strong 68.5 89.0 59.2 86.3 44.8 82.0 44.7 80.2 19.6 66.8 58.5 85.3 Light 28.3 6.9 36.4 7.6 49.5 12.2 45.5 10.4 48.1 11.0 36.0 8.1 Makeshift 3.1 4.1 4.3 6.1 5.6 5.7 9.8 9.4 32.2 22.2 5.5 6.6
Type of Toilet Facility 100.0 100.0 100.0 100.0 100.0 100.0 100.0 100.0 100.0 100.0 100.0 100.0 Water-sealed 83.4 86.9 84.0 87.9 74.3 77.3 69.6 82.9 52.7 63.3 79.9 84.6 Closed pit 7.2 6.4 7.1 6.9 12.7 11.2 9.0 7.3 9.8 11.2 8.0 7.2 Open pit 2.7 1.4 1.0 0.4 0.8 2.6 6.7 1.8 16.0 3.6 2.9 1.4 Others (pail system, etc.) 5.0 4.4 5.4 3.6 6.4 6.3 8.8 5.2 7.0 13.3 5.9 5.0 None 1.6 0.8 2.4 1.2 5.7 2.6 5.9 2.9 14.5 8.6 3.2 1.8
Source of Water Supply 100.0 100.0 100.0 100.0 100.0 100.0 100.0 100.0 100.0 100.0 100.0 100.0 Own use, faucet,
community water system 59.5 56.6 64.0 50.6 42.6 52.0 42.2 33.4 39.0 19.1 56.3 49.2 Shared, faucet
community water system 16.1 18.0 21.2 28.3 31.1 23.1 34.1 32.7 36.7 34.8 22.3 24.0 Own use, tubed/piped well 7.3 7.3 2.8 3.5 5.1 3.3 1.6 5.1 2.9 4.0 4.7 5.6 Shared, tubed/piped well 4.3 8.1 3.7 8.4 2.7 8.8 11.6 10.9 6.1 14.6 5.0 9.0 Dugwell 3.2 2.5 1.1 0.7 3.8 - 2.5 1.5 4.5 3.9 2.5 1.9 Spring, river, stream, etc. - - - - - - - - - - - - Rain - - - - - - - - - - - - Peddler 9.6 7.5 7.1 8.5 14.8 12.8 8.0 16.4 10.9 23.6 9.1 10.3
Metro CebuWall Construction Material 100.0 100.0 100.0 100.0 100.0 100.0 100.0 100.0 100.0 100.0 100.0 100.0 Strong 67.1 78.0 44.8 73.5 36.0 52.4 27.3 49.4 45.5 57.0 50.5 65.7 Light 27.6 20.5 55.2 22.8 56.0 42.0 54.5 43.2 45.5 35.6 42.3 30.0 Makeshift 5.3 1.5 - 3.7 8.0 5.6 18.2 7.4 9.1 7.4 7.1 4.2
Type of Toilet Facility 100.0 100.0 100.0 100.0 100.0 100.0 100.0 100.0 100.0 100.0 100.0 100.0 Water-sealed 81.6 69.5 79.3 78.6 76.0 75.1 59.1 65.1 61.4 60.9 73.5 68.9 Closed pit 2.6 5.6 6.9 3.8 - 9.6 9.1 15.2 6.8 8.9 4.6 8.3 Open pit 6.6 7.1 3.5 4.1 12.0 0.8 4.5 3.8 9.1 9.8 7.1 5.8 Others (pail system, etc.) - 4.5 3.5 3.2 - 3.0 - 5.5 2.3 6.4 1.0 4.7 None 9.2 13.3 6.9 10.4 12.0 11.5 27.3 10.4 20.5 14.0 13.8 12.3
Source of Water Supply 100.0 100.0 100.0 100.0 100.0 100.0 100.0 100.0 100.0 100.0 100.0 100.0 Own use, faucet,
community water system 47.4 30.0 41.4 27.9 32.0 21.5 4.5 30.1 29.5 22.9 35.7 27.8 Shared, faucet
community water system 21.1 16.7 34.5 18.2 20.0 32.9 31.8 25.2 54.5 20.3 31.6 21.0 Own use, tubed/piped well 13.2 11.8 13.8 14.1 8.0 7.2 9.1 10.2 2.3 3.8 9.7 10.0 Shared, tubed/piped well 14.5 12.0 - 22.5 32.0 16.3 27.3 18.7 6.8 23.1 14.3 16.4 Dugwell 1.3 14.0 6.9 10.2 - 12.9 4.5 5.5 - 2.4 2.0 10.1 Spring, river, stream, etc. 2.6 10.1 - - - - 4.5 0.8 2.3 - 2.0 4.6 Rain - - - - - - - - - - - - Peddler - 5.4 3.5 7.1 8.0 9.1 18.2 9.5 4.5 27.5 4.6 9.9
Davao CityWall Construction Material 100.0 100.0 100.0 100.0 100.0 100.0 100.0 100.0 100.0 100.0 100.0 100.0 Strong 62.1 88.2 42.5 80.9 63.2 81.4 32.5 74.0 - 76.9 52.7 83.2 Light 33.9 9.3 47.5 17.3 32.7 18.6 60.5 22.6 100.0 23.1 41.8 14.4 Makeshift 4.0 2.5 10.0 1.8 4.1 - 6.9 3.4 - - 5.5 2.4
Type of Toilet Facility 100.0 100.0 100.0 100.0 100.0 100.0 100.0 100.0 100.0 100.0 100.0 100.0 Water-sealed 65.4 85.2 80.0 85.0 87.2 76.4 44.1 61.6 41.1 76.9 64.8 78.5 Closed pit 13.2 3.7 7.5 1.8 4.3 2.5 11.0 1.4 58.9 - 11.4 2.7 Open pit 19.1 6.7 5.0 7.1 8.5 8.8 41.9 18.4 - - 19.9 9.7 Others (pail system, etc.) 2.2 0.4 7.5 1.8 - 4.9 3.0 1.6 - - 2.9 1.2 None - 4.1 - 4.4 4.3 7.4 3.0 17.0 - 23.1 1.0 7.9
Source of Water Supply 100.0 100.0 100.0 100.0 100.0 100.0 100.0 100.0 100.0 100.0 100.0 100.0 Own use, faucet,
community water system 43.3 62.7 47.5 38.6 36.8 21.6 27.9 25.7 - 53.3 39.9 47.4 Shared, faucet
community water system 12.8 13.2 17.5 43.1 24.6 21.1 10.1 28.7 41.1 - 14.4 20.8 Own use, tubed/piped well 6.5 1.7 - 1.8 - - 2.0 1.4 - - 3.9 1.5 Shared, tubed/piped well 4.9 6.9 7.5 11.3 12.3 26.5 11.6 22.4 58.9 23.1 7.9 13.0 Dugwell 6.5 2.8 2.5 1.8 8.2 14.2 12.7 0.8 - - 7.2 3.1 Spring, river, stream, etc. 9.2 5.8 2.5 - 10.0 7.3 16.5 2.9 - - 9.5 4.5 Rain 12.8 3.9 2.5 - - 4.4 17.3 10.1 - - 10.7 4.9 Peddler 4.0 3.1 20.0 3.5 8.2 4.9 2.0 8.0 - 23.6 6.5 4.8

Appendix 2. Tenure Trends by Income Group, Poor vs. Non-poor Households, Philippines.
1985 1991 1994 1997Own or Own/ Own/ Own or Own/ Own/ Own or Own/ Own/ Own or Own/ Own/
owner-like Rent rent-free house, rent-free house, owner-like Rent rent-free house, rent-free house, owner-like Rent rent-free house, rent-free house, owner-like Rent rent-free house, rent-free house,possession house/room, rent-free lot rent-free lot possession house/room, rent-free lot rent-free lot possession house/room, rent-free lot rent-free lot possession house/room, rent-free lot rent-free lot
of house and including Own house, w/ consent of w/o consent of of house and including Own house, w/ consent of w/o consent of of house and including Own house, w/ consent of w/o consent of of house and including Own house, w/ consent of w/o consent ofTotal lot lot rent lot owner owner Total lot lot rent lot owner owner Total lot lot rent lot owner owner Total lot lot rent lot owner owner
PhilippinesPoor 100.0 51.8 4.0 7.1 34.7 2.4 100.0 60.7 2.7 5.5 28.5 2.6 100.0 62.3 1.9 4.0 28.7 3.1 100.0 62.0 1.9 3.8 28.9 3.4 Non-poor 100.0 63.1 9.8 6.2 19.2 1.6 100.0 64.3 9.8 5.5 18.2 2.1 100.0 67.1 8.3 4.4 17.8 2.5 100.0 65.7 8.4 4.1 18.7 3.0
UrbanPoor 100.0 39.4 12.5 13.3 30.4 4.4 100.0 55.9 6.3 7.5 26.6 3.7 100.0 58.8 5.0 5.3 26.7 4.3 100.0 53.1 5.7 6.6 28.0 6.6 Non-poor 100.0 55.4 19.8 8.8 13.9 2.1 100.0 59.3 16.4 6.3 15.5 2.4 100.0 62.5 13.4 5.3 15.9 2.8 100.0 61.6 13.8 4.7 15.8 4.1
RuralPoor 100.0 56.8 0.6 4.6 36.4 1.6 100.0 63.7 0.4 4.2 29.7 2.0 100.0 64.1 0.3 3.3 29.7 2.6 100.0 65.2 0.5 2.8 29.2 2.3 Non-poor 100.0 69.4 1.5 4.2 23.7 1.2 100.0 70.8 1.2 4.5 21.8 1.8 100.0 73.5 1.2 3.0 20.4 1.9 100.0 71.2 1.2 3.4 22.7 1.5
NCRPoor 100.0 29.3 31.2 12.1 21.3 6.0 100.0 35.3 25.4 6.8 21.9 10.5 100.0 37.3 28.4 6.6 17.1 10.6 100.0 37.4 22.7 2.8 19.8 17.3 Non-poor 100.0 44.7 32.8 9.1 11.4 2.0 100.0 47.0 31.5 6.6 11.8 3.0 100.0 50.4 27.5 4.0 13.7 4.3 100.0 50.9 26.1 3.9 12.9 6.2
Metro CebuPoor 100.0 20.9 13.4 11.9 20.9 32.8 100.0 42.0 6.0 17.9 34.1 - 100.0 55.1 10.1 8.1 18.5 8.2 100.0 39.7 7.0 15.4 19.6 18.3 Non-poor 100.0 48.1 15.5 13.2 6.2 17.1 100.0 46.3 15.7 10.0 24.9 3.1 100.0 54.4 12.3 14.2 12.6 6.5 100.0 44.6 9.5 11.6 20.6 13.7
Davao CityPoor 100.0 47.1 10.9 10.3 30.2 1.6 100.0 58.3 5.4 4.2 28.6 3.6 100.0 39.7 - 3.6 54.1 2.6 100.0 41.6 6.8 13.4 38.2 - Non-poor 100.0 57.8 18.6 9.3 13.7 0.6 100.0 62.3 13.2 3.9 16.9 3.7 100.0 58.4 9.3 6.2 21.4 4.8 100.0 56.3 11.7 7.3 22.8 1.9

Appendix 3. Housing Improvements, Poor vs. Non-Poor Households, Wall Materials, 1985-1997.
1985 1991 1994 1997Total Strong Light Makeshift Total Strong Light Makeshift Total Strong Light Makeshift Total Strong Light Makeshift
PhilippinesPoor 100.0 18.7 75.1 6.2 100.0 34.8 61.2 4.0 100.0 33.6 62.6 3.8 100.0 34.9 62.0 3.1 Non-poor 100.0 53.5 44.2 2.2 100.0 72.2 26.2 1.6 100.0 71.4 26.6 2.0 100.0 74.6 23.6 1.7
UrbanPoor 100.0 25.1 65.7 9.2 100.0 44.7 50.4 4.8 100.0 41.7 53.2 5.1 100.0 42.5 50.9 6.6 Non-poor 100.0 64.8 33.1 2.1 100.0 82.9 15.2 1.9 100.0 80.0 17.8 2.2 100.0 82.0 15.6 2.4
RuralPoor 100.0 16.1 78.9 5.0 100.0 28.6 68.0 3.5 100.0 29.5 67.4 3.1 100.0 32.1 66.1 1.8 Non-poor 100.0 44.2 53.4 2.4 100.0 58.1 40.8 1.1 100.0 59.3 39.1 1.6 100.0 64.7 34.4 0.9
NCRPoor 100.0 29.8 53.3 16.9 100.0 70.3 15.5 14.2 100.0 57.5 23.9 18.6 100.0 52.8 19.1 28.1 Non-poor 100.0 67.1 30.8 2.1 100.0 90.1 6.8 3.1 100.0 86.8 9.3 3.9 100.0 87.5 7.3 5.1
Metro CebuPoor 100.0 26.9 59.7 13.4 100.0 33.9 60.1 6.0 100.0 34.6 57.1 8.2 100.0 35.8 49.2 15.0 Non-poor 100.0 62.8 33.3 3.9 100.0 75.1 21.7 3.2 100.0 65.7 29.7 4.5 100.0 68.2 28.5 3.3
Davao CityPoor 100.0 23.2 67.1 9.7 100.0 60.1 30.4 9.5 100.0 53.6 34.1 12.4 100.0 68.9 26.0 5.2 Non-poor 100.0 69.5 27.4 3.1 100.0 84.5 13.6 1.9 100.0 82.9 15.5 1.5 100.0 85.1 12.9 2.0

Appendix 4. Housing Improvements, Poor vs. Non-Poor Households, Type of Toilet Facility, 1985-1997.
Others (pail Others (pail Others (pail Others (pailTotal Water-sealed Closed-pit Open-pit system, etc) None Total Water-sealed Closed-pit Open-pit system, etc) None Total Water-sealed Closed-pit Open-pit system, etc) None Total Water-sealed Closed-pit Open-pit system, etc) None
PhilippinesPoor 100.0 34.9 19.0 20.2 4.6 21.3 100.0 37.1 19.9 16.6 4.0 22.4 100.0 36.9 19.9 17.8 3.6 21.7 100.0 40.4 17.8 17.7 3.9 20.2 Non-poor 100.0 65.8 14.7 10.1 3.0 6.4 100.0 68.3 12.9 6.9 3.9 8.0 100.0 75.5 9.4 6.4 2.1 6.7 100.0 75.5 9.3 5.8 3.6 5.9
UrbanPoor 100.0 50.2 16.7 12.7 5.5 14.8 100.0 45.3 18.7 11.7 5.4 18.9 100.0 48.7 14.9 14.1 4.1 18.2 100.0 52.4 14.5 12.1 5.1 15.9 Non-poor 100.0 81.7 8.8 3.5 2.9 3.1 100.0 79.0 9.5 3.1 4.4 4.1 100.0 85.1 5.7 3.2 2.0 4.0 100.0 82.9 7.0 2.9 3.8 3.5
RuralPoor 100.0 28.7 20.0 23.3 4.2 23.9 100.0 31.9 20.7 19.8 3.0 24.6 100.0 31.0 22.4 19.7 3.4 23.5 100.0 36.0 19.0 19.8 3.4 21.8 Non-poor 100.0 52.8 19.5 15.6 3.0 9.1 100.0 54.2 17.5 11.9 3.1 13.3 100.0 61.8 14.7 10.8 2.2 10.4 100.0 65.6 12.3 9.7 3.2 9.2
NCRPoor 100.0 63.4 13.7 6.4 9.3 7.2 100.0 62.1 9.1 4.0 13.0 11.8 100.0 72.8 8.1 4.0 8.7 6.4 100.0 68.8 10.8 3.6 8.5 8.3 Non-poor 100.0 84.9 6.4 1.9 4.8 2.0 100.0 85.3 6.6 1.3 4.8 2.0 100.0 93.1 3.2 1.0 1.5 1.3 100.0 85.7 6.9 1.2 4.7 1.4
Metro CebuPoor 100.0 49.3 11.9 11.9 3.0 23.9 100.0 20.0 26.0 6.0 18.1 29.9 100.0 28.4 16.5 18.5 4.1 32.6 100.0 29.5 4.9 14.6 11.5 39.5 Non-poor 100.0 86.0 0.8 4.7 - 8.5 100.0 64.7 5.4 1.3 22.4 6.3 100.0 55.6 12.4 10.0 7.2 14.9 100.0 72.2 8.6 5.0 4.1 10.1
Davao CityPoor 100.0 41.3 13.9 36.3 5.9 2.7 100.0 24.4 49.4 17.3 - 8.9 100.0 38.0 5.2 47.1 - 9.6 100.0 50.4 4.7 17.0 5.0 22.9 Non-poor 100.0 78.2 10.0 10.6 1.2 - 100.0 67.3 25.1 3.4 0.9 3.3 100.0 85.5 4.4 5.0 2.0 3.1 100.0 82.3 2.5 8.7 0.7 5.9
19971985 1991 1994
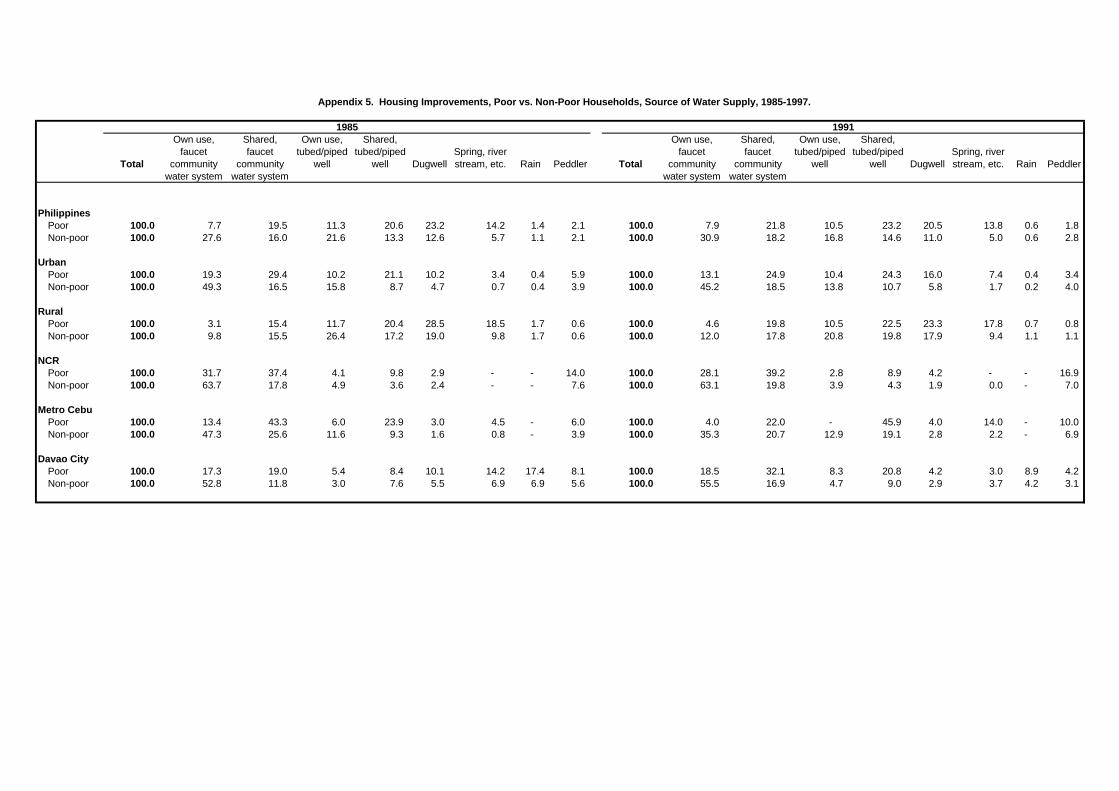
Appendix 5. Housing Improvements, Poor vs. Non-Poor Households, Source of Water Supply, 1985-1997.
1985 1991Own use, Shared, Own use, Shared, Own use, Shared, Own use, Shared,
faucet faucet tubed/piped tubed/piped Spring, river faucet faucet tubed/piped tubed/piped Spring, riverTotal community community well well Dugwell stream, etc. Rain Peddler Total community community well well Dugwell stream, etc. Rain Peddler
water system water system water system water system
PhilippinesPoor 100.0 7.7 19.5 11.3 20.6 23.2 14.2 1.4 2.1 100.0 7.9 21.8 10.5 23.2 20.5 13.8 0.6 1.8 Non-poor 100.0 27.6 16.0 21.6 13.3 12.6 5.7 1.1 2.1 100.0 30.9 18.2 16.8 14.6 11.0 5.0 0.6 2.8
UrbanPoor 100.0 19.3 29.4 10.2 21.1 10.2 3.4 0.4 5.9 100.0 13.1 24.9 10.4 24.3 16.0 7.4 0.4 3.4 Non-poor 100.0 49.3 16.5 15.8 8.7 4.7 0.7 0.4 3.9 100.0 45.2 18.5 13.8 10.7 5.8 1.7 0.2 4.0
RuralPoor 100.0 3.1 15.4 11.7 20.4 28.5 18.5 1.7 0.6 100.0 4.6 19.8 10.5 22.5 23.3 17.8 0.7 0.8 Non-poor 100.0 9.8 15.5 26.4 17.2 19.0 9.8 1.7 0.6 100.0 12.0 17.8 20.8 19.8 17.9 9.4 1.1 1.1
NCRPoor 100.0 31.7 37.4 4.1 9.8 2.9 - - 14.0 100.0 28.1 39.2 2.8 8.9 4.2 - - 16.9 Non-poor 100.0 63.7 17.8 4.9 3.6 2.4 - - 7.6 100.0 63.1 19.8 3.9 4.3 1.9 0.0 - 7.0
Metro CebuPoor 100.0 13.4 43.3 6.0 23.9 3.0 4.5 - 6.0 100.0 4.0 22.0 - 45.9 4.0 14.0 - 10.0 Non-poor 100.0 47.3 25.6 11.6 9.3 1.6 0.8 - 3.9 100.0 35.3 20.7 12.9 19.1 2.8 2.2 - 6.9
Davao CityPoor 100.0 17.3 19.0 5.4 8.4 10.1 14.2 17.4 8.1 100.0 18.5 32.1 8.3 20.8 4.2 3.0 8.9 4.2 Non-poor 100.0 52.8 11.8 3.0 7.6 5.5 6.9 6.9 5.6 100.0 55.5 16.9 4.7 9.0 2.9 3.7 4.2 3.1

Appendix 5. Housing Improvements, Poor vs. Non-Poor Households, Source of Water Supply, 1985-1997. (con't.)
1994 1997Own use, Shared, Own use, Shared, Own use, Shared, Own use, Shared,
faucet faucet tubed/piped tubed/piped Spring, river faucet faucet tubed/piped tubed/piped Spring, riverTotal community community well well Dugwell stream, etc. Rain Peddler Total community community well well Dugwell stream, etc. Rain Peddler
water system water system water system water system
PhilippinesPoor 100.0 7.1 22.8 11.5 23.7 18.9 13.9 0.7 1.5 100.0 5.0 23.6 10.4 23.8 19.3 15.6 0.4 1.9 Non-poor 100.0 31.4 19.2 18.2 15.4 8.6 3.9 0.6 2.7 100.0 29.4 19.2 18.1 16.8 8.1 4.7 0.3 3.4
UrbanPoor 100.0 12.4 26.0 11.7 25.9 13.5 7.1 0.3 3.0 100.0 12.1 29.1 11.0 24.1 12.3 6.2 0.3 4.8 Non-poor 100.0 44.1 18.9 14.4 12.7 4.7 0.9 0.4 3.8 100.0 43.1 19.4 13.9 12.9 4.2 1.2 0.1 5.2
RuralPoor 100.0 4.4 21.2 11.3 22.5 21.7 17.3 0.9 0.7 100.0 2.4 21.6 10.1 23.7 21.8 19.1 0.5 0.9 Non-poor 100.0 13.3 19.7 23.5 19.2 14.2 8.0 0.9 1.1 100.0 10.9 19.0 23.6 22.1 13.3 9.4 0.6 1.0
NCRPoor 100.0 33.3 37.5 2.7 9.2 4.6 - - 12.8 100.0 17.3 42.0 2.3 14.8 4.7 - - 18.9 Non-poor 100.0 61.2 20.9 3.9 4.8 2.6 0.0 - 6.6 100.0 51.4 22.7 5.9 8.6 1.7 - - 9.7
Metro CebuPoor 100.0 6.1 26.4 2.1 24.3 20.5 14.4 2.1 4.1 100.0 9.1 27.4 3.7 18.5 10.2 11.6 - 19.5 Non-poor 100.0 35.0 21.3 8.4 19.0 8.4 2.6 1.0 4.2 100.0 29.4 20.5 10.5 16.2 10.1 4.1 - 9.1
Davao CityPoor 100.0 4.4 41.2 - 11.5 14.8 14.0 7.8 6.2 100.0 21.5 32.4 3.0 14.2 13.5 6.0 6.0 3.3 Non-poor 100.0 63.2 20.0 3.9 5.9 1.1 1.2 2.4 2.3 100.0 50.9 19.2 1.2 12.9 1.7 4.3 4.8 5.0

Appendix 6. Distribution of Households by Lifecycle and Tenure, Philippines, 1985-1997.
1985 1991 1994 1997Tenure Status Tenure Status Tenure Status Tenure Status
Own or owner- Own/ Own/ Own or owner- Own/ Own/ Own or owner- Own/ Own/ Own or owner- Own/ Own/like rent-free house, rent-free house, like rent-free house, rent-free house, like rent-free house, rent-free house, like rent-free house, rent-free house,
possession Rent house/ rent-free lot rent-free lot possession Rent house/ rent-free lot rent-free lot possession Rent house/ rent-free lot rent-free lot possession Rent house/ rent-free lot rent-free lot Total of house and room, including Own house, w/ consent of w/o consent of Total of house and room, including Own house, w/ consent of w/o consent of Total of house and room, including Own house, w/ consent of w/o consent of Total of house and room, including Own house, w/ consent of w/o consent of
lot lot rent lot owner owner lot lot rent lot owner owner lot lot rent lot owner owner lot lot rent lot owner owner
Philippinessingle/separated, hhsize=1 100.0 54.2 12.7 0.9 32.2 - 100.0 56.1 12.9 3.2 25.9 1.9 100.0 57.5 9.6 1.0 30.5 1.4 100.0 53.0 14.5 4.0 23.9 4.5 single w/ hhsize>1 100.0 64.8 13.7 3.8 15.1 2.6 100.0 65.0 14.6 4.9 14.6 0.9 100.0 62.0 13.2 5.7 17.3 1.8 100.0 64.2 15.1 2.8 15.6 2.2 separated, hhsize>1 100.0 48.8 19.1 6.3 23.9 2.0 100.0 57.2 13.2 6.1 20.1 3.5 100.0 57.0 13.6 4.2 21.3 3.8 100.0 62.7 11.0 4.1 18.7 3.5 married, hhead<30, hsize< or =3 100.0 47.0 10.4 5.6 35.3 1.7 100.0 52.2 9.9 5.9 30.2 1.9 100.0 49.6 12.8 3.5 31.8 2.3 100.0 49.6 15.4 4.1 27.8 3.1 married, hhead<30, 3<hsize<6 100.0 44.1 9.3 7.6 36.4 2.6 100.0 51.9 8.2 4.9 32.8 2.3 100.0 53.7 7.9 4.3 31.0 3.1 100.0 53.5 9.7 2.2 30.4 4.3 married, hhead<30, hsize 6+ 100.0 45.1 11.2 7.0 35.4 1.4 100.0 53.5 9.0 5.0 30.0 2.4 100.0 56.3 6.2 5.3 26.9 5.3 100.0 53.9 9.5 3.9 30.1 2.5 married, hhead 30-39, hsize< or =3 100.0 52.1 13.6 7.2 24.8 2.3 100.0 54.3 14.9 3.6 25.1 2.1 100.0 55.1 13.5 3.4 25.1 2.9 100.0 55.3 15.8 3.0 24.0 1.9 married, hhead 30-39, 3<hsize<6 100.0 49.6 11.4 6.7 30.0 2.3 100.0 55.4 11.2 6.1 24.1 3.3 100.0 57.9 9.6 4.7 25.2 2.7 100.0 58.8 9.0 3.7 25.2 3.3 married, hhead 30-39, hsize 6+ 100.0 48.6 7.6 7.0 34.5 2.4 100.0 57.3 5.5 6.7 27.6 2.8 100.0 58.2 5.4 4.6 28.2 3.7 100.0 60.4 4.5 3.8 27.2 4.0 married, hhead 40-49, hsize< or =3 100.0 54.6 9.7 5.5 28.3 1.8 100.0 62.9 10.6 4.2 20.2 2.1 100.0 60.7 8.1 4.4 23.4 3.4 100.0 61.1 9.2 3.6 21.9 4.2 married, hhead 40-49, 3<hsize<6 100.0 57.6 9.6 6.5 24.2 2.1 100.0 62.5 9.7 5.3 20.2 2.2 100.0 64.1 8.9 5.3 18.6 3.2 100.0 64.6 7.7 4.0 20.9 2.8 married, hhead 40-49, hsize 6+ 100.0 58.0 5.5 8.8 25.7 2.0 100.0 61.0 5.4 5.8 25.4 2.5 100.0 63.2 4.9 4.2 24.6 3.2 100.0 63.1 4.4 4.8 23.8 3.8 married, hhead 50+, hsize< or =3 100.0 70.7 2.9 5.3 20.6 0.5 100.0 73.4 2.9 4.1 17.5 2.1 100.0 74.5 2.9 3.0 17.4 2.2 100.0 71.3 2.9 3.7 20.1 2.1 married, hhead 50+, 3<hsize<6 100.0 67.7 4.4 5.6 20.3 2.0 100.0 70.6 3.9 5.8 17.5 2.1 100.0 72.5 3.9 4.4 17.2 1.9 100.0 71.6 3.9 4.5 17.6 2.4 married, hhead 50+, hsize 6+ 100.0 65.9 5.4 7.1 20.1 1.6 100.0 69.6 4.7 5.7 18.0 2.0 100.0 72.8 3.8 4.1 17.0 2.2 100.0 71.3 3.6 5.0 16.8 3.3
Urbansingle/separated, hhsize=1 100.0 45.8 27.6 - 26.6 - 100.0 51.6 22.0 4.8 19.9 1.7 100.0 54.9 15.9 0.8 27.8 0.7 100.0 42.5 23.6 4.3 24.0 5.6 single w/ hhsize>1 100.0 55.5 25.8 5.9 10.5 2.3 100.0 60.7 22.4 2.9 13.1 1.0 100.0 56.2 20.3 7.3 14.0 2.2 100.0 59.2 22.3 3.0 12.6 2.9 separated, hhsize>1 100.0 39.4 28.5 7.2 22.9 1.9 100.0 52.8 19.7 7.5 16.7 3.3 100.0 54.7 21.0 4.5 15.9 3.9 100.0 61.7 16.1 3.1 14.4 4.7 married, hhead<30, hsize< or =3 100.0 28.8 29.7 10.9 29.1 1.6 100.0 38.1 22.4 9.4 28.1 2.1 100.0 46.5 20.4 4.1 27.2 1.9 100.0 40.1 31.5 5.0 19.6 3.7 married, hhead<30, 3<hsize<6 100.0 30.3 27.2 11.4 26.1 5.0 100.0 44.0 18.0 4.6 30.0 3.4 100.0 51.2 14.7 4.7 25.1 4.3 100.0 43.7 20.3 2.5 28.2 5.3 married, hhead<30, hsize 6+ 100.0 33.1 23.4 12.5 27.3 3.7 100.0 46.7 19.0 7.1 24.4 2.8 100.0 48.1 11.2 6.3 25.6 8.7 100.0 49.7 18.1 5.3 24.7 2.1 married, hhead 30-39, hsize< or =3 100.0 37.2 28.3 9.5 22.9 2.1 100.0 48.0 24.8 2.8 21.6 2.9 100.0 50.3 22.1 2.9 21.6 3.1 100.0 48.3 28.8 2.7 17.6 2.6 married, hhead 30-39, 3<hsize<6 100.0 41.5 24.0 8.7 22.7 3.1 100.0 49.6 19.8 6.7 20.3 3.6 100.0 52.5 16.9 5.3 22.6 2.7 100.0 52.3 16.4 4.2 22.4 4.7 married, hhead 30-39, hsize 6+ 100.0 40.6 21.0 11.3 24.4 2.7 100.0 53.4 11.4 7.3 23.9 3.9 100.0 55.7 11.0 5.0 23.7 4.6 100.0 54.7 10.3 5.0 23.6 6.4 married, hhead 40-49, hsize< or =3 100.0 47.5 27.2 8.8 13.9 2.6 100.0 54.4 19.2 6.6 15.8 3.9 100.0 55.4 14.4 4.7 21.4 4.0 100.0 53.5 15.4 4.6 20.5 6.0 married, hhead 40-49, 3<hsize<6 100.0 47.0 20.4 7.8 21.6 3.3 100.0 57.9 17.2 6.7 16.0 2.2 100.0 60.1 15.0 6.8 14.4 3.6 100.0 60.8 13.5 4.7 16.9 4.1 married, hhead 40-49, hsize 6+ 100.0 49.4 13.5 14.3 20.0 2.9 100.0 57.4 10.4 7.1 22.1 3.0 100.0 58.9 9.7 4.5 23.2 3.7 100.0 59.3 9.0 6.2 19.4 6.1 married, hhead 50+, hsize< or =3 100.0 63.8 10.1 8.8 16.2 1.0 100.0 70.3 6.2 6.0 15.0 2.6 100.0 70.3 6.6 4.3 15.8 3.0 100.0 71.7 6.7 5.1 13.0 3.5 married, hhead 50+, 3<hsize<6 100.0 60.5 11.2 9.7 14.8 3.7 100.0 68.4 7.7 8.0 13.5 2.3 100.0 69.6 7.2 5.9 14.6 2.8 100.0 67.7 8.0 6.4 14.7 3.3 married, hhead 50+, hsize 6+ 100.0 61.7 11.6 10.7 13.9 2.1 100.0 66.4 8.5 7.0 15.7 2.5 100.0 70.8 7.0 5.8 14.2 2.1 100.0 68.7 7.0 6.0 13.7 4.6
Ruralsingle/separated, hhsize=1 100.0 59.0 4.2 1.4 35.4 - 100.0 59.5 6.0 1.9 30.5 2.1 100.0 60.5 2.5 1.3 33.5 2.2 100.0 66.8 2.6 3.8 23.8 3.1 single w/ hhsize>1 100.0 74.7 0.8 1.5 20.0 3.0 100.0 72.7 0.6 8.6 17.4 0.7 100.0 71.2 1.9 3.1 22.5 1.2 100.0 73.2 2.3 2.6 21.0 1.0 separated, hhsize>1 100.0 62.6 5.3 4.8 25.3 2.0 100.0 65.1 1.3 3.6 26.1 3.8 100.0 61.2 - 3.8 31.3 3.7 100.0 64.6 1.4 6.1 26.7 1.2 married, hhead<30, hsize< or =3 100.0 54.7 2.3 3.4 37.9 1.7 100.0 62.7 0.5 3.3 31.8 1.6 100.0 53.8 2.8 2.8 37.7 2.9 100.0 57.4 2.1 3.4 34.6 2.5 married, hhead<30, 3<hsize<6 100.0 50.4 1.1 5.8 41.2 1.6 100.0 57.9 0.7 5.0 34.9 1.5 100.0 55.8 2.0 4.0 36.2 2.0 100.0 61.2 1.3 2.0 32.1 3.4 married, hhead<30, hsize 6+ 100.0 52.2 3.8 3.7 40.3 - 100.0 59.1 0.9 3.3 34.6 2.1 100.0 63.4 1.8 4.4 28.0 2.4 100.0 58.2 0.7 2.5 35.6 3.0 married, hhead 30-39, hsize< or =3 100.0 62.6 3.2 5.5 26.2 2.4 100.0 61.9 3.0 4.6 29.4 1.1 100.0 61.3 2.6 4.0 29.5 2.6 100.0 63.2 1.1 3.3 31.4 1.1 married, hhead 30-39, 3<hsize<6 100.0 55.6 2.0 5.3 35.4 1.7 100.0 62.0 1.2 5.4 28.4 2.9 100.0 64.4 0.8 3.9 28.3 2.6 100.0 65.3 1.6 3.2 27.9 1.9 married, hhead 30-39, hsize 6+ 100.0 52.4 1.3 4.9 39.2 2.2 100.0 60.6 0.6 6.2 30.7 1.9 100.0 60.1 1.1 4.2 31.6 3.0 100.0 64.3 0.6 3.1 29.6 2.4 married, hhead 40-49, hsize< or =3 100.0 58.6 - 3.7 36.3 1.4 100.0 72.5 0.8 1.5 25.2 - 100.0 67.4 0.1 4.0 25.9 2.7 100.0 68.5 3.0 2.6 23.3 2.5 married, hhead 40-49, 3<hsize<6 100.0 65.6 1.5 5.5 26.2 1.2 100.0 68.1 0.9 3.7 25.1 2.2 100.0 69.3 1.0 3.3 23.9 2.5 100.0 68.8 1.2 3.2 25.4 1.4 married, hhead 40-49, hsize 6+ 100.0 63.1 0.8 5.6 29.0 1.4 100.0 64.6 0.4 4.4 28.6 2.1 100.0 67.1 0.6 3.8 25.8 2.7 100.0 66.2 0.7 3.7 27.4 2.0 married, hhead 50+, hsize< or =3 100.0 73.2 0.2 3.9 22.3 0.3 100.0 75.4 0.8 2.9 19.1 1.8 100.0 77.1 0.5 2.3 18.5 1.7 100.0 71.1 0.5 2.8 24.5 1.1 married, hhead 50+, 3<hsize<6 100.0 71.9 0.4 3.2 23.5 1.0 100.0 72.7 0.5 3.7 21.2 1.9 100.0 75.5 0.6 3.0 19.8 1.1 100.0 75.0 0.3 2.9 20.1 1.6 married, hhead 50+, hsize 6+ 100.0 69.2 0.4 4.2 25.0 1.2 100.0 73.2 0.6 4.2 20.6 1.5 100.0 74.9 0.4 2.4 20.0 2.4 100.0 73.7 0.3 4.0 19.9 2.1

Appendix 6. Distribution of Households by Lifecycle and Tenure, Philippines, 1985-1997.
1985 1991 1994 1997Tenure Status Tenure Status Tenure Status Tenure Status
Own or owner- Own/ Own/ Own or owner- Own/ Own/ Own or owner- Own/ Own/ Own or owner- Own/ Own/like rent-free house, rent-free house, like rent-free house, rent-free house, like rent-free house, rent-free house, like rent-free house, rent-free house,
possession Rent house/ rent-free lot rent-free lot possession Rent house/ rent-free lot rent-free lot possession Rent house/ rent-free lot rent-free lot possession Rent house/ rent-free lot rent-free lot Total of house and room, including Own house, w/ consent of w/o consent of Total of house and room, including Own house, w/ consent of w/o consent of Total of house and room, including Own house, w/ consent of w/o consent of Total of house and room, including Own house, w/ consent of w/o consent of
lot lot rent lot owner owner lot lot rent lot owner owner lot lot rent lot owner owner lot lot rent lot owner owner
NCRsingle/separated, hhsize=1 100.0 10.6 64.5 - 25.0 - 100.0 28.1 44.9 - 14.9 12.2 100.0 43.1 33.5 - 23.4 - 100.0 31.9 31.6 1.1 22.7 12.6 single w/ hhsize>1 100.0 37.2 50.2 5.6 7.1 - 100.0 41.1 45.7 0.5 11.2 1.4 100.0 34.2 44.6 6.7 12.1 2.5 100.0 46.5 39.0 0.6 11.2 2.7 separated, hhsize>1 100.0 31.0 35.8 9.8 23.4 - 100.0 44.2 32.6 5.0 15.3 2.9 100.0 42.3 35.1 1.3 13.4 8.0 100.0 55.0 24.1 2.0 14.5 4.4 married, hhead<30, hsize< or =3 100.0 20.8 45.3 12.7 21.3 - 100.0 28.1 43.3 5.1 22.2 1.3 100.0 38.1 34.1 3.1 22.0 2.8 100.0 35.1 49.4 1.2 11.9 2.3 married, hhead<30, 3<hsize<6 100.0 30.1 46.5 5.7 13.5 4.1 100.0 26.6 43.7 4.6 21.0 4.0 100.0 38.7 29.4 2.5 25.6 3.8 100.0 36.1 36.2 0.6 20.2 7.0 married, hhead<30, hsize 6+ 100.0 24.6 40.1 7.4 23.0 4.9 100.0 26.8 47.8 4.8 19.0 1.5 100.0 21.4 27.3 11.8 28.8 10.6 100.0 47.2 36.3 0.9 15.6 - married, hhead 30-39, hsize< or =3 100.0 25.7 45.1 6.1 19.0 4.1 100.0 36.0 44.5 2.1 12.6 4.8 100.0 35.2 39.9 2.2 17.6 5.1 100.0 35.0 47.8 1.6 11.3 4.3 married, hhead 30-39, 3<hsize<6 100.0 37.6 35.7 5.6 16.7 4.4 100.0 37.2 39.3 3.9 15.5 4.1 100.0 40.8 35.7 3.2 15.9 4.4 100.0 42.1 30.0 2.5 20.4 5.0 married, hhead 30-39, hsize 6+ 100.0 35.0 41.9 8.1 13.4 1.6 100.0 43.3 26.6 6.6 16.1 7.4 100.0 43.3 25.5 4.0 19.9 7.3 100.0 46.1 21.6 3.8 17.1 11.5 married, hhead 40-49, hsize< or =3 100.0 22.3 58.9 7.6 7.8 3.5 100.0 38.0 38.7 7.8 10.9 4.6 100.0 43.0 30.5 1.0 16.8 8.7 100.0 44.5 32.0 - 14.5 9.0 married, hhead 40-49, 3<hsize<6 100.0 36.8 34.5 6.3 17.8 4.5 100.0 43.8 35.9 6.3 11.6 2.3 100.0 47.7 31.3 4.8 11.0 5.2 100.0 53.1 25.4 3.8 12.2 5.5 married, hhead 40-49, hsize 6+ 100.0 42.4 26.3 14.1 14.2 2.9 100.0 48.2 24.4 8.6 13.8 5.0 100.0 46.3 27.7 3.4 16.3 6.3 100.0 49.8 21.2 5.3 14.1 9.6 married, hhead 50+, hsize< or =3 100.0 55.9 25.6 7.2 6.5 4.7 100.0 59.5 21.9 8.1 6.9 3.5 100.0 59.6 25.6 3.2 8.1 3.5 100.0 66.0 18.0 3.4 6.9 5.7 married, hhead 50+, 3<hsize<6 100.0 49.8 25.2 11.1 11.7 2.2 100.0 58.3 20.9 10.7 8.0 2.0 100.0 58.4 20.9 5.8 10.9 4.0 100.0 56.3 22.3 6.7 9.3 5.4 married, hhead 50+, hsize 6+ 100.0 53.3 23.2 11.1 9.6 2.7 100.0 56.4 21.1 6.6 11.6 4.3 100.0 65.7 19.0 5.2 7.6 2.5 100.0 60.1 17.2 5.8 8.3 8.6
Metro Cebusingle/separated, hhsize=1 100.0 - 75.0 - 25.0 - 100.0 16.7 50.0 16.7 16.7 - 100.0 - 100.0 - - - 100.0 15.0 56.9 9.2 18.9 - single w/ hhsize>1 100.0 71.4 14.3 14.3 - - 100.0 72.7 9.1 9.1 9.1 - 100.0 66.4 - 11.2 22.4 - 100.0 36.9 20.9 12.3 3.0 27.0 separated, hhsize>1 100.0 50.0 50.0 - - - 100.0 50.2 25.1 24.7 - - 100.0 75.0 25.0 - - - 100.0 58.3 - - 16.7 25.0 married, hhead<30, hsize< or =3 100.0 33.3 - - 33.3 33.3 100.0 20.1 40.1 19.8 20.1 - 100.0 16.7 50.0 - 33.3 - 100.0 34.2 44.5 3.6 8.4 9.3 married, hhead<30, 3<hsize<6 100.0 11.1 33.3 - 11.1 44.4 100.0 44.5 11.0 11.0 27.8 5.6 100.0 57.3 9.4 14.2 9.4 9.6 100.0 23.8 15.9 5.6 38.0 16.8 married, hhead<30, hsize 6+ 100.0 33.4 66.6 - - - 100.0 25.0 25.0 - 50.0 - 100.0 12.5 12.5 12.5 24.7 37.6 100.0 59.3 5.7 - 27.1 7.9 married, hhead 30-39, hsize< or =3 100.0 25.0 - 25.0 25.0 25.0 100.0 30.8 22.9 - 46.3 - 100.0 33.2 33.5 10.9 22.4 - 100.0 45.2 30.1 4.3 12.2 8.2 married, hhead 30-39, 3<hsize<6 100.0 38.9 16.7 11.1 16.7 16.7 100.0 25.0 23.2 17.8 32.1 1.8 100.0 34.3 23.7 15.6 23.8 2.7 100.0 42.3 11.0 8.1 19.2 19.4 married, hhead 30-39, hsize 6+ 100.0 23.5 29.4 11.8 11.8 23.5 100.0 36.0 10.2 17.9 30.8 5.2 100.0 59.6 10.7 16.1 8.1 5.5 100.0 33.7 8.9 12.3 32.8 12.3 married, hhead 40-49, hsize< or =3 100.0 100.0 - - - - 100.0 33.3 50.0 - - 16.7 100.0 25.2 24.5 25.2 25.2 - 100.0 55.6 - 15.7 25.9 2.8 married, hhead 40-49, 3<hsize<6 100.0 66.7 - - - 33.3 100.0 43.5 26.1 4.4 26.1 - 100.0 59.5 9.2 12.5 12.6 6.3 100.0 44.5 8.0 9.1 29.6 8.7 married, hhead 40-49, hsize 6+ 100.0 32.1 7.1 25.0 10.7 25.0 100.0 54.3 5.7 8.5 31.5 - 100.0 62.4 7.5 7.5 17.6 5.0 100.0 44.0 2.6 14.7 19.1 19.6 married, hhead 50+, hsize< or =3 100.0 40.0 20.0 - 40.0 - 100.0 57.8 - 5.3 36.9 - 100.0 41.7 16.7 16.7 8.3 16.7 100.0 46.4 - 18.7 23.7 11.2 married, hhead 50+, 3<hsize<6 100.0 39.3 3.6 7.1 14.3 35.7 100.0 59.0 5.1 5.1 25.7 5.1 100.0 66.7 2.2 8.9 13.3 8.9 100.0 56.5 1.8 16.9 10.6 14.2 married, hhead 50+, hsize 6+ 100.0 46.7 16.7 20.0 3.3 13.3 100.0 57.7 8.9 15.5 17.8 - 100.0 60.0 6.0 17.9 8.0 8.0 100.0 44.8 9.9 13.1 18.3 13.8
Davao Citysingle/separated, hhsize=1 100.0 29.5 20.5 - 50.0 - 100.0 - 40.0 20.0 40.0 - - - - - - - 100.0 15.4 46.2 - 38.5 - single w/ hhsize>1 100.0 77.5 22.5 - - - 100.0 61.9 28.6 - 9.5 - 100.0 38.2 9.6 23.5 28.7 - 100.0 53.6 17.1 - 29.3 - separated, hhsize>1 100.0 46.2 53.8 - - - 100.0 33.3 66.7 - - - 100.0 - - 20.3 79.7 - 100.0 67.0 - 27.1 5.9 - married, hhead<30, hsize< or =3 100.0 56.4 12.7 - 30.9 - 100.0 - 28.6 - 71.4 - 100.0 24.7 16.9 - 58.4 - 100.0 17.0 28.3 9.4 45.3 - married, hhead<30, 3<hsize<6 100.0 11.9 47.4 11.9 28.9 - 100.0 43.4 17.0 - 39.6 - 100.0 43.0 23.7 - 23.7 9.6 100.0 38.5 27.5 3.9 22.5 7.6 married, hhead<30, hsize 6+ 100.0 33.3 50.0 - 16.7 - 100.0 58.4 - - 16.7 25.0 100.0 54.9 - - 45.1 - 100.0 100.0 - - - - married, hhead 30-39, hsize< or =3 100.0 50.0 50.0 - - - 100.0 - 35.3 - 64.7 - 100.0 63.4 18.3 - 18.3 - 100.0 55.9 35.3 - 8.8 - married, hhead 30-39, 3<hsize<6 100.0 34.3 22.1 15.7 23.4 4.5 100.0 54.4 13.2 4.4 24.6 3.5 100.0 45.7 13.1 6.4 32.2 2.6 100.0 40.2 25.3 3.5 29.1 1.9 married, hhead 30-39, hsize 6+ 100.0 44.5 14.6 - 37.2 3.7 100.0 53.5 9.9 6.9 24.8 5.0 100.0 47.4 6.7 6.7 33.3 5.8 100.0 28.0 11.2 11.8 48.9 - married, hhead 40-49, hsize< or =3 100.0 50.0 33.3 16.7 - - 100.0 100.0 - - - - 100.0 75.9 - - 24.1 - 100.0 66.0 19.4 - 14.6 - married, hhead 40-49, 3<hsize<6 100.0 57.6 21.2 - 21.2 - 100.0 63.9 6.0 - 16.9 13.2 100.0 62.0 - 4.2 20.5 13.4 100.0 70.4 6.9 6.5 13.8 2.4 married, hhead 40-49, hsize 6+ 100.0 59.2 5.2 7.8 27.8 - 100.0 60.5 12.3 7.0 20.2 - 100.0 43.3 9.7 5.8 34.4 6.7 100.0 42.8 8.4 9.6 37.8 1.5 married, hhead 50+, hsize< or =3 100.0 91.5 8.5 - - - 100.0 82.9 9.8 - - 7.3 100.0 24.3 17.3 - 41.1 17.3 100.0 73.9 - 3.6 18.9 3.6 married, hhead 50+, 3<hsize<6 100.0 62.8 8.0 13.7 15.5 - 100.0 84.8 2.5 2.5 7.6 2.5 100.0 79.7 9.6 4.8 3.5 2.4 100.0 64.2 5.8 4.9 25.1 - married, hhead 50+, hsize 6+ 100.0 59.9 5.0 20.2 14.8 - 100.0 69.7 3.0 6.1 18.2 3.0 100.0 63.5 6.4 10.1 20.0 - 100.0 68.4 - 18.3 13.3 -

Appendix 7. Housing Improvement By Lifecycle, Wall Materials.
Total Strong Light Makeshift Total Strong Light Makeshift
WALL MATERIALS Philippines
single/separated, hhsize=1 100.0 34.2 57.9 7.9 100.0 58.4 36.4 5.2 single w/ hhsize>1 100.0 54.0 44.6 1.5 100.0 76.3 21.6 2.1 separated, hhsize>1 100.0 46.4 47.9 5.7 100.0 65.9 31.3 2.9 married, hhead<30, hsize< or =3 100.0 21.7 71.8 6.5 100.0 53.9 43.2 2.8 married, hhead<30, 3<hsize<6 100.0 23.1 71.4 5.6 100.0 47.3 49.9 2.7 married, hhead<30, hsize 6+ 100.0 24.1 67.1 8.9 100.0 49.8 48.2 2.0 married, hhead 30-39, hsize< or =3 100.0 41.2 55.9 2.9 100.0 61.6 36.4 2.0 married, hhead 30-39, 3<hsize<6 100.0 37.4 57.9 4.7 100.0 62.0 35.7 2.3 married, hhead 30-39, hsize 6+ 100.0 31.3 64.6 4.0 100.0 51.4 45.5 3.1 married, hhead 40-49, hsize< or =3 100.0 33.4 62.6 4.0 100.0 66.6 30.6 2.8 married, hhead 40-49, 3<hsize<6 100.0 41.9 54.7 3.5 100.0 68.6 29.4 2.0 married, hhead 40-49, hsize 6+ 100.0 37.6 59.2 3.2 100.0 58.5 39.5 2.0 married, hhead 50+, hsize< or =3 100.0 40.3 55.2 4.5 100.0 61.3 37.1 1.6 married, hhead 50+, 3<hsize<6 100.0 44.0 53.0 3.0 100.0 68.6 29.9 1.5 married, hhead 50+, hsize 6+ 100.0 46.5 51.0 2.5 100.0 69.3 29.0 1.7
Urbansingle/separated, hhsize=1 100.0 51.2 45.5 3.3 100.0 76.5 19.1 4.4 single w/ hhsize>1 100.0 62.2 36.3 1.4 100.0 85.0 12.4 2.6 separated, hhsize>1 100.0 53.2 37.2 9.6 100.0 77.3 18.4 4.4 married, hhead<30, hsize< or =3 100.0 41.2 53.4 5.4 100.0 68.1 26.8 5.1 married, hhead<30, 3<hsize<6 100.0 35.5 58.1 6.5 100.0 65.3 29.5 5.2 married, hhead<30, hsize 6+ 100.0 34.3 54.6 11.1 100.0 63.2 33.4 3.4 married, hhead 30-39, hsize< or =3 100.0 52.9 43.8 3.3 100.0 78.6 19.2 2.2 married, hhead 30-39, 3<hsize<6 100.0 51.5 43.5 5.0 100.0 74.8 21.9 3.3 married, hhead 30-39, hsize 6+ 100.0 41.8 53.3 4.9 100.0 65.0 29.6 5.4 married, hhead 40-49, hsize< or =3 100.0 47.5 49.0 3.6 100.0 74.8 22.3 2.9 married, hhead 40-49, 3<hsize<6 100.0 56.3 40.6 3.1 100.0 80.3 17.1 2.6 married, hhead 40-49, hsize 6+ 100.0 49.3 45.9 4.9 100.0 72.1 25.0 2.9 married, hhead 50+, hsize< or =3 100.0 54.4 40.7 4.8 100.0 77.6 20.3 2.1 married, hhead 50+, 3<hsize<6 100.0 61.0 35.2 3.8 100.0 78.2 19.7 2.1 married, hhead 50+, hsize 6+ 100.0 56.9 39.8 3.2 100.0 79.8 17.9 2.3
Ruralsingle/separated, hhsize=1 100.0 24.5 65.0 10.5 100.0 34.7 59.1 6.2 single w/ hhsize>1 100.0 45.2 53.3 1.5 100.0 60.7 38.1 1.2 separated, hhsize>1 100.0 36.4 63.6 - 100.0 44.3 55.7 - married, hhead<30, hsize< or =3 100.0 13.5 79.6 7.0 100.0 42.2 56.8 1.0 married, hhead<30, 3<hsize<6 100.0 17.4 77.5 5.1 100.0 33.2 66.1 0.7 married, hhead<30, hsize 6+ 100.0 17.9 74.6 7.5 100.0 36.2 63.2 0.7 married, hhead 30-39, hsize< or =3 100.0 32.9 64.5 2.6 100.0 42.3 55.9 1.8 married, hhead 30-39, 3<hsize<6 100.0 27.0 68.5 4.5 100.0 49.1 49.5 1.3 married, hhead 30-39, hsize 6+ 100.0 26.5 69.9 3.6 100.0 42.3 56.2 1.5 married, hhead 40-49, hsize< or =3 100.0 25.6 70.2 4.2 100.0 58.5 38.8 2.7 married, hhead 40-49, 3<hsize<6 100.0 31.0 65.2 3.8 100.0 55.6 43.1 1.3 married, hhead 40-49, hsize 6+ 100.0 30.8 66.9 2.3 100.0 47.2 51.4 1.3 married, hhead 50+, hsize< or =3 100.0 34.9 60.6 4.4 100.0 51.0 47.8 1.2 married, hhead 50+, 3<hsize<6 100.0 34.0 63.4 2.6 100.0 60.1 38.9 1.0 married, hhead 50+, hsize 6+ 100.0 38.2 59.9 1.9 100.0 59.2 39.8 1.1
1985 1997

Appendix 7. Housing Improvement By Lifecycle, Wall Materials.
Total Strong Light Makeshift Total Strong Light Makeshift1985 1997
NCRsingle/separated, hhsize=1 100.0 54.3 45.7 - 100.0 80.2 10.0 9.8 single w/ hhsize>1 100.0 74.7 24.0 1.3 100.0 89.6 6.4 4.0 separated, hhsize>1 100.0 62.4 28.7 8.9 100.0 84.3 8.8 6.9 married, hhead<30, hsize< or =3 100.0 44.4 48.2 7.4 100.0 79.6 8.4 11.9 married, hhead<30, 3<hsize<6 100.0 44.0 47.6 8.4 100.0 80.4 9.2 10.4 married, hhead<30, hsize 6+ 100.0 42.8 49.8 7.4 100.0 76.7 21.9 1.3 married, hhead 30-39, hsize< or =3 100.0 52.9 42.9 4.2 100.0 88.9 6.5 4.7 married, hhead 30-39, 3<hsize<6 100.0 59.8 33.2 7.0 100.0 84.0 9.7 6.2 married, hhead 30-39, hsize 6+ 100.0 52.3 42.4 5.3 100.0 73.6 11.8 14.6 married, hhead 40-49, hsize< or =3 100.0 62.4 37.6 - 100.0 89.6 5.7 4.7 married, hhead 40-49, 3<hsize<6 100.0 57.4 37.6 5.0 100.0 90.5 5.8 3.7 married, hhead 40-49, hsize 6+ 100.0 53.8 39.1 7.0 100.0 86.9 7.6 5.5 married, hhead 50+, hsize< or =3 100.0 72.6 24.0 3.4 100.0 90.1 4.8 5.1 married, hhead 50+, 3<hsize<6 100.0 72.2 25.0 2.8 100.0 86.9 8.1 5.0 married, hhead 50+, hsize 6+ 100.0 60.8 34.4 4.9 100.0 90.5 4.4 5.1
Metro Cebusingle/separated, hhsize=1 100.0 25.0 75.0 - 100.0 89.4 10.6 - single w/ hhsize>1 100.0 71.4 28.6 - 100.0 80.7 11.5 7.8 separated, hhsize>1 100.0 100.0 - - 100.0 68.0 32.0 - married, hhead<30, hsize< or =3 100.0 33.4 66.6 - 100.0 52.9 47.1 - married, hhead<30, 3<hsize<6 100.0 33.3 66.7 - 100.0 51.4 42.0 6.5 married, hhead<30, hsize 6+ 100.0 33.3 33.3 33.3 100.0 44.9 40.7 14.3 married, hhead 30-39, hsize< or =3 100.0 25.0 50.0 25.0 100.0 77.5 22.5 - married, hhead 30-39, 3<hsize<6 100.0 55.6 44.4 - 100.0 63.9 31.0 5.1 married, hhead 30-39, hsize 6+ 100.0 35.3 64.7 - 100.0 64.2 31.5 4.3 married, hhead 40-49, hsize< or =3 100.0 - 100.0 - 100.0 38.0 59.2 2.8 married, hhead 40-49, 3<hsize<6 100.0 55.5 33.3 11.1 100.0 65.8 32.2 2.0 married, hhead 40-49, hsize 6+ 100.0 50.0 42.9 7.1 100.0 64.3 30.6 5.0 married, hhead 50+, hsize< or =3 100.0 - 80.0 20.0 100.0 69.6 25.0 5.4 married, hhead 50+, 3<hsize<6 100.0 50.0 32.1 17.9 100.0 76.5 20.7 2.8 married, hhead 50+, hsize 6+ 100.0 70.0 30.0 - 100.0 68.8 28.3 2.9
Davao Citysingle/separated, hhsize=1 100.0 100.0 - - 100.0 100.0 - - single w/ hhsize>1 100.0 32.4 67.6 - 100.0 79.5 10.3 10.3 separated, hhsize>1 100.0 73.1 26.9 - 100.0 93.6 - 6.4 married, hhead<30, hsize< or =3 100.0 43.6 56.4 - 100.0 81.1 9.4 9.4 married, hhead<30, 3<hsize<6 100.0 35.6 64.4 - 100.0 76.9 19.2 3.9 married, hhead<30, hsize 6+ 100.0 50.0 16.7 33.3 100.0 26.3 73.7 - married, hhead 30-39, hsize< or =3 100.0 50.0 50.0 - 100.0 91.2 8.8 - married, hhead 30-39, 3<hsize<6 100.0 45.5 48.2 6.3 100.0 86.7 13.3 - married, hhead 30-39, hsize 6+ 100.0 39.7 38.8 21.5 100.0 90.4 6.2 3.4 married, hhead 40-49, hsize< or =3 100.0 16.7 66.7 16.7 100.0 75.7 24.3 - married, hhead 40-49, 3<hsize<6 100.0 42.4 57.6 - 100.0 91.3 8.7 - married, hhead 40-49, hsize 6+ 100.0 49.0 51.0 - 100.0 76.3 20.8 2.9 married, hhead 50+, hsize< or =3 100.0 79.3 20.7 - 100.0 74.7 25.3 - married, hhead 50+, 3<hsize<6 100.0 70.8 29.2 - 100.0 88.2 11.8 - married, hhead 50+, hsize 6+ 100.0 52.4 40.1 7.6 100.0 94.7 5.3 -

Appendix 8. Housing Improvement By Lifecycle, Toilet Facility.
Others (pail Others (pailTotal Water-sealed Closed-pit Open-pit system, etc) None Total Water-sealed Closed-pit Open-pit system, etc) None
Philippinessingle/separated, hhsize=1 100.0 50.9 8.7 17.0 3.2 20.2 100.0 60.2 9.6 11.8 3.7 14.7 single w/ hhsize>1 100.0 60.8 14.9 11.1 2.5 10.7 100.0 75.2 9.2 5.9 3.9 5.8 separated, hhsize>1 100.0 58.4 12.8 12.3 5.3 11.3 100.0 70.3 10.6 5.8 2.7 10.6 married, hhead<30, hsize< or =3 100.0 33.0 21.7 21.2 3.8 20.2 100.0 56.8 15.0 11.3 4.4 12.4 married, hhead<30, 3<hsize<6 100.0 40.5 17.0 17.0 4.4 21.1 100.0 50.8 14.3 12.5 4.6 17.8 married, hhead<30, hsize 6+ 100.0 40.1 18.1 18.2 6.0 17.6 100.0 54.6 11.6 15.1 3.7 15.0 married, hhead 30-39, hsize< or =3 100.0 60.4 11.0 11.4 4.1 13.1 100.0 63.7 11.2 9.8 3.6 11.6 married, hhead 30-39, 3<hsize<6 100.0 53.2 17.6 14.1 3.8 11.3 100.0 64.7 10.7 10.0 4.2 10.4 married, hhead 30-39, hsize 6+ 100.0 44.0 17.3 17.3 3.6 17.8 100.0 53.7 14.6 11.8 4.3 15.7 married, hhead 40-49, hsize< or =3 100.0 50.2 16.3 16.1 4.7 12.7 100.0 68.1 10.3 7.2 4.2 10.3 married, hhead 40-49, 3<hsize<6 100.0 56.6 16.2 11.6 3.6 12.1 100.0 70.5 11.0 8.0 3.5 7.1 married, hhead 40-49, hsize 6+ 100.0 53.5 16.4 15.7 3.7 10.7 100.0 61.6 13.6 11.4 3.5 9.9 married, hhead 50+, hsize< or =3 100.0 48.6 17.9 15.8 2.6 15.1 100.0 62.8 12.0 8.9 3.1 13.2 married, hhead 50+, 3<hsize<6 100.0 58.3 15.2 12.1 3.3 11.0 100.0 71.1 11.9 7.5 2.8 6.8 married, hhead 50+, hsize 6+ 100.0 60.3 16.9 12.2 3.2 7.3 100.0 71.3 10.1 8.8 3.3 6.5
Urbansingle/separated, hhsize=1 100.0 83.7 9.0 0.6 1.7 5.0 100.0 76.2 6.2 5.7 3.1 8.7 single w/ hhsize>1 100.0 77.4 10.9 4.8 2.7 4.2 100.0 84.5 8.0 2.1 3.3 2.1 separated, hhsize>1 100.0 73.5 8.8 4.1 5.4 8.2 100.0 78.3 8.7 2.0 3.5 7.5 married, hhead<30, hsize< or =3 100.0 59.7 12.1 7.8 7.3 13.1 100.0 71.4 9.2 6.2 6.4 6.8 married, hhead<30, 3<hsize<6 100.0 59.4 14.1 7.7 5.2 13.5 100.0 67.5 11.6 4.9 5.8 10.1 married, hhead<30, hsize 6+ 100.0 53.5 13.2 11.3 6.5 15.5 100.0 68.8 9.9 8.2 3.8 9.4 married, hhead 30-39, hsize< or =3 100.0 74.5 9.3 8.9 3.5 3.8 100.0 78.9 7.7 4.6 4.5 4.4 married, hhead 30-39, 3<hsize<6 100.0 71.1 12.1 6.6 4.5 5.7 100.0 76.4 7.8 4.4 4.6 6.7 married, hhead 30-39, hsize 6+ 100.0 64.6 13.4 8.0 3.9 10.2 100.0 69.3 11.3 5.5 4.6 9.2 married, hhead 40-49, hsize< or =3 100.0 66.8 11.9 10.0 3.7 7.6 100.0 79.9 7.0 4.0 2.4 6.7 married, hhead 40-49, 3<hsize<6 100.0 75.7 11.4 4.1 3.7 5.1 100.0 81.3 8.0 3.7 3.3 3.7 married, hhead 40-49, hsize 6+ 100.0 69.6 12.3 7.3 3.7 7.1 100.0 75.7 9.4 5.6 4.0 5.4 married, hhead 50+, hsize< or =3 100.0 69.7 13.8 7.9 0.1 8.5 100.0 77.9 7.7 4.6 3.4 6.5 married, hhead 50+, 3<hsize<6 100.0 77.5 9.4 5.6 2.9 4.6 100.0 82.2 7.4 3.8 3.3 3.2 married, hhead 50+, hsize 6+ 100.0 76.2 11.0 5.2 3.7 3.8 100.0 81.0 6.9 4.9 3.2 4.0
Ruralsingle/separated, hhsize=1 100.0 32.3 8.6 26.3 4.1 28.8 100.0 39.2 14.0 19.7 4.5 22.6 single w/ hhsize>1 100.0 43.2 19.0 17.9 2.4 17.6 100.0 58.7 11.2 12.8 5.0 12.3 separated, hhsize>1 100.0 36.0 18.7 24.4 5.1 15.7 100.0 55.2 14.1 13.0 1.0 16.6 married, hhead<30, hsize< or =3 100.0 21.8 25.8 26.9 2.3 23.2 100.0 44.7 19.9 15.6 2.8 17.1 married, hhead<30, 3<hsize<6 100.0 31.7 18.4 21.3 4.1 24.5 100.0 37.6 16.5 18.5 3.6 23.8 married, hhead<30, hsize 6+ 100.0 32.0 21.0 22.4 5.6 18.9 100.0 40.1 13.3 22.1 3.6 20.8 married, hhead 30-39, hsize< or =3 100.0 50.5 12.2 13.1 4.5 19.6 100.0 46.5 15.3 15.9 2.6 19.8 married, hhead 30-39, 3<hsize<6 100.0 39.9 21.7 19.6 3.3 15.5 100.0 53.1 13.5 15.6 3.8 14.0 married, hhead 30-39, hsize 6+ 100.0 34.5 19.1 21.6 3.5 21.3 100.0 43.2 16.8 16.0 4.0 20.0 married, hhead 40-49, hsize< or =3 100.0 41.0 18.8 19.5 5.2 15.5 100.0 56.4 13.5 10.4 5.9 13.7 married, hhead 40-49, 3<hsize<6 100.0 42.2 19.8 17.2 3.5 17.3 100.0 58.4 14.3 12.9 3.6 10.8 married, hhead 40-49, hsize 6+ 100.0 44.2 18.8 20.5 3.7 12.9 100.0 49.9 17.2 16.2 3.2 13.5 married, hhead 50+, hsize< or =3 100.0 40.6 19.4 18.8 3.5 17.6 100.0 53.2 14.8 11.7 2.9 17.5 married, hhead 50+, 3<hsize<6 100.0 47.0 18.7 16.0 3.6 14.8 100.0 61.3 15.8 10.8 2.3 9.9 married, hhead 50+, hsize 6+ 100.0 47.7 21.6 17.8 2.9 10.0 100.0 61.8 13.2 12.5 3.4 9.1
1997
TYPE OF TOILET FACILITY
1985

Appendix 8. Housing Improvement By Lifecycle, Toilet Facility.
Others (pail Others (pailTotal Water-sealed Closed-pit Open-pit system, etc) None Total Water-sealed Closed-pit Open-pit system, etc) None
19971985
NCRsingle/separated, hhsize=1 100.0 91.4 8.6 - - - 100.0 85.6 1.7 2.8 3.5 6.4 single w/ hhsize>1 100.0 83.4 10.9 1.4 4.3 - 100.0 86.4 8.1 1.1 4.4 - separated, hhsize>1 100.0 74.6 9.7 4.3 9.2 2.2 100.0 81.7 11.0 0.9 3.3 3.1 married, hhead<30, hsize< or =3 100.0 71.6 9.9 5.3 10.5 2.7 100.0 80.9 6.7 0.7 9.2 2.6 married, hhead<30, 3<hsize<6 100.0 76.5 4.4 3.0 8.8 7.4 100.0 77.5 10.8 1.1 8.2 2.4 married, hhead<30, hsize 6+ 100.0 67.2 9.7 10.3 4.8 8.0 100.0 82.4 10.0 3.6 4.0 - married, hhead 30-39, hsize< or =3 100.0 80.6 8.3 4.4 6.6 - 100.0 83.6 8.3 0.9 5.9 1.3 married, hhead 30-39, 3<hsize<6 100.0 75.5 9.5 5.1 7.0 2.9 100.0 83.3 6.4 1.4 6.2 2.7 married, hhead 30-39, hsize 6+ 100.0 78.2 10.4 2.5 5.0 3.8 100.0 79.6 9.5 1.6 5.3 3.9 married, hhead 40-49, hsize< or =3 100.0 69.5 7.6 7.8 3.5 11.7 100.0 86.1 7.8 - 3.7 2.4 married, hhead 40-49, 3<hsize<6 100.0 82.2 7.0 2.2 6.8 1.8 100.0 84.1 8.8 1.1 4.6 1.4 married, hhead 40-49, hsize 6+ 100.0 80.3 7.4 1.2 5.3 5.8 100.0 87.7 6.1 2.4 3.1 0.8 married, hhead 50+, hsize< or =3 100.0 88.8 6.7 1.4 - 3.1 100.0 88.2 6.8 - 3.5 1.5 married, hhead 50+, 3<hsize<6 100.0 85.0 8.0 0.9 3.9 2.2 100.0 89.7 4.7 1.0 4.4 0.1 married, hhead 50+, hsize 6+ 100.0 82.2 7.4 3.6 5.8 1.1 100.0 87.3 4.6 2.3 4.6 1.2
Metro Cebusingle/separated, hhsize=1 100.0 100.0 - - - - 100.0 76.7 11.3 - - 12.1 single w/ hhsize>1 100.0 85.7 14.3 - - - 100.0 56.1 22.4 3.0 - 18.5 separated, hhsize>1 100.0 100.0 - - - - 100.0 60.2 - 7.7 3.1 28.9 married, hhead<30, hsize< or =3 100.0 33.3 - 33.3 - 33.3 100.0 49.5 7.3 17.9 6.7 18.5 married, hhead<30, 3<hsize<6 100.0 66.7 11.1 - - 22.2 100.0 63.5 13.3 - 5.1 18.1 married, hhead<30, hsize 6+ 100.0 33.3 - 33.3 33.3 - 100.0 50.5 - 8.6 - 40.8 married, hhead 30-39, hsize< or =3 100.0 50.0 - - - 50.0 100.0 92.5 - - - 7.5 married, hhead 30-39, 3<hsize<6 100.0 72.2 - 5.6 - 22.2 100.0 72.0 8.8 4.4 9.6 5.1 married, hhead 30-39, hsize 6+ 100.0 70.6 5.9 - - 23.5 100.0 66.8 10.3 - 8.8 14.0 married, hhead 40-49, hsize< or =3 100.0 100.0 - - - - 100.0 43.7 14.9 16.3 3.9 21.2 married, hhead 40-49, 3<hsize<6 100.0 66.7 - 11.1 11.1 11.1 100.0 78.5 7.5 5.8 3.3 4.9 married, hhead 40-49, hsize 6+ 100.0 82.1 7.1 7.1 - 3.6 100.0 64.2 11.6 7.2 1.3 15.6 married, hhead 50+, hsize< or =3 100.0 20.0 - 40.0 - 40.0 100.0 59.5 3.5 18.1 1.5 17.5 married, hhead 50+, 3<hsize<6 100.0 71.4 7.1 14.3 - 7.1 100.0 73.3 10.8 3.1 8.6 4.2 married, hhead 50+, hsize 6+ 100.0 90.0 - 3.3 - 6.7 100.0 73.9 3.4 9.2 2.4 11.2
Davao Citysingle/separated, hhsize=1 100.0 100.0 - - - - 100.0 100.0 - - - - single w/ hhsize>1 100.0 45.1 32.4 22.5 - - 100.0 69.2 10.3 20.5 - - separated, hhsize>1 100.0 86.5 - - 13.5 - 100.0 83.5 - 10.6 - 5.9 married, hhead<30, hsize< or =3 100.0 81.8 - 18.2 - - 100.0 71.7 - 9.4 9.4 9.4 married, hhead<30, 3<hsize<6 100.0 71.1 - 17.0 11.9 - 100.0 69.9 3.9 14.7 3.9 7.6 married, hhead<30, hsize 6+ 100.0 66.7 - 16.7 16.7 - 100.0 100.0 - - - - married, hhead 30-39, hsize< or =3 100.0 50.0 - 50.0 - - 100.0 82.4 - 8.8 - 8.8 married, hhead 30-39, 3<hsize<6 100.0 70.7 7.7 18.5 3.2 - 100.0 77.0 3.5 9.8 1.8 7.9 married, hhead 30-39, hsize 6+ 100.0 50.7 8.9 35.1 5.2 - 100.0 78.9 - 5.6 3.1 12.4 married, hhead 40-49, hsize< or =3 100.0 66.7 - 16.7 16.7 - 100.0 85.4 - - - 14.6 married, hhead 40-49, 3<hsize<6 100.0 63.6 21.2 15.2 - - 100.0 88.4 - 8.3 - 3.3 married, hhead 40-49, hsize 6+ 100.0 55.7 12.7 25.2 - 6.4 100.0 68.2 8.1 5.5 2.9 15.3 married, hhead 50+, hsize< or =3 100.0 67.0 12.2 20.7 - - 100.0 68.2 6.4 16.4 - 8.9 married, hhead 50+, 3<hsize<6 100.0 67.3 9.7 22.9 - - 100.0 68.0 - 25.1 - 6.9 married, hhead 50+, hsize 6+ 100.0 72.9 8.7 15.9 2.5 - 100.0 91.9 3.2 - - 4.9

Appendix 9. Housing Improvement By Lifecycle, Source of Water Supply.
1985 1997Own use, faucet Shared, faucet, Own use, Shared, Own use, faucet Shared, faucet, Own use, Shared,community water community water tubed/piped tubed/piped Spring, river community water community water tubed/piped tubed/piped Spring, river
Total system system well well Dugwell stream, etc. Rain Peddler Total system system well well Dugwell stream, etc. Rain Peddler
SOURCE OF WATER SUPPLY Philippines
single/separated, hhsize=1 100.0 18.7 20.1 11.9 17.2 21.1 8.8 0.8 1.4 100.0 27.6 17.9 10.8 21.8 12.8 4.8 0.8 3.5 single w/ hhsize>1 100.0 30.7 16.6 15.6 14.4 13.0 6.0 0.8 2.9 100.0 34.8 17.9 16.1 12.1 7.8 6.8 0.9 3.6 separated, hhsize>1 100.0 31.7 14.3 17.7 18.0 9.2 6.4 - 2.6 100.0 33.0 20.0 12.1 21.0 7.9 2.2 0.4 3.5 married, hhead<30, hsize< or =3 100.0 10.0 17.1 8.8 23.1 23.1 14.6 1.3 2.0 100.0 15.1 23.8 12.0 23.0 10.5 10.2 0.4 5.1 married, hhead<30, 3<hsize<6 100.0 12.8 18.0 11.6 23.2 20.5 11.0 0.9 2.0 100.0 14.1 22.8 10.0 25.9 13.2 9.7 0.2 4.1 married, hhead<30, hsize 6+ 100.0 18.0 21.0 7.9 23.6 14.4 10.4 1.0 3.8 100.0 19.8 23.7 9.2 21.6 10.8 10.4 - 4.4 married, hhead 30-39, hsize< or =3 100.0 21.6 15.8 14.2 18.6 16.7 8.9 2.2 2.0 100.0 22.1 23.8 12.9 18.9 9.3 10.1 0.1 2.7 married, hhead 30-39, 3<hsize<6 100.0 20.6 18.7 14.9 17.3 16.3 8.0 1.0 3.1 100.0 21.1 22.6 13.6 21.0 10.4 7.4 0.4 3.5 married, hhead 30-39, hsize 6+ 100.0 13.5 17.7 16.1 18.6 20.2 11.0 0.9 2.1 100.0 15.0 22.0 12.2 22.5 14.0 11.0 0.2 3.1 married, hhead 40-49, hsize< or =3 100.0 16.7 15.5 15.0 16.5 22.4 8.4 3.1 2.5 100.0 26.1 19.5 14.5 18.1 10.3 9.0 0.4 2.1 married, hhead 40-49, 3<hsize<6 100.0 23.2 17.8 16.5 14.5 15.6 9.3 1.5 1.7 100.0 28.0 18.6 17.2 16.8 10.0 6.4 0.3 2.7 married, hhead 40-49, hsize 6+ 100.0 17.8 18.5 17.4 14.7 18.4 9.6 1.2 2.4 100.0 19.6 21.1 14.2 19.0 13.6 9.0 0.3 3.2 married, hhead 50+, hsize< or =3 100.0 14.0 18.7 19.4 15.9 18.6 10.9 1.3 1.2 100.0 18.7 19.9 16.5 17.2 14.0 10.4 0.8 2.4 married, hhead 50+, 3<hsize<6 100.0 20.4 14.9 20.5 15.1 16.8 8.9 1.7 1.6 100.0 24.0 18.8 19.8 16.2 11.1 7.4 0.4 2.3 married, hhead 50+, hsize 6+ 100.0 24.0 16.2 22.0 13.2 14.3 7.8 0.8 1.8 100.0 24.3 16.7 21.0 15.8 11.2 8.3 0.2 2.4
Urbansingle/separated, hhsize=1 100.0 38.7 25.5 13.3 7.8 8.9 1.9 - 3.9 100.0 40.5 19.1 10.5 16.7 5.8 2.5 - 5.0 single w/ hhsize>1 100.0 53.6 14.8 11.0 11.0 3.9 0.5 0.3 4.9 100.0 48.6 17.8 14.0 9.9 3.1 1.4 - 5.1 separated, hhsize>1 100.0 47.5 13.7 12.2 18.6 4.7 - - 3.3 100.0 45.8 19.3 10.1 14.0 4.8 0.8 0.1 5.1 married, hhead<30, hsize< or =3 100.0 29.1 32.3 8.9 15.1 6.1 2.8 2.2 3.5 100.0 28.3 29.3 8.0 17.8 4.7 1.4 0.2 10.1 married, hhead<30, 3<hsize<6 100.0 32.3 25.5 6.8 20.1 8.7 0.9 - 5.6 100.0 26.7 28.0 9.0 19.8 5.5 2.7 0.1 8.1 married, hhead<30, hsize 6+ 100.0 34.9 30.6 3.8 16.6 4.6 1.7 - 7.9 100.0 32.1 28.8 8.7 15.8 5.8 2.7 - 6.0 married, hhead 30-39, hsize< or =3 100.0 37.9 15.9 20.0 12.6 6.0 4.6 - 3.1 100.0 36.2 28.9 9.6 13.8 4.7 2.4 0.2 4.2 married, hhead 30-39, 3<hsize<6 100.0 39.3 21.6 11.8 13.6 5.8 1.2 0.2 6.5 100.0 35.5 23.5 11.2 16.2 5.4 2.2 0.1 5.9 married, hhead 30-39, hsize 6+ 100.0 30.6 24.8 14.4 14.3 8.1 2.5 0.3 4.9 100.0 29.4 25.5 9.6 18.6 7.6 2.8 0.1 6.4 married, hhead 40-49, hsize< or =3 100.0 39.0 19.2 15.0 12.7 4.8 2.6 1.0 5.7 100.0 42.5 20.3 11.4 13.5 5.2 3.4 0.3 3.4 married, hhead 40-49, 3<hsize<6 100.0 43.6 20.6 12.2 11.8 6.9 1.7 0.4 2.8 100.0 45.3 18.4 13.3 12.8 4.1 1.4 0.1 4.5 married, hhead 40-49, hsize 6+ 100.0 35.8 23.1 13.2 12.8 7.4 1.8 0.3 5.6 100.0 34.8 22.0 12.4 15.6 6.9 2.5 0.1 5.8 married, hhead 50+, hsize< or =3 100.0 35.2 21.3 19.3 12.6 7.7 1.3 0.3 2.3 100.0 37.7 19.0 16.5 12.5 6.5 2.7 0.2 5.0 married, hhead 50+, 3<hsize<6 100.0 44.1 15.2 16.0 11.8 6.9 1.3 0.7 4.0 100.0 41.4 16.8 17.4 13.0 5.3 1.7 0.1 4.3 married, hhead 50+, hsize 6+ 100.0 45.1 17.1 17.3 9.8 5.3 1.2 0.4 3.7 100.0 40.4 16.2 17.6 13.9 5.4 2.2 0.1 4.2
Ruralsingle/separated, hhsize=1 100.0 7.3 17.0 11.1 22.5 28.0 12.7 1.3 - 100.0 10.7 16.4 11.2 28.5 21.9 7.8 1.8 1.6 single w/ hhsize>1 100.0 6.3 18.4 20.6 18.1 22.6 11.8 1.4 0.7 100.0 10.1 18.0 19.9 16.1 16.2 16.3 2.6 0.9 separated, hhsize>1 100.0 8.5 15.1 25.9 17.1 15.9 15.8 - 1.7 100.0 8.7 21.1 15.8 34.2 13.8 4.9 1.1 0.4 married, hhead<30, hsize< or =3 100.0 1.9 10.8 8.8 26.5 30.2 19.6 0.9 1.4 100.0 4.1 19.2 15.3 27.3 15.3 17.5 0.5 0.8 married, hhead<30, 3<hsize<6 100.0 3.9 14.5 13.8 24.6 25.9 15.7 1.3 0.4 100.0 4.2 18.7 10.8 30.6 19.2 15.2 0.3 0.9 married, hhead<30, hsize 6+ 100.0 7.9 15.2 10.4 27.8 20.2 15.5 1.5 1.4 100.0 7.4 18.6 9.6 27.5 15.8 18.3 - 2.8 married, hhead 30-39, hsize< or =3 100.0 10.1 15.7 10.2 22.8 24.2 12.1 3.7 1.3 100.0 6.0 18.1 16.6 24.8 14.5 18.9 - 1.0 married, hhead 30-39, 3<hsize<6 100.0 6.8 16.5 17.2 20.0 24.1 13.1 1.6 0.6 100.0 6.7 21.7 16.1 25.8 15.4 12.5 0.7 1.1 married, hhead 30-39, hsize 6+ 100.0 5.5 14.4 16.9 20.6 25.7 15.0 1.2 0.8 100.0 5.2 19.6 14.0 25.2 18.4 16.5 0.3 0.9 married, hhead 40-49, hsize< or =3 100.0 4.2 13.4 15.1 18.6 32.2 11.6 4.2 0.7 100.0 10.0 18.8 17.5 22.6 15.3 14.4 0.5 0.9 married, hhead 40-49, 3<hsize<6 100.0 7.9 15.6 19.7 16.5 22.1 15.0 2.3 0.8 100.0 8.6 18.8 21.5 21.2 16.6 12.0 0.6 0.7 married, hhead 40-49, hsize 6+ 100.0 7.4 15.8 19.8 15.8 24.8 14.0 1.7 0.6 100.0 7.0 20.3 15.8 21.8 19.2 14.4 0.4 1.1 married, hhead 50+, hsize< or =3 100.0 5.9 17.7 19.5 17.1 22.8 14.5 1.7 0.8 100.0 6.8 20.5 16.5 20.2 18.7 15.3 1.2 0.7 married, hhead 50+, 3<hsize<6 100.0 6.5 14.8 23.2 17.1 22.5 13.4 2.2 0.2 100.0 8.6 20.6 22.0 19.1 16.1 12.5 0.6 0.6 married, hhead 50+, hsize 6+ 100.0 7.1 15.4 25.6 15.8 21.4 13.1 1.2 0.3 100.0 8.5 17.2 24.3 17.7 16.9 14.3 0.4 0.7

Appendix 9. Housing Improvement By Lifecycle, Source of Water Supply.
1985 1997Own use, faucet Shared, faucet, Own use, Shared, Own use, faucet Shared, faucet, Own use, Shared,community water community water tubed/piped tubed/piped Spring, river community water community water tubed/piped tubed/piped Spring, river
Total system system well well Dugwell stream, etc. Rain Peddler Total system system well well Dugwell stream, etc. Rain Peddler
NCRsingle/separated, hhsize=1 100.0 64.6 25.7 - - - - - 9.7 100.0 51.5 18.5 3.4 14.0 2.1 - - 10.4 single w/ hhsize>1 100.0 65.3 11.6 5.4 4.4 2.8 - - 10.5 100.0 58.3 18.9 7.4 6.8 0.7 - - 8.0 separated, hhsize>1 100.0 71.4 14.0 2.7 6.9 - - - 5.1 100.0 52.2 24.3 4.4 8.3 3.2 - - 7.6 married, hhead<30, hsize< or =3 100.0 47.4 37.1 2.4 5.2 - - - 7.9 100.0 40.1 31.4 1.6 11.4 - - - 15.4 married, hhead<30, 3<hsize<6 100.0 48.6 29.3 - 8.7 4.0 - - 9.4 100.0 36.0 30.9 4.3 11.7 2.1 - - 14.9 married, hhead<30, hsize 6+ 100.0 46.8 35.8 - 10.1 - - - 7.4 100.0 49.1 32.1 2.8 4.4 - - - 11.6 married, hhead 30-39, hsize< or =3 100.0 57.1 16.9 8.7 6.0 4.2 - - 7.0 100.0 42.3 33.0 4.4 9.9 1.0 - - 9.4 married, hhead 30-39, 3<hsize<6 100.0 53.4 22.9 4.0 5.4 2.1 - - 12.2 100.0 44.6 27.0 5.9 9.9 1.5 - - 11.1 married, hhead 30-39, hsize 6+ 100.0 45.8 31.2 3.4 6.3 4.0 - - 9.4 100.0 34.8 32.4 3.0 12.0 3.6 - - 14.1 married, hhead 40-49, hsize< or =3 100.0 67.9 19.0 4.9 - - - - 8.2 100.0 61.3 18.0 5.6 7.4 2.4 - - 5.2 married, hhead 40-49, 3<hsize<6 100.0 60.9 23.0 1.8 6.9 2.5 - - 5.0 100.0 55.9 20.4 5.4 7.6 1.8 - - 8.8 married, hhead 40-49, hsize 6+ 100.0 51.9 23.4 5.3 4.7 3.2 - - 11.5 100.0 44.9 25.1 4.2 9.0 3.9 - - 13.0 married, hhead 50+, hsize< or =3 100.0 50.9 21.6 11.9 4.7 1.8 - - 9.1 100.0 54.3 22.0 6.6 5.5 3.1 - - 8.6 married, hhead 50+, 3<hsize<6 100.0 62.5 12.4 6.7 6.2 4.2 - - 8.0 100.0 55.7 16.9 8.9 9.0 0.5 - - 9.0 married, hhead 50+, hsize 6+ 100.0 61.7 19.0 6.5 3.0 1.7 - - 8.1 100.0 57.4 16.6 8.6 6.9 1.5 - - 9.0
Metro Cebusingle/separated, hhsize=1 100.0 25.0 - 25.0 25.0 25.0 - - - 100.0 61.7 - - 30.7 - 7.7 - - single w/ hhsize>1 100.0 57.1 28.6 - 14.3 - - - - 100.0 47.2 23.7 3.0 5.5 13.0 - - 7.8 separated, hhsize>1 100.0 50.0 - - 50.0 - - - - 100.0 48.3 23.5 8.1 3.1 6.1 - - 10.8 married, hhead<30, hsize< or =3 100.0 - 100.0 - - - - - - 100.0 10.4 21.9 3.9 12.5 19.2 7.3 - 24.8 married, hhead<30, 3<hsize<6 100.0 22.2 33.3 - 11.1 11.1 11.1 - 11.1 100.0 28.4 21.2 6.8 17.0 8.7 - - 17.8 married, hhead<30, hsize 6+ 100.0 - 66.6 33.4 - - - - - 100.0 15.0 7.9 10.6 46.5 5.7 - - 14.3 married, hhead 30-39, hsize< or =3 100.0 - 25.0 25.0 25.0 - 25.0 - - 100.0 23.7 19.4 14.4 15.7 11.2 7.5 - 8.2 married, hhead 30-39, 3<hsize<6 100.0 33.3 27.8 11.1 22.2 - - - 5.6 100.0 33.5 17.3 8.6 12.1 9.5 1.6 - 17.4 married, hhead 30-39, hsize 6+ 100.0 41.2 35.3 - 5.9 5.9 5.9 - 5.9 100.0 29.5 30.1 2.6 23.2 8.4 1.7 - 4.6 married, hhead 40-49, hsize< or =3 100.0 50.0 50.0 - - - - - - 100.0 11.0 14.9 2.8 17.1 14.3 31.8 - 8.1 married, hhead 40-49, 3<hsize<6 100.0 66.7 22.2 - 11.1 - - - - 100.0 27.1 22.5 11.7 13.6 10.1 4.3 - 10.7 married, hhead 40-49, hsize 6+ 100.0 28.6 39.3 10.7 14.3 - - - 7.1 100.0 23.3 18.9 8.7 22.5 12.1 4.3 - 10.3 married, hhead 50+, hsize< or =3 100.0 - 80.0 - 20.0 - - - - 100.0 16.7 12.5 23.8 8.2 12.2 16.8 - 9.7 married, hhead 50+, 3<hsize<6 100.0 28.6 32.1 14.3 17.9 - 3.6 - 3.6 100.0 30.8 19.3 12.6 14.6 13.3 3.9 - 5.5 married, hhead 50+, hsize 6+ 100.0 60.0 13.3 20.0 3.3 3.3 - - - 100.0 23.7 24.7 15.4 15.5 10.5 1.6 - 8.5
Davao Citysingle/separated, hhsize=1 100.0 50.0 20.5 - - 29.5 - - - 100.0 84.6 - 15.4 - - - - - single w/ hhsize>1 100.0 22.5 - - - 22.5 54.9 - - 100.0 46.4 11.4 - 16.0 - 10.3 10.3 5.7 separated, hhsize>1 100.0 59.7 13.4 - 13.4 - - - 13.4 100.0 55.9 10.6 - 16.5 6.4 - 10.6 - married, hhead<30, hsize< or =3 100.0 56.4 25.4 - - - 18.2 - - 100.0 - 54.7 - 17.0 - - - 28.3 married, hhead<30, 3<hsize<6 100.0 35.5 23.7 - - 28.9 - - 11.9 100.0 43.5 34.1 - 11.5 - - 7.0 3.9 married, hhead<30, hsize 6+ 100.0 33.3 50.0 - - - - - 16.7 100.0 100.0 - - - - - - - married, hhead 30-39, hsize< or =3 100.0 50.0 - - - 50.0 - - - 100.0 55.9 44.1 - - - - - - married, hhead 30-39, 3<hsize<6 100.0 44.1 9.4 4.5 12.2 6.3 3.2 4.5 15.8 100.0 52.2 29.3 - 8.4 3.5 1.8 3.2 1.8 married, hhead 30-39, hsize 6+ 100.0 30.8 7.3 - 10.5 3.7 19.4 19.4 8.9 100.0 38.8 30.1 - 28.0 - - - 3.1 married, hhead 40-49, hsize< or =3 100.0 50.0 33.3 - - - - 16.7 - 100.0 48.6 19.4 - - 17.4 - - 14.6 married, hhead 40-49, 3<hsize<6 100.0 21.2 21.2 21.2 - 10.6 - 15.2 10.6 100.0 68.1 12.0 - 6.5 1.8 3.3 6.5 1.8 married, hhead 40-49, hsize 6+ 100.0 40.0 14.2 7.8 17.6 6.4 7.5 3.8 2.6 100.0 48.9 17.0 5.2 17.6 2.9 - 2.6 5.8 married, hhead 50+, hsize< or =3 100.0 54.8 8.5 - - - 24.5 12.2 - 100.0 37.6 14.3 3.6 19.3 - 12.8 - 12.5 married, hhead 50+, 3<hsize<6 100.0 43.9 4.0 - 9.7 5.7 17.2 15.5 4.0 100.0 35.5 21.7 - 8.8 2.5 13.3 13.3 4.9 married, hhead 50+, hsize 6+ 100.0 39.0 20.2 6.2 5.1 8.7 3.6 9.8 7.6 100.0 46.7 6.3 - 21.1 7.1 13.0 3.2 2.6

Appendix 10. Estimated Parametersa/ of Housing Demand Functions.
Philippines Urban Rural Metro Manila Metro Cebu Davao Cityc/
Owners Renters Owners Renters Owners Renters Owners Renters Owners Renters Owners Renters
Constant -4.846 -4.494 -4.330 -4.396 -4.504 -2.096 -4.242 -4.772 -2.137 -2.371 -3.313 -2.286(0.065) (0.245) (0.079) (0.258) (0.121) (0.994) (0.198) (0.396) (0.465) (1.074) (0.583) (1.639)
Income 1.035 1.032 1.043 1.043 0.975 0.546 1.026 1.118 0.874 1.005 0.933 0.590(0.008) (0.026) (0.009) (0.027) (0.015) (0.119) (0.019) (0.037) (0.051) (0.112) (0.067) (0.160)
Size -0.375 -0.285 -0.385 -0.280 -0.340 -0.157 -0.314 -0.305 -0.250 -0.462 -0.309 -0.109(0.010) (0.030) (0.012) (0.030) (0.016) (0.137) (0.026) (0.043) (0.072) (0.128) (0.094) (0.151)
Housing Price b/ 0.420 0.332 0.343 0.300 0.458 0.756 0.341 0.235 0.320 0.092 0.376 0.726(0.006) (0.019) (0.007) (0.020) (0.010) (0.105) (0.021) (0.030) (0.043) (0.060) (0.059) (0.135)
Price Elasticity c/ -0.300 -0.450 -0.430 0.500 -0.240 0.260 -0.038 -0.425 -0.420 -0.775 -0.320 0.825
R2 0.745 0.620 0.742 0.600 0.600 0.590 0.735 0.557 0.693 0.651 0.710 0.584
Adjsuted R2 0.745 0.619 0.742 0.599 0.600 0.580 0.735 0.556 0.690 0.636 0.706 0.558
a/ All parameters significant at s = 0.01.b/ Price data based on computed hedonic price by type of housing in each city.c/ Price elasticity is obtained by untangling the price of land from structure using the following relationship: Εp=b/KL-1 where b = parameter for land
KS = share of structure housing: 0.60

Appendix 11. Percentage Distribution of Household Expenditure.
Income Class FOOD ALBEV & FUEL TRCOM HOPER & CLOTH EDUC MEDIC HOUSE OTHERSTBCCO PRCRE
Philippinesunder 10,000 65.6 2.0 7.7 1.7 4.9 1.7 0.2 1.3 8.0 7.0 10,000-19,999 65.3 2.9 6.3 2.2 4.6 2.2 0.5 1.4 7.5 6.9 20,000-29,999 64.3 3.3 6.1 2.4 4.8 2.6 1.0 1.4 7.0 7.2 30,000-39,999 62.4 3.6 5.8 2.5 5.1 3.0 1.2 1.6 7.1 7.6 40,000-49,999 61.2 3.6 5.6 2.8 5.1 3.3 1.4 1.6 7.5 8.0 50,000-59,999 58.8 3.3 5.4 3.0 5.2 3.3 2.0 1.8 8.4 8.6 60,000-79,999 56.1 3.4 5.7 3.4 5.3 3.4 2.4 1.7 9.8 8.8 80,000-99,999 53.3 3.0 5.7 3.9 5.4 3.5 2.7 1.8 10.9 9.7 100,000-149,999 48.9 2.5 5.7 4.5 5.4 3.6 3.5 2.0 12.3 11.6 150,000-249,999 43.3 1.9 5.4 5.3 5.6 3.5 4.4 2.4 14.0 14.1 250,000-499,999 36.0 1.4 4.9 7.0 6.0 3.5 5.3 2.4 15.7 17.6 500,000 & over 21.9 0.7 4.4 10.0 6.2 2.6 4.8 2.7 25.3 21.4
Urbanunder 10,000 68.5 2.0 7.4 1.1 4.8 1.0 0.2 0.5 9.5 5.0 10,000-19,999 63.2 2.3 6.8 2.4 4.9 2.4 0.7 2.0 9.2 6.2 20,000-29,999 62.5 3.0 6.7 2.4 5.2 2.5 1.1 1.6 8.7 6.2 30,000-39,999 61.5 3.5 6.3 2.6 5.2 2.8 1.3 1.7 9.2 6.1 40,000-49,999 60.5 3.4 6.0 3.0 5.3 3.1 1.4 1.6 9.2 6.5 50,000-59,999 58.5 3.1 5.7 3.1 5.4 3.1 1.8 1.8 10.2 7.4 60,000-79,999 55.9 3.2 5.9 3.5 5.4 3.2 2.3 1.6 11.0 7.9 80,000-99,999 53.3 3.0 5.9 3.9 5.5 3.3 2.7 1.9 11.2 9.3 100,000-149,999 48.8 2.4 5.9 4.5 5.5 3.4 3.7 2.0 12.6 11.1 150,000-249,999 42.3 1.9 5.4 5.3 5.9 3.5 4.8 2.4 13.4 15.1 250,000-499,999 35.2 1.4 4.8 7.3 6.5 3.6 5.9 3.2 13.8 18.3 500,000 & over 25.9 0.9 4.1 9.6 6.8 3.2 6.4 3.9 15.7 23.4
Ruralunder 10,000 65.3 2.0 7.7 1.7 4.9 1.8 0.2 1.4 7.8 7.2 10,000-19,999 65.7 3.0 6.2 2.2 4.6 2.2 0.4 1.3 7.1 6.9 20,000-29,999 64.7 3.3 5.9 2.4 4.7 2.7 1.0 1.3 6.6 7.4 30,000-39,999 62.8 3.7 5.6 2.5 5.0 3.1 1.3 1.5 6.5 8.2 40,000-49,999 61.5 3.7 5.4 2.7 5.0 3.4 1.5 1.5 6.7 8.5 50,000-59,999 59.2 3.5 5.2 3.0 5.2 3.5 2.1 1.8 7.3 9.4 60,000-79,999 56.4 3.6 5.2 3.2 5.2 3.8 2.7 1.8 8.2 9.9 80,000-99,999 53.4 3.1 5.0 3.8 5.3 3.9 3.3 2.0 8.8 11.4 100,000-149,999 48.1 2.7 4.7 4.2 5.3 4.1 4.1 2.5 9.2 15.0 150,000-249,999 42.8 2.2 4.4 4.7 5.6 4.0 5.0 3.1 9.9 18.4 250,000-499,999 35.0 1.8 4.0 6.0 5.6 4.0 5.9 2.4 11.8 23.5 500,000 & over 26.5 1.7 3.1 9.1 5.6 3.6 6.6 3.6 12.0 28.2
ALBEV alcoholic beverages EDUC education
TBCCO tobacco MEDIC medical care
FUEL fuel, light & water HOUSE rental of occupied dwelling unit and repair
TRCOM transportation & communication services
HOPER household operation
PRCRE personal care & effects
CLOTH clothing, footwear, etc.
Source: Family Income and Expenditure Survey, National Statistics Office 1997.
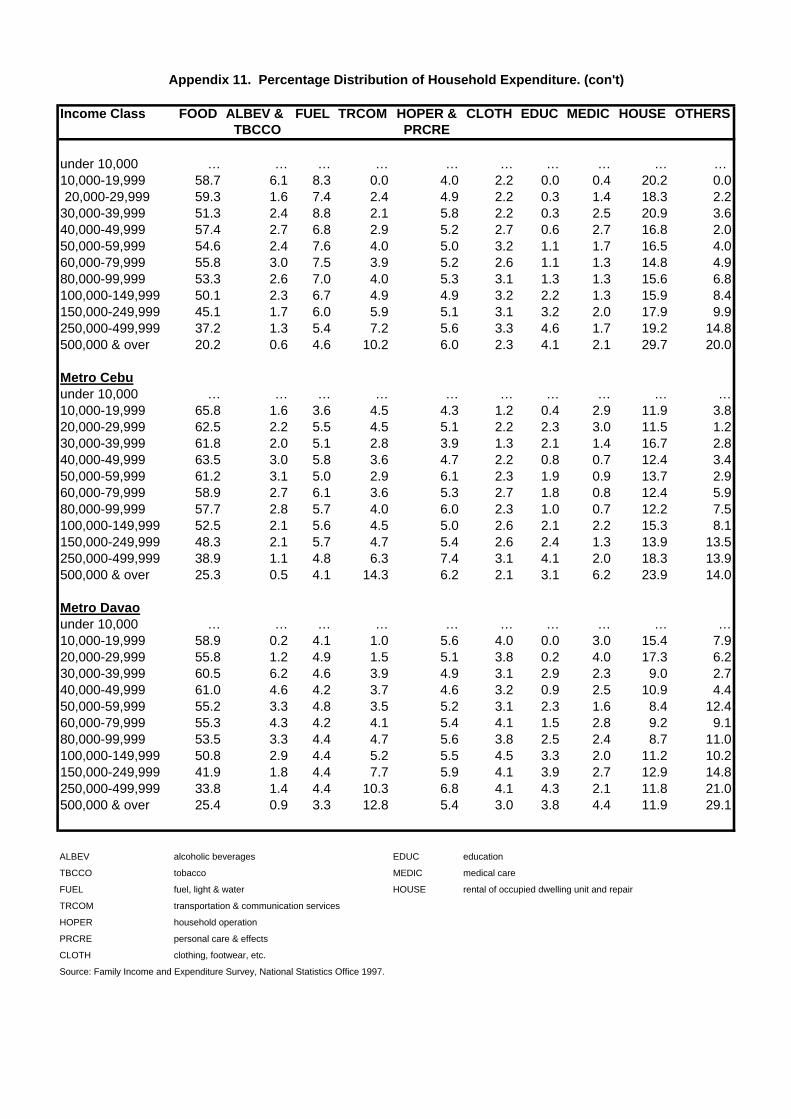
Appendix 11. Percentage Distribution of Household Expenditure. (con't)
Income Class FOOD ALBEV & FUEL TRCOM HOPER & CLOTH EDUC MEDIC HOUSE OTHERSTBCCO PRCRE
under 10,000 … … … … … … … … … …10,000-19,999 58.7 6.1 8.3 0.0 4.0 2.2 0.0 0.4 20.2 0.020,000-29,999 59.3 1.6 7.4 2.4 4.9 2.2 0.3 1.4 18.3 2.2
30,000-39,999 51.3 2.4 8.8 2.1 5.8 2.2 0.3 2.5 20.9 3.640,000-49,999 57.4 2.7 6.8 2.9 5.2 2.7 0.6 2.7 16.8 2.050,000-59,999 54.6 2.4 7.6 4.0 5.0 3.2 1.1 1.7 16.5 4.060,000-79,999 55.8 3.0 7.5 3.9 5.2 2.6 1.1 1.3 14.8 4.980,000-99,999 53.3 2.6 7.0 4.0 5.3 3.1 1.3 1.3 15.6 6.8100,000-149,999 50.1 2.3 6.7 4.9 4.9 3.2 2.2 1.3 15.9 8.4150,000-249,999 45.1 1.7 6.0 5.9 5.1 3.1 3.2 2.0 17.9 9.9250,000-499,999 37.2 1.3 5.4 7.2 5.6 3.3 4.6 1.7 19.2 14.8500,000 & over 20.2 0.6 4.6 10.2 6.0 2.3 4.1 2.1 29.7 20.0
Metro Cebuunder 10,000 … … … … … … … … … …10,000-19,999 65.8 1.6 3.6 4.5 4.3 1.2 0.4 2.9 11.9 3.820,000-29,999 62.5 2.2 5.5 4.5 5.1 2.2 2.3 3.0 11.5 1.230,000-39,999 61.8 2.0 5.1 2.8 3.9 1.3 2.1 1.4 16.7 2.840,000-49,999 63.5 3.0 5.8 3.6 4.7 2.2 0.8 0.7 12.4 3.450,000-59,999 61.2 3.1 5.0 2.9 6.1 2.3 1.9 0.9 13.7 2.960,000-79,999 58.9 2.7 6.1 3.6 5.3 2.7 1.8 0.8 12.4 5.980,000-99,999 57.7 2.8 5.7 4.0 6.0 2.3 1.0 0.7 12.2 7.5100,000-149,999 52.5 2.1 5.6 4.5 5.0 2.6 2.1 2.2 15.3 8.1150,000-249,999 48.3 2.1 5.7 4.7 5.4 2.6 2.4 1.3 13.9 13.5250,000-499,999 38.9 1.1 4.8 6.3 7.4 3.1 4.1 2.0 18.3 13.9500,000 & over 25.3 0.5 4.1 14.3 6.2 2.1 3.1 6.2 23.9 14.0
Metro Davaounder 10,000 … … … … … … … … … …10,000-19,999 58.9 0.2 4.1 1.0 5.6 4.0 0.0 3.0 15.4 7.920,000-29,999 55.8 1.2 4.9 1.5 5.1 3.8 0.2 4.0 17.3 6.230,000-39,999 60.5 6.2 4.6 3.9 4.9 3.1 2.9 2.3 9.0 2.740,000-49,999 61.0 4.6 4.2 3.7 4.6 3.2 0.9 2.5 10.9 4.450,000-59,999 55.2 3.3 4.8 3.5 5.2 3.1 2.3 1.6 8.4 12.460,000-79,999 55.3 4.3 4.2 4.1 5.4 4.1 1.5 2.8 9.2 9.180,000-99,999 53.5 3.3 4.4 4.7 5.6 3.8 2.5 2.4 8.7 11.0100,000-149,999 50.8 2.9 4.4 5.2 5.5 4.5 3.3 2.0 11.2 10.2150,000-249,999 41.9 1.8 4.4 7.7 5.9 4.1 3.9 2.7 12.9 14.8250,000-499,999 33.8 1.4 4.4 10.3 6.8 4.1 4.3 2.1 11.8 21.0500,000 & over 25.4 0.9 3.3 12.8 5.4 3.0 3.8 4.4 11.9 29.1
ALBEV alcoholic beverages EDUC education
TBCCO tobacco MEDIC medical care
FUEL fuel, light & water HOUSE rental of occupied dwelling unit and repair
TRCOM transportation & communication services
HOPER household operation
PRCRE personal care & effects
CLOTH clothing, footwear, etc.
Source: Family Income and Expenditure Survey, National Statistics Office 1997.