philippine country report - asia securities forum · · 2014-12-162011-01-17 · slide 2 outline:...
TRANSCRIPT

Slide 1
Philippine Country Report
Ismael G. CruzPresident
Philippine Association of Securities Brokers and Dealers, Inc

Slide 2
Outline: Philippine Country Report
Ä The Philippine Economy
§ Growth despite global recession In 2009
§ Strong growth in 1Q10
§ Benign inflation and supportive monetary environment
§ Surge in BoP Surplus, large current account surplus narrower traded deficit and record GIR
§ Manageable fiscal situation and reduced burden
§ Special deposit accounts
§ Strengthening of the peso
§ Overall assessment
§ 2010 and 2011 forecasts
Ä The Philippine Stock Market
§ Robust market performance and above-average volume turnover
§ More capital raised
§ Strong first-quarter earnings growth
§ Attractive P/E valuation
§ Key developments
• New trading system
• ASEAN exchange hub
Ä The Philippine Fixed Income Exchange
§ Integrated and diversified products and services
§ Diverse ownership and clear mandate
§ Building market infrastructure
§ High trading-volume growth
§ Wave of corporate bond issuances
Ä Capital Market Trends and Regulatory Policy
§ New products
• PERA, Derivatives, ETFs, REITs
§ Regulatory policy:
• DST, MRD Spin-off
§ New legislation
• FRIA, CISA, CISL, FinTax

Slide 3
The Philippine Economy

Slide 4
The Philippine Economy: Growth Despite Global Recession
Ä Growth despite global recession
§ In the face of global recession, the economy grew by 0.9% in 2009, compared with average growth of 5.5% over the previous 5 years (2004-2008)
§ GDP maintained slight growth throughout 2009, picking up in the fourth quarter, as industrial output rebounded from a slump
§ GNP, which included remittances from nearly 9m OFWs, rose by 3.0%
Ä Private and public consumption spending offset weakness in investment and trade
§ Private consumption grew 3.8%, buoyed by OFW remittances and remained the biggest contributor to GDP on the demand side
§ Significantly higher government consumption spending (up by 8.5%) and a fiscal stimulus package helped support aggregate demand
§ On the supply side, services, which accounted for 50% of GDP in 2009, expanded by 3.2% and was the only production sector to contribute to GDP growth
Annual GDP %
Quarterly GDP % (Y-Y)

Slide 5
The Philippine Economy: Resilience And Gradual Growth
5.5% 5.8%5.3%
8.7%
5.1%
6.3% 6.2%7.1%
8.2%
4.9%
6.0%
4.6%3.8%
1.4%
2.5%
4.5%
-1.7%
1.1%
-2.0% -2.3%
5.5% 5.3%
3.8%
6.3%
4.0%
-4.0%
-2.0%
0.0%
2.0%
4.0%
6.0%
8.0%
10.0%
Indonesia Malaysia Philippines Singapore Thailand
2006 2007 2008 2009 2010F

Slide 6
4.5%
5.1%4.7%
5.4%5.7% 5.5%
5.1%5.5%
7.1%7.5%
6.6%
7.4%
3.8% 3.7%
4.6%
2.8%
0.5%
1.2%
0.2%
2.1%
7.3%
0.0%
1.0%
2.0%
3.0%
4.0%
5.0%
6.0%
7.0%
8.0%
1Q05 2Q05 3Q05 4Q05 1Q06 2Q06 3Q06 4Q06 1Q07 2Q07 3Q07 4Q07 1Q08 2Q08 3Q08 4Q08 1Q09 2Q09 3Q09 4Q09 1Q10
The Philippine Economy: 1Q10 GDP Grew At The Fastest Pace Since 4Q07
5-year average
5-year (2005-2009)quarterly average: 4.5%
Quarterly GDP Growth (Y-Y)

Slide 7
The Philippine Economy:Surge In Investments, Trade, And Industry; Improvement In All Components, Except Agriculture
4Q09 1Q10
Q-Q Y-Y % of Total Q-Q Y-Y % of
Total
Private consumption +18.2% +5.0% 82.3% -15.4% +5.9% 77.2%
Investments +9.2% +5.8% 15.6% +19.5% +24.2% 20.6%
Government spending -8.9% +13.7% 5.8% +22.8% +18.5% 7.9%
Exports -26.1% -6.7% 31.8% +15.5% +17.9% 40.7%
Imports +7.1% +6.8% 44.8% -14.9% +20.3% 42.3%
4Q09 1Q10
Q-Q Y-Y % of Total Q-Q Y-Y % of
Total
Agriculture +28.9% -2.6% 19.1% -15.5% -2.5% 17.9%
Industry +12.3% +0.4% 31.4% -6.2% +15.4% 32.6%
Services +11.5% +4.3% 49.0% -9.1% +5.9% 49.4%
Quarterly Growth Of Demand And Supply Side Components (Q-Q, Y-Y)

Slide 8
The Philippine Economy: Benign Inflation And Supportive Monetary Environment
Ä Inflation has risen but remains low
§ Inflation averaged 3.2% in 2009 pulled down by lower international prices for oil and commodities, coupled with soft domestic demand
§ Consumer prices picked up to 4.4% in December, on the back of rising prices oil and food
Ä Interest rates have been kept at low levels to support growth
§ As the economy sagged and inflation waned, BSP lowered interest rates by 200 bp from December 2008 and July 2009, taking the overnight borrowing rate to 4.0%
§ BSP also supported banking system liquidity and depositor confidence by reducing commercial bank reserve requirements and increasing the ceiling on deposit insurance
Monthly Inflation (Y-Y)
Inflation (Y-Y) And Interest Rates
Slide 9
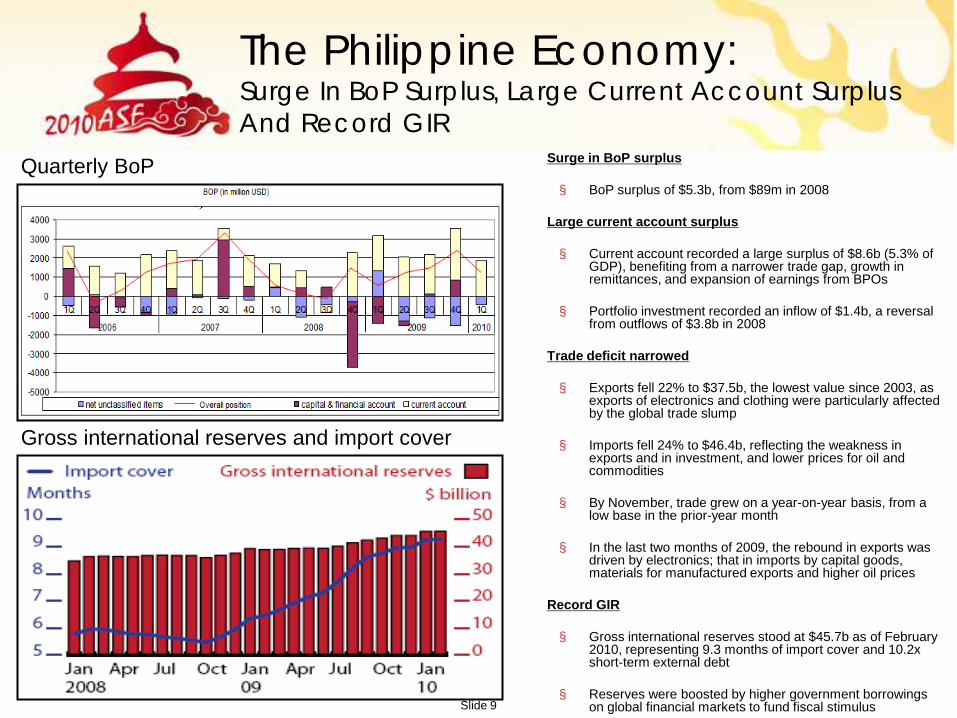
The Philippine Economy: Surge In BoP Surplus, Large Current Account Surplus And Record GIR
Ä Surge in BoP surplus
§ BoP surplus of $5.3b, from $89m in 2008
Ä Large current account surplus
§ Current account recorded a large surplus of $8.6b (5.3% of GDP), benefiting from a narrower trade gap, growth in remittances, and expansion of earnings from BPOs
§ Portfolio investment recorded an inflow of $1.4b, a reversal from outflows of $3.8b in 2008
Ä Trade deficit narrowed
§ Exports fell 22% to $37.5b, the lowest value since 2003, as exports of electronics and clothing were particularly affected by the global trade slump
§ Imports fell 24% to $46.4b, reflecting the weakness in exports and in investment, and lower prices for oil and commodities
§ By November, trade grew on a year-on-year basis, from a low base in the prior-year month
§ In the last two months of 2009, the rebound in exports was driven by electronics; that in imports by capital goods, materials for manufactured exports and higher oil prices
Ä Record GIR
§ Gross international reserves stood at $45.7b as of February 2010, representing 9.3 months of import cover and 10.2x short-term external debt
§ Reserves were boosted by higher government borrowings on global financial markets to fund fiscal stimulus
Quarterly BoP
Gross international reserves and import cover

Slide 10
The Philippine Economy: Manageable Fiscal Balance And Reduced Debt Burden
Ä Stimulative fiscal policy
§ The fiscal deficit widened to 3.9% of GDP, from 0.9% of GDP in 2008
§ Stimulus focused on extra spending for infrastructure and for social protection measures
§ Government expenditure, other than for interest payments on large public debt, rose to 14.9% of GDP from 13.5% in 2008
Ä Stable sovereign outlook
§ In July 2009, Moody’s upgraded the country’s credit rating from B1 to Ba3 with stable outlook- after 4 years at B1, citing resilience of the financial system and of the external payments position during the global recession
Ä NG debt of P4,443b (57.3% of GDP) at end 2009 from 77.3% in 2003
Budget deficit
National Government Debt

Slide 11
The Philippine Economy:SDAs Are Attracting Liquid Capital
Special Deposit Accounts (in Php bn)
585
834
-100200300400500600700800900
1H09 1H10
+43%
Slide 12
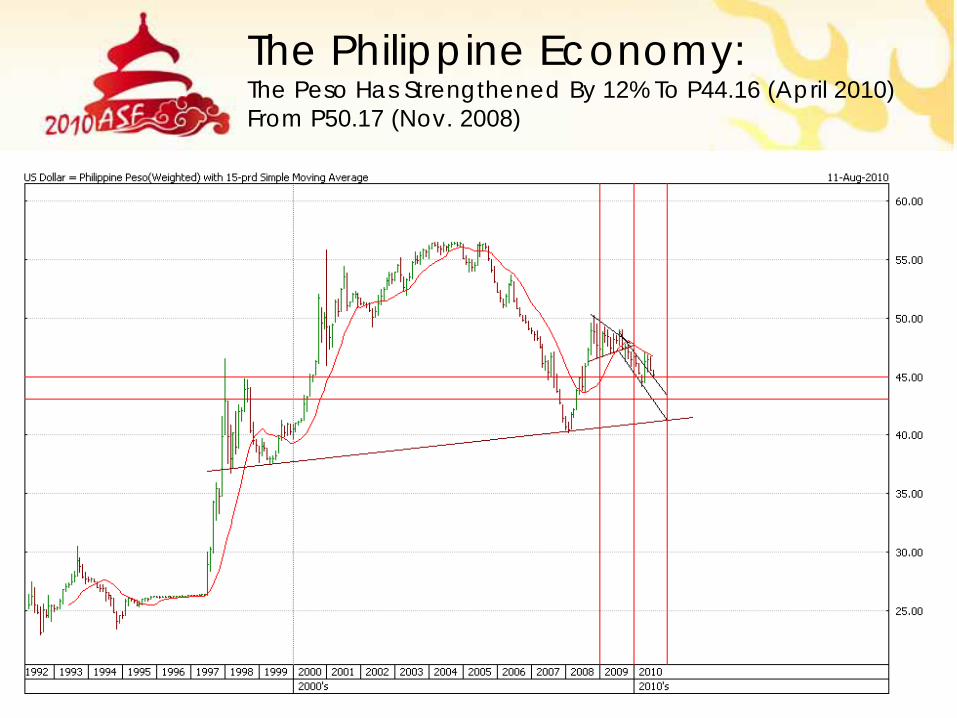
The Philippine Economy: The Peso Has Strengthened By 12% To P44.16 (April 2010) From P50.17 (Nov. 2008)

Slide 13
The Philippine Economy: Underpinned By Strong Economic Fundamentals
Positive FactorsÄ The Philippines avoided recession in 2009 with growth of 1.1%
Ä 1Q10 GDP grew 7.3%, the fastest pace since 4Q07, and full-year is forecasted to grow 5% to 6%
Ä Inflation rate slowed to 3.9% in June, from 4.3% the previous month, the lowest in seven months
Ä Interest rates are at a record low of 4% and 6% for borrowing and lending, respectively
Ä OFW remittances in the 5M10 rose 7% to $7.4b, and forecasted to grow 8% this year
Ä Balance of payments surplus grew 46% to $3.2b in 1H10, driven by strong OFW remittance and forex inflows
Ä Exports rose 39% to $19.2b in 5M10, better than full-year forecast of +15%
Ä FDI in 1Q10 rose 19% to $319M, better than full-year forecast of -8%
ÄPeso has appreciated as much 6% this year against the US dollar, and YTD appreciation of +3%
ÄSuccessful automated elections and new leadership
Negative Factors
Ä Trade deficit grew 16% y-y in 5M10 to $2.9b, due to a sharper rise in imports
ÄBudget deficit was revised upwards to P325b or 3.6% of GDP, from P300b or 3.5%
Ä External debt is at 57.3% Debt-to-GDP ratio in 2009, among the highest in the region. (Regional average: 37.8% Debt-to-GDP ratio)

Slide 14
The Philippine Economy:2009 and 2010 Forecasts
Economic Indicator 2010F 2011F
GDP +5% to +6% +7% to +8%
Inflation rate 3.5% to 5.5% 3.0% to 5.0%
Gross international reserves $49b to $50b -
OFW remittances +8% to $18.8b -
FDI -8% to $1.8b -
Balance of Payments -30% to $3.7b surplus -
Budget deficit P325b or 3.6% of GDP P285b or 3.3% of GDP
Exports +15% to $43.1b +13% to $48.7b
Imports +20% to $55.7b+16% to +18%
($64.6b to $65.7b)
*Source: Various Philippine government agencies

Slide 15
The Philippine Stock Market

Slide 16
PSEi Growth (in %)
42%
26%
15%
42%
21%
-48%
63%
15%
-60%
-40%
-20%
0%
20%
40%
60%
80%
2003 2004 2005 2006 2007 2008 2009 YTD
The Philippine Stock Market: Robust Stock Market Performance And Above-Average Volume Turnover
Average Daily Turnover (in Php bn)
0.590.84
1.56
2.32
5.48
3.11
4.11
3.2
0
1
2
3
4
5
6
2003 2004 2005 2006 2007 2008 2009 YTD
7-year average
P2.6b
1
2
3
7th annual rise in the past 8 years
Slide 17
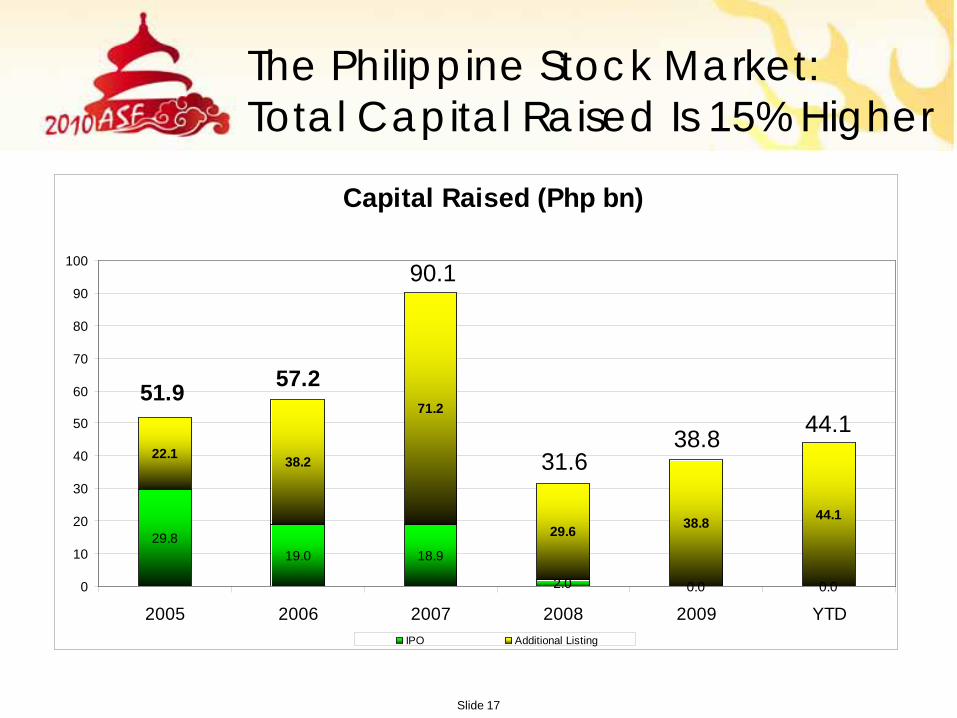
The Philippine Stock Market: Total Capital Raised Is 15% Higher
Capital Raised (Php bn)
29.819.0 18.9
2.0 0.0 0.0
22.1 38.2
71.2
29.6 38.8 44.1
0
10
20
30
40
50
60
70
80
90
100
2005 2006 2007 2008 2009 YTDIPO Additional Listing
51.9 57.2
90.1
31.638.8 44.1

Slide 18
-59% -54% -58% -61% -60% -55%
67% 65% 68% 68% 71%
102%
-2%
2% 1% 2% 1%15%
-80%
-60%
-40%
-20%
0%
20%
40%
60%
80%
100%
120%MSCI World Dow S&P 500 Euro Stoxx MSCI Asia PSEi
October 2007 High to March 2009 Low March 2009 Low to Recent High YTD%
The Philippine Stock Market: Bull Market Continues
BULL
BEAR
As of August 10, 2010

Slide 19
The Philippine Stock Market: Global Markets Have Bounced-Off From Their Recent Lows PSEi: Weaker Correction And Stronger Recovery
Max.
Current
-17.4%
-13.3%-15.3%
-18.0%-14.9% -16.0% -16.0%
-19.7%
-14.7%
-8.1%-7.4%-5.1%
-7.6%-5.8%
-3.9%-7.3% -6.7% -5.4%
-17.6%
-13.7%
-3.1%
13.8%
-25.1% -26%-30%
-25%
-20%
-15%
-10%
-5%
0%
5%
10%
15%
20%
World Dow
S&P500
Euro Zone
Euro Stoxx
600 UK
MSCI Asia
Ex-Japa
n
Shangha
i
Shenze
n HK
Philippines
*as of August 5
Recent Correction and Recovery (April to July, July to date)

Slide 20
The Philippine Stock Market: PSEi First-Quarter Earnings Growth Of 56% Exceeded Market Expectations And Full-Year Forecast Of 17%
IndustryNumber of stocks
% index weightProfit growth
Reported Recurring
Telcos 2 23.7% 6% -7%
Banks 7 16.8% 25% 25%
Conglomerates 7 19.7% 314% 128%
Utilities 6 13.7% 221% 267%
Properties 6 13.3% 15% 14%
Consumer 5 3.9% 164% 72%
Media 2 1.8% 181% 120%
Resources 2 1.8% 50% 50%
Aggregate 37 94.6% 100% 56%
Aggregate ex-power 31 77.6% 26% 20%
Source: Philippine Equity Partners
2003 2004 2005 2006 2007 2008 2009 2010F
PSEiEarnings Growth (%)
30.8 14.7 16.7 14.8 Flat 4.0 17.0
Slide 21
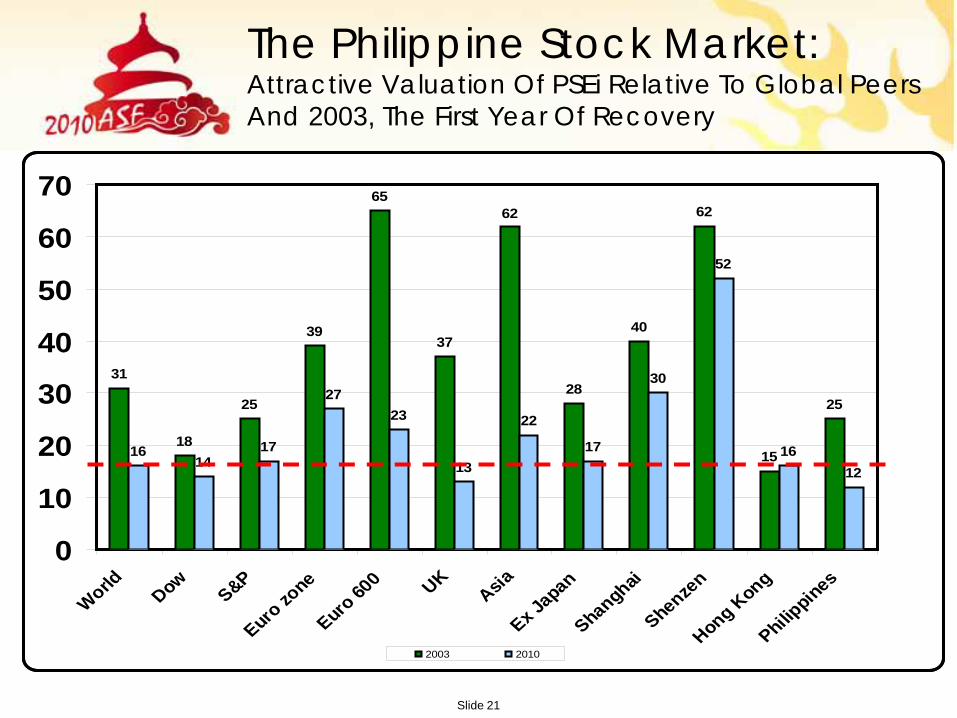
The Philippine Stock Market:Attractive Valuation Of PSEi Relative To Global Peers And 2003, The First Year Of Recovery
31
18
25
39
65
37
28
40
62
15
25
1614
17
2723
13
22
17
30
52
1612
62
0
10
20
30
40
50
60
70
World DowS&P
Euro zone
Euro 600 UK
Asia
Ex Japan
Shanghai
Shenzen
Hong Kong
Philippines
2003 2010

Slide 22
The Philippine Stock Market:PSEi Trading At 12x P/E, Still Among The Lowest In Asia
Global Market PEs
15 14
18
23
14 1412
11 10
21
26
17 1615 15 14 14
1211 10
0
5
10
15
20
25
30
Wor
ld
Dow
S&P
Euro
Sto
xx
Fran
ce
Italy
Germ
any
UK
Spai
n
MSC
I Asi
a
Japa
n
Indi
a
Indo
nesi
a
Taiw
an
Mal
aysi
a
Sing
apor
e
Hong
Kon
g
Phili
ppin
es
Sout
h Ko
rea
Thai
land
WorldUSEuropeAsia

Slide 23
2750
1685
The Philippine Stock MarketThe PSEi May Challenge 3800 By End 2010
3800
3300
2003: +42%
2004: +26%
2005: +15%
2006: +42%
2007: +21%
2008: -48%
2009: +63%
YTD: +15%
3500
Slide 24
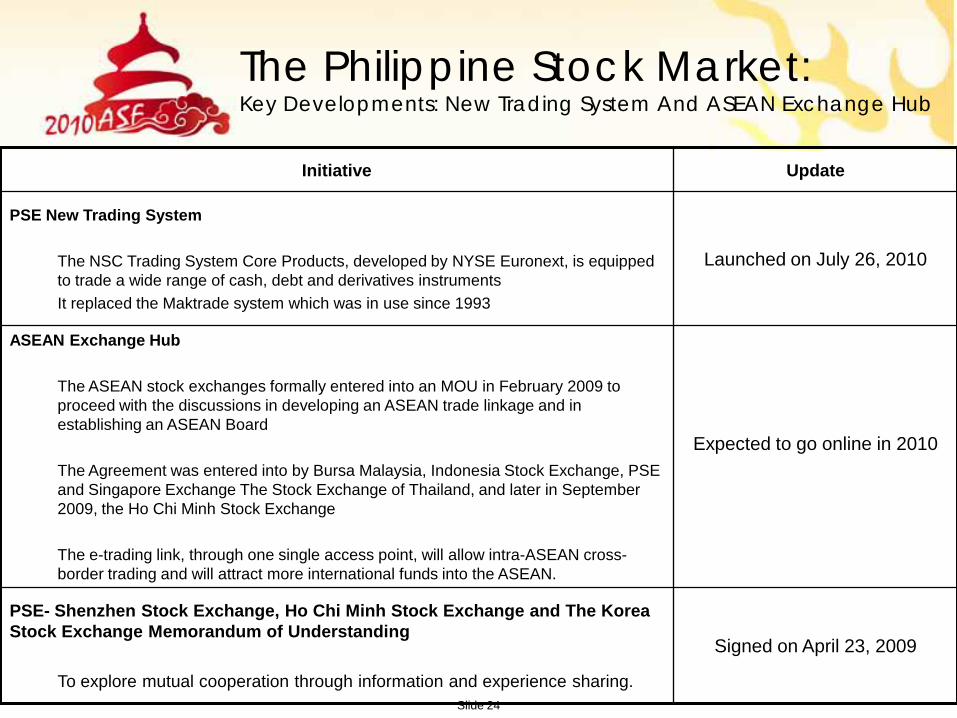
The Philippine Stock Market: Key Developments: New Trading System And ASEAN Exchange Hub
Initiative Update
PSE New Trading System
The NSC Trading System Core Products, developed by NYSE Euronext, is equipped to trade a wide range of cash, debt and derivatives instrumentsIt replaced the Maktrade system which was in use since 1993
Launched on July 26, 2010
ASEAN Exchange Hub
The ASEAN stock exchanges formally entered into an MOU in February 2009 to proceed with the discussions in developing an ASEAN trade linkage and in establishing an ASEAN Board
The Agreement was entered into by Bursa Malaysia, Indonesia Stock Exchange, PSE and Singapore Exchange The Stock Exchange of Thailand, and later in September 2009, the Ho Chi Minh Stock Exchange
The e-trading link, through one single access point, will allow intra-ASEAN cross-border trading and will attract more international funds into the ASEAN.
Expected to go online in 2010
PSE- Shenzhen Stock Exchange, Ho Chi Minh Stock Exchange and The Korea Stock Exchange Memorandum of Understanding
To explore mutual cooperation through information and experience sharing.
Signed on April 23, 2009

Slide 25
The Philippine Fixed Income Exchange

Slide 26
Phil. Dealing System Holdings Corp. (PDS)
TradingRegistry, Depository
and CustodyClearing and
Settlement Infrastructure
• Nomineeship & Trusteeship• Guardianship• Agency Function• Value Management• Centralized Collateral
Management
• National Payment Highway
• Information Highway• Multi-currency Facilities
• Price Transparencyand Discovery
• Trade execution• SRO
The Philippine Fixed Income ExchangeIntegrated And Diversified Products And Services
Designed to seamlessly link market activities from trading, clearing & settlement up to post-settlement disposition
Slide 27
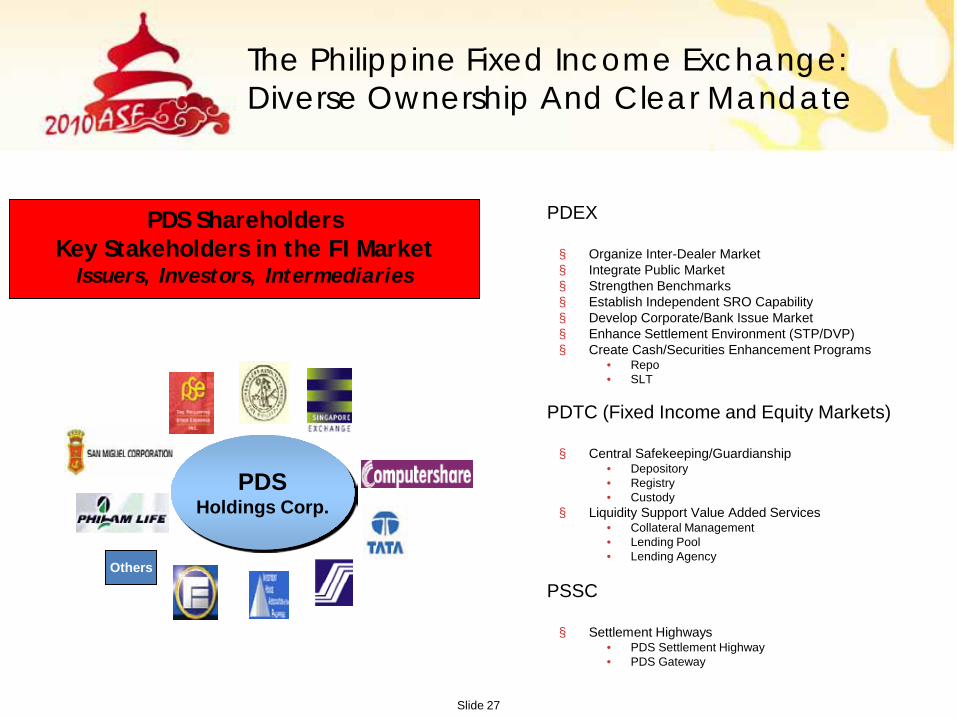
PDS Shareholders Key Stakeholders in the FI Market
Issuers, Investors, Intermediaries
Computershare
PDSHoldings Corp.
Banks
Investment Houses
PSE
SSSFINEX
Philam
SMC
Tata Consultancy
SGX
Others
The Philippine Fixed Income Exchange:Diverse Ownership And Clear Mandate
Ä PDEX
§ Organize Inter-Dealer Market§ Integrate Public Market§ Strengthen Benchmarks§ Establish Independent SRO Capability§ Develop Corporate/Bank Issue Market§ Enhance Settlement Environment (STP/DVP)§ Create Cash/Securities Enhancement Programs
• Repo• SLT
Ä PDTC (Fixed Income and Equity Markets)
§ Central Safekeeping/Guardianship• Depository• Registry• Custody
§ Liquidity Support Value Added Services• Collateral Management• Lending Pool• Lending Agency
Ä PSSC
§ Settlement Highways• PDS Settlement Highway• PDS Gateway

Slide 28
May 2010
Operation of US$
delivery versus
payment
August 2008Entry of
Cash Liquidity Facilities
through the Inter-
Professional Repo
Program
August 2008
Entry of private
debt issuers to the issuer
community
May 2010
Listing of US$ Gov’t Securities
June 2009
Launch of Fixed
Income Broker
Internet Order System
enabling real time
nationwide access to
the market
The Philippine Fixed Income Exchange:Building Market Infrastructure

Slide 29
The Philippine Fixed Income Exchange:High Growth Of Trading Volume
437.74787.40
1,564.04 1,567.95 1,769.211,296.69
160.55
58.41
367.39
651.85
382.65
100.00%
100.00%
100.00% 81% 69%75%
6%
3%
19%
25%
22%
0
500
1,000
1,500
2,000
2,500
3,000
2005 2006 2007 2008 2009 Year-to-June
Dealer Qualified Investor Broker
Volume 437.74 787.40 1,564.04 1,935.34 2,581.61 1,737.75
Growth 79.88% 98.63% 23.74% 33.39%
Ave. Daily Vol. 2.32 3.24 6.41 7.87 10.62 14.36
Turnover 0.4x 0.8x 1.3x 1.4x 1.7x 1.02x

Slide 30
0
20
40
60
80
100
120
140
160
180
June 2009 June 2010
AC
ALI
EDC
FLI
GLO
JGS
MBT
MEG
MWC
PSALM
RCB
RLC
SMB
The Philippine Fixed Income Exchange:Wave Of Corporate Bond IssuancesTotal Market Value Of Listed Corporate Securities Grew 362%
37.5 B
173.3 B June 2010 (PhpBn)
Share (%)
AC 16.0 9.2
ALI 4.0 2.3
MWC 4.0 2.3
MBT 18.5 10.7
GLO 5.0 2.9
RCB 16.0 9.2
SMB 38.8 22.4
MEG 5.0 2.9
EDC 12.0 6.9
RLC 10.0 5.8
FLI 5.0 2.9
PSALM 30.0 17.3
JGS 9.0 5.2
Total 173.3

Slide 31
Monthly Corporate Bond Trade Volume
0
1,000
2,000
3,000
4,000
5,000
6,000
7,000
8,000
9,000
10,000
2009 Jan Feb Mar Apr May Jun
AC
ALI
EDC
FLI
GLO
JGS
MBT
MEG
MWC
PSALM
RCB
RLC
SMB
The Philippine Fixed Income Exchange:Ten-fold Increase In Trading Volume Of Corporate Bonds
8,843
967752
226
5,054
YTD Corporate Bond Volume (PhpMn)
AC 467.69 2.23%
ALI 150.00 0.72%
EDC 1,176.69 5.62%
FLI 19.30 0.09%
GLO 95.88 0.46%
JGS 4.68 0.02%
MBT 141.64 0.68%
MEG 1.00 0.00%
MWC 2.45 0.01%
PSALM 17,567.40 83.87%
RCB 71.40 0.34%
RLC 23.10 0.11%
SMB 1,224.77 5.85%20,945.99
5,104
2,205
Slide 32
Capital Market Trends And Regulatory Policy

Slide 33
Capital Market Trends: New Products
Initiative Update
Personal Equity Retirement Account (PERA)
Promotes voluntary long-term savings, through investments in PERA products designed to be locked for at least 5 years until retirement age of investor
Signed into law on August 22, 2008
IRR approved on October 21, 2009 by BSP, SEC and DoF and BIR
Council private sector members submitted comments on the draft Revenue Regulations
Feasibility Study of Equity Derivatives Trading
Engaged CBM Group, Inc. to develop a strategic plan to introduce derivatives and commodities trading on the PSEThe results of the study showed potential for developing a derivatives market in the Philippines particularly for index-based futures. The study also revealed, however, that the tax structure for trading for derivatives products needs to be reviewed.
Concluded in 2009
Exchange-Traded Fund Listing Rules
Will allow local and foreign ETFs, with minimum asset size of P250m and $10m, respectively, to list on the PSE
Approved by the PSE on April 2008 and submitted to the SEC for approval
Real Estate Investment Trust (REIT)
Seeks to provide a legal and regulatory framework and create a favorable market environment for real estate investment companies The REIT Act of 2009 requires REITs to list its shares on the PSE. The REIT must distribute 90% of its income as dividends to avail of tax incentives
Lapsed into Law on December 17, 2009; Implementing Rules and Regulations issued by SEC on May 13, 2010; Awaiting BIR Implementing Rules and Regulations

Slide 34
Capital Market Trends: Regulatory Policy
Initiative Update
Abolition of Documentary Stamp Tax on Secondary Trading
Permanently exempts stock trades through the PSE from the Documentary Stamp Tax (P0.75 per P200 par), with retroactive effect to March 20, 2009
Signed into law on June 30, 2009
Spin-off of Market Regulation Division
The PSE Board approved the spin-off of the Market Regulation Division into a wholly-owned and self-regulatory company to be known as Philippine Securities Regulation Company, Inc. that will monitor the activities of trading participants.
Approved by PSE Board on May 28, 2010

Slide 35
Capital Market Trends: New Legislation
Initiative UpdateFinancial Rehabilitation and Insolvency Act (FRIA)
Aims to update the outdated legal framework of insolvency proceedings under the Insolvency Law of 1909. The law provides financially distressed companies with four different remedies: 1) Court-supervised rehabilitation 2) Pre-packaged Rehabilitation 3) Out-of-court or informal restructuring agreement 4) Liquidation
Adopted by Congress on February 2, 2010
Credit Information System Act (CISA)
Aimed at establishing a comprehensive credit information system, allowing financial institutions ready access to accurate and up-to-date credit information thru the proposed Central Credit Information Corporation
Signed into law on October 31, 2008; Implementing Rules and Regulations for Approval by Congress
Collective Investments Schemes Law (CISL) formerly referred to as the Revised Investment Company Act (RICA)
Seeks to institute reforms in the domestic investment company industry, including mutual funds and aims to establish a comprehensive regulatory framework to enable investment companies to play a key role in capital formation
Joint Committee meetings/hearings were conducted on April 16, 2009 and May 19, 2009
No bill filed at House of Representatives
Financial Sector Taxation Reform (Fin Tax)
Meant to rationalize taxation to level the playing field as regards applicable tax on similar financial instruments offered by different financial institutions, thereby avoiding tax arbitrage
Legislative Committee report under preparation

Slide 36
End Of Presentation
Thank You!