phenotyping root activity and its dependence on soil water
TRANSCRIPT

1
Rony Wallach
The R.H. Smith Faculty of Agriculture, Food and Environment
Dept. of Soil and Water Sciences
The Hebrew University of Jerusalem, Israel
Phenotyping Root Activity and its Dependence on Soil Water Availability

From: Lobet et al. (2014)
• The fundamental mechanism of water flow in
plants has been described for many years.
• The diffusion of vapor through stomata leads
to the evaporation of water from the surface
of inner leaf tissues and an increase of tension
in the xylem that propagates to each root
segment following the cohesion-tension
principle.
• Where this tension is higher than the
surrounding soil, it induces an inflow of water
from the rhizosphere, following paths of low
soil hydraulic resistance.
• How far plants are able to sustain their leaf
water demand is therefore largely dependent
on the hydraulic properties of the soil-root
system – soil-water availability.
Introduction

• The root systems play a key role by providing water from the soil, which sustains the
transpiration flux and by sending hydraulic and hormonal signals to regulate stomata
• conductance.
• The root system adjusts the spatial and temporal distribution of soil-water uptake
according to local changes in soil water availability.
• Quantitative approaches to evaluate the dependence of water loss to the atmosphere
on soil water availability for time-dependent ambient conditions are still lagging
behind.
• Most phenotyping methods that deal with plants response to abiotic stress focus
mostly on the traits of the upper part of the plant.
Soil-water availability
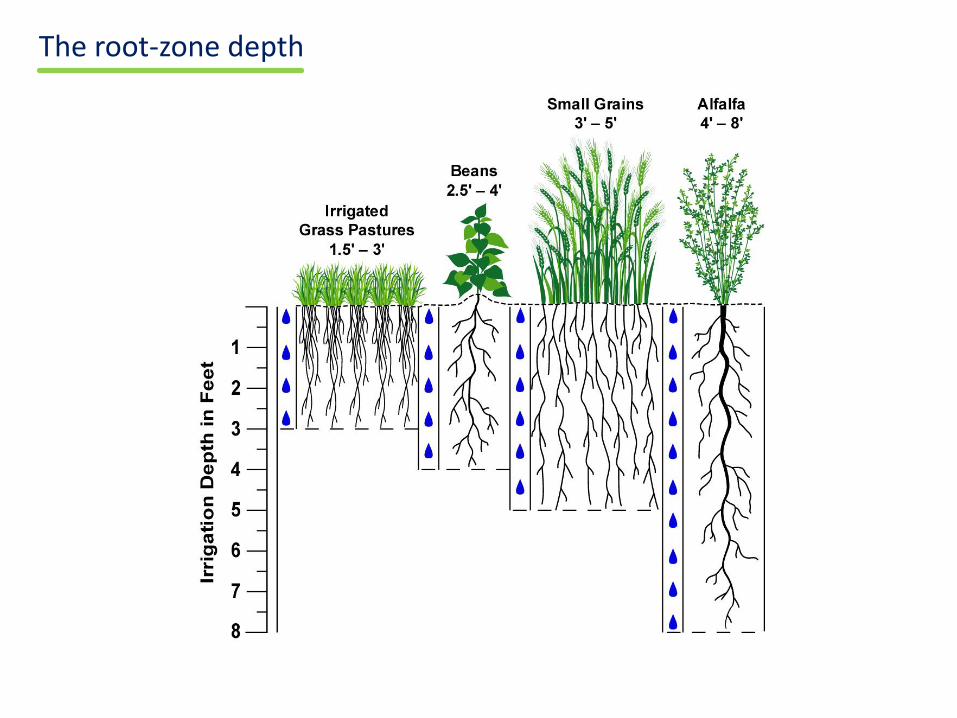
The root-zone depth
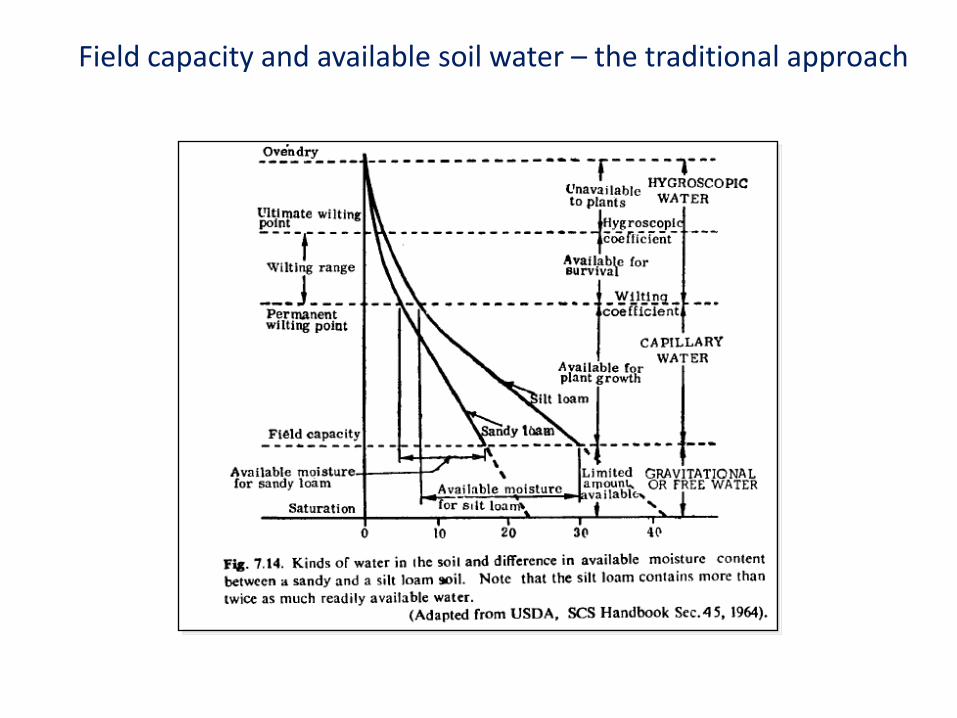
Field capacity and available soil water – the traditional approach

Water Suction, h (kPa)
Wa
ter
Co
nte
nt,
(
cm
3.c
m-3
)
0.0
0.2
0.4
0.6
0.8
1.0
secondary wetting
secondary drying
0.0
0.2
0.4
0.6
0.8
1.0
primary wetting
main drying
0 10 20 30 40 50
0.0
0.2
0.4
0.6
0.8
1.0
tertiary drying
tertiary wetting
Calculating K(h) by VG
0 10 20 30 40 50
10-9
10-8
10-7
10-6
10-5
10-4
10-3
10-2
10-1
100
101
Hyd
rau
lic C
on
du
ctivity,
K (
cm
. min
-1)
Water Suction, h (kPa)
10-9
10-8
10-7
10-6
10-5
10-4
10-3
10-2
10-1
100
101
secondary wetting
secondary drying
10-9
10-8
10-7
10-6
10-5
10-4
10-3
10-2
10-1
100
101
main drying
primary wetting
tertiary drying
tertiary wetting
Soil characteristic curves

7
The four stages in sensors output between subsequent irrigations
65
A1 A2 A4A3A5
B1 B2 B4B3B5
C5 C3 C1 C2 C4
D1
E1
25 15 5 5 15 25
Distance from the row (cm)
95
Soil surface
Drip lineSte
m
TDR sensor5
20
35D
epth
(cm
)
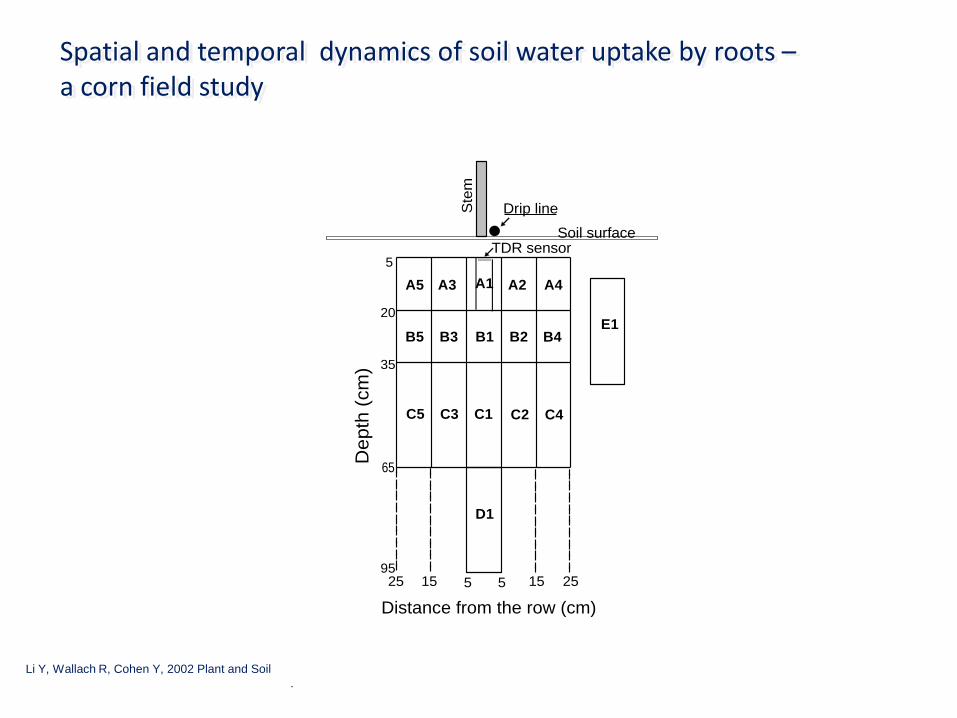
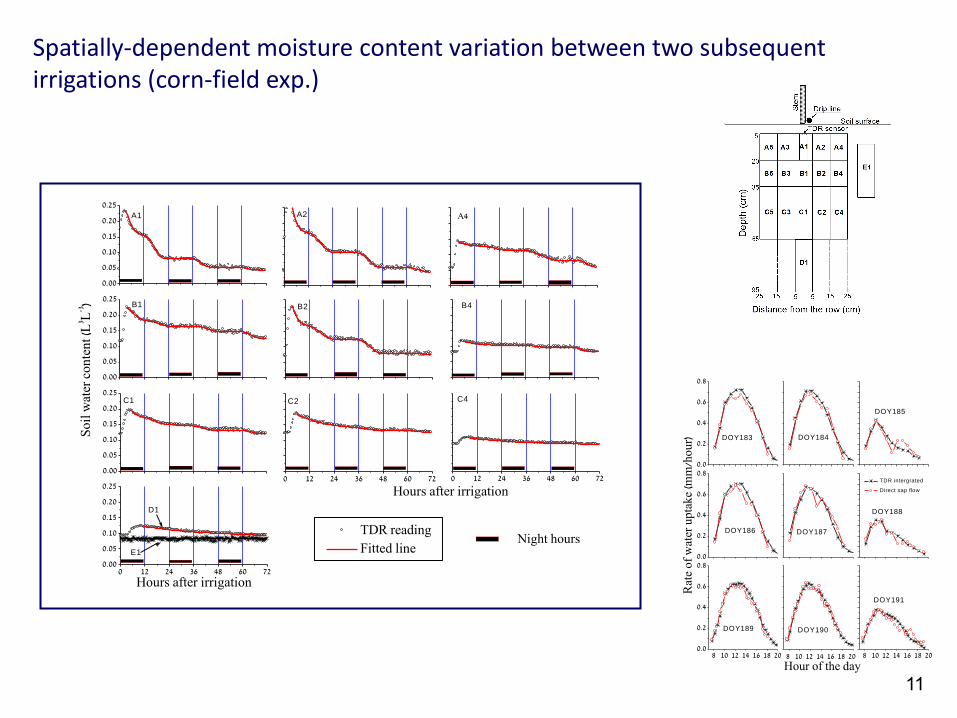
Spatial and temporal dynamics of soil water uptake by roots – a corn field study
Li Y, Wallach R, Cohen Y, 2002 Plant and Soil
.

9
The corn field experiment
Site: Faculty of Agriculture Research Station, Rehovot, Israel.
Soil: Rehovot Sand having 1% organic content,
70% fine sand, 15 % coarse sand, 10 % silt,
5% clay.
Plant: Sweet corn (density of 8 m-2).
Irrigation: Auto controlled drip irrigation with drippers
every 25 cm. Drip line at each row.
Scheduling: Every 3 days.
10
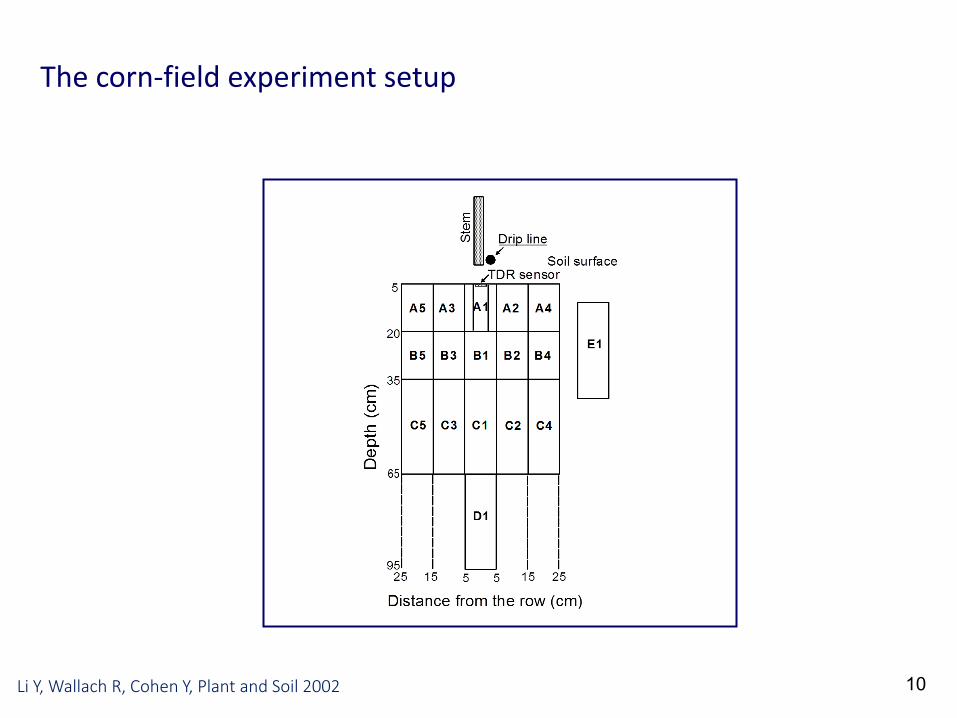
The corn-field experiment setup
Li Y, Wallach R, Cohen Y, Plant and Soil 2002
0.00
0.05
0.10
0.15
0.20
0.25
A1
Soi
l wat
er c
onte
nt (L
3 L-3
)
A4
0.00
0.05
0.10
0.15
0.20
0.25
B1
B4
0.00
0.05
0.10
0.15
0.20
0.25
C1
0 12 24 36 48 60 72
Night hours
C4
A2
B2
0 12 24 36 48 60 72
TDR reading
Fitted line
C2
0 12 24 36 48 60 720.00
0.05
0.10
0.15
0.20
0.25
Hours after irrigation
E1
D1
Hours after irrigation
11
Spatially-dependent moisture content variation between two subsequent irrigations (corn-field exp.)
0.0
0.2
0.4
0.6
0.8
DOY183
DOY184
TDR intergrated
Direct sap flow
DOY185
0.0
0.2
0.4
0.6
0.8
DOY186
Rat
e o
f w
ater
up
tak
e (m
m/h
ou
r)
DOY187
DOY188
8 10 12 14 16 18 200.0
0.2
0.4
0.6
0.8
DOY189
8 10 12 14 16 18 20
DOY190
Hour of the day8 10 12 14 16 18 20
DOY191
12
180 182 184 186 188 190 1920.00
0.04
0.08
0.12
0.16
0.20
0.05-0.20m 0.20-0.35m 0.35-0.65mSo
il w
ater
co
nte
nt (
L3 L
-3)
DOY
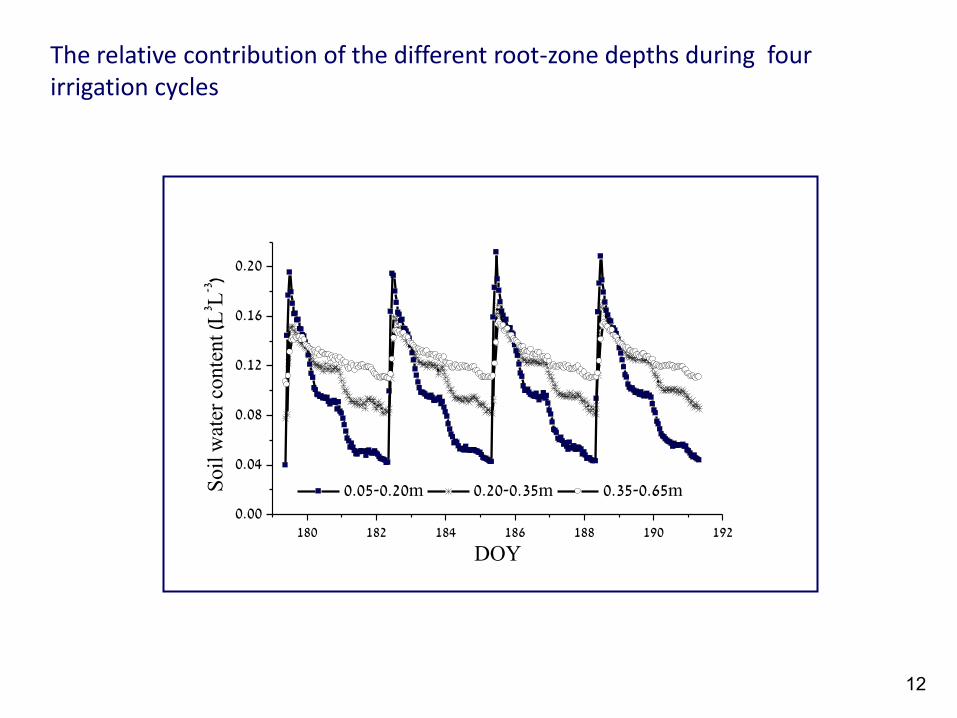
The relative contribution of the different root-zone depths during four irrigation cycles

0.000
0.002
0.004
0.006
0.008
A1
A4
B2
B4
0.000
0.002
0.004
0.006
0.008
C1
0 12 24 36 48 60 72
Night hours
C4
Hours after irrigation
0.000
0.002
0.004
0.006
0.008
B1
Wat
er l
oss
rat
e (L
3 L-3
, 30m
in)
A2
0 12 24 36 48 60 72
Net water loss cross the cell boundary
Root uptake plus net water loss
C2
0 12 24 36 48 60 720.000
0.002
0.004
0.006
0.008
D1
Hours after irrigation
13
Soil moisture depletion rate by redistribution and root extraction within the bounds of the different grid cells
1 2 31 2 30.0
0.2
0.4
0.6
0.8
0.0
0.2
0.4
0.6
0.8
35-65 cm TDR
DAYS AFTER IRRIGATION
20-35 cm TDR
WA
TE
R U
PT
AK
E R
AT
E (
mm
/h) 5-20 cm TDRSap flow : Heat pulse
1 2 31 2 30.0
0.2
0.4
0.6
0.8
0.0
0.2
0.4
0.6
0.8
1 2 31 2 30.0
0.2
0.4
0.6
0.8
0.0
0.2
0.4
0.6
0.8
35-65 cm TDR
DAYS AFTER IRRIGATION
20-35 cm TDR
WA
TE
R U
PT
AK
E R
AT
E (
mm
/h) 5-20 cm TDRSap flow : Heat pulse
14
1 2 30.0
0.2
0.4
0.6
0.8
1.0
Rel
ativ
e ef
fect
iven
ess
of t
he
root
s
Days after irrigation
1st
layer
2nd
layer
3rd
layer
1 2 30.0
0.2
0.4
0.6
0.8
1.0
Rel
ativ
e ef
fect
iven
ess
of t
he
root
s
Days after irrigation1 2 3
0.0
0.2
0.4
0.6
0.8
1.0
Rel
ativ
e ef
fect
iven
ess
of t
he
root
s
Days after irrigation
1st
layer
2nd
layer
3rd
layer
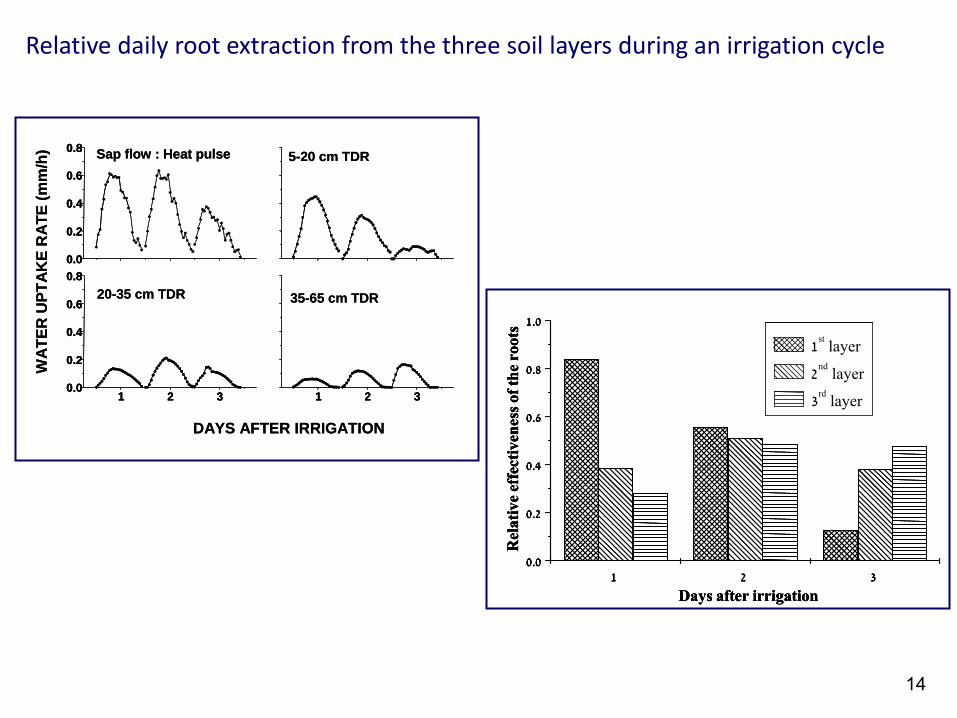
Relative daily root extraction from the three soil layers during an irrigation cycle

The PlantArray Platform
http://www.plant-ditech.com/
SPAC analytics software
(a)
No
rmal
ized
wei
ght
Time, days
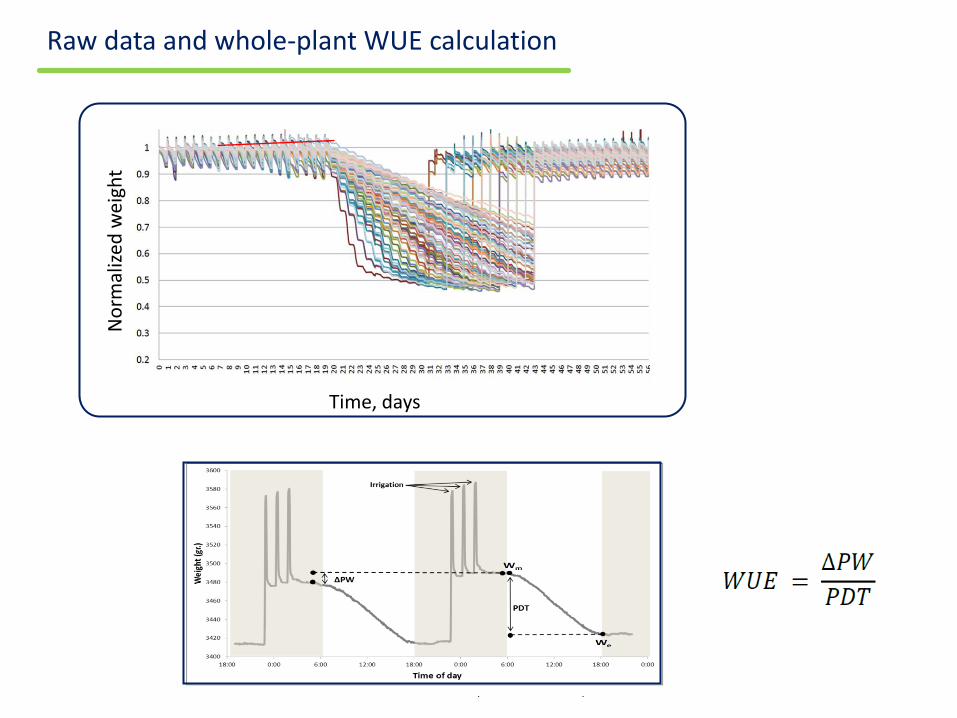
Raw data and whole-plant WUE calculation

Halperin et al., The Plant J. 2016
A plot of the midday transpiration vs. soil water content provides the dependence of transpiration rate on actual soil-water content.
Variation in different whole-plant parameters during optimal water supply followed by drought.
Does SWC can be used for soil water availability estimation?

Determining the soil water availability
max
max
( )cr
cr cr
E ; E
E b ;

Moshelion et al., PCE, 2015
Using a simple control theory concept
Where G is the transfer function representing the processes taking place within the plant.
G
max
max
( )cr
cr cr
E ; E
E b ;
anisohydric isohydric

The “dynamic soil water availability” concept
Halperin et al., The Plant J. 2016
The dependence of mid-day transpiration rate on the balance between atmospheric demand and soil water availability
Sum
mer
W
inte
r
SWCcr
SWCcr
E m
ax
(mm
ol
sec-1
m-2
)
E m
ax
(mm
ol
sec-1
m-2
)
SW
Ccr
(%)
0
10
20
30
E
(mm
ol
sec-1
m-2
)
M82
MP1
020406080
0
2
4
6
SWC (%)
cr
cr
E m
ax
(mm
ol
sec-1
m-2
)

21
TDR probes
TDR
Datalogger
CR10
Tensiometer
Load cell
Tipping bucket
Pot experiment that includes tensiomenter and TDR probes

22
T1 (wet treatment)
12.5
13.0
13.5
14.0
11/08/00
0:00
12/08/00
0:00
13/08/00
0:00
14/08/00
0:00
15/08/00
0:00
16/08/00
0:00
17/08/00
0:00
Co
nta
ine
r w
eig
ht [k
g]
T3 (dry treatment)
12.0
12.5
13.0
13.5
11/08/00
0:00
12/08/00
0:00
13/08/00
0:00
14/08/00
0:00
15/08/00
0:00
16/08/00
0:00
17/08/00
0:00
Co
nta
ine
r w
eig
ht [k
g]
Container-weight variation – frequent (T1) and less-frequent (T3) irrigations
23
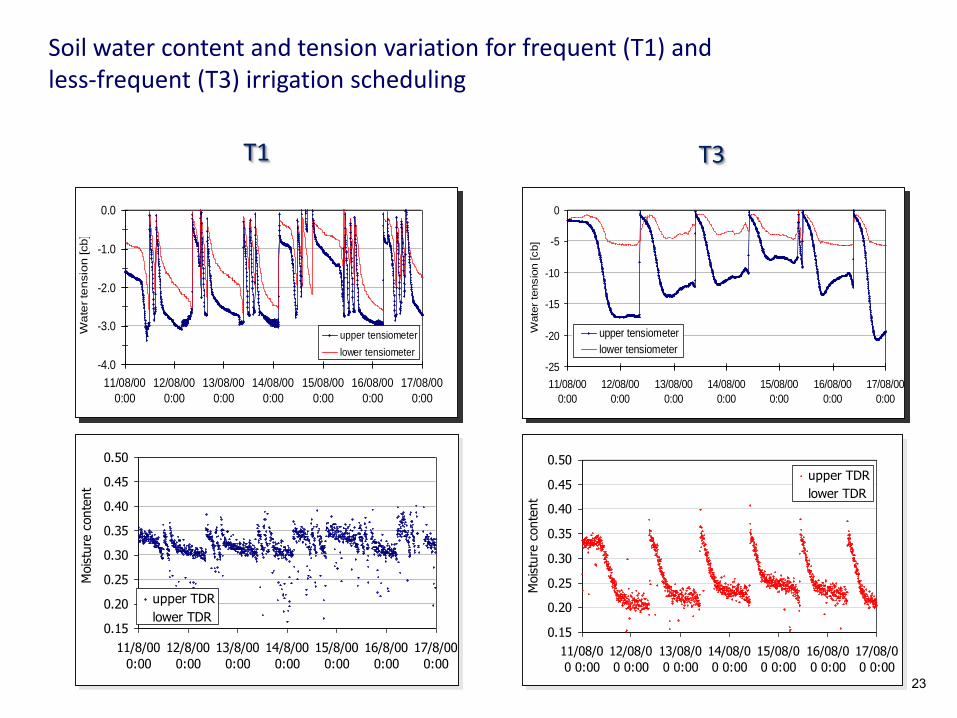
Soil water content and tension variation for frequent (T1) and less-frequent (T3) irrigation scheduling
-25
-20
-15
-10
-5
0
11/08/00
0:00
12/08/00
0:00
13/08/00
0:00
14/08/00
0:00
15/08/00
0:00
16/08/00
0:00
17/08/00
0:00
Wate
r te
nsio
n [cb]
upper tensiometer
lower tensiometer
-4.0
-3.0
-2.0
-1.0
0.0
11/08/00
0:00
12/08/00
0:00
13/08/00
0:00
14/08/00
0:00
15/08/00
0:00
16/08/00
0:00
17/08/00
0:00
Wa
ter
ten
sio
n [cb
]
upper tensiometer
lower tensiometer
0.15
0.20
0.25
0.30
0.35
0.40
0.45
0.50
11/8/00
0:00
12/8/00
0:00
13/8/00
0:00
14/8/00
0:00
15/8/00
0:00
16/8/00
0:00
17/8/00
0:00
Mois
ture
conte
nt
upper TDR
lower TDR0.15
0.20
0.25
0.30
0.35
0.40
0.45
0.50
11/08/0
0 0:00
12/08/0
0 0:00
13/08/0
0 0:00
14/08/0
0 0:00
15/08/0
0 0:00
16/08/0
0 0:00
17/08/0
0 0:00
Mois
ture
conte
nt
upper TDR
lower TDR
T1 T3

T3 lower and upper tensiometers and TDR probes on Aug 16 00
0
0.1
0.2
0.3
0.4
0.5
0.6
0 2 4 6 8 10 12 14 16 18 20
Water tension [cb]
Wa
ter
co
nte
nt
T3 lower and upper tensiometers and TDR probes on Aug 16 00
0
0.1
0.2
0.3
0.4
0.5
0.6
0 2 4 6 8 10 12 14 16 18 20
Water tension [cb]
Wa
ter
con
ten
t
T1 lower and upper tensiometers and TDR probes, Aug 16 00
0.1
0.2
0.3
0.4
0.5
0.6
0 1 2 3 4 5
Water tension [cb]
Wa
ter
co
nte
nt
T1 lower and upper tensiometers and TDR probes, Aug 16 00
0.1
0.2
0.3
0.4
0.5
0.6
0 1 2 3 4 5
Water tension [cb]
Wa
ter
co
nte
nt
upper TDR & tens.
T3 lower and upper tensiometers and TDR probes, Aug 15 00
0
0.1
0.2
0.3
0.4
0.5
0.6
0 2 4 6 8 10 12 14
Water tension [cb]
Wa
ter
co
nte
nt
T3 lower and upper tensiometers and TDR probes, Aug 15 00
0
0.1
0.2
0.3
0.4
0.5
0.6
0 2 4 6 8 10 12 14
Water tension [cb]
Wa
ter
co
nte
nt
lower TDR & tens. upper TDR & tens.
Short- and long-term measured RCs
lower TDR & tens.
upper TDR & tens.
T1 lower and upper tensiometers and TDR probes, Aug 15 00
0.1
0.2
0.3
0.4
0.5
0.6
0 1 2 3 4 5
Water tension [cb]
Wa
ter
co
nte
nt
T1 lower and upper tensiometers and TDR probes, Aug 15 00
0.1
0.2
0.3
0.4
0.5
0.6
0 1 2 3 4 5
Water tension [cb]
Wa
ter
co
nte
nt
lower TDR & tens.
upper TDR & tens.
Short- and long-term measured RCs
lower TDR & tens.
upper TDR & tens.
Short- and long-term measured RCs
In-situ measured vs. lab-measured (h) dependence on watering frequency (T1 and T3)

T3 lower and upper tensiometers and TDR probes on Aug 16 00
0
0.1
0.2
0.3
0.4
0.5
0.6
0 2 4 6 8 10 12 14 16 18 20
Water tension [cb]
Wa
ter
co
nte
nt
T3 lower and upper tensiometers and TDR probes on Aug 16 00
0
0.1
0.2
0.3
0.4
0.5
0.6
0 2 4 6 8 10 12 14 16 18 20
Water tension [cb]
Wa
ter
con
ten
t
T1 lower and upper tensiometers and TDR probes, Aug 16 00
0.1
0.2
0.3
0.4
0.5
0.6
0 1 2 3 4 5
Water tension [cb]
Wa
ter
co
nte
nt
T1 lower and upper tensiometers and TDR probes, Aug 16 00
0.1
0.2
0.3
0.4
0.5
0.6
0 1 2 3 4 5
Water tension [cb]
Wa
ter
co
nte
nt
upper TDR & tens.
T3 lower and upper tensiometers and TDR probes, Aug 15 00
0
0.1
0.2
0.3
0.4
0.5
0.6
0 2 4 6 8 10 12 14
Water tension [cb]
Wa
ter
co
nte
nt
T3 lower and upper tensiometers and TDR probes, Aug 15 00
0
0.1
0.2
0.3
0.4
0.5
0.6
0 2 4 6 8 10 12 14
Water tension [cb]
Wa
ter
co
nte
nt
lower TDR & tens. upper TDR & tens.
Short- and long-term measured RCs
lower TDR & tens.
upper TDR & tens.
T1 lower and upper tensiometers and TDR probes, Aug 15 00
0.1
0.2
0.3
0.4
0.5
0.6
0 1 2 3 4 5
Water tension [cb]
Wa
ter
co
nte
nt
T1 lower and upper tensiometers and TDR probes, Aug 15 00
0.1
0.2
0.3
0.4
0.5
0.6
0 1 2 3 4 5
Water tension [cb]
Wa
ter
co
nte
nt
lower TDR & tens.
upper TDR & tens.
Short- and long-term measured RCs
lower TDR & tens.
upper TDR & tens.
Short- and long-term measured RCs
In-situ measured vs. lab-measured (h) dependence on watering frequency (T1 and T3)

T1 on August 15 2000 (from irrigation event to midnight)
y = 0.1076x - 1.0958
R2 = 0.8887
y = 0.158x - 1.6881
R2 = 0.9285
0.15
0.20
0.25
0.30
0.35
0.40
12.012.212.412.612.813.0
Container weight [kg]
Wa
ter
con
ten
t
lower TDR probe
upper TDR probe
T1 for August 16 00 (from 10:10 to midnight)
y = 0.1072x - 1.091
R2 = 0.8794
y = 0.1681x - 1.8174
R2 = 0.9554
0.15
0.20
0.25
0.30
0.35
0.40
12.012.212.412.612.813.0
Container weight [kg]
Wa
ter
co
nte
nt
lower TDR probe
upper TDR probe
Moisture depletion vs. change in container weight for less-frequent
irrigations (two successive days)