phenotypic and microrna transcriptomic profiling of … and microrna transcriptomic ... wan yong...
TRANSCRIPT

Submitted 21 November 2016Accepted 16 June 2017Published 13 July 2017
Corresponding authorHan Kiat Ong, [email protected]
Academic editorMaría Ángeles Esteban
Additional Information andDeclarations can be found onpage 21
DOI 10.7717/peerj.3551
Copyright2017 Boo et al.
Distributed underCreative Commons CC-BY 4.0
OPEN ACCESS
Phenotypic and microRNA transcriptomicprofiling of the MDA-MB-231 spheroid-enriched CSCs with comparison of MCF-7 microRNA profiling datasetLily Boo1, Wan Yong Ho2, Norlaily Mohd Ali1, Swee Keong Yeap3, Huynh Ky4,Kok Gan Chan5, Wai Fong Yin5, Dilan Amila Satharasinghe6, Woan Charn Liew7,Sheau Wei Tan7, Soon Keng Cheong1,8 and Han Kiat Ong1
1 Faculty of Medicine and Health Sciences, Universiti Tunku Abdul Rahman, Cheras, Selangor, Malaysia2Department of Biomedical Sciences, University of Nottingham, Semenyih, Selangor, Malaysia3Xiamen University Malaysia, Sepang, Selangor, Malaysia4Department of Genetics and Plant Breeding, Cantho University, Cantho, Vietnam5Division of Genetics and Molecular Biology, University of Malaya, Kuala Lumpur, Malaysia6 Faculty of Veterinary Medicine and Animal Science, University of Peradeniya, Peradeniya, Central, Sri Lanka7 Institute of Bioscience, Universiti Putra Malaysia, UPM Serdang, Selangor, Malaysia8Cryocord Sdn Bhd, Cyberjaya, Selangor, Malaysia
ABSTRACTBreast cancer spheroids have been widely used as in vitro models of cancer stem cells(CSCs), yet little is known about their phenotypic characteristics and microRNAs(miRNAs) expression profiles. The objectives of this research were to evaluate thephenotypic characteristics of MDA-MB-231 spheroid-enriched cells for their CSCsproperties and also to determine their miRNAs expression profile. Similar to ourpreviously published MCF-7 spheroid, MDA-MB-231 spheroid also showed typicalCSCs characteristics namely self-renewability, expression of putative CSCs-relatedsurface markers and enhancement of drug resistance. From the miRNA profile, miR-15b, miR-34a, miR-148a, miR-628 and miR-196b were shown to be involved in CSCs-associated signalling pathways in both models of spheroids, which highlights theinvolvement of these miRNAs in maintaining the CSCs features. In addition, uniqueclusters of miRNAs namely miR-205, miR-181a and miR-204 were found in basal-likespheroid whereasmiR-125,miR-760,miR-30c andmiR-136were identified in luminal-like spheroid. Our results highlight the roles of miRNAs as well as novel perspectivesof the relevant pathways underlying spheroid-enriched CSCs in breast cancer.
Subjects Cell Biology, Molecular Biology, Translational MedicineKeywords Breast cancer, Cancer stem cells, MDA-MB-231, Next generation sequencing,Triple-negative breast cancer cells, MicroRNA, Spheroid culture
INTRODUCTIONThere has been a substantial amount of evidence indicating that tumours contain a groupof self-renewing cancer cells known as cancer stem cells (CSCs) which are responsiblefor tumour initiation, progression, and metastasis (Chen, Huang & Chen, 2013). Cancertherapies are clinically focused on eradicating the overall cancer cell population, rather
How to cite this article Boo et al. (2017), Phenotypic and microRNA transcriptomic profiling of the MDA-MB-231 spheroid-enrichedCSCs with comparison of MCF-7 microRNA profiling dataset. PeerJ 5:e3551; DOI 10.7717/peerj.3551

than the CSCs population, which often resulted in high recurrence as CSCs have shown tobe highly resistant to chemotherapy. Therefore, understanding the underlying biology andmolecular mechanisms of CSCs would be of paramount importance in revolutionizingcancer therapies.
Over the past years, the challenge in CSCs research is isolating a pure population ofCSCs as compelling evidences have shown that CSCs were estimated to be only 0.001–0.1%(Visvader & Lindeman, 2008) of isolated tissues, suggesting the heterogeneous complexityof the tumours. Although numerous methods have been proposed in order to isolateand expand the cells to the sufficient amount feasible for research use, these methodscomes with their own challenges. The most common approach would be cell sorting usingflow cytometry technology based on cell surface markers specifically targeting the CSCspopulations from the rest of the non-CSCs populations (Duan et al., 2013). Nevertheless,identification of CSCs based on surface markers is difficult as there is not a single markerwhich would be sensitive and specific enough to define the actual CSCs populations. Theuse of ALDEFLOUR assay, a stem cell marker based on enzymatic activity of ALDH1 wasproposed to be the next reliable tool to isolate CSCs from tumour(Croker et al., 2009).Nonetheless, this approach is not recommended as a standalone assay as it requires othermarker combinations to further separate the CSCs populations from the tumour. Takentogether, more useful and effective assays are needed to culture CSCs population subtypes.
Previous studies have demonstrated the successful application of spheroid formationtechnique in isolating, enriching, and expanding putative CSCs subset from a rangeof cancer cell lines and cancer tissues which provided a potential model towards thedevelopment of targeted therapies to study CSCs in vitro (Cao et al., 2011; Fang et al., 2005).The CSCs population enriched in serum-free culture condition favoured their expansionwhile the rest of non-CSCs population undergo anoikis. The significance of enrichingCSCs in multicellular spheroids has been supported by a pre-clinical study that indicatedsuch spheroid-enriched cells as a feasible CSCs model to elucidate the chemopreventionproperties of sulforaphane in breast cancer treatment (Li et al., 2010). In breast cancerresearch, this technique appeared to be more reliable and useful tool to select and expandCSCs populations in manner sufficient for its use in functional studies. Additionally,the conventional two-dimensional (2D) monolayer cultures commonly used to maintainand expand cancer cells have often showed loss of tumour function (Kim, Stein & OH,2004) whereas three-dimensional (3D) culture that recapitulates the in vivo solid tumourbiology has been the more favourable culture choice of demonstrating the overall featuresof the cancer cells (Ho et al., 2012; Pickl & Ries, 2008). However, despite the numerousfunctional studies on the response of these spheroid models in drug resistance therapies,little is known about the underlying mechanisms of the breast cancer spheroid CSCs.
Breast cancer can be divided into a few subtypes with regards to their molecularcharacteristics in which luminal and basal type being the two most commonly studied.MCF-7 cells, a luminal type is non-metastatic whereas MDA-MB-231 cells, which lacks ofthe three breast receptors (ER, PR and HER2), are regarded as highly aggressive (Kao etal., 2009). Cell lines are commonly used to model breast cancer in vivo as they are easilyaccessible, reliable, and less problematic compared to the primary culture of tumours.
Boo et al. (2017), PeerJ, DOI 10.7717/peerj.3551 2/27

Moreover, transcriptomic features of breast cancer cell lines were found to be similar totheir respective tumours, suggesting the clinical usage of these cell lines in breast cancerresearch (Vincent, Findlay & Postovit, 2015).
MicroRNAs (miRNAs), a class of short noncoding RNAs that has been known as animportant class of molecules regulating gene expressions (Stefanie, Eric & Caldas, 2008).The gene regulatory molecules are responsible for a wide range of diseases includingoncogenesis and are therefore proposed to be promising biomarkers or act as therapeutictargets (Mishra, 2014). Consequently, miRNAs profiling has been carried out extensivelyto identify cancer-specific miRNAs signatures in various cancers (Murakami et al., 2014;Nygaard et al., 2009;Wyman et al., 2009). In our recent published work, we have identifiedthe miRNAs of luminal MCF-7 spheroid-enriched CSCs, with some miRNAs which havenot been previously associated with breast cancer (Boo et al., 2016). In this work, we firstshowed that the basal cell line,MDA-MB-231 formed spheroids and demonstrated differentCSCs features compared to MCF-7 spheroids. MiRNA-NGS analysis on the MDA-MB-231spheroids were also conducted and compared with the miRNA profiling against MCF-7spheroids to investigate the roles of miRNAs in the spheroid-enriched CSCsmodels derivedfrom these two breast cancer subtypes. Though MCF-7 and MDA-MB-231 belong to twodistinct subtypes, they could be sharing some similar miRNAs cluster possibly linking tothe molecular characteristics of spheroid CSCs. We then focused our attention on theirgene annotations of the differentially expressed miRNAs-targets and pathways inferredusing bioinformatics tools. Collectively, this study provides potentially new miRNAsmarkers to target breast CSCs via comparison of the miRNAs profiling of the two breastspheroid-enriched subtypes.
MATERIALS AND METHODSCell culture, spheroid formation assay and SEM analysis ofMDA-MB-231The estrogen-independent human breast adenocarcinoma MDA-MB-231 was purchasedfrom American Type Culture Collection (ATCC) (Catalog no. HTB-26). The cell line wasmaintained as monolayer at 37 ◦C under a 5% humidified CO2 atmosphere in Roswell ParkMemorial Institute (RPMI)-1640 medium supplemented with 10% heat-inactivated fetalbovine serum. Spheroid cells were generated in a serum-free environment according to ourpublished method (Boo et al., 2016). To analyse the surface ultrastructures of the generatedspheroids, SEM analysis was performed following the standard sample preparation protocolbut with additional centrifugation at each step to minimise sample loss. The specimenswere then mounted, critically point dried and sputtered gold coated before viewed using aSEM (JSM-6400; JEOL, Tokyo, Japan).
Secondary spheroids and single cell formation assayThe formed spheroids were then collected, pooled by centrifugation, and then enzymaticallydissociated into single cells with Accutase (GIBCO, Gaithersburg, MD, USA). The resultedsingle cells were then sieved through a 40 µm strainer before seeded at 200 cells per well in
Boo et al. (2017), PeerJ, DOI 10.7717/peerj.3551 3/27

96-well agar-coated dishes in 100 µL of serum-free growth medium. The sphere formingefficiency (SFE) was then evaluated based on the sphere formation rate over a course of 14days. Self-renewal ability of the spheroids was also further tested by limiting dilution assaywhereby single cells were plated into an ultra-low attachment 96-well plate (Corning, NY,USA). The process of the secondary spheroids formed from the single cell was recordedusing a phase-contrast microscope.
Expression of CSCs surface markers and ALDH activityThe expression of the surface markers CD44+/CD24− was measured using anti-humanCD44 conjugated with FITC and anti-human CD24 conjugated with PE (Mitenyl Biotech,Bisley, Surrey, UK). A total of 1×10⁶ singlecells was collected by trypsinisation and filteredusing a 70 µm membrane filter prior to specific antibodies staining in accordance tothe standard protocol. To measure ALDH activity (Stem Cell Technologies, Vancouver,Canada), single cells were incubated with the activated Aldeflour reagent for 45 min at37 ◦C. The expression of the CSCs surface markers and ALDH activity were acquired usinga FACS Calibur (BD Biosciences, San Jose, CA, USA).
Immunofluorescence characterizationTo stain the monolayer, parental cells were trypsinised and grew as monolayer on achamber slide. Spheroids, on the other hand, were washed and harvested by centrifugation.Both monolayer and spheroid cells were then fixed in cold paraformaldehyde for 5 minbefore incubated with monoclonal antibodies anti-human conjugated with fluorescentdyes. The antibodies used were CD24-PE, CD44-FITC, CD49f-FITC, Sox2-PE, Nanog-AF,and ALDH-FITC. Staining was performed by incubating the antibodies overnight at 4 ◦C.Before viewing and capturing the images, the samples were stained with a nuclear stainDAPI (GIBCO, Gaithersburg, MD, USA).
MTT (3-[4, 5-dimethylthiazol-2-yl]-2, 5-diphenyltetrazolium) assayTo determine the drug resistancy of spheroid cells, cytotoxicity assay was in accordanceto the previously published method on intact spheroids (3D condition) (Ho et al., 2012).Conversely, the MTT assay for monolayer cells and dissociated spheroids (2D condition)followed the standard cytotoxicity protocol (Mosmann, 1983). Three chemotherapeuticdrugs (tamoxifen, cisplatin and doxorubicin) were serially diluted into differentconcentrations and the cytotoxicity was determined by the resulted absorbance valuestaken at 570 nm. To calculate the percentage of cell viability, the mean absorbance valueof the treated cells was measured and compared with the control wells. The IC50 values forthe spheroids and parental cells subjected to different drugs were then obtained from thedose–response graphs.
Cell proliferation assayCell proliferation assay of the spheroid and parental cells was performed using alamar BlueCell Viability Assay Reagent (Thermo Scientific, Waltham, MA, USA). Briefly, the cultureswere incubated with 10% of alamar Blue reagent of the total volume of the medium inthe well for 4 h. The assay was carried at specific time intervals for three weeks. The cell
Boo et al. (2017), PeerJ, DOI 10.7717/peerj.3551 4/27

proliferation based on the value of absorbance at 570 nm and 600 nm was measured usinga microplate reader. To calculate the rate of cell proliferation, the percentage differencein the reduction of alamar Blue reagent between the treated and control samples weredetermined (Rampersad, 2012).
In vitro scratch assayThe wounds were initiated using a pipette tip scratched across the centre in a perpendicularmanner of the well. The cells were allowed to grow for 24 h. The gap distance of the woundwas then qualitatively captured using an inverted microscope (Nikon, Tokyo, Japan) at6, 12 and 24 h post-wound. The mean percentage of cell migration rate to close up thewounds at different time points were then quantified using Image J software (Schneider etal., 2012).
Invasion and migration assayThe invasion assay was carried out by starving the cells in serum-depleted medium aday before the assay. The next day, the cells were harvested, suspended into single-celland placed onto the top chambers of transwell inserts (BD Biosciences, San Jose, CA,USA) coated with Matrigel. The inserts placed at the top of a 24-well were incubated in aserum-depleted medium whereas medium containing serum was placed at the bottom ofthe well. Detection of cell invasion was determined after 72 h by fixing and staining theinserts with 0.5% crystal violet solution. The dye was then later extracted using 30% aceticacid before the absorbance values at 590 nm was measured. To calculate the percentage ofthe invaded cells, the absorbance values of the samples divided by the absorbance of thecontrol were determined. For migration assay, similar steps were performed but with theabsence of Matrigel coating.
MiRNAs extraction and quality checkTotal RNAs includingmicroRNAswere isolated from the three parental and three spheroidssamples using a miRNeasy kit (Exiqon, Vedbæk, Denmark) following the manufacturer’sprotocol. To ensure only goodquality of RNAswere used, RNAconcentrationwasmeasuredusing Qubit 2.0 Fluorometer (Invitrogen, Carlsbad, CA, USA) and RNA integrity wasdetermined with Agilent 2100 Bioanalyzer (Applied Biosystems, Foster City, CA, USA).Only samples with concentration >600 ng/µL and intact RNA (RIN>8) were used toprepare the miRNA libraries.
Next generation sequencing (NGS) of miRNAsApproximately 3 µg of total RNA from the samples was taken into small RNA librarypreparation protocol using TruSeq Small RNA Sample Prep Kit (Illumina, San Diego,CA, USA) in accordance to the manufacturer’s protocol. Briefly, the miRNA moleculesfrom different samples were ligated to 5′ and 3′ adaptors sequentially prior to be reverse-transcribed to cDNA followed by PCR amplification. Index sequences made of six-basecombinations were then incorporated into the PCR products before they were pooledand run on a 6% PAGE gel. The final libraries resulted from the gel purification werethen validated using Bioanalyzer HS-DNA chips before they were normalised to a finalconcentration of 2 nM and sequenced in the Illumina’s HiSeq Run.
Boo et al. (2017), PeerJ, DOI 10.7717/peerj.3551 5/27

Small RNA bioinformatics analysisAnalysis of the raw NGS data included the trimming, filtering, and cleaning up thecontaminated reads was performed using CLC Genomics Workbench 7.0. The sequenceswith shorter read length of 17 and more than 27 were removed. The normalised trimmedread lengths were aligned to the Ensembl human database (Homo sapiens GRCh 37.57)and known miRNAs database (miRBase-19) using the Illumina 1.8 pipeline. The processedmiRNAs datawas then visually assessed using quality control plots. The differential profilingof genome-widemiRNAs between the spheroid and parental was then compared using Kal’sZ -test and the resulting p-values were background corrected using Benjamini–Hochbergmethod. The statistically significant differentially expressed miRNAs (FC > 2, P < 0.05)of the spheroid cells in relative to parental cells were then generated.
Comparison of miRNAs profiling between MDA-MB-231 and MCF-7spheroid-enriched CSCsNext, the miRNAs transcriptome profiles obtained in this study was used to compare tothe previously published work on miRNAs transcriptome profiling on MCF-7 spheroidenriched CSCs (GSE68246). The purpose of the comparison is to identify the potentialmiRNAs that could be found in spheroid-enriched CSCs cells of different breast cancercell subtypes and to possibly elucidate the mechanisms attributed to the two spheroidmodels. A Venn diagram was constructed to analyse the differentially or the commonlyexpressed miRNAs between the two cell types. In order to elucidate the functional roles ofthe miRNAs, the online Database for Annotation, Visualization, and Integrated Discovery(DAVID) program (http://david.abcc.ncifcrf.gov/tools.jsp) (Huang, Sherman & Lempicki,2008;Huang, Sherman & Lempicki, 2009) was used for functional annotations and enrichedpathways using the KEGG. For each GO annotation, a p-value is calculated and sorted basedon their p-values. To identify the most specific GO annotation for the groups of analysedgenes, the p-values were ranked and the lowest p-values indicate the most significantterm. Identification of the GO of the commonly deregulated miRNAs and those uniquelyexpressed miRNAs between the two spheroid cells was performed.
Interaction networks between miRNAs-target genes and thefunctional analysis of target genesMicroRNA is known to targets more than one gene, and one gene is known to betargeted by more than one miRNA. To visualise the complex underlying networksbetween the miRNA and their target genes, three prediction programs, namely,miRTarBase_hsa_r4.4 (http://mirtarbase.mbc.nctu.edu.tw/), TargetScan Homo sapiensversion 6.2 (http://www.targetscan.org/), and MicroCosm v5 Homo sapiens(http://www.ebi.ac.uk/enright-srv/microcosm/htdocs/targets/v5/) available in CytoscapeV3.3, (http://www.cytoscape.org/) were used. Enrichment analysis of the predictedmiRNAstargets were then performed usingweb-based toolDAVID asmentioned in the previous sec-tion. P-values <0.05were considered to be statistically significant for the functional analysis.
Boo et al. (2017), PeerJ, DOI 10.7717/peerj.3551 6/27

qRT-PCRTo validate the NGS data, SYBR green qRT-PCR was performed using Exiqon SYBR greenmaster mix. In brief, 100 ng of total RNA with retention of miRNAs was polyadenylated attheir 3′ ends and reverse-transcribed into cDNA. The PCR amplification was then carriedout following standard protocol. Primer sequences for qRT-PCR are listed in Data S6.Quantitative PCR was carried out using CFX96 Real-time PCR Detection System (Bio-RadLaboratories, Hercules, CA, USA). Normalization was done using the average values ofmiR-200a and miR-19 as the endogenous controls evaluated using geNORM algorithms.
Reversal of spheroid cultureThe generated spheroids were subjected to monolayer culture to induce the growthof reversal spheroid cells. Spheroids cells were transferred into a 6-well culture dishmaintained in serum-supplemented growth medium, and were allowed to migrate out asmonolayer cells. The characteristics of the reversal spheroid cells were determined usinga phase-contrast microscope and the miRNAs levels were further validated using SYBRgreen qRT-PCR.
Statistical analysisExperiments were performed in three replicates unless otherwise stated. All statisticalanalyses were performed using independent sample one-way analysis of variance (ANOVA)and student independent t -test via SPSS V17 software. Data were considered statisticallysignificant at a probability level of P-value <0.05.
RESULTSGeneration of spheroid cells from MDA-MB-231 breast cancer cell lineMDA-MB-231 cells formed three-dimensional spheroids within 24–48 h in the serum-free and anchorage-independent culture system. In contrary, the parental remained asmonolayer cells (Figs. 1A–1C). The spheroids were mostly homogenous in size after beingcultured for 96 h. Cell count revealed a reduction of cell number on day 4 (initial numberof cells: 5.00×10⁴ cells; spheroid day 4: 4.76± 0.08× 10⁴). Ultrastructure images capturedusing Scanning Electron Microscope (SEM) at 140X magnification demonstrated that thespheroids were made up of cell aggregation (Fig. 1D). Higher magnification at 2,200×showed that the cells within the intact spheroid were held closely forming a sphericalmorphology and cell to cell junctions were visible surrounding the cells resulted in arelatively compact structure (Fig. 1E). Their self-renewability of the dissociated cells wasmeasured by their spheroid ability to increase in size over a course of 14 days and theability of the single cell to be clonally expanded (Fig. 2A). The resulted spheres were thenharvested, dissociated into single cells, replated on the ultra-low plates and this process wasrepeated twice to assess the sphere-forming efficiency (SFE) of the spheroid cells (Fig. 2B).The capacity of the MDA-MB-231 spheroid cells to be serially passaged demonstrated theself-renewing ability of the cells which is a common property of cells enriched with CSCsproperties.
Boo et al. (2017), PeerJ, DOI 10.7717/peerj.3551 7/27

Figure 1 Spheroid andmonolayer cells from estrogen-independent human breast adenocarcinomacell line MDA-MB-231. (A, B) Spheroid cells organised themselves into a compact and rigid three-dimensional structure 96 h post-culture in serum-free environment (magnification: 4×, scale bar; 100µm). (C) Parental cells cultured in two-dimensional monolayer condition displayed as spindle shapedcells and adherent in nature (magnification: 4×, scale bar; 100 µm). (D) Ultrastructure analysis ofspheroid cell coincided with clumping of cells to one another, with preservation of the overall structure ofthe spheroidal architecture (magnification: 140×, scale bar; 100 µm). (E) Higher SEM magnificationshowed the presence of cell–cell junctions (arrows) within the spheroid that are responsible formaintaining strong cell–cell contact (magnification: 2,200×, scale bar; 10 µm). Micropores indicatedby ‘arrowheads’ allowed the exchange of nutrients across the inner layer of the spheroid with theirsurroundings.
Presence of subpopulations of cells CD44+/CD24−/low and ALDH+in spheroid MDA-MB-231Breast CSCs have been shown to express CD44+/CD24−/low phenotype (Ricardo et al.,2011). Increased expression of ALDH activity has also been linked with cells with CSCs-likeproperties (Ginestier et al., 2007). We found that the proportion of CD44+/CD24−/lowcells were 2.5-fold significantly higher in the spheroid population (70.42 ± 2.22%) thanits parental cells counterparts (27.28 ± 1.65%) (mean ± SD; n= 3) (Fig. 3A). Meanwhile,spheroid cells showed a higher ALDH activity (29.43 ± 1.07%) compared to the ALDHactivity of the parental cells (1.64 ± 0.52%) (mean ± SD; n= 3) (Fig. 3B). The dot plotsin Fig. 3C show the distribution of the cells expressing CD44+/CD24−/low and ALDH+ve. These results suggest that spheroid cells in serum-free condition were enriched withCD44+/CD24−/low subpopulation and ALDH +ve, showing another characteristic ofCSCs.
Boo et al. (2017), PeerJ, DOI 10.7717/peerj.3551 8/27

Figure 2 SecondaryMDA-MB-231 spheroids formed using limited dilution techniques at single cellseeding and 200 cells/well. (A) Generation of secondary spheroids from a single cell acquired microscop-ically for 14 days (magnification: 20×, scale bar; 100 µm). Secondary spheroids showed increased sizespheroids from day 3 to day 14 (magnification: 20×, scale bar; 100 µm). Size of the spheroids and imagesare representative of three biological replicates. (B) Sphere-forming assay of secondary spheroids of MDA-MB-231 cell lines. SFE was counted from first to third generation. Data are based on the mean percentagesof the number of spheres formed within a culture relative to the initial cell seeding number (means± SD,n= 3)
Spheroid MDA-MB-231 cells exhibit stem cell-like markers and ALDHactivityTo investigate the stemness characteristics, the immunofluorescence staining were testedon the spheroids and their parental cells Data S1. It was found that the spheroid cells werepositively stained with surface markers CD44 and CD49f and intracellular markers Sox2 and Nanog with decreased or non-detectable expression in control cells. Additionally,a significantly higher ALDH activity, another marker for stem/progenitor cell was foundin the spheroid cells compared to control. Besides, the expression of the stem cell-likemarkers was also observed in secondary spheroids, indicating the preservation of the stemcell features of the spheroid cells. Taken together, these data indicated that the generatedspheroids possessed CSCs characteristics of which were not observed on the parental cells.
Spheroid MDA-MB-231 cells are resistant to chemotherapeutics drugsThe CSCs characteristic of the MDA-MB-231 spheroids was further confirmed for theincreased resistance to chemotherapeutics drugs.We compared the drug resistance betweenthe spheroid cells in 3D and 2D culture conditions to the parental cells using MTT assay.
Boo et al. (2017), PeerJ, DOI 10.7717/peerj.3551 9/27

Figure 3 Cancer stem cells surface markers and ALDH activity of MDA-MB-231 spheroids assessed byflow cytometry analysis. (A) Spheroid cells exhibited a significantly higher percentage of CD44+/CD24−cells populations (70.42± 2.22%) compared to that of the parental cells (27.28± 1.65%). (B) ALDH ac-tivity also exhibited an increased in spheroid cells with 29.43± 1.07% compared to parental cells 1.64± 0.52%. (C) Representative flow cytometric dot plots were shown whereby R2 is the region of ALDH-positive cells.
Boo et al. (2017), PeerJ, DOI 10.7717/peerj.3551 10/27
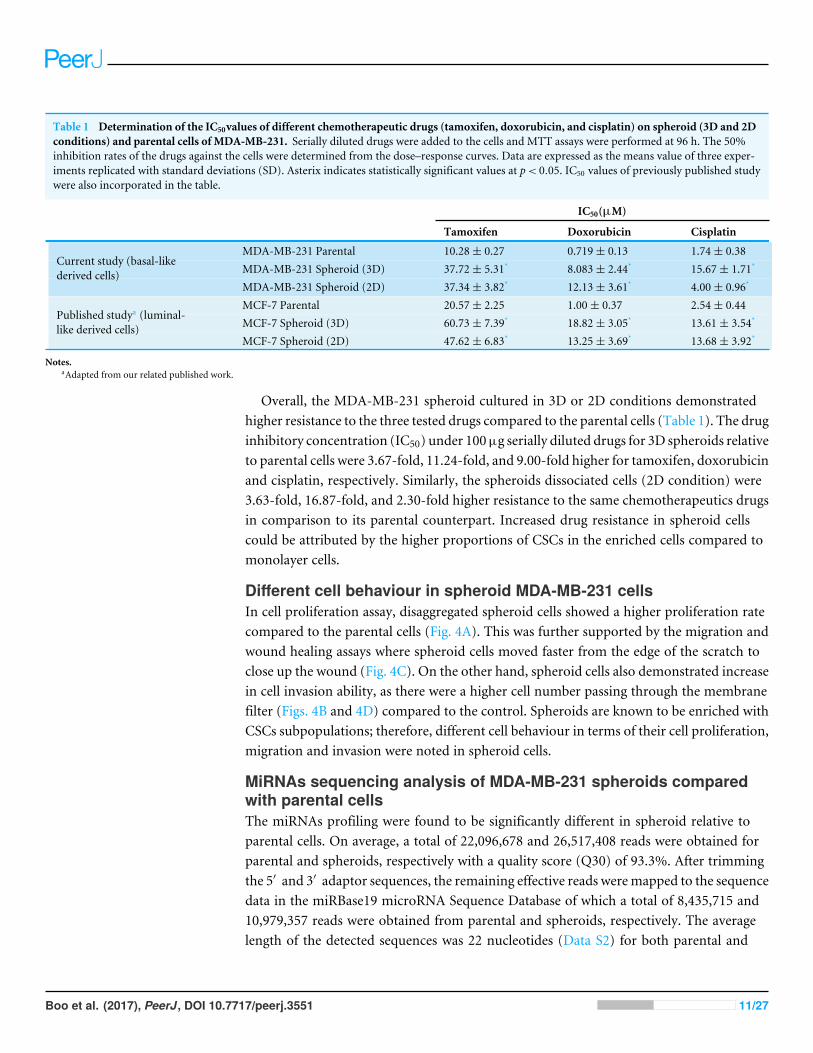
Table 1 Determination of the IC50values of different chemotherapeutic drugs (tamoxifen, doxorubicin, and cisplatin) on spheroid (3D and 2Dconditions) and parental cells of MDA-MB-231. Serially diluted drugs were added to the cells and MTT assays were performed at 96 h. The 50%inhibition rates of the drugs against the cells were determined from the dose–response curves. Data are expressed as the means value of three exper-iments replicated with standard deviations (SD). Asterix indicates statistically significant values at p< 0.05. IC50 values of previously published studywere also incorporated in the table.
IC50(µM)
Tamoxifen Doxorubicin Cisplatin
; MDA-MB-231 Parental 10.28± 0.27 0.719± 0.13 1.74± 0.38; MDA-MB-231 Spheroid (3D) 37.72± 5.31* 8.083± 2.44* 15.67± 1.71*
;
Current study (basal-likederived cells)
MDA-MB-231 Spheroid (2D) 37.34± 3.82* 12.13± 3.61* 4.00± 0.96*
; MCF-7 Parental 20.57± 2.25 1.00± 0.37 2.54± 0.44; MCF-7 Spheroid (3D) 60.73± 7.39* 18.82± 3.05* 13.61± 3.54*
;
Published studya (luminal-like derived cells)
MCF-7 Spheroid (2D) 47.62± 6.83* 13.25± 3.69* 13.68± 3.92*
Notes.aAdapted from our related published work.
Overall, the MDA-MB-231 spheroid cultured in 3D or 2D conditions demonstratedhigher resistance to the three tested drugs compared to the parental cells (Table 1). The druginhibitory concentration (IC50) under 100µg serially diluted drugs for 3D spheroids relativeto parental cells were 3.67-fold, 11.24-fold, and 9.00-fold higher for tamoxifen, doxorubicinand cisplatin, respectively. Similarly, the spheroids dissociated cells (2D condition) were3.63-fold, 16.87-fold, and 2.30-fold higher resistance to the same chemotherapeutics drugsin comparison to its parental counterpart. Increased drug resistance in spheroid cellscould be attributed by the higher proportions of CSCs in the enriched cells compared tomonolayer cells.
Different cell behaviour in spheroid MDA-MB-231 cellsIn cell proliferation assay, disaggregated spheroid cells showed a higher proliferation ratecompared to the parental cells (Fig. 4A). This was further supported by the migration andwound healing assays where spheroid cells moved faster from the edge of the scratch toclose up the wound (Fig. 4C). On the other hand, spheroid cells also demonstrated increasein cell invasion ability, as there were a higher cell number passing through the membranefilter (Figs. 4B and 4D) compared to the control. Spheroids are known to be enriched withCSCs subpopulations; therefore, different cell behaviour in terms of their cell proliferation,migration and invasion were noted in spheroid cells.
MiRNAs sequencing analysis of MDA-MB-231 spheroids comparedwith parental cellsThe miRNAs profiling were found to be significantly different in spheroid relative toparental cells. On average, a total of 22,096,678 and 26,517,408 reads were obtained forparental and spheroids, respectively with a quality score (Q30) of 93.3%. After trimmingthe 5′ and 3′ adaptor sequences, the remaining effective reads weremapped to the sequencedata in the miRBase19 microRNA Sequence Database of which a total of 8,435,715 and10,979,357 reads were obtained from parental and spheroids, respectively. The averagelength of the detected sequences was 22 nucleotides (Data S2) for both parental and
Boo et al. (2017), PeerJ, DOI 10.7717/peerj.3551 11/27

Figure 4 Spheroid cells demonstrated increased cell proliferation, migration, wound healing abil-ity and invasion capacity relative to parental cells. (A) Comparison of cell proliferation ability of thespheroid cells monitored using Alamar Blue assay. Determined by the reduction of Alamar Blue, spheroidcells showed significantly higher cell proliferation than dissociated parental cells when cultured in thesame seeding number and condition. (B, C and D) Bar charts show higher cell migration, wound healingand invasion abilities in spheroid cells compared to their parental controls. Cell migration and invasionassays were measured by extracting the resulted stained cells and the absorbance of the dye colours werequantified. On the other hand, in wound healing assay, a gap was created and the cells’ proliferative abil-ity to close the gaps were measured and recorded. The wound healing process of the spheroid and parentalcells were taken at 0, 6, 12 and 24 h post-wound initiation.
spheroids. Among these reads, 54,042 corresponding to 6,656,191 reads and 29,260corresponding to 1,764,277 reads were matched to known miRNAs sequences in parentaland spheroids, respectively. The trimmed reads revealed that there were an average of39.6% and 40.5% of spheroids miRNAs that corresponded to the miRBase-19 (Homosapiens) database. The remaining sequences were found to be matched to the non-codingdatabase (Homo Sapiens GRCh 37.57) with 60.4% in parental and 59.5% in spheroid cells.The high throughput miRNA sequencing data can be accessed at the National Center forBiotechnology Information (NCBI) with the reference number GSE75396. The summarystatistics of the miRNA libraries of spheroid and parental cells can be found in Data S3. Asshown in Data S4, the two groups were successfully segregated using the hierarchical clusteranalysis and samples with similar patterns of expression of miRNAs studies were clusteredtogether as indicated by the heatmap. Visualisation of the miRNAs expression dataset byprincipal component analysis (PCA) revealed a low level of inter-samples variations of thebiological replicates of spheroids and parental. Volcano plot filtering was also performed toidentify the significant levels of differentially expressed miRNAs between the two groups.
Boo et al. (2017), PeerJ, DOI 10.7717/peerj.3551 12/27

A total of 69 significantly differentially expressed miRNAs with fold change >2 were foundin the spheroid cells relative to the parental cells. Out of these 69 miRNAs, 33 were foundto be up-regulated in spheroid cells whereas 36 were down-regulated (Data S5), suggestingthere were distinct miRNAs profiling in spheroid relative to parental cells.
Comparison of miRNAs profiling between spheroid-enriched CSCsof two breast cancer subtypesAs illustrated in Fig. 5, 102 deregulated miRNAs (15 up and 87 down) were found onlyin MCF-7 spheroid, while 46 deregulated miRNAs (20 up and 26 down) were exclusivelyfound in MDA-MB-231 spheroid. Most of the deregulated miRNAs observed in bothspheroid cells (87 miRNAs in MCF-7 spheroid while 26 in MDA-MB-231 spheroid) wereall down-regulated, suggesting that most of the miRNAs in the spheroid-enriched breastcancer cells may be tumour suppressors. Besides, our results demonstrated that a complexnetwork of the cluster of miRNAs and their predicted target genes were spheroid-breastcancer subtype specific. The miRNAs exclusively found in MCF-7 spheroid cells wereevaluated for their target gene predictions. Gene annotations indicated that the targetgenes inferred from the group of deregulated miRNAs were associated with variousbiological characteristics like regulation of transcription factors, and signal transduction;molecular functions including protein binding and metal ion binding; and the geneproducts were primarily found in cell cytoplasm, membrane and nucleus (Fig. 6). Theenriched pathways as revealed by Kyoto Encyclopaedia of Genes and Genomes (KEGG)analysis, includes JAK-STAT signalling pathway, calcium signalling and insulin signallingpathway. Meanwhile, the group of deregulated miRNAs found only in MDA-MB-231spheroid targeted genes had the similar enriched Gene Ontology (GO) (Fig. 7). To oursurprise, the enriched KEGG pathways were also found to be quite similar to those found inMCF-7 spheroid. This implied that although different cluster of miRNAs were expressed inMCF-7 and MDA-MB-231 exclusively in spheroid-enriched CSCs, the enriched gene setsand their associated pathways were similar. Nevertheless, miRNAs expressed exclusively inMDA-MB-231 spheroid that were associated with neurotrophin signalling pathway, p53signalling pathway and ECM-receptor interaction were chosen for the validation purpose asthese signalling pathways have shown potential for cancer targeted therapy (Hondermarck,2012; Liu et al., 2015;Wang & Sun, 2009).
Common pathways in MCF-7 and MDA-MB-231 spheroids linked toCSCs-related signalling pathwaysA total of 20 miRNAs were found to be commonly deregulated between these two breastcancer spheroid-enriched CSCs cell types, as illustrated in Fig. 5. We further explored thetargets genes using Cytoscape which utilizes three target prediction algorithms in order toobtainmore confident target genes for the cluster of miRNAs. Interestingly, when the targetgenes were inferred from the deregulated common group of miRNAs between the twospheroid models, they were found to be significantly positively regulated in processes suchas transcription factors, cell proliferation, and molecular functions in nucleotide binding,DNA binding and protein kinase binding (Fig. 8). Among the commonly expressedvalidated miRNAs, miR-15b-5p, miR-34a-5p and miR-148a-5p were with the most target
Boo et al. (2017), PeerJ, DOI 10.7717/peerj.3551 13/27

Figure 5 Venn diagram analysis showing the number of differentially expressed miRNAs that areunique and commonly expressed inMCF-7 andMDA-MB-231 spheroids. A total of 20 commonlyderegulated miRNAs were found in both spheroids.
genes. The enriched genes were involved in pathways commonly found in cancer andstem cells primarily on Focal adhesion, MAPK, Wnt, Notch, Hedgehog, mTOR, andVEGF. Further validation was conducted on the five miRNAs representing the target genesassociated with these pathways using qRT-PCR expressions analysis.
Quantitative PCR validationTwelve knownmiRNAs representing specific pathways found inMCF-7 andMDA-MB-231spheroid-enriched CSCs were picked for qRT-PCR (Data S6). The miRNAs assessed werehsa-miR-15b, hsa-miR-34a-5p, hsa-miR-148a-3p, hsa-miR-628-5p, and hsa-miR-196b(commonly expressed in both spheroids), hsa-miR-125b-5p, hsa-miR-760, hsa-miR-30c-5p, and hsa-miR-136-5p (exclusively expressed in MCF-7 spheroid) and hsa-miR-204-5p,hsa-miR-181a-5p and hsa-miR-205-5p (exclusively expressed in MDA-MB-231 spheroid).Utilising qRT-PCR, the levels of the selected miRNAs expressions in spheroid cells inrelation to the parental cells were found to have consistent expression levels, suggestingthat the miRNAs profiling from Illumina sequencing run were reliable (Data S7).
Boo et al. (2017), PeerJ, DOI 10.7717/peerj.3551 14/27
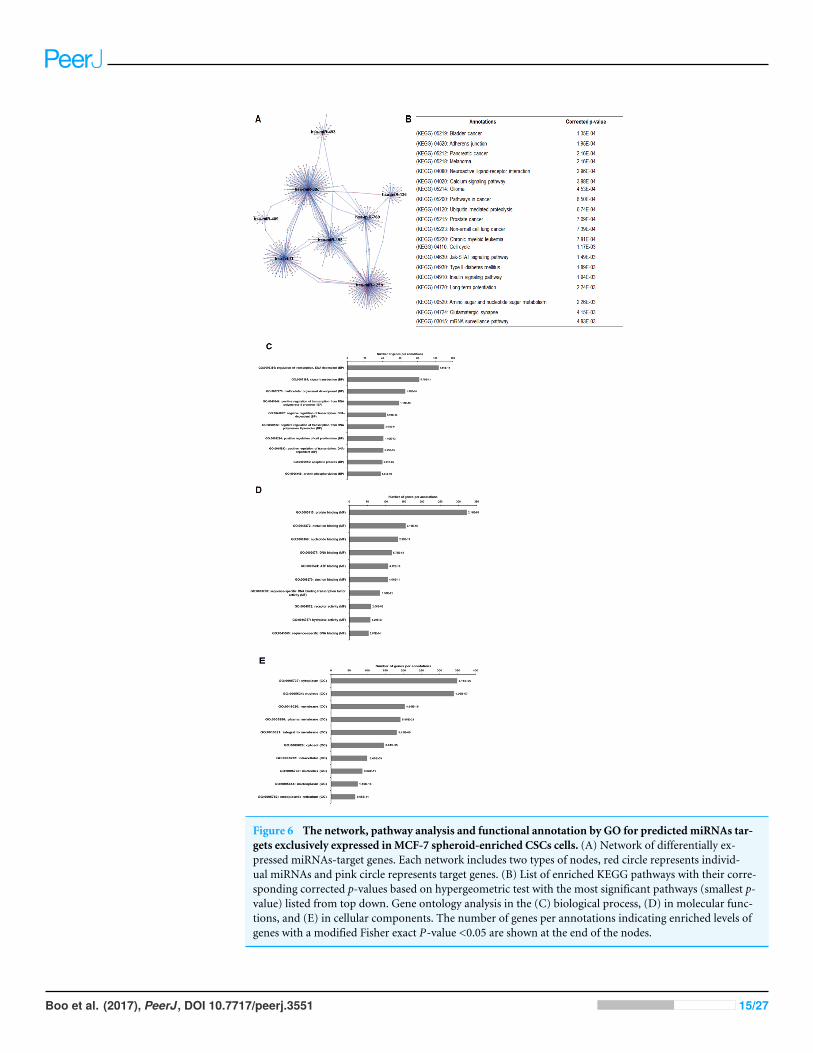
Figure 6 The network, pathway analysis and functional annotation by GO for predicted miRNAs tar-gets exclusively expressed inMCF-7 spheroid-enriched CSCs cells. (A) Network of differentially ex-pressed miRNAs-target genes. Each network includes two types of nodes, red circle represents individ-ual miRNAs and pink circle represents target genes. (B) List of enriched KEGG pathways with their corre-sponding corrected p-values based on hypergeometric test with the most significant pathways (smallest p-value) listed from top down. Gene ontology analysis in the (C) biological process, (D) in molecular func-tions, and (E) in cellular components. The number of genes per annotations indicating enriched levels ofgenes with a modified Fisher exact P-value <0.05 are shown at the end of the nodes.
Boo et al. (2017), PeerJ, DOI 10.7717/peerj.3551 15/27

Figure 7 The network, pathway analysis and functional annotation by GO for predicted miRNAs tar-gets exclusively expressed inMDA-MB-231 spheroid-enriched CSCs cells. (A) Network of differentiallyexpressed miRNAs-target genes. Each network includes two types of nodes, red circle represents individ-ual miRNAs and pink circle represents target genes. (B) List of enriched KEGG pathways with their corre-sponding corrected p-values based on hypergeometric test with the most significant pathways (smallest p-value) listed from top down. Gene ontology analysis in the (C) biological process, (D) in molecular func-tions, and (E) in cellular components. The number of genes per annotations indicating enriched levels ofgenes with a modified Fisher exact P-value <0.05 are shown at the end of the nodes.
Boo et al. (2017), PeerJ, DOI 10.7717/peerj.3551 16/27

Figure 8 The network, pathway analysis and functional annotation by GO for predicted miRNAs tar-gets commonly expressed in the two spheroid-enriched CSCs cell types. (A) Network of differentiallyexpressed miRNAs-target genes. Each network includes two types of nodes, red circle represents individ-ual miRNAs and pink circle represents target genes. (B) List of enriched KEGG pathways with their corre-sponding corrected p-values based on hypergeometric test with the most significant pathways (smallest p-value) listed from top down. Gene ontology analysis in the (C) biological process, (D) in molecular func-tions, and (E) in cellular components. The number of genes per annotations indicating enriched levels ofgenes with a modified Fisher exact P-value <0.05 are shown at the end of the nodes.
Boo et al. (2017), PeerJ, DOI 10.7717/peerj.3551 17/27

Reversal spheroid cells retained CSCs characteristicsWhen subjected to routine monolayer culture condition, cells were seen to have attachedto the plate and migrated out from the spheroids which eventually grew into monolayercells based on microscopy examination. The levels of the selected miRNAs expression inthe reversal spheroid cells were shown to express similar patterns to that of the spheroidcells (Data S9).
DISCUSSIONA vast number of literatures including one of our recently published paper havedemonstrated the successful application of serum-free enrichment technique to enrichfor CSCs population (Boo et al., 2016; Fan et al., 2010). Using the similar methodology,we initiated spheroid cells from MDA-MB-231 breast cancer cell lines, which is oneof the commonly used TNBC cell line (Chavez, Garimella & Lipkowitz, 2010). Recentadvancement in NGS and bioinformatics analysis has provided the opportunity toexplore the associated miRNA profiling in the spheroid cell models as a guide for futureidentification of potential miRNAs markers in breast CSCs studies (Shyr & Liu, 2013).
In our current study, MDA-MB-231 spheroids were found to demonstrate typicalCSCs characteristics, namely, self-renewability, overexpressing certain stem cell-associatedsurface and intracellular markers, increased expression of CD44+ and ALDH+ and alsoincreased resistance to chemotherapeutics drugs, which is in agreement with other studies(Lopez et al., 2012; Piero, Robert & Michael, 2007). When the biological properties of thesetwo spheroid models were compared, both spheroids were capable of forming secondaryspheroids under limiting dilution assay, but the morphological features between thesecells were different. MDA-MB-231 secondary spheroid enlarged into approximately 380µm while MCF-7 secondary spheroids estimated to be 303 µm in size after 14 days inculture. SFE analysis showed that dissociated single cells from MDA-MB-231 spheroidshad a higher SFE rate as compared to MCF-7 spheroids. When the CD44+/CD24− andALDH+ expression were compared between the two spheroids, MDA-MB-231 spheroidsdisplayed a higher fraction of cells displaying those markers. This is expected as it hasbeen demonstrated that basal-subtypes of breast cancer, for instance, MDA-MB-231cells are predominantly CD44+ (Fillmore & Kuperwasser, 2008). Yet compared to theparental cells, MDA-MB-231 exhibited higher ADLH expression, about 2-fold more thanthat of MCF-7 spheroids. Also, expression of ALDH in breast tumour cells has beencorrelated with higher pool of CSCs population (Douville, Beaulieu & Balicki, 2008). Thus,theMDA-MB-231 spheroids were enriched with higher CSCs population relative toMCF-7spheroids. MDA-MB-231 which is characterised by their basal/mesenchymal phenotypehas been shown to mask differentiation as compared to the increased expression ofdifferentiation-associated genes found in luminal cell type. Therefore, it is postulated thatMDA-MB-231 harbours a higher quiescent pool of CSCs (Akrap et al., 2016). In view oftheir drug resistance properties, both spheroids had higher drug inhibitory concentrationrelative to the parental cells. Interestingly, doxorubicin, a common chemotherapeuticdrug against breast cancer, was more resistant in MCF-7 spheroids (18-fold) than inMDA-MB-231 spheroids (8-fold). MDA-MB-231 which formed a loosely and less compact
Boo et al. (2017), PeerJ, DOI 10.7717/peerj.3551 18/27

spheroid thanMCF-7, could be the reason behind the higher doxorubicin drug penetrationwhich resulted in a lower drug inhibitory concentration. A similar trend was also reportedwith the cytotoxicity study of a ginger compound 6-shogaol in MCF-7 spheroids (Ray,Vasudevan & Sengupta, 2015).
In the concept of CSCs, some pathways are responsible for the induction of Epithelial-to-Mesenchymal Transition (EMT), maintaining stemness of CSCs as well as the increasedlevels of cell proliferation, invasion and migration that distinguish stem cells from non-stem cells (Takebe et al., 2015). A few potential targeting pathways have been previouslyidentified to eliminate CSCs such as the altering the self-renewal mechanisms (Wnt,Notch, Hedgehog) or the inhibition of the tumour progression and metastasis (JAK-STAT,TGF-β, PDFGR) (Pattabiraman &Weinberg, 2014). Apart from these common pathways,new therapies targeting the complex biology of CSCs were also being elucidated (Shibuyaet al., 2015).
Here, we address a cluster of potential miRNAs associated with the CSCs-signallingpathways that could aid in the development of therapeutic strategies targeting miRNAs forfuture CSCs therapy. Our study demonstrated that there were 20 significantly deregulatedmiRNAs that overlapped between these two spheroidsmodels, suggesting that there are onlya small portion of miRNAs are being shared by the spheroidmodels (Fig. 5). These miRNAswere involved in some crucial cancer-associated and stem cell regulation of pathways. Thetargets of miR-15b-5p were LRP6 and WNT5B, was shown to be related to Wnt signallingpathway, while the targets of miR-34a-5p were NOTCH-associated genes involved inNotch signalling pathway. As for miR-148a-5p, the targets were GAS1 and LRP2, whichwas related to Hedgehog signalling pathway. Interestingly, among this cluster of commonlyexpressed miRNAs identified, miR-34a-5p was previously implicated in colon, pancreaticand prostate cancer modulating CSCs self-renewal or cell fate determination where itdirectly targets Notch receptors (Bu et al., 2013; Li, Ren & Tang, 2014). As such, thesespheroid-enriched CSCs inducible miRNAs may have considerable clinical value in CSCsdiagnosis (Morata-Tarifa et al., 2016). Besides being involved in self-renewal pathway,both miR-15b-5p and miR-34a-5p were associated with MAPK signalling pathway andmiR-628-5p were predicted to be involved in mTOR signalling pathway (Hua et al., 2006;Matter et al., 2014;Wu, Yang & Li, 2009). However, the function of miR-196b-5p in breastcancer is still uncertain. Our study showed that miR-196b-5p was down-regulated inboth spheroid subtypes while another study showed that miR-196b-5p was specificallyup-regulated leading to reduction of apoptosis in colorectal cancer cells by mediatingFAS gene expression (Mo et al., 2015). The conflicting results might be attributed by thegenetics of the different cell lines used and also the targeted genes which are yet to bevalidated. Nevertheless, it is worth exploring the other afore-mentioned miRNAs that areinvolved in the other stem cell-related signalling pathways. Modulation of this cluster ofmiRNAs could be a promising approach to suppress those pathways, thus improving theeffectiveness of breast cancer treatments. When subjected to reverse culture, the migratedspheroid cells reverted to their monolayer characteristics which could be due to the serumculture condition that facilitated the attachment, migration and propagation of the reversalcells. However, those cells still maintain the selected miRNA expression pattern as that of
Boo et al. (2017), PeerJ, DOI 10.7717/peerj.3551 19/27

the spheroid cells. Nevertheless, more work must be carried out which include isolation ofindividual population of the cells to confirm the involvement of the differentially expressedmiRNAs in the maintenance of the spheroid cells and their CSC-like properties.
In the current study, when we compared the miRNAs profiling of the MDA-MB-231spheroid cells to the MCF-7 spheroid cell, we found a set of miRNAs exclusively expressedeither in MDA-MB-231 or MCF-7 spheroid cells (Fig. 5). A considerable amount of thedifferentially expressed miRNAs that were exclusively found in MDA-MB-231 spheroid(46 miRNAs) and in MCF-7 spheroid (102 miRNAs) were attributed by the fact thatthey were two distinct breast cancer subtypes. For instance, miR-205-5p preferentiallyexpressed in basal-like breast cancer cells is normally found in triple negative breasttumours, is a key player in cell cycle progression whereby it regulates cell proliferation, cellprogression and enhance metastasis (Elgamal et al., 2013; Radojicic et al., 2011). Similarly,miRNA (miR-181a-5p) which was commonly found in TNBC tissues was also found tobe upregulated in the MDA-MB-231 spheroids (Taylor et al., 2012) was reported to inhibitTGFβR3 protein translation. Subsequently, this inhibtion increases metastasis, invasion,migration, and reverting anoikis resistance in TNBC through their negative regulation inTGF-beta signalling pathway. miR-204-5p which has been reported as down-regulated ina few cancers (Yin et al., 2014), was also present at low levels in theMDA-MB-231 spheroidand their reduced expression of miR-204-5p is associated with poor clinical outcome inbasal-like TNBC, suggesting their potential diagnostic use (Li et al., 2014). In contrast,ectopic expression of miR-204-5p has been demonstrated to restore anoikis sensitivityand reduced the invasiveness and metastatic behaviour in ovarian cancer cell line (Yan etal., 2015). Therefore, targeting miR-204-5p could possibly enhance anoikis sensitivity ofbasal-like breast cancer via neutrotrophin signalling pathway, thus making it a possiblemarker for metastasis breast cancer. Based on the findings from these results and onprevious literature, the regulation of this cluster of miRNAs may play important roles inthe metastatic and chemoresistance abilities of basal-like spheroid cancer cells.
On the other hand, we identified four miRNAs (miR-125b-5p, miR-760, miR-30c andmiR-136-5p) exclusively expressed in MCF-7 spheroids based on their potential rolesin luminal-like breast tumorigenesis via regulation of a number of predicted cancer-associated pathways including JAK-STAT, calcium, and insulin signalling pathways.Among the down-regulated miRNAs, miR-125b-5p was favoured to have tumoursuppressor roles by targeting ENPEP gene, where enforced expression in MCF-7 cellsreduced cell proliferation and anchorage-independent growth by positive regulation inbreast tumorigenesis (Feliciano et al., 2013). Downregulated expression of miR-125b-5p was also found to increase HER2 protein expression, leading to worse prognosticoutcome in luminalA breast cancer patients (Bailey, Westerling & Brown, 2015). Moreover,deregulated expression of miR-760 was previously reported as one of themiRNAs regulatedby estrogen-responsive gene clusters, suggesting its potential use as biomarkers forthe luminal-like breast cancer cells (Cicatiello et al., 2009). In another similar study,expression of miR-30c has been linked to chemotherapy resistance specifically in luminalA breast tumours by regulating TWF1 and IL-11 genes in the miR-30c-mediatedpathway (Bockhorn et al., 2013) and deregulation of miR-30c has led to increase in cell
Boo et al. (2017), PeerJ, DOI 10.7717/peerj.3551 20/27

proliferation, drug sensitivity and cancer progression. As for miR-136-5p, although ithas not been to be associated with luminal-like spheroid breast cancer, it previouslyreported to be deregulated in lung cancer (Shen et al., 2013) and ovarian cancer (Zhaoet al., 2015), suggesting the potential use as biomarkers in this subtype of breast cancer.
Overall, the unique cluster of miRNAs found in each cell type are associated withtheir chemoresistance properties and cancer progression, and most likely influencingthe maintenance of the spheroid-enriched CSCs properties. Moreover, bioinformaticsanalysis revealed that the predicted gene annotation and pathways inferred from theuniquely expressed set of miRNAs found in the two breast spheroids models wererelatively similar (Figs. 6B and 7B). This indicates the highly complex interactions ofmiRNAs in the regulation of gene expressions in which MCF-7 and MDA-MB-231spheroid cells may use different miRNAs to regulate their biological properties, but thosemiRNAs converged to the similar pathways and gene products. Nonetheless, furthervalidation of the miRNAs, their target genes and the relevant pathways can help researchersin designing and developing strategies of novel therapeutic in battling breast cancer.
CONCLUSIONSHere we have determined the CSCs characteristic and profiling of the MDA-MB-231spheroid model. Compared to the previously reported miRNA profiling of the MCF-7spheroid, we further demonstrated that the spheroid culturing method can be usedto enrich for CSCs-like subpopulations in both breast cancer cell lines. The resultsconfirmed that both spheroids expressed certain miRNAs unique to their cancer subtypesand also a cluster of miRNAs that were commonly expressed in both spheroids. Thisstudy enhances our understanding not only on the roles of miRNAs in spheroid-enriched CSCs models, but more importantly highlights the 20 commonly deregulatedmiRNAs found in both spheroids cells. To the best of our knowledge, no study hasshown a comparison of the differentially expressed miRNAs from these two CSCsenriched spheroid models. As such, these miRNAs profiling datasets could be used asreference for future investigations on their role in spheroid CSCs enriched breast cancermodels, leading to potentially more effective targeted breast cancer therapies which mayprovide insights of the miRNAs mechanism and relationship in the spheroid models.
ADDITIONAL INFORMATION AND DECLARATIONS
FundingThis work was supported by the Ministry of Science, Technology and Innovation ofMalaysia (MOSTI) for the E-Science Fund (02-02-11-SF0125); UM High Impact ResearchGrants (UM-MOHEHIRGrant UM.C/625/1/HIR/MOHE/CHAN/01, no. A000001-50001;UM-MOHE HIR Grant UM.C/625/1/HIR/MOHE/CHAN/14/1, H-50001-A000027), andUniversiti Tunku Abdul Rahman Research Fund (UTARRF) (A6200/A23). The fundershad no role in study design, data collection and analysis, decision to publish, or preparationof the manuscript.
Boo et al. (2017), PeerJ, DOI 10.7717/peerj.3551 21/27

Grant DisclosuresThe following grant information was disclosed by the authors:Ministry of Science, Technology and Innovation of Malaysia (MOSTI): 02-02-11-SF0125.UM High Impact Research Grants: UM.C/625/1/HIR/MOHE/CHAN/01, A000001-50001,UM.C/625/1/HIR/MOHE/CHAN/14/1, H-50001-A000027.Universiti Tunku Abdul Rahman Research Fund (UTARRF): (A6200/A23).
Competing InterestsSoon Keng Cheong is currently an employee of Cryocord Sdn Bhd; however, his positionin Cryocord did not influence the design and output of the study.
The rest of the authors declare that there are no competing interests.
Author Contributions• Lily Boo conceived and designed the experiments, performed the experiments, analyzedthe data, wrote the paper, prepared figures and/or tables, reviewed drafts of the paper.• Wan Yong Ho, Kok Gan Chan, Wai Fong Yin, Sheau Wei Tan and Soon Keng Cheongcontributed reagents/materials/analysis tools.• Norlaily Mohd Ali performed the experiments, analyzed the data, reviewed drafts of thepaper.• SweeKeongYeap conceived anddesigned the experiments, analyzed the data, contributedreagents/materials/analysis tools, reviewed drafts of the paper.• Huynh Ky and Woan Charn Liew performed the experiments.• Dilan Amila Satharasinghe performed the experiments, analyzed the data.• Han Kiat Ong contributed reagents/materials/analysis tools, reviewed drafts of the paper.
Data AvailabilityThe following information was supplied regarding data availability:
The raw data has been provided as Supplementary File.NCBI: GSE75396.
Supplemental InformationSupplemental information for this article can be found online at http://dx.doi.org/10.7717/peerj.3551#supplemental-information.
REFERENCESAkrap N, Andersson D, Bom E, Gregersson P, Stahlberg A, Landberg G. 2016. Identi-
fication of distinct breast cancer stem cell populations based on single-cell analysesof functionally enriched stem and progenitor pools. Stem Cell Reports 6:121–136DOI 10.1016/j.stemcr.2015.12.006.
Bailey ST,Westerling T, BrownM. 2015. Loss of estrogen-regulated microRNAexpression increases HER2 signaling and is prognostic of poor outcome in luminalbreast cancer. Cancer Research 75:436–445 DOI 10.1158/0008-5472.can-14-1041.
Boo et al. (2017), PeerJ, DOI 10.7717/peerj.3551 22/27

Bockhorn J, Dalton R, Nwachukwu C, Huang S, Prat A, Yee K, Chang Y-F, Huo D,Wen Y, Swanson KE, Qiu T, Lu J, Young Park S, Eileen DolanM, Perou CM,Olopade OI, Clarke MF, Greene GL, Liu H. 2013.MicroRNA-30c inhibits humanbreast tumour chemotherapy resistance by regulating TWF1 and IL-11. NatureCommunications 4:Article 1393 DOI 10.1038/ncomms2393.
Boo L, HoWY, Ali NM, Yeap SK, Ky H, Chan KG, YinWF, Satharasinghe DA, LiewWC, Tan SW, Ong HK, Cheong SK. 2016.MiRNA transcriptome profiling ofspheroid-enriched cells with cancer stem cell properties in human breast MCF-7 cellline. International Journal of Biological Sciences 12:427–445 DOI 10.7150/ijbs.12777.
Bu P, Chen K-Y, Chen JH,Wang L,Walters J, Shin YJ, Goerger JP, Sun J, With-erspoonM, Rakhilin N, Li J, Yang H, Milsom J, Lee S, Zipfel W, Jin MM,Zeynep HG, Lipkin SM, Shen X. 2013. A microRNA miR-34a regulated bi-modal switch targets notch in colon cancer stem cells. Cell Stem Cell 12:602–615DOI 10.1016/j.stem.2013.03.002.
Cao L, Zhou Y, Zhai B, Liao J, XuW, Zhang R, Li J, Zhang Y, Chen L, Qian H,WuM,Yin Z. 2011. Sphere-forming cell subpopulations with cancer stem cell properties inhuman hepatoma cell lines. BMC Gastroenterology 11:71DOI 10.1186/1471-230X-11-71.
Chavez KJ, Garimella SV, Lipkowitz S. 2010. Triple negative breast cancer cell lines: onetool in the search for better treatment of triple negative breast cancer. Breast Disease32:35–48 DOI 10.3233/bd-2010-0307.
Chen K, Huang Y-H, Chen J-L. 2013. Understanding and targeting cancer stem cells:therapeutic implications and challenges. Acta Pharmacologica Sinica 34:732–740DOI 10.1038/aps.2013.27.
Cicatiello L, Mutarelli M, Grober OMV, Paris O, Ferraro L, RavoM, Tarallo R, LuoS, Schroth GP, Seifert M, Zinser C, Luisa ChiusanoM, Traini A, De Bortoli M,Weisz A. 2009. Estrogen receptor α controls a gene network in luminal-like breastcancer cells comprising multiple transcription factors and MicroRNAs. The AmericanJournal of Pathology 176:2113–2130 DOI 10.2353/ajpath.2010.090837.
Croker AK, Goodale D, Chu J, Postenka C, Hedley BD, Hess DA, Allan AL. 2009.Highaldehyde dehydrogenase and expression of cancer stem cell markers selects for breastcancer cells with enhanced malignant and metastatic ability. Journal of Cellular andMolecular Medicine 13:2236–2252 DOI 10.1111/j.1582-4934.2008.00455.x.
Douville J, Beaulieu R, Balicki D. 2008. ALDH1 as a functional marker of cancer stemand progenitor cells. Stem Cells and Development 18:17–26DOI 10.1089/scd.2008.0055.
Duan J-J, QiuW, Xu SL,Wang B, Ye X-Z, Ping Y-F, Zhang X, Bian X-W, Yu S-C. 2013.Strategies for isolating and enriching cancer stem cells: well begun is half done. StemCells and Development 22:2221–2239 DOI 10.1089/scd.2012.0613.
Elgamal OA, Park J-K, Gusev Y, Azevedo-Pouly ACP, Jiang J, Roopra A, SchmittgenTD. 2013. Tumor suppressive function of mir-205 in breast cancer is linked toHMGB3 regulation. PLOS ONE 8:e76402 DOI 10.1371/journal.pone.0076402.
Boo et al. (2017), PeerJ, DOI 10.7717/peerj.3551 23/27

Fan X, Liu S, Su F, Pan Q, Lin T. 2010. Effective enrichment of prostate cancer stem cellsfrom spheres in a suspension culture system. Urologic Oncology 30:314–318.
Fang D, Nguyen TK, Leishear K, Finko R, Kulp AN, Hotz S, Van Belle PA, Xu X, ElderDE, HerlynM. 2005. A tumorigenic subpopulation with stem cell properties inmelanomas. Cancer Research 65:9328–9337 DOI 10.1158/0008-5472.can-05-1343.
Feliciano A, Castellvi J, Artero-Castro A, Leal JA, Romagosa C, Hernandez-LosaJ, Peg V, Fabra A, Vidal F, Kondoh H, Ramony Cajal S, Lleonart ME. 2013.miR-125b acts as a tumor suppressor in breast tumorigenesis via its noveldirect targets ENPEP, CK2-α, CCNJ, and MEGF9. PLOS ONE 8:e76247DOI 10.1371/journal.pone.0076247.
Fillmore C, Kuperwasser C. 2008.Human breast cancer cell lines contain stem-like cells that self-renew, give rise to phenotypically diverse progeny and survivechemotherapy. Breast Cancer Research 10:R25 DOI 10.1186/bcr1982.
Ginestier C, HurMH, Charafe-Jauffret E, Monville F, Dutcher J, BrownM, JacquemierJ, Viens P, Kleer C, Liu S, Schott A, Hayes D, BirnbaumD,WichaMS, DontuG. 2007. ALDH1 is a marker of normal and malignant human mammarystem cells and a predictor of poor clinical outcome. Cell Stem Cell 1:–567DOI 10.1016/j.stem.2007.08.014.
HoWY, Yeap SK, Ho CL, Rahim RA, Alitheen NB. 2012. Development of mul-ticellular tumor spheroid (MCTS) culture from breast cancer cell and a highthroughput screening method using the MTT assay. PLOS ONE 7(9):e44640DOI 10.1371/journal.pone.0044640.
Hondermarck H. 2012. Neurotrophins and their receptors in breast cancer. Cytokine andGrowth Factor Reviews 23:357–365 DOI 10.1016/j.cytogfr.2012.06.004.
Hua Z, Lv Q, YeW,Wong C-KA, Cai G, Gu D, Ji Y, Zhao C,Wang J, Yang BB, ZhangY. 2006.MiRNA-directed regulation of VEGF and other angiogenic factors underhypoxia. PLOS ONE 1:e116 DOI 10.1371/journal.pone.0000116.
Huang DW, Sherman BT, Lempicki RA. 2008. Systematic and integrative analysis oflarge gene lists using DAVID bioinformatics resources. Nature Protocols 4:44–57DOI 10.1038/nprot.2008.211.
Huang DW, Sherman BT, Lempicki RA. 2009. Bioinformatics enrichment tools: pathstoward the comprehensive functional analysis of large gene lists. Nucleic AcidsResearch 37:1–13 DOI 10.1093/nar/gkn923.
Kao J, Salari K, Bocanegra M, Choi Y-L, Girard L, Gandhi J, Kwei KA, Hernandez-Boussard T,Wang P, Gazdar AF, Minna JD, Pollack JR. 2009.Molecular profilingof breast cancer cell lines defines relevant tumor models and provides a resource forcancer gene discovery. PLOS ONE 4(7):e6146 DOI 10.1371/journal.pone.0006146.
Kim JB, Stein R, OHMJ. 2004. Three-dimensional in vitro tissue culture modelsof breast cancer—a review. Breast Cancer Research and Treatment 85:281–291DOI 10.1023/B:BREA.0000025418.88785.2b.
LiW, Jin X, Zhang Q, Zhang G, Deng X, Ma L. 2014. Decreased expression of miR-204 isassociated with poor prognosis in patients with breast cancer. International Journal ofClinical and Experimental Pathology 7:3287–3292.
Boo et al. (2017), PeerJ, DOI 10.7717/peerj.3551 24/27

Li XJ, Ren ZJ, Tang JH. 2014.MicroRNA-34a: a potential therapeutic target in humancancer. Cell Death Dis 5:e1327 DOI 10.1038/cddis.2014.270.
Li Y, Zhang T, Korkaya H, Liu S, Lee H-F, Newman B, Yu Y, Clouthier SG, Schwartz SJ,WichaMS, Sun D. 2010. Sulforaphane, a dietary component of broccoli/broccolisprouts, inhibits breast cancer stem cells. Clinical Cancer Research 16:2580–2590DOI 10.1158/1078-0432.ccr-09-2937.
Liu X, Ma Y, YangW,Wu XIA, Jiang L, Chen X. 2015. Identification of therapeutictargets for breast cancer using biological informatics methods.Molecular MedicineReports 12:1789–1795 DOI 10.3892/mmr.2015.3565.
Lopez J, Poitevin A, Mendoza-Martinez V, Perez-Plasencia C, Garcia-CarrancaA. 2012. Cancer-initiating cells derived from established cervical cell linesexhibit stem-cell markers and increased radioresistance. BMC Cancer 12:48DOI 10.1186/1471-2407-12-48.
Matter MS, Decaens T, Andersen JB, Thorgeirsson SS. 2014. Targeting the mTORpathway in hepatocellular carcinoma: current state and future trends. Journal ofHepatology 60:855–865 DOI 10.1016/j.jhep.2013.11.031.
Mishra P. 2014.MicroRNAs as promising biomarkers in cancer diagnostics. BiomarkerResearch 2:Article 19 DOI 10.1186/2050-7771-2-19.
Mo J-S, Alam KJ, Kang I-H, ParkWC, Seo G-S, Choi S-C, KimH-S, Moon H-B, Yun K-J, Chae S-C. 2015.MicroRNA 196B regulates FAS-mediated apoptosis in colorectalcancer cells. Oncotarget 6:2843–2855 DOI 10.18632/oncotarget.3066.
Morata-Tarifa C, Jiménez G, García MA, Entrena JM, Griñán Lisón C, Aguilera M,Picon-Ruiz M, Marchal JA. 2016. Low adherent cancer cell subpopulations areenriched in tumorigenic and metastatic epithelial-to-mesenchymal transition-induced cancer stem-like cells. Scientific Reports 6:18772 DOI 10.1038/srep18772.
Mosmann T. 1983. Rapid colorimetric assay for cellular growth and survival: applicationto proliferation and cytotoxicity assays. Journal of Immunological Methods 65:55–63DOI 10.1016/0022-1759(83)90303-4.
Murakami Y, Tanahashi T, Okada R, Toyoda H, Kumada T, EnomotoM, Tamori A,Kawada N, Taguchi Yh, Azuma T. 2014. Comparison of hepatocellular carcinomamiRNA expression profiling as evaluated by next generation sequencing andmicroarray. PLOS ONE 9:e106314 DOI 10.1371/journal.pone.0106314.
Nygaard S, Jacobsen A, LindowM, Eriksen J, Balslev E, Flyger H, Tolstrup N, MøllerSR, Krogh A, Litman T. 2009. Identification and analysis of miRNAs in humanbreast cancer and teratoma samples using deep sequencing. BMCMedical Genomics2:35–35 DOI 10.1186/1755-8794-2-35.
Pattabiraman DR,Weinberg RA. 2014. Tackling the cancer stem cells—what challengesdo they pose? Nature Reviews Drug Discovery 13:497–512 DOI 10.1038/nrd4253.
Pickl M, Ries CH. 2008. Comparison of 3D and 2D tumor models reveals enhancedHER2 activation in 3D associated with an increased response to trastuzumab.Oncogene 28(3):461–468 DOI 10.1038/onc.2008.394.
Piero D, RobertWC,Michael FC. 2007. Cancer stem cells: models and concepts. AnnualReview of Medicine 58:267–284 DOI 10.1146/annurev.med.58.062105.204854.
Boo et al. (2017), PeerJ, DOI 10.7717/peerj.3551 25/27

Radojicic J, Zaravinos A, Vrekoussis T, Kafousi M, Spandidos DA, Stathopoulos EN.2011.MicroRNA expression analysis in triple-negative (ER, PR and Her2/neu) breastcancer. Cell Cycle 10:507–517 DOI 10.4161/cc.10.3.14754.
Rampersad SN. 2012.Multiple applications of alamar blue as an indicator of metabolicfunction and cellular health in cell viability bioassays. Sensors 12:12347–12360DOI 10.3390/s120912347.
Ray A, Vasudevan S, Sengupta S. 2015. 6-shogaol inhibits breast cancer cells and stemcell-like spheroids by modulation of notch signaling pathway and induction ofautophagic cell death. PLOS ONE 10:e0137614 DOI 10.1371/journal.pone.0137614.
Ricardo S, Vieira AF, Gerhard R, Leitao D, Pinto R, Cameselle-Teijeiro JF, MilaneziF, Schmitt F, Paredes J. 2011. Breast cancer stem cell markers CD44, CD24 andALDH1: expression distribution within intrinsic molecular subtype. Journal ofClinical Pathology 64:937–946 DOI 10.1136/jcp.2011.090456.
Schneider CA, RasbandWS, Eliceiri KW. 2012. NIH image to ImageJ: 25 years of imageanalysis. Nature Methods 9:671–675 DOI 10.1038/nmeth.2089.
Shen S, Yue H, Li Y, Qin J, Li K, Liu Y,Wang J. 2013. Upregulation of miR-136 inhuman non-small cell lung cancer cells promotes Erk1/2 activation by targetingPPP2R2A. Tumor Biology 35:631–640 DOI 10.1007/s13277-013-1087-2.
Shibuya K, OkadaM, Suzuki S, SeinoM, Seino S, Takeda H, Kitanaka C. 2015.Targeting the facilitative glucose transporter GLUT1 inhibits the self-renewaland tumor-initiating capacity of cancer stem cells. Oncotarget 6:651–661DOI 10.18632/oncotarget.2892.
Shyr D, Liu Q. 2013. Next generation sequencing in cancer research and clinical applica-tion. Biological Procedures Online 15:Article 4 DOI 10.1186/1480-9222-15-4.
Stefanie S, Eric AM, Caldas C. 2008.MicroRNA—implications for cancer. VirchowsArchiv 452:1–10.
Takebe N, Miele L, Harris PJ, JeongW, Bando H, KahnM, Yang SX, Ivy SP. 2015.Targeting Notch, Hedgehog, and Wnt pathways in cancer stem cells: clinical update.Nature Reviews Clinical Oncology 12:445–464 DOI 10.1038/nrclinonc.2015.61.
Taylor MA, Sossey-Alaoui K, Thompson CL, Danielpour D, SchiemannWP. 2012.TGF-B upregulates miR-181a expression to promote breast cancer metastasis. TheJournal of Clinical Investigation 123:150–163 DOI 10.1172/jci64946.
Vincent KM, Findlay SD, Postovit LM. 2015. Assessing breast cancer cell lines astumour models by comparison of mRNA expression profiles. Breast Cancer Research17:Article 114 DOI 10.1186/s13058-015-0613-0.
Visvader JE, Lindeman GJ. 2008. Cancer stem cells in solid tumours: accumulat-ing evidence and unresolved questions. Nature Reviews Cancer 8:755–768DOI 10.1038/nrc2499.
Wang Z, Sun Y. 2009. Targeting p53 for novel anticancer therapy. Translational Oncology3:1–12.
Wu F, Yang Z, Li G. 2009. Role of specific microRNAs for endothelial function andangiogenesis. Biochemical and Biophysical Research Communications 386:549–553DOI 10.1016/j.bbrc.2009.06.075.
Boo et al. (2017), PeerJ, DOI 10.7717/peerj.3551 26/27

Wyman SK, Parkin RK, Mitchell PS, Fritz BR, O’Briant K, Godwin AK, Urban N,Drescher CW, Knudsen BS, Tewari M. 2009. Repertoire of microRNAs in epithelialovarian cancer as determined by next generation sequencing of small RNA cDNAlibraries. PLOS ONE 4:e5311 DOI 10.1371/journal.pone.0005311.
Yan H,WuW, Ge H, Li P, Wang Z. 2015. Up-regulation of miR-204 enhances anoikissensitivity in epithelial ovarian cancer cell line via brain-derived neurotrophicfactor pathway in vitro. International Journal of Gynecological Cancer 25:944–952DOI 10.1097/IGC.0000000000000456.
Yin Y, Zhang B,WangW, Fei B, Quan C, Zhang J, SongM, Bian Z,Wang Q, Ni S, Hu Y,Mao Y, Zhou L,Wang Y, Yu J, Du X, Hua D, Huang Z. 2014.miR-204-5p inhibitsproliferation and invasion and enhances chemotherapeutic sensitivity of colorectalcancer cells by downregulating RAB22A. Clinical Cancer Research 20:6187–6199DOI 10.1158/1078-0432.ccr-14-1030.
Zhao H, Liu S, Wang G,Wu X, Ding Y, Guo G, Cui S. 2015. Expression of miR-136 isassociated with the primary cisplatin resistance of human epithelial ovarian cancer.Oncology Reports 33(2):591–598 DOI 10.3892/or.2014.3640.
Boo et al. (2017), PeerJ, DOI 10.7717/peerj.3551 27/27