phenols are oxidized by one electron to form phenoxyl radicals, which generally decay via rapid
TRANSCRIPT

Mechanistic Features of Lignin Peroxidase Catalyzed Oxidation of
Substituted Phenols and 1,2-Dimethoxyarenes
Gary Ward†, Yitzhak Hadar‡, Itzhak Bilkis♦1 and Carlos G. Dosoretz†1
From † Division of Environmental Engineering and Science, Faculty of Civil and
Environmental Engineering, Technion-Israel Institute of Technology, Haifa 32000,
Israel; ‡ Department of Plant Pathology & Microbiology and ♦ Institute of
Biochemistry, Food Science and Nutrition, The Faculty of Agricultural, Food and
Environmental Quality Sciences, The Hebrew University of Jerusalem, Rehovot
76100, Israel.
1To whom all correspondence should be addressed: Carlos G. Dosoretz (Tel: 972-4-
8294962; Fax: 972-4-8228898; E-mail: [email protected]) or Itzhak Bilkis
(Tel: 972-08-9489932; Fax: 972-08-9363208; E-mail: [email protected])
Running Title:
Mechanistic Features of Lignin Peroxidase-Catalyzed Oxidation
1

SUMMARY
The steady state kinetic parameters Km and kcat for the oxidation of phenolic substrates
by lignin peroxidase correlated with the pre-steady state kinetic parameters Kd and k
for the reaction of the enzyme intermediate compound II with the substrates,
indicating that the latter is the rate limiting step in the catalytic cycle. LnKm and lnKd
values for phenolic substrates correlated with redox properties, unlike lnkcat and lnk.
This finding suggests that in contrast to horseradish peroxidase, electron transfer is
not the rate limiting step during oxidation by lignin peroxidase compound II. A
mechanism is proposed for lignin peroxidase compound II reactions, consisting of an
equilibrium electron transfer step followed by a subsequent rate limiting step.
Analysis of the correlation coefficients for linear relationships between lnKd and lnKm
and different calculated redox parameters supports a mechanism in which the acidic
forms of phenols are oxidized by lignin peroxidase and that electron transfer is
coupled with proton transfer. 1,2-Dimethoxyarenes did not comply with the trend for
phenolic substrates, which may be a result of more than one substrate-binding site on
lignin peroxidase and/or alternative binding modes. This behavior was supported by
analogue studies with the 1,2-dimethoxyarenes, veratric acid and veratryl aldehyde,
both of which are not oxidized by lignin peroxidase. Inclusion of either had little
effect on the rate of oxidation of phenolic substrates, yet resulted in a decrease in the
oxidation rate of 1,2-dimethoxyarene substrates, which was considerable for veratryl
alcohol and less pronounced for 3,4-dimethoxyphenethylalcohol and 3,4-
dimethoxycinnamic acid, in particular in the presence of veratric acid.
2

INTRODUCTION
Lignin peroxidases (LIP)1 play a central role in the biodegradation of the plant cell
wall constituent lignin by white-rot fungi, the most extensively studied of which is
Phanerochaete chrysosporium (1,2). LIP possesses a higher redox potential and lower
pH value than any other peroxidase and in accordance, exhibits broader substrate
specificity (3). Like other peroxidases, it is capable of oxidizing phenolic compounds
(4-6) as well as ring- and N-substituted anilines (7-9). However, it is unique in its
ability to oxidize certain non-phenolic aromatic substrates possessing high redox
potential values, such as substituted aromatic ethers (e.g. veratryl alcohol) (10-13) and
thioethers (14).
The catalytic cycle of LIP is similar to that of other peroxidases (15,16). Reaction of
native ferric enzyme (Fe-LIP: Fe3+ P (porphyrin)) with H2O2 yields LIP-compound I
(LIPI), a complex of high valent oxo-iron and porphyrin cation radical (Fe4+=O P•+).
One-electron-oxidation of a reducing substrate by LIPI yields a radical cation and the
one-electron-oxidized enzyme intermediate, LIP-compound II (LIPII: Fe4+=O P). A
single one-electron oxidation of a second substrate molecule by LIPII, results in the
formation of another radical cation, and the release of a molecule of water, with the
enzyme being returned to Fe-LIP, completing the catalytic cycle. The oxidation of
phenols by LIPI follows second order kinetics and is linearly proportional to substrate
concentration (4,5). Kinetic studies indicate a hyperbolic concentration dependence
for the conversion of LIPII to Fe-LIP by guaiacol (4,5), β-O-4 phenolic lignin
3
1 Abbreviations used: LIP, lignin peroxidase; Fe-LIP, native ferric enzyme; LIPI, LIP-compound I; LIPII, LIP-compound II; HRP, horseradish peroxidase; RZ, Reinheitszahl; IPad(UHF), UHF adiabatic ionization potential; IPad(ROHF), ROHF adiabatic ionization potential; IPv(UHF), UHF vertical ionization potential; IPv(ROHF), ROHF vertical ionization potential; OP, oxidation potential; OPacidic, oxidation potential of undissociated phenol; OPbasic, oxidation potential of phenolate ion; OPpH3.5, oxidation potential calculated at pH 3.5; BEP, bond energy parameter.

oligomers (5), ferulic acid (6) and nonphenolic veratryl alcohol (17), which suggests
at least a two step mechanism for this stage. In this mechanism, rapid equilibrium is
ascribed to binding of a substrate molecule to LIPII, and the rate limiting step is
commonly considered as an electron transfer from the bound substrate molecule to
LIPII (4,5).
The present study focused on investigating the kinetics and thermodynamics for the
oxidation of substituted phenols by LIP. The working hypothesis was that if electron
transfer is the rate limiting step of the oxidation of substituted phenols by LIPII, then
–RTlnk or –RTlnkcat will depend on the thermodynamic driving force of the reaction
according to the Marcus equation (18), as was found for the oxidation of different
organic compounds by horseradish peroxidase (HRP) compound I (19-22) and
compound II (21,22). Furthermore, the research also addressed the kinetics and
thermodynamics for the oxidation of 1,2-dimethoxyarenes by LIP. The findings
provide new insights into the mechanism of oxidation of phenolic substrates by LIP
and furthermore, provide support for the presence of two or more binding sites (23-
26) and/or alternative binding modes for phenolic substrates and 1,2-
dimethoxyarenes.
EXPERIMENTAL PROCEDURES
Enzyme Purification
LIP isoenzyme H1 was produced from high-nitrogen cultures of P. chrysosporium
Burds BKM-F-1767 (27) and purified as described previously (6). The purified
enzyme had an RZ (A409/A280) value > 4.0. LIP concentration was determined at 409
nm using an extinction coefficient of 169 mM-1cm-1 (15) and activity (U/l) was
assayed according to Tien and Kirk (28). The catalytic activity of the stock enzyme
4

solution was calculated to be 2.14 U per nmol heme protein. The enzyme was
extensively dialyzed against double-distilled water before use.
Steady-State Kinetics Studies
Steady-state kinetic studies were conducted with 0.2 µM LIP, substrate (the range
varied for different substrates but was generally between 0-2000 µM and at least 7
different concentrations were examined) and 300 µM H2O2 in 50 mM sodium tartrate
buffer, pH 3.5. Reactions were stopped after 10 s by adding an equal volume of
acetonitrile to inactivate the enzyme and then analyzed by HPLC as described below.
The amount of substrate consumed in 10 s (calculated from blanks without H2O2 and
authentic compounds) for different initial substrate concentrations was determined.
Three replicates of both blanks and reactions were analyzed. Km and kcat were
calculated by non-linear least-squares fits to plots of the initial rate of oxidation as a
function of substrate concentration.
Pre-Steady-State Kinetics
Pre-steady-state kinetics were studied using an SFA-20 stopped flow apparatus (HI-
TECH Scientific, Sussex, UK) attached to a Shimadzu UV-260 spectrophotometer as
previously reported (6). Due to differences in rates between LIPI and LIPII, rate
constants for LIPII could be determined from experiments where it was formed from
the reaction of LIPI with the substrate (17). LIPI was prepared by adding 1 µM H2O2
to 1µM LIP (4) in one of the syringes of the stopped flow apparatus. One minute after
preparation, the pneumatic drive was operated and LIPI was mixed in the
spectrophotometer flow cell with an equal volume of the contents of another syringe
containing substrate and buffer. After mixing, reactions contained 0.5 µM LIPI, 50
mM sodium tartrate buffer, pH 3.5 and varying amounts of substrate (0-1000 µM).
The conversion of LIPII to Fe-LIP as a function of substrate concentration was
5

monitored at 426 nm, the isobestic point between Fe-LIP and LIPI (17). Five
replicates of each of at least 8 different substrate concentrations were studied.
Analogue studies
Analogue studies were conducted with 0.2 µM LIP, 100 µM substrate and 300 µM
H2O2, in the presence and absence of either 1500 µM veratryl aldehyde or veratric
acid. Reactions were stopped after 10 s by adding an equal volume of acetonitrile to
inactivate the enzyme and then analyzed by HPLC as described below. The amount of
substrate consumed in 10 s was calculated from blanks without H2O2 and authentic
compounds. Three replicates of both blanks and reactions were analyzed. The
oxidation of each substrate in the presence of veratryl aldehyde or veratric acid is
presented as a percent of the oxidation in their absence.
HPLC analysis
HPLC analysis was conducted on a Hewlett Packard HPLC (HP1100 series) equipped
with a diode array detector. A Lichrospher 100 RP-18 column (25 cm × 5 mm i.d., 5
µm; Merck, Darmstadt, Germany) was employed for analysis. 3,4-Dihydroxybenzoic
acid was analyzed using a mobile phase consisting of component A (1% v/v, acetic
acid) and component B (1% v/v acetic acid in 90% v/v methanol) (29). All other
substrates were analyzed using a mobile phase that consisted of component A (10%
v/v, aqueous acetonitrile, 1 mM trifluoroacetic acid) and component B (40% v/v,
aqueous methanol, 40%, v/v aqueous acetonitrile, 1 mM trifluoroacetic acid) (30).
The relative amounts of each component of the mobile phase varied according to the
substrate analyzed. The flow rate in all cases was maintained at 1 ml/min.
Quantification was performed by integration of peak-areas at 280 nm for all
substrates, with reference to calibrations, which were made using known amounts of
authentic compounds.
6

Quantum chemical calculations
Optimal geometries and heat of formation of the substrates were determined using the
restricted Hartree-Fock (RHF) AM1 Hamiltonian (31). For radical cations,
unrestricted Hartree-Fock (UHF) (high spin contamination was found) and restricted
open shell Hartree-Fock (ROHF) AM1 Hamiltonians were employed (31). The UHF
and ROHF adiabatic ionization potentials (IPad(UHF) and IPad(ROHF), respectively)
were calculated as the difference between the heats of formation of the substrates and
their radical cations after the optimal geometries were determined. Vertical ionization
potentials (IPv(UHF) or IPv(ROHF)) were calculated using the heats of formation of
radical cations assuming the geometries of the substrates. All the calculations were
performed with the Gaussian 94 (32) and Spartan 5.1 programs.
The difference in the heat of formation of radical cations and parent compounds
calculated for aqueous solutions corresponds to the oxidation potential (OP).
Chemicals
H2O2 (30% v/v solution) was obtained from Sigma (Rehovot, Israel). The
concentration of stock solutions of H2O2 was determined at 240 nm using an
extinction coefficient of 39.4 M-1cm-1 (33).
The substrates chosen for this study are given in Table 1. Phenolic substrates are
given in the upper part of the table and are divided into subfamilies on account of their
substitution patterns. They are followed by 1,2-dimethoxyarenes in the lower part of
the table. All substrates were obtained from Aldrich (Rehovot, Israel), except for
ferulic acid, caffeic acid, catechol, guaiacol, vanillic acid and syringic acid which
were obtained from Sigma and veratrole, which was obtained from Fluka (Rehovot,
Israel).
7

Stock solutions of substrates were made in 95% (v/v) ethanol and checked using the
extinction coefficients given in Table 1. The extinction coefficients were determined
by preparing a series of solutions of increasing concentration for each substrate and
measuring the absorbance at the pre-determined wavelength of maximum absorbance
(λmax). All stock solutions were 100 mM, except 3,4-dimethoxycinnamic acid, which
was 10 mM.
(TABLE 1)
RESULTS
Oxidation of phenolic substrates
Kinetic measurements
In the event that the last stage of the well known ping-pong mechanism (Equation 1)
is rate limiting and controls the overall rate of the catalytic cycle, then steady state
kinetic parameters for LIP catalyzed oxidation will be representative of the conversion
of LIPII to Fe-LIP in the presence of substrate molecules.
LIFe-LIP P
LIP-H2O2
H2OLIPI k3[S]
LIPI-S
PLIPII
k5SLIPII-S
P,H2O
k1[H2O2] k-1
k2 k-3
k4
k-5k6
(1)
According to Segel (34), the observed rate (v) for decay of substrate concentration is
described by equation 2.
8

AB[H2O2] + AC[H2O2] + AD[S] + AF([H2O2][S]
2A[H2O2][S] (2)
A = k1k2k3k4k5k6B = (k-5 + k6)/k5k6C = (k-3 + k4)/k3k4D = (k-1 + k2)/k1k2E = (k2k4 + k2k6 + k4k6)/k2k4k6
v =
The overall reaction rate will be determined by the reactivity of LIPII if k2 < k-1, k4 <
k-3, k6 < k-5 and k6 < k2, k4. In accordance, equation 2 can be simplified to equation 3.
k-5[H2O2]/k5 + k-3k6[H2O2]/k3k4 + (k-1k6/k1k2 + [H2O2])[S]
2k6[H2O2][S] v = (3)
If [H2O2] >> k-1/k1 , the Michaelis-Menten type equation 4 is obtained.
=2k6[S]
k-5/k5 + k-3k6/k3k4 + [S] v (4)=
kcat[S]Km + [S]
Pre-steady kinetics of the conversion of LIPII to Fe-LIP, the last stage in equation 1,
involves monitoring the change in concentration of LIPII upon reaction with substrate
molecules and is depicted in equation 5. If rapid equilibrium is assumed for the first
step, the observed rate of oxidation (v') can be given by equation 6, as previously
described by Koduri and Tien (4).
LIPII + S LIPII-S LIP + P + H2O (5)k5 k6
k-5
v' = k6[S]
k-5/k5 + k6/k5 + S (6)=
Kd + [S]k[S]
9
If steady-state kinetic parameters are representative of the conversion of LIPII to Fe-
LIP (i.e., the conversion of LIPII to Fe-LIP is the rate limiting step in the catalytic
cycle) then according to eq. 4 and 6, it can be expected that k-5/k5 >> k-3k6/k3k4, k6/k5
and thus kcat = 2k and Km = Kd.
Steady state kinetic parameters were determined for all of the substituted phenols.
Pre-steady state kinetic parameters were determined for six of them, chosen to cover
the entire range of redox potentials of the substrates studied under steady state kinetic
conditions. Under steady state conditions, the plots of the initial reaction rate (v) vs.
substrate concentration were hyperbolic for all of the substituted phenols studied.
Non-linear least squares fits were then used to determine Km and kcat, which are
presented in Table 2. Similarly, the plots of the initial reaction rate (v') vs. substrate
concentration for the pre-steady kinetics of the conversion of LIPII to Fe-LIP were
also hyperbolic, in full accordance with equation 5 and as noticed previously for the
conversion of LIPII to Fe-LIP by other substrates (4-6). The kinetic parameters k and
Kd, calculated from equation 6 using a non-linear least-squares fit to the data are
presented in Table 2. The average value of k for the six substrates, 17 s-1, was similar
to the average value of kcat/2 for the same six substrates, 16 s-1. The average value of
kcat/2 for all of the studied phenols was calculated as 15 s-1. Furthermore, a linear
relationship was observed between Kd and Km for the six substrates studied by both
approaches (Fig. 1). Since in accordance with equations 4 and 6, kcat ≅2k and Km ∝
Kd, kinetic parameters obtained under steady-state conditions can be considered to
reflect the reactivity of LIPII, which is thus the rate limiting step in the catalytic cycle.
(TABLE 2, FIG. 1)
10

Estimation of the thermodynamic driving force of electron transfer
To characterize the thermodynamic driving force for the oxidation of substituted
phenols by LIPII, the redox potential of both the enzyme intermediate and the
substrates must be known. The redox potential of LIPII is estimated to be about 1.15-
1.25 V vs. NHE (2).
The redox characteristics of phenols in aqueous solution are dependent on pH.
Oxidation of phenolate leads to formation of the corresponding phenoxyl radical
(equation 7).
PhO- PhO + e (7)
Redox potentials (Eo(PhO./PhO-)) of a large number of substituted phenolates have
been determined experimentally (35-42). The one electron oxidation of undissociated
phenols is usually described as a dissociative electron transfer (middle reaction in
equation 8) and is characterized by higher redox potentials than for the corresponding
phenolates. The redox potential of an undissociated phenol may be calculated using
equation 9 based on the thermodynamic cycle represented in the upper part of
equation 8. When both the undissociated phenol and the phenolate ion are present in
aqueous solution, then equation 10 may be applied to estimate the effective redox
potential at a given pH (43).
PhOH + H2O
PhO- + H3O+
PhO + H3O+ + e
PhO + H + H2O
(8)
Eo(PhO. + H+/PhOH) = Eo(PhO./PhO-) + 0.059 pKa (9)
Eo(PhO. + H+/PhOH) = Eo(PhO./PhO-) + 0.059 (pKa - pH) (10)
11

Another way to estimate the redox potential of an undissociated phenol is based on the
thermodynamic cycle shown in the bottom part of equation 8. In this case the redox
potential is equal to the sum of Bond Dissociation Energy (BDE) of the phenol in eV
and the redox potential of the H+ H. transformation.
(TABLE 3)
The experimentally measured redox potentials are known for only some of the
phenols studied (Table 3). Therefore a calculated parameter that adequately represents
the redox properties of the substrates was sought. Previous studies have relied on three
approaches to calculate parameters that describe the reactivity of phenols with HRP
(44-46). These involve predicting the rate of oxidation either on account of the energy
of the highest occupied molecular orbital (HOMO) of the substrates (44-46), on
account of the relative difference in the heat of formation of the substrate and its
radical cation obtained by one-electron abstraction (45), or on account of the energy
required for hydrogen atom abstraction, since initial hydrogen atom abstraction is
thought to represent an alternative to the initial electron abstraction for the reaction of
phenolic substrates with HRP (45). Nevertheless, these quantum chemical calculations
were performed for systems in vacuum and do not take into account the possible
differences in solvation energies of parent compounds, radical cations, free radicals or
other intermediates. This is especially important for phenolic substrates and their
radical cations, since they are involved in acid-base transformations in aqueous
solutions. As a result, in the present study several additional parameters were tested as
potential representatives of the redox properties of the substrates studied. The first is
based on the suggestion that LIPII is reduced by phenolate anion and involved
calculation of the difference between the heat of formation of phenolate and the
corresponding phenoxyl radical in aqueous solution. In this way, the OP of the basic
12
form (OPbasic) in aqueous solution was calculated. The second parameter is based on
the suggestion that LIPII oxidizes a phenolic substrate in its acidic form and a radical
cation intermediate is formed as the primary product. The difference between the heat
of formation of phenolic substrates and their radical cations in aqueous solution was
calculated and is referred to as OPacidic. The third parameter involves correcting for the
influence of pH, and for this purpose equation 11 was employed, which is similar to
equation 10, that describes the dependence of the Eo on pH.
OP (pH) = OP (of the basic form) + 0.059 (pKa – pH) (11)
pKa values for each of the phenols were retrieved from the literature (47) or calculated
using the SPARC on-line calculator (48). The fourth redox parameter is based on the
possibility that the acidic form of the phenolic compound is oxidized by LIPII
according to the dissociative electron transfer mechanism (middle reaction in equation
8). In this case the calculated redox parameter is associated with the difference
between a phenolic compound and its corresponding phenoxyl radical in aqueous
solution. It is referred to here as the bond energy parameter (BEP). This computer-
calculated redox parameter represents the free energies of reactions on a relative scale
and is not an exact representation. Therefore it only reflects the relative differences
between the energies required for conversion of a series of compounds.
Values of pKa, IPv (UHF and ROHF), IPad (UHF and ROHF), OPbasic (UHF and
ROHF), OPpH3.5 (UHF and ROHF), OPacidic (UHF and ROHF), and BEP (UHF and
ROHF) are presented in Table 3. For all of the calculated redox parameters, a higher
value indicates that the oxidation is less thermodynamically favorable.
Correlation between kinetic parameters and redox parameters.
Plots of lnKm, lnkcat, lnKd and lnk vs. IPv, IPad, OPbasic, OPpH3.5, OPacidic and BEP
yielded the correlation coefficients given in Table 4. LnKm and lnKd values exhibited 13

a linear relationship with all calculated redox parameters (Table 4), the best of which
were obtained with BEP (Figs. 2a and 2b). It is clear from these graphs that the values
of lnKm and lnKd are larger for thermodynamically less favorable reactions. Analysis
of the data for phenolic substrates presented in Table 4 leads to the following
conclusions. The correlation coefficients are generally higher for UHF than for ROHF
calculated redox parameters. Comparison of the correlation coefficients within the
same group of redox parameters (UHF or ROHF) indicates that correlations were
slightly better when values were calculated in aqueous solution.
(TABLE 4, FIG. 2)
In contrast to lnKm and lnKd values, lnk and lnkcat values did not show any
dependence on the redox parameters of the phenols (Table 4). This finding is in
contrast to previous reports for HRP (45), which indicated that such correlations exist
in the case of HRP-catalyzed oxidation of phenols.
Oxidation of 1,2-dimethoxyarenes
The kinetic and thermodynamic parameters for the oxidation of several 1,2-
dimethoxyarenes are presented in Table 5. It is clear that these substrates did not
comply with the trend witnessed for phenolic substrates in which lnKd and lnKm
increased for thermodynamically, less favorable reactions. The differential behavior
between the 1,2-dimethoxyarene and phenolic substrates is illustrated in Figs. 3a and
3b, which show lnKm and lnKd as a function of OP at pH 3.5 for the two sets of
substrates. 1,2-Dimethoxyarenes clearly do not comply with the trend witnessed for
phenolic substrates.
(TABLE 5, FIG. 3)
14
Analogue studies
The differential behavior between the 1,2-dimethoxyarenes and phenolic substrates
prompted analogue studies in which the 1,2-dimethoxyarenes, veratric acid and
veratryl aldehyde, both of which are not oxidized by LIP, were included in reactions
containing phenolic or 1,2-dimethoxyarene substrates. Inclusion of either veratric acid
or veratryl aldehyde had little if any effect on the rate of oxidation of phenolic
substrates (Fig. 4). On the contrary, the rate of oxidation of 1,2-dimethoxyarene
substrates was reduced in the presence of either veratric acid or veratryl aldehyde. The
most pronounced decrease was noticed for veratryl alcohol, whereas the decrease in
rate of oxidation of 3,4-dimethoxyphenethylalcohol and 3,4-dimethoxycinnamic acid
in the presence of veratric acid was the least significant (Fig. 4).
(FIG. 4)
DISCUSSION
Mechanistic features of oxidation of phenolic substrates
The dependence of lnKm and lnKd and independence of lnk and lnkcat on redox
parameters of the phenolic substrates may be explained as follows. After formation of
the binding complex, a fast equilibrium electron transfer from substrate molecule (Ket)
takes place with a subsequent rate limiting step (k6) in which the products of substrate
oxidation do not participate. Accordingly, equation 5 must be modified as follows:
k-5
k6k5
LIP + P + H2O (12)LIPII-SLIPII + S LIPII-PKet
Kinetic analysis of equation 12 leads to equation 13, a Michaelis-Menten like
equation:
15

k[S]Kd + [S]
= (13)k-5/k5(Ket + 1) + k6Ket/k5((Ket + 1) + S
(k6Ket/(Ket + 1))[S]v' =
When the oxidation is carried out under steady state conditions, a similar equation
may be derived for the observed rate (the transformation LIPII → Fe-LIP is rate
limiting).
Two principal situations evolve from equation 13.
I) In the event that the electron transfer step is exergonic, then Ket >>1, and equation
13 is modified to equation 14:
v' = k6[S]
k-5/k5Ket + k6/k5 + S (14)=
Kd + [S]
k[S]
In this case k =k6 and Kd = k-5/k5Ket, if k-5/k5Ket >> k6/k5. A linear relationship
between lnKd and the thermodynamic driving force of the reaction (∆Get) may be
expected if ln(k-5/k5) does not depend significantly on the structure of the phenolic
substrate: lnKd = ln(k-5/k5) - lnKet = ln(k-5/k5) + ∆Get/RT. According to this
expression, lnKd increases with an increase in ∆Get (the thermodynamic driving force
of the reaction). Taking into account the above mentioned restrictions, we can
conclude that equation 12 fits well with our observations. The nature of the rate
limiting step is unclear, but in view of the above mentioned suggestion that substrate
molecules are not involved in this step, a least two possibilities may exist: a) since the
mechanism of transformation of LIPII to Fe-LIP involves transfer of two protons to
the oxygen atom of Fe4+=O and subsequent elimination of a water molecule, this
could be the rate limiting step; b) alternatively reorganization of the reduced heme
moiety, that precedes elimination of water molecule, may be the rate limiting step.
16

II) If the electron transfer step is endergonic (Ket<<1), then a completely different
situation arises (equation 15).
v' = k6Ket[S]
k-5/k5 + k6Ket/k5 + S (15)=
Kd + [S]
k[S]
In this case, lnk = lnk6Ket = lnk6 + lnKet depends on the redox parameters of the
substrate molecules, even though the one electron oxidation of the substrate is not rate
limiting. Therefore, the dependence of lnk or lnkcat on the redox parameters of the
substrate in endergonic enzymatic oxidation does not provide unambiguous evidence
of the redox nature of the rate limiting step.
The specific mechanistic features of LIPII-substituted phenol interactions – an
equilibrium electron transfer step with subsequent rate limiting step - differs from the
commonly accepted suggestion that the rate of compound II reactions is limited by the
electron transfer step. The latter has been well established for the oxidation of
substituted phenols by HRP (21,22,45) and automatically expanded to other less
studied peroxidases. In light of our results, it is very likely that despite the fact that the
general scheme of peroxidase action (equation 1) is similar for all types of
peroxidases, the mechanisms of Compound I- or Compound II-substrate interactions
may differ.
Analysis of the correlation coefficients for linear relationships between lnKd and lnKm
and different calculated redox characteristics (Table 4) sheds some light on the nature
of the electron transfer step. It is obvious that at pH=3.5 all of the phenols studied are
in their acidic form. As a result, any one of three mechanisms may depict the electron
transfer step. The first involves oxidation of phenolate ion obtained by preliminary
abstraction of a proton from the parent phenol. This case is represented by the redox
parameter, OPbasic. The second mechanism involves one electron oxidation of phenol
17

with subsequent abstraction of a proton from the obtained radical cation and is
represented by IPad, IPv or OPacidic. The third mechanism suggests coupled electron
and proton transfer and is represented by BEP or OPpH3.5. Comparison of the
correlation coefficients for the linear relationships reveals that the best fits were
obtained for BEP and OPpH3.5. This supports the third mechanism in which the acidic
forms of phenols are oxidized by LIP and that electron transfer is coupled with proton
transfer.
Oxidation of 1,2-dimethoxyarenes
The results obtained for 1,2-dimethoxyarenes did not comply with trends observed for
phenolic substrates. This finding may be a consequence of different substrate binding
sites and/or alternative binding modes. Indeed, previous research has suggested that
LIP contains at least two substrate binding sites (23-26). Site directed mutagenesis
indicated that veratryl alcohol and probably other hydrophobic substrates are oxidized
at the surface of the enzyme with Trp 171 being implicated in catalysis by long range
electron transfer routes (23). Two mutants lacking Trp 171 lost all activity towards
veratryl alcohol, yet retained substantial activity towards two dye substrates. After a
charge neutralization mutation in the “classical heme edge” of the enzyme, in which
Glu 146 was substituted by Gly, LIP showed substantial activity with respect to
veratryl alcohol and a marked (2.4 pH units) increase in pKa for the oxidation of a
negatively charged difluoroazodye. This indicates that hydrophilic substrates are most
probably oxidized at the “classical heme edge” of the enzyme. To verify whether or
not our findings were a consequence of different binding sites and/or alternative
binding modes, analogue studies were conducted, in which the 1,2-dimethoxyarenes,
veratryl aldehyde and veratric acid, both of which are not oxidized by LIP, were
incorporated into reaction mixtures containing either substituted phenols (4-bromo-
18
and 4-chlorophenol, catechol, ferulic acid, and syringaldehyde) or 1,2-
dimethoxyarenes (3,4-dimethoxyphenethylalcohol, 3,4-dimethoxytoluene, 3,4-
dimethoxycinnamic acid, and veratryl alcohol). Both veratryl aldehyde and veratric
acid suppressed the oxidation of 1,2-dimethoxyarene substrates as reflected by a
decrease in the rate of their oxidation. The decrease was considerable for veratryl
alcohol and less pronounced for 3,4-dimethoxyphenethylalcohol and 3,4-
dimethoxycinnamic acid, in particular in the presence of veratric acid. Overall, these
findings suggest that veratric acid and veratryl aldehyde interfered with the interaction
between the 1,2-dimethoxyarene substrates and the enzyme, competitively inhibiting
their oxidation. Since the oxidation of phenolic substrates was unaffected by the
presence of veratric acid and veratryl aldehyde, it is possible that they are either
oxidized at another site on the enzyme, in accordance with the reports that LIP
possesses more than one binding site (23-26) and/or the modes of binding of phenolic
substrates and 1,2-dimethoxyarenes differ.
The higher OP of veratryl alcohol at pH 3.5 (1.36 V vs. NHE) (49) in comparison to
phenolic substrates (0.79 – 1.17 V vs. NHE, Table 3) is probably the driving force for
veratryl alcohol mediated oxidation of phenolic substrates, which has been
extensively documented (4, 6, 17, 50-52). The radical cation formed upon oxidation of
veratryl alcohol is preferentially reduced by phenolic substrate. Consequently, the
oxidation of veratryl alcohol to veratryl aldehyde begins only after all of the phenolic
substrate has been oxidized. A recent study showed that in the presence of a saturating
concentration of veratryl alcohol, the rate of oxidation of low concentrations of ferulic
acid by LIP approached the kcat value of veratryl alcohol (6). As the concentration of
ferulic acid was increased, the rate of its oxidation increased to a value between the
kcat for veratryl alcohol and the kcat for ferulic acid, suggesting that direct oxidation
and mediated oxidation of ferulic acid were occurring concomitantly. This 19

phenomenon has two possible explanations. According to the first, both compounds
compete for the same interaction site on the enzyme. The second suggests two distinct
interaction sites for phenol and veratryl alcohol. In light of the findings from the
analogue studies in the present paper as well as previous studies which indicate two or
more different substrate binding sites (23-26), the second explanation is more
attractive.
Recently it has been shown that 3,4,-dimethoxycinnamic acid and veratrole, which
also have significantly higher OP values than phenolic substrates (Tables 3 and 5), are
also capable of mediating their oxidation (50). On account of the aforementioned, it is
predicted that the mediation is dependent on the difference between the OP value of
the mediator and the target substrate. Therefore, other 1,2-dimethoxyarenes are also
expected to serve as mediators.
Acknowledgements: This research was supported by The Israel Science Foundation
of The Israel Academy of Science and Humanities and the Grand Water Research
Institute of the Technion.
20

REFERENCES
1. Cai, D. Y., and Tien, M. (1993) J. Biotechnol 30, 79-90
2. Schoemaker, H. E., Lundell, T. K., Floris, R., Glumoff, T., Winterhalter, K.
H., and Piontek, K. (1994) Bioorg. Med. Chem. 2, 509-519
3. Kersten, P. J., Kalyanaraman, B., Hammel, K. E., Reinhammar, B., and Kirk,
T. K. (1990) Biochem.J. 268, 475-480
4. Koduri, R. S., and Tien, M. (1995) J. Biol. Chem. 270, 22254-22258
5. Banci, L., Ciofi-Baffoni, S., and Tien, M. (1999) Biochemistry 38, 3205-3210
6. Ward, G., Hadar, Y., and Dosoretz, C. G. (2001) Enzyme Microb. Technol. 29,
34-41
7. Baciocchi, E., Gerini, M. F., Lanzalunga, O., Lapi, A., Mancinelli, S., and
Mencarelli, P. (2000) J. Chem. Soc. Chem. Commun. 393-394
8. Baciocchi, E., Gerini, M. F., Lanzalunga, O., Lapi, A., Lo Piparo, M. G., and
Mancinelli, S. (2001) Eur. J. Org. Chem. 2305-2310
9. Baciocchi, E., Gerini, M. F., and Lapi, A. (2002) J. Chem. Soc. Chem.
Commun. 946-947
10. Harvey, P. J., Floris, R., Lundell, T., Palmer, J. M., Schoemaker, H. E., and
Wever, R. (1992) Biochem. Soc. Trans. 20, 345-349
11. Harvey, P. J., and Candeias, L. P. (1995) Biochem. Soc. Trans. 23, 262-267
12. Joshi, D. K., and Gold, M. H. (1996) Eur. J. Biochem. 237, 45-57
13. Teunissen, P. J., Sheng, D., Reddy, G. V., Moenne-Loccoz, P., Field, J. A.,
and Gold, M. H. (1998) Arch. Biochem. Biophys. 360, 233-238
14. Baciocchi, E., Gerini, M. F., Harvey, P. J., Lanzalunga, O., and Mancinelli, S.
(2000) Eur. J. Biochem. 267, 2705-2710
21

15. Tien, M., Kirk, T. K., Bull, C., and Fee, J. A. (1986) J. Biol. Chem. 261, 1687-
1693
16. Renganathan, V., and Gold, M. H. (1986) Biochemistry 25, 1626-1631
17. Koduri, R. S., and Tien, M. (1994) Biochemistry 33, 4225-4230
18. Marcus, R. A., and Sutin, N. (1985) Biochim. Biophys. Acta 811, 265-322
19. Candeias, L. P., Folkes, L. K., Porssa, M., and Wardman, P. K. (1996)
Biochemistry 35, 102-108
20. Candeias, L. P., Folkes, L. K., and Wardman, P. (1997) Biochemistry 36,
7081-7085
21. Candeias, L. P., and Folkes, L. K. (1997) FEBS Lett. 412, 305-308
22. Khodpe, S. M., and Priyadarsini, K. I. (2000) Biophys. Chem. 88, 103-109
23. Doyle, W. A., Blodig, W., Veitch, N. C., Piontek, K., and Smith, A. T. (1998)
Biochemistry 37, 15097-15105
24. Choinowski, T., Blodig, W., Winterhalter, K. H., and Piontek, K. (1999) J.
Mol. Biol. 286, 809-827
25. Blodig, W., Smith, A. T., Doyle, W. A., and Piontek, K. (2001) J. Mol. Biol.
305, 851-861
26. Piontek, K., Smith, A. T., and Blodig, W. (2001) Biochem. Soc. Trans. 29,
111-116
27. Rothschild, N., Hadar, Y., and Dosoretz, C. G. (1997) Appl. Environ.
Microbiol. 63, 857-861
28. Tien, M., and Kirk, T. K. (1988) Methods Enzymol. 161, 238-249
29. Park, J. W., Dec, J., Kim, J. E., and Bollag, J. M. (1999) Environ. Sci.
Technol. 33, 2028-2034
30. Ward, G., Hadar, Y., Bilkis, I., Konstantinovsky, L., and Dosoretz, C. G.
(2001) J. Biol. Chem. 276, 18734-18741 22

31. Dewar, M. J. S., Zoebish, E. G., Healy, E. F., and Stewart, J. J. P. (1985) J.
Am. Chem. Soc. 107, 3902-3909
32. Frisch, M. J., Trucks, G. W., Schlegel, H. B., Gill, P. M. W., Johnson, B. G.,
Robb, M. A., Cheeseman, J. R., Keith, T., Petersson, G. A., Montgomery, J.
A., Raghavachari, K., Al-Laham, M. A., Zakrzewski, V. G., Ortiz, J. V.,
Foresman, J. B., Cioslowski, J., Stefanov, B. B., Nanayakkara, A.,
Challacombe, M., Peng, C. Y., Ayala, P. Y., Chen, W., Wong, M. W., Andres,
J. L., Replogle, E. S., Gomperts, R., Martin, R. L., Fox, D. J., Binkley, J. S.,
Defrees, D. J., Baker, J., Stewart, J. P., Head-Gordon, M., Gonzalez, C., and
Pople, J. A. (1995) Gaussian 94, Revision E.2, Gaussian Inc., Pittsburgh, PA
33. Nelson, D. P., and Kiesow, L. A. (1972) Anal. Biochem. 49, 474-478
34. Segel, H. M. (1975) in Enzyme Kinetics, pp. 727-728, Wiley Interscience
Publication, N.Y.
35. Steenken, S., and Neta, P. (1979) J. Phys. Chem. 83, 1134-1137
36. Steenken, S., and Neta, P. (1982) J. Phys. Chem. 86, 3661-3667
37. Lind, J., Shen, X., and Eriksen, T. E. (1990) J. Am. Chem. Soc. 112, 479-482
38. Jovanovic. S. V., Tosic, M., and Simic, M. G. (1991) J. Phys. Chem. 95,
10824-10827
39. Jovanovic, S. V., Steenken, S., Tosic, M., Marjanovic, B., and Simic, M. G.
(1994) J. Am. Chem. Soc. 116, 4846-4851
40. Priyadarsini, K. I., Guha, S. N., and Rao, M. N. A. (1998) Free Radical Bio.
Med. 24, 933-941
41. Lin, W., Navaratnam, S., Yao, S., and Lin, N. (1998) Radiat. Phys. Chem. 53,
425-433
42. Li, C., and Hoffman, M. Z. (1999) J. Phys. Chem. B 103, 6653-6656
43. Wardman, P. (1989) J. Phys. Chem. Ref. Data 18, 1637-1755 23

44. Sakurada, J., Sekiguchi, R., Sato, K., and Hosoya, T. (1990) Biochemistry 29,
4093-4098
45. Van Haandel, M. J. H., Rietjens, I. M. C. M., Soffers, A. E. M. F., Veeger, C.,
Vervoort, J., Modi, S., Mondal, M. S., Patel, P. K., and Behere, D. (1996) J.
Biol. Inorg. Chem. 1, 460-467
46. van Haandel, M. J. H., Claasens, M. M. J., Van der Hout, N., Boersma, M. G.,
Vervoort, J., and Rietjens, I. M. C. M. (1999) Biochim. Biophys. Acta 1435,
22-29
47. Hilal, S., Karickhoff, S. W., and Carreira, L. A. (1995) Quant. Struc. Act. Rel.
14, 348
48. Http://ibmlc2.chem.uga.edu/sparc/.
49. Bietti, M., Baciocchi, E., and Steenken, S. (1998) J. Phys. Chem. A 102, 7337-
7342
50. Ward, G., Belinky, P., Hadar, Y., Bilkis, I., and Dosoretz, C. G. (2002)
Enzyme Microb. Technol. 30, 490-498
51. Harvey, P. J., Schoemaker, H. E., and Palmer, J. M. (1986) FEBS Lett. 195,
242-246
52. Goodwin, D. C., Aust, S. D., and Grover, T. A. (1995) Biochemistry 34, 5060-
5065
24
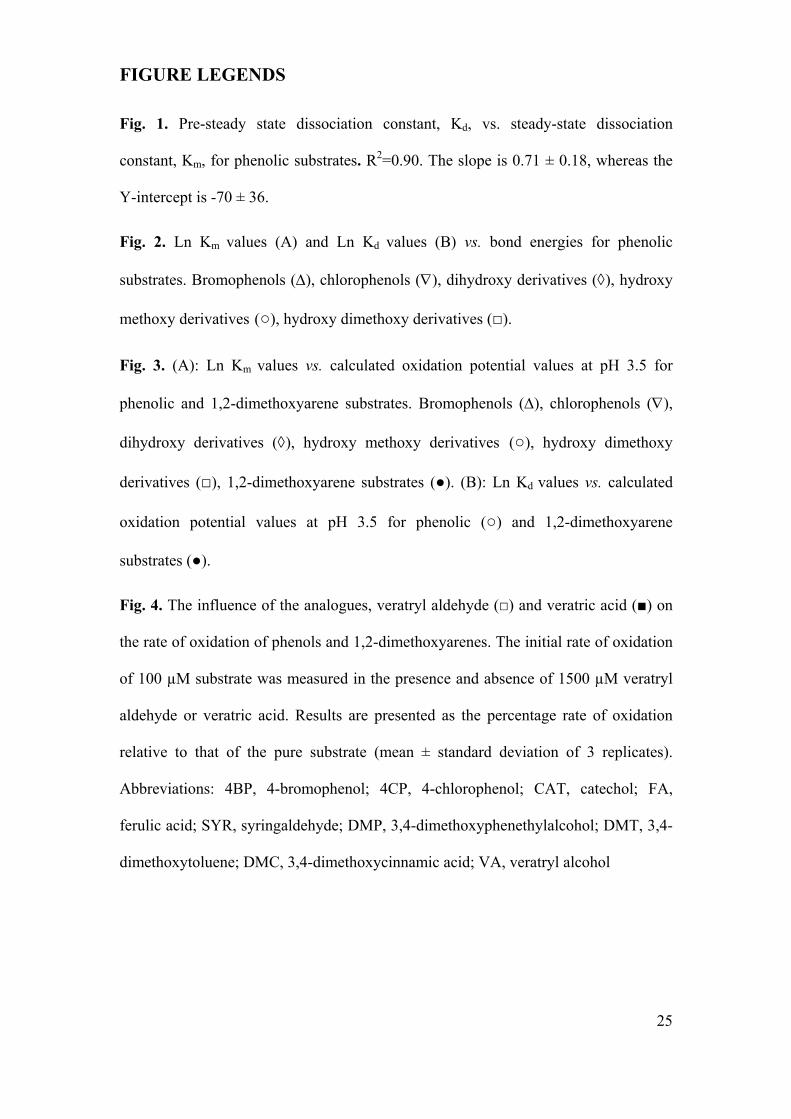
FIGURE LEGENDS
Fig. 1. Pre-steady state dissociation constant, Kd, vs. steady-state dissociation
constant, Km, for phenolic substrates. R2=0.90. The slope is 0.71 ± 0.18, whereas the
Y-intercept is -70 ± 36.
Fig. 2. Ln Km values (A) and Ln Kd values (B) vs. bond energies for phenolic
substrates. Bromophenols (∆), chlorophenols (∇), dihydroxy derivatives (◊), hydroxy
methoxy derivatives (○), hydroxy dimethoxy derivatives (□).
Fig. 3. (A): Ln Km values vs. calculated oxidation potential values at pH 3.5 for
phenolic and 1,2-dimethoxyarene substrates. Bromophenols (∆), chlorophenols (∇),
dihydroxy derivatives (◊), hydroxy methoxy derivatives (○), hydroxy dimethoxy
derivatives (□), 1,2-dimethoxyarene substrates (●). (B): Ln Kd values vs. calculated
oxidation potential values at pH 3.5 for phenolic (○) and 1,2-dimethoxyarene
substrates (●).
Fig. 4. The influence of the analogues, veratryl aldehyde (□) and veratric acid (■) on
the rate of oxidation of phenols and 1,2-dimethoxyarenes. The initial rate of oxidation
of 100 µM substrate was measured in the presence and absence of 1500 µM veratryl
aldehyde or veratric acid. Results are presented as the percentage rate of oxidation
relative to that of the pure substrate (mean ± standard deviation of 3 replicates).
Abbreviations: 4BP, 4-bromophenol; 4CP, 4-chlorophenol; CAT, catechol; FA,
ferulic acid; SYR, syringaldehyde; DMP, 3,4-dimethoxyphenethylalcohol; DMT, 3,4-
dimethoxytoluene; DMC, 3,4-dimethoxycinnamic acid; VA, veratryl alcohol
25
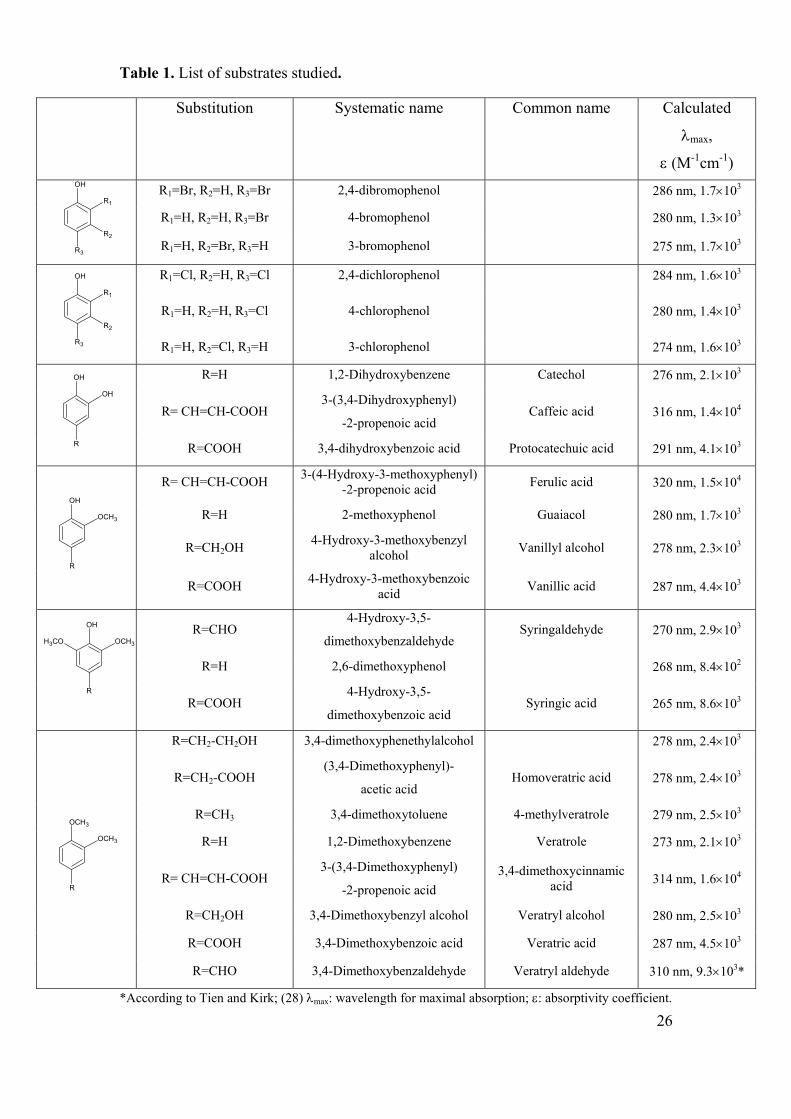
Table 1. List of substrates studied.
Substitution Systematic name Common name Calculated
λmax,
ε (M-1cm-1)
R1=Br, R2=H, R3=Br 2,4-dibromophenol 286 nm, 1.7×10³
R1=H, R2=H, R3=Br 4-bromophenol 280 nm, 1.3×10³
OH
R2
R1
R3 R1=H, R2=Br, R3=H 3-bromophenol 275 nm, 1.7×10³
R1=Cl, R2=H, R3=Cl 2,4-dichlorophenol 284 nm, 1.6×10³
R1=H, R2=H, R3=Cl 4-chlorophenol 280 nm, 1.4×10³
OH
R2
R1
R3 R1=H, R2=Cl, R3=H 3-chlorophenol 274 nm, 1.6×10³
R=H 1,2-Dihydroxybenzene Catechol 276 nm, 2.1×10³
R= CH=CH-COOH 3-(3,4-Dihydroxyphenyl)
-2-propenoic acid Caffeic acid 316 nm, 1.4×10⁴
OH
OH
R R=COOH 3,4-dihydroxybenzoic acid Protocatechuic acid 291 nm, 4.1×10³
R= CH=CH-COOH 3-(4-Hydroxy-3-methoxyphenyl) -2-propenoic acid Ferulic acid 320 nm, 1.5×10⁴
R=H 2-methoxyphenol Guaiacol 280 nm, 1.7×10³
R=CH2OH 4-Hydroxy-3-methoxybenzyl alcohol Vanillyl alcohol 278 nm, 2.3×10³
OH
OCH3
R R=COOH 4-Hydroxy-3-methoxybenzoic
acid Vanillic acid 287 nm, 4.4×10³
R=CHO 4-Hydroxy-3,5-
dimethoxybenzaldehyde Syringaldehyde 270 nm, 2.9×10³
R=H 2,6-dimethoxyphenol 268 nm, 8.4×10²
OH
OCH3H3CO
R
R=COOH 4-Hydroxy-3,5-
dimethoxybenzoic acid Syringic acid 265 nm, 8.6×10³
R=CH2-CH2OH 3,4-dimethoxyphenethylalcohol 278 nm, 2.4×10³
R=CH2-COOH (3,4-Dimethoxyphenyl)-
acetic acid Homoveratric acid 278 nm, 2.4×10³
R=CH3 3,4-dimethoxytoluene 4-methylveratrole 279 nm, 2.5×10³
R=H 1,2-Dimethoxybenzene Veratrole 273 nm, 2.1×10³
R= CH=CH-COOH 3-(3,4-Dimethoxyphenyl)
-2-propenoic acid 3,4-dimethoxycinnamic
acid 314 nm, 1.6×10⁴
R=CH2OH 3,4-Dimethoxybenzyl alcohol Veratryl alcohol 280 nm, 2.5×10³
R=COOH 3,4-Dimethoxybenzoic acid Veratric acid 287 nm, 4.5×10³
OCH3
OCH3
R
R=CHO 3,4-Dimethoxybenzaldehyde Veratryl aldehyde 310 nm, 9.3×10³*
*According to Tien and Kirk; (28) λmax: wavelength for maximal absorption; ε: absorptivity coefficient. 26

Table 2. Kinetic parameters of substituted phenols.
Substrate kcat, s-1 Km, µM k, s-1 Kd, µM
2,4-dibromophenol (4.3±0.2)×101 (3.8±0.6)×102
4-bromophenol (4.0±0.5)×101 (5.2±1.5)×102 (2.3±0.2)×101 (3.1±0.8)×102
3-bromophenol (3.0±0.5)×101 (1.3±0.6)×103
2,4-dichlorophenol (2.3±0.2)×101 (3.3±1.1)×102 (1.6±0.2)×101 (1.4±0.4)×102
4-chlorophenol (2.2±0.2)×101 (3.2±0.8)×102 (1.5±0.2)×101 (1.9±0.7)×102
3-chlorophenol (2.7±0.5)×101 (7.9±3.6)×102
Catechol (3.6±0.2)×101 (1.9±0.4)×102
Caffeic acid (3.8±0.3)×101 (2.2±0.4)×102 (1.6.±0.1)×101 (2.0±0.6)×101
Protocatechuic acid (2.5±0.3)×101 (4.4±1.3)×102
Ferulic acid (3.8±0.1)×101 (1.0±0.1)×102 (1.6±0.1)×101 (2.8±0.4)×101
Guaiacol (3.8±0.1)×101 (1.7±0.2)×102
Vanillyl alcohol (3.9±0.2)×101 (1.2±0.2)×102
Vanillic acid (1.8±0.1)×101 (1.6±0.4)×102
Syringaldehyde (1.3±0.1)×101 (1.7±0.3)×102
2,6-dimethoxyphenol (2.7±0.3)×101 (9.7±4.5)×101 (1.5±0.1)×101 (1.3±0.7)×101
Syringic acid (1.0±0.1)×101 (1.1±0.4)×102
Km and kcat are steady state parameters calculated from non-linear least-squares fits to plots of the initial rate of oxidation as a function of substrate concentration (3 replicates of each of at least 7 different substrate concentrations in the range 0-2000 µM were studied).
Kd and k are pre-steady state kinetic parameters calculated from equation 6 using a non-linear least-squares fit to plots of initial reaction rate vs. substrate concentration (five replicates of each of at least 8 different substrate concentrations were studied). Data are presented as the mean ± standard error.
27

Table 3. Experimentally determined and calculated redox parameters, and pKa values for studied substituted phenols.
Substrate pKa Eo, V Ph=3.5
IPad(uhf)/ IPad(rohf)
, Ev
IPv(uhf)/ IPv(rohf),
Ev
BEP, Ev OPacidic, Ev OPbasic, Ev OPpH3.5, Ev
2,4-dibromophenol 7.79 8.70/8.89 8.91/9.08 1.17/1.60 6.51/6.76 5.25/5.68 5.50/5.93
4-bromophenol 9.17 1.17 8.56/8.73 8.78/8.94 1.17/1.59 6.35/6.60 5.12/5.54 5.45/5.87
3-bromophenol 9.03 8.66/8.86 8.88/9.08 1.17/1.60 6.36/6.57 5.07/5.48 5.39/5.80
2,4-dichlorophenol 7.89 8.60/8.82 8.82/8.99 1.08/1.51 6.40/6.61 5.09/5.52 5.35/5.78
4-chlorophenol 9.35 1.15 8.48/8.63 8.72/8.86 1.12/1.52 6.28/6.48 5.04/5.44 5.38/5.78
3-chlorophenol 9.13 8.61/8.82 8.83/9.02 1.16/1.58 6.35/6.56 5.07/5.48 5.40/5.81
Catechol 9.45 0.84 8.21/8.37 8.44/8.61 0.98/1.32 6.06/6.20 4.84/5.17 5.19/5.52
Caffeic acid 9.07 0.85 8.20/8.48 8.42/8.68 0.93/1.43 6.06/6.35 4.82/5.32 5.14/5.64
Protocatechuic acid 8.64 0.81 8.66/8.76 8.82/9.00 1.01/1.37 6.15/6.28 4.95/5.31 5.25/5.61
Ferulic acid 9.39 0.90 8.05/8.33 8.27/8.53 0.87/1.35 6.02/6.31 4.78/5.26 5.12/5.60
Guaiacol 9.90 0.89 8.05/8.21 8.29/8.46 0.97/1.32 6.07/6.23 4.79/5.15 5.16/5.52
Vanillyl alcohol 9.99 7.90/8.07 8.12/8.29 0.94/1.30 6.06/6.22 4.77/5.14 5.15/5.52
Vanillic acid 9.39 0.98 8.41/8.58 8.66/8.83 1.01/1.38 6.17/6.32 4.92/5.29 5.26/5.63
Syringaldehyde 7.54 8.03/8.26 8.29/8.51 0.88/1.32 6.21/6.46 4.92/5.36 5.16/5.60
2,6-dimethoxyphenol 9.69 0.79 7.77/7.96 8.02/8.20 0.83/1.23 6.04/6.24 4.66/5.07 5.02/5.43
Syringic acid 9.49 0.86 8.12/8.33 8.35/8.58 0.88/1.31 6.12/6.37 4.76/5.19 5.11/5.54
Abbreviations: Eo, experimentally determined redox potential; IPad(UHF), UHF adiabatic ionization potential; IPad(ROHF), ROHF adiabatic ionization potential; IPv(UHF), UHF vertical ionization potential; IPv(ROHF), ROHF vertical ionization potential; BEP, bond energy parameter; OPacidic, oxidation potential of undissociated phenol; OPbasic, oxidation potential of phenolate ion; OPpH3.5, oxidation potential calculated for pH 3.5
28

Table 4. Correlation coefficients (R2) between the natural logarithm of the empirical kinetic parameters and experimentally determined and calculated redox parameters of substituted phenolic substrates.
Ln kcat Ln Km Ln k Ln Kd
Eo, V (pH=3.5) 4.3×10⁻³ 3.0×10⁻¹ 4.2×10⁻¹ 9.9×10⁻¹
UHF 7.7×10⁻³ 7.4×10⁻¹ 3.0×10⁻¹ 8.4×10⁻¹ IPad
ROHF 7.9×10⁻³ 7.3×10⁻¹ 2.7×10⁻¹ 7.3×10⁻¹
UHF 4.5×10⁻³ 7.4×10⁻¹ 2.9×10⁻¹ 8.6×10⁻¹ IPv
ROHF 2.7×10⁻³ 7.4×10⁻¹ 2.9×10⁻¹ 7.7×10⁻¹
UHF 8.7×10⁻² 7.8×10⁻¹ 4.3×10⁻¹ 9.5×10⁻¹ BEP
ROHF 7.2×10⁻² 7.2×10⁻¹ 4.6×10⁻¹ 8.4×10⁻¹
UHF 7.4×10⁻⁵ 5.5×10⁻¹ 2.3×10⁻¹ 8.0×10⁻¹ OPacidic
ROHF 1.5×10⁻⁴ 4.5×10⁻¹ 3.9×10⁻¹ 8.6×10⁻¹
UHF 2.0×10⁻² 6.4×10⁻¹ 3.8×10⁻¹ 9.4×10⁻¹ OPbasic
ROHF 1.6×10⁻² 5.6×10⁻¹ 3.9×10⁻¹ 8.4×10⁻¹
UHF 5.4×10⁻² 6.8×10⁻¹ 4.4×10⁻¹ 9.8×10⁻¹ OPpH3.5
ROHF 4.6×10⁻² 6.1×10⁻¹ 4.9×10⁻¹ 8.8×10⁻¹
Abbreviations: IPad(UHF), UHF adiabatic ionization potential; IPad(ROHF), ROHF adiabatic ionization potential; IPv(UHF), UHF vertical ionization potential; IPv(ROHF), ROHF vertical ionization potential; BEP, bond energy parameter; OPacidic, oxidation potential of undissociated phenol; OPbasic, oxidation potential of phenolate ion; OPpH3.5, oxidation potential calculated at pH 3.5
29

Table 5. Calculated oxidation potential and experimentally determined kinetic parameters for 1,2-dimethoxyarenes.
Substrate OPpH 3.5,eV kcat, s-1 Km, µM k, s-1 Kd, µM
3,4-dimethoxyphenethylalcohol 6.05 (1.3±0.1)×101 (6.1±1.6)×101 (1.5±0.1)×101 (8.7±2.9)×101
Homoveratric acid 6.11 (1.9±0.1)×101 (1.4±0.2)×102 (1.5±0.1)×101 (5.1±1.9)×101
4-methylveratrole 6.01 (1.8±0.1)×101 (5.0±1.1)×101 (9.7±0.7)×100 (5.0±1.6)×101
Veratrole 6.04 (6.9±1.3)×100 (3.1±1.4)×102
3,4-dimethoxycinnamic acid 6.08 (1.5±0.2)×101 (2.4±0.9)×102
Veratryl alcohol 6.09 1.3×101* (7.2±1.0)×101 (1.9±0.1)×101 (1.9±0.2)×102
OPpH3.5 is the oxidation potential calculated at pH 3.5. Km and kcat are steady state parameters calculated from non-linear least-squares fits to plots of initial rate of oxidation as a function of substrate concentration (3 replicates of each of at least 7 different substrate concentrations in the range 0-2000 µM were studied). Kd and k are pre-steady state kinetic parameters calculated from equation 6 using a non-linear least-squares fit to plots of initial reaction rate vs. substrate concentration (five replicates of each of at least 8 different substrate concentrations were studied). Data are presented as the mean ± standard error. *Standard error for veratryl alcohol was less than 0.05 s-1.
30
Fig. 1
0 100 200 300 400 500 6000
100
200
300
400
Km, µM
Kd,
µM
31
Fig. 2
0.7 0.8 0.9 1.0 1.1 1.2 1.33
4
5
6
7
8
Ln K
m
0.7 0.8 0.9 1.0 1.1 1.2 1.30
2
4
6
8
BEP, eV
Ln K
d
A
B
32

Fig. 3
4.5 5.0 5.5 6.0 6.53
4
5
6
7
8
Ln K
m
4.5 5.0 5.5 6.0 6.50
2
4
6
8
OP(UHF, pH 3.5), eV
Ln K
d
A
B
33

Fig. 4
4BP
4CP
CA
T
FA
SYR
DM
P
DM
T
DM
C
VA
60
80
100
120
Phenols 1,2-dimethoxyarenes
Rel
ativ
e ox
idat
ion
rate
(%)
34