phd thesis abstract - ulb sibiudigital-library.ulbsibiu.ro/dspace/bitstream/123456789...operated in...
TRANSCRIPT

1
Ing. Lucian Ion ROMAN
PhD THESIS ABSTRACT
RESEARCH REGARDING THE OPTIMIZATION OF THE SUSPENSIONS OF
AUTOMOBILES USED IN ROMANIA
2
THE IMPORTANCE AND THE MOTIVATION OF THE PRESENT STUDY
This doctoral thesis approaches an interdisciplinary field, namely the mechanical
engineering in general terms, the automotive components design and optimizations
resulting from computer science field.
The achievement of this thesis is based on multiple reasons, among which I mention:
the need for applied engineering studies, with the aim of optimizing the building of
automotive parts, the favorable social impact such a study has, usefulness of developing
computer-assisted systems to improve the management of car maintenance and the
reliability of their predictions, the importance of interdisciplinary approach, the own
experience as an engineer for vehicle repairer.
CHALLENGES IN THE VEHICLES RELIABILITY
Reliable system design is concerned with making systems work even in the
face of internal or external problems. In the automotive domain reliability refers to
designing a car that is safe. In this sense it should be developed applications that
control real-time vehicle. The modern automobiles are complex technical systems
which require control systems that are physically distributed around the vehicle (15
to 20 base aggregate subsystems with different functional responsibilities and
mechanisms). Networks have been designed specifically to meet the needs of real-
time distributed control for automotive components. The basic fact that drives the
design of control systems for vehicles is that they are safety-critical systems. Errors
of any kind - component failure, design flaws, exceeding the number of kilometers
that have made technical revision, etc. - can injure or kill people. Not only must these
systems be carefully verified, but they also must be architected to guarantee certain
properties [1].
In the operation process and even in downtime period of vehicles occurring
phenomena leading to worsening functional indicators and partial or total loss of
functional capacities and performance. Preservation in time the whole system
performance leads to vehicle reliability. An important parameter that defines cars
reliability is the Reliability Index [2], a score that is calculated as a combination of the
number of times a car fails, the cost of repairing it, the average amount of time it
spends off the road due to repairs, the age of the vehicles. Influencing factors resulted

3
in operating conditions can be related on the one hand the quality of the various
materials used to maintain the functionality of the vehicle such as lubricants, fuels,
liquid cooling system, brakes, actuators, etc., and on another part of the travel and
transport conditions highlighted by road and climatic qualities, operating system,
quality management and others. During vehicle operation are continuous interaction
between parts, mechanisms and materials and operating units. Depending on their
properties, it speeds up or slows down the degradation of parts and depositing the
material residues, with secondary influence on the aggregates' functioning, it
changes the consumption of operating material and vehicles productivity. Adopting
of operating materials must comply constructive and technological peculiarities of
motor vehicles, their technical status and operating conditions. Basic factors of
operating conditions that influence reliability and durability are the road conditions,
weather conditions, operating mode, quality management, quality maintenance and
quality auto repair. Due to operating conditions, the car manufacturers differentiate
the period in which they perform maintenance revision, depending by country,
geographic area, etc. [3].
The reliability domain is extremely large. When discussing about cars even we
have to split the diagnosis in two: the electronic system reliability and the mechanical
system reliability. Therefore, in this paragraph we first intend to explain some basic
concepts about reliability and then to focus on some challenges in terms of vehicles'
reliability, mainly of mechanical's system, exemplifying with OPEL cars.
Basic concepts
The availability of a system at time t is the probability that the system is
operating correctly at time t. The reliability of a system at time t is the probability that
the system has been operating correctly from time zero until time t [2]. However,
many times reliability is less appropriate metric. In the event of a catastrophic system
failure car, reliability is a less useful metric than availability. Maintainability is the
probability that maintenance of the system will retain the system in, or restore it to, a
specified condition within a given time period. Reliability, availability, maintainability
(RAM) are fundamental features of any system and the RAM performance should be
optimized to get the best value from the engineering design and enable a system to
meet the service expectations.
After duration and mode of occurrence there are known three kinds of faults
and errors:
Transient (due to electronics circuits),
Permanent (due to physical wear-out, fabrication defects or design
bugs)
4
Intermittent.
The complicate design of technical systems, in order to assure high
performance may represent, in some cases, even their degradation sources. In these
conditions, it can reach a critical level of development and improvement of systems,
in which the recovery time would equal the production of new products. Avoiding such
situations is the basic principle of terotechnology which involves a continuous
improvement in reliability in parallel with technological development [3].
AUTOMOTIVE SUSPENSION SYSTEM
Suspension system is a subassembly of the vehicle that connects the rolling elements
with the passenger compartment of the car. The functional role of the suspension must be
regarded in a double sense, on the one hand is designed to retrieve and transmit evenly to
the ground the loads and forces applied on the vehicle and on the other hand it isolates the
passenger compartment of the vehicle by the stresses received from the roadway, thereby
the comfort of the journey is enhanced.
From designing point of view, a vehicle suspension includes: elastic elements
(springs), which constitutes the effective suspension, rolling subassemblies,
damping and stabilization subassemblies.
Automotive suspensions can be classified after several criteria such as:
-after the guiding device;
-after the elastic element;
-after the type suspension feature.
According to the first criterion of classification (guiding device) suspensions
can be dependent or independent.
Elastic element type, suspensions are classified into:
-Suspension with metalic elements;
-Suspension with pneumatic elements;
-Suspension with hydropneumatic elements;
-Suspension with rubber elements;
-Suspension with mixed elements;
Finally, the third criterion of classification - type of the elastic feature - divides
the suspensions as follows:
-with linear characteristic;
-step by step characteristic
-with progressive characteristic.

5
Within the present thesis there have been presented in terms of design the
main types of suspensions, used nowadays in automotive construction, as well as
theories regarding rolling motion:
A. Independent suspension with helicoidal spring
B. Independent suspension with elastic foot type helicoidal spring
C. Independent suspension with lamellar resilient element transversely
disposed
D. Independent suspension with stabilizer bar resilient element
E. Independent suspension with pneumatic resilient element
F. Stabilizer bar
G. Rolling motion
THESIS OBJECTIVES
The general objective is to contribute to increasing the reliability of Opel cars operated in Romania and the passenger comfort by optimizing their suspension.
In accordance with this overall objective, this doctoral thesis proposes the following specific objectives:
1. Synthesizing and structuring the actual stage of the researches;
2. Accomplishing an analysis of reliability and maintenance of passenger cars by implementing a relational database and the creation of a software application for the management of maintenance thereof;
3. Implementing of multi-objective optimization algorithms for optimization of suspension system as the main vulnerability;
4. Mathematical modeling for kinematic and dynamic simulation of the suspension system.
5. Advanced optimization of suspension parameters in order to achieve the target of stability and comfort in different operating conditions;
6. CAD three dimensional modeling of the anti-roll power link
7. The topological optimization and carring out static analysis through finite element method of the anti-roll power link body.
8. Experimental study on mechanical and elastical characteristics of the raw material of the anti-roll power link and its behaviour at the most important stresses in operation.
6
IMPLEMENTING A RELATIONAL DATABASE
TO SURVEY CARS' RELIABILITY EXPLOITED IN
ROMANIA
In this section, starting from Microsoft Excel documents we developed a
crawler module and we designed a relational database that supports time analysis of
defects cars. By highlighting common patterns present in car service and parts
production failure, and through their intelligent analysis may result important
information regarding to cars' reliability and maintainability. Experimental research
was to study the behavior in operating a well-determined period of time of Opel cars
and data collection from invoice services documents. With the help of this software
application it can gather huge history information from any car service indexing files
system and, through further investigations, the manager obtains an extremely agile
understanding of the common malfunctions that a car system can suffer and even
point out to parts producer, patterns that appear in their design.
The main aim of this chapter is to implement a relational database to survey
cars' reliability exploited in Romania. By emphasizing certain patterns (spare parts /
maintenance services) that frequently occur in the automotive services and through
their intelligent analysis may result important information regarding to cars' reliability
and maintainability. This will improve the quality of spare parts production through
focusing on specific directions depending on the geographic area, the infrastructure
of the region, environmental conditions, characteristics of fuels, etc.
The scientific approach is based on Data Mining - an interdisciplinary field of
computer science that aims to discover patterns in large data sets. Methods involved
are at the intersection of artificial intelligence, machine learning, statistical and
database management systems. As we detailed further in section III paragraph C,
we developed in Microsoft Visual Studio 2012 (using C# programming
language), .NET Framework, using Microsoft SQL Server 2008, a software
application that extract the relevant data from archive of orders with maintenance
service operations, automotive components and spare parts. Further, these
commands will be called briefly invoice services (IS). The application's input consists
in information from any car service indexing files system. Currently, these information
7
are office documents of Microsoft Excel and Microsoft Word types. The purpose of
the application (output) is to design, implement and populate a relational database
with extracted data. As more data are extracted as more accurate will be the analysis.
At present, the database is customized to serve at AutoHaus Huber SRL Sibiu, OPEL
dealer, but with small modifications it could be extended to any auto service from
Romania or outside.
The present application is extremely useful because the processing and
interpretation of data extracted obtain a fairly accurate understanding of the common
faults that may occur in operating a motor vehicle, may determine the causes of
breakdowns, can identify abnormal wear. Also, it can track mode troubleshooting and
even it can suggest to manufacturer the templates that appear in spare parts design.
This type of analysis is called “Business intelligence” and it is becoming one of the
key factors in planning marketing strategies. With this pattern recognition ability the
management team can easily take decisions that in the past were consider risky and
dependent on the manager skills on the subject.
The further organization of this section is as follows: Section 4.1 describes the
Database Architecture. It starts with a theoretical background regarding Database
design, then it introduces the developed three-tier architecture, it details the business
layer concept and finishes with Database mapping, presenting the data structures
and relations between tables.
DATABASE ARCHITECTURE
A. Explaining the basic concepts
Because our paper has an interdisciplinary character applying domain-specific
tools computer science in industrial engineering, specifically road vehicles and
transportation engineering, we start this section by explaining some main concepts
regarding databases. The first step in order to implement a relational database that
supports time analysis of defects cars is data collection and analysis and
implementation of a conceptual model. At this stage are considered nature and the
use of data. Identified data will be stored and processed, and are divided into logical
groups and establishes relationships between groups. This stage should be
according with client's requests (in this case OPEL). The most important feature in
database design is the normalization. This technique eliminates / avoids certain
anomalies and data inconsistencies. Thus, the data should not be redundant and
data manipulation operations (update / insert / delete) must ensure database
integrity. A design tool of conceptual model of relational databases is Entity
Relationship Diagram (ERD). An ERD developed during the conceptual data
8
modeling phase of the database development process is generally transformed and
enhanced through normalization principles during the logical database design phase.
The next design step is to transform conceptual model into logical schema of data
model. The database model is not just a way of structuring data, but also defines a
set of operations that can be performed with the data and also defines a set of rules
in order to keep database integrity. One of the most common data models, and which
we used in our application is the relational (due to the simplicity of data types, text
only). The data is organized as tables, there are relationships between them.
Relational model based on relational algebra made possible development of
relational languages as software that assists the implementation of databases. One
such language used in this application is SQL (Structured Query Languages).
B. The proposed three-tier architecture
We use 3-tier architecture in our software application. Commonly, 3-tier
architecture consists of the following three tiers (levels):
Presentation tier as known as Frontend
This is the topmost level of the application. It is the layer which users can
access directly such as a web page or application GUI (graphical user interface).
Through the presentation tier the user / client ask for information such “Get the most
replaced component?” or “Which is the most performed operation to a certain car?”
It communicates with other architectural tiers in order to output, finally, the text or
graphical results.
Logical (Application) tier that includes Business layer and Data access
layer, as known as middleware
The logical tier is pulled out from the presentation tier and, it controls an
application’s functionality by performing detailed processing based on set of rules.
The Business layer includes the Crawler module that is responsible for data mining
in office documents, parsing, computing, and synchronizing. The extracted data are
collected and indexed. With their help, in the Data access layer (software
implemented in the Database module), are conceived and designed the conceptual
scheme of database, tables and relationships. This layer manages accesses to
database by means of SQL, transforming customer requirements from the
Presentation layer in database queries. After Database tier provide the requested
data these are forwarded back to the Presentation layer.
Database tier as known as Backend
This tier is the physical storage layer, responsible for data persistence and
consists of database servers. Here information that comes from processed data
9
during the Logical layer is stored and retrieved and forwarded back to Logical layer.
This tier keeps data neutral and independent from previously two tiers. Giving data
its own tier also improves scalability and performance.
By splitting the application's architecture into 3 logical layers - presentation,
application and database access, are improved the development efforts, allowing re-
usability and extensibility as much as possible, increase maintainability and by
division of work ensure a faster development. The idea is to reduce the overall
maintenance and increase the scalability of your application.
C. Description of business layer concept
We developed a 3-tier database architecture. The application’s input are office
documents of Microsoft Excel type that represent the invoice services collected for
last 5 years from AutoHaus Huber SRL Sibiu, OPEL dealer.
The key aspect of this software implementation is the ability to gather
information as easy as it can. This is due to the fact that larger history means higher
accuracy rate. So to be able to gather information from all possible car services
providers means we need an intelligent document template interpreter. This points
our first software module Crawling Module.
"Crawler" is a generic term for any program (hardware - such as a robot or
software - web application), used to automatically discover and scan new locations /
sites by following links stepper or links from a Web page to another. In this case, the
application requires such a module because every day, at every vehicle checked /
repaired, new data appear in the system and even new pattern of faults. The Crawling
module provides the interface with actual data present on client computers (in this
case, OPEL Company). This module is responsible for collecting these data, index
them (assigning indexes for different spare parts / operations, etc.) and then forward
them to the next module, Database. Some of these data are field names in the
developed tables and others will be field values.
In such real-time application, the synchronization and data consistency are
very important. An issue consists in dynamically configuring of moment when the files
are parsed and extracted dates, and then are inserted into database. Crawling
module creates a hierarchy of files and ads in each folder a file with the extension .nrd
used for indexing and synchronization.
In the process of normalization of data from Business layer, we face some
integrity problems. The first error was due to car brand - “Marca” field from
“Autoturism” table that does not correspond with the car driven series chassis. The
second was due to incomplete synchronization of data. Some spare parts were

10
assigned to “orders” in “ListaPiese” table that were not registered (yet) on invoice
services (in “Comanda” table). The first error was eliminated by Crawler module
implementation in a chassis code checker which automatically corrects and updates
the “Marca” field. With our implemented solution for auto correction, we reduced by
70% the erroneous data. The second error was treated by resynchronization of data
(after short period of time) and, if the error still persisted, these records were removed
from the database. Another problem that has required attention in order to preserve
the integrity of database consisted in aligning data text variables in varchar fields of
databases tables and removing empty spaces from field names. Such situations may
be encountered due to negligence of human operators who place wrong values or,
leave empty spaces on invoice services.
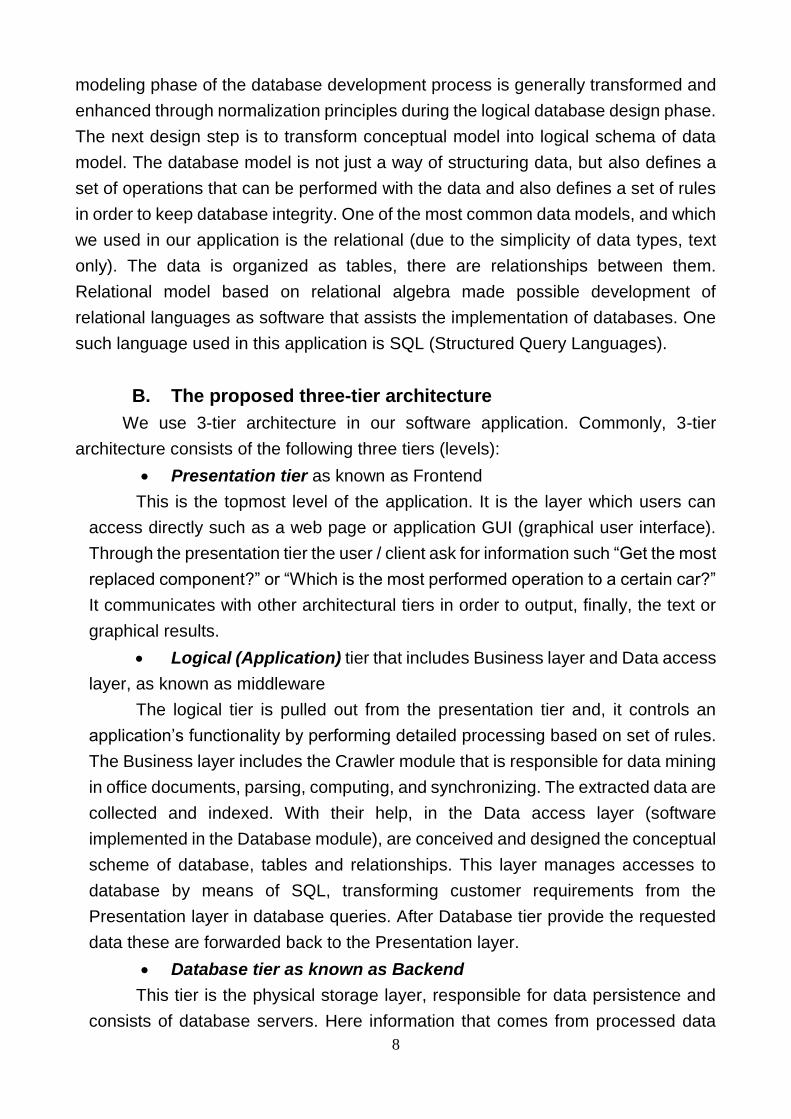
D. Database mapping
After having data crawled and ready for storage there was needed a mapping
structure in the database taking into account the obtained data and their type. The
following tables are currently mapped in the database: Autoturism, Comanda,
ListaOperatii, ListaPiese, Piesa. Figure 4.1.4 shows the implemented database
structure, the component tables and main fields, primary keys, etc.
Database module is responsible for designing the conceptual scheme of
database and mapping, performing database queries, being able to handle huge
bulks of data. It is interfaced with the Crawling module and adds data in safe location
data storage to be accessed later by all users. This way we connect our local
extracted data to the global database (Database tier) thus creating a data share point.
These data mappings tables are created for a single file template, currently an
Excel file. With the use of these tables, a data visualization module that we will
implement as further work, will have enough available data for further management
and marketing analytics.
As a short explanation of fig.4.1.4, basically there is a unique code (primary
key) of car chassis ("sasiu" field in "Autoturism" table) but in "Comanda" table can
find many records with the same car chassis (as the same car was repaired on
several times using different invoice services). The link is named 1 to many
relationship.
11
Fig. 4.1.4. Relationships between database tables
In this thesis section, starting from Microsoft Excel documents we developed a
C# crawler module and we designed and populate a relational database that supports
time analysis of defects cars. We removed some database integrity problems which
were caused by employees that completed wrong some invoice services or due to
later or no synchronization. The usefulness of application developed consists in
efficiency interpreting of extracted data. These information could provide a fairly
accurate understanding of the common faults that may occur in operating a motor
vehicle, may determine the causes of breakdowns, can identify abnormal wear.
We intend to continue working on this application bringing new features, and
to exploit the created database, in order to identify the main faults and the possibility
of optimizing the operating conditions in Romania. Also, experimental validation
proposals for improving technical quality using some CAD tools we plan.
RELATIONAL DATABASE MANAGEMENT SYSTEM
A. The main features of SQL
In practice, creating and using relational databases requires a standard
language that allows these operations. Thus, it was developed a relational
programming language as software that assists the implementation of databases.
IBM has made in the middle of 1970s the first implementation of the SQL (Structured
Query Languages). Today SQL is fully standardized and is recognized by
theAmericanNationalStandardsInstitute (ANSI).
12
The SQL commands can be classified in 5 categories: Query commands, Data
Manipulation Languages, Data Definition Languages, Transaction Control, and Data
Control Language.
B. Database queries for highlighting the behavior in operating of
OPEL cars'
In this paragraph we present the Database queries for highlighting the behavior
in operating for a determined period of time of OPEL cars'. With the help of queries
we intend to emphasize common patterns present in car service and parts production
failure.
For accessing data in the database layer, we need to make some queries and
return appropriate data. The following tables are currently mapped in our database:
Autoturism, Comanda, ListaOperatii, ListaPiese, Piesa. Further, we exemplify some
queries that we used in our application.
• Chassis identification in database in order to incorporate a new record
in the cars’ table (“Autoturism”).
• What is the number of operations performed every day and how much
cost the workmanship? Grouping records by date/time field in a predetermined range
and ordering low revenues. Using aggregate functions.
SELECT dataCreareFisa, COUNT(*) as total_manopera,
SUM(oraTotalLucrate*oraTarifara) AS suma_incasata_manopera FROM comanda
WHERE (dataCreareFisa>'2009-1-1') AND (dataCreareFisa<'2010-1-1') GROUP BY
dataCreareFisa ORDER BY suma_incasata_manopera DESC
• Ensuring integrity restrictions (deleting spare parts that appear in
commands that do not exist in “Comanda” table) by using nested queries.
• Based on the relations established after normalizing of database may
associate related tables in a formal way, easy to use, so that to combine data from
multiple tables within the same query, while maintaining the flexibility to include only
the interesting information for user. To do this, we used relational operators such as
intersection, difference and Cartesian product of two or more tables.
C. The Data Visualization module
As we stated before, this section presents the Presentation tier of previously
started 3-tier database architecture. This layer (implemented here in Data
Visualization Module) is the topmost level of application by which users have directly
access such as a web page or application GUI. Through the Presentation tier the
user / client ask for information such “Get the most replaced component?” or “Which
13
is the most performed operation to a certain car?” It communicates with other
architectural tiers (Logical and Database – implemented by Crawling and Database
Modules) in order to output, finally, the text or graphical results.
The Crawling Module offers the interface to the real data, present on
computers of OPEL service station (extracted from invoice services). This layer has
the task to gather this data, indexing it in and then present it to the next module, the
database. For ordinary users data in a raw format (unformatted data, unstructured,
unorganized) means headaches, and showing this data extensively proves nothing,
even creating confusion. That’s why, for a higher impact on the subject special
graphic libraries needed to be created or extended, because it is well known that “A
picture is worth a thousand words!” Despite the fact that the design is appealing it
also brings the user the possibility to “grab” graphs and navigate them for a better
understanding and take the proper decisions.
Our application provides a user friendly output interface. First, you can select
the range time for study. The next step is to choose whose is applied the analysis:
individual or general.
However, for a time analysis, we consider quantifying the frequency of defects'
occurrence on certain types of cars (general view) and vice versa, by introducing a
certain type of car to get parts with the lowest reliability (On what cars occur the most
defects?). Other facilities of our application are:
Identifying the operations frequently carried out to a certain (all) car(s)
for a well-defined period of time by choosing “TopOperatii” option, or determining
how many times was performed a certain operation.
Identifying the most commonly replaced parts to a certain (all) car(s).
Time analysis of revenues. Financial approach of company based on the
repaired cars.
EXPERIMENTAL RESULTS
One of the main features of our developed application is flexibility. We may
extract a lot of interesting statistics very helpful for mechanical engineer or manager.
By highlighting common patterns present in car service and parts production failure,
and through their intelligent analysis may result important information regarding to
cars' reliability and maintainability. Experimental research was to study the behavior
in operating a well-determined period of time of Opel cars and data collection from
invoice services documents.
14
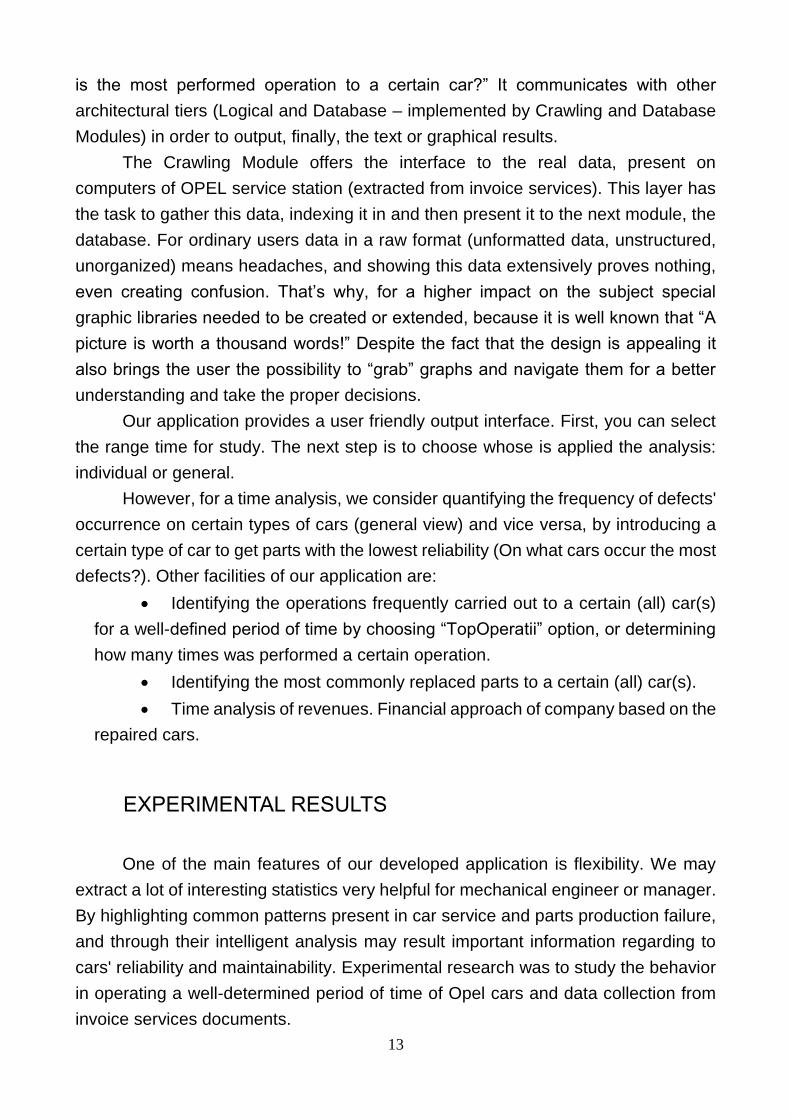
Fig. 4.3.5. Comparative statistics on years of relevant mechanical components that were
repaired
The information from figure 4.3.5 may be correlated with the roads degradation
in Romania, which influences among others the engine operating conditions, the
number of connection and disconnection of the clutch, braking and steering systems.
The evaluation methodology of operational reliability at OPEL cars
In this section we attempt to answer the following questions: What are the most
replaced components? Why do these failures occur? What can be done to predict
the failures? What solution to apply in order to optimize the system?
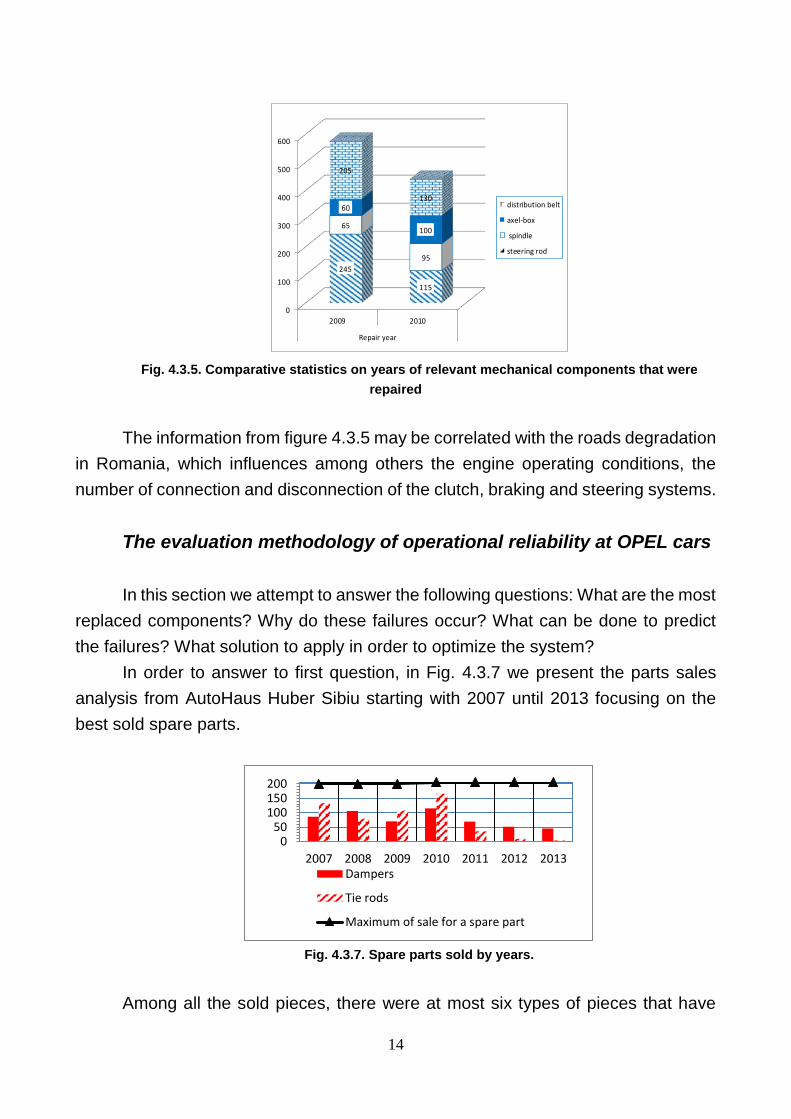
In order to answer to first question, in Fig. 4.3.7 we present the parts sales
analysis from AutoHaus Huber Sibiu starting with 2007 until 2013 focusing on the
best sold spare parts.
Fig. 4.3.7. Spare parts sold by years.
Among all the sold pieces, there were at most six types of pieces that have
0
100
200
300
400
500
600
2009 2010
Repair year
245
115
65
95
60
100
205
130distribution belt
axel-box
spindle
steering rod
050
100150200
2007 2008 2009 2010 2011 2012 2013Dampers
Tie rods
Maximum of sale for a spare part

15
been sold more than dampers and tie rods. However, all of these are consumables
(filters, antifreeze, engine oil, clips, rivets, spark plugs). In conclusion, the main parts
to be considered and whose reliability must be studied are the suspension system
components: tie rods and dampers. Therefore, further we focus the assessment only
on the two components, by analyzing samples of failures on each 10000 km, until
150000 km.
Based on operational measurements, in our statistics we called as tie rods the
following spare parts: inner and outer tie rods, steering rods, anti-roll rods, bushings,
ball joints, sway bar links, jam nuts and control arms related. Also, we use the
dampers term substituting the following spare parts: damper, bearings, coil spring,
buffer, ring and flange related. Of the 3358 repaired cars in service Autohaus Huber
Sibiu during 12.01.2009 ÷ 31.01.2011, 271 have damaged due the tie rods and 130
have failed because of the dampers, after a running up to maximum 150000 km. The
number of defective dampers is about half of the tie rods and, as the following figure
reveals, the maximum number of failures occurred within the driving range between
100000 km up to 110000 km.
Fig. 4.3.10. Suspension system components: MTTF.
Analyzing the results it is observed that the failure of components is done
unevenly and the dampers reliability is higher than that of tie rods. Increasing the
number of failures in the range between 100000 km and 110000 km significantly
increases the cumulative probability for failure (F) and decreases the reliability
function (R).
The results show that the MTTF is about five years of running (estimated time
for a travelling distance of 73500 km by a regular driver which runs about 250 km
weekly, in the city, which performs yearly about 2000 km in holiday, and makes one
or two trips per year outside of the village (about 1300 km). Although the
manufacturer does not specify the average lifetime for these types of components,
73561
83577
0
20000
40000
60000
80000
100000
10
20
30
40
50
60
70
80
90
10
0
11
0
12
0
13
0
14
0
15
0
km
Traveled distance [103 km]
Tie rodsDampers
16
the OPEL experts suggest that these express a too short lifetime (only five years). It
is obvious that one cause of failure consists in the road conditions (irregular with pits,
etc). For example, if one wheel falls into a pothole, the link rod is exposed to a
massive shock loading. If this happen in wet and cold conditions when materials used
in the ball joint part of the rod are very brittle, then the ball joint becomes vulnerable
to water and grit ingress, leading inevitable to total failure.
Optimization Techniques in the Design of Suspension Systems
The questionable quality of the roads represents the main factor of discomfort,
being directly responsible for the accidents, affecting car components, but also the
security of passengers causing death and serious injuries. According to statistics
released by the World Health Organization, road accidents, in underdeveloped
countries, tends to increase by 80 % in 2020 compared to 2000. In terms of road
infrastructure, the low- and middle- income countries are characterized by a higher
accident rate, reason for which the cars designers must approach the suspension
problem slightly different and the parameters obtained by optimization algorithms
should be different from the same model of car depending on where they will be
driven / sold. This paper presents the optimization of a quarter-car model with two
degree-of-freedom using evolutionary algorithms to determine the optimal
parameters for a vehicle suspension, in order to improve ride comfort. I am concerned
to improve suspension's system by optimizing the stiffness and damping coefficients
in order to minimize the maximum bouncing acceleration of the sprung mass and
minimize the average suspension displacement during movement on random roads,
especially with bumps and potholes. We analyzed the quarter-car model (QCM) with
two-degrees-of-freedom (2DOF) in order to find optimal parameters of stability and
to keep high standard of ride comfort under different exploiting conditions, minimizing
the discomfort during movement.
17
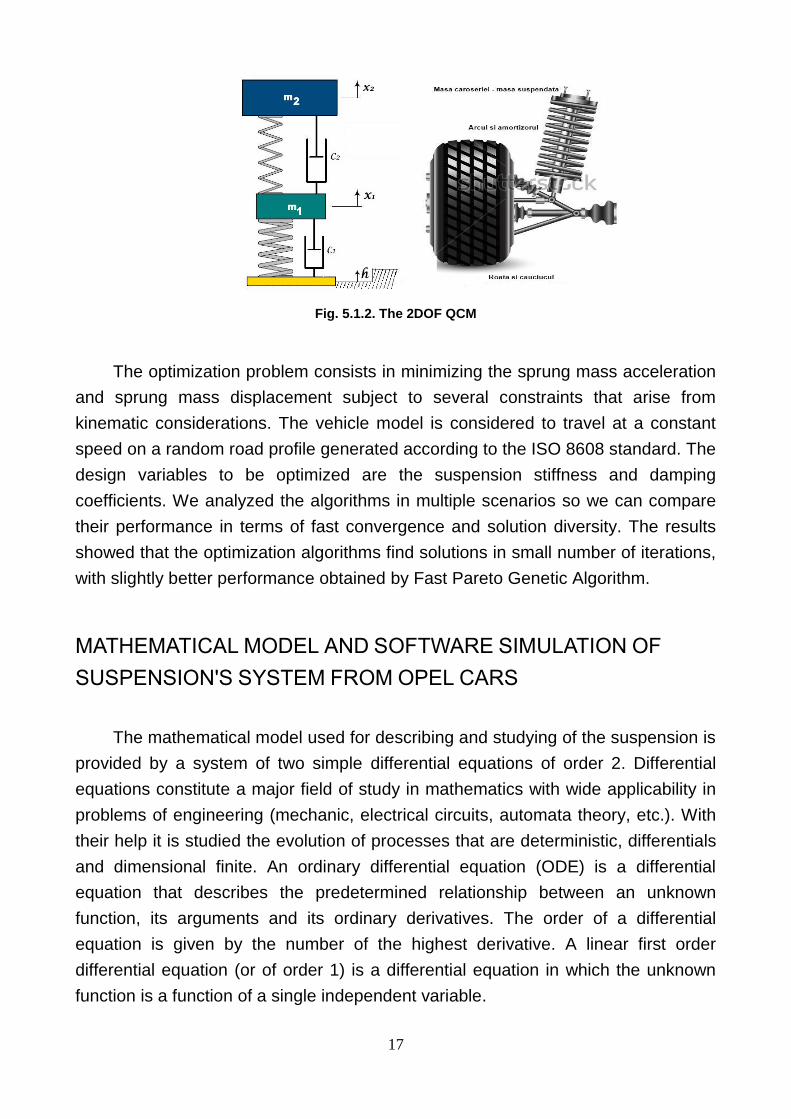
Fig. 5.1.2. The 2DOF QCM
The optimization problem consists in minimizing the sprung mass acceleration
and sprung mass displacement subject to several constraints that arise from
kinematic considerations. The vehicle model is considered to travel at a constant
speed on a random road profile generated according to the ISO 8608 standard. The
design variables to be optimized are the suspension stiffness and damping
coefficients. We analyzed the algorithms in multiple scenarios so we can compare
their performance in terms of fast convergence and solution diversity. The results
showed that the optimization algorithms find solutions in small number of iterations,
with slightly better performance obtained by Fast Pareto Genetic Algorithm.
MATHEMATICAL MODEL AND SOFTWARE SIMULATION OF
SUSPENSION'S SYSTEM FROM OPEL CARS
The mathematical model used for describing and studying of the suspension is
provided by a system of two simple differential equations of order 2. Differential
equations constitute a major field of study in mathematics with wide applicability in
problems of engineering (mechanic, electrical circuits, automata theory, etc.). With
their help it is studied the evolution of processes that are deterministic, differentials
and dimensional finite. An ordinary differential equation (ODE) is a differential
equation that describes the predetermined relationship between an unknown
function, its arguments and its ordinary derivatives. The order of a differential
equation is given by the number of the highest derivative. A linear first order
differential equation (or of order 1) is a differential equation in which the unknown
function is a function of a single independent variable.
18
One of the usual methods for approximating solutions of differential equations
is the “Runge-Kutta” numerical method having different orders of accuracy,
developed around 1900 by the German mathematicians, C. Runge and M.W. Kutta
[8]. The p order solution obtained by “Runge-Kutta” method is equivalent to the Taylor
series expansion up to dp, where d is the difference between two points on the axis
of the independent variable. Due to the high accuracy obtained it is preferred the
“Runge-Kutta” method of order 4 (p=4).
Returning to the model of the suspensions system, a mathematical analysis
theorem says that a system of high order differential equations can be transformed
into a first order differential equations system by introducing new unknown functions.
Generally, a system of k differential equations having k unknown functions, of order
o1, o2, ..., ok, turns into an first order system with o1+o2+...+ok differential equations.
Whereas in many scientific papers the model is presented only by the matrix equation
of the kinematics system without providing of solving details, in the following we
chose to present a method for solving the differential system of equations of the
second order. We proceeded like this because, although there are some Matlab
implementations or a standalone library for developers, in Visual Studio 2012 C#,
that solves systems of differential equations by “Runge-Kutta” method, these are only
first order equations. Thus, it is required transforming the differential equations
system of order 2, into a first order system by introducing two new functions, and
writing it as matrix equation: z’(t)=A·z(t), where z’(t) is the derivative functions array
and z(t) is the unknown functions array, and A is the square matrix of whose elements
should passed as inputs to our implemented software applications.
The kinetic of the 2DOF QCM are governed by the following matrix equation:
𝑚𝑠�̈�𝑠 = −𝑘𝑠(𝑥𝑠 − 𝑥𝑢) − 𝑐𝑠(�̇�𝑠 − �̇�𝑢) (5.3)
𝑚𝑢�̈�𝑢 = 𝑘𝑠(𝑥𝑠 − 𝑥𝑢) + 𝑐𝑠(�̇�𝑠 − �̇�𝑢) − 𝑘𝑢(𝑥𝑢 − 𝑦) − 𝑐𝑢(�̇�𝑢 − �̇�) (5.4)
Advanced optimization of the suspension to achieve the target
parameters of stability and comfort in different operational conditions
The main functionality of a suspension system is to isolate vibrations produces at
the wheel level by the road conditions. These vibrations can make the body of the
passenger vibrate violently which can make the ride uncomfortable especially when
the exposure time is high. Thus, it is necessary to design competitive suspensions
mechanisms that increase the ride comfort and maneuverability. Regarding the ride
19
comfort, designing a suspension system involves choosing the right characteristics
in such a way that the vertical acceleration and vertical displacement of the sprung
mass are minimized. These objectives are usually conflicting: reducing one does not
also reduce the other. Moreover, the existence of some design constraints
complicates even more the designer’s task. In this paper, we defined three
constraints [8]. The first represents the maximum value of the sprung mass
acceleration that should not exceed 1g (9.8m/s2). The second constraint specifies the
maximum displacement between the sprung and unsprung mass. The third constraint
refers to the frequencies at which humans experience motion sickness. According to
ISO 2631, humans experience motion sickness when exposed to frequencies in the
interval 0.1-1Hz. Thus, the natural frequency (𝜔) of the suspension system should
be greater than 1Hz.
minimize 𝑥𝑠 𝑎𝑛𝑑 �̈�𝑠
Subject to
| �̈�𝑠| < 9.8𝑚/𝑠2
|𝑥𝑠 − 𝑥𝑢| < 0.1 m
𝜔 > 1 𝐻𝑧
This makes the problem a perfect candidate for multi-objective optimization.
OPTIMIZATION PROCEDURE
First, the suspension model is initialized. The body mass, wheel mass, tire
stiffness and damping are fixed parameters and will not change during the simulation.
Then, the design variables are defined, the spring stiffness 𝐾𝑠 and the damping
coefficient 𝐶𝑠, which are represented as real numbers. The bounds of the variables
are also set in this step. The next step is to establish the design constraints. For this
paper we used three constraints which are related to the maximum acceleration of
the sprung mass, the relative displacement of the masses and the suspension’s
natural frequency. The optimization’s objectives are to minimize the sprung mass
acceleration and the sprung mass displacement. Now an optimization algorithm is
chosen and the optimization process is started.
The algorithms used in this paper belong to the evolutionary algorithms class.
All of them will follow the same basic steps. An initial set of solutions called population
is generated randomly. Then, an optimization loop will use the initial population in
order to generate better solutions (new populations), using specific evolutionary

20
operators. In this loop, the objective functions are evaluated, for a particular case in
which the suspension’s mathematical model is solved. Based on this evaluation, a
fitness is assigned to each solution in the population. The fitness represents the
quality or the chance of the survival on an individual. After the evaluation the best
candidates are chosen which will reproduce to create a new population. The
selection, crossover and mutation operators are used to achieve this process. When
a new population is obtained, the optimization loop will execute the same steps until
a termination condition is satisfied. The algorithm output is a Pareto front, a set of
solutions considered to be optimal. The entire procedure is synthesized in Fig. 5.2.1.
Fig. 5.2.1. Optimization procedure
Of great importance are the objective functions used by the evolutionary
algorithms to evaluate solutions. Fig. 5.2.1.a shows the steps taken by such a
function. The RMS value represents the Root Mean Square computed as:
𝑅𝑀𝑆 = √1
𝑛(𝑥1
2 + 𝑥22 … 𝑥𝑛
2)

21
Fig. 5.2.1.a. Objective function (steps)
SOFTWARE IMPLEMENTATION OF SUSPENSION’S
OPTIMIZATION PROBLEM
This section presents a brief overview of the optimization algorithms used in this
paper and that were software implemented for obtaining the experimental results.
Non-Pareto techniques
o Classic GA with objective aggregation
o Vector Evaluated Genetic Algorithm (VEGA)
Pareto techniques
o NSGA-II algorithm
o SPEA-II algorithm
o The Fast Pareto Genetic Algorithm
Swarm-intelligence-based techniques
o Speed constrained Multi-objective Particle Swarm Optimization (SMPSO)
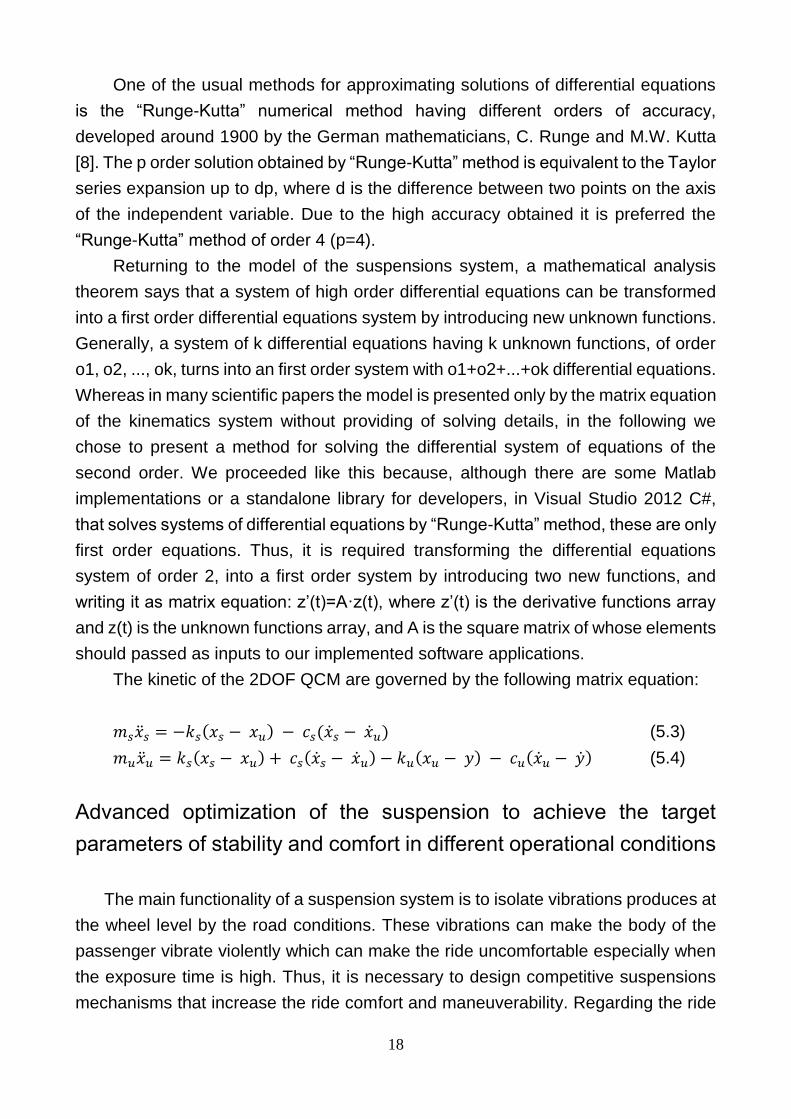
APPLICATION GRAPHICAL USER INTERFACE
22
Our application was written in C# language under Visual Studio 2012
environment. The software solution consists in two basic projects: EVA Framework
and jMetal.NET. The first contains the application graphical user interface (GUI)
which allows selecting the algorithm’s configuration class, the optimization problem,
and facilitates viewing and comparing the obtained results and viewing the values of
individuals and of objectives. The second project’s goal was to provide C#
implementation of jMetal (a Java framework for multi-objective optimization with
metaheuristics) by porting this library on .NET platform. It contains a subset of
algorithms and the way they are setup, a number of problems and their subsets of
solution representations, and the genetic operators from original library. For a proper
run of application is required a performant PC, such as quad-core 2.4 GHz Intel P4
Xeon with 4GB RAM memory, Windows XP SP2 operating system or newer and 4.5
version of .NET Framework.
To start the application is launched the binary file
EvaSuspensionFramework.exe. Then on full screen is displayed a user-friendly GUI
(see fig. 5.4.1). This consists in: the main menu, an algorithm control panel, an
optimization problem configuration control panel, a results list, an implemented
metrics list, a panel designed for plotting the selected road quality. From the algorithm
configuration panel (left side) the user may run the following actions:
Selecting the optimization mode: mono / multi objective.
Establishing the evaluation strategy of solutions: single-core, multi-core or
distributed. In single-core assessment strategy the algorithm is performed just on one
core. In multi-core mode, there are involved in processing all processor cores made
available by the host station. In distributed way the evaluation is done on multiple
workstations taking into account on their cores number.
Choosing the optimization problem
Setting the parameters of optimization (the population size, number of
generations, the values of genetic operators, etc).
Start/Stop the optimization procedure
23
Fig. 5.4.1. Application’s GUI
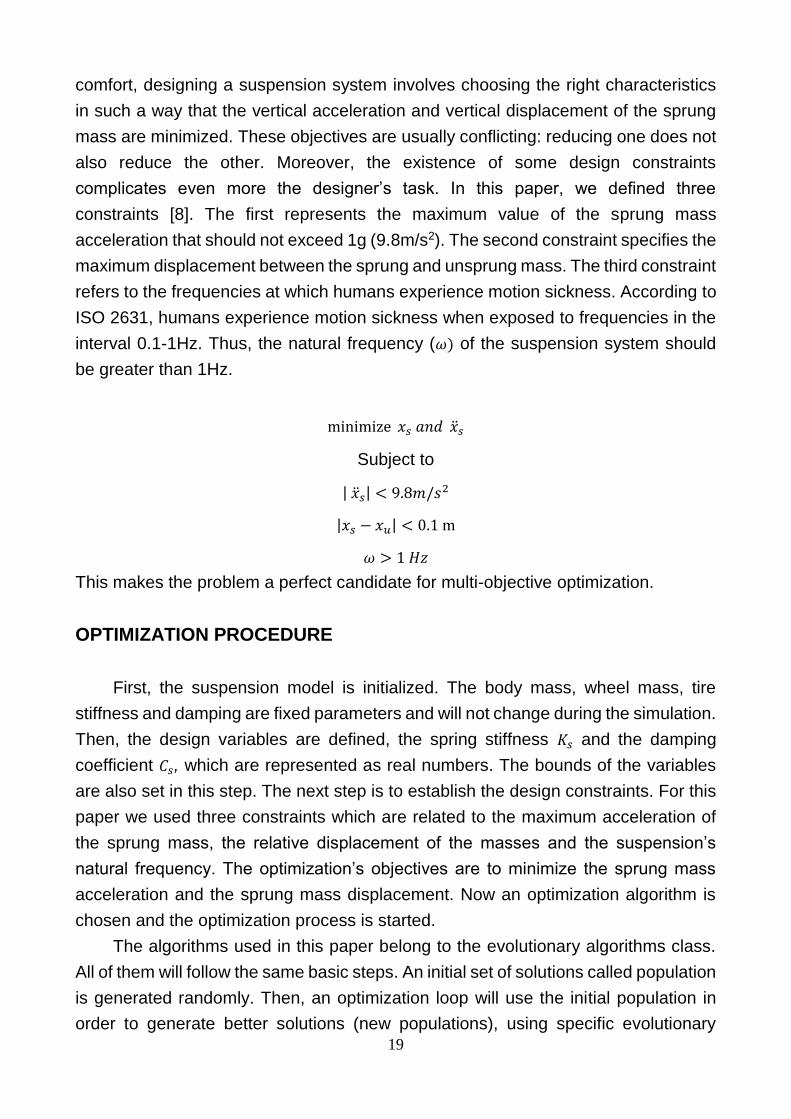
CAD ANTI-ROLL POWER LINK MODELING ON OPEL VEHICLES MANUFACTURING
Before proceeding to the actual modelling of the power link, it is appropriate to
make some remarks on the construction and operation of this major auto part.
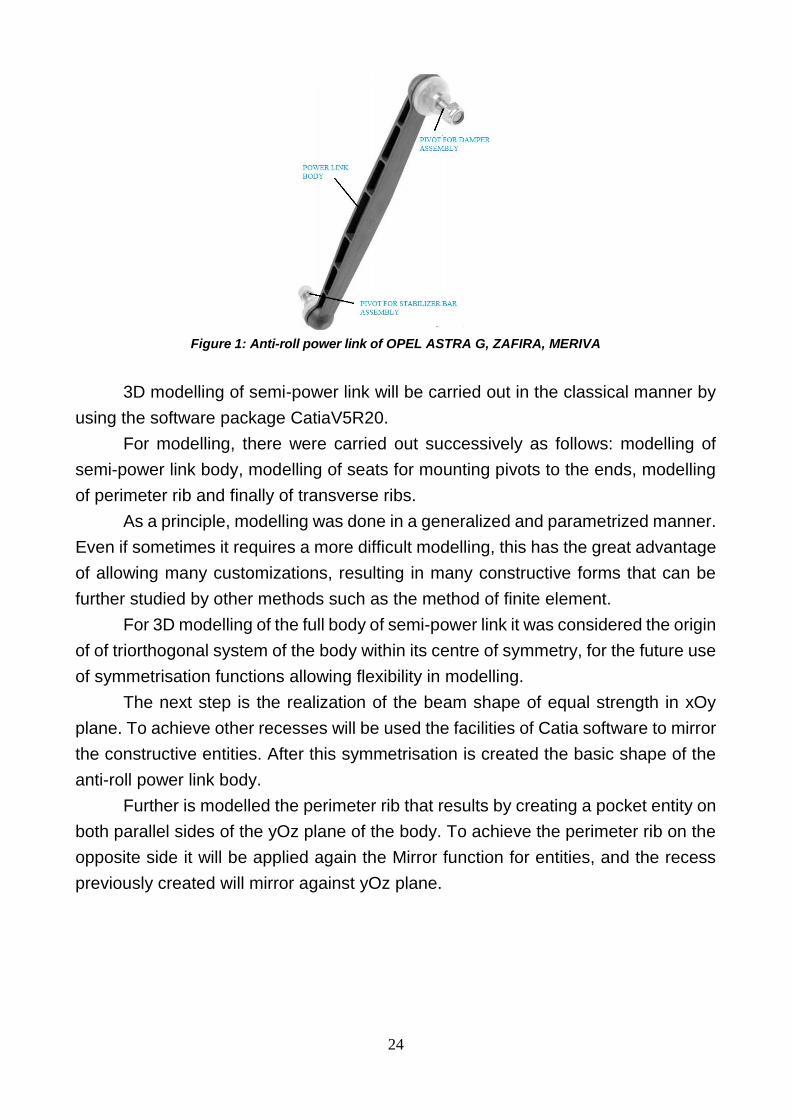
As regards the construction, we can distinguish three main parts, namely: body
of power link and the two pivot sub-assemblies through which the anti-roll power link
is assembled on the damper and respectively on the stabilizer bar of the vehicle
(Figure 1).
Functionally, anti-roll power link is a component part of the vehicle suspension
which has two basic functions, namely: reducing the leaning of the vehicle and
adjusting the vehicle balance. On poor quality roads, the vehicle shall enter a rocking
motion, and the motion depends on the construction of power link body or the material
of which they are made.
Therefore, we believe that it is fully justified to perform a thorough study of
power link body, even if the parts wearing faster within this subassembly are the pivot
parts on the ends. Also, the body of anti-roll power link has been less studied in
specialized literature compared to pivot wear.
24
Figure 1: Anti-roll power link of OPEL ASTRA G, ZAFIRA, MERIVA
3D modelling of semi-power link will be carried out in the classical manner by
using the software package CatiaV5R20.
For modelling, there were carried out successively as follows: modelling of
semi-power link body, modelling of seats for mounting pivots to the ends, modelling
of perimeter rib and finally of transverse ribs.
As a principle, modelling was done in a generalized and parametrized manner.
Even if sometimes it requires a more difficult modelling, this has the great advantage
of allowing many customizations, resulting in many constructive forms that can be
further studied by other methods such as the method of finite element.
For 3D modelling of the full body of semi-power link it was considered the origin
of of triorthogonal system of the body within its centre of symmetry, for the future use
of symmetrisation functions allowing flexibility in modelling.
The next step is the realization of the beam shape of equal strength in xOy
plane. To achieve other recesses will be used the facilities of Catia software to mirror
the constructive entities. After this symmetrisation is created the basic shape of the
anti-roll power link body.
Further is modelled the perimeter rib that results by creating a pocket entity on
both parallel sides of the yOz plane of the body. To achieve the perimeter rib on the
opposite side it will be applied again the Mirror function for entities, and the recess
previously created will mirror against yOz plane.
25
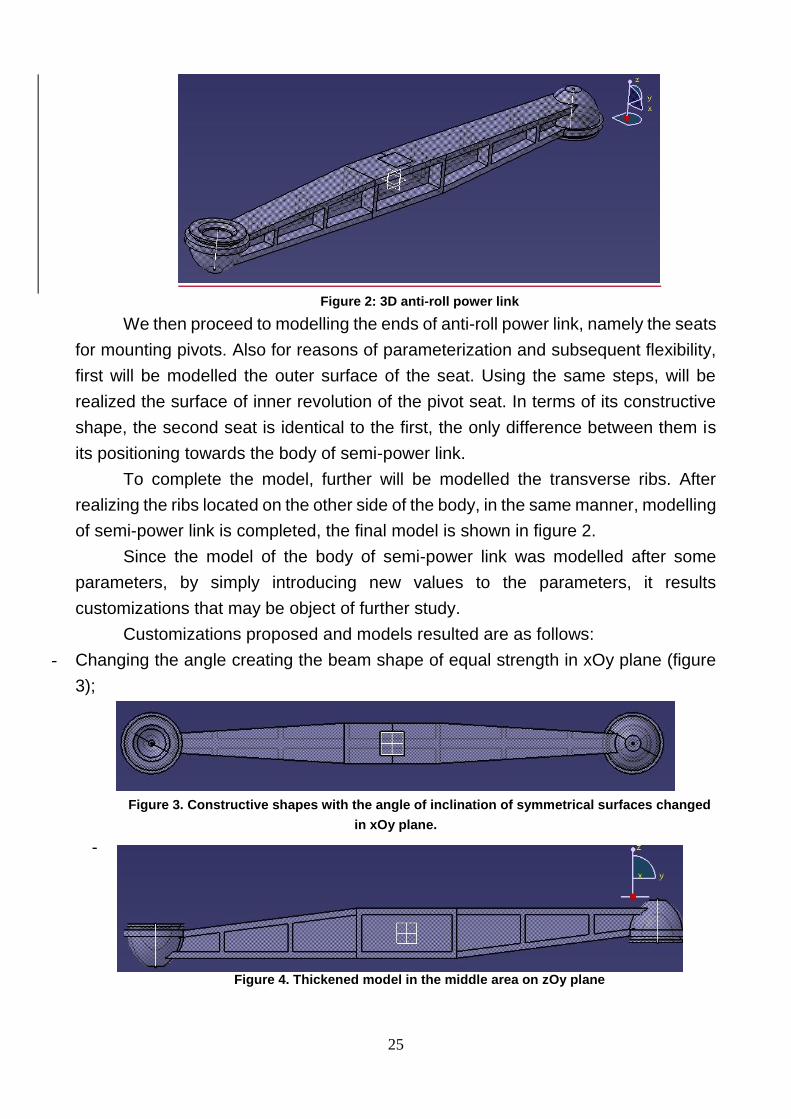
Figure 2: 3D anti-roll power link
We then proceed to modelling the ends of anti-roll power link, namely the seats
for mounting pivots. Also for reasons of parameterization and subsequent flexibility,
first will be modelled the outer surface of the seat. Using the same steps, will be
realized the surface of inner revolution of the pivot seat. In terms of its constructive
shape, the second seat is identical to the first, the only difference between them is
its positioning towards the body of semi-power link.
To complete the model, further will be modelled the transverse ribs. After
realizing the ribs located on the other side of the body, in the same manner, modelling
of semi-power link is completed, the final model is shown in figure 2.
Since the model of the body of semi-power link was modelled after some
parameters, by simply introducing new values to the parameters, it results
customizations that may be object of further study.
Customizations proposed and models resulted are as follows:
- Changing the angle creating the beam shape of equal strength in xOy plane (figure
3);
Figure 3. Constructive shapes with the angle of inclination of symmetrical surfaces changed
in xOy plane.
-
Figure 4. Thickened model in the middle area on zOy plane

26
Thinning or thickening of the middle area of the body in both xOy and yOz planes
(figures 4, 5);
Figure 5. Thickened model in the middle area on xOy plane
- Changing the inclination of body surface in yOz plane (figure 6);
Figure 6. Model changed in terms of inclination of surfaces on zOy plane
- Thickening or thinning of perimeter rib (figure 7);
Figure 7. Model of thickened perimeter rib
- Changing the position of transverse ribs and of their sizes (figure 8)
Figure 8. Model of thinned transverse rib and the increased distance between the ribs
As already seen, parameterized modelling enables a large enough study on
constructive shape of anti-roll power link.
Starting from the modelling presented in detail through constructive
adjustments, there are several types of anti-roll power link bodies that can be
suggested.
So, if the idea of ribs modelling is abandoned, will result a semi-power link of
whose body is full. Another version is featured by the absence of transverse ribs, the
body having only the perimeter rib. Another body model can be modelled without
transverse ribs, by replacing them with a longitudinal rib passing through the centre
of symmetry of the body and medially including xOy plane.
Finally, the last suggestion is a model of high rigidity, being basically a
combination between the original model with transverse ribs and the model with
longitudinal rib. The model is shown in figure 9.
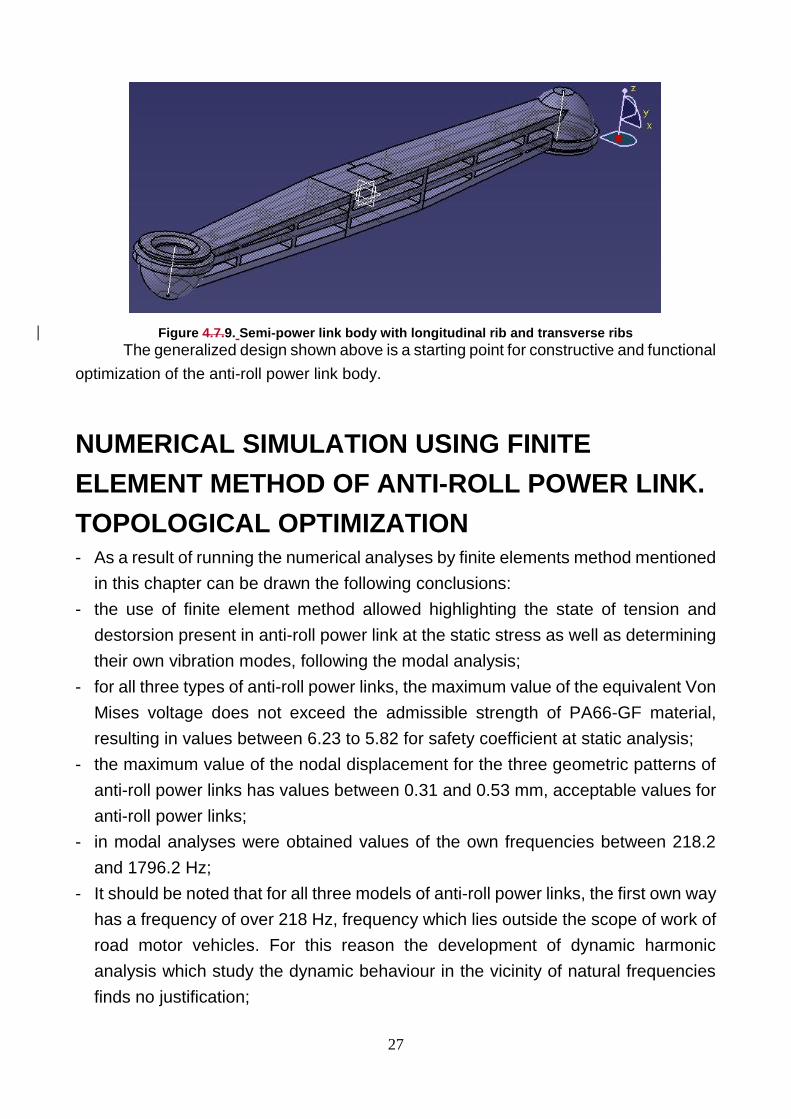
27
Figure 4.7.9. Semi-power link body with longitudinal rib and transverse ribs The generalized design shown above is a starting point for constructive and functional
optimization of the anti-roll power link body.
NUMERICAL SIMULATION USING FINITE
ELEMENT METHOD OF ANTI-ROLL POWER LINK.
TOPOLOGICAL OPTIMIZATION - As a result of running the numerical analyses by finite elements method mentioned
in this chapter can be drawn the following conclusions:
- the use of finite element method allowed highlighting the state of tension and
destorsion present in anti-roll power link at the static stress as well as determining
their own vibration modes, following the modal analysis;
- for all three types of anti-roll power links, the maximum value of the equivalent Von
Mises voltage does not exceed the admissible strength of PA66-GF material,
resulting in values between 6.23 to 5.82 for safety coefficient at static analysis;
- the maximum value of the nodal displacement for the three geometric patterns of
anti-roll power links has values between 0.31 and 0.53 mm, acceptable values for
anti-roll power links;
- in modal analyses were obtained values of the own frequencies between 218.2
and 1796.2 Hz;
- It should be noted that for all three models of anti-roll power links, the first own way
has a frequency of over 218 Hz, frequency which lies outside the scope of work of
road motor vehicles. For this reason the development of dynamic harmonic
analysis which study the dynamic behaviour in the vicinity of natural frequencies
finds no justification;

28
- I do consider optimum the optimized anti-roll power link by reducing the thickness
of a transverse rib because it allows to obtain a good stiffness under conditions of
reducing the volume of material with 7,57%. For these reasons, experimental
research presented in Chapter 8 will relate only to this geometric pattern of anti-
roll power link;
- geometric model of anti-roll power link with longitudinal stiffening rib is not
recommended to be used for vehicles running on even roads but only for those
running on rough terrain (off-road), because improving the mechanical strength
does not justify otherwise high consumption of material for anti-roll power link body;
- numerical researches will be validated in Chapter 8 by experimental research on
eccentric bending, pure bending respectively.
EXPERIMENTAL RESEARCH For testing the anti-roll power link at eccentric bending, it was made a device (figure
2) that allows its fixing on Instron machine bed in the area for assembling the power
link to stabilizer (torsion) bar. At the opposite end of the power link (the place of
fastening on vehicle damper) it was introduced a cylindrical bolt, planely milled to one
end so that it can be applied the load using the mobile cheek of the testing machine.
Figure 2: Anti-roll power link assembly – eccentric compression testing device
mounted on testing machine
The applied force progressively increased up to a value of 1,000 [N], which is
applied to an eccentricity of 100 [mm] to the longitudinal axis of tested power link,
thus obtaining a bending moment of 100 [Nm].
The results obtained and recorded if the compression force reaches the
maximum value of 1,000 [N] were as follows: major strain (Major Strain ε1), minor
strain (Minor Strain ε2), equivalent strain (von Mises Strain), displacement on X axis,
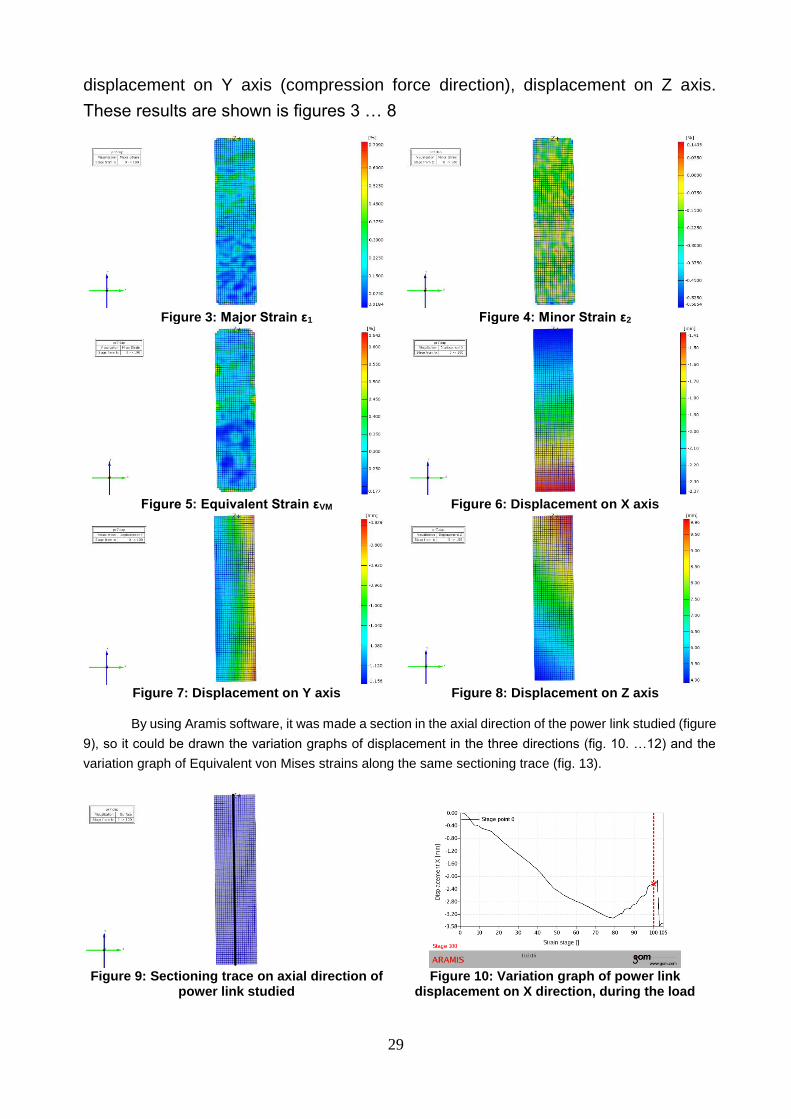
29
displacement on Y axis (compression force direction), displacement on Z axis.
These results are shown is figures 3 … 8
Figure 3: Major Strain ε1
Figure 4: Minor Strain ε2
Figure 5: Equivalent Strain εVM
Figure 6: Displacement on X axis
Figure 7: Displacement on Y axis
Figure 8: Displacement on Z axis
By using Aramis software, it was made a section in the axial direction of the power link studied (figure
9), so it could be drawn the variation graphs of displacement in the three directions (fig. 10. …12) and the
variation graph of Equivalent von Mises strains along the same sectioning trace (fig. 13).
Figure 9: Sectioning trace on axial direction of
power link studied
Figure 10: Variation graph of power link
displacement on X direction, during the load

30
Figure 11: Variation graph of power link
displacement on Y direction, during the load
Figure 12: Variation graph of power link
displacement on Z direction, during the load
Figure 13: Variation graph of von Mises
equivalent strain, during the load
Figure 14: Displacement on Z axis (deformed
medium fiber of power link)
It should be noted that when the test reached ‘stage 100’ took place the
removal of the load on the power link while eccentric bending, which is why all graphs
showing the variation way of displacements on the three directions and also the
variation graph of von Mises equivalent strains reveal a gradual variation of these
parameters determined by experiment.
By using the same sectioning trace could be determined and drawn the
deformed medium fiber of the power link studied, on the part located near Aramis
system cameras, which is shown in figure 14.
CONCLUSIONS. ORIGINAL CONTRIBUTIONS. FUTURE RESEARCH DIRECTIONS
This thesis has successfully combined a number of different scientific areas
such as Computer Science (Artificial Intelligence, Reliability, Programming
Languages and Distributed computing subdomains), Mathematics (Differential
Equations), Road Vehicles Engineering and Mechanical Engineering in order to
contribute to solve a real problem, even critical in Romania, meaning exploiting
motor vehicles with an emerging infrastructure, where there are poor quality roads,
too.
31
The main original contributions are:
1. Carrying out a thorough bibliographical study from which has emerged the
need for studies;
2. Study of Opel motor vehicles behaviour in operation for 9 years (and not only
Opel) through the pursuit of faults encountered in use, malfunction causes
and of abnormal wear identification.
3. Design and implementation of a relational database allowing to study the
reliability of OPEL cars exploited in Romania.
4. Adapting the solutions of differential equations systems of order 2 on the
suspension issue and their algorithmic transposal, automatically solvable.
5. Software implementation of the optimizating multi-objective algorithms like
Non-Pareto, Pareto and Bio-inspired (based groups behavior) in the design of
the suspension system.
6. By using the software application developed in this thesis we will improve the
quality of production of spare parts
7. Creating a parameterized 3D anti-roll power link model
8. Creating new models of anti-roll power link
9. Achieving the study of the tension stages and deformations and topological
optimization of the anti-roll power link
10. Experimental determination of raw material characteristic curves, of the
variation of the force in relation to movement and maximum and minimum
main specific deflection for the stressed anti-roll power link.
Key words: power link, bending, displacement, major strain, von Mises strain, CAD modelling, finite element methods, stabilizer bar, parameterized modelling, static analysis, suspension optimization; quarter-car; evolutionary algorithms; genetic algorithms; multi-objective, reliability, road profile, Software Application, suspension system, database, data mining, maintainability,materials reliability, differential equations system, Quarter-Car Model, software application, suspension system, database, data mining, SQL.