phd house, new delhi september 24, 2009 presentation to petrofed members policy & regulations on...
Post on 19-Dec-2015
214 views
TRANSCRIPT

PHD House, New Delhi September 24, 2009
Presentation to Petrofed Members
Policy & Regulations on Natural Gas Pipelines
& way forward…

Presentation covers…
drivers for gas markets & models
gas market development stages
Indian gas market
downstream regulatory framework
way forward…

drivers for gas markets & models

context… drivers for gas markets
discovery of substantial quantities of gas in association with oil drilling (USA) or large discoveries of non-associated gas in industrial nations (Europe)
strong desire to reduce urban pollution caused by coal or heavy fuel oil (UK, Germany) supported by GDP levels & personal affluence to make gas a fuel of choice
strong support from government (all countries)
comparative shorter transport distances boosted development of pipelines (Netherlands & UK)
existing coal based “town gas” grids facilitated market penetration (UK, USA & Germany)
gas was priced competitively against existing fuels (Germany & Netherlands)
use of more polluting fuels was discouraged (UK & Netherlands)
countries that are substantial net importers of energy wish to diversify primary energy supply (Korea & Japan post 1970’s Gulf oil crisis)
three principal models of market development…

gas industry development model 1
private monopolies(multiple networks)
regulation deregulation
open access
“private Monopoly” (or oligopoly) model is typical of USA (FERC) & to some extent Germany (Self regulated basis)
local town gas grids are connected by multiple, privately owned gas networks
gas transportation typically takes place on a monopoly or occasionally “contract carriage” basis
regulation of market becomes a necessity to promote orderly development, private investment, long term consumer gain & to encourage responsible operators
long-run regulation tends to create distortions & inefficiencies, leading to deregulation & development of open access regimes, typically on a “contract carriage” basis
isolated grids

gas industry development model 2
development of State-owned monopolies has occurred in a number of countries, notably UK & France
nationalisation
state monopolies(single networks)
privatisation
open access
liberalisation
isolated grids
local town gas grids declined, following development of electric lighting, were later nationalised & consolidated by post-war governments
introduction of natural gas in 60s’ & 70s’ sees state funded development of transmission networks & conversion programmes
privatisation of state assets seen in UK & South America (now under consideration in France) …typically after up to 30 years of state ownership
UK model has evolved to fully open access…partial access in France

hybrid monopolies(mixed private/ state)
open access
public/ private development
liberalisationseparation
gas industry development model 3
isolated grids
In a number of countries a partnership between State & private industry has driven developments…as seen in Netherlands
development of industry viewed by government as a national priority
government takes an equity stake along gas chain or is heavily engaged as facilitator or guarantor
no privatisation…government retains stake in assets prior to adoption of an open access system typically 30 – 40 years later

gas market development stages

classification of gas industries
gas industry of any country can generally be defined on two axes of infrastructural or market sophistication
Basic Emerging Emerging/Restructuring
Sub-Mature MatureSub-Mature/Restructuring
1 – 2 gas sources. Some high pressure transmission pipelines with <10 off take points to power generation or primary/secondary industry
2+ gas sources. High pressure transmission with <100 off-take points for power generation and industrial usage. Some LDCs in major cities but with limited penetration into domestic energy sector
…so for emerging but requiring significant refurbishment & modernisation. Significant capital injection required
4+ gas sources. Nationally extensive transmission system with significant industrial& commercial market share. Growing need for integrated grid control with seasonal load balancing needs beyond use of line pack. Distribution networks in all major towns with significant domestic market penetration
…so for sub-mature but requiring significant refurbishment & modernisation. Significant capital injections required
multiple gas sources, flexible & integrated gas grid. Approaching saturation in geographical coverage to “economic” customers. Ongoing maintenance & capacity expansion programmes
Infrastructural Maturity

same applies to market sophistication
state monopoly private monopoly emerging (competitive)
emerging (restructuring)
liberalised
state owned transmission assets, municipal ownership of local distribution grids. Strong horizontal & where appropriate, vertical integration. De facto regulation by government ministries
significant private ownership of transmission & distribution assets. National monopoly or regionally focused oligopoly in transmission, distribution & supply. Limited negotiated TPA to transmission networks. Regulation by statute &/ or state ministry
governmental or supra-governmental drive for competition & break-up of monopolies. Negotiated access to capacity, rudimentary energy balancing/ settlement mechanism. Government appointed independent regulator and/ or supra-national body
so for “Emerging Competitive” but including partial (accounting) or legal separation transportation & shipping. Developing non-discriminatory access to capacity, cost reflective energy balancing & settlement mechanism. Independent regulatory body focused on promoting competition & limiting monopoly powers
ranging from partial (Industrial & commercial) to full (including residential sector) liberalisation. Full separation between transportation & supply. Horizontal integration with dual fuel suppliers. Fully non-discriminatory access code with mature energy balancing & settlement regime. Regulatory emphasis shifts from competition towards incentivising network efficiency
classification of gas industries

plotting relationships - markets & regulation
no two gas markets are exactly alike, but high level classification is possible along two axes – parabolic relationships
statemonopoly
privatemonopoly
emergingcompetitive
liberalised
basic
emerging
sub-mature
mature
mar
ket/
infr
astr
uctu
re
ownership/ regulation
(restructuring)
(restructuring)
infrastructure & market maturity
structure

different stages of development
nonestate
monopolyprivate
monopolyemerging
competitiveliberalised
none
basic
emerging
sub-mature
mature
mar
ket/
infr
astr
uct
ure
ownership/ regulation
(restructuring)
(restructuring)
Chile
Venezuela Turkey
SingaporeEgypt
Brazil
IndiaChina
TaiwanSaudi Arabia
Philippines
Bangladesh
USAUK
Spain Norway
Netherlands
New Zealand
Korea
Italy
Germany
Belgium
Australia
Argentina
Ukraine
JapanRussia
France
relative position of gas markets

gas market development case studies

UK
StateMonopoly
PrivateMonopoly
EmergingCompetitive
Liberalised
Basic
Emerging
Sub-Mature
Mature
Nationalisation of private gas companies
19
48
- 1
98
6
1986 - 1992 1992 - 1998
Full unbundling of transportation
& supply Full I&C and
residential competition
Privatisation and limited TPA
evolution of UK gas market
UK is now an advanced liberalised gas market… but how did it get there?
extensive town gas system dating back to 1860s’
nationalised in 1948 small natural gas network
created early 1960s for Algerian LNG
gas discovered in North Sea 1965
national transmission system constructed 1967 – 1973… town gas systems converted
British Gas privatised -1986 full I&C competition - 1992 full residential competition -
1998 now bedevilled by
regulatory complexity

EU gas market is not what it used to be…
recent past
emergent markets
exclusive rights (infrastructure & supply)
national monopolies
demarcation zones
no gas-to-gas competition
gas prices contractually linked to oil
vertically integrated companies
near future
mature but growing markets
equality of market rights
freedom to invest and sell
several players in all markets
integrated market with TPA
gas-to-gas competition
gas prices also a function of gas-to-gas competition (market-based)
legal separation of transportation
….transition towards a new world with new roles, business models & risks

European gas market maturity
during past 30 years, Europe has matured into a large, integrated gas market
PragueBrussels
Algiers
Vienna
Athens
Warsaw
Rome
Munich
Belgrade
Uzhgorod
Lisbon
Oslo
Paris
Sofia
Stockholm
HamburgBerlinLondon
Helsinki
BarcelonaMadrid
Fos-sur-Mer
La Spezia
Lyon
BernBudapest
Essen
Emden
Canvey
Le Havre
1970
Minsk
St. Petersburg
Bratislava
Berlin
Rome
LjubljanaZagreb
Oslo
Algiers
Madrid
Cordoba
London
Copenhagen
Prague
Warsaw
Vienna
Stockholm
Helsinki
Athens
Paris
Essen
Lisbon
Budapest
Tunis
Brussels
Sofia
Bern
Lyon
Belgrade
Dublin
Bucharest
Emden
H u elvaC artag en a
B arc elo n a
F o s-su r-M er
L a S p ezia
M on to ir
Z eeb ru g g e
Tyra
E ko fisk
Kårsto
KollsnesTro ll
G u llfaksStatfjo rd
H eim d a lF rig g
S le ip n e r Stavanger
O seb erg
W'haven
Belfast
Minsk
St. Petersburg
Bratislava
Rome
LjubljanaZagreb
Oslo
Algiers
Madrid
Cordoba
London
Copenhagen
Prague
Warsaw
Vienna
Stockholm
Helsinki
Athens
Paris
Lisbon
Budapest
Tunis
Brussels
Sofia
Bern
Lyon
Belgrade
Dublin
Bucharest
H u elvaC artag en a
B arc elo n a
F o s-su r-M er
L a S p ezia
M on to ir
Z eeb ru g g e
Tyra
E ko fisk
Kårsto
KollsnesTro ll
G u llfaksStatfjo rd
H eim d a lF rig g
S le ip n e r Stavanger
O seb erg
W'haven
Belfast
ArzewSkikda
B ilb ao
Is tan b u l
S in es
K rk
R o vig o
E l F erro l
Va le n cia
2000
maturity of infrastructure allows progress towards more liberalised market models

evolution of US gas market
StateMonopoly
PrivateMonopoly
EmergingCompetitive
Liberalised
Basic
Emerging
Sub-Mature
Mature
USA
19
40
- 1
98
6
1986 - 2002
different development path in USA - huge geographical scale with strong free market ethics
parallel evolution of natural gas & town gas since early 20th century
rapid expansion post 1945 via competition between private monopolies
strict regulation of prices & development introduced to curb excess & manage development
deregulation of interstate pipelines under FERC 501 in 1986 with progressive deregulation of pipelines
different states moving towards fully liberalised markets at varying speeds
regulatory model adapting to meet security of supply issues

gas pipelines in USA (Lower 48)
Interstate Pipelines
Legend
Intrastate PipelinesTexas
Oklahoma
Arkansas
Kentucky
Mississippi
Alabama
Louisiana
Delaware
Maryland
ConnecticutNew JerseyPennsylvania
Rhode Island
Massachusetts
New Hampshire
Vermont
Maine
New York
Kansas
Wyoming
New Mexico
Florida
South Dakota
IowaOhio
Virginia
North Carolina
Georgia
South Carolina
Tennessee
Michigan
Indiana
Illinois
Wisconsin
Minnesota
Colorado
Missouri
Arizona
North DakotaMontana
Idaho
California
Nevada
Washington
Oregon
Utah
West Virginia
USA enjoys a substantially mature gas pipeline network, linking demand centres with traditional sources of supply
FERC regulates interstate pipelines & SERCs’ regulate intrastate pipelines

evolution of Dutch gas market
Dutch market model follows lines of a unique private industry/ state collaboration
StateMonopoly
PrivateMonopoly
EmergingCompetitive
Liberalised
Basic
Emerging
Sub-Mature
Mature
Netherlands
1963
- 1
998
1998 - 2002
Gasunie unbundled in 2004
small legacy town gas industry
super-giant gas discovery at Groningen in 1959
state/ private entities of Gasunie, NAM and Maatschaap created in 1963
main pipeline construction phase (internal & export) 1970 - 1980
rapid penetration achieved by competitive pricing against other fuels
implementation of EU competition directives saw unbundling of Gasunie

evolution of German gas market
Germany
StateMonopoly
PrivateMonopoly
EmergingCompetitive
Liberalised
Basic
Emerging
Sub-Mature
Mature
19
63
- 1
99
8
1998 - 2002 ?2002 - 2008
German gas market is unusual in Europe, having no direct State involvement, but self regulation
conventional town gas origins, first imports of natural gas in early 1960s
Germany has always been heavily dependent upon imports
no direct State participation but heavy involvement as facilitator & guarantor
multiple transporters, distributors & LDCs…main period of infrastructure growth 1975 – 1995, undergoing consolidation
ongoing liberalisation under EU directive though with a weak regulatory model (energy regulation has been made a sub-department of the telecom regulator)

StateMonopoly
PrivateMonopoly
EmergingCompetitive
Liberalised
Basic
Emerging
Sub-Mature
Mature
Korea
19
87
- 2
00
3
evolution of South Korean gas market
Partial privatisationsplit of KOGAS in 2003
Korean gas market is entirely LNG based around State owned transportation infrastructure & private LDCs
KOGAS formed in 1983 to develop industry…first LNG imports in 1987
varied State, private & municipal ownership
3 LNG import terminals, 20 separate LDCs’
strong government involvement in providing subsidy & fiscal relief for infrastructure development, in building regulations & for bus conversion
driven by need for supply diversity & environmental improvements
planned privatisation & separation of KOGAS into 3 separate supply companies in 2003 but considerable difficulties exist due to political & union resistance

generic gas industry development Path
Ownership / Regulation
StateMonopoly
PrivateMonopoly
EmergingCompetitive
Liberalised
Basic
Emerging
Sub-Mature
Mature
Mar
ket
/ In
fras
tru
ctu
reat a high level, similar patterns emerge around the world
there is no example of a substantial gas market emerging from a fully liberalised market
theoretical economic attraction is not borne out by evidence

Indian gas market

natural gas demand: latest outlook
Latest outlook as per 11th plan document
(MMSCMD)
Sector 2009-2010 2010-2011 2011-2012
Power 100 112 125
Fertilizer 52 79 79
City gas 14 15 16
Industrial 17 18 20
Petrochemicals/ refineries/ others/ internal consumption 29 31 33
Sponge iron/ steel 7 7 8
Total 219 263 281

Indian gas industry
Power & fertilizer prime consumers (70%)
Captive & industrial consumption (30%)
42%
13%4%
28%
3%
10%
POWER
FERTILISER
PETROCHEM/ LPG
STEEL
INDUSTRIES
CITY GAS/ CNG

projected imports of natural gas
© OECD/IEA

LNG sources: India
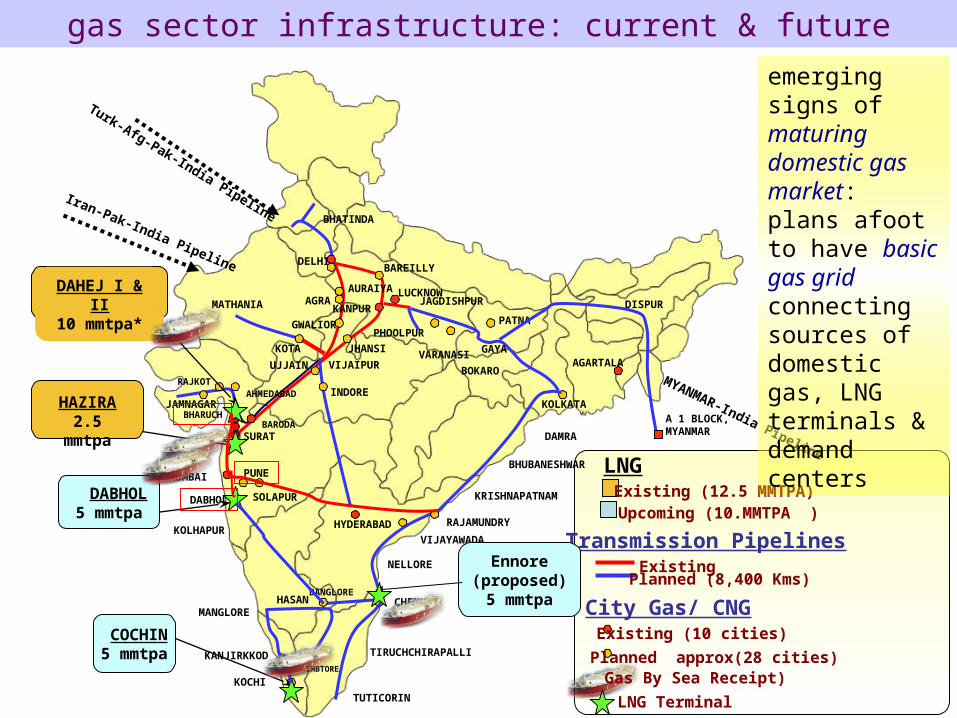
LNGExisting (12.5 MMTPA)
Transmission PipelinesExisting
JAGDISHPUR
PHOOLPUR
BHATINDA
JAMNAGAR
BAREILLY
DISPUR
DELHI
AGARTALA
BARODASURAT
KANPUR
LUCKNOW
PATNA
AHMEDABADRAJKOT
KOTA
MATHANIA
GWALIOR
VIJAIPUR
INDORE
UJJAIN
AGRA
KOLKATA
GAYA
BOKARO
VARANASIJHANSI
Iran-Pak-India Pipeline
Turk-Afg-Pak-India Pipeline
DAHEJ I & II10 mmtpa*
HAZIRA2.5 mmtpa
DABHOL5 mmtpa
COCHIN5 mmtpa
MYANMAR-India Pipeline
A 1 BLOCK, MYANMAR
Upcoming (10.MMTPA )
Planned (8,400 Kms)
City Gas/ CNGExisting (10 cities)
Planned approx(28 cities) Gas By Sea Receipt)
LNG Terminal
COIMBTORE
MANGLORE
MUMBAIBHUBANESHWAR
KRISHNAPATNAM
NELLORE
CHENNAI
TUTICORIN
TIRUCHCHIRAPALLI
PUNE
BHARUCH
DABHOL
HASANBANGLORE
KOLHAPURHYDERABAD
SOLAPUR
RAJAMUNDRY
VIJAYAWADA
DAMRA
KOCHI
KANJIRKKOD
AURAIYA
gas sector infrastructure: current & future
Ennore(proposed)5 mmtpa
emerging signs of maturing domestic gas market: plans afoot to have basic gas grid connecting sources of domestic gas, LNG terminals & demand centers

downstream regulatory framework…
natural gas pipelines

seek orderly sectoral growth & entry control
promote efficiency
productive: competition & reasonable cost
allocative: who remains in market ?
signaling role of price: cost reflective pricing
equity
fair play: access to natural monopoly assets
managed transition: legacy of controlled market (with state ownership) to robust segmented market
compliance – all stakeholders to adhere to rules & regulations, minimum service obligations & civic norms
regulatory design: objectives…

govt. policy on gas pipelines…
upfront provisioning of tax incentive u/s 80-IA (4) for infrastructure benefits: however, IT Act provides for 25% extra capacity, which is at variance with that in GOI policy for pipelines (33% extra capacity)
interchangeable use of common carrier or contract carrier in policy document & PNGRB Act, 2006- yet internationally gas markets have first been contract carriage systems before graduating into mature common carriage or hybrid systems
time frame for unbundling, which is key to creation of independent “shipping interest” not firmed-up

covers pipelines including spur line for transport of natural gas along with connected equipments & facilities, but excludes
dedicated pipelines for transporting natural gas to specific customer to meet specific requirements (& no re-sale)
pipelines in a CGD network
EOI followed by bidding route (or Suo Motu by Board)
does provide enabling platform with
minimum technical qualification requirements
net worth & bid bond linkage with pipeline length ensures serious bidding
authorization process…

PNGRB may modify or accept EOI depending upon gas availability or need to expand an existing pipeline & guided by objective (s) of:
promoting competition among entities;
avoiding infructuous investment;
maintaining or increasing supplies or for securing equitable distribution;
ensure adequate availability of natural gas throughout the country;
protection of customers’ interest in terms of availability of natural gas at reasonable natural gas pipeline tariff;
incentivizing rapid development of natural gas pipeline infrastructure
authorization process…

authorization process…
bidding criteria (25 years economic life):
lowness of PV of tariff bid for each year (70% weightage)
highness of PV of natural gas volumes (in MMSCMD) proposed to be transported (30% weightage)
Notes:
tariff to be bid zone-wise (TZn >= TZn-1) with 40% weight for TZ1 20% weight for %age increase over first zone 10% weight for %age increase over TZ2 (constant % thereon)
PV to be determined by using discount rate of 12%
bids to be consistent with assumptions considered in approved DFR of project
entity with highest composite score is successful

bidding process…illustratedBid A Bid B Bid C
TZ I II III IV Vol TZ I II III IV Vol TZ I II III IV Vol
Yr 10% 80% Yr 15% 90% Yr 0% 100%
8% 6.4% 14% 12.2% 0% 0.0%
1 1.30 1.43 1.54 1.64 48 1 1.20 1.38 1.57 1.76 50 1 1.50 1.50 1.50 1.50 54
2 1.33 1.46 1.58 1.68 56 2 1.26 1.45 1.65 1.85 60 2 1.53 1.53 1.53 1.53 63
3 1.36 1.50 1.62 1.72 72 3 1.29 1.48 1.68 1.88 70 3 1.56 1.56 1.56 1.56 81
4 1.39 1.53 1.65 1.76 80 4 1.32 1.52 1.73 1.93 90 4 1.59 1.59 1.59 1.59 90
5 1.42 1.56 1.68 1.79 80 5 1.39 1.60 1.82 2.04 90 5 1.62 1.62 1.62 1.62 90
10 1.57 1.73 1.87 1.99 80 10 1.77 2.04 2.32 2.60 90 10 1.77 1.77 1.77 1.77 90
15 1.72 1.89 2.04 2.17 80 15 2.26 2.60 2.95 3.31 90 15 1.97 1.97 1.97 1.97 90
20 1.91 2.10 2.27 2.41 80 20 2.88 3.31 3.76 4.21 90 20 2.17 2.17 2.17 2.17 90
25 2.11 2.32 2.51 2.67 80 25 3.68 4.23 4.80 5.38 90 25 2.40 2.40 2.40 2.40 90
PV 11.83 13.01 14.05 14.95 80 PV 13.18 15.16 17.20 19.30 90 PV 13.49 13.49 13.49 13.49 90
54 578 65 637 54 651
Tariff Criteria Vol
Wt 40% 20% 10% 30%
Bid Score Tot
A 11.83 10% 80% 578 A 45% 0% 10% 27% 82%
B 13.18 15% 90% 637 B 40% 0% 9% 30% 79%
C 13.49 0% 100% 651 C 39% 20% 8% 31% 98%
Min 11.83 0% 80% 651
short & medium term: expected participation from gas producers only- guided by desires to timely reach markets to match gas monetization plans & surety on capacity utilization!

extra capacity provisions…
provision for extra capacity in natural gas pipeline to be made available for use as common carrier by any third party on open access & non-discriminatory basis
capacity of natural gas pipeline = A + B + CA. capacity requirements of entity (?)B. firmed-up contracted capacity with other entitiesC. at least 33% of (A) & (B) = extra capacity
(?) should entity’s own requirement be clubbed with that of requirement of its own affiliate as well (provisions in PNGRB Act, 2006 does not envisage so; yet authorizations of some of pipelines do not suggest so…)

extra capacity provisions…
both government policy & PNGRB have same objective of having competitive gas markets – key is progressive unbundling along gas value chain
to create new authorization on ‘bundled basis’ only to be ‘unbundled’ later may have serious consequences in future
clubbing provision may have potential of serious monopoly abuse, in case authorized entity were to create an affiliate to be used as surrogate for blocking capacity booking by others
consumer may have only bundled contract option restricting it to either authorized entity or its affiliate
provisions in affiliate code of conduct may come in conflict when affiliate capacity requirements are to be assessed
section 21 of the PNGRB Act 2006 emphasizes need for fair competition & availability of natural gas
extra capacity provisions…
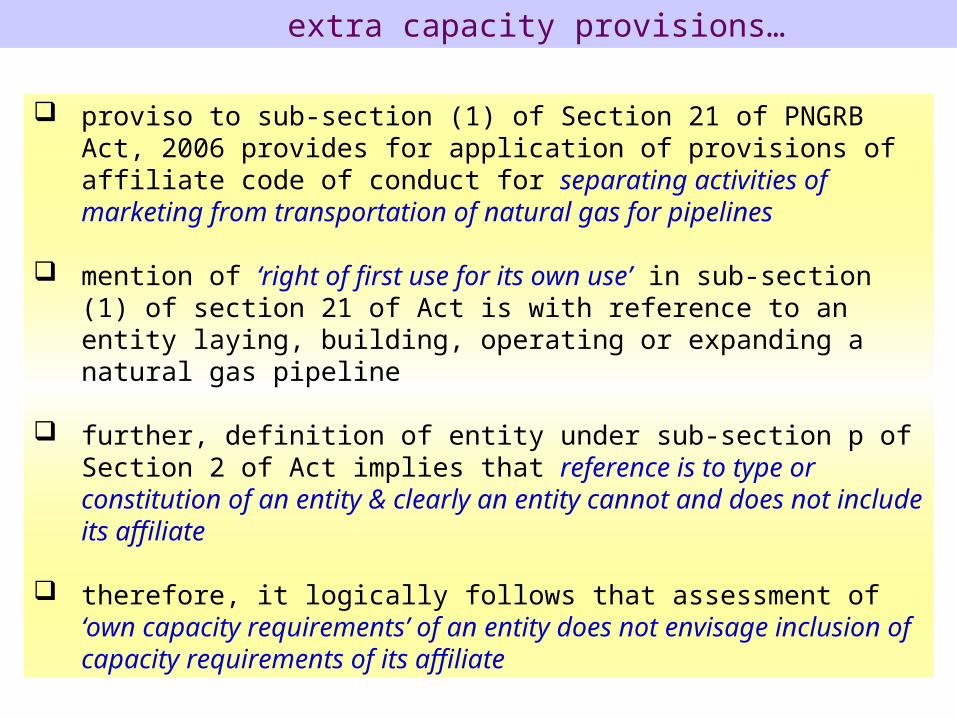
proviso to sub-section (1) of Section 21 of PNGRB Act, 2006 provides for application of provisions of affiliate code of conduct for separating activities of marketing from transportation of natural gas for pipelines
mention of ‘right of first use for its own use’ in sub-section (1) of section 21 of Act is with reference to an entity laying, building, operating or expanding a natural gas pipeline
further, definition of entity under sub-section p of Section 2 of Act implies that reference is to type or constitution of an entity & clearly an entity cannot and does not include its affiliate
therefore, it logically follows that assessment of ‘own capacity requirements’ of an entity does not envisage inclusion of capacity requirements of its affiliate

tariff determinationtariff model: cost of service (discounted cash flow)
historical cost of assets to be considered on “rolling basis”
efficiently incurred capex & opex with linkage with capacity (existing pipeline capacity determination an issue ?) & operating parameters of pipeline: to be considered over economic life of project (replacements factored)
norms for capacity utilization & variable costs linked to actual throughput
returns linked to12% post-tax on capital employed (implying project funding & fund re-engineering flexibilities available)
infrastructure benefits u/s 80-IA allowed to be retained: shall incentivize pipeline investments
capital employed = net fixed assets (gross fixed assets less depreciation at SLM rates as per Companies Act + normative working capital (30 days of opex: at variance with product pipelines at 20 days during APM days’)

tariff determinationtariff model: cost of service (discounted cash flow)
no change in tariff in case of capacity expansion by up to 10%
in case of capacity expansion >10%, entity to submit proposal to PNGRB & same may be allowed provided entity agrees to reduction in tariff by sharing fifty percent of proposed incremental tariff revenue calculated based on applicable tariff before expansion & incremental volumes
non-discriminatory charge of tariff & tariff to be reflected in invoice in energy equivalence terms (Rs./ MMBTU) making system more transparent from consumers’ standpoint
PNGRB, in medium term, should focus on evolving best standards & practices in pipeline laying, building & operations to enable development of benchmarks for efficient capex & opex in pipelines

tariff recovery system… potential disconnect
300 km each
TZ 1 TZ 2 TZ 3 TZ 4 TZ 5
50 km band
Interconnecting pipeline
1.20 1.35 1.45 1.53 1.60
1.20 1.35 1.451.351.45
two-way gas flows physical impossibility- may result in unofficial swap positions
inadvertently netback advantage could flow away from inter-connected pipeline into interconnecting pipeline resulting in:
pre-mature gas-to-gas competition interconnecting pipeline opts for
postalized tariff for entire pipeline length & customer closer to starting point suffers
customer pays different tariffs based on gas source in same pipeline in same zone!
new pipeline development gets adversely impacted as two-way gas flows cannot be envisaged in economics of pipeline design as volume flows may not be same in each tariff zone
rationale of tariff recovery similar to a railway line where passenger getting-off closer to starting point does not want to pay fare for distance not traveled
flexibility of volume variations in tariff zones allowed as pass-through in tariff
principle based on “pay for distance traveled alone” may make inter-connection proposition unattractive for inter-connected pipeline….maybe tariff recovery system should be dynamic to gas grid concept & not vice-versa…
Injection point

way forward…

some issues in way forward…
calibrated movement required (considering nascent stage of Indian gas market) from zonal postalized basis to full fledged entry-exit model for tariff recovery system, which is hallmark of most developed gas markets (Netherlands & U.K.)
regional network of pipelines may sometimes resemble CGD networks, yet CGD regulations cannot be applied due to legacy issues & impracticability, like, AGCL’s NE network of pipelines catering to small tea gardens; Charottar co-operative catering to small villages in an area along small industrial customers belt; Vadodra municipal corporation’s pipeline network catering only domestic PNG segment, etc.
applicability of tariff system yet to be articulated for regional network of pipelines, like GAIL’s pipeline network in KG basin

some issues in way forward…
monitoring mechanism for ensuring transparent contracting based on access code provisions
impact analysis of provisions of direct tax code on new natural gas pipeline projects
notification still awaited on regulations for basis of capacity determination for existing pipelines & declaration of pipelines as common carrier or contract carrier as envisaged in PNGRB Act, 2006 & in pipeline authorization regulations
thoughts on evolving trading platform for trading in pipeline capacity & gas supply contracts…

way forward for India…
Ownership / Regulation
StateMonopoly
PrivateMonopoly
EmergingCompetitive
Liberalised
Basic
Emerging
Sub-Mature
Mature
Mar
ket
/ In
fras
tru
ctu
re
possible alternative routes to be guided by degree of
non-discriminatory access allowed to CC capacity
effective unbundling of transportation & marketing activities
…& during such period, adherence to ACOC provisions, regulatory maturity in handling complex access code issues & GOI’s forward looking policies shall be keenly followed by industry…
Current

Thanks
views contained in this presentation are expressed in personal capacity
Vijay Duggal, DGM Commercial (CGD), BPCL [email protected]