phd and post phd network security visualization research
TRANSCRIPT

Network Security Visualization
Research Kulsoom Abdullah PhD
1
Kulsoom Abdullah's LinkedIn profile https://www.linkedin.com/in/kulsoomabdullah

• PhD Thesis work
• Post-PhD work
Outline
2

• Network traffic capacity is greater than systems can process
• Network attacks have not decreased, current security tools are insufficient
• Information visualization techniques used in network security research have initial success and future promise
• Text logs and machine learning algorithms are complemented and information is represented more densely.
Why Information Visualization & Network
Security
3

• Graph occlusion
• Avoid overlap and occlusion in the visualizations
• Scaling data parameters ranges
• For networking, port numbers & IP addresses need scaling
• 65535 TCP and UDP ports
• 4 billion possible IP addresses
• Time scaling
• Needs to be either small or large depending on activity
• small for quick activities: fast network scans, DoS, fast propagating worms
• large for slow network scans, overall trends in a network
Network data & graph scaling issues
4

IDS Rainstorm Main View
• This design scales all of the GT IP addresses
• 2.5 Class B addresses plotted along 8 vertical axis
• 20 IPs represented on each line
• Color represents severity
• Time: 24 hours of Stealthwatch IDS alarms shown
• Most logs are archived into 24 hours
• Filtering on alarm type & priority 5

Zoom View 6

Examples 7

8!
ICMP Flood Example!

9
Worm
Watch port active alarms in dorm space. Port watch was
on a known exploit.

• All stated that time was saved compared to using traditional IDS logs, it was simple and intuitive to use & functioned well
• Seeing patterns and sequence & connections between host
• Some did not return to the alarm text log & some did return to the log for more detail
• Not all alarm parameters are visually encoded
• Avoid overlap and occlusion in the visualizations
• Time scaling - Needs to be either small or large depending on activity
• small for quick activities: fast network scans, DoS, fast propagating worms
• large for slow network scans, overall trends in a network
Results-User Study
10

• K. Abdullah, G. Conti and R. Beyah. “A Visualization Framework for Self-monitoring of Web-based Information Disclosure” IEEE International Conference on Communications (ICC), May 2008. (Post PhD) http://bit.ly/1WfUbu1
• K. Abdullah, G. Conti and E. Sobiesk. “Self-monitoring of Web-based Information Disclosure” Workshop on Privacy in the Electronic Society (WPES); October 2007. http://bit.ly/1WfUB3L Cited in: G. Conti; Googling Security [http://amzn.to/1NcestF], Addison Wesley; November 2008. (Post PhD)
• K. Abdullah, J. A. Copeland. ”High alarm count issues in IDS RainStorm” ACM Conference on Computer and Communications Security’s Workshop on Visualization and Data Mining for Computer Security (VizSEC); November 2006. http://bit.ly/1KioKbz
• K. Abdullah, C. Lee, G. Conti and J. Copeland. “Processing Data to Construct Practical Visualizations for Network Security” Information Assurance Newsletter, Information Assurance Technology Analysis Center, United States Department of Defense, Summer 2006. http://bit.ly/1Snimrt
• G. Conti, K. Abdullah, J. Grizzard, J. Stasko, J. Copeland, M. Ahamad, H. Owen and C. Lee, ”Countering Security Analyst and Network Administrator Overload Through Alert and Packet Visualization” IEEE Computer Graphics and Applications (CG&A), March 2006. http://bit.ly/1ZqpgeD
• K. Abdullah, C. Lee, G. Conti, J. Copeland and J. Stasko, “IDS RainStorm: Visualizing IDS Alarms” IEEE Symposium on Information Visualization’s Workshop on Visualization for Computer Security (VizSEC); October 2005. http://bit.ly/1n1Heb8 Cited in: G. Conti; Security Data Visualization, No Starch Press; September 2007 http://amzn.to/1UVZPjY
• K. Abdullah, C. Lee, G. Conti and J. Copeland, “Visualizing Network Data for Intrusion Detection” IEEE Information Assurance Workshop (IAW); June 2005. http://bit.ly/1lg5m8P
• G. Conti and K. Abdullah,“Passive Visual Fingerprinting of Network Attack Tools” ACM Conference on Computer and Communications Security’s Workshop on Visualization and Data Mining for Computer Security (VizSEC); October 2004. http://bit.ly/1PwRaR1
Publications
11

Post PHD Network
Visualization Research
3D Network Security Visualization
12

3D Network Security
Visualization Troy Nunnally, CAP &
CSC at GATECH
• 3D Shows more information vs 2D
• 3D can be difficult to for Novices to navigate
13
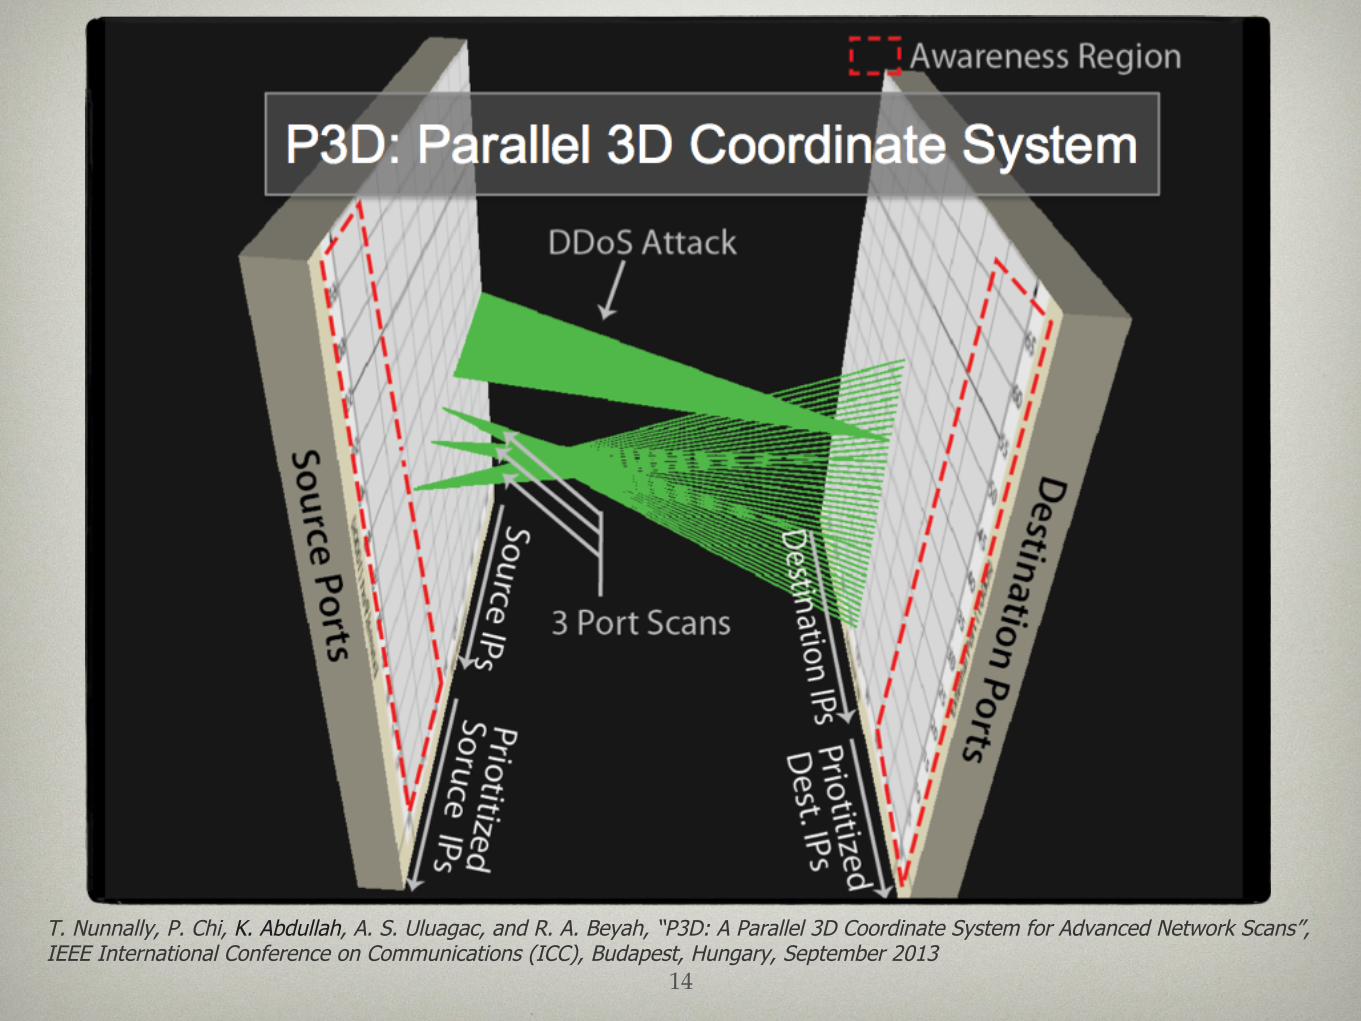
T. Nunnally, P. Chi, K. Abdullah, A. S. Uluagac, and R. A. Beyah, “P3D: A Parallel 3D Coordinate System for Advanced Network Scans”, IEEE International Conference on Communications (ICC), Budapest, Hungary, September 2013
14!

Collaborative Filtering & Global Restriction
15!

16!
T. Nunnally, K. Abdullah, A. S. Uluagac, and R. A. Beyah, “NAVSEC : A Recommender System for 3D Network Security Visualizations”, IEEE Symposium on Information Visualization’s
Workshop on Visualization for Computer Security (VizSEC), Atlanta, GA, USA, October 2013.!

Stealthy Port Scanning Use-Case
P3D Multiple concurrent FTP scan P3D Multiple concurrent FTP scan
17
• Implementation and evaluation of more advance use-case scenarios (i.e., introduce benign traffic)
• T. Nunnally, K. Abdullah, A. S. Uluagac, J. A. Copeland & R. A. Beyah, "InterSec: An Interaction System for Network Security Applications", IEEE Symposium on Information Visualization's Workshop on Visualization for Computer Security (VizSEC) 2014. http://bit.ly/1P58Hpd
• User Testing
• 3D, Stereoscopic view, Navigation Assistance
• Natural User Interface
• Kinect, WII
Future P3D work
18