phase separation in confined systems - penn engineeringbiophys/cv_files/reprint_rop99.pdf · we...
TRANSCRIPT

Rep. Prog. Phys.62 (1999) 1573–1659. Printed in the UK PII: S0034-4885(99)42161-X
Phase separation in confined systems
Lev D Gelb†§, K E Gubbins†, R Radhakrishnan† and M Sliwinska-Bartkowiak‡† North Carolina State University, Department of Chemical Engineering, 113 Riddick Labs, Raleigh, NC27695-7905, USA‡ Instytut Fizyki, Uniwersytet im Adama Mickiewicza, ul Grunwaldzka 6, 60-780 Poznan, Poland
Received 12 April 1999
Abstract
We review the current state of knowledge of phase separation and phase equilibria in porousmaterials. Our emphasis is on fundamental studies of simple fluids (composed of small, neutralmolecules) and well-characterized materials. While theoretical and molecular simulationstudies are stressed, we also survey experimental investigations that are fundamental in nature.Following a brief survey of the most useful theoretical and simulation methods, we describethe nature of gas–liquid (capillary condensation), layering, liquid–liquid and freezing/meltingtransitions. In each case studies for simple pore geometries, and also more complex oneswhere available, are discussed. While a reasonably good understanding is available for phaseequilibria of pure adsorbates in simple pore geometries, there is a need to extend the models tomore complex pore geometries that include effects of chemical and geometrical heterogeneityand connectivity. In addition, with the exception of liquid–liquid equilibria, little work hasbeen done so far on phase separation for mixtures in porous media.
§ Present address: Department of Chemistry, Florida State University, Tallahassee, FL 32306-4390, USA.
0034-4885/99/121573+87$90.00 © 1999 IOP Publishing Ltd 1573

1574 L D Gelb et al
Contents
Page1. Introduction 15752. Simulation and theoretical methods 1580
2.1. Grand canonical Monte Carlo 15802.2. Gibbs ensemble Monte Carlo 15822.3. Semi-grand Monte Carlo 15822.4. Quench molecular dynamics 15822.5. Lattice models 15832.6. Histogram analysis methods 15842.7. Histogram-biased Monte Carlo simulations 15842.8. Density functional theory 15852.9. Intermolecular potential functions 1586
3. Capillary condensation 15873.1. Experimental studies 15883.2. Theoretical and simulation studies: simple pore geometries 15953.3. Theoretical and simulation studies: complex pore geometries 1606
4. Layering transitions 16174.1. Experiments 16174.2. Theoretical treatments and systematics of surface phase transitions 16184.3. Molecular simulation 1621
5. Liquid–liquid equilibria 16225.1. Experimental results 16245.2. Lattice models 16325.3. Molecular simulation results 1633
6. Freezing 16376.1. Experiments on freezing/melting 16386.2. Simulation studies: simple pore geometries 16426.3. Simulation studies: complex pore geometries 16496.4. Freezing versus glass transition 1650
7. Conclusions 1651Acknowledgments 1652References 1652

Phase separation in confined systems 1575
1. Introduction
Molecules confined within narrow pores, with pore widths of a few molecular diameters, canexhibit a wide range of physical behaviour. The introduction of wall forces, and the competitionbetween fluid–wall and fluid–fluid forces, can lead to interesting surface-driven phase changes.These include new kinds of phase transitions not found in the bulk phase, e.g. layering, wettingand commensurate–incommensurate transitions, as well as shifts in transitions (e.g. freezing,gas–liquid, liquid–liquid) that are familiar from bulk behaviour. In such confined systems theconfined phase is usually termed theadsorbate, and the porous material theadsorbent.
The fundamental scientific interest in these phase changes is to understand the new physicsthat results from finite-size effects, varying dimensionality, and surface forces. When the porewidth is of the order of the range of the intermolecular forces, a large fraction of the confinedmolecules will experience a reduction in the number of nearest-neighbour molecules, and wemight expect this to lead to large shifts in phase coexistence curves and a lowering of any criticalpoints. These expectations are confirmed by experiment. For a slit-shaped pore (as in some car-bons or in the surface force apparatus), reduction of the pore width will cause the behaviour ofthe confined system to change from nearly three-dimensional to two-dimensional. For a cylin-drical pore (as in some zeolites and in carbon buckytubes), reduction in pore diameter will leadto one-dimensional behaviour. Thus, investigations of such confined fluids provide a way tostudy both finite-size effects and varying dimensionality. A fundamental question is how suchtransitions (and any associated critical points) are affected by state conditions and pore variables(pore geometry and size, molecular structure of the pore surface, pore connectivity, etc).
In addition to scientific interest, a fundamental understanding of these phenomena isnecessary for many industrial and geophysical operations. Micro- and meso-porous (porewidths of under 2 nm and 2–50 nm, respectively) materials are widely used in the chemical,oil and gas, food and pharmaceutical industries for pollution control, mixture separation, andas catalysts and catalyst supports for chemical reactions. The design of such processes islargely empirical at the present time, with little scientific basis. Improved understandingof the effects of confinement on the equilibrium composition of reacting mixtures, and onadsorption and diffusion rates, could lead to significant improvements in these industrialprocesses. Confinement effects are also important for many applications in lubrication andadhesion, and in geology and geophysics. Many rock and soil formations are porous, and theflow, diffusion and selective adsorption of water, aqueous solutions, pollutants, oil and gas insoils and rocks is important in such fields as tertiary oil recovery, gas field technology, removalof pollutants from ground water and soils, and in frost heaving. Materials with very regularpores are finding application in the fabrication of nanomaterials (conducting polymers, opto-electronic devices, metal wires, etc). In these applications the nanopores are used as templatesfor the material fabrication, which often involvesin situ chemical reaction and/or fluid–solidor solid–solid phase changes.
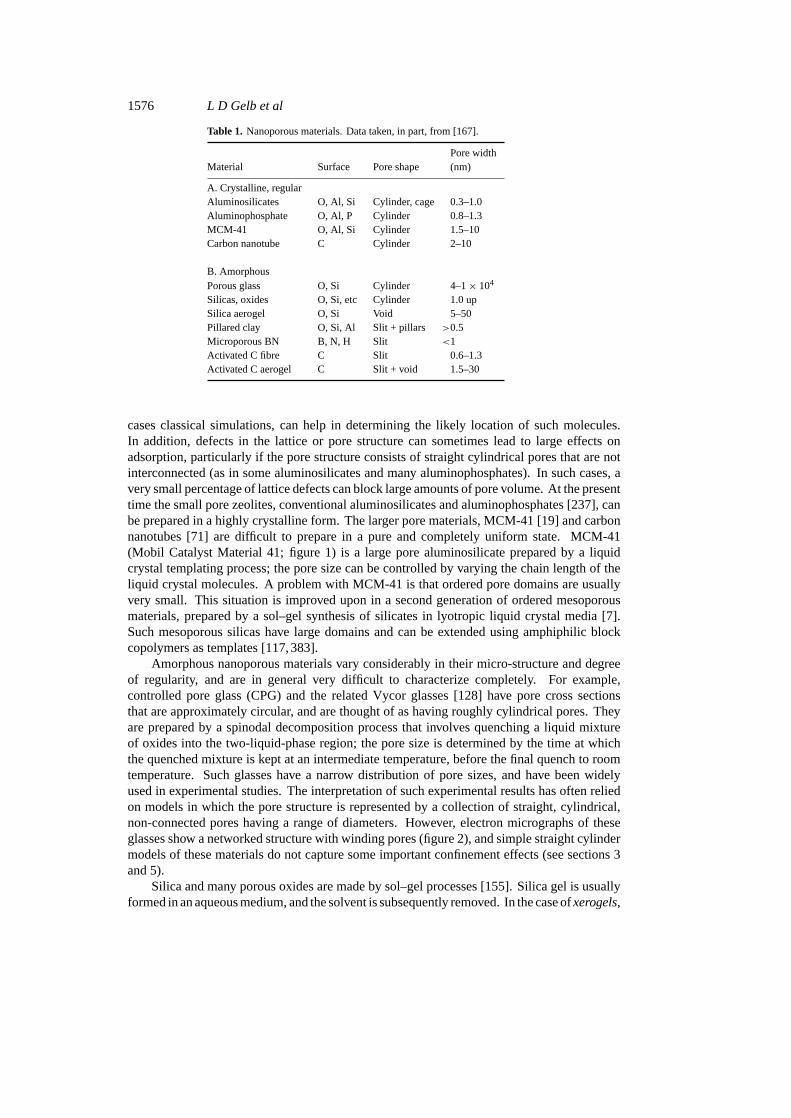
Some examples of nanoporous materials are given in table 1, together with approximatepore shapes and sizes. It is convenient to divide these into those with crystalline orregular structures, and those that are amorphous. For crystalline (e.g. aluminosilicates,aluminophosphates) or regular (e.g. carbon buckytubes) materials, x-ray or neutron diffractioncan be employed to determine the atomic structures, and hence the pore geometry anddimensions. Such information provides the coordinates of the solid atoms, and this structuralinformation greatly facilitates the interpretation of experiments carried out on these materials.In addition, modelling of confinement effects in such materials is greatly simplified. Even inthese materials some structural uncertainties usually remain. The location of water moleculesand ions in the framework structure may be unknown.Ab initio calculations, and in some
1576 L D Gelb et al
Table 1. Nanoporous materials. Data taken, in part, from [167].
Pore widthMaterial Surface Pore shape (nm)
A. Crystalline, regularAluminosilicates O, Al, Si Cylinder, cage 0.3–1.0Aluminophosphate O, Al, P Cylinder 0.8–1.3MCM-41 O, Al, Si Cylinder 1.5–10Carbon nanotube C Cylinder 2–10
B. AmorphousPorous glass O, Si Cylinder 4–1× 10⁴
Silicas, oxides O, Si, etc Cylinder 1.0 upSilica aerogel O, Si Void 5–50Pillared clay O, Si, Al Slit + pillars >0.5Microporous BN B, N, H Slit <1Activated C fibre C Slit 0.6–1.3Activated C aerogel C Slit + void 1.5–30
cases classical simulations, can help in determining the likely location of such molecules.In addition, defects in the lattice or pore structure can sometimes lead to large effects onadsorption, particularly if the pore structure consists of straight cylindrical pores that are notinterconnected (as in some aluminosilicates and many aluminophosphates). In such cases, avery small percentage of lattice defects can block large amounts of pore volume. At the presenttime the small pore zeolites, conventional aluminosilicates and aluminophosphates [237], canbe prepared in a highly crystalline form. The larger pore materials, MCM-41 [19] and carbonnanotubes [71] are difficult to prepare in a pure and completely uniform state. MCM-41(Mobil Catalyst Material 41; figure 1) is a large pore aluminosilicate prepared by a liquidcrystal templating process; the pore size can be controlled by varying the chain length of theliquid crystal molecules. A problem with MCM-41 is that ordered pore domains are usuallyvery small. This situation is improved upon in a second generation of ordered mesoporousmaterials, prepared by a sol–gel synthesis of silicates in lyotropic liquid crystal media [7].Such mesoporous silicas have large domains and can be extended using amphiphilic blockcopolymers as templates [117,383].
Amorphous nanoporous materials vary considerably in their micro-structure and degreeof regularity, and are in general very difficult to characterize completely. For example,controlled pore glass (CPG) and the related Vycor glasses [128] have pore cross sectionsthat are approximately circular, and are thought of as having roughly cylindrical pores. Theyare prepared by a spinodal decomposition process that involves quenching a liquid mixtureof oxides into the two-liquid-phase region; the pore size is determined by the time at whichthe quenched mixture is kept at an intermediate temperature, before the final quench to roomtemperature. Such glasses have a narrow distribution of pore sizes, and have been widelyused in experimental studies. The interpretation of such experimental results has often reliedon models in which the pore structure is represented by a collection of straight, cylindrical,non-connected pores having a range of diameters. However, electron micrographs of theseglasses show a networked structure with winding pores (figure 2), and simple straight cylindermodels of these materials do not capture some important confinement effects (see sections 3and 5).
Silica and many porous oxides are made by sol–gel processes [155]. Silica gel is usuallyformed in an aqueous medium, and the solvent is subsequently removed. In the case ofxerogels,

Phase separation in confined systems 1577
Figure 1. Transmission electron micrograph (TEM) ofMCM-41, showing uniform pores of hexagonal crosssection. From [149].
Figure 2. Scanning electron micrograph of a CPG of300 nm mean pore diameter. From [128].
Figure 3. TEM of a carbon aerogel, magnification2200 000. From [132].
Figure 4. TEM of a pitch-based activated carbon fibre.White areas are pores, grey areas are pore walls, darkareas are thicker pore walls [271].
the structure is compressed and the porosity reduced by the surface tension forces as the liquidmedium is removed.Aerogelsare gels in which the liquid phase has been replaced by a gas insuch a way as to avoid the shrinkage that would normally occur if the gel were directly dried;thus, they are characterized by very high porosity. Carbon aerogels are prepared by supercriticaldrying, followed by pyrolysis, of an organic gel such as resorcinol-formaldehyde gel [286,287].They are mesoporous and may contain some micropores [131, 133]. An example is shownin figure 3. Silica aerogels [155] can be prepared by replacing the water by alcohol, heatingthe gel to a temperature above the critical temperature of the alcohol (to avoid the tensionassociated with a gas–liquid meniscus, and consequent compression of the gel), followed byremoval of the alcohol vapour. Porous materials fabricated by sol–gel processes generallyconsist of roughly spherical solid particles separated by void space. Models consisting of arandom array of spheres to represent the solid have been used to study such materials.
Activated carbons [15, 156, 233, 236, 285] can take a variety of forms (figures 4 and 5).

1578 L D Gelb et al
Figure 5. High-resolution TEM image before (a) and after (b) image analysis of a graphitizedanthracene soot sample. From [277].
Figure 6. High-resolution TEM images of carbon nanotubes withincreasing numbers of concentric tubes, one to five layers in (a)–(e).From [2].
They are usually prepared by heating organic material (e.g. wood, coal, polymers, vegetablematter) to a high temperature in the presence of an oxidizing agent (often steam). Such carbonshave been modelled using a collection of slit-shaped pores of varying widths, with the poresurfaces modelled as graphite basal planes. Variations on this include wedge-shaped pores,and blocks of graphite with sections randomly removed [27,28]. Carbon nanotubes (figure 6)can be prepared as regular straight carbon tubes; the diameter and number of graphite sheetsin the walls can be controlled in the manufacturing process.
In a bulk system we can think of a first-order phase transition as being accompanied by an

Phase separation in confined systems 1579
infinitely sharp change in a suitable order parameter, usually the density or composition. Atthe equilibrium transition point the two phases have equal free energies or chemical potentials.Correlation lengths grow to infinite size as the system approaches a critical point. In a confinedsystem, care must be used to define what is meant by a phase change. For a slit-shaped pore,true phase transitions are known to occur. The correlation length can grow to infinity in thetwo dimensions parallel to the pore walls, but in the third dimension, normal to the walls, it canonly grow to the pore widthH . Critical points will be associated with gas–liquid and liquid–liquid equilibria in such systems. For cylindrical pores the situation is more complicated.The confined system can separate into two or more phases having equal grand free energies.However, the correlation length can only grow to infinity in one dimension, that along the axisof the cylinder. Such a one-dimensional system cannot exhibit a true phase transition. Phaseseparation consists of the formation of small micro-domains of each phase. The average lengthof these micro-domains depends on the diameter of the pore and the temperature, being largerfor larger pores and lower temperatures (see figure 43). As the temperature approaches a porepseudo-critical temperature the average domain length decreases. However, away from thiscritical region the average domain length can be macroscopic, running to many micrometresor millimetres. In such cases it is convenient to refer to the system as phase separated, and torefer to the point at which such phase separation no longer occurs as a critical point. This isdiscussed further in sections 3 and 5.
Both experimental and theoretical work in this field are beset with significant difficulties.On the experimental side, it is difficult to describe the adsorbed material, and one must attemptto infer its molecular structure from a range of experimental techniques. With the exception ofthe crystalline materials, one of the greatest difficulties is in determining the morphology of thematerial. Often the distribution of pore sizes and shapes is poorly known, and little is known ofconnectivity and surface chemistry. In such situations any interpretation of experimental resultsis speculative. In equilibrium experiments it is often difficult to know if true thermodynamicequilibrium has been achieved. Metastable states are a considerably greater problem in thesesystems than in bulk materials. In some cases, such as freezing and liquid–liquid separationin amorphous materials, it is likely that equilibrium is never attained in any reasonable time.Other common difficulties in the experiments include: (a) the possibility that the surfaces andpore structure may change with temperature or pressure; and (b) trace amounts of impuritiesin the adsorbate may preferentially adsorb on the pore walls, leading to spurious results.
In theoretical and simulation work the problems are somewhat different. In contrast to theexperiments, the molecular structure of the adsorbate is completely known. However, in tryingto simulate amorphous systems, the lack of knowledge of the morphology of the porous materialis often the greatest problem. Two possible approaches to this problem are: (i) attempt to builda model that looks as much as possible like the real material by studying electron micrographsand other laboratory measures; (ii) try to mimic by simulation the manufacturing process usedto make the real material. Other complications that arise in modelling are: (a) metastable statesarise frequently, as in the experiments. However, in theory and simulation we can calculatefree energies, and thus determine which of several different states of the system is the trueequilibrium one, and the point at which true phase equilibrium exists. (b) Usually the porewalls are assumed to be rigid and do not change with the state conditions of the bulk fluid. Thisrequirement can be relaxed, as in clay swelling, for example: (c) vibration of solid atoms isusually neglected, but will be important for some properties. (d) The intermolecular potentials(fluid–fluid and fluid–solid) are uncertain. The fluid–fluid potentials are often assumed to bethe same as those for the bulk fluid, i.e., the external field from the walls is assumed to havea negligible influence on these. In the case of the fluid–solid interactions, the importance ofelectrostatic, induction, and three-body and higher-body interactions is often unknown.

1580 L D Gelb et al
In addition to its use to model real systems, simulation and theory can also be used to studythe behaviour of adsorbates confined in hypothetical porous materials that do not necessarilycorrespond to real materials. Such simulations offer the possibility of systematic investigationsnot possible in the laboratory, since the simulator can vary the pore geometry, connectivity andsurface chemistry at will.
Earlier reviews of adsorption have addressed some aspects of phase separation in porousmedia [55, 78, 79, 126, 127, 325], but have not been comprehensive. In what follows wereview the current state of knowledge of phase separation and phase transitions in porousmaterials. Our emphasis is on simple fluids (composed of small, neutral molecules) and well-characterized materials. Although we emphasize theoretical and simulation studies, we alsodiscuss examples of experimental investigations. The most useful theoretical and simulationmethods for this work are described in section 2. Subsequent sections describe various kinds ofphase separations (condensation, layering transitions, liquid–liquid equilibria, and freezing).We do not cover wetting in detail, which has been reviewed separately [96, 344], nor dowe discuss solid–solid transitions. Also, complex fluids, such as ionic fluids [200, 204],polymers [17,76,392], colloidal suspensions [177,373] and amphiphiles, are not covered.
2. Simulation and theoretical methods
A variety of molecular simulation schemes have been used to study phase transitions inconfined systems. The principal methods that have been used are grand canonical MonteCarlo (GCMC) simulation and Gibbs ensemble Monte Carlo (GEMC) simulation. Othermethods that have been applied less frequently to these problems are semi-grand Monte Carlo(SGMC), histogram-reweighting and histogram-biasing methods, and molecular dynamics. Anumber of texts which cover these techniques in considerable depth are available, includingComputer Simulation of Liquids[4], Understanding Molecular Simulation[98], andComputerSimulation and the Statistical Mechanics of Adsorption[260].
Among theoretical methods, the most widely used has been density functional theory(DFT) [77,80,126]. While integral equation theories have proved useful for investigating thestructure of confined fluids [140,178,179], a realistic description of phase changes has provedmore difficult, requiring complex closures. Here we give a brief review of simulation anddensity-functional techniques and their application to confined fluid phase equilibria.
2.1. Grand canonical Monte Carlo
The GCMC method simulates an open system specified by fixed temperatureT , volumeVand chemical potentialµ. It is the staple technique for the simulation of an adsorbed fluid(or fluid mixture) in equilibrium with a bulk fluid reservoir, which is frequently the situationencountered in experimental studies of confined fluids. The method was first used in studiesof bulk fluids [1,263], and was quickly extended to adsorbed systems [365,366].
GCMC, like other Monte Carlo methods used in molecular simulation, is based on the useof a Markov chain to generate a series of molecular configurations [134,318] with the correctdistribution of energy and density. In the grand canonical ensemble, the probability associatedwith any given (classical) states of the system is
P(s) ∝ exp[−β(V(s)−Nµ)− lnN ! − 3N ln3 +N lnV ], (1)
where3 is the de Broglie wavelength,β = 1/kBT , V(s) is the total intermolecular potentialenergy of the system, andN is the number of molecules in the system. Most simulators use theoriginal prescription for generating the Markov chain proposed by Norman and Filinov [4,263].
Phase separation in confined systems 1581
In this method, subsequent steps in the chain are generated by modifying the current molecularconfiguration in one of three ways: either creating a new molecule at a random position,destroying an existing molecule, or displacing an existing molecule by a random vector. These‘moves’ are then accepted or rejected according to criteria based on the temperature andchemical potential. Thermodynamic quantities of interest can be estimated by averaging theirmicroscopic counterparts over a large number,M, of these configurations; for instance, theaverage internal energy〈U〉 is estimated by the average of the instantaneous potential energy,1M
∑Mi V (s). In general, there is considerable freedom in choosing the parameters controlling
the simulation, and statistically efficient choices of these parameters, as well as the totalsimulation length, vary widely between different systems.
The thermodynamic potential appropriate to the grand canonical ensemble is the grandfree energy,�, given by
� = F − µ〈N〉 (2)
whereF is the Helmholtz free energy,F = U−T S and〈N〉 is the average number of molecules(for a mixture the last term on the right-hand side of equation (2) is replaced by sum over allcomponents,
∑α µα〈Nα〉). For a pore of general shape the exact differential of� is given by
d� = −S dT − Pb dV − 〈N〉 dµ + γ dA (3)
whereS is the entropy,Pb is the bulk phase pressure,γ is the solid–fluid interfacial tensionandA is the surface area. For slit-shaped pores this is often written as [11,78]
d� = −S dT − Pb dV − 〈N〉 dµ + 2γ dA− Af dH (4)
whereA is now the surface area of one of the pore walls,H is the pore width and has beenallowed to vary, andf is the solvation force (also called the solvation pressure), defined asf = PH − Pb, wherePH is the pressure exerted on the pore walls by the adsorbate. From (4)the form of the Gibbs adsorption isotherm is obtained,(
∂�
∂µ
)T ,V,A,H
= −〈N〉. (5)
An important refinement in the use of GCMC simulations to study capillary phaseequilibria was the development of an integration scheme that allowed precise location ofthe thermodynamic condensation pressure in mesoporous systems [290]. In this method, thegrand free energy� is integrated along the adsorption isotherm using equation (5). The lowerlimit of the integration is taken as an ideal gas state, for which the grand potential can becalculated directly from the external potential [127].
The grand potential density of the desorption branch of the isotherm is determined usinga three-part integration. First, a supercritical (and hence reversible) adsorption isotherm ismeasured. Then a second integration along a path of decreasing temperature at constantµ isdone, using the expression(
∂(�/T )
∂(1/T )
)V,A
= U − 〈N〉µ (6)
with U the (absolute) potential energy of the system. Finally, the desorption isotherm itself isintegrated using equation (5). The thermodynamic transition chemical potential is found at theintersection of the�(µ) curves for the adsorption and desorption branches. These methodshave been used to study liquid–vapour coexistence in both simple cylindrical models [291]and more complex models [274, 275]. For pores of irregular geometry or pore models basedon an atomistic description of the adsorbent, this integration scheme is the only method sofar used to calculate capillary condensation phase diagrams. We note that the thermodynamic

1582 L D Gelb et al
transition pressure cannot be determined by experiment in general, because the internal energydata required for this integration scheme is extremely difficult to obtain. We also note that, forthe case of slit pore geometry, amechanicalroute to� has been proposed [378].
2.2. Gibbs ensemble Monte Carlo
The GEMC method is a more recent development [279] which directly calculates phasecoexistence by simulating the two phases in different simulation cells, with both mass andvolume exchange between the two phases; for a pure fluid, this imposes equality of thepressure, temperature, and chemical potentials between the two phases, which implies phasecoexistence. The method has also been extended to mixtures [281]. The chemical potential ofeach component in each phase can be calculated at no extra cost in this type of simulation [338].Since its introduction, the Gibbs ensemble has enjoyed wide use in the study of bulk phaseequilibria [280].
A Gibbs ensemble simulation is also based on a Markov chain generation; in this case, thedifferent types of moves are displacement of molecules (in each box), transfer of moleculesbetweenboxes, and exchange of volume between boxes; the latter is generally accomplishedby rescaling the physical dimensions of each simulation cell.
For some confined systems, this method can be used directly to obtain capillarycondensation [160,278] phase diagrams and liquid–liquid phase diagrams [119]. The systemmust be of a sufficiently ideal geometry that volume-scaling moves can be used; this essentiallyrestricts one to studying smooth-walled pores of either cylindrical or planar geometry.
2.3. Semi-grand Monte Carlo
The SGMC method was developed for use in studying multicomponent phase equilibria [182].In the case of a binary mixture, it consists of a simulation at constant(T ,N,µ1− µ2), whichis achieved by including simulation moves that attempt to change molecules of species ‘1’ intomolecules of species ‘2’, and vice versa. In the constant-pressure version of the algorithm,the simulation is performed at constant(T , P, µ1−µ2). In both cases, the absolute chemicalpotentials of both species can be calculated using a modification of the Widom insertionmethod [182]. This method is especially useful for studying liquid mixtures [67] in which thequantity of main interest is the mole fraction, rather than the density.
The semi-grand method can be used for studying liquid–liquid coexistence in poresystems [106, 108]. However, if the bulk phase in equilibrium is to be specified as well,the method has little advantage over direct grand canonical ensemble simulation of the binarymixture, since the chemical potential of both species is specified in advance in the GCMCmethod.
2.4. Quench molecular dynamics
Molecular dynamics is a widely used technique in which the classical equations of motion forthe system are integrated using a finite-difference algorithm. The resulting trajectory samplesthe microcanonical ensemble of states, and can be used to obtain thermodynamic averages.More important for phase equilibria calculations are the constant-temperature modifications ofthis method, in which the total kinetic energy of the system is adjusted, either by direct rescalingor by various schemes of coupling to an external bath of constant temperature [21,145,264].
Most molecular dynamics studies of phase equilibria in confined systems have focusedon the kinetics of two-phase separation. In these studies a system is prepared at supercritical

Phase separation in confined systems 1583
temperature and then quenched into the two-phase region by resetting the thermostat in theequations of motion. The phase separation then proceeds dynamically. It can be quantitativelyfollowed by tracking either the total potential energy of the system or measuring structuralquantities such as the inter-species radial distribution function. This method has principallybeen used to study the separation of liquid mixtures, and has been applied in planar pores [168],two-dimensional ‘strip’ pores [398], cylindrical pores [106, 107, 396], and more complexdisordered media [343].
2.5. Lattice models
The isomorphism between the spin-12 Ising model and the classical lattice gas is well known,
and discussed in most standard texts on statistical mechanics [147]. The Ising model is givengenerally by
E{si} = −∑〈ij〉
εij sisj −HN∑i=1
si, (7)
where the first sum is taken over all pairs of spins, and the second term is the contributionof an (optional) applied magnetic fieldH . εij is the interaction energy between each pair ofspins. The Ising model has been studied in many dimensions, for many lattice geometries,and for many spatially varying external fields. Most work, however, has focused on a three-dimensional cubic lattice, with only isotropic nearest-neighbour couplings.
This simple Ising model is isomorphic with a simple model for liquid–vapour equilibria,the lattice gas. The lattice gas is generally given by a simple uniform lattice in which latticesites can be occupied by a single ‘gas’ molecule. Gas molecules on neighbouring sites interactthrough some energy−εlg. This model is made equivalent to the Ising model with nearest-neighbour interactions on the same lattice by equating occupied lattice gas sites with spin ‘up’Ising sites, etc. The thermodynamic state of the lattice gas is specified by a temperature andchemical potential (µ), while the state of the Ising model is specified by a temperature and amagnetic fieldH ; the mapping is given by 2(εγ −H)↔ µ, with γ the coordination numberof a lattice site.
In a similar way, the simple Ising model can be used to describe a coarse model for amixture of two species. The two spin states correspond with the two species in this case. Themole fraction of the mixture is just the net magnetization, and the nearest-neighbour couplingε corresponds withε11 + ε22 − 2ε12, these being the nearest-neighbour couplings betweenisolated pairs of ‘1’ atoms, ‘2’ atoms, and the cross-coupling [147].
The kinetics of phase separation and domain motion in the Ising model have beenextensively studied by computer simulation. Ising calculations are of the Monte Carlo type, sothat there is no physically definedtime; instead, an (arbitrary) time parameter is associated witheach particular Monte Carlo simulation algorithm. Of particular interest are two algorithms; thestandard spin-flip algorithm and dynamics, in which the total magnetization is not conserved,and the ‘Glauber’ dynamics associated with the spin-exchangeIsing model, in which the onlyallowed move is the exchange of spins on neighbouring lattice sites. The spin-exchange modelis suitable for studying the dynamic separation (or mixing) of liquid mixtures, although it omitshydrodynamic effects.
In this review we will hold to the usual liquids-oriented notation in describing thethermodynamics of confined systems, exept where directly concerned with spin systemcalculations. Those more familiar with magnetic systems might review the mappings describedabove in order to better reconcile these different descriptions.

1584 L D Gelb et al
2.6. Histogram analysis methods
A variety of new methods have been used in the last decade to obtain bulk phase coexistenceand critical point data to very high precision. These methods are based on the collection andanalysis of histograms of the energy and (usually) number of particles over the course of aMonte Carlo simulation, from which can be extracted the density of states and free energiesin the system.
Histogram data were first collected some time ago, in studies of the supercritical Lennard-Jones (LJ) fluid [235]. The fact that these data could be used to efficiently estimate free energydifferences was suggested by Bennett [20], after which these techniques were widely appliedin analysis of spin systems and lattice models. Histogram methods were applied to phasetransitions by Ferrenberg and Swendsen [87], who later determined optimal methods for thecombination of data from multiple simulations [88] and uncertainty analysis [86].
Histogram methods were finally re-applied to continuous systems by Wilding and Bruce[385, 386], in conjunction with ‘mixed-field’ finite-size scaling analysis, which allowed thedetermination of the critical parameters of a LJ fluid to very high precision.
In the grand canonical ensemble, the probability of observing a stateswith givenU = V(s)andN is given in equation (1). Equivalently, the probability of observing a state with energyU and number of particlesN could be written as
P(U,N) ∝ exp(βµN)× exp(−βU)×W(U,N), (8)
whereW(U,N) is themicrocanonical density of statesof energyU and numberN . In a given(long) GCMC simulation, if we collect a histogram of the energy and number of particles, thenumber of ‘counts’ in each histogram bin will be proportional toP(U,N), and so the densityof states can be recovered up to a constant factor from the simulation data by dividing by theBoltzmann factor and chemical potential term. Furthermore, multiple simulations at differentstate points can be used to build up an accurate density of states over a large range ofN andU by combining data. Ferrenberg and Swendsen [88] give an optimal statistical recipe for thiscombination.
The probabilityP(U,N) can be estimated fordifferent temperatures and chemicalpotentials, by reweighting the histogram according to
Pβ ′,µ′(U,N)
Pβ,µ(U,N)∝ exp((β ′µ′ − βµ)N)× exp(−(β ′ − β)U), (9)
which is obtained by dividing the previous expression by itself at differentβ andµ. Thisnew distribution can be used to regenerate quantities such as〈U〉 and 〈N〉, and to locatethermodynamic transitions.
The form of P(U,N) near a critical point is universal up to some scaling factors.Wilding [385] showed that this property could be used to precisely locate the critical point inboth finite and infinite systems.
Histogram schemes are also immediately extensible to multicomponent systems. Inaddition, they can be used to obtain surface tension data in both spin systems [23] and molecularsimulations [148]. These methods have not yet been extensively applied in the study of confinedfluids, but ought to allow for detailed and direct characterization of critical fluids in some porousmaterials.
2.7. Histogram-biased Monte Carlo simulations
A closely related technique, based on similar ideas, is that of histogram-biasedsimulation[22,270]. In this family of techniques, the Monte Carlo chain itself is biased to favour certain

Phase separation in confined systems 1585
areas of phase space; this results in a biased probability distribution histogram, which can becorrectedafter completion of the simulation by dividing out the biasing function. The strengthof this technique is that it allows distant sections of phase space (such as the solid-like andliquid-like regions) to be covered by a single series of simulations, so that transition points canbe located as described above.
2.8. Density functional theory
DFT has been used extensively in theoretical treatments of confined phase equilibria and isthe basis of much of our theoretical understanding of capillary phenomena [83]. In this familyof methods, which are applicable to both confined and bulk systems, the equilibrium densityprofileρ(r) is obtained by minimizing a free-energyfunctional[77,80,126]. For the particularcase of a pore system in equilibrium with a bulk phase, we write the grand potential� as afunctional of the density profile:
�[ρ(r)] = F [ρ(r)] −∫
dr ρ(r)[µ− Vext(r)] (10)
whereF is the intrinsic Helmholtz free energy of the fluid (i.e. the Helmholtz energy in theabsence of the external field) andVext is the potential field due to the pore material. For the LJand similar fluids,F is usually given by a first-order perturbation around the hard-sphere fluid,with the attractive part of the fluid–fluid potential interactions approximated by a mean-fieldterm:
F [ρ(r)] = Fh[ρ(r)] + 12
∫dr∫
dr′ ρ(r)ρ(r′)φatt(|r − r′|). (11)
Generally, the attractive part of the fluid–fluid potential is taken from the Weeks–Chandler–Andersen division of the LJ potential [382]. The intrinsic free energy of the hard sphere fluidis then split into an ideal part and an excess part. The ideal part is trivial; the excess part isdealt with in one of several ways, which distinguish the several commonly used forms of thetheory.
• Local density approximation. In this approximation, the excess (over the ideal gas) freeenergy of the hard-sphere fluid is taken to depend only on the local density, so that
F exh [ρ(r)] =
∫dr ρ(r)fex(ρ(r)) (12)
wherefex is the excess free energy per molecule of the bulk hard-sphere fluid given bysome equation of state. This theory, while simple to use, does not account for even short-range correlations in the fluid, and is not able to describe the structures assumed by fluidsin narrow pores.• Tarazona’s weighted density approximation. In this theory, the excess hard-sphere free
energy is still written as a single integral over the density profile, but the integrated quantityis now a functional of some weighted density:
F exh [ρ(r)] =
∫dr ρ(r)fex[ρ(r)]. (13)
ρ(r) is a weighted average over the original density profile, with weighting functionschosen so that the theory gives a good description of the direct correlation functions ofthe bulk fluids. In Tarazona’s theory the weighted density is an implicit function of thelocal density; the weighting functions themselves are functions of the weighted density.Further details and applications of this theory to various systems can be found in theoriginal papers [348,349].

1586 L D Gelb et al
• Kierlik and Rosinberg’s weighted density approximation. This theory is formally similarto Tarazona’s. The four weighting functions used here are chosen such that this theoryexactly reproduces the Percus–Yevick result for the direct pair correlation function inthe uniform hard-sphere fluid. In addition, these weighting functions are independentof the density, so that the calculation of the weighted density from the local density isconceptually simpler [170]. This version of DFT has been found to be somewhat moreaccurate in very small pores than the Tarazona recipe, and has the added advantage that itis easily and unambiguously extended to adsorbed mixtures [161,171].
A number of papers [171, 349, 367] have extensively compared these and other theoriesfor confined systems. There have also been applications of other liquid-state theories toconfined fluids; integral equations in particular, have been found to be in excellent agreementwith simulation data [178, 179], and have been used to obtain solvation forces between largeparticles [139,141] and between large particles and surfaces [112].
2.9. Intermolecular potential functions
Calculated property behaviour for confined fluids is sensitive to the model used for the fluid–wall interaction. When the wall structure is included, the location of the various wall atomsmust be defined in the simulation; such locations may be taken from x-ray or neutron diffractiondata for the experimental material, or may be defined as part of the model in other cases. It iscommon to assume pairwise additivity of the intermolecular potentials; the total intermolecularinteraction of a given adsorbate moleculei with the walls is then obtained by summing the pairinteractions with individual wall atoms,
∑j usf (i, j), where the sum is over all wall atoms,
j . In some applications it is possible to treat the walls as structureless; in this case a fluid–wall intermolecular potential is obtained by replacing the sum over fluid–wall interactionsby a sum of integrals over wall atoms in a given plane. This is a reasonable approximationat higher temperatures and when the adsorbate molecule is large compared with the spacingbetween wall atoms. In graphitic carbons, for example, the C–C spacing between surfacecarbon atoms is only 1.42 Å , so that even a small molecule such as methane (diameter 3.81 Å)feels only a rather small corrugation in the fluid–solid interaction as it moves parallel to thesurface. In the case of a planar graphite surface the graphite layers are separated by a uniformspacing,1 = 3.35 Å. Assuming a LJ (12, 6) potential for the fluid–wall atom interaction andintegrating over the interactions with individual carbon atoms in each graphite plane, followedby summation over these planes, gives the ‘10, 4, 3 potential’ [340,341]
usf (z) = 2πρsεsf σ2sf 1
[2
5
(σsf
z
)10
−(σsf
z
)4
−(
σ 4sf
31(z + 0.611)3
)], (14)
wherez is the distance from the graphite surface,σsf andσsf are LJ potential parameters forthe solid–fluid interaction, andρs = 0.114 Å−3 is the atomic density of the solid. Here the‘10’ and ‘4’ terms represent the repulsive and attractive interactions of the fluid molecule withthe surface graphite plane, and the ‘3’ term results from the summation over the remaininglayers of the solid. For a slit pore, the fluid molecule will interact with both graphite walls, sothat the total fluid–solid interaction will be the sum of two terms of the type given by (14), i.e.usf (z) + usf (H − z).
If, in addition to integrating over each graphite plane, one integrates over all of the graphiteplanes in thez direction, the (9, 3) potential is obtained [341]:
usf (z) = 2
3πρsεsf σ
3sf
[2
15
(σsf
z
)9
−(σsf
z
)3]. (15)

Phase separation in confined systems 1587
The (9, 3) potential is, in general, a considerably poorer approximation to the true solid–fluid interaction than the (10, 4, 3) potential, and underestimates the depth of the potentialwell [341]. Analogous potentials for structureless walls have been developed for pores ofcylindrical geometry [294].
For low temperatures and for surfaces where the atomic spacing is not small thestructureless approximation will not be appropriate. The LJ intermolecular potential has oftenbeen used as an approximate two-body potential between atoms or simple molecules. However,even for molecularly simple systems both higher-order two-body dispersion and three-bodyinteractions have been shown to be significant, often contributing of the order 15% to theintermolecular potential energy [55, 188, 258, 261, 288]. Implicit in these commonly usedpotential functions for dispersion is the assumption that the polarizability is isotropic. This isnot, in general a good approximation for polyatomic molecules [121] or for carbon surfaces,since the polarizability of graphite is quite anisotropic [257]. Some of the implications of thishave been discussed by Nicholson [258] and Nicholson and Parsonage [260].
For many systems both direct electrostatic and induction forces between the adsorbatemolecule and the surface atoms will be significant [188, 258]. For zeolites and some othermaterials it is necessary to account for charges on the adsorbent species, and these can leadto strong direct electrostatic and also induction forces with adsorbate molecules. Quantummechanical calculations are helpful in determining the magnitude of partial charges to beassigned to various adsorbent atoms [384].
Although suitable functional forms for the solid–fluid intermolecular potential can beconstructed, it is generally necessary to fit some parameters to experimental data. Data forthe zero-coverage heat of adsorption and Henry’s law constants are especially valuable in thisregard, since they depend only on the adsorbate–adsorbent interaction, and are sensitive todetails of this potential.
It is usual to use expressions for the fluid–fluid potential that have been developed for thebulk fluid [121, 227]. However, it should be noted that the parameters in such pair potentialshave been optimized for bulk fluid properties, and such parametrizations include the effects ofthree-body forces. Adsorbed fluids, in contrast, are inhomogeneous, and additional kinds ofthree-body forces are present. For example, the ‘mediated’ three-body interaction involves twoadsorbate molecules and a wall atom [258]. Despite these reservations, three-body dispersioninteractions are unlikely to account for more than 5–10% of the total interaction, so that theuncertainties associated with these effects may not be too serious.
3. Capillary condensation
The gas–liquid transition has been extensively studied in pores, by experiment, DFT, andmolecular simulation. Such a transition occurs when the temperature is below the pore criticaltemperature, and the pore width is greater than a few times the adsorbate molecule diameter.Such a transition appears in the adsorption isotherm (amount adsorbed versus bulk gas pressure)as a sudden and large jump in the amount adsorbed at thecapillary condensation pressure. Ina porous material in which all the pores are of the same size and shape, with homogeneouswalls, such a condensation may be a sharp transition, signified by a sudden vertical jumpin adsorption. In real systems, this jump is often replaced by steeply rising adsorption, i.e.continuous filling. Such behaviour can result from a distribution of pore sizes and shapes, fromconnectivity among pores, and from heterogeneity of the walls; in the last case, clusters ofadsorbed molecules may form at strongly adsorbing centres prior to filling, and the filling maynot occur as a sharp transition. Capillary condensation is usually accompanied by hysteresis.That is, desorption starting from pores that are filled with a dense fluid phase occurs via a

1588 L D Gelb et al
different path than adsorption in the pressure range where condensation occurs. Provided thatthe temperature is above the triple-point temperature of the bulk adsorbate, such hysteresis isusually taken to be a signature of capillary condensation. (For temperatures below the triplepoint, hysteresis may be due to a fluid–solid or solid–solid transition.)
3.1. Experimental studies
Although many experimental studies of capillary condensation have been reported, relativelyfew of these have been for well-characterized materials with a narrow pore size distribution(PSD). In this section we consider several examples of investigations where well-characterizedmaterials have been used. Such materials have included Vycor and CPG, silica aerogels, andmore recently MCM-41. The porous glasses have networked pores of roughly cylindricalshape, with pore sizes from about 4.5 nm upwards; although these materials are amorphous,the PSD is narrowly peaked about the mean pore size. MCM-41 is an aluminosilicatematerial having straight, non-interconnected, cylindrical pores of nearly uniform diameter.This material can have pore sizes in the range 1.5–10 nm.
Results for the adsorption of xenon in two porous materials, Vycor glass (mean pore sizeabout 5 nm) and active carbon, are shown in figure 7 for a range of temperatures [42,46,265].In both cases we observe a low-pressure region of the adsorption isotherm that is reversible,followed by a sharp increase in adsorption for a narrow range of pressures, accompaniedby a hysteresis loop; the hysteresis region indicates capillary condensation. The capillarycondensation pressure increases with temperature, and the hysteresis loop becomes narrowerat the higher temperatures, finally disappearing at somehysteresis critical temperaturewhichlies below the bulk critical temperature. The hysteresis loops arise from metastability, and sodo not represent true equilibrium states; points on these irreversible sections of the adsorptionisotherm generally represent a system trapped in a local minimum in the free energy. Inprinciple, it should be possible to calculate the grand free energy for these ‘gas-like’ and‘liquid-like’ states in the pore, and so determine the point of true thermodyamic equilibrium,using equations (5) and (6). This is difficult in practice due to the difficulty in measuringU ,and does not appear to have been attempted using experimental data.
Although the broad features of the adsorption isotherms shown in figure 7 are similarfor glasses and carbons, there are marked differences in the behaviour of the hysteresis loopsin the two cases. In the case of the glasses these loops are more triangular in shape, andbecome smaller in both width and height asT is increased. For the active carbons these loopshave a parallelogram shape, and while becoming narrower do not vary much in height asT isincreased. These differences are believed to arise from differences in pore shape in the twocases, the glasses having roughly cylindrical pores and the carbons pores that are slit shaped.
By plotting the temperature versus the total number of moles adsorbed,nt , at the extremesof the hysteresis loop it is possible to construct ahysteresis phase diagram. Such a diagram issuperficially similar to what one expects for the true equilibrium ‘gas–liquid’ coexistence curvein the pore, but will differ from the latter since the ‘gas’ and ‘liquid’ points at a given temperatureare not in true thermodynamic equilibrium. Hysteresis vanishes above thehysteresis criticaltemperature, Tch. Such hysteresis phase diagrams are shown in figure 8 for CO2 in Vycor andfor Xe in active carbon. For CO2 in Vycor the adsorption isotherms are found to be reversiblefor temperatures below about 193–200 K. The pore triple-point temperature is believed tolie in this range, thus providing a lower limit to capillary condensation and hysteresis. Forsimple fluids such as CO2 and Xe in Vycor the pore triple-point temperature is believed to liebelow the bulk value (see section 4 and figure 8). For the Xe/active carbon system the twobranches of the hysteresis coexistence curve remain more widely separated than for CO2/Vycor

Phase separation in confined systems 1589
Figure 7. Adsorption isotherms for xenon, plotted as moles adsorbed per g of adsorbent versus logof fugacity of xenon in the bulk gas phase: (a) in Vycor glass, (b) in active carbon. From [46].
or Xe/Vycor until close toTch, reflecting the different shape of the hysteresis loops in theadsorption isotherms for the carbon and Vycor systems. Moreover, the top of the coexistencecurve is flatter for the Xe/active carbon system than for the Vycor system. This could arisefrom the more nearly two-dimensional nature of the pores in the case of the carbon. Thehysteresis phase diagram for Xe/Vycor is similar to that for CO2/Vycor, and when these areplotted in reduced units asT/Tch versusnt/ntch, wherentch is the value ofnt at the hysteresiscritical point, the two curves coincide within experimental error (figure 9). Comparison of thehysteresis phase diagram with the bulk coexistence curve can be made by converting the totalmoles adsorbed to the average density of fluid in the pores,ρ, as shown for CO2/Vycor infigure 10. The coexistence curve in the pore is seen to be narrowed and the hysteresis criticalpoint is depressed relative to that for the bulk. The considerably higher density for the ‘gas’phase in the pore relative to that for the bulk is due to the adsorption of dense layers of adsorbateon the pore walls, leading to a high value ofρ on averaging over the pore cross section. Thedensity of the ‘liquid’ phase is similar to that for the bulk liquid. The pore critical temperature

1590 L D Gelb et al
Figure 8. Hysteresis phase diagrams for (a) CO2 in Vycor, (b)Xe in active carbon. The triple-point temperature for the bulkfluids is shown as dashed lines labelledTt . From [46].
is expected to be lower than the bulk value, since from simple mean field theory [144]
Tc = c zεk
(16)
wherec is a constant,z is the mean coordination number for a molecule in the fluid andε is theinteraction energy with a nearest-neighbour molecule. For a confined adsorbate the averagecoordination number will be lower than for the bulk fluid, since many molecules will lie closeto a pore wall, leading to a lower critical temperature.
Thommes and Findenegg [354] have reported similar measurements for SF6 in CPGs.These materials have a narrower PSD than Vycor. The hysteresis phase diagrams are shownin figure 11 for two pore sizes. The shift in the critical temperature,1Tc = Tc − Tch, was0.480± 0.23 K for CPG having a mean pore width of 31 nm, and 0.92± 0.24 K for a 24 nmmean pore width. Similar measurements [64] for a CPG with a mean pore size of 7.7 nm gave1Tc = 15± 5 K. The data near the pore critical region can be represented by the usual powerlaw,
ρlp − ρgp = a(Tch − T )β (17)
whereρlp andρgp are the mean density in the pore for the liquid and gas phases, respectively.Fits to the data gave the critical exponent asβ = 0.45 for the 24 nm CPG andβ = 0.53 for

Phase separation in confined systems 1591
Figure 9. Comparison of hysteresis phase diagrams forCO2/Vycor and Xe/Vycor, in reduced units. From [46].
Figure 10. Comparison of hysteresis phase diagram forCO2/Vycor with phase diagram for bulk CO2. From [46].
Figure 11. Vapour–liquid coexistence curve for bulk sulfur hexafluoride, and hysteresis phasediagrams for SF6 in CPG of mean pore diameters 31 and 24 nm. From [354].
the 31 nm glass. These values are considerably larger than the Ising value of 0.33 for three-dimensional systems, and close to the classical value (β = 0.5). However, these differencesfrom the Ising value were not regarded as necessarily significant in view of the large errorbars on the density data. The shift in the hysteresis critical point was found to increase withdecreasing pore width, and to be consistent with a power law of the form
1Tc = bH−y (18)
with y ∼ 2.5. Similar measurements have been reported by Findenegget al [90] forcyclopentane, iso-pentane, perfluoropentane and SF6 in CPG with mean pore diameters of

1592 L D Gelb et al
7.7 and 24 nm. Measurements have been reported by other workers for Vycor and silica gelshaving fairly narrow PSDs (e.g., [213–215,273]).
Gross and Findenegg [123] have studied adsorption and capillary condensation of SF6 ina mesoporous silica material having straight, non-interconnected pores, prepared by a sol–gelsynthesis of silicates in lyotropic liquid crystal media [7]. This material is similar to MCM-41,but has larger ordered domains. Gross and Findenegg found a capillary phase diagram similarto that of figure 11. The lowering of the critical temperature,1Tc, was 20± 5 K, reflectingthe smaller average pore diameter of about 3 nm.
Thommeset al [355] have also shown that adsorption is reduced at temperatures very closeto, but slightly above, the bulk critical point. Starting at a temperature in the one phase regionabove the bulk critical point, and cooling along the critical isochore, the amount adsorbed ina CPG, at first increases asT is reduced, as expected. However, at a temperature about 1.5 KaboveTc the adsorption goes through a maximum and on further lowering the temperaturethe adsorption is much reduced. There have been several attempts to explain thiscriticaldepletion effectusing molecular simulation [217,387] and theoretical methods [216,217] forthe independent slit pore model. Although an initial study based on lattice gas theory [216] didseem to show the critical depletion effect, recent molecular simulation studies [217,387] andDFT calculations [217] show that there is no critical depletion effect for the independent slitpore model; the apparent depletion found in the lattice gas results was an artifact of that simpletheory. Thus this effect remains to be explained. Apparently, it arises from effects omitted inthis simple model, possibly pore geometry, connectivity or some form of heterogeneity.
The mesoporous glasses used in these studies have a networked pore structure thatmakes a molecular analysis of the capillary condensation results difficult (see later in thissection and section 5). Mesoporous MCM-41, an aluminosilicate molecular sieve withstraight, parallel cylindrical pores and with negligible pore interconnections, is a moresuitable material for investigating capillary condensation. The pore diameter can be tailoredwithin the range 2–10 nm. Recently, experimental studies of capillary condensation andhysteresis for simple adsorbates in these materials have been reported by several workers[37–39, 187, 206, 243, 246, 309, 310]. Some typical results are shown in figure 12 for argonin MCM-41 samples having two different average pore diameters. At the lower temperaturesthe isotherms show the sharp rise characteristic of capillary condensation, accompanied byhysteresis. As the temperature is raised the hystersis loop shrinks and vanishes at the hysteresiscritical temperatureTch. For these systemsTch ≈ 62 K for the smaller mean pore radius ofrp = 1.2 nm, and≈100 K for rp = 2.1 nm.
The hysteresis critical temperatureTch, can be distinguished from thepore criticaltemperature,Tcp, defined as the temperature where the sharp jump in adsorption due to capillarycondensation just disappears. While some authors have implicitly assumed that the hysteresiscritical temperature coincides with the pore critical temperature, there is evidence that thesetwo temperatures are different, withTcp > Tch. This is plausible on theoretical grounds, sinceit is known that for straight unconnected pores, as in MCM-41, the hysteresis results from thesystem being trapped in a local minimum in the free energy. On adsorption, for example, thislocal free-energy minimum would correspond to the gas-like state, and the system may remainin this state at pressures somewhat above the true thermodynamic transition pressure. However,we might expect that as the temperature is raised this local minimum well in the free energyeither disappears or becomes too small to hold the system in the gas-like state (fluctuationsin such small systems can be large). In this situation, hysteresis would disappear somewhatbelow the pore critical temperature. Morishige and Shikimi [246] have estimatedTcp for argonin siliceous MCM-41 by measuring how the slope of the adsorption isotherm in the capillarycondensation region varies with temperature. In a perfectly monodisperse material, in which

Phase separation in confined systems 1593
Figure 12. Adsorption isotherms for argon in siliceous MCM-41 at various temperatures for twomean pore radii: (a) rp = 1.2 nm, (b) 2.1 nm. Adsorption points are shown as open circles,desorption as filled circles. In (a) the isotherms at the two lower temperatures, 57.7 and 72.2 K,are plotted against reduced pressure, while the others are plotted versus reduced fugacity. Thetriple-point temperature of bulk argon is 83.8 K. From [246].
all pores are of the same diameter, surface structure and composition, capillary condensationshould result in a sharp vertical jump inV , the adsorption; thus, the slopes(∂ lnP/∂V )Tor (∂ ln f/∂V )T should be zero. By plotting the experimentally determined values of theslope(∂ lnP/∂V )T or (∂ ln f/∂V )T against temperature [253] it is possible to make a roughestimate ofTcp, as shown in figure 13 for argon. In the temperature range where capillarycondensation occurs these derivatives are positive but small; their non-zero values arise fromthe distribution of pore sizes in the real material. For temperatures up to about to about 98 Kthe derivative increases slowly, but above this temperature, it increases more rapidly withT .Such a rapid increase is expected whenT is above the pore critical temperature. Morishige andShikimi interpret the intersection of these two straight line regions as being the pore criticaltemperature,Tcp ' 98 K. If this interpretation is correct, thenTcp is significantly larger thanTch, which for this system is approximately 62 K. Both of these temperatures are substantiallybelow the bulk fluid critical temperature of argon, which is 150.7 K, as expected for such

1594 L D Gelb et al
Figure 13. Effect of temperature on the inverse slope of the adsorption isotherm at the point ofcapillary condensation, for argon in siliceous MCM-41 with a mean pore radius of 1.2 nm. Theinverse slope at higher pressures is estimated on the basis of both(∂ logP/∂V )T and(∂ logf/∂V )T .From [246].
Figure 14. Shifts in the hysteresis and pore critical temperatures,(Tc−Tch)/Tc and(Tc−Tcp)/Tc,vs reduced inverse pore radius, for various adsorbates in mesopores: Ar (◦), N2 (4), O2 (�),C2H4 (5), CO2 (↓) and Xe (∗). Open and closed points representTch andTcp , respectively. Thefour open points at smaller values ofd/rp , which lie well below the line for the hysteresis criticaltemperature of MCM-41, are results forTch for networked mesoporous adsorbents, Vycor [46] andsilica gel [214]. Lines are guides for the eye. From [246].
small pores. Morishige and Shikimi have estimated pore critical temperatures for other gases,including N2, O2, CO2 and C2H4, in this material, and find thatTcp > Tch in each case, thedifference being of the order 40–60%.
A dimensionless plot of the shift in the both the hysteresis and pore critical temperaturesagainst the inverse pore radius is shown in figure 14 for several adsorbates. According tosimple theories of adsorption [83] such a plot should be linear, and the results agree with thisprediction within experimental error. The results for(Tc − Tch)/Tc versusd/rp, wheredis the diameter of the adsorbate molecule, for Ar, N2, O2 and C2H4 fall on a single straightline passing through the origin; the data for CO2 and for C2H4 at rp = 1.4 nm deviate fromthis relationship. The shifts in the pore critical temperature are smaller than those for thehysteresis critical temperature. Also included in figure 14 are four points for(Tc − Tch)/Tc
Phase separation in confined systems 1595
versusd/rp for the networked porous materials Vycor and silica gel. The shift in hysteresiscritical temperature for these materials is considerably smaller than for the straight cylindricalpores of MCM-41. Such a result might be expected, since in MCM-41 as the pore criticalpoint is approached the molecular correlation length can grow only to the pore diameter in theradial direction normal to the pore axis. In networked materials, on the other hand, we expectthe correlation length to be able to grow to larger values, on average, so that the depression ofthe pore critical point would be less.
A few studies have been reported for silica aerogels. In particular, Chan and colleagues[389,390] have studied the liquid–vapour transition for4He and for nitrogen in a silica aerogelhaving a porosity of 95%, using heat capacity measurements in the case of4He and lightscattering in the case of N2. In spite of the disordered nature of the void spaces, sharp transitionswere seen, with a pore critical temperature that is somewhat below the bulk value. They foundthat the coexistence curves were much narrower than those for the bulk fluid. They were ableto determine the critical exponent of equation (16), and found it to beβ = 0.280± 0.05 for4He andβ = 0.350± 0.05 for nitrogen. These values are consistent with that found for bulkfluids (β = 0.33), but not with the random-field Ising model [66], for which a value ofβ closeto zero is expected.
In principle, carbon nanotubes also offer an attractive material for fundamental studiesof capillary condensation, since the pores are straight, non-interconnected cylinders withmonodisperse pore size. So far adsorption studies have been limited due to several problems,including difficulty in obtaining the nanotubes in a sufficiently pure form and strong adsorptionon the outer surfaces [102].
3.2. Theoretical and simulation studies: simple pore geometries
There have been many studies of fluids confined in pores of simple geometry over the lastdecade. Here we define ‘simple geometry’ to mean pores of some simple and regularshape, usually slit-like or cylindrical, although some studies have been reported for poresof spherical shape. Furthermore, our definition implies that the surfaces are homogeneous(fluid interactions with the wall are the same for different regions of the wall), the pores arenot interconnected, and are independent in the sense that the adsorbate molecules in a givenpore are unaware of the existence of those in neighbouring pores; the pores all have the samegeometry, although they can differ in pore width.
3.2.1. Macroscopic thermodynamic treatment.For sufficiently large pores it is possible touse a macroscopic treatment of capillary condensation. For such pores, oscillations in thedensity profile due to the fluid–wall forces can be ignored, and the grand free energy can bewritten as the sum of a bulk and a surface term,� = −PV + 2γA, as follows from integrationof equation (3) using Euler’s theorem (here we have implicitly assumed a slit geometry, andthe areaA is that of one of the pore walls). By writing equations for the grand free energy ofthe confined gas-like and liquid-like phases, assuming that the liquid wets the walls completely(contact angle is zero), and equating the grand free energies it is possible to derive an equationfor the pressureP at which capillary condensation occurs [82,83,122]:
ln
(P
P0
)= − 2γlg
RTρlH(19)
whereP0 is the saturated vapour pressure of the bulk fluid,γlg is the gas–liquid surfacetension for the bulk fluid,R is the gas constant, andρl is the density of the bulk liquid. Thisequation, called the Kelvin equation after its originator, should be valid for large pores and

1596 L D Gelb et al
for temperatures well below the pore critical temperature. Its derivation is based on severalassumptions: density oscillations due to the walls can be neglected, the system is large enoughthat a surface tension can be defined [357], the gas phase can be treated as an ideal gas, theliquid phase is incompressible, and the surface tension can be taken to be the value for the bulkfluid at this temperature.
Because the Kelvin equation fails to account for the strong adsorbed layers on the porewalls, it is common to modify equation (16) by replacing the true pore widthH by somemodified pore width which accounts for the adsorbed layers that form prior to capillarycondensation. Usually this is done by replacingH byH − 2t , wheret is the thickness of theadsorbed layer on the wall. A systematic treatment of the influence of wetting on corrections tothe Kelvin equation was carried out by Derjaguin [65]. He showed thatH should be replacedbyH −2t only when the solid–fluid forces are exponential or of finite range; when dispersionforces are present and wetting films developH should be replaced byH−3t ; see the discussionby [81, 83]. In practice, this thickness is usually estimated from an adsorption isotherm (or‘ t-curve’) for the adsorbate fluid on a non-porous surface of the same chemical type as theporous material. In addition, the Kelvin equation can be modified to account for nonidealityof the gas phase, liquid compressibility, and non-zero contact angle.
An estimate of the range of applicability of equation (18) can be obtained by determiningthe capillary condensation pressure for suitable model fluid/pore systems, using either DFTor molecular simulation, and comparing the result with the prediction of the Kelvin equationor its modified form. Such comparisons for simple models of nitrogen in carbon slit poresindicate that the Kelvin equation becomes inaccurate for pore sizes below about 7.5 nm [378].This estimated lower bound to the pore width below which the Kelvin equation breaks downwill depend on the temperature and the material. Nevertheless, the figure of 7.5 nm is ingood general agreement with an estimate of Fisher and Israelachvili [93], which was based onexperimental observations of cyclohexane between mica surfaces in the surface force apparatus.They concluded that the Kelvin equation broke down for separationsH below 8.0 nm (16molecular diameters). These estimates are for cases where the liquid completely wets thesurface. When the contact is non-zero (partial wetting) the Kelvin equation may remainaccurate to somewhat smaller pore widths [349]. The Kelvin equation, and its modifiedforms, overestimates the capillary condensation pressure for a given pore size; conversely,it underestimates the pore width corresponding to a given capillary condensation pressure.These errors become large for small pores, as shown in figure 15 [197]. The modified Kelvinequation is seen to be in significant error even for pores of 4–5 nm. For pores ofH = 2 nm, useof the modified Kelvin equation to predict the pore size from a known capillary condensationpressure is in error by a factor of about 2 for these model carbons. Errors of this magnitudehave also been shown to occur when this equation is applied to realistic models of poroussilica glasses [110]. The non-local form of DFT is in very good agreement with the simulationresults shown in figure 15. Local DFT (not shown) gives capillary condensation pressures thatare somewhat too low [195]. Comparisons of the modified Kelvin equation, and other semi-empirical approaches, with molecular simulation have also been made for straight cylindricalpores [197]. The results are similar to those shown in figure 15.
3.2.2. Microscopic treatment: theory and molecular simulation for pure fluids.Work upto 1990 has been reviewed by Evans [79], and most of what follows focuses on more recentwork. Such studies have often included investigations on heats of adsorption, structure of theadsorbent, and in some cases solvation forces, as well as capillary condensation. They differin (a) the method used, (b) the pore geometry (primarily slit or cylinder), and (c) the use of astructured versus a structureless wall. The methods used have included DFT, lattice gas model

Phase separation in confined systems 1597
Figure 15. Pore filling pressures versus pore width from the Kelvin and modified Kelvin equations,the Horvath–Kawazoe equation (HK), DFT and molecular simulation (points) for a simple modelof nitrogen adsorption in a slit carbon pore at 77 K. HereH is defined as the distance betweenthe planes passing through the centres of the carbon atoms making up the first layer of each wall.The DFT and simulation results show capillary condensation for the larger pores, with continuousfilling at some smaller pore widths. The sharp increase in the curve forH <∼ 7 is due to themolecular sieving effect. From [197].
calculations [44, 230], integral equation theory [140, 178, 179], and molecular simulation.These different methods have been found to give similar results for capillary condensation.
In the case of pores of slit geometry with the walls lying in thexy plane, the molecularcorrelation length,ξ , can grow to infinity in thex andy directions, although its growth islimited toH in thez direction normal to the walls. True phase transitions are possible in sucha geometry, and capillary criticality will correspond to the two-dimensional Ising universalityclass [79]. Fisher and Nakanishi [94] used scaling arguments to show that for large pores thedecrease in the critical temperature in the pore should obey
1Tc = (Tc − Tcp)/Tc ∝ H−1/ν (largeH) (20)
whereν is the critical exponent for the correlation length, and takes the value 0.63 for bulkthree-dimensional fluids. For small pores [79]
1Tc ∝ H−1 (smallH). (21)
Since the criticality is of the two-dimensional Ising class, we expect the jump in adsorption,0, due to capillary condensation to vanish as0 ∝ (Tcp − T )β , with β = 1
8 rather thanthe bulk three-dimensional value ofβ = 0.32. Even for very strongly attractive adsorbents,such as carbon, molecular simulations [160] suggest thatβ is very close to the unperturbedtwo-dimensional value of18.
Numerous studies of adsorption behaviour and capillary condensation in slit pores havebeen reported [10,11,58,79,83,162,195–197,230,254,259,283,311,312,325,328,376,378].

1598 L D Gelb et al
Calculations of adsorption isotherms for a given pore size bear a qualitative resemblance tothose found experimentally. For mesopores and sub-critical temperatures, as the pressure isincreased layers of adsorbate molecules first form on the walls of the pores, leading to aninitially rapid increase in adsorption. At higher pressures there is a sudden, discontinuousjump in adsorption, corresponding to the capillary condensation transition [378]. Followingthe transition, the pores are filled with a nearly incompressible liquid-like phase, and littlefurther increase in adsorption is observed on further increasing the pressure. Starting fromsuch filled pores and decreasing the pressure, capillary evaporation is delayed and occursat a lower pressure than that observed for condensation. Such hysteresis effects are due tometastability. The system becomes trapped in a local minimum in the free energy, and remainsin the metastable state until the pressure has changed sufficiently that the local minimumdisappears or becomes small enough that a small fluctuation in the density is sufficient for thesystem to change to the state representing a deeper minimum in the free energy [294]. If suchcalculations are repeated at higher temperatures the capillary condensation moves to higherpressures and the hysteresis loops decrease in size, until they eventually disappear [83, 84].This adsorption behaviour is similar to that shown by the experimental systems in figure 7,except that since the pores are monodisperse in these model systems the jumps in adsorptioncorresponding to capillary condensation are sharp discontinuities. In addition, the shape ofthe hysteresis loops in the model calculations are somewhat different to those observed inthe experiments, being usually more rectangular in form. In the simulations it is possible todetermine the true thermodynamic transition condition by using equations (4) and (5), and theintegration scheme described in section 2.1 [290, 291]. In general, the true phase transitionpressure lies between the adsorption and desorption curves.
For a given adsorbate/adsorbent system at a fixed subcritical temperature, the capillarycondensation pressure is reduced as the pore widthH gets smaller. This is illustrated for asimple model of nitrogen in a graphitic carbon having slit pores in figure 16. The capillarycritical temperature also decreases as the pore width gets smaller. For sufficiently narrowpores the sharp capillary condensation transition no longer occurs, and is replaced by a steepbut continuous filling. In the example shown in figure 16 this occurs for a pore widthH ∗
between 3.75 and 4.00. This phenomenon is due to the fact that the pore critical temperaturelies somewhat below 77 K for the pore of width 3.75, but is above 77 K forH ∗ = 4.0. Thus,the pore width below which continuous filling occurs will depend on the temperature.
From figure 16 it can be noted that the capillary condensation pressure is very sensitive tothe pore width. This observation is the basis of commonly used methods for measurement ofthe PSD for porous materials [122]. The usual procedure is to assume the pore structure of thematerial can be represented as a collection of non-interconnected pores all of which have thesame geometry (e.g. slit or cylinder) and surface structure, but which can differ in pore widthH , so that the total adsorption0 can be represented by
0 =∫ρ(P,H)f (H)dH (22)
whereρ(P,H) is the mean density of fluid in the pore of widthH at pressureP , f (H) isthe PSD, and the integration is carried out over all possible values of the pore width. In earlyapproaches to determination of the PSD, the Kelvin equation or a modified form of it was usedto determine the relation between capillary condensation pressure and pore size [122]. In suchmethods the pore widthH in equation (16) is replaced by(H −nt), wheret is the thickness ofthe adsorbed film on the wall andn is 2 or 3, depending on the particular method used [81]. Thefilm thickness is usually estimated empirically from an adsorption isotherm for a nonporoussample of the material of interest. Such methods are known to give pore sizes that are too smallfor pore widths below 7–10 nm (see figure 15), and more accurate theories for the prediction of

Phase separation in confined systems 1599
Figure 16. Adsorption isotherms for a LJ model of nitrogen in slit-shaped graphitic carbon poreswith 10, 4, 3 walls at 77 K, from the Tarazona form of DFT. Reading from left to right, the porewidths areH ∗ = H/σ =3.75, 4.0, 4.25, 4.5, 5, 6, 8, 14 and 40, whereσ is the LJ diameter of theN2 molecule. The inset shows the characteristic solid–fluid potential profile for a mesoporous slit.From [195].
ρ(P,H) have been proposed. Thus, Seatonet al [331] used local DFT to predict this quantity,while later workers have used either non-local DFT [157,195–197,255,266–269,301,311,320]or molecular simulation. An example of the application of these methods to determine the PSDof an activated carbon, CXV, is shown in figure 17; the pores are assumed to be slit shaped.The use of DFT results in a great improvement in the accuracy of prediction of the adsorptionρ(P,H) for various pore sizes in equation (21). Moreover, DFT is accurate for pores ofany size, in contrast to the Kelvin-based and other semi-empirical methods, and providesa good prediction of the entire isotherm (not just the condensation pressure). The principalproblems remaining in such PSD determinations result from the oversimplification representedby equation (21). In addition, it is usually necessary to use some assumed mathematical formfor the PSD given byf (H) in (21); however, this is not believed to be a major problem providedthat the function assumed for this is sufficiently flexible (e.g. it allows for multiple peaks ofwidely varying width).
Using DFT or molecular simulation, it is possible to explore the effects of system variableson the adsorption behaviour in a systematic manner. For example, Balbuena and Gubbins[10–12] have used the Tarazona form of DFT to study the effects of varying temperature,pressure, pore width, and the LJ intermolecular force ratiosσsf /σff andεsf /εff , wheresfandff refer to solid–fluid and fluid–fluid interactions, respectively, for adsorption into slitpores. They determine the ranges of these variables for which the adsorption behaviour isfound to be in each of the classes of the IUPAC classification shown in figure 18. Classes IVand V are of interest here, since the hysteresis loops are a signature of capillary condensation.The step-wise adsorption shown in class VI indicates adsorption by layers; that is, adsorptionproceeds by completing a given layer before starting the next layer. Such layering transitionsare discussed in section 4.
An example of the results of this classification of adsorption behaviour is shown infigure 19, which is for the case when the ratioσsf /σff = 0.9462; this ratio correspondsto the adsorption of methane on graphite, for whichεsf /εff = 0.435. In this figure a class VII

1600 L D Gelb et al
Figure 17. PSD for an activated carbon, CXV, based on inversion of equation (22) using nitrogenadsorption data at 77 K over the reduced pressure rangeP/P0 = 0 to 1: solid curve, Tarazona non-local DFT; dashed curve, local DFT; dotted curve, Kelvin equation; dash-dotted curve, modifiedKelvin equation. From [195].
Figure 18. The six types of adsorption isothermaccording to the 1985 IUPAC classification. From[333].

Phase separation in confined systems 1601
Figure 19. Classification of adsorption isotherms for slit pores forσsf /σff = 0.9462: (a) T ∗ =kT /ε = 0.5; (b) T ∗ = 0.8; (c) T ∗ = 1.4, from DFT. The lines in the figure are approximateand refer to qualitative changes in the adsorption behaviour. Subscript f means ‘finite’, i.e. theadsorption remains finite asP → P0 (T is below the wetting temperature). Superscript sc means‘supercritical’ (T is above the pore critical temperature). From [11].
has been added to the empirical classification of figure 18; class VII is similar to V, but becausethe solid–fluid interaction is very weak compared with the fluid–fluid one, and the temperatureis relatively high, condensation does not occur untilP/P0 > 1, i.e., the pressure is greater thanthe bulk vapour pressure, a phenomenon referred to ascapillary evaporation. Subscript f onthe classes in figure 19 indicates that the adsorption remains finite atP/P0 = 1, in contrast toadsorption on single surfaces above the wetting temperature. As with the adsorption results,it is possible to classify capillary condensation (and layering transition) behaviour in terms ofthese independent variables [10, 11]. An example of these results is shown in figure 20. Asimilar classification of adsorption and capillary condensation behaviour has been made forpores of cylindrical geometry [12].
Turning from slit to cylindrical pores, we can recognize two main differences. First,

1602 L D Gelb et al
Figure 20. Phase coexistence envelopes for capillary condensation (cc) and first (first LT)and second (second LT) layering transitions for potential parameters corresponding to themethane/carbon system from DFT. Results for pore widthsH ∗ = 2.5, 5.0 and 10.0 are shown.Dashed curves are a rough estimate of the pore critical region. The abscissa is the reduced densityin the pore,ρ∗‘p = ρ′pσ 3
ff , whereρ′p is the number density excluding the dead space (thickness0.7σff ) near the walls. From [11].
because the fluid is now confined in two dimensions rather than one, the confinement effectsare greater. Thus, we observe capillary condensation at lower pressures, and the lowering ofthe critical temperature is greater than for slit pores of the same width. Second, for narrowcylindrical pores the system approaches a one-dimensional system, and so cannot exhibit truephase transitions at temperatures above 0 K. Any first-order phase transition in a cylinder mustbe rounded by finite-size effects [300]. A rough estimate for the effect of rounding on thechemical potential shows [78, 79] that the change inµ scales as exp[−(R/σ)2], whereR isthe radius of the cylinder andσ is the diameter of the confined fluid molecule. Thus, even for(R/σ) = 2.5 the rounding is small, and the capillary condensation transition appears sharp inboth simulations and DFT calculations [83, 291]. A second consequence of these finite-sizeeffects is that, because of the finite surface area of the gas–liquid interface in a cylinder, wedo not observe single domains of ‘gas’ and ‘liquid’ phase in the cylinder, but rather a series ofalternating domains of each phase [300]. The average length of these domains depends on thespecific system, the pore diameter and the temperature, becoming shorter for small diameterpores and for temperatures approaching the pore critical value. Such alternating domains havebeen observed in simulations of long cylindrical pores for both capillary condensation [138]and liquid–liquid equilibria [106]. Typical results for the average domain length are shown infigure 43; it is seen that, except near the pore critical temperature, the average domain lengthis quite large, often thousands of nanometres or more, so that it is reasonable to talk of thesedomains as microphases.

Phase separation in confined systems 1603
Numerous studies of capillary condensation have been reported for straight cylindricalpores [12, 14, 83, 137, 138, 283, 290, 291, 293, 294, 302, 376]. For a given pore diameter theintermolecular potential experienced by an adsorbate molecule due to the walls has a deeperwell than for a slit of the same width, so that capillary condensation occurs at lower pressures.In addition, the mean density of adsorbate in the filled pore is generally lower for cylinders, aresult of packing considerations [12]. Of particular interest is the approach to one-dimensionalbehaviour in narrow cylinders [291,302].
Pores of other regular geometries have been studied, including spheres [118, 391] as anapproximate model of some zeolite cavities, and pores of square [33] and triangular [35]cross-section.
The hysteresis associated with capillary condensation has been studied by several methods.Early studies were carried out by mean field DFT and GCMC simulations [83,84,294] for bothslit and cylindrical pores. As the chemical potential (bulk gas pressure) is gradually increasedthe adsorbed phase remains in the gas-like state for some distance beyond the point of truethermodynamic transition. This is because the system remains in a local minimum in the grandfree energy that corresponds to the gas-like state; only when the barrier separating this localminimum from the global one becomes very small does the system exhibit condensation [294].A similar phenomenon occurs on desorption, with the system persisting in the liquid state atchemical potentials (pressures) below the true equilibrium value. Such metastability is similarto that found in bulk liquids in the gas–liquid coexistence region, but is more pronouncedin confined systems. However, neither DFT nor GCMC calculations allow the presenceof both gas-like and liquid phases simultaneously, so that it is not possible to observe theinfluence of a meniscus. This problem is not present in molecular dynamics or canonicalMonte Carlo, where the phase change can be effected by changing the overall density of theconfined fluid. Molecular dynamics calculations [138] have been used to observe the interfacebetween the coexisting phases, and its influence on hysteresis, for cylindrical pores of infinitelength. Calculations for pores having open ends, using both a lattice gas model and canonicalMonte Carlo simulations, allow the formation and disappearance of menisci at the open endof the pore, and have shown [230,283] that this effect has a large influence on the width of thehysteresis loops. Open-ended tubes of finite length also result in end effects (the net adsorbate-wall interaction is reduced near the tube ends) that can significantly reduce the width of thehysteresis loop [224]. Additional effects that influence hysteresis, due to pore networking andtortuosity, are discussed in section 3.2.3.
For the most part, the studies described above have been of a general nature. However,several attempts have been made to model capillary condensation in simple geometries forspecific systems, and in some cases to make direct comparison with experiment. Examplesinclude investigations of krypton [254], nitrogen [259], methane [162,312] and water [362] ingraphitic carbons; argon and nitrogen in MCM-41 [222,254,311]; argon in an alumina-pillaredclay [56]; and argon and nitrogen in carbon buckytubes [224]. Using a lattice gas model, Coleet al [54] have studied condensation of4He in carbon nanotube bundles.
3.2.3. Microscopic treatment: theory and molecular simulation for mixtures.Several studieshave been made for simple mixtures in cylindrical [135, 136, 347] and slit [57, 58, 161, 346]pores. The total adsorption isotherms display capillary condensation at pressures that areusually below the bulk vapour pressure for the mixture, as for pure fluids. The essential newfeature for mixtures is the change in composition due to confinement. Results for a modelof an argon(1)/krypton(2) mixture in a cylindrical carbon dioxide pore [136] are shown infigure 21. The LJ model was used for the fluid–fluid and fluid–solid interactions, and thesolid was treated as a structureless continuum. The results forR∗ = ∞ show the gas–liquid

1604 L D Gelb et al
Figure 21. Mole fractions for coexisting gas (y1) and liquid(x1) phases for a LJ model of argon(1)/krypton(2) mixturesin a cylindrical CO2 pore. The upper figure is for a poreof radiusR∗ = R/σ1 = 5 at T ∗ = kT /ε1 = 0.7, andthe lower one is forR∗ = 2.5, T ∗ = 0.6. The horizontalaxis is the mole fraction of argon in the bulk gas phase,yb1,that coexists with the pore. The dotted (R∗ = ∞, bulksystem) and dashed curves denote local mean field results,while the filled circles and the solid lines drawn through themare molecular dynamics simulation results for the pore. Molefractions are averaged over the pore width; in the case of thebulk system,x1 andy1 denotexb1 andyb1. From [136].
coexistence for the bulk mixture, as predicted by the local form of DFT. The confined mixtureshows a marked increase in the krypton mole fraction for the gas phase, a result of the strongerattraction of krypton to the walls. This effect is much smaller for the confined liquid phase,so that the difference in composition for the confined gas and liquid phases is much smallerthan for the corresponding bulk phases. Agreement between the local DFT and molecularsimulation results is only qualitative, since the local theory fails to describe the strong densityoscillations of the adsorbate near the walls.
The change in composition of the confined phase is often expressed as a selectivity,S,defined by
S2 = xp2/xpl
yb2/ybl(23)
wherexpi is the average mole fraction of componenti in the pore andybi is the correspondingmole fraction ofi in the coexisting bulk phase. Results for the selectivity for ethane for a LJmodel mixture of methane(1) and ethane(2) in a slit carbon pore with (10, 4, 3) walls are shownin figure 22. Calculations were based on an extension to mixtures [347] of the Tarazona formof DFT. For the larger pore sizes shown the temperature chosen lies above the pore criticaltemperature,Tcp, but is belowTcp for the smaller pore widths. The vertical jump inS at

Phase separation in confined systems 1605
Figure 22. Selectivity for ethane ver-sus pore width, H ∗ = H/σ11, formethane(1)/ethane(2) mixtures in a slit carbonpore, atT ∗ = kT /ε11 = 1.5, yb1 = 0.5.Results are shown for two pressures,P ∗ =Pσ 3
11/ε11 = 0.1 (solid curve) and 0.2 (dashedcurve). Vertical jumps are due to capillary con-densation. From [346].
Figure 23. Selectivity isotherms for the samesystem as in figure 22, forH ∗ = 8 andyb1 = 0.5, for a range of temperatures. From[346].
H = Hcc indicates the capillary condensation transition. ForH < Hcc the pore is filled with aliquid-like phase, while forH > Hcc it is filled with a gas-like phase. The strong oscillationsin S, asH is varied when the pore is filled with liquid results from the layered structure of theadsorbed phase; asH is decreased sudden changes in the average density occur at particularpore widths where a whole layer of molecules is squeezed out of the pore.
The effects of temperature and pressure on the selectivity for this system are shown infigure 23. The vertical jumps in selectivity at the lower temperature results from capillarycondensation. As a result of these and similar calculations, Tan and Gubbins [346] haveproposed the classification of selectivity isotherms shown in figure 24. Class I is found attemperatures well aboveTcp. The increase inS at low pressure results from the strongerfluid–fluid attraction between ethane molecules relative to methane. Class II corresponds totemperatures slightly aboveTcp. A second maximum inS appears as the result of a buildup ofmultiple adsorbed layers, a precursor to capillary condensation. Class III occurs at temperaturessomewhat belowTcp, and exhibits capillary condensation. For temperatures well belowTcp,layering transitions can occur in addition to capillary condensation, leading to selectivityisotherms of class IV.
Cracknell et al [57] have also carried out GCMC simulations of the adsorption of
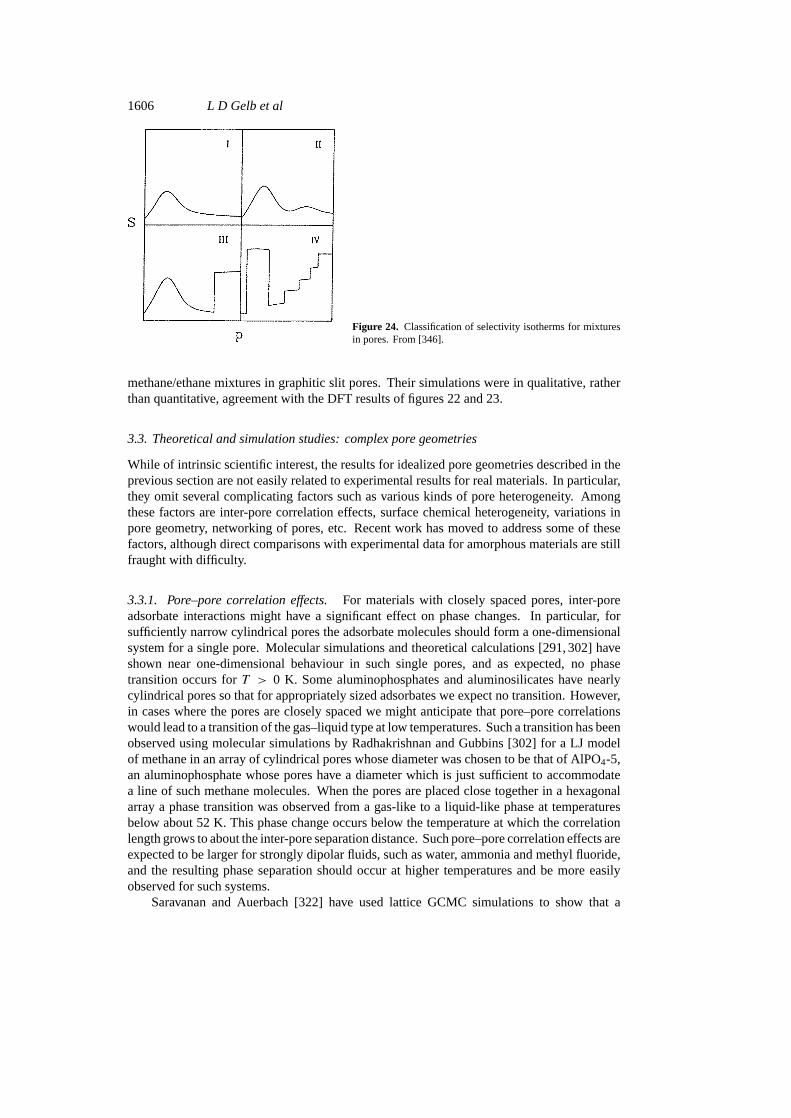
1606 L D Gelb et al
Figure 24. Classification of selectivity isotherms for mixturesin pores. From [346].
methane/ethane mixtures in graphitic slit pores. Their simulations were in qualitative, ratherthan quantitative, agreement with the DFT results of figures 22 and 23.
3.3. Theoretical and simulation studies: complex pore geometries
While of intrinsic scientific interest, the results for idealized pore geometries described in theprevious section are not easily related to experimental results for real materials. In particular,they omit several complicating factors such as various kinds of pore heterogeneity. Amongthese factors are inter-pore correlation effects, surface chemical heterogeneity, variations inpore geometry, networking of pores, etc. Recent work has moved to address some of thesefactors, although direct comparisons with experimental data for amorphous materials are stillfraught with difficulty.
3.3.1. Pore–pore correlation effects.For materials with closely spaced pores, inter-poreadsorbate interactions might have a significant effect on phase changes. In particular, forsufficiently narrow cylindrical pores the adsorbate molecules should form a one-dimensionalsystem for a single pore. Molecular simulations and theoretical calculations [291, 302] haveshown near one-dimensional behaviour in such single pores, and as expected, no phasetransition occurs forT > 0 K. Some aluminophosphates and aluminosilicates have nearlycylindrical pores so that for appropriately sized adsorbates we expect no transition. However,in cases where the pores are closely spaced we might anticipate that pore–pore correlationswould lead to a transition of the gas–liquid type at low temperatures. Such a transition has beenobserved using molecular simulations by Radhakrishnan and Gubbins [302] for a LJ modelof methane in an array of cylindrical pores whose diameter was chosen to be that of AlPO4-5,an aluminophosphate whose pores have a diameter which is just sufficient to accommodatea line of such methane molecules. When the pores are placed close together in a hexagonalarray a phase transition was observed from a gas-like to a liquid-like phase at temperaturesbelow about 52 K. This phase change occurs below the temperature at which the correlationlength grows to about the inter-pore separation distance. Such pore–pore correlation effects areexpected to be larger for strongly dipolar fluids, such as water, ammonia and methyl fluoride,and the resulting phase separation should occur at higher temperatures and be more easilyobserved for such systems.
Saravanan and Auerbach [322] have used lattice GCMC simulations to show that a
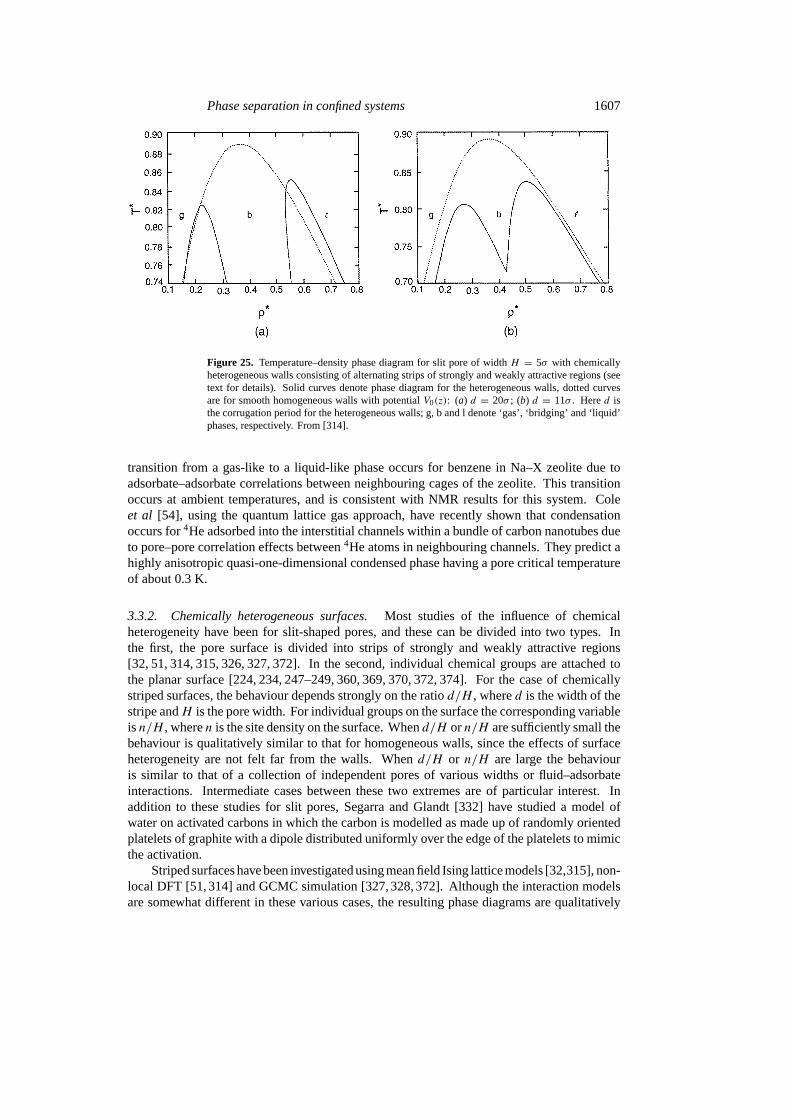
Phase separation in confined systems 1607
Figure 25. Temperature–density phase diagram for slit pore of widthH = 5σ with chemicallyheterogeneous walls consisting of alternating strips of strongly and weakly attractive regions (seetext for details). Solid curves denote phase diagram for the heterogeneous walls, dotted curvesare for smooth homogeneous walls with potentialV0(z): (a) d = 20σ ; (b) d = 11σ . Hered isthe corrugation period for the heterogeneous walls; g, b and l denote ‘gas’, ‘bridging’ and ‘liquid’phases, respectively. From [314].
transition from a gas-like to a liquid-like phase occurs for benzene in Na–X zeolite due toadsorbate–adsorbate correlations between neighbouring cages of the zeolite. This transitionoccurs at ambient temperatures, and is consistent with NMR results for this system. Coleet al [54], using the quantum lattice gas approach, have recently shown that condensationoccurs for4He adsorbed into the interstitial channels within a bundle of carbon nanotubes dueto pore–pore correlation effects between4He atoms in neighbouring channels. They predict ahighly anisotropic quasi-one-dimensional condensed phase having a pore critical temperatureof about 0.3 K.
3.3.2. Chemically heterogeneous surfaces.Most studies of the influence of chemicalheterogeneity have been for slit-shaped pores, and these can be divided into two types. Inthe first, the pore surface is divided into strips of strongly and weakly attractive regions[32, 51, 314, 315, 326, 327, 372]. In the second, individual chemical groups are attached tothe planar surface [224, 234, 247–249, 360, 369, 370, 372, 374]. For the case of chemicallystriped surfaces, the behaviour depends strongly on the ratiod/H , whered is the width of thestripe andH is the pore width. For individual groups on the surface the corresponding variableisn/H , wheren is the site density on the surface. Whend/H orn/H are sufficiently small thebehaviour is qualitatively similar to that for homogeneous walls, since the effects of surfaceheterogeneity are not felt far from the walls. Whend/H or n/H are large the behaviouris similar to that of a collection of independent pores of various widths or fluid–adsorbateinteractions. Intermediate cases between these two extremes are of particular interest. Inaddition to these studies for slit pores, Segarra and Glandt [332] have studied a model ofwater on activated carbons in which the carbon is modelled as made up of randomly orientedplatelets of graphite with a dipole distributed uniformly over the edge of the platelets to mimicthe activation.
Striped surfaces have been investigated using mean field Ising lattice models [32,315], non-local DFT [51, 314] and GCMC simulation [327, 328, 372]. Although the interaction modelsare somewhat different in these various cases, the resulting phase diagrams are qualitatively

1608 L D Gelb et al
Figure 26. Density profile for a ‘bridge’ state for a slit pore of widthH = 7.2σ atT ∗ = kT /ε =1.00, µ∗ = µ/ε = −11.50, from GCMC simulations. The strongly attractive wall strip liesbetweenx = −2σ and +2σ . From [32].
similar. Typical results for a slit pore of widthH = 5σ (whereσ is the diameter of theadsorbate molecule) for two intermediate values ofd/H are shown in figure 25. For thesecases the fluid–wall potential was periodic in thex direction, and of the form
V (r) = V0(z) +A(z) cos(2πx/d) (24)
whereV0(z) is the mean strength of the potential,z is the direction normal to the walls,dis the period of the fluid–solid potential corrugation, andV0 andA are given by Yukawapotentials. Ford = 20σ two coexistence regions are seen, each with its own critical point.At the lower densities, the coexistence is between a gas-like state (g) and a state (b) in whichliquid ‘bridges’ have formed between the strongly attractive regions of the surfaces of the twowalls of the pore; successive bridges of liquid are separated by gas-like regions that coverthe less strongly attractive wall areas. At the higher densities there is a coexistence betweenthe ‘bridge’ state and a state in which the pore is filled with a liquid-like phase (l). Suchbehaviour is expected whend/H is relatively large. For the smaller value,d = 11σ , these twocoexistence regions merge at the lower temperatures, where coexistence is between the gasand liquid phases, but remain separated at higher temperatures. These two temperature regionsare divided by a triple point, at which all three phases (g, b, l) are in coexistence. On furtherreducing the value ofd, the triple-point temperature increases, and the triple point disappearsat a value betweend = 8σ and 9σ . Typical density profiles for the bridge state are shown infigure 26, taken from the work of [32]. These results are obtained from GCMC simulationsfor a wall model in which the fluid–solid interaction is the LJ model, and consists of strips ofstrongly attractive (s) and weakly attractive (w) regions. The strongly attractive strips are ofwidth ds = 4σ , while the weakly attractive strips have a widthdw = 8σ .
Surfaces with individual chemical groups have been studied by lattice gas models [360].GCMC simulations have been reported for water [224, 234, 247, 248], methane [372] and forassociating chain molecules [249, 369, 370] adsorbed on model activated carbons composedof slit pores in which the surfaces are decorated with chemical groups. In the case of waterand associating chains, these groups can hydrogen bond to the adsorbate molecules. For waterit is found that if the site density is low enough the adsorption is similar to that in graphiticpores [248, 362]. That is, almost no adsorption occurs at low to moderate relative pressures,
Phase separation in confined systems 1609
but this is followed by capillary condensation. As the surface density of sites increases moreadsorption occurs at low pressures, and the pore filling moves to lower pressures. At thesehigher site densities the pore filling ceases to be via a sharp phase transition, and occurscontinuously. Examination of snapshots of the adsorption at increasing pressures shows thatwater molecules first adsorb singly on the surface sites, and these adsorbed molecules formadsorption sites for further water molecules to hydrogen bond to. Thus water clusters areformed around surface sites, and these grow until eventually they link up with other clusters onthe same wall, or with clusters on the opposing wall in narrow pores. This filling mechanismis quite different to that for simple fluids on homogeneous pore walls, where the filling occursa layer at a time followed by capillary condensation.
3.3.3. Geometric heterogeneity.Geometric heterogeneity can take a variety of forms. Forexample, the effects of surface irregularities in the pore walls, networking and interconnectionsamong pores of the same or different size and geometry, and disordered pore structures suchas those in aerogels are all of interest.
Surface irregularity. Adsorption in slit pores in which the surfaces have a step (raised region),and in which the steps are in registry for the two walls, have been studied using the non-localDFT of Tarazona by Chmielet al [51]. The behaviour is dependent on the lengths of thestep compared with the remainder of the surface, and on the step height relative to the porewidthH , but is in many respects similar to that for the chemically striped surfaces consideredin section 3.3.2. When the step height is appreciable compared with the pore width twocapillary condensation transitions occur at a particular temperature, the one at lower pressurescorresponding to the formation of a ‘bridge’ phase in which a liquid-like layer forms in thenarrower part of the pore, and the one at higher pressure corresponding to the pore beingfilled with a liquid-like phase (cf figures 25 and 26). Related studies for stepped surfaceshave been reported by Tovbin and Votyakov [360] using lattice-gas theory. Maddox and co-workers [221, 223] have studied the case of two narrow slit pores, open at one end to a bulkgas phase, and separated by a larger pore. The behaviour in this case depends strongly onthe relative widths of the two pores. Curryet al [61] studied a slit pore in which each of thewalls had a fcc(100) structure, and one of the walls was smooth while the other had a steppedsurface; depending on the registry of the two walls, the confined phase may be fluid or solid.While adsorption on single walls composed of randomly packed spheres (the Bernal model)has been studied [47], there does not seem to have been a systematic study for pores for thismodel. Vishnyakovet al [372] have studied capillary condensation for methane in slit poremodels of coal in which the surfaces are geometrically structured.
Networked structures. So far we have considered only materials in which the pores areindependent, each connected through their open end to the bulk fluid phase with which they arein equilibrium. In such systems the adsorbate molecules in a given pore are usually unaware ofthe existence of adsorbate in neighbouring pores. However, most amorphous porous materialshave pores that are interconnected; moreover the pores may be tortuous and of varying size. Ithas long been suspected that such connectivity of pores and size variation may have an importanteffect on the adsorption behaviour, and particularly on capillary condensation. Thus, poresof larger width may be connected to the bulk phase only through narrower pores or necks; insuch cases, once the pore structure is filled with a liquid-like phase, it will be difficult for suchlarger pores to empty since molecules must diffuse through the liquid-like phase that still fillsthe smaller pore regions (‘pore blocking’). In addition, near pore connection points, as the

1610 L D Gelb et al
Figure 27. Adsorption isotherms for xenon in Vycor glass, calculated from (a) the independentsingle-pore model, (b) the network model of Mason, atT = 0.63Tc, whereTc is the bulk criticaltemperature of xenon. From [14].
pore critical point is approached by raising the temperature the correlation length can grow tolengths greater than the pore width, and this could have a significant effect on the location ofthe pore critical point. Possible evidence for this is seen in figure 14, where the lowering of thepore critical temperature for simple adsorbates in Vycor and silica gel, which have networkedpores, is smaller than for MCM-41, which has straight pores which are not interconnected.
The effects of networking on the adsorption of simple fluids in Vycor and CPGs have beenconsidered by several authors. Ball and Evans [14] used local DFT to study the adsorptionof xenon in Vycor glass for two models: (a) a collection of independent single cylindricalpores, each open to the bulk phase, and (b) an interconnected network of such pores. Yukawapotentials were used for the intermolecular interactions, and the PSD was assumed to be givenby a Gaussian distribution, with parameters appropriate for Vycor. In order to account fornetworking in model (b) Ball and Evans used a theory due to Mason [231,232], in which poresare interconnected via ‘windows’ or necks. Application of Mason’s model requires knowledgeor assumption of the distribution of pore and neck sizes, and the connectivityC, defined as theaverage number of necks connected to a given pore. In Mason’s model adsorption is assumedto be unhindered, but desorption cannot occur until the pressure falls to a value where themenisci can pass through the necks. This pressure is calculated using the local DFT, andC istaken to be 4. Mason’s model leads to hysteresis due to pore blocking, even when adsorptionis reversible in a single pore. Typical results from these independent pore and network modelsare shown in figure 27. The two models give noticeably different shapes for the hysteresisloops, the network model giving a sharper drop in adsorption, as is observed in the experiments(see figure 7(a)). The horizontal region at high pressure and the sharp ‘knee’ in the desorptioncurve are artifacts of the network model. The temperature dependence of these isotherms showthat the size of the hysteresis loops decreases with increasing temperature, disappearing at thehighest temperature studied,T/Tc = 0.94, for both models, in agreement with experiment. Inthe case of the network model the width of the loops remains constant up toT/Tc = 0.87 incontrast to the experimental findings; again this is an artifact of the network model.
A more realistic model of Vycor and CPG glasses has been developed by Gelb andGubbins [109] by mimicking the spinodal decomposition manufacturing process for theseglasses using quench molecular dynamics simulation. Such glasses are prepared by heating a

Phase separation in confined systems 1611
Figure 28. Preparation of model porous glasses. Quench molecular dynamic simulations for abinary mixture (top) produce a networked structure. Snapshots taken at later stages in the phaseseparation are made into porous samples (bottom, shown in cutaway view) by removing one of thephases. Pore size increases with time after quench. Simulation time is given in reduced unitsτ (τis equivalent to 0.781 ps). From [110].
suitable mixture of oxides (typically 62.7% SiO2, 26.9% B2O3, 6.6% Na2O and 3.5% Al2O3
in the case of Vycor) to about 1200◦C, where it forms a homogeneous liquid mixture, andthen quenching it to an intermediate temperature of about 700◦C, where it phase separateson a microscopic scale into two continuous phases, one rich in silica and the other rich in theother oxides. The mixed oxide phase forms a network structure of winding cylinders, whosediameter grows with time. By controlling the time at this intermediate temperature it is possibleto control the diameter of the cylinders. When the desired diameter is reached the mixtureis quenched to room temperature and the mixed-oxide phase is removed by treatment with ahot acid solution, leaving a porous glass that is 96% silica. This phase separation process isrelatively insensitive to the intermolecular potentials used. Gelb and Gubbins use a symmetricLJ binary mixture in which the like pair interactions are the same for the two species, i.e.ε11 = ε22 = ε andσ11 = σ22 = σ , but the unlike pair attraction is weak,ε12 = 0.25ε(σ12 = σ ). Such a mixture has a liquid–liquid coexistence region which is symmetrical, withthe critical mixing composition atx1 = 0.5. Provided that the composition is not very dilutein one of the components, quenching this mixture into the spinodal region leads to phasesplitting to produce locally tubular phases whose diameter grow with time. Following thequench, one phase can be removed and the resulting porous structure relaxed or annealed.Pore size is controlled by varying the length of the quench period; porosity can be controlledby varying the initial composition. Such simulated glass structures closely resemble thoseobtained experimentally in appearance, surface area, connectivity and porosity. Snapshots ofthis procedure for preparing model porous glasses are shown in figure 28 for several stages ofthe quench process; hereτ = (ε/mσ 2)0.5t is the reduced time, and corresponds to 0.781 ps.In these simulations the sides of the simulation box were each 27 nm in length, and the cellcontained 868 000 atoms initially with a mole fraction ofX = 0.7, so that the porosity of theglasses formed was close to 30%. The pore volume in these glasses is fully connected.
Porous glasses generated in this way are precisely characterized, since we know the

1612 L D Gelb et al
Figure 29. Adsorption isotherms for a modelof nitrogen in the model glasses depicted infigure 28, at 77 K. Adsorption data are shownas circles; desorption data, shown only for theA and D glass samples, are shown as squares.The isotherms are vertically displaced forclarity, and lines are a guide to the eye.Uncertainties in the data are smaller than thesymbols. Glasses A, B, C and D had averagepore sizes of approximately 3.3, 3.9, 4.5 and5.0 nm; all glasses had a porosity very closeto 30%. From [110].
position of all solid atoms, and hence the surface area, PSD, porosity, connectivity, etc. In viewof this, together with the fact that they appear to be realistic representations of the morphologyof real CPG and Vycor glasses, they provide ideal systems on which to test commonly usedcharacterization methods. In such calculations the LJ parameters for the substrate atoms areset equal toσ = 0.27 nm,ε/k = 230 K, the values used to represent bridging oxygen atoms insilica [222]. Simulations of nitrogen adsorption in these glasses provide nitrogen adsorptionisotherms (figure 29), which can be analysed by standard methods [122] to estimate the surfacearea, PSD and porosity. The accuracy of these conventional methods can be rigorously testedby comparison of such estimates with the exact values. Tests of this sort have been madefor the BET (Brunauer–Emmett–Teller) method for determining surface area [109] and theBJH (Barrett–Joyner–Halenda) method for obtaining the PSD [110]. For the BET method,the estimates of surface area are found to be accurate for large mesopores (pore diametersdown to about 5 nm), but corrections become significant for smaller pores, with the BETmethod overestimating the surface area by as much as 20–25% for pore diameters of 2 nm.The principal source of error in the BET method arises because the monolayer density forcylindrical pores is generally higher than that for a planar surface; the latter value is commonlyused in applying the BET method to obtain surface areas. The BJH method for the PSD relieson the modified Kelvin equation, and so is expected to give pore diameters that are too small,based on previous tests for the independent straight cylinder model (see figure 15). This isconfirmed by tests for the more realistic glass model of figure 28. Typical results for thePSD are shown in figure 30. The BJH method predicts PSDs which are narrower and havemaximum pore diameters that are about 1 nm smaller than the exactly known geometric PSDs.This error is believed to be due to a combination of factors: (a) errors in using the modifiedKelvin equation for small pores (figure 15); (b) the use of the independent cylinder model in

Phase separation in confined systems 1613
Figure 30. PSDs from geometric analysis using spherical probes (solid curves), together with PSDestimates from BJH analysis (dashed curves) of the nitrogen adsorption isotherms of figure 29.From [110].
BJH, which fails to include pore tortuosity, surface irregularities and networking effects; and(c) the use of a standard reference isotherm for a planar surface, which underestimates thedensity of the adsorbed layers.
These model glasses have also been used to study the adsorption and capillary condensationof xenon [111]. Some typical results are shown in figure 31, together with results for theindependent straight cylinder model, and experimental results for Xe in Vycor [46]. Directcomparison of the simulation results with the experimental ones is complicated by the factthat the average pore size and porosity are not accurately known for the experimental glass.However, it is clear that for the independent cylinder model the shape of the hysteresis loops,and also the shape of the isotherm at low pressure, are both incorrect. For the more realisticglass model of figure 28 the isotherms are qualitatively very similar to the experimental ones.Slight adjustments to the mean pore size and porosity in the model calculations would bringthe two sets of results into quantitative agreement.
Cracknellet al [56] have used molecular simulation to study capillary condensation as afunction of pillar density in model pillared clays (consisting of slit pores in which the walls arespanned by cylindrical pillars placed on a hexagonal close-packed lattice). They find that belowa critical pillar density capillary condensation occurs. The capillary condensation pressuresare below those for the slit pores, due to the increased confinement.
Disordered (random) porous media.Many porous materials, particularly oxides such assilica, alumina, titania, zirconia, thoria and ceria, are formed from colloidal suspensions byaggregation and suspension [155,306,307,363]. They are composed of microscopic particles
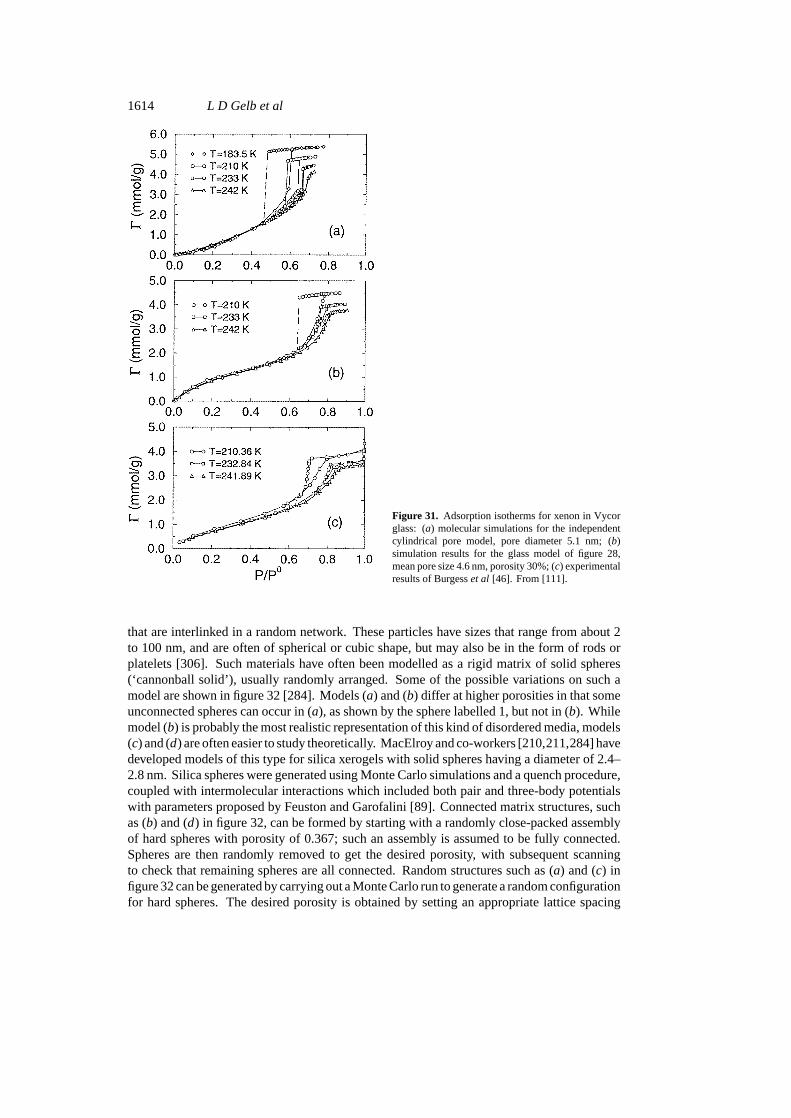
1614 L D Gelb et al
Figure 31. Adsorption isotherms for xenon in Vycorglass: (a) molecular simulations for the independentcylindrical pore model, pore diameter 5.1 nm; (b)simulation results for the glass model of figure 28,mean pore size 4.6 nm, porosity 30%; (c) experimentalresults of Burgesset al [46]. From [111].
that are interlinked in a random network. These particles have sizes that range from about 2to 100 nm, and are often of spherical or cubic shape, but may also be in the form of rods orplatelets [306]. Such materials have often been modelled as a rigid matrix of solid spheres(‘cannonball solid’), usually randomly arranged. Some of the possible variations on such amodel are shown in figure 32 [284]. Models (a) and (b) differ at higher porosities in that someunconnected spheres can occur in (a), as shown by the sphere labelled 1, but not in (b). Whilemodel (b) is probably the most realistic representation of this kind of disordered media, models(c) and (d) are often easier to study theoretically. MacElroy and co-workers [210,211,284] havedeveloped models of this type for silica xerogels with solid spheres having a diameter of 2.4–2.8 nm. Silica spheres were generated using Monte Carlo simulations and a quench procedure,coupled with intermolecular interactions which included both pair and three-body potentialswith parameters proposed by Feuston and Garofalini [89]. Connected matrix structures, suchas (b) and (d) in figure 32, can be formed by starting with a randomly close-packed assemblyof hard spheres with porosity of 0.367; such an assembly is assumed to be fully connected.Spheres are then randomly removed to get the desired porosity, with subsequent scanningto check that remaining spheres are all connected. Random structures such as (a) and (c) infigure 32 can be generated by carrying out a Monte Carlo run to generate a random configurationfor hard spheres. The desired porosity is obtained by setting an appropriate lattice spacing

Phase separation in confined systems 1615
Figure 32. ‘Cannonball’ models for a disordered porous medium: (a) random overlapping spheres;(b) randomly connected overlapping spheres; (c) random non-overlapping spheres; (d) randomlyconnected non-overlapping spheres. Shaded regions are the solid matrix, the small solid circlesrepresent a fluid molecule moving through the void space. From [284].
in the initial fcc lattice. MacElroy and co-workers used these structures to study adsorptionand diffusion of methane in a silica xerogel. They found good agreement with experimentaldata using the more realistic connected model, (d) of figure 32. Connectivity of the spheresforming the matrix was found to have a pronounced effect on the diffusion rates. However,they did not determine phase diagrams for capillary condensation.
Capillary condensation in such matrices has been studied by both theoretical andsimulation methods. Monson and co-workers [164–166, 274, 323] have used GCMCsimulations to study a simplified version of the system used by MacElroy and Raghavan [211] toinvestigate methane in silica. In the work of Monsonet al the matrix was one of random non-overlapping spheres, and the fluid–solid interaction was averaged over the atomic structureof the surface, to give the analogue of the (9, 3) potential model for planar surfaces. Theyfound [274, 323] that the coexistence curve for capillary condensation, as determined fromthe simulations by thermodynamic integration (see section 2.1), is much narrower than for thebulk fluid, and that the pore critical point moves to lower temperatures and higher densities,in agreement with experimental findings (figure 33). They also find that at low temperaturesa second transition occurs, from a low-density gas-like phase to a phase of moderate density.This second transition is associated with the wetting behaviour of the fluid in regions ofthe solid matrix where the spheres are more densely packed, and involves high-density fluidpermeating these more confined regions. The effect of varying the strength of the attractivefluid–solid forces on the coexistence curve was also studied [274]. It was found that the formof the coexistence curves was sensitive to this variation. Adsorption isotherms [323] showedhystersis loops that were qualitatively in agreement with experiment for this system. Sarkisovet alhave also obtained the coexistence curve for a matrix of spheres placed on a fcc lattice, and

1616 L D Gelb et al
Figure 33. Temperature-density phase diagrams for a LJ fluid in a solid made up of a matrix ofspheres. The coexistence curve for the bulk fluid is shown as the solid curve. Filled circles are theresults for the random array of non-overlapping spheres, with a sphere density corresponding to asilica xerogel, and a fluid modelled on methane. Open circles are for an ordered fcc matrix. HereT ∗ = kT /ε andρ∗ = ρσ 3, whereε andσ are the fluid–fluid LJ parameters; (1−η) is the porosity,with η being the fraction of the volume occupied by the solid spheres. From [323].
these results are also included in figure 33. This latter coexistence curve is quite different fromthat for the random matrix, being similar to the bulk coexistence curve, but shifted to lowertemperatures; it does not show the second low-density transition. Evidently this transitionarises from the spatial variation of the density of solid spheres, and hence of the porosity.
The simulation results for these disordered porous media should be treated with caution,since the systems studied are not large enough to represent a truly random sample, and areperiodic at the length scale of the simulation box. Several recent studies [5, 40, 76], usinglarger systems and in some cases [76] histogram re-weighting, have shown that the resultingphase diagram is highly sensitive to the particular configuration used for the solid particles.
It is interesting to note that Bryket al [45] have found similar phase diagrams to that shownin figure 33 for a LJ fluid adsorbed in a system of semi-permeable walls. Their investigationis based on the Kierlik–Rosinberg form of density functional theory. For intermediate andlow potential barriers separating the pores, coexistence curves exhibit two critical points anda triple point, similar to that shown in figure 25(b). The two parts of the coexistence curvescorrespond to condensation in the pore and in the semi-permeable walls.
A variety of approaches from liquid-state statistical mechanics have been applied todisordered porous materials of this kind. The system can be treated as a so-called ‘quenched-annealed’ binary mixture, in which the solid matrix of spheres is the ‘quenched’ componentwhose configuration is obtained by sampling from an appropriate equilibrium ensemble,while the second component is the fluid adsorbed into the matrix [316]. Madden andGlandt [218] worked out the statistical mechanics of such a system, including the appropriatecluster expansions and Ornstein–Zernike equations that relate the various total and direct

Phase separation in confined systems 1617
correlation functions. Givens and Stell [113, 115] subsequently showed that the Ornstein–Zernike equations given by Madden and Glandt were only approximate, and derived exactequations. These derivations relied on the ‘replica method’, which exploits a mathematicalisomorphism between a partly quenched system and a limiting case of a correspondingequilibrium system, called thereplicatedsystem. The resulting Ornstein–Zernike relationsare a set of coupled integral equations involving correlation functions for the matrix–matrix,matrix–fluid and fluid–fluid structure, and are known as the replica symmetric Ornstein–Zernike (RSOZ) equations. A range of approximate methods based on liquid-state theory havebeen explored using the replica method [114, 172–174, 205, 289, 298, 299, 317, 361]. Severalof these methods have been used to determine temperature-density coexistence curves for suchsystems [172–174, 299]. The results are sensitive to the closure relation used in conjunctionwith the RSOZ equations. The most realistic of these calculations to date appear to be thosebased on a quench-annealed lattice gas model, solved using the mean spherical approximationas closure of the RSOZ equations [173,174]. This model produces gas–liquid phase envelopesin which the critical temperature is lowered and the critical density raised relative to the bulk,as in the experiments and simulations. For relatively high densities of matrix particles, andsufficiently strong attraction between the fluid molecules and the matrix particles, a secondpre-condensation transition is observed at low temperatures that is similar to that shown in thesimulation results of figure 33. However, the calculated results, particularly those for the pre-condensation transition, are sensitive to the lattice used and the thermodynamic route chosen(e.g. ‘compressibility’ versus ‘energy’ routes).
4. Layering transitions
At relatively low temperatures, adsorption isotherms on smooth surfaces can show step-wisebehaviour, which is generally interpreted as layer-wise adsorption. In these situations, theadsorbing gas prefers to complete each successive monolayer before beginning the next one.In addition, the steps in these isotherms are often quite sharp, which led to speculation thatthese systems undergo a series of first-order phase transitions as layers are added.
This hypothesis has been extensively tested by experiments, lattice-model simulations,molecular simulations, and classical DFT and integral equation theory calculations. As aresult, these layer-wise transitions have been incorporated into a much larger picture of surfacephase behaviour involving the interplay between thesurface rougheningandsurface wettingtransitions.
4.1. Experiments
Many experimental observations of layering transitions have been made on clean, planarsurfaces such as graphite. Measurements have also been made on metal surfaces,magnesium oxide ‘smoke’, exfoliated graphite and graphite foams, and other high-surfacearea materials.
Methane adsorption on the MgO(100) surface shows stepwise behaviour in the isotherm at87.4 K [104] up to the completion of the third layer, after which the isotherms become smooth;at the lower temperature of 77 K up to five steps are found in the isotherm [225]. Thesestrongly adsorbed layers are found to be quite solid-like from quasi-elastic neutron scatteringexperiments [24, 25]. Similar stepwise adsorption has been found for methane adsorption onnonporous graphite at 77 K [192], as well as on exfoliated graphite and graphite foam [26].
Oxygen adsorbed on graphite also exhibits layering transitions at low temperatures, withthe number of observed transitions dependent on the temperature. These layers are found

1618 L D Gelb et al
Figure 34. Phase diagram for argon multi-layers on graphite. The thick cross-hatchedlines indicate first-order phase transition re-gions (vertical isotherm steps) while the thinlines denote possible continuous transitionlines (kinks in the isotherms). The symbols S,G and F, represent solid, gas and fluid phase,respectively. The fluid or disordered phasemost likely exists in a region where the ver-tical extent of the liquid phase is not welldefined. Layer critical temperatures are lo-cated atTc(2) = 70.0 ± 0.3 K, Tc(3) =68.3± 0.5 K, Tc(4) = 67.2± 0.2 K and thelayer triple points atTt (2) = 66.5± 0.5 Kand Tt (3) = 67.2 ± 0.5 K. Reproducedfrom [191].
to be crystalline below 43.8 K and liquid-like at higher temperatures [394]; the completeadsorbed phase diagram, involving adsorbed multilayer solids, liquids, and mixed states, (e.g.,solid films, liquid films, and surface-melted films) has been obtained by neutron diffraction[49, 186]. In this system, transitions occur between crystalline layers at low temperatures,between liquid-like layers at temperatures much above the triple-point temperature, andbetween states composed of some liquid-like and some crystalline layers at intermediatetemperatures.
Argon adsorption on graphite has also been extensively studied using ellipsometry [394],neutron scattering [191, 193], adsorption isotherm measurements [194] and x-ray scattering[194], and a complex adsorbed phase diagram has been determined in which as many as sevenlayering transitions appear at low temperatures. One estimation of this phase diagram is shownin figure 34. Remarkably, a second series of layering transitions occurs at higher temperaturesbetween films which are thought to be surface-melted solids; the second series of transitionsis offset in pressure from the first, leading to ‘re-entrant’ behaviour [394], in which layerwisetransitions disappear near 69 K and then reappear near 73 K, and then disappears at yet highertemperatures, as shown in figure 35. This behaviour indicates that a completed liquid-likelayer can be re-solidified by additional adsorption [295].
Other gases that have been shown to have complex layering adsorption phase diagramsare ethylene [175, 345], ethane [256] and xenon and krypton [395]; much of the work in thisarea has been concisely reviewed [143].
4.2. Theoretical treatments and systematics of surface phase transitions
Panditet al [282] discuss the systematics of layering, wetting, and roughening on a planarsurface in terms of the strength and range of the surface-fluid interaction, using a lattice-gas approach. For a strongly-adsorbing surface, where the surface-fluid interaction is largecompared with the fluid–fluid interaction, adsorption at low temperatures proceeds througha series of layer-wise first-order transitions, with the film thickness becoming infinitelylarge at liquid–vapour coexistence. Each of these first-order transitions has an associatedcritical layer temperature, at which that layer transition becomes smooth. These layer criticalpoints approach thesurface roughening temperatureTR at liquid–vapour coexistence. Theroughening temperature can also be physically understood as that temperature where the freeenergy of defect formation in the surface drops to zero, which leads to a divergence in the

Phase separation in confined systems 1619
Figure 35. Ellipsometric coverage isotherms for argon on graphite at four temperatures. Theabscissa is a function of the reduced pressure, given by [µn − µ0 = T ln(pn/p0)]. With theparticular functional form used, the simple Frenkel–Halsey–Hill model predicts a uniform staircase.Reproduced from [394].
height–height correlation function along the surface. Thus, at the roughening temperature andabove, there can be no layer-wise phase transitions in this type of model.
For intermediate-strength surfaces, where the interaction between fluid and surface iscomparable with the fluid–fluid interaction, the picture is complicated by the additionalpresence of a non-zero wetting temperature. For adsorption at temperatures below the wettingtemperature, the adsorbed layer is of finite thickness even at bulk liquid–vapour coexistence,while at temperatures above, the thickness of the adsorbed layer diverges. The wettingtemperature is lower than the roughening temperature, and the layer-wise transition linesintersect the bulk liquid–vapour curve. This leads to adsorption isotherms at intermediatetemperatures that show several steps at low pressures followed by a smooth divergence at highpressures.
Panditet al also discuss the critical wetting regime in depth, as well as the layer-wisetransitions that occur in the critical drying region; since this section focuses principally onphysisorbed systems of the type discussed in section 3, we will not discuss these here.
Another surface phase transition relevant to confined liquids is theprewettingtransition,which corresponds to a discontinuous butfinite jump in the adsorbed layer thickness, typicallyof several monolayers’ size. The prewetting transition is first order with an associated criticalpoint, and occurs for some intermediate-strength substrates; prewetting has been verified byboth lattice-gas simulations [79, 262] and experiments on binary mixtures [169] and surfacemelting [25]. Studies of the prewetting transition in lattice models [262] have confirmed thatthis transition (and other layering transitions) are of the two-dimensional Ising universalityclass.
In porous materials the asymptotic growth of the adsorbed layer is affected by the curvatureof the pore surfaces, and ultimately interrupted at the point of pore filling. This leads toisotherms that consist of layer-wise regimes at low pressure, which lead to smooth multilayeradsorption at intermediate pressures and finally capillary condensation at higher pressures.
1620 L D Gelb et al
The prewetting transition is also still observable in some pore models [262]. Confinement in aporous material suppresses both the roughening and wetting transitions, because they involvemacroscopic growth and fluctuations in the thickness of the adsorbed layer. In addition, thenontrivial geometry and surface heterogeneity of most porous materials tends to smooth outlayer-wise behaviour.
Wetting and layering have been extensively studied in the context of the simple-cubic Isingmodel and other lattice gases. In these studies, bulk and surface external fields replace thepressure and surface-fluid attractions relevant for the gas adsorption problem. Many studiesusing mean-field arguments [68, 73], the quasichemical approximation [6], renormalization-group solutions [319], and Monte Carlo simulations [72, 73] have demonstrated the basicstructure of the surface phase diagrams involving layering transitions. Binder and Landau[30,31] used Monte Carlo simulations to systematically map out the changeover from layeringto roughening to wetting behaviour as both the surface field strength and the first-layer spin-coupling energy are changed.
Some of the drying and layering transitions predicted by lattice model studies have notbeen observed in real adsorbed systems, possibly because the range of adsorption energiesavailable with common materials is not very great. However, many adsorbed films do havequite complex phase diagrams due to the presence of solid–liquid transitions, which can (inprinciple) occur at different temperatures in each adsorbed layer, with each layer freezingtemperature dependent on the total coverage. In addition, experiments (section 4.1) haveshown a complex interplay between (layer-wise)surface meltingin the adsorbed film and thelayer-wise buildup of the adsorbate.
Some theoretical studies of adsorption using Potts models and related multi-state latticemodels have focused on the interaction of solid and liquid states in the adsorbed film. These arelattice models where a given site can be unoccupied, and if occupied, can be in one of severalsymmetric states. Neighbouring occupied lattice sites in the same state have a more favourableenergetic interaction; this gives rise to distinct solid and liquid phases, characterized by orderand disorder in these symmetric states. Kahng and Ebner [163] used six- and eight-state Pottsmodels in both mean-field studies and Monte Carlo simulations to describe the adsorption ofsimple gases on graphite, and obtained many complete surface phase diagrams, exhibiting arich variety of behaviour. Another model which reduces to the three-state Potts model has beenused in the mean-field approximation to study solid–liquid transitions in adsorbed films [353],and Potts-type models have been extensively studied in the context of surface melting, whichis a closely related problem [105,158,352].
Layering transitions on strong substrates at low pressures are qualitatively easy tounderstand, as they may be attributed to the packing of adsorbed molecules that maximizessurface-fluid interactions. However, for thicker layers, where the substrate potential iseffectively zero near the surface of the adsorbed layer, and for weaker substrates, where eventhe first adsorbed layers are quite liquid-like, the phase behaviour of the adsorbed film isgoverned by very delicate fluid correlations acting over long length scales.
DFT has been used to characterize capillary transitions and adsorption in porous materials(see section 3), and has also been used to study layering transitions. Ball and Evans [13] usednon-local DFT to study the LJ fluid and the Yukawa fluid both at solid surfaces and in narrowcylindrical pores. At low temperatures steps were found in the adsorption isotherms, withvery small associated metastable regions. These first-order layering transitions disappeared ata series of layer critical points, as predicted by earlier work with lattice models. In cylindricalpores the layering transitions are shifted to lower pressures (for the same fluid–wall potential),and there is a competition between the layering transitions and capillary condensation. Underthe conditions used in this study, solid-like layers and layer-melting transitions were not

Phase separation in confined systems 1621
observed. Balbuena and Gubbins [11] have used non-local DFT to study the effects oftemperature, pore width and intermolecular interaction parameters on layering transitions inslit pores. Both fluid–fluid (ff ) and solid–fluid (sf ) interactions were of the LJ type. Thelayering transition behaviour was strongly influenced byεsf /εff , the ratio of solid–fluid tofluid–fluid attraction. Henderson [142] has used mean-field DFT with and without linearrenormalization to fully analyse the interaction of the many competing length scales involvedin wetting and prewetting in adsorbed films, and related these phenomena to theories of theasymptotic structure of liquids and mixtures.
4.3. Molecular simulation
Layering transitions have been studied using molecular simulations in a number of geometries.In an early study, Pertersonet al [292] used GCMC simulations to study layering transitionsin a cylindrical pore of diameter 14σ , whereσ is the LJ diameter of the fluid molecule.The pores had structureless walls (the cylindrical analogy of the (9, 3) fluid–wall potentialwas used), and the fluid–wall potential was strongly attractive; LJ parameters typical ofa methane-like fluid in a carbon pore were used. Three layering transitions were found,followed by capillary condensation. In addition, a quasi-two-dimensional freezing transitionoccurred in the first layer at a pressure below that corresponding to the formation of thesecond layer. Maddox and Gubbins [220] observed stepped adsorption isotherms in grandcanonical Monte Carlo simulations of argon and nitrogen in models of buckytubes; thisbehaviour is to be expected due to the strength and smoothness of the adsorbate-fluid potential.Interestingly, in the correponding desorption isotherms, most of the stepped behaviour isnot observed because the capillary hysteresis loop is so large in these calculations; most ofthe layering transitions occur within the hysteresis loop of the larger transition. Since theposition of the thermodynamic capillary transition is not known, this may mean that some ofthe layering transitions are entirely metastable, and occur at pressures where pore filling isthermodynamically favourable.
The structure of argon films adsorbed on graphite has been studied with canonical MonteCarlo simulations [295] in order to better understand experimental results. By analysis of thelayer densities and in-layer pair correlation functions, the solid-like or liquid-like character ofeach adsorbed layer could be determined as a function of temperature and total adsorption.This reinforced the picture of reentrant layering developed from experimental studies; thatincreasing adsorption causes freezing transitions in already completed layers. The prewettingtransition for argon adsorbing on a ‘9–3’ wall has also been observed and characterized usingmolecular simulations, and the interplay of prewetting, layering and wetting in this system hasbeen examined [85,91]. Simulations of neon adsorption on homogeneous surfaces have foundprewetting behaviour, while prewetting is absent on similar heterogeneous surfaces, indicatingthat substrate roughness can significantly affect adsorbate phase behaviour [34,62].
Layering, freezing and capillary condensation transitions have been studied in a simulationstudy of methane adsorption in graphite slit pores [162]. In this study, the freezing transitionwas observed in the first layer only, and was signalled by a kink in the adsorption isotherm(see figure 36) and marked change in the in-layer pair correlation function from that of astrongly ordered liquid to that of a crystalline solid, and molecular dynamics studies found adecrease in the self-diffusion coefficient of molecules in the first layer of more than two ordersof magnitude. The additional adsorbed layers in this figure are also thought to be solid atthis temperature, so that the transition from a one-layer to a two-layer system (and beyond)is a transition between solid phases. As in the simulation study of adsorption in buckytubes,for the larger pores several layering transitions were observed at higher pressureswithin the

1622 L D Gelb et al
Figure 36. GCMC results for adsorption isotherms for methane in graphite slit pores atT ∗ = 0.5and (a) H ∗ = 10, (b) H ∗ = 20, whereT ∗ = kT /ε andH ∗ = H/σ . Adsorption is denotedby circles, desorption by triangles, and first-order transitions as dashed lines. FT is the freezingtransition. Reproduced from [162].
capillary condensation hysteresis loop. The number of layering transitions observed dependedon the width of the pore, as shown in figure 36; in pores 5σ (5 methane diameters) wideonly one layering transition was observed before condensation, while in pores 10σ wide threetransitions were seen, and in pores 20σ wide four transitions were found. The situation inthis and similar systems is that a competition exists between layering transitions, which areinduced by a single surface, and capillary condensation, which is caused by confinement. Forsufficiently narrow pores, capillary condensation obscures many (or all) layer-wise transitions,while for large pores, layering phenomena mediate the thickness of the adsorbed layer, andthus the pressure at which capillary condensation in the central part of the pore ultimatelyoccurs.
Forsman and Woodward [95] have used isotension ensemble MC simulations and non-localDFT to study layering transitions in a slit pore with structureless walls. The interactions wereof the LJ type, and the fluid–wall interaction was given by the (9, 3) model (see section 2.9). Inthe isotension ensemble the number of molecules,N , the average component of the pressuretensor parallel to the walls,P‖, and the temperature are fixed, but the surface area of the porewalls is allowed to fluctuate.
5. Liquid–liquid equilibria
Problems in liquid–liquid equilibria are often considered as special cases of liquid–vapourequilibria, since both systems can (in the vicinity of a critial point) be mapped onto Ising-typelattice models. However, the dynamic properties of binary liquid mixtures and liquid–vapoursystems are very different, and the range of coupling strength to external variables is muchlarger for the liquid–liquid systems.
In confined systems, most studies (experimental or theoretical) have focused on eitherthe dynamic properties of a near-critical binary mixture or the position and properties of the
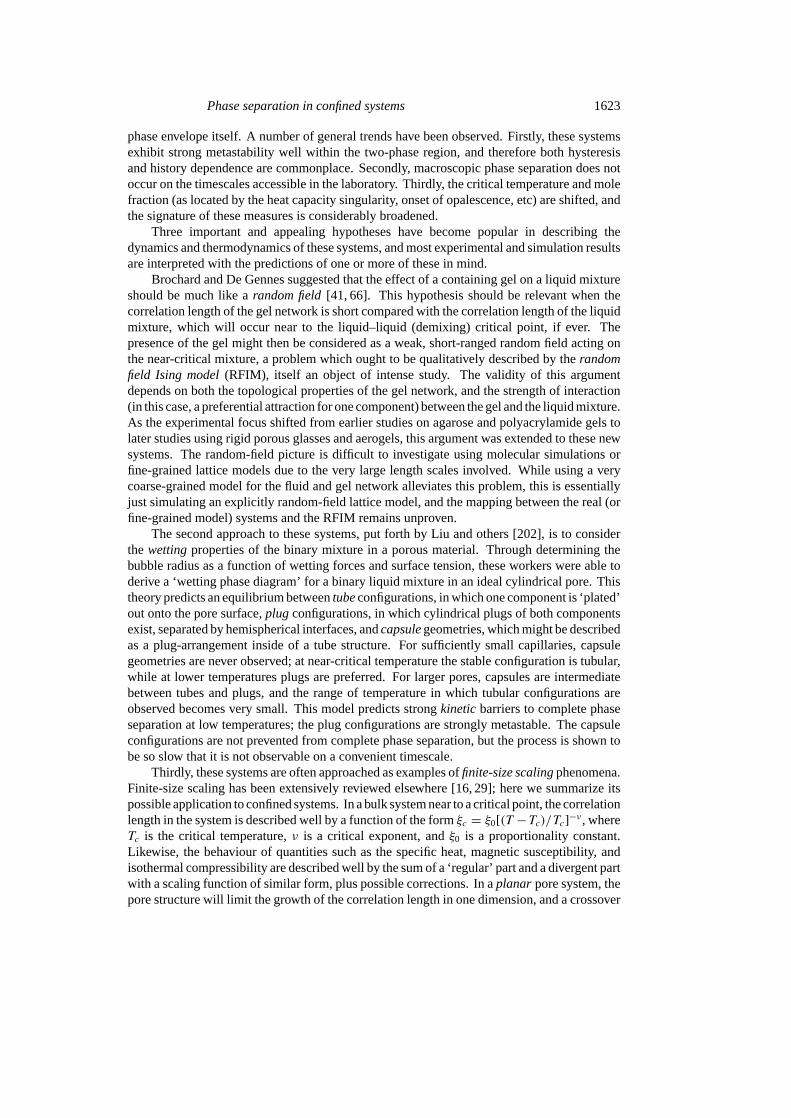
Phase separation in confined systems 1623
phase envelope itself. A number of general trends have been observed. Firstly, these systemsexhibit strong metastability well within the two-phase region, and therefore both hysteresisand history dependence are commonplace. Secondly, macroscopic phase separation does notoccur on the timescales accessible in the laboratory. Thirdly, the critical temperature and molefraction (as located by the heat capacity singularity, onset of opalescence, etc) are shifted, andthe signature of these measures is considerably broadened.
Three important and appealing hypotheses have become popular in describing thedynamics and thermodynamics of these systems, and most experimental and simulation resultsare interpreted with the predictions of one or more of these in mind.
Brochard and De Gennes suggested that the effect of a containing gel on a liquid mixtureshould be much like arandom field[41, 66]. This hypothesis should be relevant when thecorrelation length of the gel network is short compared with the correlation length of the liquidmixture, which will occur near to the liquid–liquid (demixing) critical point, if ever. Thepresence of the gel might then be considered as a weak, short-ranged random field acting onthe near-critical mixture, a problem which ought to be qualitatively described by therandomfield Ising model(RFIM), itself an object of intense study. The validity of this argumentdepends on both the topological properties of the gel network, and the strength of interaction(in this case, a preferential attraction for one component) between the gel and the liquid mixture.As the experimental focus shifted from earlier studies on agarose and polyacrylamide gels tolater studies using rigid porous glasses and aerogels, this argument was extended to these newsystems. The random-field picture is difficult to investigate using molecular simulations orfine-grained lattice models due to the very large length scales involved. While using a verycoarse-grained model for the fluid and gel network alleviates this problem, this is essentiallyjust simulating an explicitly random-field lattice model, and the mapping between the real (orfine-grained model) systems and the RFIM remains unproven.
The second approach to these systems, put forth by Liu and others [202], is to considerthe wettingproperties of the binary mixture in a porous material. Through determining thebubble radius as a function of wetting forces and surface tension, these workers were able toderive a ‘wetting phase diagram’ for a binary liquid mixture in an ideal cylindrical pore. Thistheory predicts an equilibrium betweentubeconfigurations, in which one component is ‘plated’out onto the pore surface,plugconfigurations, in which cylindrical plugs of both componentsexist, separated by hemispherical interfaces, andcapsulegeometries, which might be describedas a plug-arrangement inside of a tube structure. For sufficiently small capillaries, capsulegeometries are never observed; at near-critical temperature the stable configuration is tubular,while at lower temperatures plugs are preferred. For larger pores, capsules are intermediatebetween tubes and plugs, and the range of temperature in which tubular configurations areobserved becomes very small. This model predicts strongkineticbarriers to complete phaseseparation at low temperatures; the plug configurations are strongly metastable. The capsuleconfigurations are not prevented from complete phase separation, but the process is shown tobe so slow that it is not observable on a convenient timescale.
Thirdly, these systems are often approached as examples offinite-size scalingphenomena.Finite-size scaling has been extensively reviewed elsewhere [16, 29]; here we summarize itspossible application to confined systems. In a bulk system near to a critical point, the correlationlength in the system is described well by a function of the formξc = ξ0[(T −Tc)/Tc]−ν , whereTc is the critical temperature,ν is a critical exponent, andξ0 is a proportionality constant.Likewise, the behaviour of quantities such as the specific heat, magnetic susceptibility, andisothermal compressibility are described well by the sum of a ‘regular’ part and a divergent partwith a scaling function of similar form, plus possible corrections. In aplanar pore system, thepore structure will limit the growth of the correlation length in one dimension, and a crossover
1624 L D Gelb et al
will occur to two-dimensional Ising behaviour very near the critical point, which will be shiftedas [252]
|Tc − Tm(L)|Tc
∝ L−1/ν (25)
whereTm(L) is the position of the shifted maximum andL is the pore width of the system. Ina cylindrical pore system, correlations can only grow large in one dimension; it is well knownthat in such a system no true first-order phase transition can occur, and so only a remnant ofphase behaviour is observed, with no real critical behaviour or divergences. Most real materialshave complex geometries, which may be locally cylindrical or planar, but have connections(and correlations) between pore sections, which are the basis for the random field picturedescribed above. Many studies, as described below, attempt to correlate the average pore sizewith the shift in critical temperature from that of the bulk system using equation (25) and toconfirm other hypotheses from the scaling theory, despite the non-ideality of the experimentalmaterials’ structure.
These attempts are frequently complicated by the fact that it is difficult to combine datafrom materials of significantly different pore geometries because the meaning of the acceptedaverage pore size in different classes of materials is different. This is one reason why CPGshave been extensively used in these studies; these materials can be prepared with a wide rangeof pore sizes with essentially the same network morphology.
5.1. Experimental results
5.1.1. High-porosity materials. Maheret al [226] used light scattering to study the near-critical behaviour of both isobutyric acid plus water and 2,6-lutidine (2,6-dimethylpyridine)plus water in agarose and polyacrylamide gels of varying weight fraction. They report thatstrong light scattering occurs when the systems were quenched into the two-phase region ofthe binary mixtures, and that this scattering did not cease for hundreds of hours. They locatedthe temperature at which opalescence was observed as a function of the concentration of themixture; these data resembled the phase diagrams of the bulk mixture, except that they wereshifted slightly to favour the more strongly adsorbed component, and occurred at temperaturesoutside (below, in the case of the water–isobutyric acid mixture and above, in the case of thewater–lutidine mixture) the bulk phase envelope.
Frisken and Cannell and co-workers have extensively studied the water-lutidine mixtureand the water-isobutyric acid mixture in dilute silica gels using both light scattering and neutronscattering. These studies have focused principally on the properties of the near-critical mixturein the gel, and have shown that the simple random-field approach to these systems does notfully account for many of their properties.
The water–isobutyric acid system is a type II binary mixture and has an upper criticalsolution temperature ofTc = 299.83 K with critical weight fraction near 38.8%. Intheir study of this mixture in 4 wt.% silica gel [99], the dynamics of order parameter (inthis case, concentration) fluctuations were followed as the temperature was brought downtowards the critical temperature. At high temperatures, the gel-mixture system had the sameexponential fluctuation decay as the bulk mixture. Nearer to the critical point a wavelength-dependent activated term becomes important, with the most significant contributions for largeq vectors. At a reduced temperature oft ∼ 0.002, (abovethe critical temperature) the systemspontaneously orders and a very long-time relaxation appears, which later dies away. A laterstudy [101] showed that this mode re-appeared with each successive temperature decrement,but increasing the temperature had no such effect. This is consistent with a phase separationprocess. For temperatures slightly below the critical solution temperature, similar behaviour

Phase separation in confined systems 1625
Figure 37. Phase diagram showing the relationship between the water/isobutyric acid coexistencecurve of the bulk mixture (open circles, crosses), the narrow two-phase region of the silicagel/mixture system, which lies between the open diamonds, and the slow mode onset temperature(solid diamonds). Reproduced from [399].
is observed, and for deeper quenches, macroscopic phase separation was found to occur over aperiod of months. Using neutron scattering, [100] found that in the two-phase region of a bulkmixture of water and lutidine a gel-confined mixture showed scattering changes consistentwith a slow phase separation process in which the liquids segregate into large domains.
Further studies [8] showed that for low isobutyric acid concentrations, the phase-separationinduced by pressure quenching to within the coexistence envelope was described well by adynamic scaling model with the domain size growing ast1/3, indicating that ‘domain pinning’behaviour due to the gel network is not present. For higher concentrations of acid, the scalinghypothesis did not hold at any observed time. The overall behaviour of these systems issimilar to that of random field models, with the notable exception that the water–isobutyricacid–gel system appears to relax to equilibrium from a ‘frozen’ domain state over an accessibletimescale, while random-field models do not.
The phase diagram of the gel/mixture system was measured using a morethermodynamically oriented approach, in which the concentration of isobutyric acid in thegel system was determined as a function of coexistingbulk-phaseconcentration [399]. Phaseseparation in the gel system was found for temperatures of 15 and 19◦C, but not at 23◦C,indicating that the critical temperature in the gel has been lowered from its bulk value of near25.72◦C. The shift in concentration in the gel system was more dramatic; the entire phaseenvelope was shifted to one side of the bulk critical concentration, as shown in figure 37.
5.1.2. Low-porosity materials. Voronov et al have studied the behaviour of the specificheat of a mixture of water and 2,6-lutidine imbibed in porous glasses [75,375]. This mixturehas also been extensively studied by several other groups in the context of confined liquid–liquid separation (see below). At constant pressure, water and 2,6-lutidine have alowercriticalsolution temperature (LCST), so that at temperaturesabovethisTc the liquids separate into twophases. The criticalweightfraction of the mixture isxc = 0.290±0.005 (equivalent to a criticalmolefraction of 0.0642±0.0001) and the critical temperature isTc = 306.79±0.01 K [375].In these studies the heat capacity was measured as a function of temperature for both critical

1626 L D Gelb et al
Figure 38. The specific heat of 2,6-lutidine+ water in CPG of 100 nm average pore size,at x = 0.29 and atx = 0.16, and also thebulk specific heat atx = 0.29 as functions oftemperature. Reproduced from [75].
Figure 39. Coexistence curve of a 2,6-lutidine–water mixture in the bulk(+), in the porous glasswith a characteristic pore size of 1000 Å(�), and in the porous nickel with a pore size of 2500 Å(•). Reproduced from [375].
and off-critical mole fractions.In these experiments the peak in the heat capacity around the critical point was shifted to
higher temperatures, and dramatically rounded, as shown in figure 38. The amount of shiftand rounding varied with pore size; in smaller pores the peak position was shifted furtherand rounded more than in larger pores. By locating the heat capacity peak position at manymole fractions, phase diagrams for the confined fluids were constructed, which gave a critical

Phase separation in confined systems 1627
weight fraction of 2,6-lutidine ofx = 0.32 and a critical temperature ofT = 307.09 K inpores of 100 nm size, as shown in figure 39. Additional measurements in a porous nickelsample (of very different pore topology) and average pore size of 250 nm, gavex ' 0.30 andT = 306.86 K.
These results were all interpreted in the context of finite-size scaling theory, and augmentedby calculations on the three-dimensional periodically bound Ising model. The displacementof the temperature of the specific-heat maxima was described well by the finite-size scalingprediction of equation (25). Ising, porous glass, and porous nickel data all fit the same curve,with an exponent ofν = 0.64± 0.02. Furthermore, good agreement is found between theuniversal functionF that describes the shape of the near-critical heat capacity, for all thesystems studied. The authors conclude that the predictions of finite-size scaling theory are notdependent on the geometry of the specific porous media.
Sliwinska-Bartkowiaket al [336, 337] have studied the phase diagram of a mixture ofnitrobenzene andn-hexane in CPGs using nonlinear dielectric effect measurements and lighttransmission. The nonlinear dielectric effect (NDE) is the change in electrical permittivityof the system due to a strong electric field; near the liquid–liquid critical point this quantitydiverges with a critical exponentφ = γ −2β. When this mixture is confined in porous glasseswith pore sizes of 100 nm and 150 nm, the(T ,X) phase diagram is shifted to increased hexaneconcentrations, and the critical temperature is slightly depressed. This mixture has a type IIphase diagram with an upper critical solution temperature (UCST), so this shift corresponds toa shrinking of the phase envelope. These effects are stronger in the sample with smaller pores,and in recent experiments on 7.5 nm porous glasses the depression is much larger, as shown infigure 40. As the temperature is lowered towards the critical point, the NDE value increasesas it does in the bulk, with a comparable exponent, but in the region of the confined-systemcritical point the divergence is replaced with a rounded-off peak. These authors interpret this asa crossover from Ising-like behaviour to classical behaviour, arguing that once the correlationlength of the fluid is comparable with the pore size the system enters a mean-field regime [241].
Light transmission measurements in this system [337] implied that the phase-separatedmixture in the pores exists in a microscopic domain structure, at least on the timescale of theseexperiments. As the temperature is reduced, transmission of visible light through the sampledrops off sharply at the confined critical temperature; in the bulk system similar behaviour isfound at the bulk critical point. In the pore system, at lower temperatures the light transmissioncontinues to decrease, while in the bulk system it returns to a high value just below the criticalpoint. While the pore system is expected to quickly equilibrate on a small length scale, itmay be that the two phases cannot globally phase separate in reasonable times, and the systembecomes trapped in a state with many small domains of each phase alternating throughout thepore structure. In single-pore models, such alternating domain structures have been shown tohave extremely long lifetimes [107,242].
Other studies of liquid mixtures in large-pore glasses have revealed similar behaviour.Goldburg et al [116] used light scattering to study a mixture of carbon disulfide andnitromethane in a 100 nm porous glass. This mixture has anuppercritical solution temperatureof approximately 63.4 ◦C in the bulk phase. When confined in the porous glass, the criticaltemperature, as identified by a sharp change in the light transmission with temperature, isdepressed to approximately 62.2 ◦C. In these experiments, the correlation length was foundto not exceed 30 nm, so that the random-field hypothesis was not expected to apply at anytemperature. The time autocorrelation function of the concentration fluctuations was foundto have a non-exponential decay with a spectrum of relaxation times that can be as long as100 s. In additional experiments on the porous sample immersed in bulk mixtures of variousconcentration, the form and timescale of the autocorrelation function were different from that

1628 L D Gelb et al
Figure 40. Coexistence curves of a nitrobenzene/n-hexane mixture in two different CPGs,compared with the bulk system. From [334].
of the isolated sample, and the confined fluid behaved much more like the surrounding mixture.A simple one-dimensional Brownian domain-diffusion model was described which capturedmany of the qualitative aspects of these dynamics.
Light scattering experiments have also been used to study the lutidine–water system inVycor glass, which has an average pore diameter of approximately 7 nm and a porosity near28%. Wiltzius et al [388] measured the phase diagram of this system by measuring theintensity of the Raman bands of lutidine in glass samples which had been exposed to bulkmixtures of various composition. The ‘concentration shift’ (enrichment of lutidine in thepores) varied between +0.15 weight fraction and−0.05 weight fraction, depending on thebulk concentration. The picture of phase separation proposed in this study involves two‘transitions’. As the system is heated from the one-phase region into the two-phase region, itundergoes a transition from a state in which lutidine is preferentially adsorbed (the finite-sizeanalogue of ‘complete wetting’) to a state in which small domains rich in lutidine or waterare present (the finite-size analogue of ‘partial wetting’). This change is not abrupt, and issignalled by a change in the scattered light intensity. Once domains of each phase are formed,the correlation length in the system can grow to scales larger than the pore diameter, and arandom-field transition is possible. An effective phase diagram for this transition was found bylocating the divergence in the activation time for composition fluctuations. These data were fitto the standard form of the coexistence curve|φA− φB | = B|T − Tc|β (whereφ is the weightfraction of one component), from which was extracted anupper boundfor β of 0.21, smallerthan the bulk value of near13, and in agreement with simulated and theoretical predictions forthe random-field model. This study also found that far above the bulk separation temperaturethe system became cloudy, but no macroscopic phase separation was ever observed.
A later study of the same system with small-angle neutron scattering experiments cameto somewhat different conclusions. Linet al [201] obtained the structure factorS(q) over a

Phase separation in confined systems 1629
large range of temperature and concentration for the water–lutidine mixture in Vycor glass.These data were then fit to standard predictions for the random-field model, which are generallysimilar to the scattering predicted for a collection of random domains. In order to obtain a goodfit to the experimental data, an additional term was included to represent the scattering from anadsorbed lutidine-rich layer; the form of this term was determined by separate experiments onalkylsiloxanes attached to the Vycor surface. The conclusions of this study were that there wasa surface layer rich in lutidine at all temperatures studied, and that the domain size (as definedby one of the fit parameters) never exceeds the Vycor pore size, even well above the criticaltemperature, deep into the two-phase region. This picture is consistent with the predictionsof the single-pore model discussed above, and seems to represent a transition from the tubephase (at low temperatures) to a ‘capsule’ phase near the critical temperature.
5.1.3. Liquid crystal transitions. There have been many studies of liquid crystal transitionsin controlled-pore and Vycor glasses and other porous materials. Most of these studies havefocused on the transition between orientationally ordered (nematic) and disordered (isotropic)phases, with less attention paid to the orientationally and positionally ordered smectic phases.In the bulk phase, the nematic–isotropic (N–I) transition is weakly first order; the heatcapacity has a strong peak at the transition temperature related to large fluctuations in thelocal orientational order parameter.
In confined systems the substrate material affects the local order through surface effects,by which molecules can be ‘anchored’ at the pore surface. This serves (in many cases) toincrease the degree of order in the liquid crystal. The interaction of surfaces and liquid crystalphases has been extensively reviewed [159].
Conversely, ‘geometric’ confinement in a pore can either increase or hinder orientationaland positional order, depending on the regularity of the pore structure and its compatibilitywith the bulk liquid crystalline structure. The pore geometry can either stabilize or destabilizesmectic structures, and these effects are closely linked with the favoured orientation of the firstadsorbed layer. Regular pore geometries can stabilize smectic structures, while locally roughsurfaces can destabilize them.
Another effect of confinement in low-porosity materials is to separate the adsorbed fluidinto weakly-coupled domains. Since the heat capacity peak (and strength of the transition)are related to large fluctuations in the local order, confinement broadens and reduces this peakin much the same way that it affects the susceptibilities of liquid–liquid mixtures near totheir critical transitions. For sufficiently small pore sizes, surface interactions dominate overliquid properties and the sharp orientational transition disappears, replaced by a gradual lossof orientational order with increasing temperature.
In the bulk phase, the N–I transition is necessarily first-order because of the change insymmetry of the system. For porous networks with small pores, however, this need not be thecase; because most of these materials are homogeneous and isotropic at large length scales, aconfined nematic phase would also beglobally isotropic in order to maintain locally favourableorientation throughout the network. That is, each section of pore would have its own preferrednematic director, but at larger scales these would average to zero. As in the case of adsorbedbinary fluids, theoretical descriptions of these systems tend to focus either on a single-poremodel, in which surface interactions and local geometry are considered [351], or random-fieldtypes of models, in which the system as a whole is studied, with the pore matrix taken as arandom or semi-random perturbation of the adsorbed fluid [229].
Dadmun and Muthukumar [63] studied the N–I transition ofp-azoxyanisole in a series ofCPGs using differential scanning calorimetry, and showed that as the pore size was reducedfrom 313 to 16 nm the transition temperature first increased relative to the bulk phase and

1630 L D Gelb et al
Figure 41. The DSC thermograms of the fully annealedsystems. (A) Purep-azoxyanisole (PAA), (B) PAA in CPG1,pore size 3125 Å, (C) PAA in CPG2, pore size 347 Å, and(D) PAA in CPG3, pore size 156 Å. The horizontal axis is thetemperature in◦C. Reproduced from [63].
Figure 42. Temperature evolution of the absorption spectrum width for pentylcyanobiphenyl in12 nm(+), 150 nm (�, pathb; ×, patha), 200 nm (4) CPG, and for the bulk(♦) sample. Thehalf-height widths are shown for the 12 and 150 nm samples (measured via pathb) and the isotropicphase for all samples. The spectral half splittings are shown for the 150 nm (measured via patha), 200 nm and bulk samples in the nematic phase. The inset shows the details close toTNI .Reproduced from [185].
then decreased, as shown in figure 41. For very large pores, the pore network structure haslittle effect on the liquid crystal, and the major effect of confinement is an enhancement of thenematic phase through surface-induced ordering. As the pore size is reduced, nematic orderis still locally enhanced by confinement, but the directors in different parts of the networkbecome decoupled, which overall weakens the nematic phase relative to the isotropic phase,and reduces the temperature of the transition.

Phase separation in confined systems 1631
Kralj et al [185] studied the liquid crystal pentylcyanobiphenyl in several CPGs usingdeuterium NMR. In samples with 150 and 200 nm radius pores, the transition remainedbulk-like, with a discontinuity in the width of the adsorption spectrum near that found inthe bulk phase. For a sample with 12 nm radius pores, the discontinuity was replaced by acontinuous (though still relatively sharp) change from a somewhat less-ordered nematic stateto the isotropic phase. Some of these data are shown in figure 42. This study concluded that farfrom the transition, in either phase, a single-pore picture was appropriate for these materials,while near the transition their results could be accounted for by introducing strong effects dueto the junctions between pores. When the (different) directors in each pore section meet ata junction defects must occur. Because these junctions (in 12 nm radius pores) are of sizecomparable with the correlation length of the nematic phase, they may be responsible for thecontinuous nature of the transition, as no sharp transition could occur in such a volume. Inthe large-pore samples, the same geometric constraints on the director apply, but the junctionvolumes are much larger and allow for bulk-like behaviour.
Iannacchioneet al [152] have used deuterium NMR and calorimetry to study the N–Itransition of a number of liquid crystals in Vycor and CPGs. For octylcyanobiphenyl in large(100 nm) pores, they found that the nematic phase showed a NMR powder pattern spectraconsistent with a locally ordered material with no overall preferred direction. This phasecoexisted with an isotropic component. This liquid has a smectic-A phase as well, which wasstrongly suppressed relative to the nematic phase. For this liquid in 10 nm pores, no phasetransition was detected, although there was a continuous variation of local orientational orderwith temperature. In Iannacchioneet al [150, 151] several different liquid crystals in Vycorglass were studied with the same techniques; in all cases no real transition was found, with astrongly rounded remnant of the orientational transition occurring at a depressed temperature.In these studies Landau-type theories were successfully used to describe these data.
In anopore and nucleopore membranes with 200 nm diameter pores, Crawfordet al [59]used deuterium NMR to examine the effects of confinement on the orientation of the liquidcrystal 4’-pentyl-4-cyanobiphenyl, and found that the preferred orientation was along the axesof the cylindrical pores of the materials. The NMR spectral patterns were used to characterizethe pore geometry of the two materials; the roughness of the pore surface was found to stronglyinfluence the degree of order at temperatures above the bulk transition.
5.1.4. Helium transitions. The superfluid phase diagrams and near-critical behaviour ofhelium-4 (4He) and mixtures of3He and4He have been measured in a variety of porousmaterials by Chan and co-workers. These fluids exhibit transitions to superfluid states atvery low temperatures, and attracted a great deal of attention in bulk-phase studies as ‘ideal’experimental realizations of critical transitions. Similarly, the confined helium systems areexcellent experimental systems with which to study the effects of confinement. Some of thework in this area has been directed at measuring and characterizing the critical exponents ofthe superfluid transitions ofthin filmsof 4He [60, 92]; thin helium films adsorbed on Vycorglass show a crossover from two-dimensional-like to three-dimensional-like critical behaviourvery near the superfluid transition. For temperatures far from critical, the films are describedwell by a modified Kosterlitz–Thouless approach, while near to the transition the correlationlength becomes quite large (larger than the characteristic pore length), and a three-dimensionalXY -type transition is found. Experiments on porous gold and hydrogen-plated gold reaffirmthese findings, and show an additional peak in the heat capacity at temperatures significantlybelow the transition, which has yet to be explained [60].
Helium and helium mixtures have also been extensively studied in very high porosityaerogel materials. In the case of pure4He, adsorption in aerogels reduces the transition

1632 L D Gelb et al
temperature, with larger reductions for smaller porosities (higher gel densities.) In addition,as the gel density is increased, the heat capacity signature of the transition is more stronglyrounded, when compared with bulk data [393]. For 5% gels, the heat capacity has no singularpart below the transition, while for 2% and 0.5% gels it does; in general, as the percentageweight of silica in the gel is reduced the near-critical behaviour shows a smooth evolutiontowards the bulk limit [393].
In the case of3He–4He mixtures, the effects of even low gel densities are striking. Inthe bulk phase, this system has a critical line which intersects a liquid–liquid coexistenceloop at a tricritical point. In the pore system, the coexistence region is narrowed so that thecritical line ‘misses’ it and continues down to very low temperatures; the topology of the phasediagram is completely changed [176]. This system has been modelled using the spin-1 BlumeEmery–Griffths model with the silica framework described as a quenched random field; thetricritical point was found to be unstable under conditions pertaining to these experimentalsystems [228].
5.2. Lattice models
MacFarlandet al [212] used large-scale Monte Carlo calculations to study the Ising modelconfined in a porous matrix comparable with CPGs. The matrices were produced using separateMonte Carlo simulations of the bulk Ising model with spin-exchange kinetics (conserved orderparameter, withM ≡ 0); the bulk systems were quenched to subcritical temperatures, and thedynamic phase separation of the two phases was continued until the desired ‘pore size’ wasreached. One phase was taken as the void space, and the other as the substrate. In this model,the void and substrate are entirely symmetric, which is not true in experimental Vycor, thoughit does hold for some other CPGs. In addition, the interaction between the confined Isingmodel and the substrate was that of a hard wall; no interaction energy was present betweenspins and the substrate. Sophisticated Monte Carlo sampling schemes were used to obtaincritical temperatures and near-critical properties for many realizations of the porous matrix,and these data were analysed using finite-size scaling methods.
The principal conclusions of this study were that all of the data from all of the differentpore systems studiedcould be collapsed together using simple scaling laws, and that all oftheir observations could be fit with a single set of critical exponents which were consistentwith those of therandom Ising model(also known as the ‘site-diluted Ising model’, not thesame as the RFIM). These exponents wereν = 0.8±0.1,γ = 1.4±0.1 andβ = 0.65±0.13.While critical exponents are often difficult to measure precisely, these are quite different fromthose of the bulk Ising model. Since there were no surface fields in this model, the change inuniversality class appears to be due entirely to the effects of confinement. The dependence ofthese exponents on the degree of confinement was not measured.
Liu and Grest [203] and Monette [242] used kinetic Monte Carlo studies to support thesingle-pore model approach to confined liquid–liquid equilibria. These studies used a three-dimensional square cross-sectioned single-pore and spin-exchange Monte Carlo moves toinvestigate both the kinetics of domain growth and the effects of the pore surface field ondomain topology. These studies provide examples of much of the behaviour predicted by thesingle-pore model. Upon quenching a system with weak surface fields from the disordered(supercritical) phase into a plug region, the domains of each phase grow quickly until theplugs are clearly visible, after which the dynamics slow drastically. The authors do notpresent quantitative domain-growth data; due to the small number of domains observed inthese simulations, repeating these calculations many times would have been necessary forthis. Additional simulations showed that upon quenching from the tube phase into the plug

Phase separation in confined systems 1633
phase, the appearance of plugs appears to be a nucleation-limited process. In simulations ofa pore with stronger surface fields and a capsule phase, the transition between capsule andtube systems was also studied, and the rate of growth of capsules into tubes was found to bedependent on the thickness of the wetting layer.
The two-dimensional Ising model has been used in many studies of the effects ofconfinement on phase separation, with many different geometry ‘pores’. Lee [198, 199] hasstudied a model with parallel pores separated by irregular, broken walls using kinetic MonteCarlo simulations of the type described above. In these studies the kinetics of phase separationwere measured at both near-critical and sub-critical temperatures. These studies found veryslow dynamics similar to those determined experimentally by light scattering, and support thehypothesis that some microscopic separation of the two phases begins at temperatures abovethe bulk critical temperature, induced by the correlated disorder of the pore system and thepreferential attraction of the pore walls for one species. At sub-critical temperatures thesestudies found that static correlation data from systems with varying pore size could be fitwith a single scaling function, provided that the correlation functions were measured using aminimum-distance convention.
For a one-dimensional system without a conserved order parameter, simulations of a simple‘kink–antikink’ model predicted a logarithmic growth of domains upon phase separation [251].Albanoet al [3] tested this scaling using simulations of two-dimensional Ising ‘strips’ with nopreferential surface field. They found that at short times, when the spin domain length scalewas smaller than the strip width, the kinetics were very similar to those of the unconfined two-dimensional Ising model, and that at late times and large length scales, the system formed ‘plug’phases where the growth of plugs was described well by a logarithmic law. Later simulationsby Muller and Paul [250], however, indicate that this agreement with a logarithmic law maybe spurious, and that at late times the domain growth could be completely described by anannihilating random-walk model, which predicts purely diffusive (power-law) domain growth.While non-conserved order parameter models are not applicable to binary liquid mixtures, theydo describe single-component liquid–vapour coexistence, and can also be compared favourablywith liquid crystal systems.
Kotelyanskii and Kumar [184] have carried out Monte Carlo simulations for an Isingmodel of an associating liquid mixture confined in a slit pore, with hydrogen-bond interactionsbetween the fluid molecules and the walls. They find that the single liquid phase can be eitherstabilized or destabilized by the confinement.
5.3. Molecular simulation results
There have not been many molecular simulation studies of liquid–liquid phase equilibria inporous systems, and no studies based on realistic models of the experimental systems discussedearlier.
Most molecular simulation studies have focused on the kinetics of phase separation uponquenching, with only a few recent efforts at locating the phase diagram itself. Keblinskiet al [168] used molecular dynamics to study the phase separation of a model LJ mixturein a slit-pore geometry at two slit widths (2σ and 3σ ), allowing either one or two layers ofadsorbed atoms. The fluid model is a symmetric LJ binary mixture with the attractive part(the dispersion term) of the inter-species potential turned off. This model mixture has beenextensively studied in the context of bulk phase separation [190, 209]. This study found thatthe two-layer fluid showed good scaling in the radial distribution function, while the one-layerfluid did not. Furthermore, the domain growth exponent in the two-layer fluid was foundequal to that from the author’s earlier study [209]. The growth exponents were sensitive to

1634 L D Gelb et al
the simulation scheme used, with constant-temperature (canonical) simulations giving largergrowth exponents than constant-energy (microcanonical) simulations.
These results have not been fully reconciled with otherstrictly two-dimensionalsimulations of the same mixture, which did find good scaling in the radial distribution function,provided that different growth exponents of1
2 and 23 were allowed at short and long times,
respectively [371, and references therein], presumably due to a crossover from diffusive domaingrowth to hydrodynamic domain growth. In these studies a slightly different potential wasused, in which the sign of the attractive dispersion term between unlike species was reversed;this potential has a longer range than that used in the Keblinski study. However, the differencesbetween strictly two-dimensional fluids and fluids physically confined to a single monolayerhave not been systematically addressed, at least in this context, so comparison of these twostudies may not be well founded.
Zhang and Chakrabarti [398] have studied the same binary LJ fluid as Keblinskiet al in avariety of confined geometries in two and three dimensions. In their study of two-dimensionalpores they investigated the kinetics of phase separation in ‘strip’ pores (the two-dimensionalanalogue of cylindrical pores) with pore walls that were either parallel or ‘uneven’. They foundthat the phase separation followed a power-law growth with a low exponent (around 0.3) forshort times, and then all but stopped once the domains of each phase were large enough toform plugs. In the uneven pores, which contained sections of larger pore radius, the phaseseparation continued for longer, with a late time crossover to a growth exponent of 0.64±0.04,equal to the2
3 power law mentioned above. In a system that included a junction between twosimple strip pores, domains were found to grow faster in the region of the junction, althoughno signature in the growth law was found. In a different study of a three-dimensional fluidin a cylindrical pore [396], the authors found striking qualitative evidence of the ‘plug’ phaseproposed by Liuet al in the single-pore theory discussed above, although they did not locatea stable ‘tube’ phase. The pore system in this study was relatively short (l = 69.6σ for a8.7σ pore radius) which did not allow for the measurement of plug growth properties or sizedistributions, as only a few plugs could be observed.
Stricklandet al [343] considered the dynamics of phase separation in a more realistictwo-dimensional medium, for several wetting conditions. In this work the porous material wasitself generated by a molecular dynamics simulation of bulk two-dimensional liquid–liquidseparation; once the desired pore size was reached, one phase was frozen, while the other wassplit into a binary mixture. This study used a ‘12–3’ LJ-type potential, also with completelyrepulsive forces between atoms of unlike species. For symmetric wetting conditions in whichthe pore surface does not prefer either component, plug configurations were observed at latetimes, while for the asymmetric system studied, in which one component was attracted to thepore wall and one was repelled from it, a capsule ‘phase’ was observed.
Gozdz et al [119] studied the phase diagram of a symmetric LJ mixture in ideal slit-poregeometries using the GEMC method. In this study the inter-species attractive well depth waslessened;ε12 = 0.65ε11, which is sufficient to induce type II phase separation in this mixture,but gives substantially more diffuse (and realistic) liquid–liquid interfaces than observed inprevious studies. The interactions between each fluid component and the pore wall were thesame, so that the phase diagram was necessarily symmetric aboutX = 0.5; this alloweda modification of the Gibbs ensemble scheme in which only the ‘identity’ of particles needbe exchanged between cells, as the cell densities can be held equal. Both the influence ofthe strength of the wall–fluid attraction and the pore size were studied. In this study thetemperature was held fixed, and(ρ,X) sections of the phase diagram were measured. Thisstudy showed thatincreasingthe potential well depth led to an increased critical density (atconstant temperature), and thatdecreasingthe pore width also increased the critical density,

Phase separation in confined systems 1635
apparently well into the solid-like region for very narrow pores.Gelb and Gubbins [106, 107] have studied the kinetics of phase separation of the binary
LJ mixture used by Gozdz et al in several different cylindrical pores. In these studies, theeffective pore density was held constant, and the course of phase separation was followedfor different temperatures and pore diameters. The systems used in these studies were allsymmetric, and no capsule ‘phases’ were observed. In all cases, the phase-separating liquidsreached plug conformations at late times. For deep quenches (to quench temperatures far belowthe critical point) the phase separation slowed dramatically when the domain size reached thepore diameter. For only slightly sub-critical quenches this was not the case, and the domainscontinued a power-law growth to the latest times studied, reaching average sizes of severalpore diameters. The authors postulate that this temperature dependence is caused by largefluctuations in the liquid–liquid interface near the pore critical point, which in turn enablethe diffusion of plugs of one phase in another. The motion of these domains was studiedqualitatively in [106], and over the length of the simulation it does appear that domain growthis by a condensation mechanism.
Gelb and Gubbins [107] also considered the thermodynamics of their systems usinga simple model of one-dimensional behaviour. Strictly speaking, the ‘single-pore model’cannot have a true phase transition at nonzero temperature, for much the same reason thatthe one-dimensional Ising model cannot have one: the entropy associated with the positionof the domain boundaries causes the system to favour many small plugs, rather than a fewlarge ones. Using a histogram-weighted SGMC simulation they measured the probabilitydistribution of the pore mole-fraction at sub-critical temperatures. A simple division of theseprobability distributions into ‘one-phase’ and ‘two-phase’ components allowed the calculationof the surface tension between adjacent plugs, and hence the average plug length as a functionof temperature. The results of these calculations are shown in figure 43, supplemented byestimates of the average plug size from direct canonical Monte Carlo simulations; they indicatedthat the average plug length was extremely large except quite close to the critical point, and thatnone of the molecular dynamics simulations had reached a thermodynamically stable state, byat least an order of magnitude in plug length.
In a later study these authors used the same histogram-based methods to study the phasecoexistence properties of strongly asymmetric systems [108]. Three different strengths ofwetting potential were studied, with wall–fluid well-depth ratiosε2w/ε1w of 3:1, 2.2:1 and1.67:1, in cylindrical pores of 5σ radius. The phase coexistence curve in the(T ,X) planewas shifted towards the more strongly adsorbed component, and the pore critical temperature(as extrapolated from lower-temperature data) was depressed, with both effects being mostpronounced for the 3:1 system, as expected. These data are shown in figure 44. Simulationsnapshots showed that the coexisting phases were a nearly pure phase of the preferredcomponent and a tubular phase in which the preferred component wet the wall and the non-preferred component occupied the centre of the cylinder. Thus, these coexistence curves couldbe interpreted as a coexistence between complete-wetting and partial-wetting states. Theauthors also investigated the effects of the finite-size periodic boundary conditions used inthe simulations, and determined that, while the qualitative behaviour of the systems did notchange with increasing systemlength, theP(X) distributions and the shape of the top of thephase diagram were quite sensitive, underlining the difficulties of using small ideal-geometrysystems for the investigation of near-critical phenomena.
5.3.1. Liquid crystal simulations.There have been many simulation studies of liquid crystalsin confined geometries, using both lattice-based models and more sophisticated off-latticepotentials.
1636 L D Gelb et al
Figure 43. Results from histogram analysis for the equilibrium domain length,leq (reduced withmolecular diameterσff ) in cylindrical pores of radii 3σ and 5σ , and from direct Monte Carlosimulation of the equilibrium domain length in the 3σ system, over a range of temperature. Potentialparameters are chosen to model argon in pores of carbon dioxide. Reproduced from [106].
Telo da Gamaet al [351] solved a Lebwohl–Lasher model with both simulations andapproximate methods to locate the N–I phase transition for a liquid crystal confined in a slitpore at many pore widths. This model consists of rotors fixed to a cubic lattice, interactingthrough nearest-neighbour potentials based onP2(cosθ), whereθ is the angle between rotorsandP2 is the second Legendre polynomial. They found that the Kelvin prediction, that theshift (downwards) in the N–I transition temperature is proportional to 1/L, whereL is the porewidth, is accurate forL > 64 layers. In addition, for wide enough pores a wetting layer of theisotropic phase was observed at each wall; in this system the walls did not exert any orderingpotential on the fluid model, so that orientational order was greater in the centre of the pore thanat the wall. A subsequent study of the same model [53] also considered the effects of an aligningsurface field and simulation system size. For zero field, they concluded that the film (pore) hasa critical thickness 8< Lc < 16 below which no phase transition occurs. Chiccoliet al [50]used Monte Carlo simulations of this type of lattice model to study the effects of confinementin a slit pore with two different surfaces that preferred normal and tangential orientations of themolecules, leading to complicated defect structures in the film. Zhang and Chakrabarti [397]used a two-dimensional Lebwohl–Lasher model in a complex tortuous model of Vycor glassto show that the ordered phase breaks into many nematic domains with independent directors,as argued from experimental studies. Measurements of the order parameter relaxation in thisstudy were consistent with predictions based on random-field models.
Most molecular simulations of liquid crystals have used the Gay–Berne potential [103]to model the fluid. The liquid crystal in contact with a graphite surface has been shown tohave a highly ordered surface layer oriented normal to the surface, while the second and higherlayers are much less strongly ordered [276]. In addition, the rate at which the surface-inducedorder decays away from the surface depends on the orientation of the bulk nematic director.

Phase separation in confined systems 1637
Figure 44. (T ,X1) phase diagrams for the symmetric LJ system and asymmetric systems #1, #2and #3. These have values ofε2w/ε1w of 3.0, 2.3 and 1.67, respectively. Points are simulation data(except for the estimated critical points) and curves are fits to the Ising lattice-gas form. Reproducedfrom [108].
Wall and Cleaver [377] studied the Gay–Berne fluid between two graphite-like walls withanisotropic substrate–fluid potentials, and found that the surface layers tilted slightly; this tiltwas propagated through the entire film. At lower temperatures layered (smectic) structureswere observed and the tilt angle changed considerably to accomodate this; the degree of tilt inthe smectic phases was found to be dependent on the strength of the surface–fluid interactions,which was not the case for the nematic fluids. Gruhn and Schoen [124,125] studied a confinedfluid given by a modified Gay–Berne potential with a different pore–wall model and manydifferent pore widths, showing that the normal stress (across the pore) changed in a complexoscillatory sequence as the pore width was increased, due to changes in the number of smecticlayers and the compression (axial tilt) of each layer.
6. Freezing
Improved understanding of confinement effects on freezing are essential in areas relating tolubrication, adhesion and fabrication of nanomaterials and nanotribology. In addition, thesestudies can provide insight into mechanisms involved in frost heaving and distribution ofpollutants in soils. Freezing in porous media has been widely employed in the characterizationof porous materials. In the method termed thermoporometry, the shift in freezing temperatureof water is determined, and the PSD is inferred from a thermodynamic analysis which isanalogous to the use of Kelvin equation for capillary condensation.
In this section we focus on theoretical and experimental studies of freezing and melting

1638 L D Gelb et al
behaviour in completely filled, well-characterized porous systems. Various experimentaltechniques used to measure freezing temperature as well as structure of the condensed phasesinside pores are briefly described. The effect of pore size and the nature of the fluid–wallinteraction, as well as various methods to calculate the free energy of the confined phases,are discussed. Other important aspects of freezing in confined systems that are not discussedin this review include freezing of monolayers on a substrate, commensurate–incommensuratephase transitions, freezing of quantum fluids, and solid–solid transitions in pores. Some ofthese topics warrant separate reviews by themselves and are discussed elsewhere [18,127,321].We note that DFT has been widely successful in addressing freezing transitions in the bulk.However, little progress has been made in extending this to freezing of confined fluids. Someof the early attempts in this direction are reviewed by Henderson [140].
6.1. Experiments on freezing/melting
Freezing of oxygen in sol–gel glasses was studied by Warnocket al [379] by a sub-picosecondoptical technique. In this method, the optical pump pulses were used to create a birefringence,that occurred due to the rotational motion of the molecules in the liquid, and the subsequentmolecular orientational relaxation time was measured. A change in the value of the relaxationtime was used as an indicator of the freezing temperature. The freezing temperature in theconfined system was always depressed as compared with the bulk; the shift was larger forsmaller pores, and as large as 10 K for the smallest (20 nm) pore (figure 45). Unruhet al [364]examined the melting behaviour of indium metal in porous silica glasses by differentialscanning calorimetry (DSC) measurements, and reported a large depression in melting pointdue to confinement (see figure 45). Other experiments that used porous silica glass as theconfinement medium also found a decrease in the freezing temperature,Tf , as compared withthe bulk [36,74,129,186,240,245,272,335,339,342,350,358].
The simplest way to understand this behaviour is through a classical thermodynamicargument that determines the freezing temperature,Tf , as the point at which the chemicalpotential of the solid core inside the pore equals that of the surrounding fluid†. The shift inthe chemical potential due to the presence of the pore wall can be determined along the samelines of the Kelvin equation for gas–liquid condensation [260]. It is then easy to show that(see, e.g., [82]),
1Tf
Tfb= −2
(γws − γwl)νHλfb
(26)
whereTfb is the bulk freezing temperature,γws andγwl are the corresponding wall–solidand wall–fluid surface tensions,ν is the molar volume of the liquid,λfb is the latent heat ofmelting in the bulk andH is the pore width. Equation (26) is sometimes referred to as theGibbs–Thomson equation. The sign of1Tf = Tf − Tfb depends on whether the walls preferthe solid or the liquid, i.e. whetherγws is greater or less thanγwl . The observed depressionin the melting temperatures varied as 1/H in the above-mentioned studies, and were thusconsistent with equation (26) down to pore sizes as low as 6 nm (figure 45). However, thistype of classical thermodynamic argument breaks down for small pores, for reasons that areanalogous to those that lead to the breakdown of the Kelvin equation (section 3.2.1).
One can go further along the same lines to show that the latent heat of the confined solidis related to that of the bulk solid by
λfp = Tf
Tf bλf b. (27)
† Other approaches that lead to the same equation involve balancing the bulk, surface and interfacial components ofthe excess free energy (see [379]).

Phase separation in confined systems 1639
Figure 45. Shift in freezing temperature from experiment: O2 in sol–gel glass [379], indium inCPG [364], cyclohexane between mica plates in a surface force apparatus [180], CCl4 in CPG [335].The dashed lines are a guide to the eye.
Unruh et al [364] and Molzet al [240] reported latent heat measurements in the confinedsystems that were less than the bulk values, but the magnitude ofλfp was much less than thevalue predicted by equation (27). For example, in the case of indium in silica, the latent heat inthe bulk is 28.5 J g−1 and the latent heat in an 8.2 nm pore glass was measured to be 10.2 J g−1,while that predicted by equation (27) is 26.3 J g−1. These differences were attributed to thepremise that, in a pore the first few molecular layers close to the pore wall (contact layer)remained amorphous, while the interior froze to a crystalline form.
There have been experimental reports that investigated the structure of the confinedphases through NMR and x-ray diffraction techniques, that corroborate the above hypothesis.Overloop and Gervan [272] studied freezing of water in porous silica using NMR, and theysuggest that in the confined solid phase up to three molecular layers adjacent to the pore wall(which they term ‘bound water’) have a structure that is different from the crystal phase andfrom that of the free liquid. The rest of the water molecules in the pore interior were in the formof cubic ice (Ic) and the freezing temperatures were consistent with equation (26). The studyalso indicated a distribution of the molecular correlation times associated with translation androtation in the bound water phase, with the values lying in a range that was inbetween the liquidand the crystal phases. Morishige and co-workers [244, 245] used x-ray diffraction to studywater in siliceous MCM-41 having a range of pore sizes, and also confirmed the existence ofa disordered layer of water molecules near the pore wall, with the inner region being the Ic
phase. Morishige and Kawano [244] also studied water in Vycor glass and found evidence forboth the cubic Ic phase as well as the ordinary hexagonal (Ih) phase. Bakeret al [9] studied thenucleation of ice in sol–gel silicas and MCM-41 and found that the crystal structure dependsstrongly on the conditions and nature of the porous material, showing characteristics of both Ih
and Ic forms. X-ray diffraction studies of water in activated carbons suggested an increase
1640 L D Gelb et al
in the freezing temperature due to confinement [153, 154]. Morishige and Kawano [244]have reviewed other experimental studies of the freezing/melting behaviour of water in poroussilicas and glasses.
In a recent study, Booth and Strange [36] examined the melting of cyclohexane in poroussilica using the NMR technique. The melting temperature was below the bulk melting point,and in the confined solid phase there were two distinct components of the transverse relaxationtime. The short component (15–30µs, comparable with the crystal phase in the bulk) wasattributed to the crystal phase in the interior of the pore, and the long component was attributedto a liquid-like contact layer. Further lowering of temperature led to the freezing of the surface(contact) layer as well.
Sliwinska-Bartkowiaket al [335] attempted to characterize the melting/freezing transitionfor a dipolar fluid, nitrobenzene confined in CPG of different pore sizes, using DSC anddielectric relaxation spectroscopy. The depression in the melting temperature followedequation (26) for pore sizes larger than 7.5 nm; however, significant deviation was observed fora smaller pore width. The results from both experiments were in good agreement. The authorsalso made a quantitative estimate of the rotational relaxation time in the fluid and crystal phasesby fitting the complex permittivityε∗ = ε′(ω)− iε′′(ω)measurements to the Debye dispersionequation. In addition to the liquid and crystal phase relaxation, a third relaxation componentwas observed, that supported the existence of a contact layer with dynamic properties that weremore liquid like than the inner layers as found in the previous studies.
The experiments described so far show a decrease in melting/freezing temperature in thepore, which seems to indicate that for the set of chosen fluids and porous materials, the wallalways prefers the liquid phase to the solid phase. Alternatively, this can be viewed as the fluid–wall interaction being weak relative to the fluid–fluid interaction. The term−2(γws−γwl)ν/Hin equation (26), can be interpreted as the difference between the actual wall–solid potentialenergy and the wall–solid potential energy, that would occur if the wall were made up of theadsorbed solid itself. Moreover, for this type of fluid–wall interaction, it appears that the firstfew layers of the confined solid phase melt at a temperature lower than the depressed meltingtemperature in the interior of the pore.
In view of this large body of experimental evidence for a decrease in the freezingtemperature due to confinement, it is tempting to assume that a decrease always occurs.However, in 1995 an experimental study of cyclohexane and octamethylcyclotetrasiloxane(OCTMS) between parallel mica surfaces in a surface force apparatus provided evidenceof an increasein freezing temperature in confined systems [180]. In this study, Klein andKumacheva start from a confined liquid phase and slowly reduce the separation between themica surfaces. At a separation close to about seven molecular diameters, the liquid freezesabruptly, which they monitor through viscosity measurements. At this separation the increasein the freezing temperature for cyclohexane was about 17 K (figure 45). Similar studies havebeen reported in a surface force apparatus (with mica surfaces) for linear alkanes [120, 146]and cyclohexane [181], and again show an increase in the freezing temperature. This increaseis believed to be due to strong attraction between the confined fluid molecules and potassiumin the mica surface. In a subsequent molecular simulation study of the effect of confinementon freezing of simple fluids in slit pores [238] it was shown thatTf was strongly affected bythe strength of the attractive forces between the fluid molecules and the walls (see section 6.2).For strongly attracting walls such as carbons, anincreasein Tf was predicted. Moreover,the increase inTf was predicted to be larger for slit than cylindrical pores [219]. Recently,experiments on the freezing of CCl4 in activated carbon fibres by Kaneko and co-workers [380],have indicated a large upward shift in freezing temperature of about 56 K in nanopores ofdiameter 0.7–1.2 nm (figure 46). Similarly, a large increase in the freezing temperature for
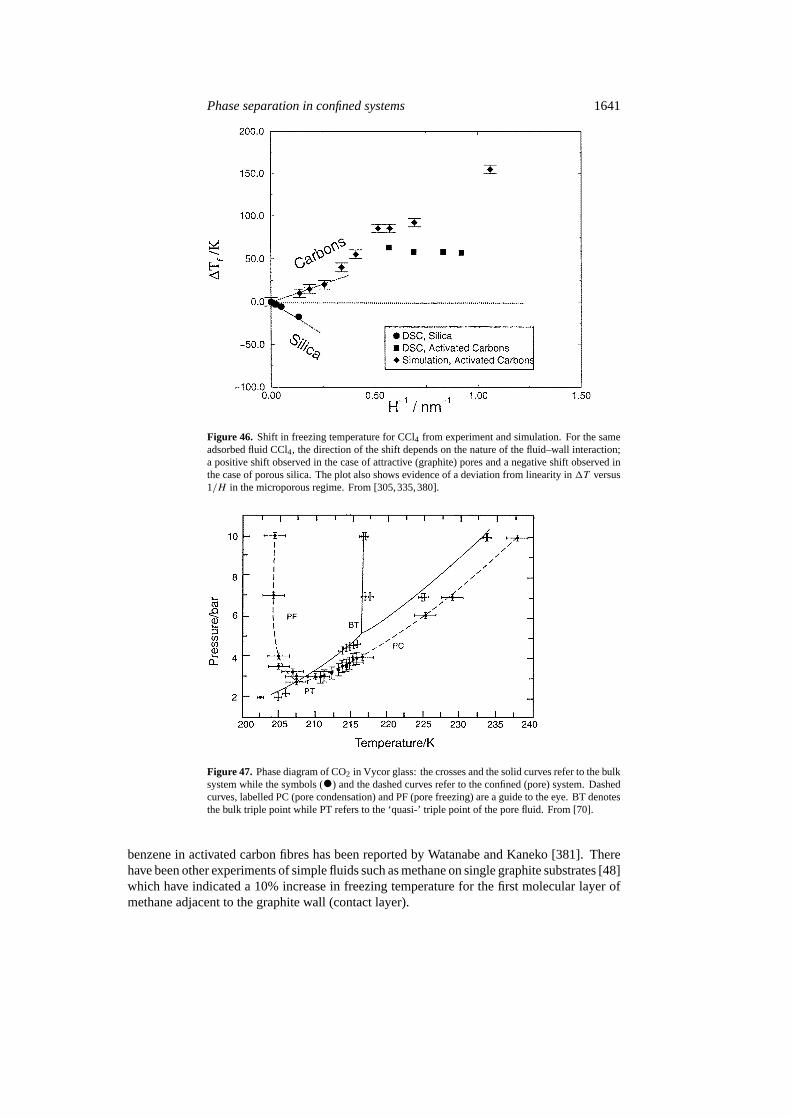
Phase separation in confined systems 1641
Figure 46. Shift in freezing temperature for CCl4 from experiment and simulation. For the sameadsorbed fluid CCl4, the direction of the shift depends on the nature of the fluid–wall interaction;a positive shift observed in the case of attractive (graphite) pores and a negative shift observed inthe case of porous silica. The plot also shows evidence of a deviation from linearity in1T versus1/H in the microporous regime. From [305,335,380].
Figure 47. Phase diagram of CO2 in Vycor glass: the crosses and the solid curves refer to the bulksystem while the symbols (•) and the dashed curves refer to the confined (pore) system. Dashedcurves, labelled PC (pore condensation) and PF (pore freezing) are a guide to the eye. BT denotesthe bulk triple point while PT refers to the ‘quasi-’ triple point of the pore fluid. From [70].
benzene in activated carbon fibres has been reported by Watanabe and Kaneko [381]. Therehave been other experiments of simple fluids such as methane on single graphite substrates [48]which have indicated a 10% increase in freezing temperature for the first molecular layer ofmethane adjacent to the graphite wall (contact layer).

1642 L D Gelb et al
The above studies did not attempt to determine a detailed phase diagram for the confinedfluid. However, Duffyet al [70] used the positronium annihilation spectroscopy to map outthe complete phase diagram (figure 47) for CO2 in Vycor glass with a mean pore diameterof 70 Å. The confinement shifts the liquid–solid transition to a considerably lower, and thegas–liquid transition to a considerably higher temperature than in the bulk. The triple pointis reduced both in pressure and temperature from that of the bulk. The positron annihilationspectroscopy studies, while providing information on the location of the phase transitions, donot provide any information on the microscopic structure of the confined solid phase. Brownet al [43] reported studies of the microscopic structure of the confined solid CO2 adsorbedin porous Vycor glass using x-ray diffraction. Their study concluded that the confined CO2
solidifies into crystallites with average dimensions of 160 Å, with a structure that is consistentwith thePa3structure (which is an fcc lattice with molecules oriented along the diagonals ofthe cubic lattice) of bulk CO2. The average crystallite size of the solid phase of the confinedCO2 is comparable with the pore dimensions in Vycor indicating that the solidification occursseparately in each of the pores. However the unit-cell size for the confined solid is larger thanwhat has been observed in the bulk at the same temperature, indicating a less dense solid in thepores. Also a significant amount of disorder was observed in the arrangement of the moleculeswhich could not be accounted for with the Debye–Waller effect.
6.2. Simulation studies: simple pore geometries
6.2.1. Melting and freezing studies.Schmidt and Lowen [324] studied the freezing of hardspheres confined between two parallel hard plates for various plate separations, interpolatingbetween two and three dimensions, using Monte Carlo simulation. The co-existence conditionswere obtained by identifying van der Waals loops in pressure versus density curves, and thenapplying a Maxwell construction. The full phase diagram for this model was mapped out forarbitrary density and plate separations lying between one and two sphere diameters (figure 48).The phase diagram is found to exhibit a rich structure with a fluid phase and many differentsolid phases of buckled, layered and rhombic crystalline structure. For the finite system sizesstudied, the freezing was found to be first order, which was followed by a further solid–solidtransition as the density was increased. Some of the solid–solid transitions were found to beweakly first order. These findings can be verified in principle, by performing experiments withcolloidal suspensions between parallel plates.
Detailed and systematic simulations aimed at qualitative comparison with the experimentaldata were made by Miyahara and Gubbins [238] who studied freezing in slit-shaped pores andMaddox and Gubbins [219] who studied freezing in cylindrical pores. The adsorbate was a LJfluid, and various pore sizes and choices of wall–fluid potential functions were investigated.Miyahara and Gubbins [238] used GCMC simulation, and found that for the case of LJ-methaneconfined in a hard wall pore the freezing temperature was significantly lower than in the bulk,whereas for strongly attracting walls (modelled on graphite), there was a significant increasein the freezing temperature (figure 49). In addition, the contact layers (the molecular layersadjacent to the two pore walls) behaved differently than the rest of the fluid. For example, thecontact layers appeared to freeze at a different temperature than the rest of the fluid in the pore;the freezing temperature was higher than that of the bulk material for the case of attractive walls,and lower for the case of repulsive walls. Maddox and Gubbins [219] used a novel simulationmethod that combined GCMC simulations with molecular dynamics for better relaxation ofthe displacement moves for LJ molecules in cylinders. They reached similar conclusionsabout the nature of the freezing-point shifts, but found important differences because of theincreased confinement in a cylindrical geometry. In particular, the additional confinement led

Phase separation in confined systems 1643
Figure 48. Simulated phase diagram for hard spheres of reduced densityρ between parallel plateswith effective reduced separationh. Hereh = (H −σ −σw)/σ , whereσ andσw are the diametersof the hard sphere and wall molecules, respectively, andH is the pore width as measured betweenthe planes through the centres of the atoms in the first layer of each opposing pore-wall. Six phasesoccur (fluid; 14: triangular lattice with one layer; b: crystalline structure of buckled lines; 2�:square lattice with two layers; r: rhombic phase; 24: triangular lattice with two layers). The closedpacked density is marked by a dashed line. Solid curves are guides to the eye. Thin horizontaltie-lines represent two-phase co-existence. From [324].
Figure 49. Shift in the freezing temperature from simulation. The symbols show the shift in thefreezing temperature of LJ methane in three different pores of pore widthH = 7.5 σ , σ beingthe LJ size parameter for methane. The attractive pore was modelled on graphite, the neutral poreconsisted of an artificial methane wall and the repulsive pore consisted of two hard plates. Thedashed lines are a guide to the eye. From [238].

1644 L D Gelb et al
to downward shifts in the freezing temperatures when compared with confinement in a slitgeometry. Miyaharaet al [239] also studied the effect of the pressure of the equilibrium gasphase on the melting temperature of the confined liquid phase using a innovative simulationsetup. They found that, while the solid–fluid co-existence line in aP–T diagram for theconfined system remained vertical above the bulk saturation pressures, there is significantvariation of the melting temperature with pressure for the confined system for pressures lowerthan the bulk saturation pressure, which is very different from what is observed for the bulksystem. This observation is consistent with the experimental report of the CO2 phase diagramin Vycor glass that was discussed earlier [70].
These simulation studies made use of pair correlation function and structure factor plots,together with snapshots of molecular configurations to monitor the freezing process. Thesewere also verified by applying the Hansen–Verlet criterion [130,308] and calculation of self-diffusion coefficients. The findings provide a detailed understanding of the freezing/meltingbehaviour observed in the experiments. However, a limitation of the simulation studies was thatthe precise location of the phase transition was not found. The freezing and melting displayedlarge hysteresis loops, and thus the location of the equilibrium freezing/melting point couldbe estimated only to the accuracy of the width of the hysteresis loops which often spanned10–30 K. The nature of the transition was also not clear, as the results of the behaviour insmaller pores suggested a continuous rather than a first-order transition. Answers to theseissues lie in a detailed and explicit calculation of the free energies of the phases involved inthe phase transition.
6.2.2. Free-energy methods.In an attempt to address the problem of locating the truetransition point, Dominguezet al[69] used thermodynamic integration [97] to calculate the freeenergy of the solid and fluid phases in the pore. This method involves a numerical integrationof the Gibbs free energy starting from a known reference phase (the Einstein crystal for thesolid phase and the ideal gas for the liquid phase) to the state point of interest. It relies onfinding a suitable path of integration which is thermodynamically reversible, i.e., the pathmust not intersect any phase boundary characterized by a first-order transition. The Gibbs freeenergy was calculated for the case of purely repulsive and weakly attractively pores and thelocation of the thermodynamic transition temperature was found. Their results also indicatedthat the transition was first order. In addition, the authors calculated the condensation line andmapped out the complete phase diagram for weakly attractive pores (figure 50). The behaviourof fluids in attractive and repulsive pores was found to be consistent with the study in Maddoxand Gubbins [238].
The free-energy study of Dominguezet al [69] was limited to confined systems withrepulsive or weakly attractive wall–fluid potentials. For the more ubiquitous case of a wall–fluid potential that is moderately or strongly attractive, this method breaks down. This isbecause the adsorbed molecules adjacent to the pore–wall (the contact layer) freeze before theadsorbed molecules in the interior of the pore. This makes it impossible to find a reversiblepath from the ideal gas phase to the fluid phase, since any such path runs into a first-ordertransition corresponding to the freezing of the contact layer.
To overcome this difficulty, Radhakrishnan and Gubbins [303] used a method based onan order parameter formulation to calculate the free energy. They used GCMC simulationson a system similar to that studied by Miyahara and Gubbins [238]. The method relies oncalculation of the Landau free energy as a function of an effective bond orientational orderparameter8. The Landau free energy can be defined through the equation [189],
3[8] = −kBT ln(P [8]) + constant (28)

Phase separation in confined systems 1645
Figure 50. Coexistence curves for confined and bulk LJ fluid in slit pores of widthH = 10σ .Note that for the pore,P denotes the normal pressurePz, whereas for bulk it is the bulk pressure.The symbols represent,
Bulk ◦ liquid–gas � liquid–solidRepulsive wall ♦ liquid–gas 4 liquid–solid N = 600Repulsive wall 5 liquid–gas + liquid–solid N = 300Weakly attractive wall × liquid–gas ∗ liquid–solid N = 300
whereN is the number of molecules used in the simulation. From [69].
whereP [8] is the probability of observing the system having an order parameter value between8 and8+δ8. The probability distribution functionP [8] is calculated in a GCMC simulationby collecting statistics of the number of occurrences of a particular value of8 in the form of ahistogram, with the help of umbrella sampling [359]. The grand free-energy�, is then relatedto the Landau free energy by,
exp(−β�) =∫
d8 exp(−β3[8]). (29)
This approach comes under the general classification of histogram re-weighting methodsdiscussed in section 2, and was first used to study solid–fluid transitions in the bulk by VanDuijneveldt and Frenkel [368] and Lynden-Bellet al [208]. It can be used sucessfully forthe case of strongly attractive walls, as well as weakly attractive and repulsive ones, andis not affected by phase changes in the contact layer. The method requires the choice ofan order parameter that is appropriate for the system of interest [303]. For example, for athree-dimensional system a combination of the spherical harmonics of the orientation of thenearest-neighbour bonds is suitable.
The Landau free-energy results of Radhakrishnan and Gubbins [303] for LJ methane in anattractive graphite pore showed that there are three phases for such a system (figure 51); phase Acorresponds to all the layers having a liquid structure (figure 52(a)), phase B corresponds to thecontact layers (the layers adjacent to the two pore walls) being frozen and the rest of the layershaving liquid structure (figure 52(b)), and phase C corresponds to all the layers being frozen. Aplot of the grand free energy for each phase as a function of temperature gave the freezing pointfor the contact layers as well as for the inner layers, and clearly indicated that both transitions

1646 L D Gelb et al
Figure 51. The Landau free energy as a function of the order parameter, for methane confinedin a graphite slit pore of width 7.5σ , for (a) T = 123 K, (b) T = 118 K, (c) T = 113 K and(d) T = 109 K; the relative depths of the minima indicate the stability of each phase. From [303].
were first order (figure 53). We note that the freezing temperature for LJ methane in the bulkis 101 K. Transition temperatures in the pore are well above this value. Radhakrishnan andGubbins also found strong evidence for a liquid to hexatic transition prior to freezing in the LJmethane/carbon system. They attributed the relatively weak first-order nature of the freezingtransition in this system to the large entropy loss associated with this liquid–hexatic transitionprior to freezing. The order parameter method can be applied to weakly attractive or purelyrepulsive walls [303]. In this latter case there is no evidence of a hexatic phase, and the freezingtransition is strongly first order.
The effect of the fluid–wall interaction on the freezing behaviour has been investigated fora slit pore model along with the ‘10–4–3’ Steele potential, by a systematic study of the Landaufree-energy surfaces as a function of the relative strengths of the fluid–wall to the fluid–fluidinteraction, given byα/εff = ρsεsf σ 2
sf1/εff in equation (14) [304]. For weak wall strengths,α/εff < 0.5, the Landau free-energy function showed just two minima, corresponding to aliquid and a solid phase, the intermediate phase being metastable. For intermediate wall

Phase separation in confined systems 1647
Figure 52. The two-dimensional, in-plane pair correlation function for each of the adsorbedmethane layers for theH = 7.5σ graphite slit pore at three different temperatures: (a) T = 130 K,corresponding to phase A; (b) T = 123 K, corresponding to phase B. Only four of the seven layersare shown because of the symmetry about the mid-plane. From [303].
strengths 0.5 < α/εff < 0.85 there are three phases, with the intermediate phase B havinga structure such that the contact layers are liquid like while the inner layers are crystalline.For strongly attractive pore walls,α/εff > 1.15, the intermediate phase B had frozen contactlayers and liquid-like inner layers (as in figure 52(b)). The LJ fluid confined in the slit poreshowed depression in the freezing temperature forα/εff < 0.85 and elevation in freezingtemperature forα/εff > 1.15. Radhakrishnanet al [304] used corresponding states theory tomap out a global phase diagram that predicts the phase behaviour and freezing temperaturesfor different fluids confined in different porous materials based on the effect of the fluid–wallinteractions.
Figure 54 summarizes the predictions of this theory for a variety of fluids. The fluid–fluidterms were determined from second virial coefficient data and the Lorentz–Berthelot mixingrule was invoked to calculate the fluid–wall parameters. For the case of polar molecules, onlythe dispersive part of the fluid–fluid interaction was used to obtain the fluid–wall parametersand the pore walls were assumed to be non-polarizable. Figure 54 predicts the phase behaviourof different fluids in model (slit shaped) silica and graphite pores. The structure of the confined

1648 L D Gelb et al
Figure 53. The grand free energy of the three phases A, B and C, as a function of temperaturefor LJ methane in the graphite slit pore ofH = 7.5σ . The cross-over pointsTA−B andTB−Ccorrespond to the two first-order phase transitions. The freezing temperature of LJ methane in thebulk is 101 K. From [303].
Figure 54. The global phase diagram, summarizing the freezing behaviour of different fluids inmodel silica and graphite slit pores of widthH = 7.5σ . The two dotted lines represent the boundarybetween the elevation and depression of the freezing temperature. From [304].
phase is given by the pair correlation function plots of the individual layers of the confinedphase. Such a classification can be used to estimate freezing temperature shifts and phasebehaviour of a fluid/pore system. However, one should bear in mind that, apart from the fluid–wall strength parameterα, other factors such as change in geometry (cylindrical instead of slitshaped pore) and surface polarizability of the pore walls will also contribute significantly tothe freezing behaviour.

Phase separation in confined systems 1649
Figure 55. The structure of water adsorbed in a slit carbon poreof width H = 3σ at T = 180 K under a loading pressure of1 Gpa, showing a distorted hexagonal lattice: (a) top view, (b)side view. From [183].
Kogaet al [183] have studied the freezing of water in hydrophobic nanopores by moleculardynamics simulation, using the TIP4P model for water and a weakly interacting, structurelesswall. They observed a bilayer ice formation by controlling the pressure normal to the pore walls.The bilayer ice crystal is characterized by a hydrogen-bonding network of water molecules,each layer forming a distorted hexagonal lattice (figure 55). However, the study only focusedon the approximate bounds for the free energies of the condensed phases.
6.3. Simulation studies: complex pore geometries
One of the first efforts in studying the effects of surface epitaxy on phase behaviour [313]considered a slit pore model with the pore wall atoms arranged on a fcc lattice. The nature ofthe confined phase (whether a liquid or solid) was found to depend on whether the top wallsurface was ‘in’ or ‘out’ of registry with the bottom surface. It was also found that, for thesame number of layers in the confined phase, pore widths below a critical value did not supporta solid phase, that is, below a certain value of inter-layer separation, the solid phase was notstable. Similarly, under conditions that supported a confined solid phase [61], moving the topplate such that the configuration goes from ‘out’ of registry to ‘in’ registry, melts the solidphase. This observation was also confirmed by other studies modelling the shear behaviour ina surface force apparatus, in which the ‘stick–slip’ behaviour was attributed to shear-inducedmelting transitions [207,356].
The freezing of simple fluids in a corrugated pore model that consisted of a slit pore withrectangular grooves carved out of one of the surfaces exhibits a rich phase behaviour thatdepends on the width of the pore, width of the groove and depth of the groove [61]. Over a

1650 L D Gelb et al
Figure 56. Local density profilesρ(1)(z), in-plane pair correlation functionsg(2) and snapshotsof the configuration of LJ molecules in a ‘grooved’ slit pore. The shaded spheres represent thewall atoms (the grey and the black spheres represent alternate rows of an fcc lattice), and theopen spheres represent the adsorbed molecules. The parameterα defines the lateral allignment or‘registry’ of the opposing pore walls, (α = 0: the walls are precisely in registry,α = 0.5: thewalls are completely out of registry). The dashed and the solid curves represent the profiles forfluid adsorbed in the narrow region and the wide region of the pore, respectively. From [61].
range of registries and groove depth, the confined phase consisted of fluid and solid portionsin equilibrium, i.e., fluid filled nanocapillaries separated by solid strips (figure 56).
The effect of the presence of active sites on the adsorbent surface was briefly addressedby Vishnyakovet al [372] for graphitic slit pores. The authors considered several models forgraphitic pores with varying pore widths and different densities of NH2, CH = O, CH3OHgroups on a graphitic surface to model anthracite. The freezing temperature was found to bestrongly dependent on the nature and the density of the active sites present.
6.4. Freezing versus glass transition
In general, one must exercise care in interpreting freezing inside pores. Experiments suchas differential scanning calorimetry do not give any information on the structure of theconfined phase. It is also difficult to use diffraction methods to characterize the structureof the confined phase, because of the presence of the additional signal due to the adsorbentmolecules. Spectroscopic methods such as NMR and dielectric relaxation spectroscopyare useful under these circumstances, as they yield information about the translational andorientational relaxation time of the molecules in the confined phase. For example, in the studyof freezing of O2 in sol–gel glasses [379], the orientational relaxation timeτ of moleculeswas measured as a function ofT and a sharp drop inτ (about four orders of magnitude)was observed at the transition. A similar measurement for a glass transition would show acontinuous change from liquid phase to glass phase relaxation times.
In computer simulation studies of freezing in confined geometries, it is possible todirectly measure the pair correlation function to monitor the freezing process. However,for finite system size even a glassy phase can display extended positional correlations [52].An additional measure of the self-diffusion coefficient often provides a distinction between afreezing transition and a glass transition. Free-energy calculations are very useful, as the natureof the phase transition can be inferred directly. The order parameter provides a direct measureof the difference in bond orientational order between the ordered and disordered phase. Thus,

Phase separation in confined systems 1651
for the case of a glass transition, the minimum in the Landau free-energy curve at the value ofthe order parameter corresponding to the crystalline phase would be absent, unlike figure 51.
The glass transition in a porous medium is an interesting topic in its own right. There havebeen a number of studies that have investigated the effect of confinement on glass-formingorganic liquids [296,297,329,330]. It is well established that the glass transition temperatureTgof a liquid inside a porous glass is shifted by1Tg, the sign and extent of which is materialspecific, just as for the case of freezing. Dielectric relaxation studies have indicated a slowerrelaxation process in the confined liquid as compared with the bulk, and the appearance ofan additional relaxation component due to the contact layer, consistent with the studies onfreezing. However, unlike freezing, there seems to be no general basis to explain the nature ofthe shift in1Tg.
7. Conclusions
There has been a considerable advance in our understanding of phase equilibria and separationin model pores of simple geometry, particularly cylindrical and slit-shaped pores, over the lastdecade. Capillary condensation and layering transitions have been extensively investigated.Less work has been done on liquid–liquid equilibria and freezing in such systems, but a clearerpicture of these phenomena is also beginning to emerge. Little work seems to have beenreported on the effects of confinement on phase equilibria for mixtures, other than that forliquid–liquid separations.
The relationship between this rather large body of theoretical work and the behaviour ofadsorbates in real porous materials remains unclear. All experimental materials possess somedegree of heterogeneity in the pores (an exception is the surface force apparatus), and it is noteasy to distinguish effects of chemical and geometric heterogeneity. On the modelling side,there is a need now to develop better models for such materials, and to use these to gain a betterunderstanding of phase equilibria in real materials. Examples of steps in this direction werediscussed in section 3.3 for the case of capillary condensation. The need for better modelsis particularly acute for the amorphous porous materials, such as activated carbons, aerogelsand oxides. In some cases it may be possible to mimic the manufacturing process (as in thecase of the CPGs discussed in section 3.3). In others, such as the activated carbons, this willbe difficult or impossible because of the complexity of the processes involved; nevertheless,it may prove possible to simulate the final stages of manufacture and thus produce structuresthat more closely resemble the real materials.
On the experimental side there is a continuing need to develop more well-characterizedmaterials in which it is possible to control and vary the pore size in the manufacturing process.Better ways to characterize such materials are needed. Many of the standard methods used toestimate pore sizes, pore volumes and surface area are more than 50 years old, and in somecases are known to be seriously in error for pore sizes below a few nanometres. Hopefully,improved methods for interpreting experimental data will emerge from improved models ofthe type discussed in the previous paragraph.
A persistent problem in this field has been the difficulty of bringing experiment and theorytogether in a fruitful way, a result of the difficulty of characterization of materials on the experi-mental side, combined with the difficulty of developing adequate models for use in the theoriesand simulations. We hope that this situation will gradually improve as increased computationalpower makes more sophisticated models a reality, and as new materials become available.
1652 L D Gelb et al
Acknowledgments
It is a pleasure to thank M Endo, S Hyde, K Kaneko and L C Rainey for providing electronmicrograph figures of porous materials. We are grateful for support of our work by the NationalScience Foundation (grant no CTS-9896195), the Department of Energy (grant no DE-FG02-98ER14847), and KBN (grant no 2-PO3B-17508). Supercomputer time was provided undera NSF/NPACI grant (no MCA93S011P). LDG thanks the National Science Foundation for aCISE postdoctoral award (grant no ACI-9896107). International cooperation was aided by agrant from the US–Poland Maria Sklodowska–Curie Joint Fund (no MEN/DOE-97-314).
References
[1] Adams D J 1975Mol. Phys.29307–11[2] Ajayan P M 1996Carbon Nanotubes: Preparation and Propertiesed T W Ebbesen (Boca Raton, FL: Chemical
Rubber Company)[3] Albano E V, Binder K, Heerman D W and Paul W 1992PhysicaA 183130–47[4] Allen M P and Tildesley D J 1987Computer Simulation of Liquids(Oxford: Clarendon)[5] Alvarez M, Levesque D and Weiss J-J 1999Phys. Rev.E 60at press[6] Asada H 1990Surf. Sci.230323–8[7] Attard G S, Glyde J C and Goltner C G 1995Nature378366[8] Bailey A E, Frisken B J and Cannell D S 1997Phys. Rev.E 563112–18[9] Baker J M, Dore J C and Behrens P 1997J. Phys. Chem.B 1016226
[10] Balbuena P B and Gubbins K E 1992Fluid Phase Equilib.7621–35[11] Balbuena P B and Gubbins K E 1993Langmuir9 1801–14[12] Balbuena P B and Gubbins K E 1994Characterization of Porous Solids III (Studies in Surface Science and
Catalysis vol 87)ed J Rouquerolet al (Amsterdam: Elsevier) pp 41–50[13] Ball P C and Evans R 1988J. Chem. Phys.894412[14] Ball P C and Evans R 1989Langmuir5 714–23[15] Bansal R C, Donnet J B and Stoeckli H F 1988Active Carbon(New York: Dekker)[16] Barber M N 1983Phase Transitions and Critical Phenomenavol 8, ed C Domb and J L Lebowitz (London:
Academic) ch 2, pp 145–475[17] Baumgartner A and Muthukumar M 1996Adv. Chem. Phys.vol XCIV, ed I Prigogine and S A Rice (New York:
Wiley) pp 625–708[18] Beamish J R, Hikata A, Tell L and Elbaum C 1983Phys. Rev. Lett.50425[19] Beck J Set al 1992J. Am. Chem. Soc.11410 834[20] Bennett C H 1976J. Comput. Phys.22245–68[21] Berendsen H J C,Postma J P M, vanGunsteren W F, DiNiola A and Haak J R 1984J. Chem. Phys.813684–90[22] Berg B A and Neuhaus T 1991Phys. Lett.B 267249[23] Berg B A and Neuhaus T 1992Phys. Rev. Lett.689–12[24] Bienfait M 1987Europhys. Lett.4 79–84[25] Bienfait M, Gay J M and Blank H 1988Surf. Sci.204331–44[26] Bienfait M, Zeppenfeld P, Gay J M and Palmari J P 1990Surf. Sci.226327–38[27] Biggs M and Agarwal P 1992Phys. Rev.A 463312[28] Biggs M and Agarwal P 1995Phys. Rev.E 49531–7[29] Binder K 1990Finite Size Scaling and Numerical Simulation of Statistical Systemsed V Privman (Singapore:
World Scientific) ch 4, pp 173–221[30] Binder K and Landau D P 1988Phys. Rev.B 371745[31] Binder K and Landau D P 1992J. Chem. Phys.961444–54[32] Bock H and Schoen M 1999Phys. Rev.E 594122–36[33] Bojan M J, Cheng E, Cole M W and Steele W A 1996Adsorption2 51–8[34] Bojan M J, Stan G, Curtarolo S, Steele W A and Cole M W 1999Phys. Rev.E 59864–73[35] Bojan M J and Steele W A 1993Proc. 4th Int. Conf. on Fundamentals of Adsorptioned M Suzuki (Tokyo:
Kodansha) pp 51–8[36] Booth H F and Strange J H 1998Mol. Phys.93263[37] Branton P J, Hall P G and Sing K S W1993J. Chem. Soc., Chem. Commun.1257–8

Phase separation in confined systems 1653
[38] Branton P J, Hall P G, Sing K S W,Reichert H, Schuth F and Unger K K 1994J. Chem. Soc., Faraday Trans.902965
[39] Branton P J, Sing K S W andWhite J W 1997J. Chem. Soc., Faraday Trans.932337–40[40] Brennan J K and Dong W 1999J. Chem. Phys.submitted[41] Brochard F and De Gennes P G 1983J. Physique Lett.44L785–91[42] Brown A J, Burgess C G V, Everett D H and Nuttall S 1997Characterization of Porous Solidsvol IV, ed
T J McEnaneyet al (Cambridge: Royal Society of Chemistry) pp 1–8[43] Brown D W, Sokol P E, Clarke A P, Alam M A and Nuttall W J 1997J. Phys.: Condens. Matter9 7317–25[44] Bruno E, Marini Bettolo Marconi U and Evans R 1987PhysicaA 141187[45] Bryk P, Patrykiejew A, Reszko-Zygmunt J and Sokolowski S 1999Mol. Phys.961509–16[46] Burgess C G V, Everett D H and Nuttall S 1989Pure Appl. Chem.611845–52[47] Cascarini de Torre L E, Bottani E J and Steele W A 1996Langmuir125399–406[48] Castro M A, Clarke S M, Inaba A and Thomas R K 1997J. Phys. Chem.B 1018878[49] Chiarello R, Coulomb J P, Krim J and Wang C L 1988Phys. Rev.B 388967–73[50] Chiccoli C, Lavrentovich O D, Pasini P and Zannoni C 1997Phys. Rev. Lett.794401–4[51] Chmiel C, Karykowski K, Patrykiejew A, Rzysko W and Sokolowski S 1994Mol. Phys.81691[52] Chokappa D K and Clancy P 1987Mol. Phys.61617[53] Cleaver D J and Allen M P 1993 Computer simulation of liquid crystal filmsMol. Phys.80253–76[54] Cole M W, Crespi V H, Stan G, Hartman J M, Moroni S and Boninsegni M 1999Phys. Rev. Lett.submitted[55] Cracknell R F, Gubbins K E, Maddox M W and Nicholson D 1995Accs. Chem. Res.28281–8[56] Cracknell R F, Koh C A, Thompson S M and Gubbins K E 1993Mat. Res. Soc. Symp. Proc.290135–46[57] Cracknell R F, Nicholson D and Quirke N 1993Mol. Phys.80885–97[58] Cracknell R F, Nicholson D, Tennison S R and Bromhead J 1996Adsorption2 193–203[59] Crawford G P, Steele L M, Ondris-Crawford R, Iannachhione G S, Yeager C J, Doane J W and Finotello D
1992J. Chem. Phys.967788–96[60] Csathy G A, Tulimieri D, Yoon J and Chan M H W 1998Phys. Rev. Lett.804482–5[61] Curry J E, Zhang F, Cushman J H, Schoen M and Diestler D J 1994J. Chem. Phys.10110 824–32[62] Curtarolo S, Stan G, Cole M W, Bojan M J and Steele W A 1999Phys. Rev.E 594402–7[63] Dadmun M D and Muthukumar M 1993J. Chem. Phys.984850–2[64] DeKeizer A, Michalski T and Findenegg G H 1991Pure Appl. Chem.631495[65] Derjaguin B V 1940Zh. Fiz. Khim.40137 (Engl. transl.Acta. Phys. Chem.12181)[66] De Gennes P G 1984J. Phys. Chem.886469–72[67] De Miguel E, del Rio E M and Telo de Gama M M 1995J. Chem. Phys.1036188–96[68] De Oliveira M J and Griffiths R B 1978Surf. Sci.71687–94[69] Dominguez H, Allen M P and Evans R 1998Mol. Phys.96209–29[70] Duffy J A, Wilkinson N J, Fretwell H M, Alam M A and Evans R 1995J. Phys.: Condens. Matter7 L713[71] Ebbesen T W 1997Carbon Nanotubes(Boca Raton, FL: Chemical Rubber Company)[72] Ebner C 1981Phys. Rev.A 231925[73] Ebner C 1983Phys. Rev.B 282890[74] Elder K J, Reynolds P A, Trouw F and White J W 1996J. Chem. Soc. Chem. Commun.155[75] Entov L V, Levchenko V A and Voronov V P 1993Int. J. Thermophys.14221–9[76] Escobedo F A and de Pablo J J 1999Phys. Rep.31885–112[77] Evans R 1979Adv. Phys.28143[78] Evans R 1990Liquids at Interfaces (Les Houches Session XLVIII)ed J Charvolin, J Joanny and J Zinn-Justin
(Amsterdam: Elsevier)[79] Evans R 1990J. Phys.: Condens. Matter2 8989–9007[80] Evans R 1992Fundamentals of Inhomogeneous Fluidsed D Henderson (New York: Dekker) ch 5[81] Evans R and Marini Bettolo Marconi U 1985Chem. Phys. Lett.114415[82] Evans R and Marini Bettolo Marconi U 1987J. Chem. Phys.867138–48[83] Evans R, Marini Bettolo Marconi U and Tarazona P 1986J. Chem. Soc. Faraday Trans.2 1763–87[84] Evans R, Marini Bettolo Marconi U and Tarazona P 1986J. Chem. Phys.842376–99[85] Fan Y and Monson P A 1993J. Chem. Phys.996897[86] Ferrenberg A M, Landau D P and Swendsen R H 1995Phys. Rev.E 515092–100[87] Ferrenberg A M and Swendsen R H 1988Phys. Rev. Lett.612635–8[88] Ferrenberg A M and Swendsen R H 1989Phys. Rev. Lett.631195–8[89] Feuston B P and Garofalani S H 1988J. Chem. Phys.895818[90] Findenegg G H, Gross S and Michalski T 1994Characterization of Porous Solids III (Studies in Surface Science
and Catalysis vol 87)ed J Rouquerolet al (Amsterdam: Elsevier)
1654 L D Gelb et al
[91] Finn J E and Monson P A 1989Phys. Rev.A 396402–8[92] Finotello D, Gillis K A, Wong A and Chan M H W 1988Phys. Rev. Lett.611954–7[93] Fisher L R and Israelachvili J N 1981J. Colloid Interface Sci.80528[94] Fisher M and Nakanishi H 1981J. Chem. Phys.755857–63[95] Forsman J and Woodward C E 1999Mol. Phys96189–200[96] Franck C 1992Fundamentals of Inhomogeneous Fluidsed D Henderson (New York: Dekker) pp 277–302[97] Frenkel D and Ladd A J C1984J. Chem. Phys.813188[98] Frenkel D and Smit B 1996Understanding Molecular Simulation(New York: Academic)[99] Frisken B J and Cannell D S 1992Phys. Rev. Lett.69632–5
[100] Frisken B J, Cannell D S, Lin M Y and Sinha S K 1995Phys. Rev.E 515866–79[101] Frisken B J, Ferri F and Cannell D S 1995Phys. Rev.E 515922–43[102] Gaucher H, Grillet Y, Beguin F, Bonnamy S and Pellenq R J M1998 ed F MeunierFundamentals of Adsorption
vol 6 (Paris: Elsevier) pp 243–8[103] Gay J G and Berne B J 1981J. Chem. Phys.743316–19[104] Gay J M, Suzanne J and Coulomb J P 1990Phys. Rev.B 4111 346–51[105] Gelb L D 1994Phys. Rev.B 5011 146–50[106] Gelb L D and Gubbins K E 1997Phys. Rev.E 563185–96[107] Gelb L D and Gubbins K E 1997Phys. Rev.E 551290R[108] Gelb L D and Gubbins K E 1997PhysicaA 244112–23[109] Gelb L D and Gubbins K E 1998Langmuir142097–111[110] Gelb L D and Gubbins K E 1999Langmuir15305–8[111] Gelb L D and Gubbins K E 1999 in preparation[112] Gelb L D and Lynden-Bell R M 1994Phys. Rev.B 492058–66[113] Givens J A and Stell G 1992J. Chem. Phys.974573–4[114] Givens J A and Stell G 1993Condensed Matter Theoriesvol 8, ed L Blum and F B Malik (New York: Plenum)
pp 395–410[115] Givens J A and Stell G 1994PhysicaA 209495–510[116] Goldburg W I, Aliev F and Wu X-I 1995PhysicaA 21361–70[117] Goltner C G and Antonietti M 1997Adv. Mater.9 431[118] Gonzalez A, White J A, Roman F L, Velasco S and Evans R 1997Phys. Rev. Lett.792466–9[119] Gozdz W T, Gubbins K E and Panagiotopoulos A Z 1995Mol. Phys.84825–34[120] Granick S 1991Science2531374[121] Gray C G and Gubbins K E 1984Theory of Molecular Fluids(Oxford: Clarendon) ch 2 and appendix C[122] Gregg S J and Sing K S W1982Adsorption, Surface Area and Porosity(London: Academic)[123] Gross S and Findenegg G 1997Ber. Bunsenges. Phys. Chem.1011726–30[124] Gruhn T and Schoen M 1997Phys. Rev.E 552861–75[125] Gruhn T and Schoen M 1998J. Chem. Phys.1089124–36[126] Gubbins K E 1997Physical Adsorption: Experiment, Theory and Applicationsed J Fraissard (Dordrecht:
Kluwer) pp 65–103[127] Gubbins K E, Sliwinska-Bartkowiak M and Suh S-H 1996Mol. Simul.17333–67[128] Haller W 1983Solid Phase Biochemistryed W H Scouten (New York: Wiley) ch 11, pp 535–97[129] Hansen E W, Stoker M and Schmidt R 1996J. Phys. Chem.1002195[130] Hansen J P and Verlet L 1969Phys. Rev.184151[131] Hanzawa Y, Kaneko K, Pekala R W and Dresselhaus M SLangmuir126167–9[132] Hanzawa Y, Kaneko K, Yoshizawa N, Pekala R W and Dresselhaus M S 1998Adsorption4 187–95[133] Hanzawa Y, Yoshizawa T and Kaneko K 1998 Private communication[134] Hastings W K 1970Biometrika5797–109[135] Heffelfinger G S, Tan Z, Gubbins K E, Marini Bettolo Marconi U and Van Swol F 1988Int. J. Thermophys.9
1051–60[136] Heffelfinger G S, Tan Z, Gubbins K E, Marini Bettolo Marconi U and Van Swol F 1989Mol. Simul.2 393–411[137] Heffelfinger G S, Van Swol F and Gubbins K E 1987Mol. Phys.611381–90[138] Heffelfinger G S, Van Swol F and Gubbins K E 1988J. Chem. Phys.895202–5[139] Henderson D 1992J. Chem. Phys.971266–70[140] Henderson D 1992Fundamentals of Inhomogeneous Fluids(New York: Dekker)[141] Henderson D and Plischke M 1992J. Chem. Phys.977822–4[142] Henderson J R 1994Phys. Rev.E 504836–46[143] Hess G B 1991Phase Transitions in Surface Filmsvol 2, ed H Taubet al (New York: Plenum) pp 357–89[144] Hill T L 1956Statistical Mechanics, Principles and Selected Applications(New York: McGraw-Hill) ch 7

Phase separation in confined systems 1655
[145] Hoover W G 1985Phys. Rev.A 311695–7[146] Hu H W, Carson G A and Granick S 1991Phys. Rev. Lett.662758[147] Huang K 1963Statistical Mechanics2nd edn (New York: Wiley)[148] Hunter J E III and Reinhardt W P 1995J. Chem. Phys.1038627–37[149] Hyde S 1993 Private communication[150] Iannachione G S, Crawford G P, Qian S, Doane J W and Finotello D 1996Phys. Rev.E 532402–11[151] Iannachione G S, Crawford G P,Zumer S, Doane J W and Finotello D 1993Phys. Rev. Lett.712595–8[152] Iannachione G S, Qian S, Finotello D and Aliev F M 1997Phys. Rev.E 56554–61[153] Iiyama T, Nishikawa K, Otowa T and Kaneko K 1995J. Phys. Chem.9910 075[154] Iiyama T, Nishikawa K, Suzuki T and Kaneko K 1997Chem. Phys. Lett.274152[155] Iler R K 1979The Chemistry of Silica(New York: Wiley)[156] IUPAC 1985International Committee for Characterization and Terminology of Carbon20445
IUPAC 1985International Committee for Characterization and Terminology of Carbon21517IUPAC 1985International Committee for Characterization and Terminology of Carbon23601
[157] Jagiello J and Tolles D 1998 ed F MeunierFundamentals of Adsorptionvol 6 (Paris: Elsivier) pp 629–34[158] Jayanthi C S 1991Phys. Rev.B 44427[159] Jerome B 1991Rep. Prog. Phys.54391–451[160] Jiang S and Gubbins K E 1995Mol. Phys.86599–612[161] Jiang S, Gubbins K E and Balbuena P B 1994J. Phys. Chem.982403–241[162] Jiang S, Rhykerd C L and Gubbins K E 1993Mol. Phys.79373–91[163] Kahng J and Ebner C 1989Phys. Rev.B 4011 269[164] Kaminsky R D and Monson P A 1991J. Chem. Phys.952936–48[165] Kaminsky R D and Monson P A 1994Langmuir10530–7[166] Kaminsky R D and Monson P A 1994Chem. Engng Sci.492967–77[167] Kaneko K 1998Adsorption and its Application to Industry and Environmental Protection: Surface Science
and Catalysis 120Bvol II, ed A Dobrowski (Amsterdam: Elsevier)[168] Keblinski P, Ma W-J, Maritan A, Koplik J and Banavar J R 1993Phys. Rev.E 47R2265–8[169] Kellay H, Bonn D and Meunier J 1993Phys. Rev. Lett.712607[170] Kierlik E and Rosinberg M 1990Phys. Rev.A 423382–7[171] Kierlik E and Rosinberg M 1991Phys. Rev.A 445025–37[172] Kierlik E, Rosinberg M L, Tarjus G and Monson P A 1996J. Phys.: Condens. Matter8 9621–5[173] Kierlik E, Rosinberg M L, Tarjus G and Monson P A 1998 ed F MeunierFundamentals of Adsorptionvol 6
(Paris: Elsevier) pp 867–72[174] Kierlik E, Rosinberg M L, Tarjus G and Pitard E 1998Mol. Phys.95341–51[175] Kim H K, Feng Y P, Zhang Q M and Chan M H W1988Phys. Rev.B 371745–65[176] Kim S B, Ma J and Chan M H W 1993Phys. Rev. Lett.712268–71[177] Kim Y W, Kim S C and Suh S H 1999J. Chem. Phys.1101230–4[178] Kjellander R and Sarman S 1990Mol. Phys.70215–37[179] Kjellander R and Sarman S 1991Mol. Phys.74665–88[180] Klein J and Kumacheva E 1995Science269816[181] Klein J and Kumacheva E 1998J. Chem. Phys.1086996
Klein J and Kumacheva E 1998J. Chem. Phys.1087010[182] Kofke D A and Glandt E D 1988Mol. Phys.641105–31[183] Koga K, Zeng X C and Tanaka H 1997Phys. Rev. Lett.795262[184] Kotelyanskii M and Kumar S K 1998Phys. Rev. Lett.801252–5[185] Kralj S, Zidansek A, Lahajnar G, Musevic I, Zumer S, Blinc R and Pintar M M 1996Phys. Rev.E 533629–38[186] Krim J, Coulomb J P and Bouzidi J 1987Phys. Rev. Lett.58583–6[187] Kruk M, Jaroniec M and Sayari A 1997Langmuir136267–73[188] Lachet V, Boutin A, Tavitian B and Fuchs A H 1998J. Phys. Chem.B 1029224–33[189] Landau L D and Lifshitz E M 1980Statistical Physics3rd edn (London: Pergamon)[190] Laradji M, Toxvaerd S and Mouritsen O G 1996Phys. Rev. Lett.772253–6[191] Larese J Z 1993Acc. Chem. Res.26353–60[192] Larese J Z, Harada M, Passell L, Krim J and Satija S 1988Phys. Rev.B 374735–42[193] Larese J Z and Zhang Q M 1990Phys. Rev. Lett.64922–5[194] Larese J Z and Zhang Q M 1995Phys. Rev.B 5117 023–7[195] Lastoskie C M, Gubbins K E and Quirke N 1993J. Phys. Chem.974786–96[196] Lastoskie C M, Gubbins K E and Quirke N 1993Langmuir9 2693–702[197] Lastoskie C M, Quirke N and Gubbins K E 1997Equilibria and Dynamics of Gas Adsorption on Heteregeneous

1656 L D Gelb et al
Surfaces (Studies in Surface Science and Catalysis vol 104)ed W Rudzinski, W A Steele and G Zgrablich(Amsterdam: Elsevier) pp 745–75
[198] Lee J C 1992Phys. Rev.B 468648–51[199] Lee J C 1993Phys. Rev. Lett.703599–602[200] Lee M and Chan K Y 1995Chem. Phys. Lett.27556–62[201] Lin M Y, Sinha S K, Drake J M, Wu X-I, Thiyagarajan P and Stanley H B 1994Phys. Rev. Lett.722207–10[202] Liu A J, Durian D J, Herbolzheimer E and Safran S A 1990Phys. Rev. Lett.651897–900[203] Liu A J and Grest G S 1991Phys. Rev.A 44R7894–7[204] Lo W Y and Chan K-Y 1995Mol. Phys.86745–58[205] Lomba E, Given J A, Stell G, Weis J J and Levesque D J 1993Phys. Rev.E 48233–44[206] Long Y, Xu T, Sun Y and Dong W 1998Langmuir146173–8[207] Lupowski M and VanSwol F 1991J. Chem. Phys.951995–8[208] Lynden-Bell R M, van Duijneveldt J S and Frenkel D 1993Mol. Phys.80801[209] Ma W-J, Maritan A, Banavar J R and Koplik J 1992Phys. Rev.A 45R5347–50[210] MacElroy J M D 1993Langmuir9 2682–92[211] MacElroy J M D andRaghavan K K 1990J. Chem. Phys.932068–79[212] MacFarland T, Barkema G T and Marko J F 1996Phys. Rev.B 53148–58[213] Machin W D 1992J. Chem. Soc., Faraday Trans.88729–35[214] Machin W D 1994Langmuir101235–40[215] Machin W D 1999Langmuir15169–73[216] Maciolek A, Ciach A and Evans R 1998J. Chem. Phys.1089765–74[217] Maciolek A, Evans R and Wilding N B 1999Phys. Rev.E at press[218] Madden W G and Glandt E D 1988J. Stat. Phys.51537–58[219] Maddox M and Gubbins K E 1997J. Chem. Phys.1079659[220] Maddox M W and Gubbins K E 1995Langmuir113988–96[221] Maddox M W, Lastoskie C M, Quirke N and Gubbins K E 1996Fundamentals of Adsorptioned M D LeVan
(Boston, MA: Kluwer) pp 571–8[222] Maddox M W, Olivier J P and Gubbins K E 1997Langmuir131737–45[223] Maddox M W, Quirke N and Gubbins K E 1997Mol. Simul.19267–83[224] Maddox M W, Ulberg D and Gubbins K E 1995Fluid Phase Equilib.104145–8[225] Madih K, Croset B, Coulomb J P and Lauter H J 1989Europhys. Lett.8 459–64[226] Maher J V, Goldburg W I, Pohl D W and Lanz M 1984Phys. Rev. Lett.5360–3[227] Maitland G C, Rigby M, Smith E B and Wakeham W A 1981Intermolecular Forces: Their Origin and
Determination. (Oxford: Clarendon)[228] Maritan A and Cieplak M 1992Phys. Rev. Lett.69221–4[229] Maritan A, Cieplak M, Bellini T and Banavar J R 1994Phys. Rev. Lett.724113–16[230] Marini Bettolo Marconi U and Van Swol F 1989Phys. Rev.A 394109–16[231] Mason G 1982J. Colloid Interface Sci.8836[232] Mason G 1983Proc. R. Soc.A 39047–72[233] Mattson J S and Mark H B 1971Activated Carbon, Surface Chemistry and Adsorption from Solution(New
York: Dekker)[234] McCallum C, Bandosz T J, McGrother S C, Muller E A and Gubbins K E 1999Langmuir15533–44[235] McDonald I R and Singer K 1967J. Chem. Phys.474766–72[236] McEnaney B and Mays T M 1989Introduction to Carbon Science(London: Butterworths)[237] Meier W M and Olson D H 1992Atlas of Zeolite Structure Types(London: Butterworth–Henemann)[238] Miyahara M and Gubbins K E 1997J. Chem. Phys.1062865[239] Miyahara M, Kanda H, Higashitani K and Gubbins K E 1999Proc. COPS-V, Characterization of Porous Solids
(Amsterdam: Elsevier) at press[240] Molz E, Wong A P Y, Chan M H W andBeamish J R 1993Phys. Rev.B 485741[241] Mon K K and Binder K 1992J. Chem. Phys.966989–95[242] Monette L, Liu A J and Grest G S 1992Phys. Rev.A 467664–79[243] Morishige K, Fujii H, Uga M and Kinukawa D 1997Langmuir133494–8[244] Morishige K and Kawano K 1998J. Chem. Phys.1104867–72[245] Morishige K and Nobuoka K 1997J. Chem. Phys.1076965[246] Morishige K and Shikimi M 1998J. Chem. Phys.1087821–4[247] Muller E A and Gubbins K E 1998Carbon361433–8[248] Muller E A, Rull L F, Vega L F and Gubbins K E 1996J. Phys. Chem.1001189–96[249] Muller E A, Vega L F and Gubbins K E 1995Int. J. Thermophys.16705–13

Phase separation in confined systems 1657
[250] Muller M and Paul W 1993J. Stat. Phys.73209–33[251] Nagai T and Kawasaki K 1983PhysicaA 120587–99[252] Nakanishi H and Fisher M E 1983J. Chem. Phys.783279–92[253] Nardon Y and Lahrer Y 1974Surf. Sci.42299[254] Neimark A V and Ravikovitch P I 1998Mat. Res. Soc. Symp. Proc.49227–33[255] Neimark A V, Ravikovitch P I, Grun M, Schuth F and Unger K K 1998J. Colloid Interface Sci.207159–69[256] Nham H S and Hess G B 1988Phys. Rev.B 385166–9[257] Nicholson D 1987Surf. Sci.181L189–92[258] Nicholson D 1991Fundamentals of Adsorptioned A B Mersmann and S E Scholl (New York: Engineering
Foundation) pp 3–12[259] Nicholson D 1994J. Chem. Soc., Faraday Trans.90181–5[260] Nicholson D and Parsonage N G 1982Computer Simulation and the Statistical Mechanics of Adsorption
(London: Academic)[261] Nicholson D and Pellenq R J M1998Adv. Colloid. Interface Sci.76–77179–202[262] Nicolaides D and Evans R 1989Phys. Rev. Lett.63778[263] Norman G E and Filinov V S 1969High Temp. (USSR)7 216–22[264] Nose S 1991Prog. Theor. Phys. Suppl.1031–46[265] Nuttall S 1974 Adsorption and capillary condensation of xenon in porous glass and porous carbonPhD Thesis
University of Bristol[266] Olivier J P 1995J. Porous Mater.2 9–17[267] Olivier J P 1996Fundamentals of Adsorptioned M D LeVan (Boston, MA: Kluwer) pp 699–707[268] Olivier J P 1998Fundamentals of Adsorptionvol 6, ed F Meunier (Paris: Elsevier) pp 207–11[269] Olivier J P 1998Carbon361469–72[270] Orkoulas G and Panagiotopoulos A Z 1999J. Chem. Phys.1101581
Orkoulas G and Panagiotopoulos A Z 1999J. Chem. Phys.1101590[271] Oshida K and Endo M 1998 Private communication[272] Overloop K and Van Gerven L 1993J. Magn. Res.A 101179[273] Page J H, Liu J, Abeles B, Deckman H W and Weitz D A 1996Phys. Rev. Lett.711216–19[274] Page K S and Monson P A 1996Phys. Rev.E 546557–64[275] Page K S and Monson P A 1996Phys. Rev.E 54R29–32[276] Palermo V, Biscarini F and Zannoni C 1998Phys. Rev.E 57R2519–22[277] Palotas A B, Rainey L C, Feldermann C J, Sarofim A F and Van der Sande J B 1996Microsc. Res. Tech.33
266–78[278] Panagiotopoulos A Z 1987Mol. Phys.62701–19[279] Panagiotopoulos A Z 1987Mol. Phys.61813–26[280] Panagiotopoulos A Z 1992Mol. Simul.9 1–23[281] Panagiotopoulos A Z, Quirke N, Stapleton M and Tildesley D J 1988Mol. Phys.63527–45[282] Pandit R, Schick M and Wortis M 1982Phys. Rev.B 265112[283] Papadopoulou A, Van Swol F and Marini Bettolo Marconi U 1992J. Chem. Phys.976942–52[284] Park I A and MacElroy J M D 1989Mol. Simul.2 105–45[285] Patrick J W 1995Porosity in Carbons: Characterization and Applications(New York: Halsted)[286] Pekala R W and Alviso C T 1992Mat. Res. Soc. Symp. Proc.2703–14[287] Pekala R W, Alviso C T, Kong F M and Hulsey S S 1992J. Non-Cryst. Solids14590–8[288] Pellenq R J M andNicholson D 1998Mol. Phys.95549–70[289] Perez L, Sokolowski S and Pizio O 1998J. Chem. Phys.1091147–51[290] Peterson B K and Gubbins K E 1987Mol. Phys.62215–26[291] Peterson B K, Gubbins K E, Heffelfinger G S, Marini Bettolo Marconi U and Van Swol F 1988J. Chem. Phys.
886487–500[292] Peterson B K, Gubbins K E, Heffelfinger G S and Van Swol F 1990J. Chem. Phys.93679–85[293] Peterson B K, Walton J P R B andGubbins K E 1985Int. J. Thermophys.6 585–93[294] Peterson B K, Walton J P R B andGubbins K E 1986J. Chem. Soc., Faraday Trans.2 1789–800[295] Phillips J M, Zhang Q M and Larese J Z 1993Phys. Rev. Lett.712971–4[296] Pissis P, Daoukaki-Diamanti D, Apekis L and Christodoulides C 1994J. Phys.: Condens. Matter6 L325[297] Pissis P, Kyritsis A, Daoukaki D, Barut G, Pelster R and Nimtz G 1998J. Phys.: Condens. Matter106205[298] Pitard E, Rosinberg M L, Stell G and Tarjus G 1995Phys. Rev. Lett.744361–4[299] Pitard E, Rosinberg M L and Tarjus G 1996Mol. Simul.17399–419[300] Privman V and Fisher M 1983J. Stat. Phys.33385[301] Quirke N and Tennison S R R1997Carbon341281–6

1658 L D Gelb et al
[302] Radhakrishnan R and Gubbins K E 1997Phys. Rev. Lett.792847–50[303] Radhakrishnan R and Gubbins K E 1999Mol. Phys.961249–67[304] Radhakrishnan R, Gubbins K E and Sliwinska-Bartkowiak M 1999J. Chem. Phys.submitted[305] Radhakrishnan R, Gubbins K E, Watanabe A and Kaneko K 1999J. Chem. Phys.at press[306] Ramsay J D F andBooth B O 1991Fundamentals of Adsorption, Proc. 3rd Int. Conf.ed A B Mersmann and
S E Scholl (New York: Engineering Foundation) pp 701–14[307] Ramsay J D F,Russell P J and Swanton S W 1991Characterization of Porous Solidsvol II, ed F Rodriguez-
Reinosoet al (Amsterdam: Elsevier) pp 257–65[308] Ranganathan S and Pathak K N 1992Phys. Rev.A 455789[309] Rathousky J, Zukal A, Franke O and Schulz-Ekloff G 1995J. Chem. Soc., Faraday Trans.91937–40[310] Ravikovitch P I, Domhnaill S C O,Neimark A V, Schuth F and Unger K K 1995Langmuir114765–72[311] Ravikovitch P I, Haller G L and Neimark A V 1998Adv. Colloid Interface Sci.76–77203–26[312] Rhykerd C, Tan Z, Pozhar L A and Gubbins K E 1991J. Chem. Soc. Faraday Trans.872011–16[313] Rhykerd C L, Schoen M, Diestler D J and Cushman J H 1987Nature330461–3[314] Rocken P, Somoza A, Tarazona P and Findenegg G H 1998J. Chem. Phys.1088689–97[315] Rocken P and Tarazona P 1996J. Chem. Phys.1052034–43[316] Rosinberg M L 1999New Approaches to Problems in Liquid State Theory (NATO Science Series C vol 529)
ed C Caccamet al (New York: Kluwer) p 245[317] Rosinberg M L, Tarjus G and Stell G 1994J. Chem. Phys.1005172–7[318] Ross S M 1997Simulation2nd edn (San Diego, CA: Academic)[319] Saam W F 1983Surf. Sci.125253–64[320] Samios S, Stubos A K, Kanellopoulos N K, Cracknell R F, Papadopoulos G K and Nicholson D 1997Langmuir
132796–802[321] Sandburg K J 1992Bond Orientational Order in Condensed Matter Systems(New York: Springer)[322] Saravanan C and Auerbach S M 1999J. Chem. Phys.submitted[323] Sarkisov L, Page K S and Monson P A 1998Fundamentals of Adsorptionvol 6, ed F Meunier (Paris: Elsevier)
pp 847–53[324] Schmidt M and Lowen H 1996Phys. Rev. Lett.764552[325] Schoen M 1993Computer Simulation of Condensed Phases in Complex Geometries(Berlin: Springer)[326] Schoen M and Diestler D J 1997Chem. Phys. Lett.270339–44[327] Schoen M and Diestler D J 1997Phys. Rev.E 564427–40[328] Schoen M and Diestler D J 1998J. Chem. Phys.1095596–606[329] Schuller J, Mel’nichenko Y B, Richert R and Fischer E W 1994Phys. Rev. Lett.732224–7[330] Schuller J, Richert R and Fischer E W 1995Phys. Rev.B 5215 232[331] Seaton N A, Walton J P R B andQuirke N 1989Carbon27853[332] Segarra E I and Glandt E D 1993Chem. Eng. Sci.492953[333] Sing K S W, Everett D H, Haul R A, Moscou L, Pierotti R A, Rouquerol J and Siemineiewska T 1985Pure
Appl. Chem.57603[334] Sliwinska-Bartkowiak M 1999 to be published[335] Sliwinska-Bartkowiak M, Gras J, Sikorski R, Radhakrishnan R, Gelb L D and Gubbins K E 1999Langmuirat
press[336] Sliwinska-Bartkowiak M, Sikorski R, Sowers S L, Gelb L D and Gubbins K E 1997Fluid Phase Equilib.136
93–109[337] Sliwinska-Bartkowiak M, Sowers S L and Gubbins K E 1996Langmuir131182–8[338] Smit B and Frenkel D 1989Mol. Phys.68951–8[339] Sokol P E, Ma W J, Herwig K E, Soon W M, Wang Y, Koplik J and Banavar J R 1992Appl. Phys. Lett.61777[340] Steele W A 1973Surf. Sci.36317–52[341] Steele W A 1974The Interaction of Gases with Solid Surfaces(Oxford: Pergamon)[342] Strange J H, Rahman M and Smith E G 1993Phys. Rev. Lett.713589[343] Strickland B, Leptoukh G and Roland C 1995J. Phys. A: Math. Gen.28L403–8[344] Sullivan D E and Telo da Gama M M 1986Fluid Interfacial Phenomenaed C A Croxton (Chichester: Wiley)
pp 45–134[345] Sutton M, Mochrie S G J and Birgeneau R J 1983Phys. Rev. Lett.51407[346] Tan Z and Gubbins K E 1992J. Phys. Chem.96845–54[347] Tan Z, Van Swol F and Gubbins K E 1987Mol. Phys.621213–24[348] Tarazona P 1985Phys. Rev.A 312672–9[349] Tarazona P, Marini Bettolo Marconi U and Evans R 1987Mol. Phys.60573–95[350] Tell J L, Maris H J and Seidel G M 1983Phys. Rev.B 285122

Phase separation in confined systems 1659
[351] Telo da Gama M M, Tarazona P, Allen M P and Evans R 1990Mol. Phys.71801–21[352] Teraoka Y 1993Surf. Sci.294273–83[353] Teraoka Y and Seto T 1993Surf. Sci.283371–6[354] Thommes M and Findenegg G H 1994Langmuir104270–7[355] Thommes M, Findenegg G H and Schoen M 1995Langmuir112137–142[356] Thompson P A and Robbins M O 1990Science250792–4[357] Thompson S M, Gubbins K E, Walton J P R B,Chantry R A R and Rowlinson J S 1984J. Chem. Phys.81530[358] Torii R H, Maris H J and Seidel G M 1990Phys. Rev.B 417167[359] Torrie G M and Valleau J P 1974Chem. Phys. Lett.28578[360] Tovbin Y K and Votyakov K V 1993Langmuir9 2652–60[361] Trokhymchuk A and Sokolowski S 19981095044–9[362] Ulberg D E and Gubbins K E 1995Mol. Phys.841139–53[363] Unger K K 1979Porous Silica (Journal of Chromatography Library Vol 16)(Amsterdam: Elsevier)[364] Unruh K M, Huber T E and Huber C A 1993Phys. Rev.B 489021[365] Van Megen W and Snook I K 1982Mol. Phys.45629–36[366] Van Megen W and Snook I K 1985Mol. Phys.54741–55[367] Vanderlick T K, Scriven L E and Davis H T 1989J. Chem. Phys.902422–36[368] Van Duijneveldt J S and Frenkel D 1992J. Chem. Phys.964655[369] Vega L F, Muller E A, Rull L F and Gubbins K E 1995Mol. Simul.15141–54[370] Vega L F, Muller E A, Rull L F and Gubbins K E 1996Adsorption2 59–68[371] Velasco E and Toxvaerd S 1996Phys. Rev.E 54605–10[372] Vishnyakov A, Piotrovskaya E M and Brodskaya E N 1998Adsorption4 207–24[373] Van Roij R, Dijkstra M and Evans R 1999Phys. Rev. Lett.submitted[374] Van Slooten R, Bojan M J and Steele W A 1994Langmuir10542–8[375] Voronov V P and Buleıko V M 1998J. Exp. Theor. Phys.86586–90[376] Votyakov E V, Tovbin Yu K, MacElroy J M D andRoche A 1999Langmuir155713–21[377] Wall G D and Cleaver D J 1997Phys. Rev.E 564306–16[378] Walton J P R B andQuirke N 1989Mol. Simul.2 361–91[379] Warnock J, Awschalom D D and Shafer M W 1986Phys. Rev. Lett.571753[380] Watanabe A, Iiyama T, Kaneko K, Radhakrishnan R and Gubbins K E 1999J. Phys. Chem.at press[381] Watanabe A and Kaneko K 1999Chem. Phys. Lett.at press[382] Weeks J D, Chandler D and Andersen H C 1971J. Chem. Phys.545237–47[383] Weissenberger M C, Goltner C G and Antonietti M 1997Ber. Bunsenges. Phys. Chem.1011679[384] White J C and Hess A 1993J. Phys. Chem.976398
White J C and Hess A 1993J. Phys. Chem.978703[385] Wilding N B 1995Phys. Rev.E 52602–11[386] Wilding N B and Bruce A D 1992J. Phys.: Condens. Matter4 3087–108[387] Wilding N B and Schoen M 1999Phys. Rev.E at press[388] Wiltzius P, Dierker S B and Dennis B S 1989Phys. Rev. Lett.62804–7[389] Wong A P Y andChan M H W1990Phys. Rev. Lett.652567–70[390] Wong A P Y, Kim S B,Goldburg W I and Chan M H W1993Phys. Rev. Lett.70954–7[391] Woods G B, Panagiotopoulos A Z and Rowlinson J S 1988Mol. Phys.6349[392] Yoon D V, Vacatello M and Smith G D 1995Monte Carlo and Molecular Dynamics Simulations in Polymer
Scienceed K Binder (New York: Oxford University Press) ch 8[393] Yoon J, Sergatskov D, Ma J, Mulders N and Chan M H W 1998Phys. Rev. Lett.801461–4[394] Youn H S and Hess G B 1990Phys. Rev. Lett.64443[395] Youn H S, Meng X F and Hess G B 1993Phys. Rev.B 4814 556–76[396] Zhang Z and Chakrabarti A 1994Phys. Rev.E 50R4290–3[397] Zhang Z and Chakrabarti A 1995Phys. Rev.E 524991–9[398] Zhang Z and Chakrabarti A 1995Phys. Rev.B 522736–41[399] Zhuang Z, Casielles A G and Cannell D S 1996Phys. Rev. Lett.772969–72