phase ii report (final): project definition...
TRANSCRIPT

OSHPC BARKI TOJIK
TECHNO-ECONOMIC ASSESSMENT STUDY FOR ROGUN HYDROELECTRIC CONSTRUCTION PROJECT
PHASE II REPORT (FINAL): PROJECT DEFINITION OPTIONS
VOLUME 3: ENGINEERING AND DESIGN
Chapter 5: Reservoir Operation Study

TEAS for Rogun HPP Construction Project
Phase II - Vol. 3 – Chap.5 – Reservoir operation study
P.002378 RP 40 page 1 /107
TECHNO-ECONOMIC ASSESSMENT STUDY FOR ROGUN HYDROELECTRIC CONSTRUCTION PROJECT
PHASE II: PROJECT DEFINITION OPTIONS
Volume 3: Engineering and design
Chapter 5: Reservoir operation study
August 2014
Report No. P.002378 R P40 rev. E
E 06/08/2014 Final after 5th riparian
consultation O.Clave A.Lara L.Bouzat
D 31/03/2014 Final O.Clave A.Lara N.Sans
C 06/11/2013 Comments from WB, construction
schedule updated O.Clave A.Lara N.Sans
B 16/07/2013 Comments from WB and GoT
included O.Clave A.Lara N.Sans
A 29/03/2013 First Emission O.Clave A.Lara N.Sans
Revision Date Subject of revision Drafted Checked Approved

TEAS for Rogun HPP Construction Project
Phase II - Vol. 3 – Chap.5 – Reservoir operation study
P.002378 RP 40 page 2 /107
CONTENTS
ACRONYMS ................................................................................................................................... 9
1 OBJECTIVES AND CONTEXT ............................................................................................. 10
2 DATA AND ASSUMPTIONS ................................................................................................. 10
2.1 Sources .......................................................................................................................... 10
2.2 Vakhsh Cascade model .................................................................................................. 11
2.3 Interstate water allocation legal framework ..................................................................... 12
2.4 Inflows ............................................................................................................................ 14
2.5 Water withdrawals from Vakhsh River in Tajikistan ......................................................... 16
2.6 Reservoirs characteristics ............................................................................................... 17
2.7 Sedimentation ................................................................................................................. 20
2.8 Hydropower plants characteristics .................................................................................. 23
2.9 Rogun installed capacity ................................................................................................. 25
2.10 Rogun Early impounding ................................................................................................. 25
2.10.1 Schedule .................................................................................................................................. 25
2.10.2 Temporary units characteristics ............................................................................................... 26
3 METHODOLOGY .................................................................................................................. 29
3.1 General ........................................................................................................................... 29
3.2 Calculation algorithm for reservoir simulation .................................................................. 31
3.3 Energy variable ............................................................................................................... 32
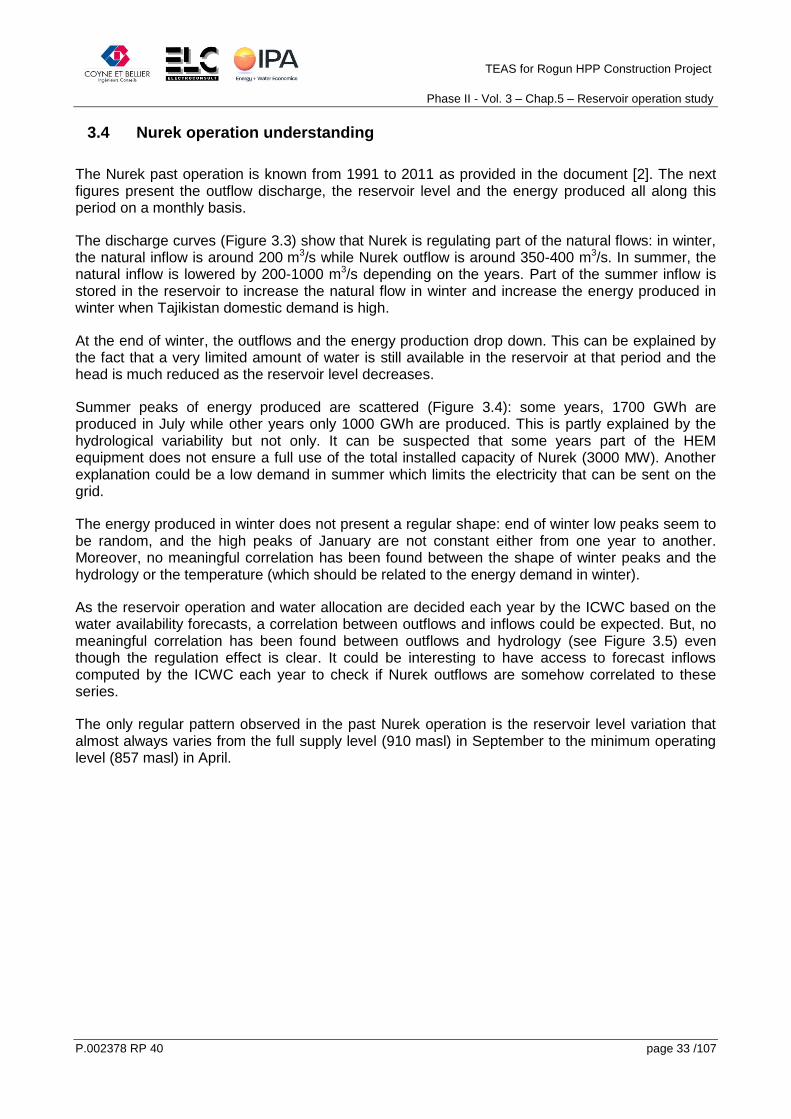
3.4 Nurek operation understanding ....................................................................................... 33
3.5 Model calibration ............................................................................................................. 35
3.6 Nurek operation improvement ......................................................................................... 41
3.7 Rogun and Nurek coupled operation ............................................................................... 42
3.8 Rogun and Nurek coupled operation during Rogun filling ............................................... 43
4 SCENARIOS STUDIED ......................................................................................................... 43
4.1 Simulation scenario cases for normal operation .............................................................. 43
4.2 Simulation scenario for Rogun reservoir filling ................................................................ 44
4.3 Recapitulative chart ........................................................................................................ 44
5 SIMULATION RESULTS FOR NORMAL OPERATION ........................................................ 45
5.1 Without Rogun ................................................................................................................ 45
5.1.1 Reservoir rule curve ................................................................................................................. 45
5.1.2 Results scenario (a) ................................................................................................................. 47
5.1.3 Results scenario (b) ................................................................................................................. 51
5.2 With Rogun Base line scenarios (b) ................................................................................ 54
5.2.1 Optimized coupled operation of Rogun and Nurek.................................................................. 54

TEAS for Rogun HPP Construction Project
Phase II - Vol. 3 – Chap.5 – Reservoir operation study
P.002378 RP 40 page 3 /107
5.2.2 FSL =1290 masl ....................................................................................................................... 55
5.2.3 FSL=1255 masl ........................................................................................................................ 60
5.2.4 FSL =1220 masl ....................................................................................................................... 65
5.3 Current status extrapolated with Rogun (a) ..................................................................... 70
5.3.1 FSL =1290 masl ....................................................................................................................... 70
5.3.2 FSL=1255 masl ........................................................................................................................ 75
5.3.3 FSL =1220 masl ....................................................................................................................... 79
5.4 Base line scenario with sedimentation ............................................................................ 83
5.4.1 General .................................................................................................................................... 83
5.4.2 Without Rogun ......................................................................................................................... 84
5.4.3 With Rogun FSL= 1290 masl ................................................................................................... 85
5.4.4 With Rogun FSL= 1255 masl ................................................................................................... 87
5.4.5 With Rogun FSL= 1220 masl ................................................................................................... 89
5.5 Synthesis and comparison of results ............................................................................... 90
5.5.1 Energy production .................................................................................................................... 90
5.5.2 Discharge at the downstream point of the Vakhsh cascade ................................................... 92
5.5.3 Other comments ...................................................................................................................... 94
6 SIMULATION RESULTS – FILLING PERIOD ....................................................................... 94
6.1 Hydrological situation ...................................................................................................... 94
6.2 FSL = 1290 masl ............................................................................................................ 94
6.3 FSL = 1255 masl ............................................................................................................ 97
6.4 FSL = 1220 masl .......................................................................................................... 100
6.5 Comments on triggered seismicity ................................................................................ 103
7 CONCLUSIONS .................................................................................................................. 104
8 APPENDICES ..................................................................................................................... 107

TEAS for Rogun HPP Construction Project
Phase II - Vol. 3 – Chap.5 – Reservoir operation study
P.002378 RP 40 page 4 /107
FIGURES
Figure 2.1 : Vakhsh cascade scheme ......................................................................................... 12
Figure 2.2 : HPI inflows and Nurek outflows ................................................................................ 15
Figure 2.3 : Simulation period yearly inflows ............................................................................... 16
Figure 2.4 : Computed reservoir level versus historical Nurek reservoir level .............................. 19
Figure 2.5 : Rogun and Nurek reservoir capacity vs elevation ..................................................... 20
Figure 2.6 : Rogun reservoir storage capacity FSL =1290 masl- Impact of sedimentation .......... 21
Figure 2.7 : Rogun reservoir storage capacity FSL =1255 masl- Impact of sedimentation .......... 21
Figure 2.8 : Rogun reservoir storage capacity FSL =1220 masl- Impact of sedimentation .......... 22
Figure 2.9 : Nurek reservoir storage capacity.- Impact of sedimentation without Rogun .............. 23
Figure 2.10 : Dam rise schedule - FSL=1290, 1255 and 1220 masl ............................................ 26
Figure 2.11 : Rogun units - FSL=1290 masl ................................................................................ 27
Figure 2.12 : Rogun units - FSL=1255 masl ................................................................................ 28
Figure 2.13 : Rogun units - FSL=1220 masl ................................................................................ 28
Figure 3.1 : Calculation algorithm ................................................................................................ 32
Figure 3.2 : Firm and secondary energy definition....................................................................... 32
Figure 3.3 : Historical Nurek outfllow and reservoir level (1991-2008) ......................................... 34
Figure 3.4 : Historical Nurek energy production (1991-2008) ...................................................... 34
Figure 3.5 : Nurek outflows versus Nurek inflows ........................................................................ 35
Figure 3.6 : Nurek Reservoir level - Comparison between historical data and simulation results . 36
Figure 3.7 : Comparison of historical and simulated Nurek outflows ........................................... 37
Figure 3.8 : Nurek Outflows - Comparison between historical data and simulation results .......... 37
Figure 3.9 : Cross plot of simulated and historical discharge downstream of Nurek .................... 38
Figure 3.10 : Comparison of historical and simulated Nurek monthly energy .............................. 38
Figure 3.11 : Nurek Outflows duration curve - Comparison between historical data and simulation results ......................................................................................................................................... 39
Figure 3.12 : Illustrative explanation of the "regulation ratio" ....................................................... 43
Figure 5.1 : Nurek reservoir level rule curve - Calibrated and improved ...................................... 46
Figure 5.2 : Nurek E95% versus Minimum Operating level ......................................................... 46
Figure 5.3 : Without Rogun (a) - Comparison of historical and simulated discharge downstream of Nurek (1991-2008) ...................................................................................................................... 47
Figure 5.4 : Cross plot of simulated (Without Rogun-Scenario a) and historical discharge downstream of Nurek .................................................................................................................. 48
Figure 5.5 : Without Rogun (a)- Comparison of historical and simulated energy produced .......... 48
Figure 5.6 : Average monthly energy produced by the cascade along the year ........................... 49
Figure 5.7 : Without Rogun (a) - Nurek monthly energy distribution ............................................ 50
Figure 5.8 : Without Rogun (a) - Vakhsh cascade monthly energy distribution ............................ 50

TEAS for Rogun HPP Construction Project
Phase II - Vol. 3 – Chap.5 – Reservoir operation study
P.002378 RP 40 page 5 /107
Figure 5.9 : Without Rogun scenario (a)- Discharge at the downstream of the cascade .............. 51
Figure 5.10 : Without Rogun scenario (a) – Distribution of the discharge at the downstream of the cascade ...................................................................................................................................... 51
Figure 5.11 : Without Rogun (b) - Average monthly energy produced by the cascade ................ 52
Figure 5.12 : Without Rogun (b) - Nurek monthly energy distribution .......................................... 53
Figure 5.13 : Without Rogun (b) - Vakhsh cascade monthly energy distribution .......................... 53
Figure 5.14 : Without Rogun scenario (b)- Discharge at the downstream of the cascade ............ 54
Figure 5.15 : Without Rogun scenario (b) – Distribution of the discharge at the downstream of the cascade ...................................................................................................................................... 54
Figure 5.16 : Optimization of Rogun and Nurek coupled operation ............................................. 55
Figure 5.17 : Scenario (b-1290) - Average Rogun and Nurek reservoir level ............................... 55
Figure 5.18 : Average monthly energy produced by the cascade along the year Scenario (b-1290) Pinst = 3600 MW ........................................................................................................................ 57
Figure 5.19 : Rogun monthly energy distribution - Scenario (b-1290) Pinst = 3600 MW .............. 58
Figure 5.20 : Nurek monthly energy distribution - Scenario (b-1290) Pinst = 3600 MW ............... 58
Figure 5.21 : Vakhsh cascade monthly energy distribution - Scenario (b-1290) Pinst = 3600 MW59
Figure 5.22 : Scenario (b-1290) - Discharge at the downstream of the cascade ......................... 60
Figure 5.23 : Scenario (b-1290) – Distribution of the discharge at the downstream of the cascade ................................................................................................................................................... 60
Figure 5.24 : Scenario (b-1255) - Average Rogun and Nurek reservoir level ............................... 61
Figure 5.25 : Average monthly energy produced by the cascade along the year Scenario (b-1255) Pinst = 3200 MW ........................................................................................................................ 62
Figure 5.26 : Rogun monthly energy distribution - Scenario (b-1255) Pinst = 3200 MW .............. 63
Figure 5.27 : Nurek monthly energy distribution - Scenario (b-1255) Pinst = 3200 MW ............... 63
Figure 5.28 : Vakhsh cascade monthly energy distribution - Scenario (b-1255) Pinst = 3200 MW64
Figure 5.29 : Scenario (b-1255) - Discharge at the downstream of the cascade ......................... 65
Figure 5.30 : Scenario (b-1255) – Distribution of the discharge at the downstream of the cascade ................................................................................................................................................... 65
Figure 5.31 : Scenario (b-1220) - Average Rogun and Nurek reservoir level ............................... 66
Figure 5.32 : Average monthly energy produced by the cascade along the year Scenario (b-1220) Pinst = 2800 MW ........................................................................................................................ 67
Figure 5.33 : Rogun monthly energy distribution - Scenario (b-1220) Pinst = 2800 MW .............. 68
Figure 5.34 : Nurek monthly energy distribution - Scenario (b-1220) Pinst = 2800 MW ............... 68
Figure 5.35 : Vakhsh cascade monthly energy distribution - Scenario (b-1220) Pinst = 2800 MW69
Figure 5.36 : Scenario (b-1220) - Discharge at the downstream of the cascade ......................... 70
Figure 5.37 : Scenario (b-1220) – Distribution of the discharge at the downstream of the cascade ................................................................................................................................................... 70
Figure 5.38 : Scenario (a-1290) - Average Rogun and Nurek reservoir level ............................... 71
TEAS for Rogun HPP Construction Project
Phase II - Vol. 3 – Chap.5 – Reservoir operation study
P.002378 RP 40 page 6 /107
Figure 5.39 : Average monthly energy produced by the cascade along the year Scenario (a-1290) Pinst = 3600 MW ........................................................................................................................ 72
Figure 5.40 : Rogun monthly energy distribution - Scenario (a-1290) Pinst = 3600 MW .............. 73
Figure 5.41 : Nurek monthly energy distribution - Scenario (a-1290) Pinst = 3600 MW ............... 73
Figure 5.42 : Vakhsh cascade monthly energy distribution - Scenario (a-1290) Pinst = 3600 MW74
Figure 5.43 : Scenario (a-1290) - Discharge at the downstream of the cascade ......................... 74
Figure 5.44 : Scenario (a-1290) – Distribution of the discharge at the downstream of the cascade ................................................................................................................................................... 75
Figure 5.45 : Scenario (a-1255) - Average Rogun and Nurek reservoir level ............................... 75
Figure 5.46 : Average monthly energy produced by the cascade along the year Scenario (a-1255) Pinst = 3200 MW ........................................................................................................................ 76
Figure 5.47 : Rogun monthly energy distribution - Scenario (a-1255) Pinst = 3200 MW .............. 77
Figure 5.48 : Nurek monthly energy distribution - Scenario (a-1255) Pinst = 3200 MW ............... 77
Figure 5.49 : Vakhsh cascade monthly energy distribution - Scenario (a-1255) Pinst = 3200 MW78
Figure 5.50 : Scenario (a-1255) - Discharge at the downstream of the cascade ......................... 78
Figure 5.51 : Scenario (a-1255) – Distribution of the discharge at the downstream of the cascade ................................................................................................................................................... 79
Figure 5.52 : Scenario (a-1220) - Average Rogun and Nurek reservoir level ............................... 79
Figure 5.53 : Average monthly energy produced by the cascade along the year Scenario (a-1220) Pinst = 2800 MW ........................................................................................................................ 80
Figure 5.54 : Rogun monthly energy distribution - Scenario (a-1220) Pinst = 2800 MW .............. 81
Figure 5.55 : Nurek monthly energy distribution - Scenario (a-1220) Pinst = 2800 MW ............... 81
Figure 5.56 : Vakhsh cascade monthly energy distribution - Scenario (a-1220) Pinst = 2800 MW82
Figure 5.57 : Scenario (a-1220) - Discharge at the downstream of the cascade ......................... 82
Figure 5.58 : Scenario (a-1220) – Distribution of the discharge at the downstream of the cascade ................................................................................................................................................... 83
Figure 5.59 : Without Rogun (b) - Impact of sedimentation on energy production ....................... 84
Figure 5.60 : Vakhsh downstream discharge - Without Rogun (b) after 65 years of sedimentation85
Figure 5.61 : Comparison of Vakhsh downstream discharge (at present and after 65 years) - Without Rogun (b) ....................................................................................................................... 85
Figure 5.62 : With Rogun (1290-b) - Impact of sedimentation on energy production ................... 86
Figure 5.63 : Vakhsh downstream discharge - With Rogun (b-1290) after 80 years of sedimentation ................................................................................................................................................... 87
Figure 5.64 : Comparison of Vakhsh downstream discharge (at present and after 80 years) - With Rogun (b-1290) ........................................................................................................................... 87
Figure 5.65 : With Rogun (1255-b) - Impact of sedimentation on energy production ................... 88
Figure 5.66 : With Rogun (1220-b) - Impact of sedimentation on energy production ................... 89
Figure 5.67 : Vakhsh cascade production - Comparison of the alternatives, Scenario (b) ........... 92
Figure 5.68 : Vakhsh cascade production - Comparison of the alternatives, Scenario (a) ........... 92

TEAS for Rogun HPP Construction Project
Phase II - Vol. 3 – Chap.5 – Reservoir operation study
P.002378 RP 40 page 7 /107
Figure 5.69 : Average discharge at the downstream end of the Vakhsh river - Comparison of scenario (a) and (b) ..................................................................................................................... 93
Figure 5.70 : Monthly discharge at the Vakhsh downstream point - Comparison With and Without Rogun ......................................................................................................................................... 93
Figure 6.1 : Rogun reservoir filling - Simulation results FSL=1290 masl ...................................... 95
Figure 6.2 : Discharge at the downstream end of the Vakhsh - Filling FSL=1290 masl ............... 97
Figure 6.3 : Cross plot of the discharge at the downstream end of the Vakhsh – Rogun 1290 filling ................................................................................................................................................... 97
Figure 6.4 : Rogun reservoir filling - Simulation results FSL=1255 masl ...................................... 98
Figure 6.5 : Discharge at the downstream end of the Vakhsh - Filling FSL=1255 masl ............... 99
Figure 6.6 : Cross plot of the discharge at the downstream end of the Vakhsh – Rogun 1255 filling ................................................................................................................................................. 100
Figure 6.7 : Rogun reservoir filling - Simulation results FSL=1220 masl .................................... 101
Figure 6.8 : Discharge at the downstream end of the Vakhsh - Filling FSL=1220 masl ............. 102
Figure 6.9 : Cross plot of the discharge at the downstream end of the Vakhsh – Rogun 1220 filling ................................................................................................................................................. 103
TEAS for Rogun HPP Construction Project
Phase II - Vol. 3 – Chap.5 – Reservoir operation study
P.002378 RP 40 page 8 /107
TABLES
Table 2.1 : Storage and regulation capacity of Vakhsh HPP's ..................................................... 11
Table 2.2 : Yearly water volume allocation according to Protocol n°566- Amudarya ................... 13
Table 2.3 : Average water allocation between 1992 and 2010 (Source: Data from BWO “Amudarya” as of 1992-2010 years) ............................................................................................ 14
Table 2.4 : Average of actual water withdrawals and return flow during 2005-2011 (m3/s) .......... 17
Table 2.5 : Prospective water withdrawals and return flow (m3/s) ................................................ 17
Table 2.6 : Rogun and Nurek evaporation losses ........................................................................ 18
Table 2.7 : Rogun reservoir capacity vs elevation ....................................................................... 18
Table 2.8 : Evolution of Nurek reservoir capacity ........................................................................ 18
Table 2.9 : Tailwater rating curves .............................................................................................. 24
Table 2.10 : Vakhsh cascade installed capacity and maximum discharge ................................... 25
Table 2.11 : Installed capacities selected .................................................................................... 25
Table 2.12 : Key dates for early generation ................................................................................. 29
Table 3.1: Average monthly deviation of Simulation results with regards to Historical data – Nurek HPP ............................................................................................................................................ 40
Table 4.1 : Scenario and alternatives simulated .......................................................................... 45
Table 5.1 : Cascade energy production during wet or dry years - Without Rogun (a) .................. 49
Table 5.2 : Cascade energy production during wet or dry years - Without Rogun (b) .................. 52
Table 5.3 : Cascade energy production during wet or dry years - (b-1290) ................................. 57
Table 5.4: Average yearly spilled water volume - FSL=1290 masl (b) ......................................... 59
Table 5.5 : Cascade energy production during wet or dry years - (b-1255) ................................. 62
Table 5.6: Average yearly spilled water volume - FSL=1255 masl (b) ......................................... 64
Table 5.7 : Cascade energy production during wet or dry years - (b-1220) ................................. 67
Table 5.8: Average yearly spilled water volume - FSL=1220 masl (b) ......................................... 69
Table 5.9 : Cascade energy production during wet or dry years - (a-1290) ................................. 72
Table 5.10 : Cascade energy production during wet or dry years - (a-1255) ............................... 77
Table 5.11 : Cascade energy production during wet or dry years - (a-1220) ............................... 81
Table 5.12 : Vakhsh cascade firm energy of all simulated scenario ............................................. 90
Table 5.13 : Vakhsh cascade secondary energy of all simulated scenario .................................. 90
Table 5.14 : Vakhsh cascade average energy of all simulated scenario ...................................... 91
Table 6.1 : Rogun filling - Energy production - FSL=1290 masl ................................................... 96
Table 6.2 : Rogun filling - Energy production - FSL=1255 masl ................................................... 99
Table 6.3 : Rogun filling - Energy production - FSL=1220 masl ................................................. 102

TEAS for Rogun HPP Construction Project
Phase II - Vol. 3 – Chap.5 – Reservoir operation study
P.002378 RP 40 page 9 /107
ACRONYMS
Organisms:
HPI : Hydro Project Institute Moscow, Russian Institute
BWO : Basin Water Organization “Amudarya”, executive and interdepartmental control body of ICWC (Interstate Commission for Water Coordination) of Central Asia republics, Kazakhstan and Turkmenistan and acts on the base of an intergovernmental agreement. It allocates rights of use of water resources within ICWC established limits in the Amudarya Basin.
GoT: Government of Tajikistan
Others:
FSL : Full Supply Level
MOL : Minimum Operation Level
TWL : Tail Water Level
HPP : Hydro Power Plant
ESIA : Environmental and Social Impact Assessment

TEAS for Rogun HPP Construction Project
Phase II - Vol. 3 – Chap.5 – Reservoir operation study
P.002378 RP 40 page 10 /107
1 OBJECTIVES AND CONTEXT
The Rogun Hydropower Project is part of the Vakhsh Cascade which is already equipped with several operating hydropower plants (including reservoir facilities and run of the river facilities). Future developments of the cascade are also under study and projects will be added to the existing facilities.
The Vakhsh Cascade simulation aims at optimizing the Rogun reservoir management in order to allow for optimum energy generation from the whole cascade (including future developments) in accordance with the downstream water requirements. For that purpose, several scenarios for water withdrawal in Tajikistan will be envisaged, all in perfect adequacy with international regulation within Amudarya Basin.
Indeed, as the Vakhsh River is one of the main contributors of the Amudarya river, the Cascade Operation should respect the regional water sharing agreements and practices, including the Nukus declaration and Protocol 566. Afghanistan, Tajikistan, Turkmenistan, Uzbekistan, and the Aral Sea share the water from the Amudarya basin. Water allocation is currently decided by the Interstate Commission for Water Coordination (ICWC) established in 1992. The Vakhsh average discharge is 650 m3/s while the Pyandj river average discharge is approximately twice that of the Vakhsh river.
This report presents the agreed method and assumptions, as well as the simulation results of the various scenarios and alternatives. It includes the normal operation of the cascade, the impact of sedimentation and the Rogun reservoir filling period.
This study aims at assessing the future possible production of Rogun and the Vakhsh cascade taking into account the regional constraints as well as the impact on the river flow. Results of this study are used in the economic and financial analysis of Rogun project as well as in the Environmental and Social Impact Assessment (ESIA).
The methodology of this study is consistent with the level of study of the TEAS (feasibility) and is also consistent with the accuracy of the various data used and the level of details of the results required at this stage.
2 DATA AND ASSUMPTIONS
2.1 Sources
Data are coming from various sources and documents. They are detailed below, and used as reference in the following paragraphs.
From Barki Tojik:
[1] One series of 8 excel files named “Журнал-Выр 20xxг.xls” (from 2004 to 2011), and containing daily data about all HPP’s of Vakhsh cascade: discharge, energy production, and for Nurek the reservoir water level;
[2] One excel file named “Управление Нурекским в-щем(2).xls” and containing daily discharge, and energy production of Nurek, on 1991-2011 period.
[3] 5 pdf files transmitted in November 2012 by Barki Tojik and containing all data concerning water withdrawals within Tajikistan.

TEAS for Rogun HPP Construction Project
Phase II - Vol. 3 – Chap.5 – Reservoir operation study
P.002378 RP 40 page 11 /107
[4] Report on the engineering hydrology of the Nurek reservoir, Tajik State Design and survey research institute "Hydroenergoproject", Dushanbe 2001
From HPI:
[5] Report n° 1861 - 2 - II - 2 “Hydrometeorological conditions”: it contains monthly inflows at Rogun, between Rogun and Nurek, between Nurek and Baïpaza and between Baïpaza and Sangtuda from April 1932 to March 2008
[6] Report 1861 – III Water economy: among others it contains reservoirs characteristics,
2.2 Vakhsh Cascade model
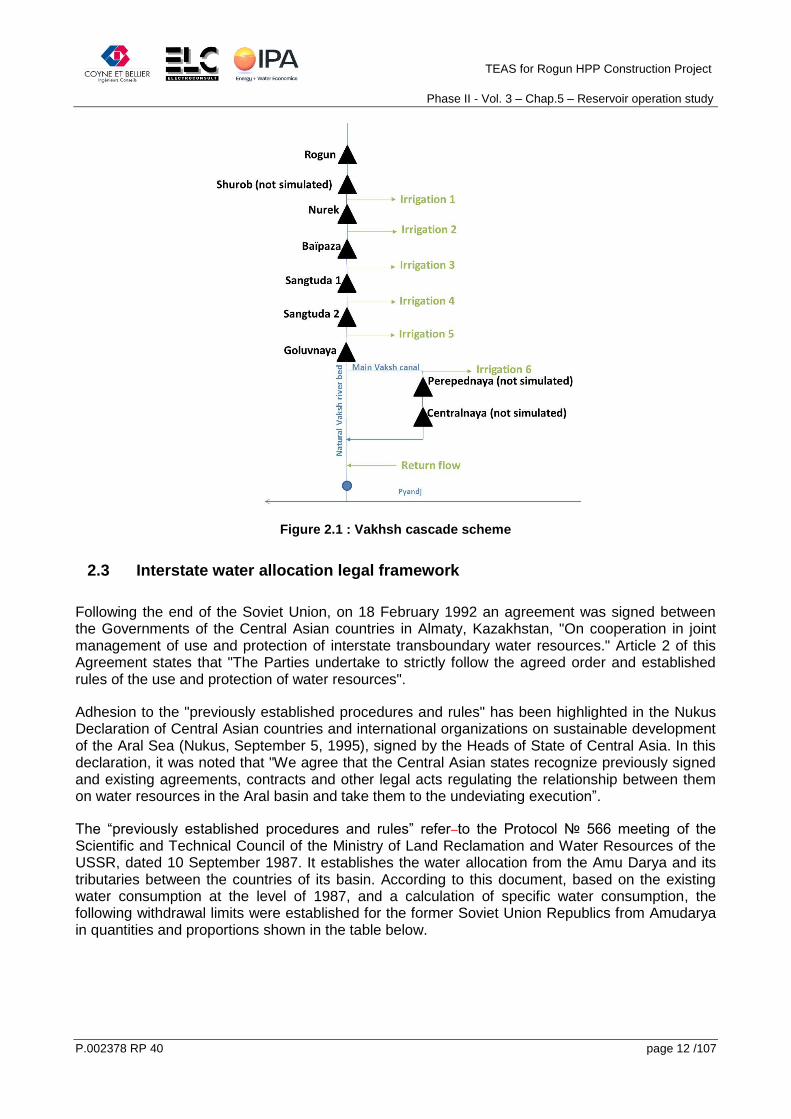
The Vakhsh cascade includes nine hydropower plants presently existing, under construction or under design. Seven are on the Vakhsh river: Rogun, Shurob, Nurek, Baïpaza, Sangtuda 1, Sangdtuda 2, Goluvnaya. And two are on the Main Vakhsh Canal: Centralnaya and Perepednaya. This canal intake is downstream of Goluvnaya and returns to the Vakhsh river bed before its confluence with the Pyandj river as shown in figure 2.1. Each black triangle represents a reservoir and its hydropower plant. The green arrows represent the irrigation water flows, either withdrawn from the river or returning to the river. In the downstream part of the Vakhsh, there is a channel bringing water through two small hydropower plants. This part has not been simulated in this study as it produces only a small amount of energy compared to the other upstream plants.
The reservoir capacity of the various reservoirs is reported in the next table.
Rogun 1290
Rogun 1255
Rogun 1220
Shurob Nurek Baïpaza Sangtuda 1
Sangtuda 2
Goluvnaya
Under design
Under design
Under design
Under design
In operation
In operation
In operation In operation In operation
Live storage (hm
3)
10 300 6 454 3 927 5 4 200 87 18 5 4
Regulation Inter-annual
Inter-annual
Inter-annual
daily Inter-annual
weekly daily daily daily
Table 2.1 : Storage and regulation capacity of Vakhsh HPP's
Rogun and Nurek reservoirs are the only ones large enough to regulate the natural inflows in more than a week. Therefore, in the simulation all other structures are considered as if they were pure run-of-river hydropower plants.
As the historical distribution of water discharge going through the Main Vakhsh canal is not known on the full simulation period, Perepedanaya and Centralnaya cannot be simulated.
Shurob is not simulated as it is still under evaluation and its construction is not yet decided. In addition, this has negligible impact on future energy production.
Along the Vakhsh river, several water intakes for irrigation and other domestic uses have been identified and incorporated in the model. In addition, between Goluvnaya and the confluence with the Pyandj, important volumes of return-water are recorded along the Vakhsh as a residue of the irrigation schemes but also from the main Vakhsh canal.
The next figure illustrates the Vakhsh cascade scheme as considered in the simulation.
TEAS for Rogun HPP Construction Project
Phase II - Vol. 3 – Chap.5 – Reservoir operation study
P.002378 RP 40 page 12 /107
Figure 2.1 : Vakhsh cascade scheme
2.3 Interstate water allocation legal framework
Following the end of the Soviet Union, on 18 February 1992 an agreement was signed between the Governments of the Central Asian countries in Almaty, Kazakhstan, "On cooperation in joint management of use and protection of interstate transboundary water resources." Article 2 of this Agreement states that "The Parties undertake to strictly follow the agreed order and established rules of the use and protection of water resources".
Adhesion to the "previously established procedures and rules" has been highlighted in the Nukus Declaration of Central Asian countries and international organizations on sustainable development of the Aral Sea (Nukus, September 5, 1995), signed by the Heads of State of Central Asia. In this declaration, it was noted that "We agree that the Central Asian states recognize previously signed and existing agreements, contracts and other legal acts regulating the relationship between them on water resources in the Aral basin and take them to the undeviating execution”.
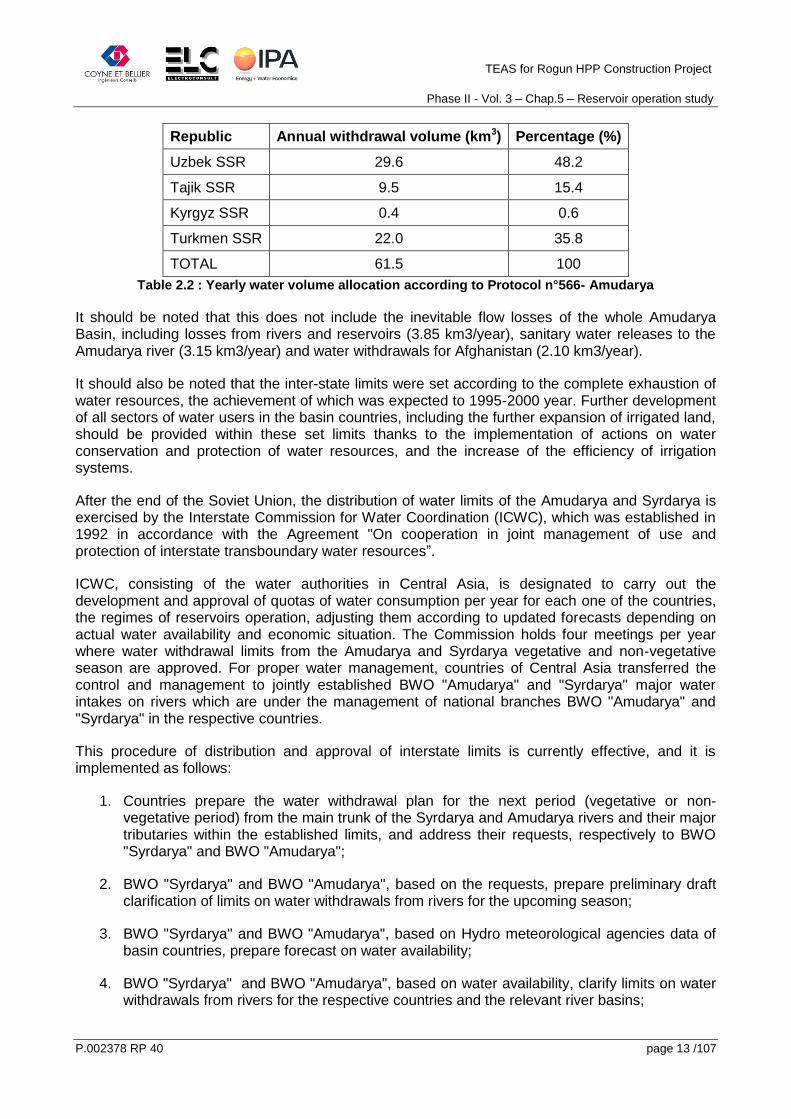
The “previously established procedures and rules” refer to the Protocol № 566 meeting of the Scientific and Technical Council of the Ministry of Land Reclamation and Water Resources of the USSR, dated 10 September 1987. It establishes the water allocation from the Amu Darya and its tributaries between the countries of its basin. According to this document, based on the existing water consumption at the level of 1987, and a calculation of specific water consumption, the following withdrawal limits were established for the former Soviet Union Republics from Amudarya in quantities and proportions shown in the table below.
TEAS for Rogun HPP Construction Project
Phase II - Vol. 3 – Chap.5 – Reservoir operation study
P.002378 RP 40 page 13 /107
Republic Annual withdrawal volume (km3) Percentage (%)
Uzbek SSR 29.6 48.2
Tajik SSR 9.5 15.4
Kyrgyz SSR 0.4 0.6
Turkmen SSR 22.0 35.8
TOTAL 61.5 100
Table 2.2 : Yearly water volume allocation according to Protocol n°566- Amudarya
It should be noted that this does not include the inevitable flow losses of the whole Amudarya Basin, including losses from rivers and reservoirs (3.85 km3/year), sanitary water releases to the Amudarya river (3.15 km3/year) and water withdrawals for Afghanistan (2.10 km3/year).
It should also be noted that the inter-state limits were set according to the complete exhaustion of water resources, the achievement of which was expected to 1995-2000 year. Further development of all sectors of water users in the basin countries, including the further expansion of irrigated land, should be provided within these set limits thanks to the implementation of actions on water conservation and protection of water resources, and the increase of the efficiency of irrigation systems.
After the end of the Soviet Union, the distribution of water limits of the Amudarya and Syrdarya is exercised by the Interstate Commission for Water Coordination (ICWC), which was established in 1992 in accordance with the Agreement "On cooperation in joint management of use and protection of interstate transboundary water resources”.
ICWC, consisting of the water authorities in Central Asia, is designated to carry out the development and approval of quotas of water consumption per year for each one of the countries, the regimes of reservoirs operation, adjusting them according to updated forecasts depending on actual water availability and economic situation. The Commission holds four meetings per year where water withdrawal limits from the Amudarya and Syrdarya vegetative and non-vegetative season are approved. For proper water management, countries of Central Asia transferred the control and management to jointly established BWO "Amudarya" and "Syrdarya" major water intakes on rivers which are under the management of national branches BWO "Amudarya" and "Syrdarya" in the respective countries.
This procedure of distribution and approval of interstate limits is currently effective, and it is implemented as follows:
1. Countries prepare the water withdrawal plan for the next period (vegetative or non- vegetative period) from the main trunk of the Syrdarya and Amudarya rivers and their major tributaries within the established limits, and address their requests, respectively to BWO "Syrdarya" and BWO "Amudarya";
2. BWO "Syrdarya" and BWO "Amudarya", based on the requests, prepare preliminary draft clarification of limits on water withdrawals from rivers for the upcoming season;
3. BWO "Syrdarya" and BWO "Amudarya", based on Hydro meteorological agencies data of basin countries, prepare forecast on water availability;
4. BWO "Syrdarya" and BWO "Amudarya", based on water availability, clarify limits on water withdrawals from rivers for the respective countries and the relevant river basins;
TEAS for Rogun HPP Construction Project
Phase II - Vol. 3 – Chap.5 – Reservoir operation study
P.002378 RP 40 page 14 /107
5. Clarified water withdrawal limits for the upcoming season BWO "Syrdarya" and BWO "Amudarya" individually represent to the next meeting of the ICWC. An integral part of revised water withdrawal limits for the upcoming season is the schedule of the operation of reservoirs cascade on major rivers and their major tributaries;
6. ICWC members consider the submitted clarified limits and schedule of operation of reservoirs cascade. Taking into account comments and changes, Parties approve them by consensus. From that moment, the signed Minutes of ICWC meeting become the legal basis of interstate water distribution to a specific vegetative or non-vegetative season.
Imposed limits on the ICWC meetings comply with the limits of the Scientific and Technical Council of the former USSR Ministry of Water Resources. Depending on the annual water availability, the absolute values of these limits are often assigned at the level of 95-90% of the supply. In water abundant years the difference of flow goes away at downstream, and is used at the discretion of the downstream countries.
When the available volume forecasted differs from the actual volume, the following applies:
if the forecasts are lower than the actual volumes, the additional water is discharged in the Aral sea;
if the forecasts are higher, a new meeting is held to correct the allocations.
The following table shows the average data distribution of limits between the riparian countries between 1992 and 2010 (Amudarya basin).
Countries Km3/year %
Kyrgyzstan 0.202 0.36
Tajikistan 8.8 15.61
Turkmenistan 20.1 35.62
Uzbekistan 21.3 37.74
Aral and Priaralye 6.014 10.67
Total 56.4 100.0
Table 2.3 : Average water allocation between 1992 and 2010 (Source: Data from BWO “Amudarya” as
of 1992-2010 years)
Details of water use within Tajikistan on the Vakhsh river as taken into account in the simulation are presented in §2.5.
2.4 Inflows
Inflows have been calculated by HPI and presented in the report n°1861-II-2 – Hydrometeorological conditions [5].
It consists in monthly discharges from April 1932 to March 2008 at Rogun site, between Rogun and Nurek, between Nurek and Baïpaza, and between Baïpaza and Sangtuda 1.
TEAS for Rogun HPP Construction Project
Phase II - Vol. 3 – Chap.5 – Reservoir operation study
P.002378 RP 40 page 15 /107
Additional inflows downstream of Sangtuda 1 are negligible; they are therefore not considered in the simulation.
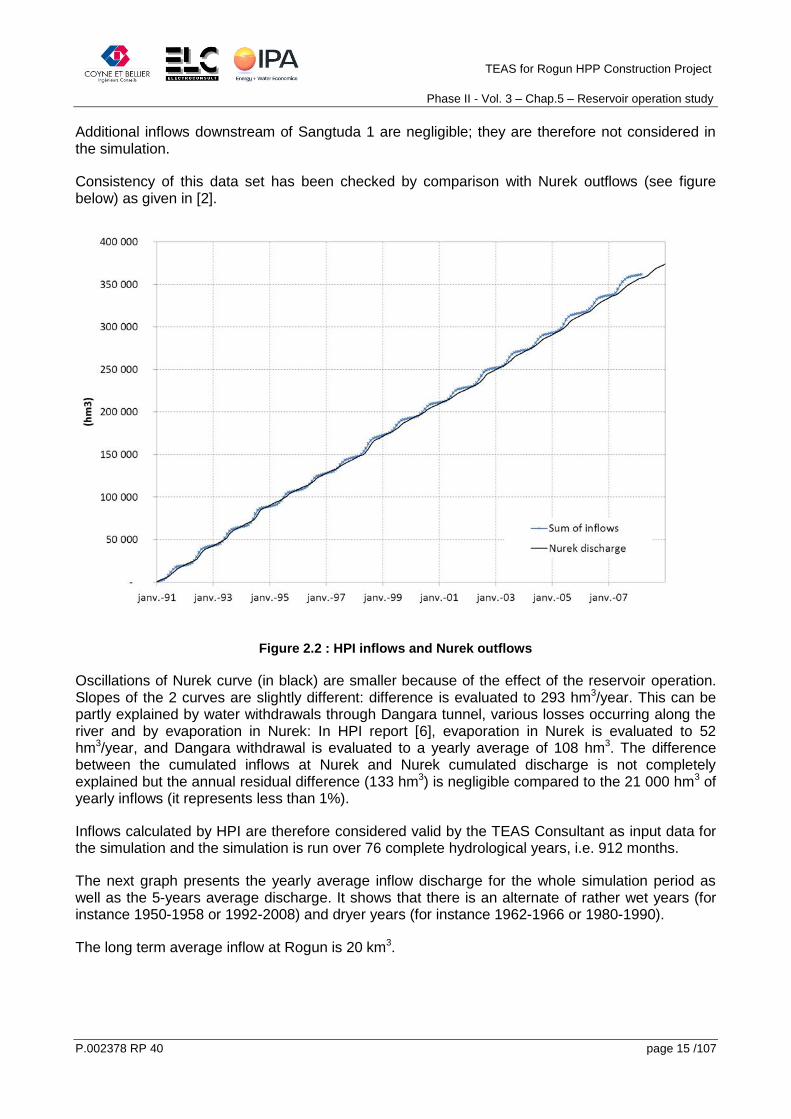
Consistency of this data set has been checked by comparison with Nurek outflows (see figure below) as given in [2].
Figure 2.2 : HPI inflows and Nurek outflows
Oscillations of Nurek curve (in black) are smaller because of the effect of the reservoir operation. Slopes of the 2 curves are slightly different: difference is evaluated to 293 hm3/year. This can be partly explained by water withdrawals through Dangara tunnel, various losses occurring along the river and by evaporation in Nurek: In HPI report [6], evaporation in Nurek is evaluated to 52 hm3/year, and Dangara withdrawal is evaluated to a yearly average of 108 hm3. The difference between the cumulated inflows at Nurek and Nurek cumulated discharge is not completely explained but the annual residual difference (133 hm3) is negligible compared to the 21 000 hm3 of yearly inflows (it represents less than 1%).
Inflows calculated by HPI are therefore considered valid by the TEAS Consultant as input data for the simulation and the simulation is run over 76 complete hydrological years, i.e. 912 months.
The next graph presents the yearly average inflow discharge for the whole simulation period as well as the 5-years average discharge. It shows that there is an alternate of rather wet years (for instance 1950-1958 or 1992-2008) and dryer years (for instance 1962-1966 or 1980-1990).
The long term average inflow at Rogun is 20 km3.

TEAS for Rogun HPP Construction Project
Phase II - Vol. 3 – Chap.5 – Reservoir operation study
P.002378 RP 40 page 16 /107
Figure 2.3 : Simulation period yearly inflows
Complete tables of inflows used in the simulation can be found in appendix A.
2.5 Water withdrawals from Vakhsh River in Tajikistan
Values of water withdrawals have been thoroughly discussed with Barki Tojik and the Ministry of Water resources of Tajikistan. Several sets of water withdrawals were provided, historical and projections reproduced here below. GoT underlines that these values are in full accordance with the established limits based on agreements in force.
The following Table 2.4 presents the available historical chronicles (2005-2011) on average withdrawals and return flows. Table 2.5 gives projected values of withdrawals and return flow, estimated by GoT and using the entire amount of the water share of Tajikistan remaining below the limits set by the existing agreements and practices (in particular the Nukus Declaration and Protocol 566). Table 56 presents the available historical chronicles (2005-2011) on average withdrawals and return flows. These values are the one used in the simulation, respectively in the scenario b and a as defined, and considered constant during the whole simulation period. The return flow takes into account the discharge that is going back to the Vakhsh River via the main Vakhsh canal.
The net difference in terms of volume between the two tables is 1 211 hm3 per year.

TEAS for Rogun HPP Construction Project
Phase II - Vol. 3 – Chap.5 – Reservoir operation study
P.002378 RP 40 page 17 /107
Month 1 2 3 4 5 6 7 8 9 10 11 12 Yearly Volume
(hm3)
Rogun-Nurek 0.97 0.97 1.47 2.03 4.02 6.96 8.89 7.07 3.96 2.10 1.00 1.00 107
Nurek-Baïpaza 2.41 1.93 2.44 10.14 33.22 39.77 46.39 45.46 29.72 10.50 6.03 3.01 611
Baïpaza-Sangtuda 1
0
Sangtuda 1 -Sangtuda 2
0.10 0.19 0.29 0.51 0.80 0.99 1.48 1.21 0.99 0.53 0.30 0.20 20
Sangtuda 2 -Goluvnaya
0.19 0.67 2.93 5.58 7.55 8.45 8.89 7.58 5.94 3.15 2.51 0.71 143
Goluvnaya-Confluence
91.18 89.42 90.10 163.22 221.20 232.12 239.26 236.49 196.32 157.57 118.34 97.89 5093
Return flow 79.38 75.54 74.44 95.59 124.16 127.09 129.85 131.50 109.72 91.02 83.11 80.08 3163
Table 2.4 : Average of actual water withdrawals and return flow during 2005-2011 (m3/s)
Month 1 2 3 4 5 6 7 8 9 10 11 12
Yearly Volume (hm
3)
Rogun-Nurek 5 5 10 25 40 60 75 55 30 20 10 5 899
Nurek-Baïpaza 3 8 15 20 35 45 50 45 35 20 10 5 768
Baïpaza-Sangtuda 1 0.2 0.2 0.5 0.8 1 1.5 2 1.5 1 0.8 0.4 0.2 27
Sangtuda 1 -Sangtuda 2
0.04 0.05 0.05 0.32 0.36 0.39 0.4 0.37 0.32 0.09 0.05 0.03 7
Sangtuda 2 -Goluvnaya
0.55 0.72 3.12 5.45 9.5 11.25 12.01 9.66 8.4 5.45 2.77 0.7 184
Goluvnaya-Confluence
110 115 120 170 220 230 240 230 180 150 150 120 5358
Return flow 81.95 72.73 75.66 109.1 129.41 129.37 134.52 132.83 110.35 89.49 79.86 77.36 3219
Table 2.5 : Prospective water withdrawals and return flow (m3/s)
2.6 Reservoirs characteristics
In this paragraph, all assumptions made in the simulation concerning Rogun and Nurek reservoirs are shown. It is reminded that all other reservoirs are not able to perform regulation on a monthly basis and are therefore considered as run-off-the-river structure at this stage of the studies.
Rogun performances are compared for three full supply levels, 1290, 1255 and 1220 masl. Nurek FSL is 910 masl, Baïpaza FSL is 630 masl, Sangtuda 1 FSL is 571.5 masl, Sangtuda 2 is 509.7 masl, and Goluvnaya FSL is 485 masl.
The minimum operation level is 1185 masl for Rogun FSL at 1290 masl which is the same as considered in HPI design. For the two lower FSL, a common assumption has been chosen: the minimum acceptable level is 66% of the maximum head. It means that the minimum operation level considered are 1161 masl for Rogun FSL at 1255 masl and 1137 masl for Rogun FSL at 1220 masl. Those Minimum Operating Levels are set based on the usual turbines head range capacity: a Francis turbine is able to work between 66 and 125% of its design head.
Nurek minimum operation level is 857 masl.

TEAS for Rogun HPP Construction Project
Phase II - Vol. 3 – Chap.5 – Reservoir operation study
P.002378 RP 40 page 18 /107
The next table presents the evaporation losses considered in Rogun and Nurek reservoir, these data are extracted from the HPI report [6] and considered as satisfactory by the TEAS Consultant. According to HPI, the yearly evaporated volume is 52.3 hm3 in Nurek reservoir and 144 hm3 in Rogun with a reservoir at 1290 masl, which represents a loss discharge of 1.6 m3/s for Nurek and 4.6 m3/s for Rogun at FSL=1290 masl.
Month 1 2 3 4 5 6 7 8 9 10 11 12 Year
Evaporation (mm)
43 0 20 25 39 73 105 138 128 89 91 54 805
Table 2.6 : Rogun and Nurek evaporation losses
Initial Rogun storage capacity vs. elevation curve is presented in the next table.
Rogun
Elevation (masl)
Initial capacity (km
3)
1300 15.084
1290 13.299
1270 10.209
1240 6.764
1210 4.429
1180 2.784
1150 1.599
1120 0.864
1090 0.479
1060 0.239
1030 0.089
Table 2.7 : Rogun reservoir capacity vs elevation
Nurek is partially filled with sediments, reducing its initial storage capacity. Several surveys have been carried out over the years to follow the filling of Nurek reservoir by sediments: in 1989, 1994 and 2001.
The next table shows the main results of those surveys [4].
Volume (km3)
Storage 1972 1989 1994 2001
Total 10.50 8.66 7.96 8.63
Live 4.50 3.40 3.06 4.27
Dead 6.00 5.26 4.90 4.36 Table 2.8 : Evolution of Nurek reservoir capacity
It can be seen on the table above that the exact Nurek volume and bathymetry nowadays is not well known, and that the volume variation from one bathymetry survey to another are doubtful (increased storage capacity between 1994 and 2001 for instance). This was highlighted by other designers in the past. It is therefore recommended that a more realistic storage capacity law for Nurek will be derived during further phases of the study.

TEAS for Rogun HPP Construction Project
Phase II - Vol. 3 – Chap.5 – Reservoir operation study
P.002378 RP 40 page 19 /107
For the purpose of this study, the inflow series (§2.4) and the data available on the past operation of Nurek (reservoir level, outflows on the period 1991-2011 [2]) are used to compute an updated storage capacity vs elevation curve as we cannot rely on existing bathymetry:
each month a differential volume (dV1) can be calculated as the difference between the inflows and the outflows;
a second differential volume (dV2) can be calculated thanks to the reservoir level variation and an assumed storage capacity vs elevation law;
an optimized law that gives the best fit between dV1 and dV2 is found.
The best fit was found to be the following:
Where Zo = 762.7 masl, a = 2.41 and b = 1.64.
The graph compares the historical level data with the one computed based on the volume balance and the best fit reservoir storage law.
Figure 2.4 : Computed reservoir level versus historical Nurek reservoir level
The active storage is found to be 4.2 km3.
It is to be noted that the law is fit on the Nurek reservoir variation within its active storage, between 910 and 857 masl. Therefore, confidence can be given in this law in this range of elevation, corresponding to the active storage.
Moreover, this law is computed using data from 1991-2011 time period, therefore, it is an “average” storage capacity over this period. The storage available between 910 and 857 masl is likely to have decreased during these 20 years.

TEAS for Rogun HPP Construction Project
Phase II - Vol. 3 – Chap.5 – Reservoir operation study
P.002378 RP 40 page 20 /107
This assumption is found sufficient at this stage of the study. Its impact on calibration and model efficiency is detailed in §3.5.
At further stages, the real capacity of Nurek needs to be clarified thanks to the bathymetry survey recommended by the Consultant in Vol 2 Chapt 6 - Sedimentation.
Figure 2.5 : Rogun and Nurek reservoir capacity vs elevation
2.7 Sedimentation
The effect of the sedimentation on energy production is evaluated with the same model and method as any other simulation scenario except that the storage capacity of Rogun and/or Nurek is reduced.
As presented in the sediment management report (Vol2 chapter 6), the yearly solid run off is in the range of 60-100 hm3 per year. For the purpose of this study, and to be on the conservative side, the value 100 hm3/year has been selected.
The USBR method (Design of small dam-Appendix A, USBR) is used to compute the storage capacity vs elevation curve for Nurek and the 3 Rogun dam alternatives from the initial one and assuming an annual sediment transport of 100 hm3.
The next figures present the reservoir curves for different time step for the three dam alternatives.

TEAS for Rogun HPP Construction Project
Phase II - Vol. 3 – Chap.5 – Reservoir operation study
P.002378 RP 40 page 21 /107
Figure 2.6 : Rogun reservoir storage capacity FSL =1290 masl- Impact of sedimentation
Figure 2.7 : Rogun reservoir storage capacity FSL =1255 masl- Impact of sedimentation

TEAS for Rogun HPP Construction Project
Phase II - Vol. 3 – Chap.5 – Reservoir operation study
P.002378 RP 40 page 22 /107
Figure 2.8 : Rogun reservoir storage capacity FSL =1220 masl- Impact of sedimentation
In the case “With Rogun”, Nurek reservoir storage capacity is not modified. Indeed, once Rogun starts to be constructed, the solid run off going into Nurek will decrease and only the solid run off in between Rogun and Nurek will keep filling Nurek reservoir. To take into account the residual filling of Nurek reservoir after Rogun construction, a specific study of sediment is necessary as the knowledge on that subject is today limited. At this level of the studies, considering that after Rogun implementation, Nurek reservoir storage capacity will not change significantly is a reasonable assumption.
In the case “Without Rogun”, Nurek reservoir is modified within time because of the effect of sedimentation, as illustrated on the next figure.

TEAS for Rogun HPP Construction Project
Phase II - Vol. 3 – Chap.5 – Reservoir operation study
P.002378 RP 40 page 23 /107
Figure 2.9 : Nurek reservoir storage capacity.- Impact of sedimentation without Rogun
2.8 Hydropower plants characteristics
To calculate the energy production of each hydropower plants, several parameters have to be introduced: the tailwater level, the turbines efficiency and head losses, and the installed capacity.
The installed capacity of the existing power plants is known: 3000 MW for Nurek, 600 MW for Baïpaza, 670 MW for Sangtuda 1, 220 MW for Sangtuda 2 and 240 MW for Goluvnaya.
The Rogun installed capacity is dealt with in the next paragraph.
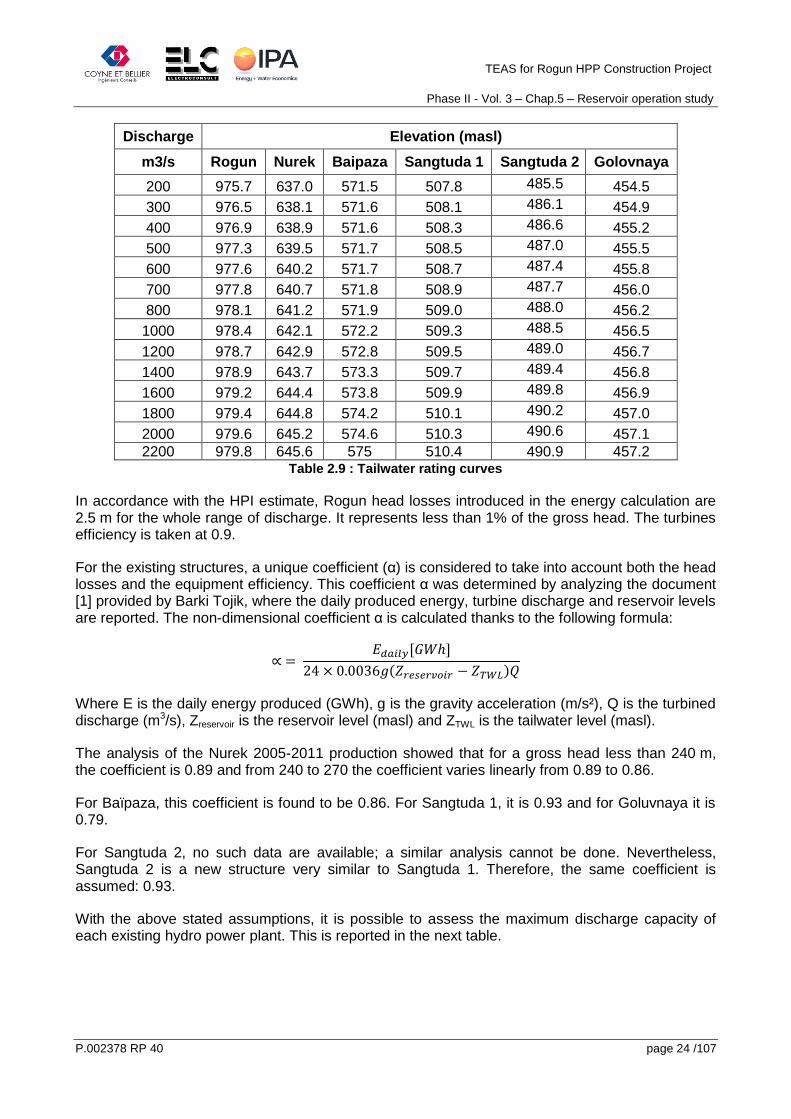
The tailwater rating curves of the five power plants (Rogun, Nurek, Baïpaza, Sangtuda 1 and Goluvnaya) are taken as in HPI report [6]. For Sangtuda 2, the tailwater rating curve was submitted by the Client:
TEAS for Rogun HPP Construction Project
Phase II - Vol. 3 – Chap.5 – Reservoir operation study
P.002378 RP 40 page 24 /107
Discharge Elevation (masl)
m3/s Rogun Nurek Baipaza Sangtuda 1 Sangtuda 2 Golovnaya
200 975.7 637.0 571.5 507.8 485.5 454.5
300 976.5 638.1 571.6 508.1 486.1 454.9
400 976.9 638.9 571.6 508.3 486.6 455.2
500 977.3 639.5 571.7 508.5 487.0 455.5
600 977.6 640.2 571.7 508.7 487.4 455.8
700 977.8 640.7 571.8 508.9 487.7 456.0
800 978.1 641.2 571.9 509.0 488.0 456.2
1000 978.4 642.1 572.2 509.3 488.5 456.5
1200 978.7 642.9 572.8 509.5 489.0 456.7
1400 978.9 643.7 573.3 509.7 489.4 456.8
1600 979.2 644.4 573.8 509.9 489.8 456.9
1800 979.4 644.8 574.2 510.1 490.2 457.0
2000 979.6 645.2 574.6 510.3 490.6 457.1
2200 979.8 645.6 575 510.4 490.9 457.2 Table 2.9 : Tailwater rating curves
In accordance with the HPI estimate, Rogun head losses introduced in the energy calculation are 2.5 m for the whole range of discharge. It represents less than 1% of the gross head. The turbines efficiency is taken at 0.9.
For the existing structures, a unique coefficient (α) is considered to take into account both the head losses and the equipment efficiency. This coefficient α was determined by analyzing the document [1] provided by Barki Tojik, where the daily produced energy, turbine discharge and reservoir levels are reported. The non-dimensional coefficient α is calculated thanks to the following formula:
( )
Where E is the daily energy produced (GWh), g is the gravity acceleration (m/s²), Q is the turbined discharge (m3/s), Zreservoir is the reservoir level (masl) and ZTWL is the tailwater level (masl).
The analysis of the Nurek 2005-2011 production showed that for a gross head less than 240 m, the coefficient is 0.89 and from 240 to 270 the coefficient varies linearly from 0.89 to 0.86.
For Baïpaza, this coefficient is found to be 0.86. For Sangtuda 1, it is 0.93 and for Goluvnaya it is 0.79.
For Sangtuda 2, no such data are available; a similar analysis cannot be done. Nevertheless, Sangtuda 2 is a new structure very similar to Sangtuda 1. Therefore, the same coefficient is assumed: 0.93.
With the above stated assumptions, it is possible to assess the maximum discharge capacity of each existing hydro power plant. This is reported in the next table.

TEAS for Rogun HPP Construction Project
Phase II - Vol. 3 – Chap.5 – Reservoir operation study
P.002378 RP 40 page 25 /107
Nurek Baïpaza Sangtuda 1 Sangtuda 2 Goluvnaya
Installed capacity (MW) 3000 600 670 220 240
Estimated maximum discharge (m3/s) 1500 1190 1190 1110 1090
Table 2.10 : Vakhsh cascade installed capacity and maximum discharge
2.9 Rogun installed capacity
At this phase of the studies, three installed capacities shall be studied for each FSL alternative.
The maximum one is the installed capacity having the same plant factor as P=3600 MW for FSL = 1290 masl (HPI design).
An analysis of a preliminary run of the model and of the Vakhsh natural run-off has been used to derive the two other installed capacities for each FSL.
The three installed capacities chosen to be studied are the following:
FSL = 1220 masl FSL = 1255 masl FSL = 1290 masl
High installed capacity 2 800 MW 3 200 MW 3 600 MW
Medium installed capacity 2 400 MW 2 800 MW 3 200 MW
Low installed capacity 2 000 MW 2 400 MW 2800 MW
Table 2.11 : Installed capacities selected
The choice of Rogun installed capacity is independent from the other installed capacity of the cascade. Indeed, as it will be presented in the following, Rogun operation is simulated in such manner that the river flow downstream of Nurek will not be changed. Therefore, Rogun installed capacity, and maximum discharge, will not impact the downstream power plants operation.
The number and size of the units are not taken into account in this study. Here, the objective is to assess the maximum energy that can be produced regardless the units’ configuration.
2.10 Rogun Early impounding
2.10.1 Schedule
The reservoir filling is closely linked to the work schedule and especially the dam rise schedule. The energy production during the reservoir filling is also linked to the units implementation sequence. The construction schedule is studied in detail in the dedicated report. Only key dates and assumptions are reminded here.
It is assumed that the maximum reservoir level is always 10 m lower than the crest of the dam.
The next figure presents the dam rise schedule for the three alternatives.

TEAS for Rogun HPP Construction Project
Phase II - Vol. 3 – Chap.5 – Reservoir operation study
P.002378 RP 40 page 26 /107
Figure 2.10 : Dam rise schedule - FSL=1290, 1255 and 1220 masl
2.10.2 Temporary units characteristics
The Rogun filling period is simulated for the three alternatives with the highest installed capacity. In this paragraph, the temporary units characteristics are presented.
For the highest alternative (FSL=1290 masl), the temporary units are taken as designed by HPI as the two temporary runners are already constructed. The temporary units sequence is as followed:
First step: 2 units with a minimum net head of 80 m; and maximum net head of 120 masl. The maximum flow per unit is 191 m3/s. This step use temporary runners and temporary generators.
Second step: 2 units with a minimum net head of 120 m and a maximum net head of 185 m. Here, the runners have been replaced by the final ones.
Third step: 6 units with a minimum head of 185 m and a maximum net head of 320 m. Here the 6 units are in their final arrangement. The two first units have to be modified by increasing the rotational speed to its nominal value. To do it, the stator is rewinded and the rotor poles are changed.
Given the reservoir rise schedule, only the second and third steps are used.
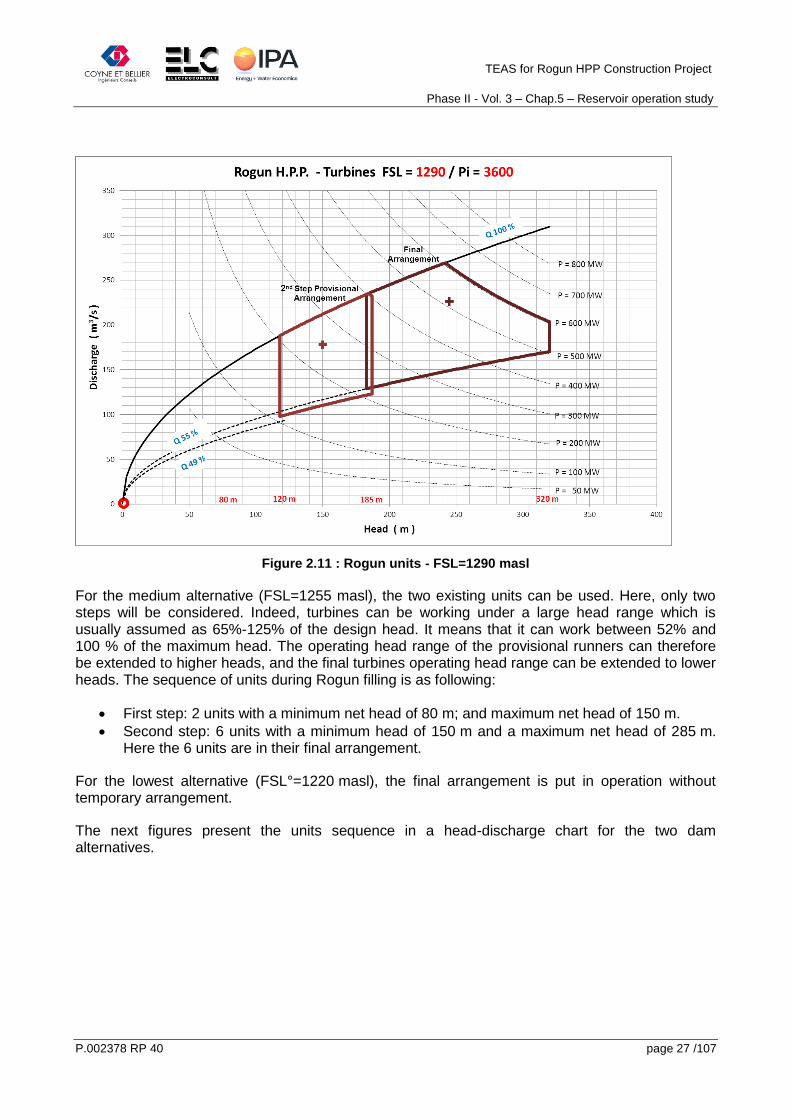
The following figure presents the units sequence in a head-discharge chart.
TEAS for Rogun HPP Construction Project
Phase II - Vol. 3 – Chap.5 – Reservoir operation study
P.002378 RP 40 page 27 /107
Figure 2.11 : Rogun units - FSL=1290 masl
For the medium alternative (FSL=1255 masl), the two existing units can be used. Here, only two steps will be considered. Indeed, turbines can be working under a large head range which is usually assumed as 65%-125% of the design head. It means that it can work between 52% and 100 % of the maximum head. The operating head range of the provisional runners can therefore be extended to higher heads, and the final turbines operating head range can be extended to lower heads. The sequence of units during Rogun filling is as following:
First step: 2 units with a minimum net head of 80 m; and maximum net head of 150 m.
Second step: 6 units with a minimum head of 150 m and a maximum net head of 285 m. Here the 6 units are in their final arrangement.
For the lowest alternative (FSL°=1220 masl), the final arrangement is put in operation without temporary arrangement.
The next figures present the units sequence in a head-discharge chart for the two dam alternatives.

TEAS for Rogun HPP Construction Project
Phase II - Vol. 3 – Chap.5 – Reservoir operation study
P.002378 RP 40 page 28 /107
Figure 2.12 : Rogun units - FSL=1255 masl
Figure 2.13 : Rogun units - FSL=1220 masl

TEAS for Rogun HPP Construction Project
Phase II - Vol. 3 – Chap.5 – Reservoir operation study
P.002378 RP 40 page 29 /107
Concerning the units implementation sequences, the following assumptions are taken into account:
Temporary unit 6 and 5 can be ready to operate after 32 and 35 months respectively after the river diversion.
Changing the rotational speed takes 4 months plus 2 months for the wet tests;
Finally, the key dates for the various units commissioning are presented in the next table.
Table 2.12 : Key dates for early generation
3 METHODOLOGY
3.1 General
Usually, a river production simulation model is defined by various water use rules along the river, at the downstream point of the model and by power production requirements. Those rules and requirements lead to an optimization of the operation.
Here, the various water uses along the river have been indeed defined and provided by the Client (see §2.5), but not at the downstream point of the cascade, before confluence of Vakhsh and Pyandj rivers.
The Nukus declaration, that rules the water use on the Vakhsh River, does not contain the precise water allocations and reservoir operation as they are decided each year by the ICWMC (see §2.3). Therefore, the definition of one downstream water demand usable as a boundary condition in the simulation is rather complicated.
As a consequence, given the data available, the Consultant proposed to calibrate the model with the objective that the seasonal flow pattern downstream of Nurek will remain unchanged and will mimic for the future years the outflow recorded at Nurek outlet for the period January 1991 to July 2011.
1290 masl 1255 masl 1220 masl
TEAS Validation - - -
Diversion 28 28 28
Commissioning U 6 Temp. 73 73 82 (final)
Commissioning U 5 Temp. 75 75 84 (final)
End of Erection U4 85 85 85
End of Erection U3 98 98 98
End of Erection U2 112 112 112
End of Erection U1 112 112 112
Minimum Reservoir level reach 112 94 80
Temp U5 and U6 shut down 117 114
Commissioning U 4 115 101 101
Commissioning U 3 117 114 114
Commissioning U 2 119 116 116
Commissioning U 1 121 118 118
Commissioning U 6 123 120
Commissioning U 5 127 122

TEAS for Rogun HPP Construction Project
Phase II - Vol. 3 – Chap.5 – Reservoir operation study
P.002378 RP 40 page 30 /107
The present cascade operation principle will therefore remain unchanged: unless differently agreed with the neighboring countries, the future operation of Vakhsh hydropower cascade shall replicated the principle that was used to operate Nurek over the recent years. It means that the Rogun and Nurek combined reservoirs will be progressively emptied form October to March for electricity production and will be progressively filled from April to September. The water volume balanced from summer to winter shall not exceed the present one, which is actually the active storage of Nurek.
More precisely, the method consists in:
analysing the past operation of Nurek and finding an operation rule (the present operation principle) that reproduces as much as possible the historical data available (1991-2008) in terms of discharge, energy and reservoir level (see §3.3);
modify this operation rule to improve the energy production distribution within winter and within the limit set by the principle (unchanged operation principle) (see § 3.5); and then extend the operation rule to the whole simulation period (1932-2008);
apply this operation rule to all other scenarios on the whole simulation period (1932-2008) (see §3.7 and 4).
This methodology is adapted to the objectives of the study and the model should be accurate enough to :
assess the additional future energy production resulting from Rogun implementation
check that this additional future energy production can be achieved without changing the operation principle other than the change due to the full use of Tajik water allocation;
The model is not meant to predict what will be the future water releases but is meant to calculate the maximum energy than can be produced by the whole cascade without changing the present operation principle of the Vakhsh cascade other than the change due to the full use of Tajik water allocation.
Simulated structures Period 1991-2008 Period 1932-2008
Nurek alone Model calibration -
Nurek and the downstream cascade
- Energy production
improvement
Rogun, Nurek and the downstream cascade -
- Rogun and Nurek coupled operation optimization
- Computation of all scenarii
The calibration period is defined as the longest common period between the inflows series (1932-2008) and the Nurek past operation data (1991-2010), ie 1991-2008.
The simulation period is defined as the longest inflows series available: 1932-2008.
It is noteworthy that the daily peaking possibility is not assessed in this report here because the simulation time step is the month. All variables presented are monthly data. It is to be noted that operating Rogun in peaking mode could be possible within the monthly operation studied here but

TEAS for Rogun HPP Construction Project
Phase II - Vol. 3 – Chap.5 – Reservoir operation study
P.002378 RP 40 page 31 /107
it will not change the average monthly energy production. The peaking operation can be assessed thanks to the economic analysis by dispatching the total energy within a day to fit the demand.
3.2 Calculation algorithm for reservoir simulation
All the simulation calculations are based on water volume balances. The operation constraints are imposed thanks to a “required water release” which consists in a monthly discharge that has to be released downstream of the reservoir.
It has to be noted that the “required water release” is a computational tool and can be defined in various ways in relation with the selected operation rule: it can be a constant value, or a constant yearly distribution, or a function of the previous reservoir level or a function of the hydrology for instance.
Then, the water volume split up is decided by the following algorithm:
1. The required release is discharged through the turbines.
a. Either the monthly inflows are sufficient to fulfill the required release;
b. either it is completed by water from the reservoir. In that case, the reservoir level decreases but is limited by its minimum operating level. The unmet minimum release is postponed to the next month;
2. The remaining water surplus is discharged through turbines and then spillways.
The calculation steps are as follows for each month:
Vinflow: volume of water inflowing during the month
Vstor: Volume available in the reservoir to store some water
Vavail:: Active volume of water available in the reservoir
Vturb max : Maximum volume of water that can be turbined within a month
Vmin : Volume of water that has to be release within a month, it is the “required water release”

TEAS for Rogun HPP Construction Project
Phase II - Vol. 3 – Chap.5 – Reservoir operation study
P.002378 RP 40 page 32 /107
Figure 3.1 : Calculation algorithm
3.3 Energy variable
The simulation results in terms of energy are derived through four variables:
The 95% of exceedance winter energy (Ew-95%): this is the monthly energy that is exceeded 95 winter months over 100. Among the 912 months simulated, 459 are in winter (month October to march), the Ew-95% is the monthly energy that is exceeded on more than 436 months.
The firm energy: this is the 95% of exceedance power times the number of hour within a year.
The average yearly energy.
The secondary energy: this is the total produced energy minus the firm energy.
The next figure illustrates the firm and secondary energy.
Figure 3.2 : Firm and secondary energy definition
V1=Min(Vmin;Vinflow) is turbined
V2=Min(V
min–V1;Vavail
) is turbined
Є=Vmin-V1-V2
V2=Min(V
inflow–V
1; V
turb max) is turbined
V3= V
inflow–V
1-V
2 is spilled
If Vmin > Vinflow If Vmin
< Vinflow
Go to next month Where Vmin = Vmin + є
If Vinflow
> V1 +V
2
TEAS for Rogun HPP Construction Project
Phase II - Vol. 3 – Chap.5 – Reservoir operation study
P.002378 RP 40 page 33 /107
3.4 Nurek operation understanding
The Nurek past operation is known from 1991 to 2011 as provided in the document [2]. The next figures present the outflow discharge, the reservoir level and the energy produced all along this period on a monthly basis.
The discharge curves (Figure 3.3) show that Nurek is regulating part of the natural flows: in winter, the natural inflow is around 200 m3/s while Nurek outflow is around 350-400 m3/s. In summer, the natural inflow is lowered by 200-1000 m3/s depending on the years. Part of the summer inflow is stored in the reservoir to increase the natural flow in winter and increase the energy produced in winter when Tajikistan domestic demand is high.
At the end of winter, the outflows and the energy production drop down. This can be explained by the fact that a very limited amount of water is still available in the reservoir at that period and the head is much reduced as the reservoir level decreases.
Summer peaks of energy produced are scattered (Figure 3.4): some years, 1700 GWh are produced in July while other years only 1000 GWh are produced. This is partly explained by the hydrological variability but not only. It can be suspected that some years part of the HEM equipment does not ensure a full use of the total installed capacity of Nurek (3000 MW). Another explanation could be a low demand in summer which limits the electricity that can be sent on the grid.
The energy produced in winter does not present a regular shape: end of winter low peaks seem to be random, and the high peaks of January are not constant either from one year to another. Moreover, no meaningful correlation has been found between the shape of winter peaks and the hydrology or the temperature (which should be related to the energy demand in winter).
As the reservoir operation and water allocation are decided each year by the ICWC based on the water availability forecasts, a correlation between outflows and inflows could be expected. But, no meaningful correlation has been found between outflows and hydrology (see Figure 3.5) even though the regulation effect is clear. It could be interesting to have access to forecast inflows computed by the ICWC each year to check if Nurek outflows are somehow correlated to these series.
The only regular pattern observed in the past Nurek operation is the reservoir level variation that almost always varies from the full supply level (910 masl) in September to the minimum operating level (857 masl) in April.

TEAS for Rogun HPP Construction Project
Phase II - Vol. 3 – Chap.5 – Reservoir operation study
P.002378 RP 40 page 34 /107
Figure 3.3 : Historical Nurek outflow and reservoir level (1991-2008)
Figure 3.4 : Historical Nurek energy production (1991-2008)

TEAS for Rogun HPP Construction Project
Phase II - Vol. 3 – Chap.5 – Reservoir operation study
P.002378 RP 40 page 35 /107
Figure 3.5 : Nurek outflows versus Nurek inflows
3.5 Model calibration
It has been chosen to impose a reservoir level operation rule curve at Nurek to simulate the past operation of the Vakhsh cascade in order to check the calibration of the model and evaluate the associated uncertainties. This choice is based on:
the observation made in the previous paragraph;
the results of several attempts. In particular, imposing a minimum release has found to be a less accurate operation rule than imposing a reservoir rule curve.
Each month, water is stored or discharged (through turbines and spillways) to reach the level imposed as a rule. First, the historical average level of each month is imposed, and then it is slightly modified to improve the history/simulation fit. A trial and error procedure is therefore used to achieve an average error of 5% between the historical and simulated of the outflows.
Results of this calculation are presented in the next graphs. Detailed tables are in Appendix D.
Here under, the reservoir level and outflows of each year are plotted on the same graph: each thin curve represents a specific year and the bold curves are the average for each month. It highlights the distribution and scattering of the historical and simulated data.

TEAS for Rogun HPP Construction Project
Phase II - Vol. 3 – Chap.5 – Reservoir operation study
P.002378 RP 40 page 36 /107
Figure 3.6 : Nurek Reservoir level - Comparison between historical data and simulation results
The simulated reservoir level curves are all superimposed. Indeed, the operation rule imposes the reservoir level, therefore, if it is correctly respected, no variation should be observed from the rule.
This reservoir rule curve means also that each year the same water volume is balanced from summer to winter. As calibrated, it represents 4208 hm3. The historical average water volume balance is 4127 hm3 and varies from 2700 hm3 to 4900 hm3 depending on the year.
The simulated curve is higher than the historical average one by a maximum value of 2.4 m. This can be explained by the fact that there are some uncertainties on the Nurek reservoir storage capacity: the computed law (see §2.6) tends to slightly overestimate the Nurek active storage. Therefore, in order to balance the same volume of water from summer to winter, the minimum reservoir level reach in the end of winter is slightly higher than in the historical average.
The Figure 3.8, Figure 3.9 and Figure 3.7 compare the historical and simulated Nurek outflows. The three types of plot are complementary.
Figure 3.9 shows that:
The average of simulated outflows is very close to the historical one all along the year.
in winter, simulated curves are less scattered than the historical one. In summer, simulated and historical curves have approximately the same scattering width: from 600 to 1700 m3/s in July. In May and June the simulated curves are more scattered: in wet year the discharge is higher and in dry year the discharge is slightly lower.
Figure 3.9 presents the cross plot of the simulated discharge versus the historical one. It can be seen that the series of points follows a 1/1 slope and is more and more scattered toward high discharges.
An example of an isolated point is spotted on every graph.

TEAS for Rogun HPP Construction Project
Phase II - Vol. 3 – Chap.5 – Reservoir operation study
P.002378 RP 40 page 37 /107
All this evidences that the calibration is efficient enough for the purpose of the simulation as the seasonal pattern (high scattering of the summer discharges) is reproduced. It is to be noted that this pattern is well reproduced as a trend but not really on a systematic comparison.
Figure 3.7 : Comparison of historical and simulated Nurek outflows
Figure 3.8 : Nurek Outflows - Comparison between historical data and simulation results
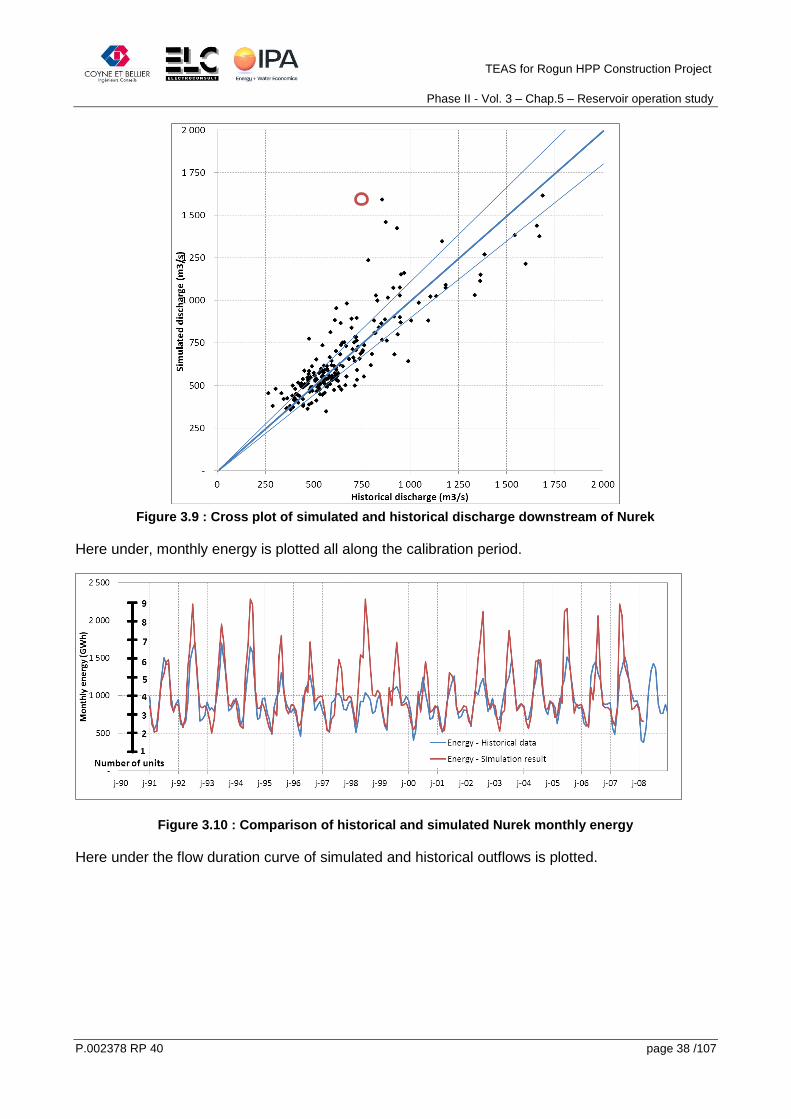
TEAS for Rogun HPP Construction Project
Phase II - Vol. 3 – Chap.5 – Reservoir operation study
P.002378 RP 40 page 38 /107
Figure 3.9 : Cross plot of simulated and historical discharge downstream of Nurek
Here under, monthly energy is plotted all along the calibration period.
Figure 3.10 : Comparison of historical and simulated Nurek monthly energy
Here under the flow duration curve of simulated and historical outflows is plotted.

TEAS for Rogun HPP Construction Project
Phase II - Vol. 3 – Chap.5 – Reservoir operation study
P.002378 RP 40 page 39 /107
Figure 3.11 : Nurek Outflows duration curve - Comparison between historical data and simulation
results
The shape of simulated curves is, as expected, very regular. There is a large difference in summer energy: the simulated peaks are much higher than the historical ones. In terms of outflows, the two curves (simulated and historical) are close.
The next table presents the average of deviations between historical data and simulated values for each month.
These deviations include a certain number of uncertainties and simplifications made to build the model:
the first and more important one is the fact the historical variability is difficult to reproduce with a single reservoir operation rule repeated every year;
uncertainties on hydrological data (inflows), and Nurek operation data;
simplification and uncertainties brought by the computed Nurek storage capacity law (see §2.6).

TEAS for Rogun HPP Construction Project
Phase II - Vol. 3 – Chap.5 – Reservoir operation study
P.002378 RP 40 page 40 /107
Month Outflows Energy
produced Reservoir level (m)
1 2% -1% -0.5
2 2% 2% 0.7
3 3% 5% 2.7
4 3% 4% 2.5
5 4% 8% 0.9
6 4% 15% 0.8
7 0% 23% -1.0
8 3% 28% -0.7
9 1% 11% 0.2
10 3% 6% -0.1
11 4% 6% -0.2
12 3% 3% -0.2
Table 3.1: Average monthly deviation of Simulation results with regards to Historical data – Nurek
HPP
The average outflows deviation is lower than 5% for each month. The average deviation in terms of reservoir level is less than 1 meter all year long, except in March and April where it reaches 2.7 and 2.5 m respectively. It represents less than 5% of the possible reservoir level variation (FSL – MOL). It is to be noted that for all months, the outflow is slightly higher than the historical one.
The results of outflows and reservoir level show that the model reproduces the past operation of Nurek with an acceptable approximation.
In winter, the energy production results are also quite close to historical data: the maximum average deviation is 6% in October. The winter energy is slightly higher than historical data due to the two different sources of uncertainties highlighted above:
the calibration process that found a water volume balanced from summer to winter 2% higher than the average historical one;
and the storage capacity law that tends to slightly overestimate the reservoir level in the end of winter.
The energy production in summer is very different (+ 28% in the model in August). This could be explained by the fact that in the simulation, the maximum turbine capacity is always assumed to be available. In reality, the maximum possible energy is not always produced because of equipment
TEAS for Rogun HPP Construction Project
Phase II - Vol. 3 – Chap.5 – Reservoir operation study
P.002378 RP 40 page 41 /107
non-availability or maintenance or because of a lack of energy demand in summer. On Figure 3.10, along the energy axis the corresponding number of operating units is indicated. By limiting the operational units in the simulation, the historical energy production could be reproduced.
As presented, the model gives a reasonable approximation of the Vakhsh cascade behavior, considering full availability of equipment; and the various assumptions made lead to an acceptable systemic error with respect the objectives of the study. It is reminded that the model should be accurate enough to:
assess the additional future energy production resulting from Rogun implementation
check that this addition future energy production can be achieved without changing the operation principle and as a consequence the seasonal flow pattern;
The average yearly energy produced by the calibrated model of Nurek and the whole cascade is the following:
ENurek=11 718 ± 1 422 Є [8 841; 15 544] GWh
ECascade=19 885 ± 2 313 Є [15 375; 25 982] GWh
(where E=average ± standard deviation Є [minimum; maximum])
3.6 Nurek operation improvement
The operation rule found in the previous paragraph allows reproducing the past behavior of Nurek. No additional optimization of any kind has been done at this point.
Comparing the past energy production and the energy demand variation within a year, it can be seen that improvements are possible in the Nurek operation. Indeed, the demand is higher at the end of winter than at the beginning.
With a trial and error procedure, the reservoir rule curve will be modified in order to have more water available in February and March and produce more energy in these months. It means that the reservoir level should be lowered more slowly at the beginning of winter so that enough water remains until the end of winter. In that case, less energy is produced in October but more in February-March when the demand is still high.
This procedure aimed at increasing the 95% probability of exceedance of winter energy (Ew-95%).
This improvement of Nurek operation will not change the summer outflows but only the distribution of winter outflows. The total volume stored remains unchanged and corresponds to Nurek active storage capacity. Therefore, the regulation of the river and the operation principle of the Vakhsh river is not changed.
The improved operation rule curve that has been found shall then be transformed in terms of volume or discharge to be usable in any scenario that includes both Nurek and Rogun. This reservoir operation rule can be easily transformed in “required release” as defined in the calculation algorithm (see §3.2) thanks to the volume balance principle:

TEAS for Rogun HPP Construction Project
Phase II - Vol. 3 – Chap.5 – Reservoir operation study
P.002378 RP 40 page 42 /107
=> ( ) ( )
=> ( ) ( )
Where V(Zi) is the reservoir level of the month, and V(Zi-1) the reservoir level of the previous month.
In the following, the term “required release” refers to the discharge calculated thanks to the previous formula from the reservoir level operating rule that have found to be the best way to calibrate the model. At each calculation step, it is a function of the previous reservoir level and the inflows.
3.7 Rogun and Nurek coupled operation
The principle established in 3.1 imposes a certain level of regulation that is limited by Nurek active storage capacity and that cannot be increased. Therefore, within this limit, the only parameter that can be adapted is the share of regulation between Rogun and Nurek. The two extreme possibilities are:
Doing all the regulation allowed in Rogun and Nurek is a run off the river;
Doing all the regulation allowed in Nurek and Rogun is a run off the river;
The optimum operation could be in between.
The “required release" found and define in the previous paragraph has to be respected downstream of Nurek. The same required release (minus the intermediate inflows, plus the intermediate withdrawals) can be fully or partly respected downstream of Rogun. This can be quantified by a “regulation ratio” that is defined as the ratio between the required release considered downstream of Rogun and the maximum one (the one that has to be respected in Nurek). This “regulation ratio” is illustrated in Figure 3.12.
If no required release is imposed downstream of Rogun, the regulation ratio is 0, it will be a run-off-the-river and Nurek will have to do all the regulation.
If the “full” required release is imposed downstream of Rogun, the regulation ratio is 1, and Rogun will do all the regulation and Nurek will be a run-off-the-river.
Those two extremes and several intermediates situations are computed, and the Ew-95% is calculated for each of them.

TEAS for Rogun HPP Construction Project
Phase II - Vol. 3 – Chap.5 – Reservoir operation study
P.002378 RP 40 page 43 /107
Figure 3.12 : Illustrative explanation of the "regulation ratio"
3.8 Rogun and Nurek coupled operation during Rogun filling
When Rogun is low, it is more interesting in term of energy production to make the regulation in Nurek: the head decrease made in Rogun to increase the turbined discharge in winter is more important than the increase brought to Nurek reservoir level.
On the other hand, when Rogun reaches a certain level, it starts to be more interesting to regulate in Rogun even though the full supply level is not reach yet: the turbined discharge in Rogun is significantly increased and Nurek remains at its maximum reservoir level created a higher head.
The optimum Rogun level for which the regulation starts in Rogun has been studied. A range of levels has been tested: from 1050 masl to 1290 masl, as well as a range of regulation ratio (from 0 to 1). It has been found that the optimum in term of winter energy is:
to operate Rogun as a run-off-the river hydropower plant (regulation ratio is 0) as long as the reservoir level is lower than 1140 masl;
Then, to start regulate in Rogun (regulation ratio is 0.2) and to gradually increase the regulation in Rogun as the reservoir level rises;
And to perform the complete regulation in Rogun (regulation ratio = 1) when the reservoir level reaches 1210 masl.
4 SCENARIOS STUDIED
4.1 Simulation scenario cases for normal operation
As mentioned earlier, for the need of numerical simulations, the following boundary conditions will be always observed:
The Vakhsh river operation principle remains unchanged;
The monthly irrigation withdrawals and return flows between Rogun and the end of Vakhsh cascade (confluence with the Pyandj river) will be evaluated by GoT, but will in any case remain in full compliance with Nukus Declaration (Protocol 566) and within the limits set by the ICWC in application of Nukus declaration for the Vakhsh river and protocol 566.

TEAS for Rogun HPP Construction Project
Phase II - Vol. 3 – Chap.5 – Reservoir operation study
P.002378 RP 40 page 44 /107
Different cases will be simulated for each FSL:
a) Current status extrapolated
The Vakhsh river operation principle remains unchanged;
The withdrawals and return flow are derived from the factual data of 2005-2011 available on Vakhsh. This data shall be consistent with the decade data (limits and facts) that were published by ICWC.
b) Base line – Future use of Tajikistan water allocation
The Vakhsh river operation principle remains unchanged;
The withdrawals and return flow monthly values are average projected values estimated by GoT using full water allocation of Vakhsh and remaining below the limits set up by the Nukus declaration and protocol 566.
It is to be noted that the impact of sedimentation into Rogun reservoir has been studied on case (b) all along the project life span.
For comparison purposes, the current cascade (i.e without Rogun) will also be simulated as a baseline scenario.
4.2 Simulation scenario for Rogun reservoir filling
In addition to the Normal Operation cases, the Consultant will also run the reservoir filling period assuming the following:
The Vakhsh river operation principle remains unchanged;
The withdrawals and return flow are derived from the factual data of 2005-2011 on Vakhsh River not exceeding Nukus declaration and Protocol 566 limits on river Vakhsh. It was agreed that reservoir filling will only be done within the water allocation of Tajikistan on Vakhsh River.
The difference between the limit and the average factual withdrawals is used to fill Rogun. This means that each year, the same volume (1211 hm3) is available to fill Rogun reservoir.
Construction period for the three FSL alternatives will be determined by the Consultant.
Limitations due to triggered seismicity or other potential limiting factors are taken into account in defining the rate of filing of the reservoir during construction.
4.3 Recapitulative chart
The next table shows all the scenarii and alternatives that will be studied. As a total, 20 simulations have to be run.

TEAS for Rogun HPP Construction Project
Phase II - Vol. 3 – Chap.5 – Reservoir operation study
P.002378 RP 40 page 45 /107
Installed capacity
(a) (b) Filling (b) +
sedimentation
Without Rogun yes yes
FSL = 1290 masl
3600 MW yes yes yes yes
3200 MW
yes
2800 MW
yes
FSL = 1255 masl
3200 MW yes yes yes yes
2800 MW
yes
2400 MW
yes
FSL = 1220 masl
2800 MW yes yes yes yes
2400 MW
yes
2000 MW
yes
Table 4.1 : Scenario and alternatives simulated
5 SIMULATION RESULTS FOR NORMAL OPERATION
For each simulation case, the detailed simulation results are presented in Appendix D.
In this paragraph, only main results and comparison between the various scenarios are presented.
5.1 Without Rogun
5.1.1 Reservoir rule curve
The improved Nurek operation rule is a reservoir rule curve presented in the Figure 5.1.
The reservoir lowering is slower than the calibrated rule curve. And the minimum reservoir level is reached at the end of April, and is 860 masl, as for the calibrated curve. The principle of keeping the same river operation principle imposes not to regulate more than presently and so not to lower the reservoir more than at current state
It has also been checked that this rule curve is the optimized one in terms of amplitude, ie in term of Minimum Operating level. The 95% of exceedance energy (on winter months and all months) has been calculated for several minimum operating levels and results are shown in the Figure 5.2.

TEAS for Rogun HPP Construction Project
Phase II - Vol. 3 – Chap.5 – Reservoir operation study
P.002378 RP 40 page 46 /107
Figure 5.1 : Nurek reservoir level rule curve - Calibrated and improved
Figure 5.2 : Nurek E95% versus Minimum Operating level
For low MOLs, The 95% of exceedance energy of the winter months is higher than the 95% of exceedance energy of the whole year. Indeed, for low MOLs, the April months (considered as summer) produce less energy than all winter months because of the reduced head.
The Figure 5.2 shows that the optimum is in between 850 and 860 masl.
Therefore, the rule curve found and presented in the Figure 5.1 fulfils the two goals of the simulation: improve the winter energy produced and keep the River operation principle unchanged.

TEAS for Rogun HPP Construction Project
Phase II - Vol. 3 – Chap.5 – Reservoir operation study
P.002378 RP 40 page 47 /107
5.1.2 Results scenario (a)
Hereafter are presented the various results of the scenario simulating the cascade “Without Rogun” in present condition (scenario (a)).
First, the comparison of the simulated and historical discharge between 1991 and 2008 at the outlet of Nurek is presented to highlight the difference between the calibration (§3.5) and Nurek operation improvement. It can be seen on Figure 5.3. In March and April, the simulated discharges are higher than the historical one by 100 m3/s approximately. This is the effect of the reservoir rule curve modification: more water remains available at the end of winter. To balance that, discharges are lower in October and November. In summer (may to august), both the average and the scattering are close to the historical data.
Figure 5.3 : Without Rogun (a) - Comparison of historical and simulated discharge downstream of
Nurek (1991-2008)
Figure 5.4 shows the cross plot of the simulated discharge versus the historical one. It can be seen that the series of points is quite close to the 1/1 slope. The distribution of the points is very similar to the one found after the calibration (see §3.5), except for the small discharges (lower than 500 m3/s) that are shifted upward.

TEAS for Rogun HPP Construction Project
Phase II - Vol. 3 – Chap.5 – Reservoir operation study
P.002378 RP 40 page 48 /107
Figure 5.4 : Cross plot of simulated (Without Rogun-Scenario a) and historical discharge
downstream of Nurek
In terms of energy, the low peak that is observed in the historical production in March-April is now in the same range as the one observed in October. The energy production during the whole winter is more regular than in the historical production. As for the calibrated series, the summer energy (may to august), is much more important than the historical one. This can be explained by the fact that in the simulation, the maximum turbine capacity is always assumed to be available. In reality, the maximum possible energy is not always produced because of equipment non-availability or maintenance or because of a lack of energy demand in summer.
Figure 5.5 : Without Rogun (a)- Comparison of historical and simulated energy produced
The Nurek 95% exceedance energy in winter (EW-95%) is 645 GWh per month. The EW-95% of the whole cascade is 1107 GWh per month.

TEAS for Rogun HPP Construction Project
Phase II - Vol. 3 – Chap.5 – Reservoir operation study
P.002378 RP 40 page 49 /107
With a calibrated operation of Nurek, Nurek was able to produce a 95% exceedance energy in winter of 519 GWh per month. The whole cascade was able to produce a 95% exceedance energy in winter of 915 GWh per month. The improved operation allows increasing by 21% the cascade guaranteed energy (EW-95%).
The average yearly energy produced by Nurek and the whole cascade is the following:
ENurek=11 753 ± 1 419 Є [8 758; 15 501] GWh
ECascade=19 910 ± 2 336 Є [15 104; 25 916] GWh
(where E=average ± standard deviation Є [minimum; maximum])
The firm energy produced by the whole cascade is 13 040 GWh per year.
It is to be noted that the average energy produced by Nurek and by the whole cascade is approximately the same with and without the improved operation. Only the quantity of guaranteed energy is increased.
Figure 5.6 : Average monthly energy produced by the cascade along the year
The distribution of the monthly energy is presented in the next figure (the 2 dotted lines are the “typical” wet and dry years). It can be noted that the difference between a wet and dry year is limited to the highest energy, ie summer month where the discharge variability is important. In winter, the difference is very limited. Variation of average energy produced by the cascade on the wet years (inflows higher than the complete series average) and dry (inflows lower than the complete series average) years are presented in the table below.
(GWh) Wet years Dry years
Average yearly energy 21 857 18 221
Table 5.1 : Cascade energy production during wet or dry years - Without Rogun (a)

TEAS for Rogun HPP Construction Project
Phase II - Vol. 3 – Chap.5 – Reservoir operation study
P.002378 RP 40 page 50 /107
Figure 5.7 : Without Rogun (a) - Nurek monthly energy distribution
Figure 5.8 : Without Rogun (a) - Vakhsh cascade monthly energy distribution
In the simulation, spillage episode have been used only 14 summers over 76. Over the whole simulation period, the total volume of spilled water is 4280 hm3, ie an average of 56 hm3/year. This represents less than 0.5% of the average inflows.
The discharge at the downstream point of the Vakhsh river all along the simulation period is presented Figure 5.9. The discharge distribution is presented in Figure 5.10.

TEAS for Rogun HPP Construction Project
Phase II - Vol. 3 – Chap.5 – Reservoir operation study
P.002378 RP 40 page 51 /107
Figure 5.9 : Without Rogun scenario (a)- Discharge at the downstream of the cascade
Figure 5.10 : Without Rogun scenario (a) – Distribution of the discharge at the downstream of the
cascade
5.1.3 Results scenario (b)
Hereafter are presented the various results of the scenario simulating the cascade “Without Rogun” in base line scenario (b, future use of Tajik water allocation). The simulation performed is the same as in the previous paragraph except that the full Tajik water allocation is used.
The Nurek 95% exceedance energy in winter (EW-95%) is 618 GWh per month. The EW-95% of the whole cascade is 1072 GWh per month.
The average yearly energy produced by Nurek and the whole cascade is the following:
ENurek=11 289 ± 1 404 Є [8 501; 15 223] GWh

TEAS for Rogun HPP Construction Project
Phase II - Vol. 3 – Chap.5 – Reservoir operation study
P.002378 RP 40 page 52 /107
ECascade=19 084 ± 2 310 Є [14 631; 25 429] GWh
(where E=average ± standard deviation Є [minimum; maximum])
The firm energy produced by the whole cascade is 12 528 GWh per year.
Figure 5.11 : Without Rogun (b) - Average monthly energy produced by the cascade
The distribution of the monthly energy is presented in the next figure (the 2 dotted lines are the “typical” wet and dry years). It can be noted that the difference between a wet and dry year is limited to the highest energy, ie summer month where the discharge variability is important. In winter, the difference is very limited. Variation of average energy produced by the cascade on the wet years (inflows higher than the complete series average) and dry (inflows lower than the complete series average) years are presented in the table below.
(GWh) Wet years Dry years
Average yearly energy 19 302 18 858
Table 5.2 : Cascade energy production during wet or dry years - Without Rogun (b)

TEAS for Rogun HPP Construction Project
Phase II - Vol. 3 – Chap.5 – Reservoir operation study
P.002378 RP 40 page 53 /107
Figure 5.12 : Without Rogun (b) - Nurek monthly energy distribution
Figure 5.13 : Without Rogun (b) - Vakhsh cascade monthly energy distribution
In the simulation, spillage episode have been used only 10 summers over 76. Over the whole simulation period, the total volume of spilled water is 2173 hm3, ie an average of 29 hm3/year. This represents less than 0.2% of the average inflows.
The discharge at the downstream point of the Vakhsh river all along the simulation period is presented Figure 5.9. The discharge distribution is presented in Figure 5.10. Peaks are slightly lower than in the scenario (a) as expected: the water withdrawals considered in the base case are
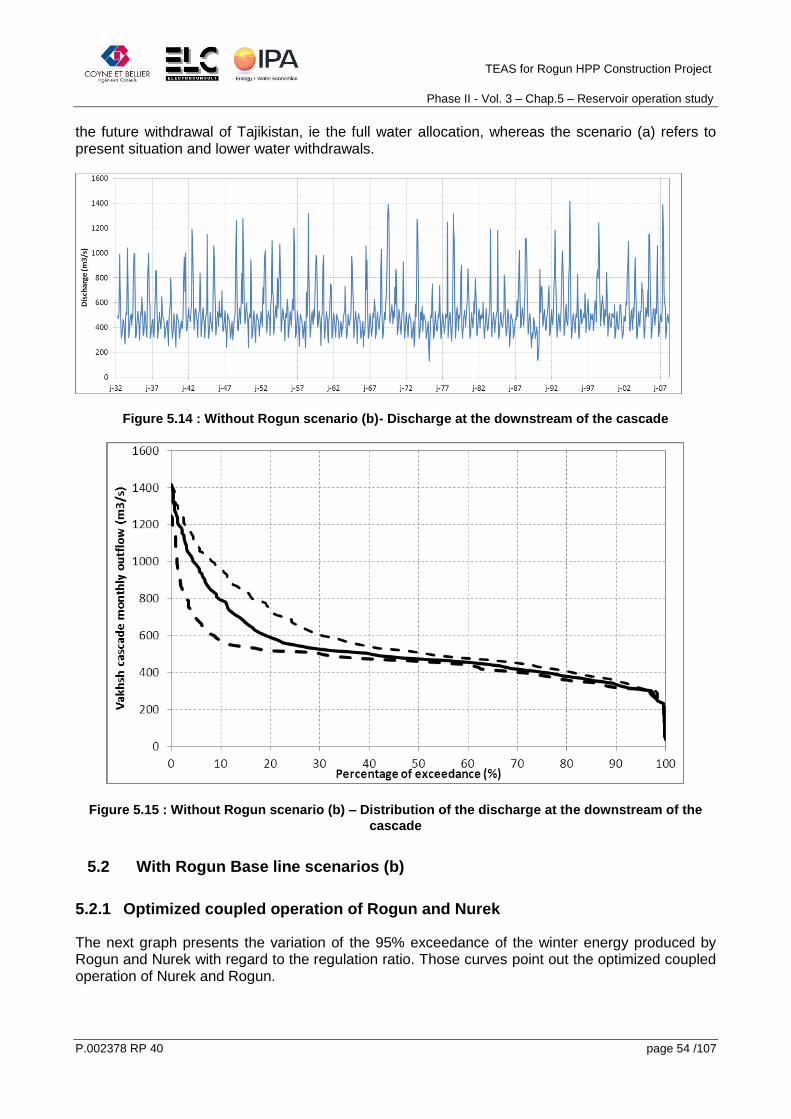
TEAS for Rogun HPP Construction Project
Phase II - Vol. 3 – Chap.5 – Reservoir operation study
P.002378 RP 40 page 54 /107
the future withdrawal of Tajikistan, ie the full water allocation, whereas the scenario (a) refers to present situation and lower water withdrawals.
Figure 5.14 : Without Rogun scenario (b)- Discharge at the downstream of the cascade
Figure 5.15 : Without Rogun scenario (b) – Distribution of the discharge at the downstream of the
cascade
5.2 With Rogun Base line scenarios (b)
5.2.1 Optimized coupled operation of Rogun and Nurek
The next graph presents the variation of the 95% exceedance of the winter energy produced by Rogun and Nurek with regard to the regulation ratio. Those curves point out the optimized coupled operation of Nurek and Rogun.

TEAS for Rogun HPP Construction Project
Phase II - Vol. 3 – Chap.5 – Reservoir operation study
P.002378 RP 40 page 55 /107
Figure 5.16 : Optimization of Rogun and Nurek coupled operation
For each alternative, the optimized regulation ratio has been found to be: 1 for FSL = 1290 masl, 1 for FSL = 1255 masl and 0.95 for FSL = 1220 masl.
5.2.2 FSL =1290 masl
Hereafter are presented the results of the base case scenario (b). Detailed results are presented for the installed capacity of 3600 MW. The results in terms of energy only are presented for the two others installed capacity studied.
First, the regulation ratio of 1 means that all the regulation is made in Rogun. The average water level in Rogun and Nurek at the middle of each month are presented in the next graph.
Figure 5.17 : Scenario (b-1290) - Average Rogun and Nurek reservoir level

TEAS for Rogun HPP Construction Project
Phase II - Vol. 3 – Chap.5 – Reservoir operation study
P.002378 RP 40 page 56 /107
It can be seen that Rogun lowest average level is 1259 masl in April, while Nurek reservoir level is very flat. Nurek reservoir is only used on dry year to complete the regulation made by Rogun.
The Rogun+Nurek 95% exceedance energy in winter (EW-95%) is 1460 GWh per month. The EW-95%
of the whole cascade is 1903 GWh per month. The firm energy produced by the whole cascade is 22 360 GWh. This is valid for the three installed capacity studied.
The average yearly energy produced by Rogun, Nurek and the whole cascade is the following for the installed capacity 3600 MW:
ERogun=14 398 ± 1 718 Є [11 265; 18 989] GWh
ENurek=12 297 ± 1 457 Є [9 730; 16 249] GWh
ECascade=34 441 ± 4 054 Є [27 330; 45 405] GWh
(where E=average ± standard deviation Є [minimum; maximum])
The average yearly energy produced by Rogun, Nurek and the whole cascade is the following for the installed capacity 3200 MW:
ERogun=14 288 ± 1 602 Є [11 265; 18 123] GWh
ENurek=12 297 ± 1 457 Є [9 730; 16 249] GWh
ECascade=34 331 ± 3 936 Є [27 215; 44 538] GWh
The average yearly energy produced by Rogun, Nurek and the whole cascade is the following for the installed capacity 2800 MW:
ERogun=14 066 ± 1 429 Є [11 056; 17 527] GWh
ENurek=12 297 ± 1 457 Є [9 730; 16 249] GWh
ECascade=34 109 ± 3753 Є [26 917; 43 655] GWh
Nurek production is the same no matter Rogun installed capacity is, which was expected as changing the installed capacity, does not change the operation rule.
The variation of Rogun installed capacity impacts only on high energy (summer months): from 2800 to 3600 MW, it represents an increase of 2% of the average yearly energy in Rogun.
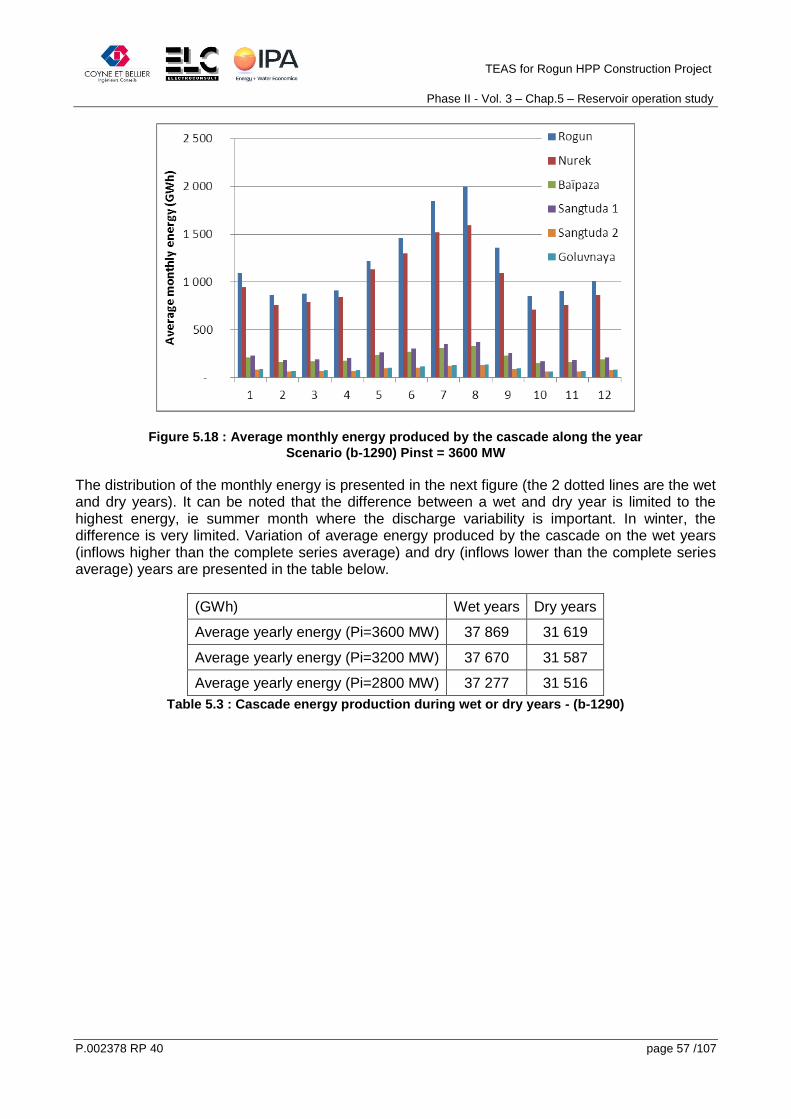
TEAS for Rogun HPP Construction Project
Phase II - Vol. 3 – Chap.5 – Reservoir operation study
P.002378 RP 40 page 57 /107
Figure 5.18 : Average monthly energy produced by the cascade along the year
Scenario (b-1290) Pinst = 3600 MW
The distribution of the monthly energy is presented in the next figure (the 2 dotted lines are the wet and dry years). It can be noted that the difference between a wet and dry year is limited to the highest energy, ie summer month where the discharge variability is important. In winter, the difference is very limited. Variation of average energy produced by the cascade on the wet years (inflows higher than the complete series average) and dry (inflows lower than the complete series average) years are presented in the table below.
(GWh) Wet years Dry years
Average yearly energy (Pi=3600 MW) 37 869 31 619
Average yearly energy (Pi=3200 MW) 37 670 31 587
Average yearly energy (Pi=2800 MW) 37 277 31 516
Table 5.3 : Cascade energy production during wet or dry years - (b-1290)

TEAS for Rogun HPP Construction Project
Phase II - Vol. 3 – Chap.5 – Reservoir operation study
P.002378 RP 40 page 58 /107
Figure 5.19 : Rogun monthly energy distribution - Scenario (b-1290) Pinst = 3600 MW
For lowest installed capacities, the distribution curve is the same except that it is cut at 2370 GWh (5% of exceedance) for the installed capacity 3200 MW and at 2070 GWh (8.5% of exceedance) for the installed capacity 2800 MW.
Figure 5.20 : Nurek monthly energy distribution - Scenario (b-1290) Pinst = 3600 MW

TEAS for Rogun HPP Construction Project
Phase II - Vol. 3 – Chap.5 – Reservoir operation study
P.002378 RP 40 page 59 /107
Figure 5.21 : Vakhsh cascade monthly energy distribution - Scenario (b-1290) Pinst = 3600 MW
In terms of spilled water, the next table presents the average yearly spilled water volume as well as the number of summer with actual spillage.
Pi=3600 MW Pi=3200 MW Pi=2800 MW
Rogun 61 hm3
(17) 213 hm3
(30) 518 hm3
(46)
Nurek 90 hm3
(17) 90 hm3
(17) 90 hm3
(17)
Table 5.4: Average yearly spilled water volume - FSL=1290 masl (b)
In all cases, the water spilled in very limited compared to the yearly inflows (20 km3).
The discharge at the downstream point of the Vakhsh river all along the simulation period is presented Figure 5.22. The discharge distribution is presented in Figure 5.23. Peaks in summer are the same as in the “Without Rogun” scenario (b) as expected: the water withdrawals are the same. A systematic comparison of the downstream discharge is presented in § 5.5.2 along with other scenarios and alternatives.

TEAS for Rogun HPP Construction Project
Phase II - Vol. 3 – Chap.5 – Reservoir operation study
P.002378 RP 40 page 60 /107
Figure 5.22 : Scenario (b-1290) - Discharge at the downstream of the cascade
Figure 5.23 : Scenario (b-1290) – Distribution of the discharge at the downstream of the cascade
5.2.3 FSL=1255 masl
Hereafter are presented the results of the base case scenario (b). Detailed results are presented for the installed capacity of 3200 MW. Only the results in terms of energy are presented for the two others installed capacity studied.
First, the regulation ratio of 1 means that all the regulation is made in Rogun. The average water level in Rogun and Nurek at the middle of each month are presented in the next graph.

TEAS for Rogun HPP Construction Project
Phase II - Vol. 3 – Chap.5 – Reservoir operation study
P.002378 RP 40 page 61 /107
Figure 5.24 : Scenario (b-1255) - Average Rogun and Nurek reservoir level
It can be seen that Rogun lowest average level is 1208 masl in April, while Nurek reservoir level is very flat. Nurek reservoir is only used on dry year to complete the regulation made by Rogun.
The Rogun+Nurek 95% exceedance energy in winter (EW-95%) is 1341 GWh per month. The EW-95%
of the whole cascade is 1794 GWh per month. The firm energy produced by the whole cascade is 21 240 GWh. This is valid for the three installed capacity studied.
The average yearly energy produced by Rogun, Nurek and the whole cascade is the following for the installed capacity 3200 MW:
ERogun=12 391 ± 1 501 Є [9 462; 16 402] GWh
ENurek=12 297 ± 1 457 Є [9 730; 16 249] GWh
ECascade=32 480 ± 3 841 Є [25 763; 42 848] GWh
(where E=average ± standard deviation Є [minimum; maximum])
The average yearly energy produced by Rogun, Nurek and the whole cascade is the following for the installed capacity 2800 MW:
ERogun=12 295 ± 1 401 Є [9 462; 15 675] GWh
ENurek=12 297 ± 1 457 Є [9 730; 16 249] GWh
ECascade=32 384 ± 3 739 Є [25 700; 42 121] GWh
The average yearly energy produced by Rogun, Nurek and the whole cascade is the following for the installed capacity 2400 MW:
ERogun=12 072 ± 1 229 Є [9 462; 14 997] GWh
ENurek=12 297 ± 1 457 Є [9 730; 16 249] GWh

TEAS for Rogun HPP Construction Project
Phase II - Vol. 3 – Chap.5 – Reservoir operation study
P.002378 RP 40 page 62 /107
ECascade=32 161 ± 3 558 Є [25 402; 41 237] GWh
Nurek production is the same no matter is the Rogun installed capacity and is also identical to the previous alternative. Indeed, Rogun operation is the same and discharge downstream of Rogun is the same.
Here, an increase of installed capacity from 2400 to 3200 MW increases the average energy by 2.6%.
Figure 5.25 : Average monthly energy produced by the cascade along the year
Scenario (b-1255) Pinst = 3200 MW
The distribution of the monthly energy is presented in the next figure (the 2 dotted lines are the wet and dry years). It can be noted that the difference between a wet and dry year is limited to the highest energy, ie summer month where the discharge variability is important. In winter, the difference is very limited.
For the lowest installed capacity at Rogun, the curve is identical but cut at 2067 GWh (5% exceedance) for installed capacity 2800 MW, and cut at 1780 GWh (9% exceedance) for installed capacity 2600 MW.
Variation of average energy produced by the cascade on the wet years (inflows higher than the complete series average) and dry (inflows lower than the complete series average) years are presented in the table below.
(GWh) Wet years Dry years
Average yearly energy (Pi=3200 MW) 35 722 29 810
Average yearly energy (Pi=2800 MW) 35 551 29 779
Average yearly energy (Pi=2400 MW) 35 163 29 703
Table 5.5 : Cascade energy production during wet or dry years - (b-1255)

TEAS for Rogun HPP Construction Project
Phase II - Vol. 3 – Chap.5 – Reservoir operation study
P.002378 RP 40 page 63 /107
Figure 5.26 : Rogun monthly energy distribution - Scenario (b-1255) Pinst = 3200 MW
Figure 5.27 : Nurek monthly energy distribution - Scenario (b-1255) Pinst = 3200 MW

TEAS for Rogun HPP Construction Project
Phase II - Vol. 3 – Chap.5 – Reservoir operation study
P.002378 RP 40 page 64 /107
Figure 5.28 : Vakhsh cascade monthly energy distribution - Scenario (b-1255) Pinst = 3200 MW
In terms of spilled water, the next table presents the average yearly spilled water volume as well as the number of summer with actual spillage found by the simulation.
Pi=3200 MW Pi=2800 MW Pi=2400 MW
Rogun 40 hm3
(11) 193 hm3
(30) 547 hm3
(46)
Nurek 92 hm3
(17) 92 hm3
(17) 92 hm3
(17)
Table 5.6: Average yearly spilled water volume - FSL=1255 masl (b)
In all cases, the water spilled is very limited compared to the yearly inflows (20 km3).
The discharge at the downstream point of the Vakhsh river all along the simulation period is presented Figure 5.29. The discharge distribution is presented in Figure 5.30. Peaks in summer are the same as in the “Without Rogun” scenario (b) as expected: the water withdrawals are the same. A systematic comparison of the downstream discharge is presented in § 5.5.2 along with other scenarios and alternatives.
Discharge downstream of the Vakhsh river is the same as for the previous alternative.

TEAS for Rogun HPP Construction Project
Phase II - Vol. 3 – Chap.5 – Reservoir operation study
P.002378 RP 40 page 65 /107
Figure 5.29 : Scenario (b-1255) - Discharge at the downstream of the cascade
Figure 5.30 : Scenario (b-1255) – Distribution of the discharge at the downstream of the cascade
5.2.4 FSL =1220 masl
Here are presented the results of the base case scenario (b). Detailed results are presented for the installed capacity of 2800 MW. Only the results in terms of energy are presented for the two others installed capacity studied.
First, the regulation ratio of 0.95 means that the main part of the regulation is made in Rogun. The average water level in Rogun and Nurek at the middle of each month are presented in the next graph.

TEAS for Rogun HPP Construction Project
Phase II - Vol. 3 – Chap.5 – Reservoir operation study
P.002378 RP 40 page 66 /107
Figure 5.31 : Scenario (b-1220) - Average Rogun and Nurek reservoir level
It can be seen that Rogun lowest level at the end of April is 1140 masl, while Nurek reservoir level is very flat.
The Rogun+Nurek 95% exceedance energy in winter (EW-95%) is 1200 GWh per month. The EW-95%
of the whole cascade is 1662 GWh per month. The firm energy produced by the whole cascade is 19 560 GWh. This is valid for the three installed capacity studied.
The average yearly energy produced by Rogun, Nurek and the whole cascade is the following for the installed capacity 2800 MW:
ERogun=10 121 ± 1 250 Є [7 207; 13 400] GWh
ENurek=12 260 ± 1 483 Є [9 703; 16 220] GWh
ECascade=30 155 ± 3 600 Є [23 541; 39 804] GWh
(where E=average ± standard deviation Є [minimum; maximum])
The average yearly energy produced by Rogun, Nurek and the whole cascade is the following for the installed capacity 2400 MW:
ERogun=10 037 ± 1 165 Є [7 207; 12 804] GWh
ENurek=12 260 ± 1 483 Є [9 703; 16 220] GWh
ECascade=30 072 ± 3 515 Є [23 541; 39 209] GWh
The average yearly energy produced by Rogun, Nurek and the whole cascade is the following for the installed capacity 2000 MW:
ERogun=9 800 ± 1 009 Є [7 207; 12 067] GWh
ENurek=12 260 ± 1 483 Є [9 703; 16 220] GWh

TEAS for Rogun HPP Construction Project
Phase II - Vol. 3 – Chap.5 – Reservoir operation study
P.002378 RP 40 page 67 /107
ECascade=29 834 ± 3 351 Є [23 541; 38 400] GWh
Nurek production is the same no matter is the Rogun installed capacity Indeed, Rogun operation is the same and discharge downstream of Rogun is the same. On the other hand, Nurek production is slightly different from the previous alternatives as the Rogun operation is also slightly different.
Here, an increase of installed capacity from 2000 to 2800 MW increases the average energy by 3.2%.
Figure 5.32 : Average monthly energy produced by the cascade along the year
Scenario (b-1220) Pinst = 2800 MW
The distribution of the monthly energy is presented in the next figure (the 2 dotted lines are the wet and dry years).
It can be noted that the difference between a wet and dry year is limited to the highest energy, ie summer month where the discharge variability is important. In winter, the difference is very limited.
For the lowest installed capacity at Rogun, the curve is identical but cut at 1770 GWh (5% exceedance) for installed capacity 2400 MW, and cut at 1480 GWh (9% exceedance) for installed capacity 2000 MW.
Variation of average energy produced by the cascade on the wet years (inflows higher than the complete series average) and dry (inflows lower than the complete series average) years are presented in the table below.
(GWh) Wet years Dry years
Average yearly energy (Pi=2800 MW) 33 200 28 667
Average yearly energy (Pi=2400 MW) 33 056 28 584
Average yearly energy (Pi=2000 MW) 32 675 27 503
Table 5.7 : Cascade energy production during wet or dry years - (b-1220)

TEAS for Rogun HPP Construction Project
Phase II - Vol. 3 – Chap.5 – Reservoir operation study
P.002378 RP 40 page 68 /107
Figure 5.33 : Rogun monthly energy distribution - Scenario (b-1220) Pinst = 2800 MW
Figure 5.34 : Nurek monthly energy distribution - Scenario (b-1220) Pinst = 2800 MW

TEAS for Rogun HPP Construction Project
Phase II - Vol. 3 – Chap.5 – Reservoir operation study
P.002378 RP 40 page 69 /107
Figure 5.35 : Vakhsh cascade monthly energy distribution - Scenario (b-1220) Pinst = 2800 MW
In terms of spilled water, the next table presents the average yearly spilled water volume as well as the number of summers with actual spillage shown by the simulation.
Pi=2800 MW Pi=2400 MW Pi=2000 MW
Rogun 21 hm3
(9) 178 hm3
(32) 627 hm3
(56)
Nurek 89 hm3
(17) 89 hm3
(17) 89 hm3
(17)
Table 5.8: Average yearly spilled water volume - FSL=1220 masl (b)
In all cases, the water spilled in very limited compared to the average yearly inflows (20 km3).
The discharge at the downstream point of the Vakhsh river all along the simulation period is presented Figure 5.36. The discharge distribution is presented in Figure 5.37. Peaks in summer are the same as in the “Without Rogun” scenario (b) as expected: the water withdrawals are the same. A systematic comparison of the downstream discharge is presented in § 5.5.2 along with other scenarios and alternatives.
Discharge downstream of the Vakhsh river is the same as for the previous alternatives.

TEAS for Rogun HPP Construction Project
Phase II - Vol. 3 – Chap.5 – Reservoir operation study
P.002378 RP 40 page 70 /107
Figure 5.36 : Scenario (b-1220) - Discharge at the downstream of the cascade
Figure 5.37 : Scenario (b-1220) – Distribution of the discharge at the downstream of the cascade
5.3 Current status extrapolated with Rogun (a)
5.3.1 FSL =1290 masl
Here are presented the results of the scenario “current status extrapolated” (a). This scenario is computed only for the highest installed capacity studied, 3600 MW.
As for the scenario (b), the regulation ratio is 1. It means that all the regulation is made in Rogun. The average water level in Rogun and Nurek at the middle of each month are presented in the next graph.

TEAS for Rogun HPP Construction Project
Phase II - Vol. 3 – Chap.5 – Reservoir operation study
P.002378 RP 40 page 71 /107
Figure 5.38 : Scenario (a-1290) - Average Rogun and Nurek reservoir level
It can be seen that Rogun lowest level is 1259 masl as for scenario (b), while Nurek reservoir level is very flat, and even flatter that in the previous scenario as more water is available.
The Rogun+Nurek 95% exceedance energy in winter (EW-95%) is 1473 GWh per month. The EW-95%
of the whole cascade is 1930 GWh per month. The firm energy produced by the whole cascade is 22 762 GWh.
The average yearly energy produced by Rogun, Nurek and the whole cascade is the following for the installed capacity 3600 MW:
ERogun=14 398 ± 1 718 Є [11 265; 18 989] GWh
ENurek=12 807 ± 1 454 Є [10 159; 16 469] GWh
ECascade=35 314 ± 4 078 Є [28 006; 45 837] GWh
(where E=average ± standard deviation Є [minimum; maximum])
Rogun production is the same as in scenario (b), indeed, upstream of Rogun there are no water withdrawals so there is no difference between scenario (a) and (b) use of water. Differences appear at Nurek and downstream where the withdrawals are lower in scenario (a), therefore, production is slightly higher.
On the whole cascade, the production is 2.5% more in scenario (a) than in scenario (b).

TEAS for Rogun HPP Construction Project
Phase II - Vol. 3 – Chap.5 – Reservoir operation study
P.002378 RP 40 page 72 /107
Figure 5.39 : Average monthly energy produced by the cascade along the year
Scenario (a-1290) Pinst = 3600 MW
The distribution of the monthly energy is presented in the next figure (the 2 dotted lines are the wet and dry years). It can be noted that the difference between a wet and dry year is limited to the highest energy, ie summer month where the discharge variability is important. In winter, the difference is very limited.
Variation of average energy produced by the cascade on the wet years (inflows higher than the complete series average) and dry (inflows lower than the complete series average) years are presented in the table below.
(GWh) Wet years Dry years
Average yearly energy (Pi=3600 MW) 38 700 32 225
Table 5.9 : Cascade energy production during wet or dry years - (a-1290)

TEAS for Rogun HPP Construction Project
Phase II - Vol. 3 – Chap.5 – Reservoir operation study
P.002378 RP 40 page 73 /107
Figure 5.40 : Rogun monthly energy distribution - Scenario (a-1290) Pinst = 3600 MW
Figure 5.41 : Nurek monthly energy distribution - Scenario (a-1290) Pinst = 3600 MW

TEAS for Rogun HPP Construction Project
Phase II - Vol. 3 – Chap.5 – Reservoir operation study
P.002378 RP 40 page 74 /107
Figure 5.42 : Vakhsh cascade monthly energy distribution - Scenario (a-1290) Pinst = 3600 MW
In the simulation, spillage episodes have been used only 16 summers over 76 at Rogun, and 21 summers over 76 at Nurek. Over the whole simulation period, the yearly average water volume spilled is 61 hm3 at Rogun and 142 hm3 at Nurek.
The discharge at the downstream point of the Vakhsh River all along the simulation period is presented Figure 5.43. The discharge distribution is presented in Figure 5.44. Peaks in summer are slightly higher than in the scenario (b), as expected: the water withdrawals considered in the base case are the future withdrawal of Tajikistan, ie the full water allocation, whereas the scenario (a) refers to present situation and lower water withdrawals. The discharge downstream of the Vakhsh river in scenario (a) is identical to scenario “Without Rogun”. A systematic comparison of the downstream discharge is presented in § 5.5.2 along with other scenarios and alternatives.
Figure 5.43 : Scenario (a-1290) - Discharge at the downstream of the cascade

TEAS for Rogun HPP Construction Project
Phase II - Vol. 3 – Chap.5 – Reservoir operation study
P.002378 RP 40 page 75 /107
Figure 5.44 : Scenario (a-1290) – Distribution of the discharge at the downstream of the cascade
5.3.2 FSL=1255 masl
Here are presented the results of the scenario “current status extrapolated” (a). This scenario is computed only for the highest installed capacity studied, 3200 MW.
As for the scenario (b), the regulation ratio is 1. It means that all the regulation is made in Rogun. The average water level in Rogun and Nurek at the middle of each month are presented in the next graph.
Figure 5.45 : Scenario (a-1255) - Average Rogun and Nurek reservoir level
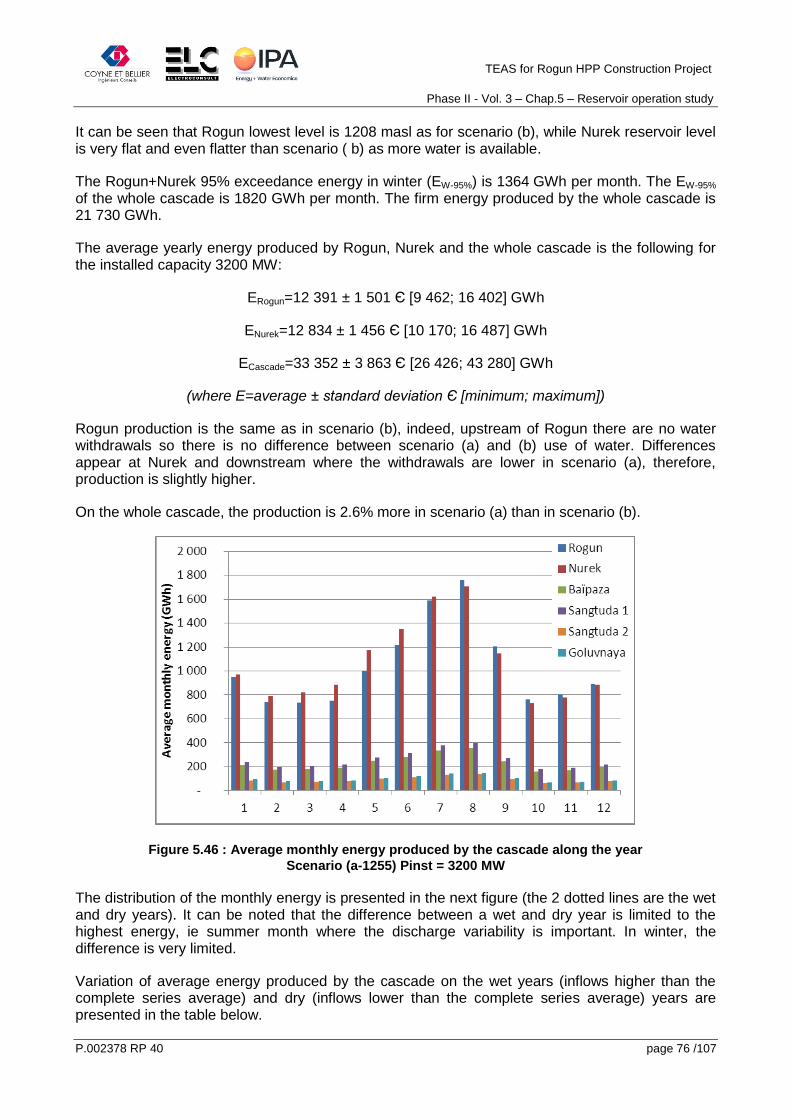
TEAS for Rogun HPP Construction Project
Phase II - Vol. 3 – Chap.5 – Reservoir operation study
P.002378 RP 40 page 76 /107
It can be seen that Rogun lowest level is 1208 masl as for scenario (b), while Nurek reservoir level is very flat and even flatter than scenario ( b) as more water is available.
The Rogun+Nurek 95% exceedance energy in winter (EW-95%) is 1364 GWh per month. The EW-95%
of the whole cascade is 1820 GWh per month. The firm energy produced by the whole cascade is 21 730 GWh.
The average yearly energy produced by Rogun, Nurek and the whole cascade is the following for the installed capacity 3200 MW:
ERogun=12 391 ± 1 501 Є [9 462; 16 402] GWh
ENurek=12 834 ± 1 456 Є [10 170; 16 487] GWh
ECascade=33 352 ± 3 863 Є [26 426; 43 280] GWh
(where E=average ± standard deviation Є [minimum; maximum])
Rogun production is the same as in scenario (b), indeed, upstream of Rogun there are no water withdrawals so there is no difference between scenario (a) and (b) use of water. Differences appear at Nurek and downstream where the withdrawals are lower in scenario (a), therefore, production is slightly higher.
On the whole cascade, the production is 2.6% more in scenario (a) than in scenario (b).
Figure 5.46 : Average monthly energy produced by the cascade along the year
Scenario (a-1255) Pinst = 3200 MW
The distribution of the monthly energy is presented in the next figure (the 2 dotted lines are the wet and dry years). It can be noted that the difference between a wet and dry year is limited to the highest energy, ie summer month where the discharge variability is important. In winter, the difference is very limited.
Variation of average energy produced by the cascade on the wet years (inflows higher than the complete series average) and dry (inflows lower than the complete series average) years are presented in the table below.

TEAS for Rogun HPP Construction Project
Phase II - Vol. 3 – Chap.5 – Reservoir operation study
P.002378 RP 40 page 77 /107
(GWh) Wet years Dry years
Average yearly energy (Pi=3200 MW) 36 646 30 642
Table 5.10 : Cascade energy production during wet or dry years - (a-1255)
Figure 5.47 : Rogun monthly energy distribution - Scenario (a-1255) Pinst = 3200 MW
Figure 5.48 : Nurek monthly energy distribution - Scenario (a-1255) Pinst = 3200 MW
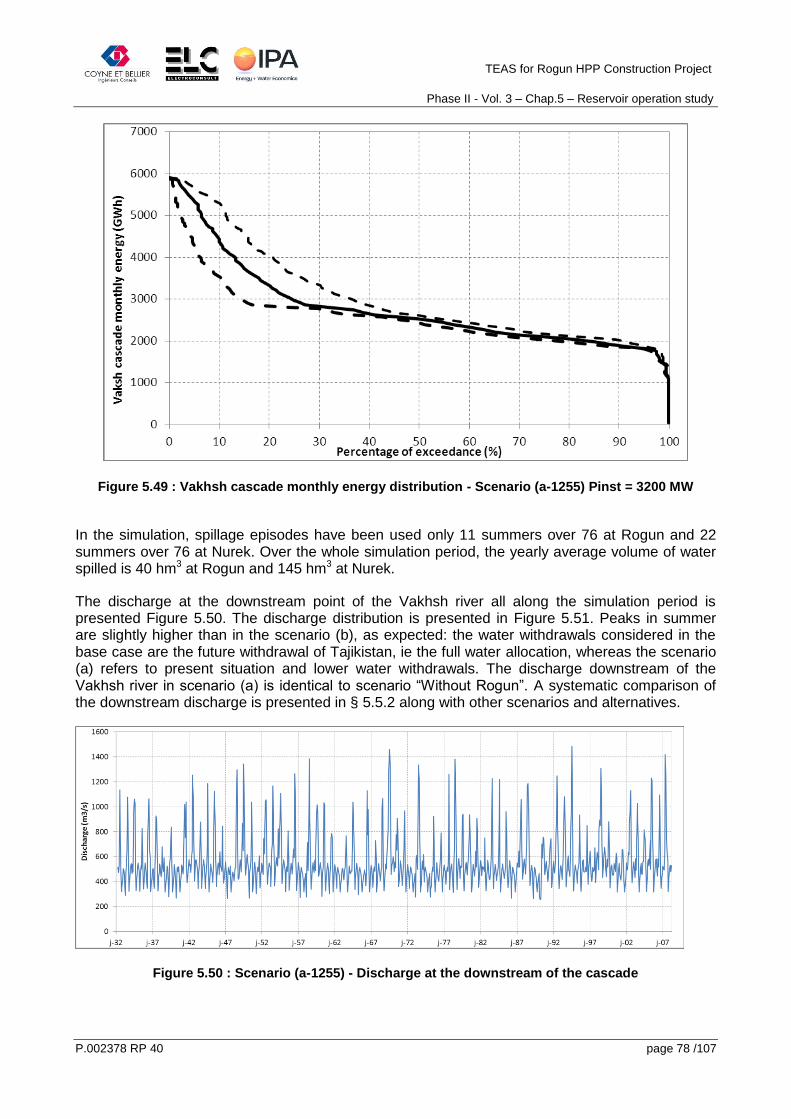
TEAS for Rogun HPP Construction Project
Phase II - Vol. 3 – Chap.5 – Reservoir operation study
P.002378 RP 40 page 78 /107
Figure 5.49 : Vakhsh cascade monthly energy distribution - Scenario (a-1255) Pinst = 3200 MW
In the simulation, spillage episodes have been used only 11 summers over 76 at Rogun and 22 summers over 76 at Nurek. Over the whole simulation period, the yearly average volume of water spilled is 40 hm3 at Rogun and 145 hm3 at Nurek.
The discharge at the downstream point of the Vakhsh river all along the simulation period is presented Figure 5.50. The discharge distribution is presented in Figure 5.51. Peaks in summer are slightly higher than in the scenario (b), as expected: the water withdrawals considered in the base case are the future withdrawal of Tajikistan, ie the full water allocation, whereas the scenario (a) refers to present situation and lower water withdrawals. The discharge downstream of the Vakhsh river in scenario (a) is identical to scenario “Without Rogun”. A systematic comparison of the downstream discharge is presented in § 5.5.2 along with other scenarios and alternatives.
Figure 5.50 : Scenario (a-1255) - Discharge at the downstream of the cascade

TEAS for Rogun HPP Construction Project
Phase II - Vol. 3 – Chap.5 – Reservoir operation study
P.002378 RP 40 page 79 /107
Figure 5.51 : Scenario (a-1255) – Distribution of the discharge at the downstream of the cascade
5.3.3 FSL =1220 masl
Here are presented the results of the scenario “current status extrapolated” (a). This scenario is computed only for the highest installed capacity studied, 2800 MW.
As for the scenario (b), the regulation ratio is 0.95. It means that all the regulation is made in Rogun. The average water level in Rogun and Nurek at the middle of each month are presented in the next graph.
Figure 5.52 : Scenario (a-1220) - Average Rogun and Nurek reservoir level

TEAS for Rogun HPP Construction Project
Phase II - Vol. 3 – Chap.5 – Reservoir operation study
P.002378 RP 40 page 80 /107
It can be seen that Rogun lowest level is 1140 masl at the end of April as for scenario (b), while Nurek reservoir level is very flat.
The Rogun+Nurek 95% exceedance energy in winter (EW-95%) is 1221 GWh per month. The EW-95%
of the whole cascade is 1704 GWh per month. The firm energy produced by the whole cascade is 20 140 GWh.
The average yearly energy produced by Rogun, Nurek and the whole cascade is the following for the installed capacity 2800 MW:
ERogun=10 121 ± 1 250 Є [7 207; 13 400] GWh
ENurek=12 767 ± 1 478 Є [10 087; 16 439] GWh
ECascade=31 026 ± 3 628 Є [23 864; 40 238] GWh
(where E=average ± standard deviation Є [minimum; maximum])
Rogun production is the same as in scenario (b), indeed, upstream of Rogun there is no water withdrawals so there is no difference between scenario (a) and (b) use of water. Differences appear at Nurek and downstream where the withdrawals are lower in scenario (a), therefore, production is slightly higher.
On the whole cascade, the production is 2.8% more in scenario (a) than in scenario (b).
Figure 5.53 : Average monthly energy produced by the cascade along the year
Scenario (a-1220) Pinst = 2800 MW
The distribution of the monthly energy is presented in the next figure (the 2 dotted lines are the wet and dry years). It can be noted that the difference between a wet and dry year is limited to the highest energy, ie summer month where the discharge variability is important. In winter, the difference is very limited.
Variation of average energy produced by the cascade on the wet years (inflows higher than the complete series average) and dry (inflows lower than the complete series average) years are presented in the table below.

TEAS for Rogun HPP Construction Project
Phase II - Vol. 3 – Chap.5 – Reservoir operation study
P.002378 RP 40 page 81 /107
(GWh) Wet years Dry years
Average yearly energy (Pi=2800 MW) 34 119 28 480
Table 5.11 : Cascade energy production during wet or dry years - (a-1220)
Figure 5.54 : Rogun monthly energy distribution - Scenario (a-1220) Pinst = 2800 MW
Figure 5.55 : Nurek monthly energy distribution - Scenario (a-1220) Pinst = 2800 MW

TEAS for Rogun HPP Construction Project
Phase II - Vol. 3 – Chap.5 – Reservoir operation study
P.002378 RP 40 page 82 /107
Figure 5.56 : Vakhsh cascade monthly energy distribution - Scenario (a-1220) Pinst = 2800 MW
In the simulation, spillage episodes have been used only 9 summers over 76 at Rogun and 20 summers over 76 at Nurek. Over the whole simulation period, the yearly average volume of water spilled is 21 hm3 at Rogun and 141 hm3 at Nurek which is very limited compared to the yearly average inflows volume (20 000 hm3).
The discharge at the downstream point of the Vakhsh river all along the simulation period is presented Figure 5.57. The discharge distribution is presented in Figure 5.58 Peaks in summer are slightly higher than in the scenario (b), as expected: the water withdrawals considered in the base case are the future withdrawal of Tajikistan, ie the full water allocation, whereas the scenario (a) refers to present situation and lower water withdrawals. The discharge downstream of the Vakhsh river in scenario (a) is identical to scenario “Without Rogun”. A systematic comparison of the downstream discharge is presented in § 5.5.2 along with other scenarios and alternatives.
Figure 5.57 : Scenario (a-1220) - Discharge at the downstream of the cascade

TEAS for Rogun HPP Construction Project
Phase II - Vol. 3 – Chap.5 – Reservoir operation study
P.002378 RP 40 page 83 /107
Figure 5.58 : Scenario (a-1220) – Distribution of the discharge at the downstream of the cascade
5.4 Base line scenario with sedimentation
5.4.1 General
As discussed in the Sedimentation report (Vol 2 Chapter 6), the yearly solid run off is estimated at 100 Mm3 per year and the Rogun projects life spans are assumed to be the following:
Life span (Years)
FSL = 1290 masl 115
FSL = 1255 mas 75
FSL = 1220 masl 45
Along that time, Rogun reservoir is progressively filled by sediment and therefore; its regulation capacity is progressively decreased. This paragraph aims at assessing the impact on the Vakhsh cascade energy production due to the sedimentation in Rogun reservoir.
For comparison purpose, the same assessment is made on the “Without Rogun” scenario: in that case, Nurek is progressively filled by 100 Mm3 of sediment per year.
For each time period, a storage capacity curve is computed as explained in §2.7, and the coupled operation optimum between Rogun and Nurek is found using the same methodology as for the “normal operation” case.
The main results are presenting here under.

TEAS for Rogun HPP Construction Project
Phase II - Vol. 3 – Chap.5 – Reservoir operation study
P.002378 RP 40 page 84 /107
5.4.2 Without Rogun
The next figure presents the evolution within time of the firm and the yearly average energy produced by Nurek alone and by the whole cascade. The graph also presents the variation of the minimum operating level within time.
The firm energy produced by Nurek is slowly decreasing and the minimum operating level remains at its lowest possible level (857 masl). After 65 years, the sediment level reaches the power intakes and the Nurek power house cannot be operated anymore.
The average energy is not significantly impacted by the sedimentation.
Figure 5.59 : Without Rogun (b) - Impact of sedimentation on energy production
Nurek storage capacity and, as a consequence, the river regulation capacity, decreases with time. Therefore, the discharge progressively tends to its natural variation: the discharge decreases in winter and increases in summer. As an example, the Figure 5.60 shows the Vakhsh downstream discharge after 65 years of sedimentation, and the Figure 5.61 shows the discharge duration curve of the without Rogun (b) scenario versus the same after 65 years of sedimentation.

TEAS for Rogun HPP Construction Project
Phase II - Vol. 3 – Chap.5 – Reservoir operation study
P.002378 RP 40 page 85 /107
Figure 5.60 : Vakhsh downstream discharge - Without Rogun (b) after 65 years of sedimentation
Figure 5.61 : Comparison of Vakhsh downstream discharge (at present and after 65 years) - Without
Rogun (b)
5.4.3 With Rogun FSL= 1290 masl
The next figure presents the evolution within time of the firm and the yearly average energy produced by Rogun and Nurek together and by the whole cascade. The graph also presents the variation of the minimum operating level within time.
As in the previous paragraph, two phases can be seen on the graph:
Up to 80 years, the firm energy slightly decreases as well as the minimum operating level. The losses in the Rogun active storage capacity increase, and as a consequence, the

TEAS for Rogun HPP Construction Project
Phase II - Vol. 3 – Chap.5 – Reservoir operation study
P.002378 RP 40 page 86 /107
amplitude of the yearly oscillation of reservoir levels (necessary for the regulation of river discharges) increases. Discharge regulation (increase of winter discharge) is not affected but heads in late winter get reduced. Energy can be consequently affected if the head loss is significant compared to the total head.
From 80 to 130 years: the firm energy decreases sharply and the minimum operating level increases. When the lowering of reservoir level (necessary for discharge regulation) is too important, the optimum coupled operation of Rogun and Nurek is to be reviewed: the Nurek reservoir starts its contribution to the discharge regulation, getting its winter head reduced. Energy generation is consequently reduced. After 130 years, Rogun regulation capacity does not exist anymore and Rogun is operated as a run-off-the-river hydro power plant.
The average energy is slightly impacted compared to the firm energy. Indeed, this is mostly the yearly dispatch that is modified because of the sedimentation but not the total energy produced. The lowest is the installed capacity, the more impacted is the average energy. This is an expected result: without regulation, there are high discharges in summer that cannot be fully turbined because it overpasses the power capacity.
Figure 5.62 : With Rogun (1290-b) - Impact of sedimentation on energy production
Even though Rogun storage capacity decreases with time, Nurek is compensating this regulation loss. Therefore, as long as Rogun reservoir traps the sediment, the Vakhsh downstream discharge does not change and remains the same as the one presented in the “With Rogun (b)” scenario presented in §5.2.2. As an example, the Figure 5.60 shows the Vakhsh downstream discharge after 80 years of sedimentation, and the Figure 5.61 shows the cross plot of the with Rogun (b-1290) scenario versus the same after 80 years of sedimentation.

TEAS for Rogun HPP Construction Project
Phase II - Vol. 3 – Chap.5 – Reservoir operation study
P.002378 RP 40 page 87 /107
Figure 5.63 : Vakhsh downstream discharge - With Rogun (b-1290) after 80 years of sedimentation
Figure 5.64 : Comparison of Vakhsh downstream discharge (at present and after 80 years) - With
Rogun (b-1290)
5.4.4 With Rogun FSL= 1255 masl
The next figure presents the evolution within time of the firm and the yearly average energy produced by Rogun and Nurek together and by the whole cascade. The graph also presents the variation of the minimum operating level within time.
As in the previous paragraph, two phases can be seen on the graph:
Up to 40 years, the firm energy slightly decreases as well as the minimum operating level. The losses in the Rogun active storage capacity increase, and as a consequence, the amplitude of the yearly oscillation of reservoir levels (necessary for the regulation of river
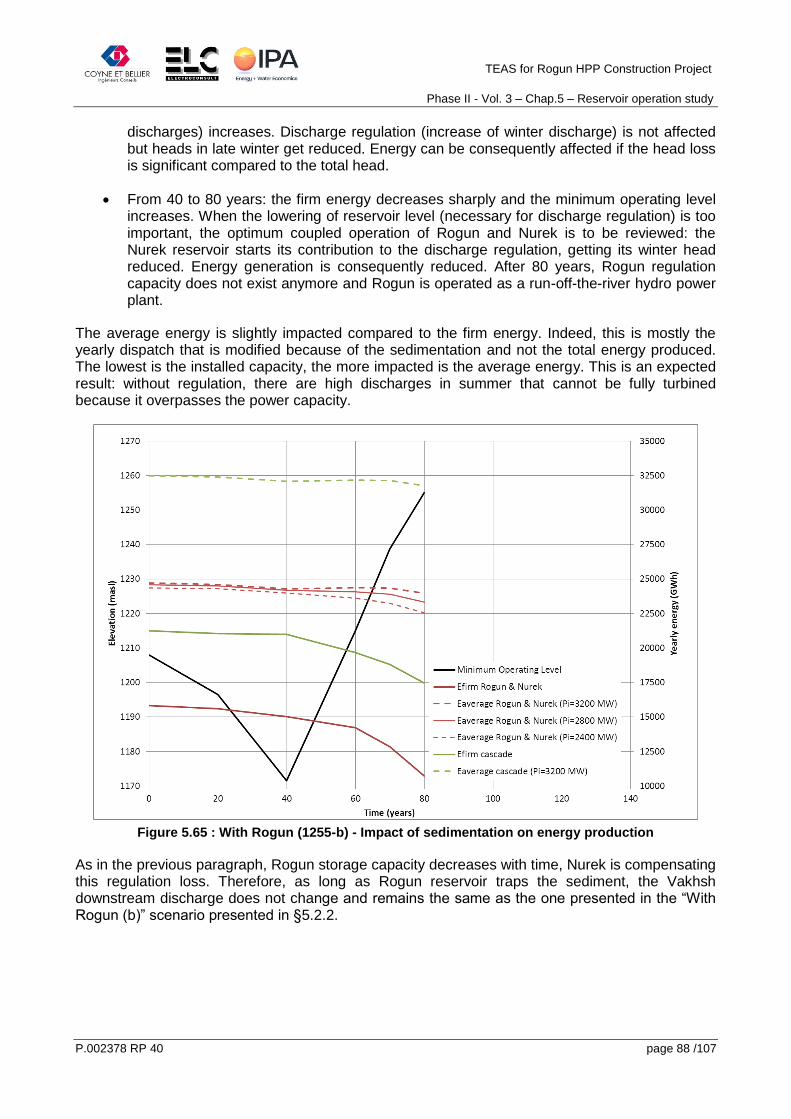
TEAS for Rogun HPP Construction Project
Phase II - Vol. 3 – Chap.5 – Reservoir operation study
P.002378 RP 40 page 88 /107
discharges) increases. Discharge regulation (increase of winter discharge) is not affected but heads in late winter get reduced. Energy can be consequently affected if the head loss is significant compared to the total head.
From 40 to 80 years: the firm energy decreases sharply and the minimum operating level increases. When the lowering of reservoir level (necessary for discharge regulation) is too important, the optimum coupled operation of Rogun and Nurek is to be reviewed: the Nurek reservoir starts its contribution to the discharge regulation, getting its winter head reduced. Energy generation is consequently reduced. After 80 years, Rogun regulation capacity does not exist anymore and Rogun is operated as a run-off-the-river hydro power plant.
The average energy is slightly impacted compared to the firm energy. Indeed, this is mostly the yearly dispatch that is modified because of the sedimentation and not the total energy produced. The lowest is the installed capacity, the more impacted is the average energy. This is an expected result: without regulation, there are high discharges in summer that cannot be fully turbined because it overpasses the power capacity.
Figure 5.65 : With Rogun (1255-b) - Impact of sedimentation on energy production
As in the previous paragraph, Rogun storage capacity decreases with time, Nurek is compensating this regulation loss. Therefore, as long as Rogun reservoir traps the sediment, the Vakhsh downstream discharge does not change and remains the same as the one presented in the “With Rogun (b)” scenario presented in §5.2.2.

TEAS for Rogun HPP Construction Project
Phase II - Vol. 3 – Chap.5 – Reservoir operation study
P.002378 RP 40 page 89 /107
5.4.5 With Rogun FSL= 1220 masl
The next figure presents the evolution within time of the firm and the yearly average energy produced by Rogun and Nurek together and by the whole cascade. The graph also presents the variation of the minimum operating level within time.
The two phases highlighted in the previous paragraphs cannot be clearly seen for the lowest dam alternative. Since the 10th years of Rogun operation, its regulation capacity is impacted by sedimentation. Therefore, the firm energy is significantly decreasing since the 10th years of operation.
The average energy is slightly impacted compared to the firm energy. Indeed, this is mostly the yearly dispatch that is modified because of the sedimentation and not the total energy produced. The lowest is the installed capacity, the more impacted is the average energy. This is an expected result: without regulation, there are high discharges in summer that cannot be fully turbined because it overpasses the power capacity.
Figure 5.66 : With Rogun (1220-b) - Impact of sedimentation on energy production
As in the previous paragraph, Rogun storage capacity decreases with time, and Nurek is compensating this regulation loss. Therefore, as long as Rogun reservoir traps the sediment, the Vakhsh downstream discharge does not change and remains the same as the one presented in the “With Rogun (b)” scenario presented in §5.2.2.

TEAS for Rogun HPP Construction Project
Phase II - Vol. 3 – Chap.5 – Reservoir operation study
P.002378 RP 40 page 90 /107
5.5 Synthesis and comparison of results
5.5.1 Energy production
The next tables present the firm (Table 5.12), the secondary (Table 5.14) and the average (Table 5.14) produced by the all cascade for each scenario studied.
Firm energy (GWh)
(a) (b)
Without Rogun 13 040 12 528
FSL = 1290 masl
3600 MW 22 762 22 360
3200 MW - 22 360
2800 MW - 22 360
FSL = 1255 masl
3200 MW 21 730 21 240
2800 MW - 21 240
2400 MW - 21 240
FSL = 1220 masl
2800 MW 20 140 19 560
2400 MW - 19 560
2000 MW - 19 560
Table 5.12 : Vakhsh cascade firm energy of all simulated scenario
Secondary energy (GWh)
(a) (b)
Without Rogun 6 870 6 556
FSL = 1290 masl
3600 MW 12 552 12 141
3200 MW - 12 031
2800 MW - 11 809
FSL = 1255 masl
3200 MW 11 622 11 240
2800 MW - 11 144
2400 MW - 10 921
FSL = 1220 masl
2800 MW 10 886 10 596
2400 MW - 10 512
2000 MW - 10 274
Table 5.13 : Vakhsh cascade secondary energy of all simulated scenario
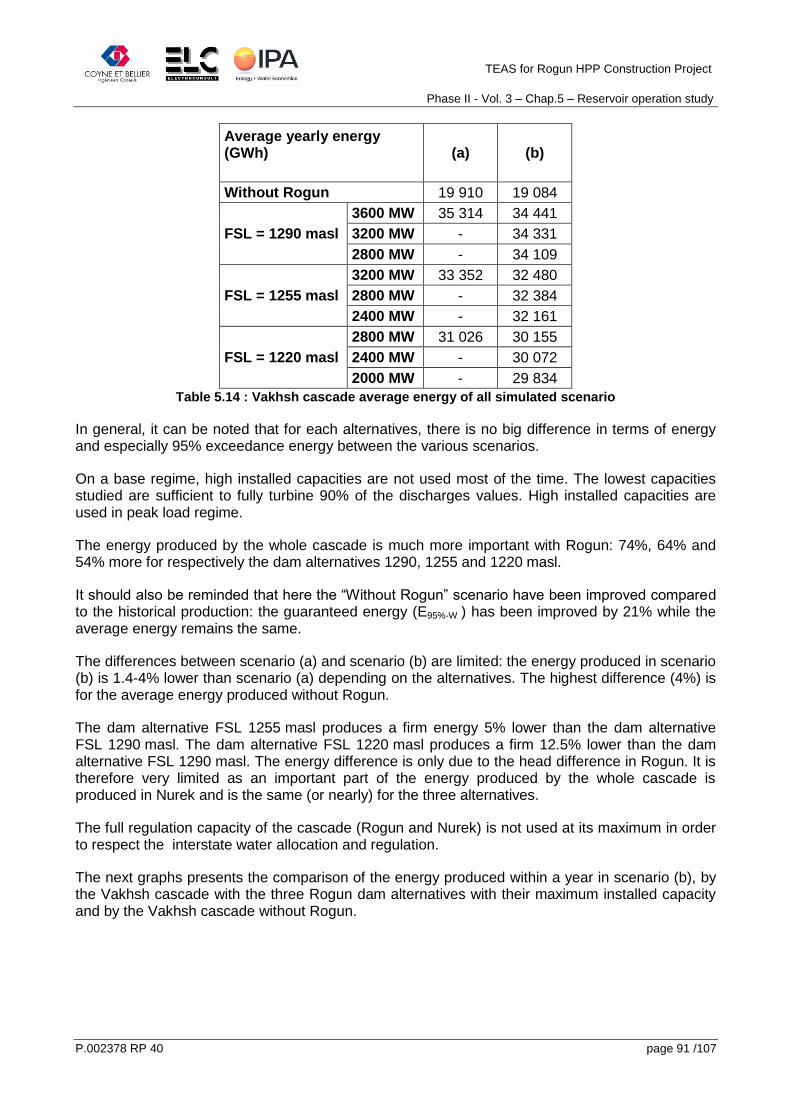
TEAS for Rogun HPP Construction Project
Phase II - Vol. 3 – Chap.5 – Reservoir operation study
P.002378 RP 40 page 91 /107
Average yearly energy (GWh)
(a) (b)
Without Rogun 19 910 19 084
FSL = 1290 masl
3600 MW 35 314 34 441
3200 MW - 34 331
2800 MW - 34 109
FSL = 1255 masl
3200 MW 33 352 32 480
2800 MW - 32 384
2400 MW - 32 161
FSL = 1220 masl
2800 MW 31 026 30 155
2400 MW - 30 072
2000 MW - 29 834
Table 5.14 : Vakhsh cascade average energy of all simulated scenario
In general, it can be noted that for each alternatives, there is no big difference in terms of energy and especially 95% exceedance energy between the various scenarios.
On a base regime, high installed capacities are not used most of the time. The lowest capacities studied are sufficient to fully turbine 90% of the discharges values. High installed capacities are used in peak load regime.
The energy produced by the whole cascade is much more important with Rogun: 74%, 64% and 54% more for respectively the dam alternatives 1290, 1255 and 1220 masl.
It should also be reminded that here the “Without Rogun” scenario have been improved compared to the historical production: the guaranteed energy (E95%-W ) has been improved by 21% while the average energy remains the same.
The differences between scenario (a) and scenario (b) are limited: the energy produced in scenario (b) is 1.4-4% lower than scenario (a) depending on the alternatives. The highest difference (4%) is for the average energy produced without Rogun.
The dam alternative FSL 1255 masl produces a firm energy 5% lower than the dam alternative FSL 1290 masl. The dam alternative FSL 1220 masl produces a firm 12.5% lower than the dam alternative FSL 1290 masl. The energy difference is only due to the head difference in Rogun. It is therefore very limited as an important part of the energy produced by the whole cascade is produced in Nurek and is the same (or nearly) for the three alternatives.
The full regulation capacity of the cascade (Rogun and Nurek) is not used at its maximum in order to respect the interstate water allocation and regulation.
The next graphs presents the comparison of the energy produced within a year in scenario (b), by the Vakhsh cascade with the three Rogun dam alternatives with their maximum installed capacity and by the Vakhsh cascade without Rogun.

TEAS for Rogun HPP Construction Project
Phase II - Vol. 3 – Chap.5 – Reservoir operation study
P.002378 RP 40 page 92 /107
Figure 5.67 : Vakhsh cascade production - Comparison of the alternatives, Scenario (b)
The next graphs presents the comparison of the energy produced within a year in scenario (a), by the Vakhsh cascade with the three Rogun dam alternatives with their maximum installed capacity and by the Vakhsh cascade without Rogun.
Figure 5.68 : Vakhsh cascade production - Comparison of the alternatives, Scenario (a)
5.5.2 Discharge at the downstream point of the Vakhsh cascade
Then Figure 5.69 shows a comparison of the average downstream discharge for the two scenario (a) and (b).

TEAS for Rogun HPP Construction Project
Phase II - Vol. 3 – Chap.5 – Reservoir operation study
P.002378 RP 40 page 93 /107
Figure 5.69 : Average discharge at the downstream end of the Vakhsh river - Comparison of scenario
(a) and (b) (alternative FSL 1290 masl)
The Figure 5.70 presents the comparison of the discharge at the downstream end of the Vakhsh River viewed as monthly average distribution and duration curves. It shows the comparison of the With and Without Rogun simulation in scenario (a), and (b). This shows that the principle of not changing the river flow pattern is respected.
Figure 5.70 : Monthly discharge at the Vakhsh downstream point - Comparison With and Without
Rogun (alternative FSL 1290 masl)
TEAS for Rogun HPP Construction Project
Phase II - Vol. 3 – Chap.5 – Reservoir operation study
P.002378 RP 40 page 94 /107
5.5.3 Other comments
It can be noted that all volumes of spilled water of the “with Rogun” scenario are higher than the “without Rogun” scenario. This can seem counterintuitive but can be explained by the Nurek operation differences between the two scenarios: in the “without Rogun”, Nurek reservoir is used for regulation whereas in “With Rogun” Nurek reservoir is always at FSL. This means that, in the “With Rogun” scenario, there is an immediate spillage in summer (July) when the turbines are saturated. On the other hand, in the “Without Rogun” scenario, in summer (July) the reservoir is not filled yet, therefore, the water is first stored in the remaining reservoir room and then is spilled. This means that less water are spilled in the “Without Rogun” scenario.
6 SIMULATION RESULTS – FILLING PERIOD
6.1 Hydrological situation
The previous scenario was computed on the whole simulated period (from 1932 to 2008). Here, the simulation is run only on the 10-18 years of reservoir filling.
It has to be noted that the reservoir is filled only with the differential volume of water withdrawn today and water allocation of Tajikistan. This volume is 1211 hm3 per year. Therefore, the filling of the reservoir is not influenced by the hydrological series used in the simulation, only the energy production is.
It has been chosen to run the reservoir filling simulation by using the typical average year 1937.
6.2 FSL = 1290 masl
The simulation results are presented Figure 6.1 and Table 6.1.
Figure 6.1 shows the Rogun reservoir rise and the monthly energy produced by Rogun during the construction.
Table 6.1 gives the yearly energy and winter energy produced by Rogun during the construction period.
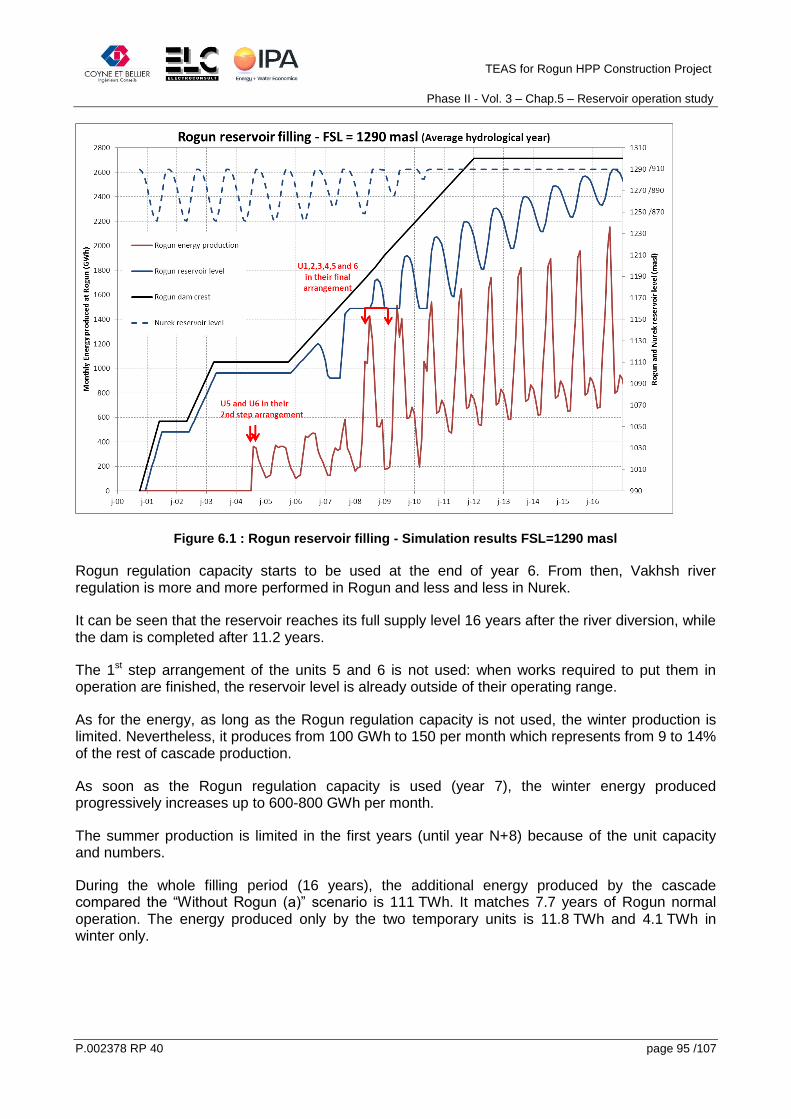
TEAS for Rogun HPP Construction Project
Phase II - Vol. 3 – Chap.5 – Reservoir operation study
P.002378 RP 40 page 95 /107
Figure 6.1 : Rogun reservoir filling - Simulation results FSL=1290 masl
Rogun regulation capacity starts to be used at the end of year 6. From then, Vakhsh river regulation is more and more performed in Rogun and less and less in Nurek.
It can be seen that the reservoir reaches its full supply level 16 years after the river diversion, while the dam is completed after 11.2 years.
The 1st step arrangement of the units 5 and 6 is not used: when works required to put them in operation are finished, the reservoir level is already outside of their operating range.
As for the energy, as long as the Rogun regulation capacity is not used, the winter production is limited. Nevertheless, it produces from 100 GWh to 150 per month which represents from 9 to 14% of the rest of cascade production.
As soon as the Rogun regulation capacity is used (year 7), the winter energy produced progressively increases up to 600-800 GWh per month.
The summer production is limited in the first years (until year N+8) because of the unit capacity and numbers.
During the whole filling period (16 years), the additional energy produced by the cascade compared the “Without Rogun (a)” scenario is 111 TWh. It matches 7.7 years of Rogun normal operation. The energy produced only by the two temporary units is 11.8 TWh and 4.1 TWh in winter only.

TEAS for Rogun HPP Construction Project
Phase II - Vol. 3 – Chap.5 – Reservoir operation study
P.002378 RP 40 page 96 /107
Year Rogun average yearly energy (GWh) Rogun average winter energy (GWh)
N+4 1 332 617
N+5 3 058 962
N+6 3 787 1 200
N+7 3 694 1 318
N+8 8 241 2 180
N+9 9 064 2 432
N+10 9 675 3 234
N+11 10 534 3 936
N+12 11 350 4 222
N+13 11 987 4 421
N+14 12 553 4 615
N+15 13 052 4 787
N+16 13 702 4 953
TOTAL 112 029 38 876
Table 6.1 : Rogun filling – Rogun Energy production - FSL=1290 masl
The next graph (Figure 6.2) presents the discharge at the downstream end of the cascade and compare the Rogun filling with normal operation in scenario (b) (results from §5.2.2).
It is to be pointed out that during the first 7 years of the filling period, the discharge at the downstream end of the cascade is higher in the filling of Rogun scenario than in scenario (b). After the 7th year, the two are perfectly superimposed. It means that the volume allowed for reservoir filling is not fully used for the first 7 years of reservoir filling.
The Figure 6.3 is a cross plot of the discharge at the downstream end of the cascade which compares the Rogun filling scenario with scenario (b). The series of points is either aligned on the 1/1 slope or above.

TEAS for Rogun HPP Construction Project
Phase II - Vol. 3 – Chap.5 – Reservoir operation study
P.002378 RP 40 page 97 /107
Figure 6.2 : Discharge at the downstream end of the Vakhsh - Filling FSL=1290 masl
Figure 6.3 : Cross plot of the discharge at the downstream end of the Vakhsh – Rogun 1290 filling
6.3 FSL = 1255 masl
The simulation results are presented Figure 6.4 and Table 6.2.
Figure 6.4 shows the Rogun reservoir rise and the monthly energy produced by Rogun during the construction.
Table 6.2 gives the yearly energy and winter energy produced by Rogun during the construction period.

TEAS for Rogun HPP Construction Project
Phase II - Vol. 3 – Chap.5 – Reservoir operation study
P.002378 RP 40 page 98 /107
Figure 6.4 : Rogun reservoir filling - Simulation results FSL=1255 masl
Rogun regulation capacity starts to be used in year 8. From then, Vakhsh river regulation is more and more performed in Rogun and less and less in Nurek.
It can be seen that the reservoir reaches its full supply level 13 years after the river diversion, while the dam is completed after 9.5 years.
As for the energy, as long as the Rogun regulation capacity is not used, the winter production is limited. Nevertheless, it produces from 100 GWh to 150 per month which represents from 9 to 14% of the rest of cascade production.
As soon as the Rogun regulation capacity is used (year 8), the winter energy produced progressively increases up to 600-800 GWh per month.
During the whole filling period (13 years), the additional energy produced by the cascade compared the “Without Rogun (a)” scenario is 68.6 TWh. It matches 5.5 years of Rogun normal operation. The energy produced only by the two temporary units is 11.7 TWh and 3.8 TWh in winter only.

TEAS for Rogun HPP Construction Project
Phase II - Vol. 3 – Chap.5 – Reservoir operation study
P.002378 RP 40 page 99 /107
Year Rogun average yearly energy (GWh) Rogun average winter energy (GWh)
N+4 1 102 509
N+5 3 157 925
N+6 3 664 1 135
N+7 3 807 1 244
N+8 7 422 1 925
N+9 7 782 2 180
N+10 8 666 2 999
N+11 9 819 3 707
N+12 10 800 4 039
N+13 11 664 4 249
TOTAL 67 885 22 912
Table 6.2 : Rogun filling - Energy production - FSL=1255 masl
The next graph (Figure 6.5) presents the discharge at the downstream end of the cascade and compare the Rogun filling with normal operation in scenario (b) (results from §5.2.2).
It is to be pointed out that during the first 7 years of the filling period, the discharge at the downstream end of the cascade is higher in the filling of Rogun scenario than in scenario (b). After the 7th year, the two are superimposed. It means that the volume allowed for reservoir filling is not fully used for the first 7 years of reservoir filling.
The Figure 6.6is a cross plot of the discharge at the downstream end of the cascade which compares the Rogun filling scenario with scenario (b). The series of points is either aligned on the 1/1 slope or above.
Figure 6.5 : Discharge at the downstream end of the Vakhsh - Filling FSL=1255 masl

TEAS for Rogun HPP Construction Project
Phase II - Vol. 3 – Chap.5 – Reservoir operation study
P.002378 RP 40 page 100 /107
Figure 6.6 : Cross plot of the discharge at the downstream end of the Vakhsh – Rogun 1255 filling
6.4 FSL = 1220 masl
The simulation results are presented Figure 6.7 and Table 6.3.
Figure 6.7 shows the Rogun reservoir rise and the monthly energy produced by Rogun during the construction.
Table 6.3 gives the yearly energy and winter energy produced by Rogun during the construction period. These values are the average of the 4 hydrological scenarios.

TEAS for Rogun HPP Construction Project
Phase II - Vol. 3 – Chap.5 – Reservoir operation study
P.002378 RP 40 page 101 /107
Figure 6.7 : Rogun reservoir filling - Simulation results FSL=1220 masl
Rogun regulation capacity starts to be used at the end of year 5. From then, Vakhsh river regulation is more and more performed in Rogun and less and less in Nurek.
It can be seen that the reservoir reaches its full supply level 9 years after the river diversion, while the dam is completed after 7.7 years.
As for the energy, as long as the Rogun regulation capacity is not used, the winter production is limited. Nevertheless, it produces from 100 GWh to 150 per month which represents from 9 to 14% of the rest of cascade production.
As soon as the Rogun regulation capacity is used (year 6), the winter energy produced increases up to 600-700 GWh per month.
The temporary arrangement of the units 5 and 6 is not used: when works required to put them in operation are finished, the reservoir level is already outside of their operating range.
During the whole filling period (9 years), the additional energy produced by the cascade compared the “Without Rogun (a)” scenario is 37.2 TWh. It matches 3.7 years of Rogun normal operation.

TEAS for Rogun HPP Construction Project
Phase II - Vol. 3 – Chap.5 – Reservoir operation study
P.002378 RP 40 page 102 /107
Year Rogun average yearly energy (GWh) Rogun average winter energy (GWh)
N+4
N+5 3 817 960
N+6 4 931 1 794
N+7 7 080 2 489
N+8 8 725 3 129
N+9 10 368 3 773
TOTAL 34 921 12 146
Table 6.3 : Rogun filling - Energy production - FSL=1220 masl
The next graph (Figure 6.9) presents the discharge at the downstream end of the cascade and compare the Rogun filling with normal operation in scenario (b) (results from §5.2.2).
It is to be pointed out that during the first 6 years of the filling period, the discharge at the downstream end of the cascade is higher in the filling of Rogun scenario than in scenario (b). After the 6th year, the two are superimposed. It means that the volume allowed for reservoir filling is not fully used for the first 6 years of reservoir filling.
The Figure 6.9 is a cross plot of the discharge at the downstream end of the cascade which compares the Rogun filling scenario with scenario (b). The series of points is either aligned on the 1/1 slope or above.
Figure 6.8 : Discharge at the downstream end of the Vakhsh - Filling FSL=1220 masl

TEAS for Rogun HPP Construction Project
Phase II - Vol. 3 – Chap.5 – Reservoir operation study
P.002378 RP 40 page 103 /107
Figure 6.9 : Cross plot of the discharge at the downstream end of the Vakhsh – Rogun 1220 filling
6.5 Comments on triggered seismicity
The Rogun site is likely to know triggered seismicity phenomena during the reservoir filling because of the various faults located in the reservoir.
The most intense events should occur during the first phase of filling, the first 60-80 m. It is indeed at the beginning that the greatest relative change in the field pore pressure will occur.
In general, to limit triggered seismicity the reservoir filling should be done slowly and continuously. As the Rogun reservoir filling is done only by using the Tajik water withdrawal allocation, it is indeed very regular until the regulation starts. At its highest rate, the reservoir filling is 9 meters per month.
The topic of triggered seismicity is also dealt with in the seismicity chapter (Vol 2 Chapt 6). There, it is reminded that during Nurek filling no significant triggered seismicity was detected wen the filling rate was lower than 0.5 m per day (ie 15 m/month).
In addition, to prevent such phenomena, a thorough monitoring of the reservoir area should be implemented as soon as possible: first to know the present seismic condition and then during reservoir filling to detect any triggered seism and adapt the reservoir filling rate if necessary.

TEAS for Rogun HPP Construction Project
Phase II - Vol. 3 – Chap.5 – Reservoir operation study
P.002378 RP 40 page 104 /107
7 CONCLUSIONS
This report contains the study made by the Consultant on the Vakhsh cascade, it includes:
the understanding of the present cascade operation, and of the regional water distribution;
the model of the present cascade and its calibration;
the simulation of the energy production in the present scenario and its improvement,
the simulation of the energy production in various future scenarios and alternatives.
The simulation of the Vakhsh cascade operation respects the downstream water requirements as ruled by the Interstate Commission for Water Coordination (ICWC)as agreed in the Nukus declaration and Protocol 566.
The whole study is performed in such a way that the operation principle of the Vakhsh river will remain unchanged and will replicate the operation recorded at Nurek for the period January 1991 to July 2011. Practically, it means that the active volume used for flow regulation on the Vakhsh River remains the same as presently in all scenario studied.
The main results in terms of energy production are synthetized in the next two tables. The first one presents the average yearly energy, the second one presents the firm energy and the last one presents the secondary energy.
Average yearly energy produced (TWh)
Rogun
Nurek Rest of Vakhsh cascade
Total Vakhsh cascade
1290 1255 1220 1290 1255 1220
Historical 11.7 8.2 19.9
Improved Nurek operation (a)
11.7 8.2 19.9
Improved Nurek operation (b)
11.3 7.8 19.1
With Rogun (a) 14.4 12.4 10.1 12.8 8.1 35.3 33.3 31.0
With Rogun(b) 14.4 12.4 10.1 12.3 7.8 34.4 32.5 30.2

TEAS for Rogun HPP Construction Project
Phase II - Vol. 3 – Chap.5 – Reservoir operation study
P.002378 RP 40 page 105 /107
Firm energy produced (TWh)
Rogun
Nurek Rest of Vakhsh
cascade
Total Vakhsh cascade
1290 1255 1220 1290 1255 1220
Historical 6.1 4.8 10.9
Improved Nurek operation (a)
7.6 5.4 13.0
Improved Nurek operation (b)
7.2 5.3 12.5
With Rogun (a) 9.3 7.9 5.9 8.1 5.4 22.8 21.7 20.1
With Rogun(b) 9.3 7.9 5.9 8.0 5.1 22.4 21.2 19.6
Secondary energy produced (TWh)
Rogun
Nurek Rest of Vakhsh
cascade
Total Vakhsh cascade
1290 1255 1220 1290 1255 1220
Historical 5.6 3.4 9
Improved Nurek operation (a)
4.1 2.8 6.9
Improved Nurek operation (b)
4.1 2.5 6.6
With Rogun (a) 5.1 4.5 4.2 4.7 2.8 12.6 11.6 10.9
With Rogun(b) 5.1 4.5 4.2 4.3 2.7 12 11.3 10.6
The study has shown that the present operation of Nurek could be improved to keep a constant energy production all along winter season: the firm energy production has been improved by 21%. The average energy remains constant.
It also shows that Rogun has a major impact on the electricity production of the whole Vakhsh cascade: Rogun own production is added but it also increases the Nurek production. Indeed, the river regulation is made in Rogun and Nurek remains mostly at its full supply level, increasing the head of the discharge through the turbines. The energy produced by the whole cascade is 74%, 64% and 54% more than “without Rogun” for respectively the dam alternatives 1290, 1255 and 1220 masl.
The energy production of the cascade is sensitive to the hydrology: the wet years allow producing 10% more energy than average years and in dry years it is decreased by 8%.
The dam alternative FSL 1255 masl produces a firm energy 5% lower than the dam alternative FSL 1290 masl. The dam alternative FSL 1220 masl produces a firm energy 12.5% lower than the dam alternative FSL 1290 masl. The energy difference is only due to the head difference in Rogun. It is therefore limited as an important part of the energy produced by the whole cascade is produced in Nurek and is the same (or nearly) for the three alternatives.

TEAS for Rogun HPP Construction Project
Phase II - Vol. 3 – Chap.5 – Reservoir operation study
P.002378 RP 40 page 106 /107
These operation results are achieved within the framework of the existing agreements and practices among the countries sharing the Amudarya basin. This means that the full regulation capacity of the cascade (Rogun and Nurek) is not used but is limited to the regulation presently performed by Nurek.
For the dam alternative FSL=1290 masl, the dam operates between 1290 and 1259 masl. For the dam alternative FSL=1255 masl, the dam operates between 1255 and 1208 masl. For the dam alternative FSL=1220 masl, the dam operates between 1220 and 1140 masl.
Using the full Tajik water withdrawals allowed has a limited impact on the energy produced: the volume of the withdrawals is limited compared to the Vakhsh run off.
The study of the various installed capacities shows that the highest one is used only 2% of the whole simulation period. The daily peaking potential cannot be assessed here because the study is made on a monthly basis, therefore the difference between the various installed capacity studied is not significant. Nevertheless, the daily peaking potential, both in summer and winter, is studied in the economic analysis.
The impact of sediment deposit in the Rogun reservoir has been assessed over the entire project life span. The energy produced is hardly impacted for 80, 40 and 10 years for FSL alternatives 1290, 1255 and 1220 masl respectively. Afterwards the firm energy is decreased by 20% over 35 years for the highest alternative, by 22% over 35 years for the medium alternative and by 17% over 35 years for the lowest alternatives.
The Rogun filling period have also been studied. It shows that it possible to fill Rogun only by using the differential volume between the Tajik water allocation and their present water use. It will take respectively 16, 13 and 9 years for the dam alternatives FSL=1290, 1255 and 1220 masl to reach the normal operation. It is to be noted that the river regulation will be done in Rogun as soon as possible as it has a significant impact on the winter energy; it will start 7, 8 and 5 years after river diversion for the dam alternatives FSL=1290, 1255 and 1220 masl. The total amount of energy produced during that period is equivalent to 7.7, 5.5 and 3.7 ordinary years for respectively the dam alternatives FSL=1290, 1255 and 1220 masl.
Recommendation
1. The method used in this study, replicate the historical operation of the river and as a consequence the flow release, is unusual. Normally, an optimization routine would be used to maximize the hydropower production. This requires a precise set of water use constrains.
Therefore, it would be useful and will bring benefits to all countries of the Amudarya basin to set a precise interstate agreement on optimize multipurpose use of the cascade. This could introduce significant improvements in electricity, irrigation and environmental purposes.
A precise and agreed by all countries rule for the Amudarya flow regulation would help at taking advantages of the Rogun capacity: it could store water in wet years and release water in dry years in order to improve both the energy production and the irrigation. Knowing exactly what is the water demand downstream of the Vakhsh river would allow to perform an efficient optimization of the Vakhsh operation.
2. The Nurek bathymetry and detailed sedimentation study are recommended to be available for further stage of the study.

TEAS for Rogun HPP Construction Project
Phase II - Vol. 3 – Chap.5 – Reservoir operation study
P.002378 RP 40 page 107 /107
8 APPENDICES
Appendix A - Monthly Inflows data
Appendix B - Nurek daily records on the period January 1991-July 2011
Appendix C - Vakhsh production daily records on the period January 2004 - May 2011
Appendix D – Simulation results
Appendix E – Water Withdrawals within Tajikistan