phase i transmission study
TRANSCRIPT

COLORADO COORDINATED PLANNING GROUP SAN LUIS VALLEY SUBCOMMITTEE
Phase I Transmission Study
January 28, 2016
Studies Performed By: Jonathan Fidrych
James Nguyen

Phase I: Reliability Evaluation
Table of Contents
1. Executive Summary ....................................................................................................................1
2. Objectives ..................................................................................................................................1
3. Background ................................................................................................................................2
4. Reliability& Load Serving Capability ............................................................................................2
5. Export Capability ........................................................................................................................4
6. Aging Infrastructure ....................................................................................................................4
7. Stakeholder Input .......................................................................................................................5
8. Methodology ..............................................................................................................................7
8.1. Base Cases ........................................................................................................................................ 7 8.2. Load Forecasts ................................................................................................................................. 7 8.3. Generation Assumptions ................................................................................................................. 8 8.4. Line Rating Assumptions .................................................................................................................. 8 8.5. Contingency Analysis ....................................................................................................................... 8 8.6. Voltage Stability (P-V) Analysis ........................................................................................................ 8 8.7. Transfer Capability Analysis ............................................................................................................. 9
9. Alternatives .............................................................................................................................. 10
9.1. Alternative 1: 69kV -> 115kV ......................................................................................................... 10 9.2. Alternative 2: 115kV -> 230kV ....................................................................................................... 11 9.3. Alternative 3: New 230kV .............................................................................................................. 12 9.4. Alternative 4: 115kV -> 230kV and 69kV -> 115kV ........................................................................ 13 9.5. Alternative 5: New 230kV and 69kV -> 115kV ............................................................................... 14 9.6. Alternative 6: 69kV -> 230kV ......................................................................................................... 15 9.7. Alternative 7: New 230kV Double Circuit Line ............................................................................... 16 9.8. Sensitivity A: Rebuild Mosca – Alamosa 69kV to 115kV ................................................................ 17 9.9. Sensitivity B: STATCOM .................................................................................................................. 17 9.10. Sensitivity C: New Generator ......................................................................................................... 17
10. Results .................................................................................................................................. 18
10.1. Reliability........................................................................................................................................ 18 10.2. Load Serving Capability .................................................................................................................. 23 10.3. Preliminary Transfer Capability Analysis ........................................................................................ 26
11. Conclusion ............................................................................................................................ 27
Appendix A: Tri-State’s Reliability Criteria......................................................................................... 29
Appendix B: PSCO’s Reliability Criteria .............................................................................................. 30
Appendix C: Contingency Analysis Results ........................................................................................ 31

Phase I: Reliability Evaluation
1. Executive Summary New high-voltage transmission must be built in the San Luis Valley (SLV) region of south-central Colorado to increase electric system reliability and customer load-serving capability, and to accommodate development of potential generation resources. Tri-State Generation and Transmission (Tri-State) and Public Service Company of Colorado (Public Service) facilitated this effort through the Colorado Coordinated Planning Group (CCPG), which formed the San Luis Valley (SLV) Subcommittee to perform an evaluation of the transmission system immediately in and around the SLV and develop system alternatives that would improve the transmission system between the SLV and Poncha Springs (Poncha), Colorado. Both Tri-State and Public Service have electric customer loads in the SLV region that are served radially from transmission that originates at or near Poncha. The transmission consists of three lines: a 230 kV line, a 115 kV line and a 69 kV line. Previous studies have identified performance issues with the SLV transmission, which include reliability concerns, and limited capability for load service and resource export capability. In addition, there has been a growing concern for the integrity of the aging transmission infrastructure in the area. This study was performed to evaluate the transmission alternatives that could address each of the identified issues. The SLV Subcommittee agreed to split the study process into two phases. This first phase of the study focused on resolving reliability issues and increasing load serving capacity potential. However, some preliminary analysis was also performed to gain a relative understanding of potential export capability. The second phase of the study will focus more on the transfer capability and address the potential generation export capability of transmission alternatives by expanding the study area beyond the Poncha Substation.
This study followed the CCPG and FERC Order 890 stakeholder processes and stakeholders were invited to provide input during all stages of the study process. Several different transmission alternatives were submitted by stakeholders during an open comment period at the beginning of the process. This information was then aggregated and similar alternatives combined to reduce the number of power flow analyses to be performed. The reduced list of alternatives was presented to the stakeholder group in a subsequent meeting upon close of the comment period ensuring that the list included all input.
The study concluded that, at a minimum, an additional 230 kV line is needed to increase system reliability. Studies show that this could be accomplished by either adding a new 230 kV line or rebuilding an existing lower voltage line to and operating it at 230 kV. As such, Alternatives 2-6 are all electrically feasible from a transmission planning perspective. Further transmission upgrades within the SLV would be required to meet each of the objectives. It should be noted that any alternative which does not directly address aging transmission infrastructure in the SLV does not preclude this issue from being addressed separately.
2. Objectives There were four main objectives and needs identified by the SLV Subcommittee prior to the beginning of the study process. The goal was to identify and evaluate potential alternatives that would address the SLV transmission system limitations adequately. The objectives to be addressed are:
1. Improve reliability 2. Increase load serving capability 3. Increase generation export capability 4. Allow for improvements to aging infrastructure
~ 1 ~
Phase I: Reliability Evaluation
3. Background Power is transferred to and from the SLV by two primary transmission lines: the Poncha – SLV 230 kV line, which is jointly owned between Tri-State and Public Service, and the Poncha – Sargent – SLV 115 kV line owned by Public Service. There is also a 69 kV line between Poncha and the SLV, but it is primarily used for local load serving purposes. The 69 kV line is usually operated with a normal open point at Mirage Junction, rather than as a continuous delivery transmission line. Previous studies have shown that outages on either the 115 kV line or the 230 kV line can cause unacceptably large amounts of power to flow onto the 69 kV line if it is operated as a continuous line. Refer to Figure 3 for an area overview of the SLV.
4. Reliability& Load Serving Capability Reliability standards require that acceptable performance be maintained for both system intact and contingency conditions. The most critical contingency for the SLV area is the loss of the Poncha – SLV 230 kV line. If that line is lost during high load conditions, the remaining 115 kV line cannot provide the necessary capacity and there is a risk of losing customer loads. Tri-State has installed an Under Voltage Load Shedding (UVLS) scheme which de-energizes a significant portion of their customers in the event the existing Poncha – SLV 230 kV line trips and remains open. This is to prevent voltage collapse of the greater Bulk Electric System (BES). Public Service also has customers in the SLV that may be exposed to low voltage conditions. The existing transmission system also limits the ability to accommodate additional load growth in the SLV region.
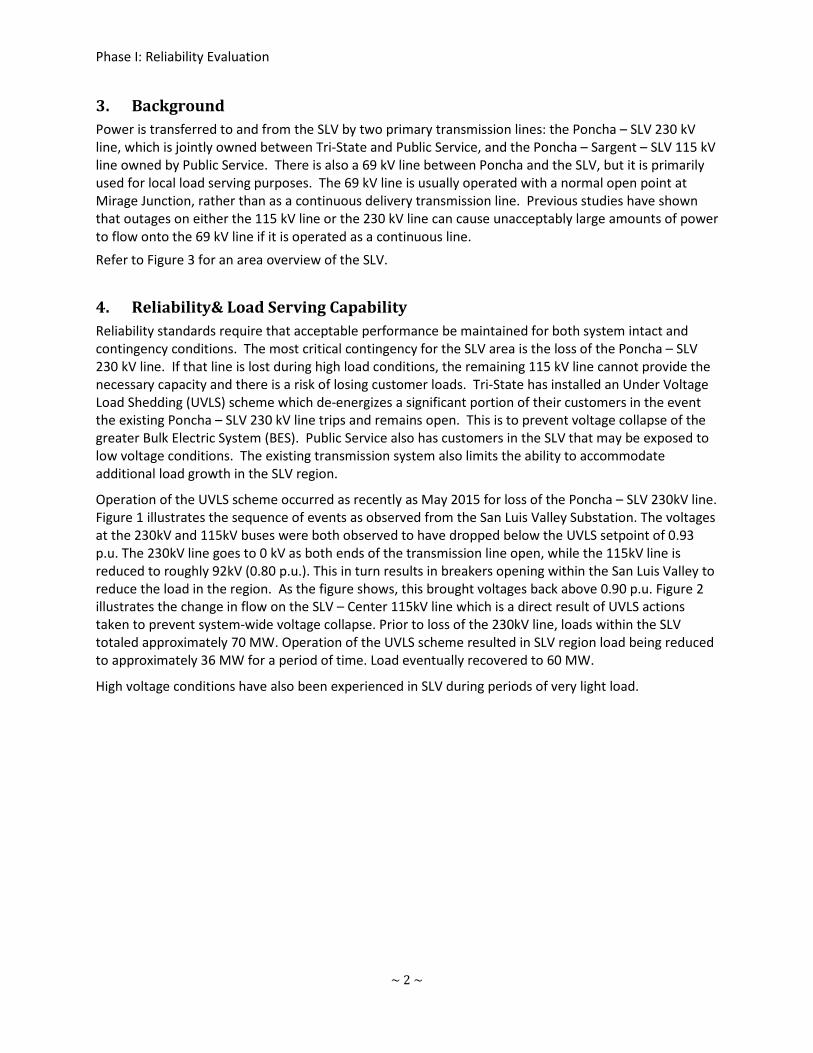
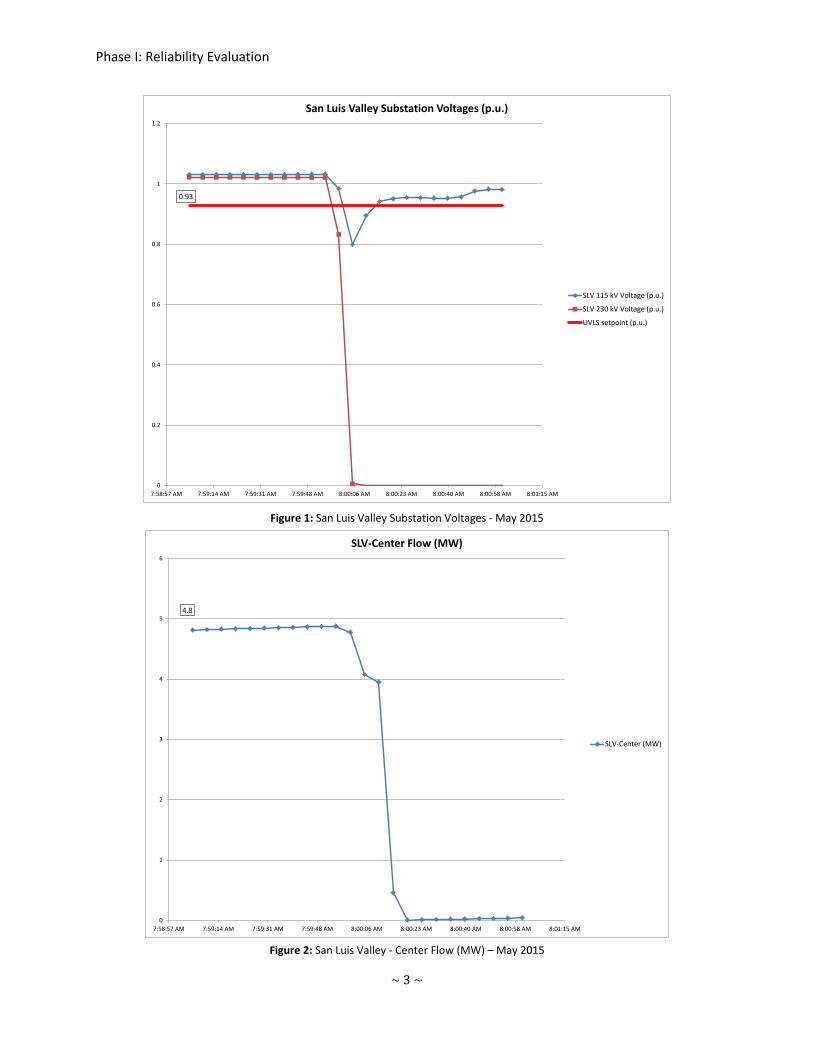
Operation of the UVLS scheme occurred as recently as May 2015 for loss of the Poncha – SLV 230kV line. Figure 1 illustrates the sequence of events as observed from the San Luis Valley Substation. The voltages at the 230kV and 115kV buses were both observed to have dropped below the UVLS setpoint of 0.93 p.u. The 230kV line goes to 0 kV as both ends of the transmission line open, while the 115kV line is reduced to roughly 92kV (0.80 p.u.). This in turn results in breakers opening within the San Luis Valley to reduce the load in the region. As the figure shows, this brought voltages back above 0.90 p.u. Figure 2 illustrates the change in flow on the SLV – Center 115kV line which is a direct result of UVLS actions taken to prevent system-wide voltage collapse. Prior to loss of the 230kV line, loads within the SLV totaled approximately 70 MW. Operation of the UVLS scheme resulted in SLV region load being reduced to approximately 36 MW for a period of time. Load eventually recovered to 60 MW.
High voltage conditions have also been experienced in SLV during periods of very light load.
~ 2 ~
Phase I: Reliability Evaluation
Figure 1: San Luis Valley Substation Voltages - May 2015
Figure 2: San Luis Valley - Center Flow (MW) – May 2015
0.93
0
0.2
0.4
0.6
0.8
1
1.2
7:58:57 AM 7:59:14 AM 7:59:31 AM 7:59:48 AM 8:00:06 AM 8:00:23 AM 8:00:40 AM 8:00:58 AM 8:01:15 AM
San Luis Valley Substation Voltages (p.u.)
SLV 115 kV Voltage (p.u.)
SLV 230 kV Voltage (p.u.)
UVLS setpoint (p.u.)
4.8
0
1
2
3
4
5
6
7:58:57 AM 7:59:14 AM 7:59:31 AM 7:59:48 AM 8:00:06 AM 8:00:23 AM 8:00:40 AM 8:00:58 AM 8:01:15 AM
SLV-Center Flow (MW)
SLV-Center (MW)
~ 3 ~

Phase I: Reliability Evaluation
Figure 3: Area map of SLV
5. Export Capability The existing transmission in the SLV region also limits the amount of generation that can be exported out of the Valley. The SLV region has been identified as an area with good potential for solar energy generation and has been designated by Public Service to be an Energy Resource Zone as defined by Colorado Senate Bill 07-100 (SB100). SB100 was passed by the Colorado legislature in 2007. The bill requires regulated utilities in the state to develop plans for the construction or expansion of transmission facilities necessary to deliver electric power consistent with the timing of the development of beneficial energy resources, and to submit applications for certificates of public convenience and necessity for those plans. However, due to the same transmission constraints that limit the ability to serve load, there are also limits to how much power can be transported from San Luis Valley to Poncha, and beyond.
6. Aging Infrastructure As good company practice and in response to poor reliability and aging infrastructure in the SLV, Tri-State and Public Service have identified facilities that need to be improved, maintained, and/or
~ 4 ~

Phase I: Reliability Evaluation
sustained. All of the transmission lines are in various needs for repair or replacement. A secondary objective of this study is to develop alternatives that either directly upgrade existing lines, or will allow for those lines to be readily upgraded in the future.
7. Stakeholder Input In the summer of 2014, Tri-State and Public Service came to a consensus to jointly perform a reliability study for the SLV area which meets both companies’ objectives. At the 2014, 4th quarter CCPG meeting, Tri-State and Public Service presented the idea to the CCPG membership, and a study group was formed under the CCPG umbrella. The first conference call to kick off the subcommittee effort was held in December of 2014 and focused mainly on the first phase of the study effort - addressing the reliability portion of the study. The invitation was extended to all CCPG participants, and the study group followed the CCPG open stakeholder process for planning studies. At the beginning of the process, stakeholders were presented with a brief background of the SLV and the current issues that the system experiences. Objectives and needs were identified and can be found in Section 2 of this report. The first stakeholder call was followed by an open comment period for submission of alternatives for consideration. This comment period closed January 23, 2015. Closing of this comment period was followed by a second conference call on January 27, 2015. This second call reiterated the outlined objectives and needs and discussed the comments received during the comment period as well as the prior conference call. The comments pertaining to alternatives received during both the open comment period and two conference calls resulted in the eleven items below.
1. Restring San Luis Valley - Poncha 69 kV on existing double circuit 230-69 kV structures to 230 kV and continue on new structures south to San Luis Valley.
2. Restring San Luis Valley - Poncha 69 kV on existing double circuit 230-69 kV structures to 230 kV and continue on new structures south to San Luis Valley. Rebuild remaining 69 kV line to 115 kV.
3. Rebuild San Luis Valley – Sargent – Poncha 115 kV to 230 kV and Poncha – San Luis Valley 69 kV to 115 kV
4. Rebuild San Luis Valley – Poncha 69 kV to 115 kV with STATCOM 5. Rebuild San Luis Valley – Poncha 69 kV to 115 kV with backup generation 6. New Poncha – Malta 230 kV 7. New San Luis Valley – Comanche 230 kV 8. New San Luis Valley – Walsenburg 230 kV 9. New San Luis Valley – Poncha 230 kV 10. New San Luis Valley – Montrose 230 kV 11. New San Luis Valley – Pagosa 230 kV
Some of the above alternatives were electrically equivalent allowing the subcommittee to reduce the number to a set of unique alternatives which could be studied to verify that they met the stated objectives. Alternatives 6, 7, and 8 were analyzed in previous studies, which are still relevant; therefore, the studies were not reproduced. Electrically speaking, alternatives 10 and 11 could also improve the reliability in the San Luis Valley. Nevertheless, the subcommittee declined to analyze them primarily because they would require the construction of new transmission lines across rugged mountainous regions. It was decided such lines would be so difficult to permit and build that they did not justify the effort required to model and analyze them. Taking the above into consideration, the eleven alternatives were narrowed down to seven.
1. Rebuild San Luis Valley – Poncha 69 kV to 115 kV 2. Rebuild San Luis Valley – Poncha 115 kV to 230 kV 3. New San Luis Valley – Poncha 230 kV Line
~ 5 ~
Phase I: Reliability Evaluation
4. Alternative 1 + Alternative 2 5. Alternative 1 + Alternative 3 6. Rebuild San Luis Valley – Poncha 69 kV to 230 kV 7. New 230 kV San Luis Valley – Poncha 230 kV Double Circuit Line
Stakeholder comments were not limited to alternatives. Additional comments that did not explicitly outline an alternative, but which are considered part of the planning process are listed below.
A. Analyze locations/need for new substation(s) to accommodate export of 500 MW – 700 MW of new solar.
B. Consider that distributed generation, demand response, storage, and energy efficiency measures will reduce the need for 100 MW of transfer capacity over the next 20 years
C. Consider proposed transmission and distribution infrastructure improvements will a) encourage utility-scale solar projects to be sited beyond Alamosa and Saguache Counties and b) facilitate DSM and other community-based technologies.
D. Evaluate if the existing 115 kV line can be re-conductored with bigger wire or bundled to increase the capacity of the 115 kV line.
These four comments are addressed here. First, this study is not a generation interconnection study. Therefore, a point of interconnection and delivery, size, and necessary improvements to accommodate such a request were not identified. This study only evaluates the impact that an improvement which meets the reliability and load serving capability needs has on export capability. If a specific amount of generation export to accommodate a project is desired, a generation interconnection request and associated study is necessary. Further, consideration is not given to location of necessary infrastructure (transmission and distribution) improvements as they are specific to the point of interconnection, delivery, size of project, etc. and are unique to each study. This addresses comments ‘A’ and ‘C.’ As for distributed generation, demand response, storage, and energy efficiency measures, they are considered as part of the load forecast or load sensitivity studies. Load within the SLV was studied at two levels: 150 MW and 45 MW. The lower load level, 45 MW, is consistent with off peak off season load levels seen historically. The higher 150 MW load level is consistent with the highest observed load. It is a transmission provider’s objective to reliably serve both load levels. Therefore, a reduction in load due to the measures listed above while having an impact does not remove the need to have the capability to serve the peak load. This addresses comment ‘B.’ Lastly, it was asked if the existing 115 kV line could be reconductored with a bigger wire or bundled to increase the capability of the line. While this has been done before, it is insufficient with respect to the load serving needs of the San Luis Valley. A bigger wire or bundled wire at 115 kV, while not specifically studied, is similar electrically to having two 115 kV lines which was studied. The results show that this is insufficient in preventing voltage collapse of the Valley. The results show that at a minimum a second 230 kV line is required. This addresses comment ‘D.’
~ 6 ~
Phase I: Reliability Evaluation
8. Methodology 8.1. Base Cases As the likelihood of constructing a new project prior to 2020 is viewed as low and with the possible need to perform transient stability analysis, two 2020 WECC Approved Bases Cases (20hs2a1p, 20hw1a1p) with associated dynamics data were utilized for the analysis. The two different cases were included to evaluate how differences in power factor between summer and winter loads affect the load serving capability. It was observed that the power factor within the Valley differs by 0.035 p.u. between the summer (0.96) and winter cases (0.995). Further, the load pattern, how the total load within the valley is divided among all of the delivery points, differs between cases. Some loads change between leading and lagging power factor between seasons. All these things can have an impact on potential voltage issues, thermal overloads, and the overall load serving capability.
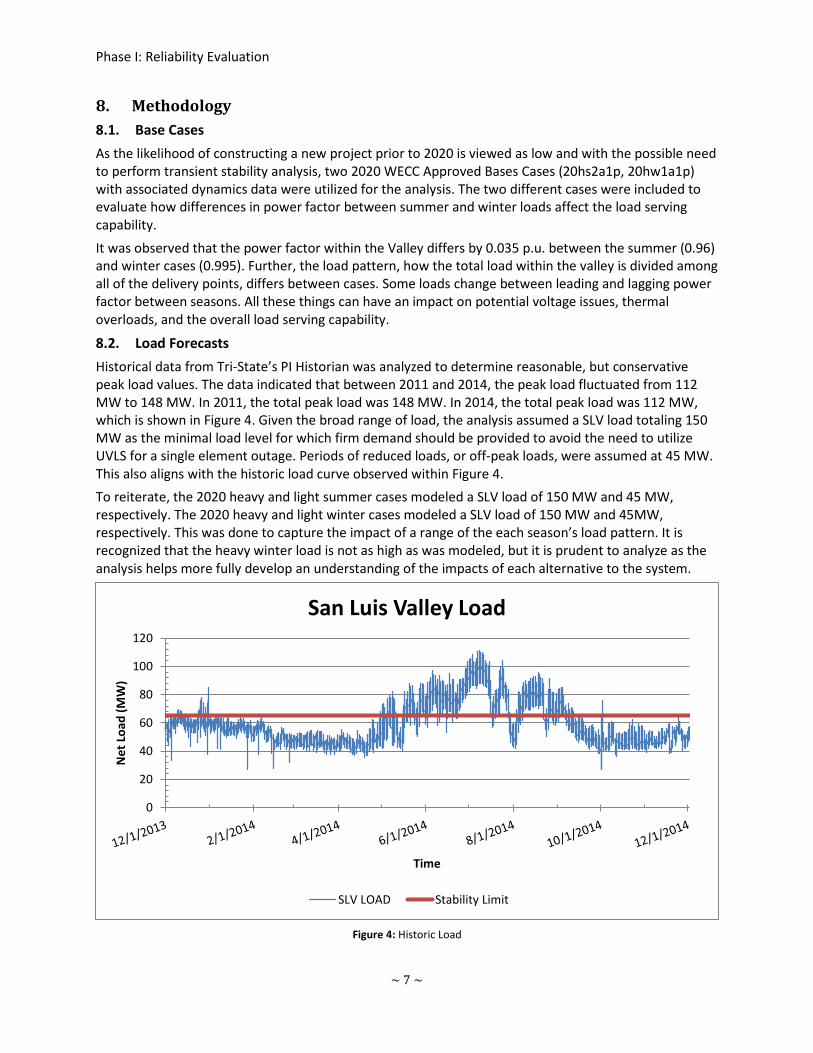
8.2. Load Forecasts Historical data from Tri-State’s PI Historian was analyzed to determine reasonable, but conservative peak load values. The data indicated that between 2011 and 2014, the peak load fluctuated from 112 MW to 148 MW. In 2011, the total peak load was 148 MW. In 2014, the total peak load was 112 MW, which is shown in Figure 4. Given the broad range of load, the analysis assumed a SLV load totaling 150 MW as the minimal load level for which firm demand should be provided to avoid the need to utilize UVLS for a single element outage. Periods of reduced loads, or off-peak loads, were assumed at 45 MW. This also aligns with the historic load curve observed within Figure 4. To reiterate, the 2020 heavy and light summer cases modeled a SLV load of 150 MW and 45 MW, respectively. The 2020 heavy and light winter cases modeled a SLV load of 150 MW and 45MW, respectively. This was done to capture the impact of a range of the each season’s load pattern. It is recognized that the heavy winter load is not as high as was modeled, but it is prudent to analyze as the analysis helps more fully develop an understanding of the impacts of each alternative to the system.
Figure 4: Historic Load
0
20
40
60
80
100
120
Net
Loa
d (M
W)
Time
San Luis Valley Load
SLV LOAD Stability Limit
~ 7 ~
Phase I: Reliability Evaluation
8.3. Generation Assumptions The standard assumptions used to develop the base cases were assumed. Generation at Comanche and Craig Generation Stations were offset depending on increase or reduction in the total SLV load from that in the base case.
8.4. Line Rating Assumptions It was assumed that all new or improved 115 kV lines were constructed with 795 ACSR Drake conductor rated at 238 MVA and all new or improved 230 kV lines were constructed with 1272 ACSR Bittern conductor rated at 631 MVA.
Additionally, the following existing lines were assumed to have conductor limited ratings. 1. SLV – Sargent 115 kV rated at 120 MVA 2. Poncha – West Canon 230 kV rated at 442 MVA.
8.5. Contingency Analysis Single breaker-to-breaker contingency analysis was performed to identify any system issues from the loss of a single element. Further, all contingency analysis assumed a SLV area load of 150 MW for heavy loading and 45 MW for light loading for the selected base cases. The SLV area load within each case was scaled such that each load retained its percentage of the total SLV load and power factor (pf). While there were two loading scenarios evaluated, there were also two solar generation scenarios considered. These included all solar offline and solar at 85% of its nameplate rating.
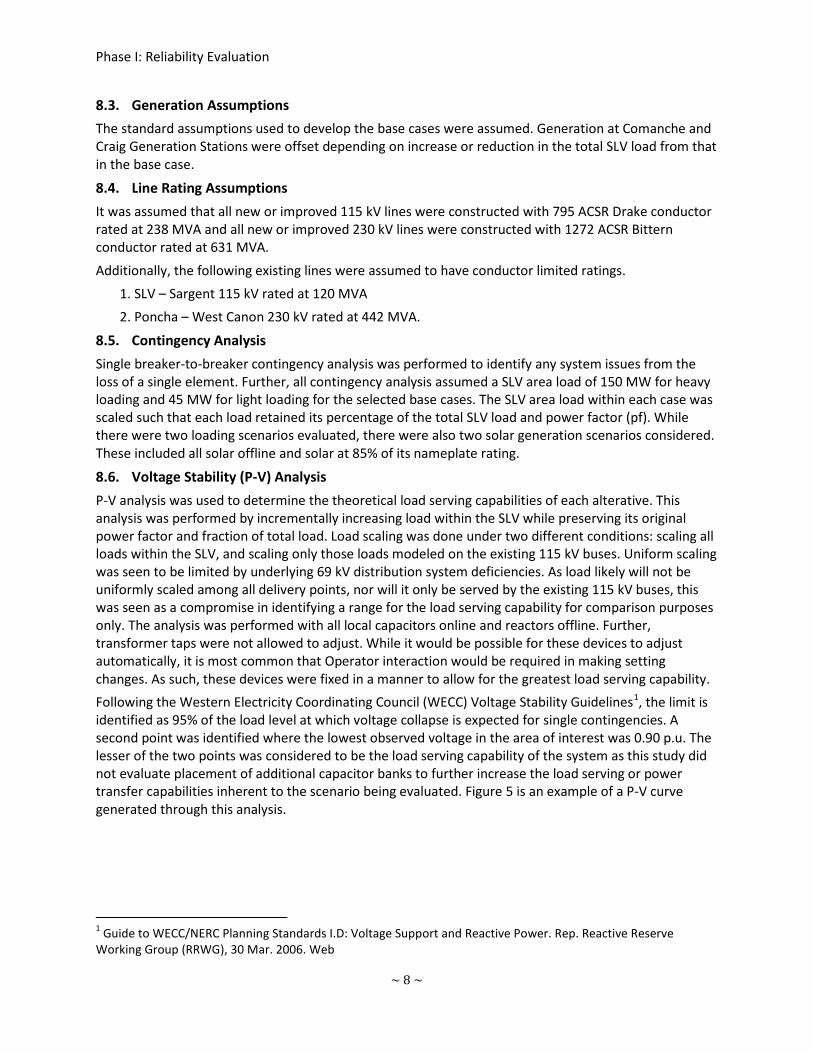
8.6. Voltage Stability (P-V) Analysis P-V analysis was used to determine the theoretical load serving capabilities of each alterative. This analysis was performed by incrementally increasing load within the SLV while preserving its original power factor and fraction of total load. Load scaling was done under two different conditions: scaling all loads within the SLV, and scaling only those loads modeled on the existing 115 kV buses. Uniform scaling was seen to be limited by underlying 69 kV distribution system deficiencies. As load likely will not be uniformly scaled among all delivery points, nor will it only be served by the existing 115 kV buses, this was seen as a compromise in identifying a range for the load serving capability for comparison purposes only. The analysis was performed with all local capacitors online and reactors offline. Further, transformer taps were not allowed to adjust. While it would be possible for these devices to adjust automatically, it is most common that Operator interaction would be required in making setting changes. As such, these devices were fixed in a manner to allow for the greatest load serving capability. Following the Western Electricity Coordinating Council (WECC) Voltage Stability Guidelines1, the limit is identified as 95% of the load level at which voltage collapse is expected for single contingencies. A second point was identified where the lowest observed voltage in the area of interest was 0.90 p.u. The lesser of the two points was considered to be the load serving capability of the system as this study did not evaluate placement of additional capacitor banks to further increase the load serving or power transfer capabilities inherent to the scenario being evaluated. Figure 5 is an example of a P-V curve generated through this analysis.
1 Guide to WECC/NERC Planning Standards I.D: Voltage Support and Reactive Power. Rep. Reactive Reserve Working Group (RRWG), 30 Mar. 2006. Web
~ 8 ~
Phase I: Reliability Evaluation
Figure 5: Example PV Diagram
8.7. Transfer Capability Analysis To determine how each alternative might impact export capability, a preliminary transfer capability analysis was performed for each alternative. This assessment was intended to provide a relative comparison of the potential transfer capability for each alternative. It is not meant to provide any direct correlation to an actual export capability of the SLV (Phase II). The assessment focused on the transmission between SLV Substation and Poncha Substation and did not take into account any transmission limitations outside of Poncha. The analysis also ignored voltage limitations and focused on transmission loading, assuming that voltage issues could be mitigated by voltage control devices in the future. Phase II studies will consist of a more detailed evaluation of export capability from the SLV, identify limitations beyond Poncha, and evaluate alternatives to mitigate those limitations. An infinite source was modeled at SLV and infinite sink at Poncha. The most limiting contingency was modeled and transfers increased until a limit was reached. The resulting “total transfer capability” limit between the two end points is the summation of the line flows from SLV to Poncha during system intact conditions with no further changes to the model. These analyses identified preliminary limitations of the system within the Valley and discounted the surrounding area. In Phase II, the SLV Subcommittee will be looking beyond Poncha Substation and evaluating different alternatives to deliver generation to load serving areas such as the Front Range. Table 19 summarizes the findings of the different Phase I alternatives evaluated. It is likely that there will be additional limitations to the export capability from Poncha and further evaluation of this capability is the subject of Phase II.
~ 9 ~

Phase I: Reliability Evaluation
9. Alternatives
Figure 6: SLV current system
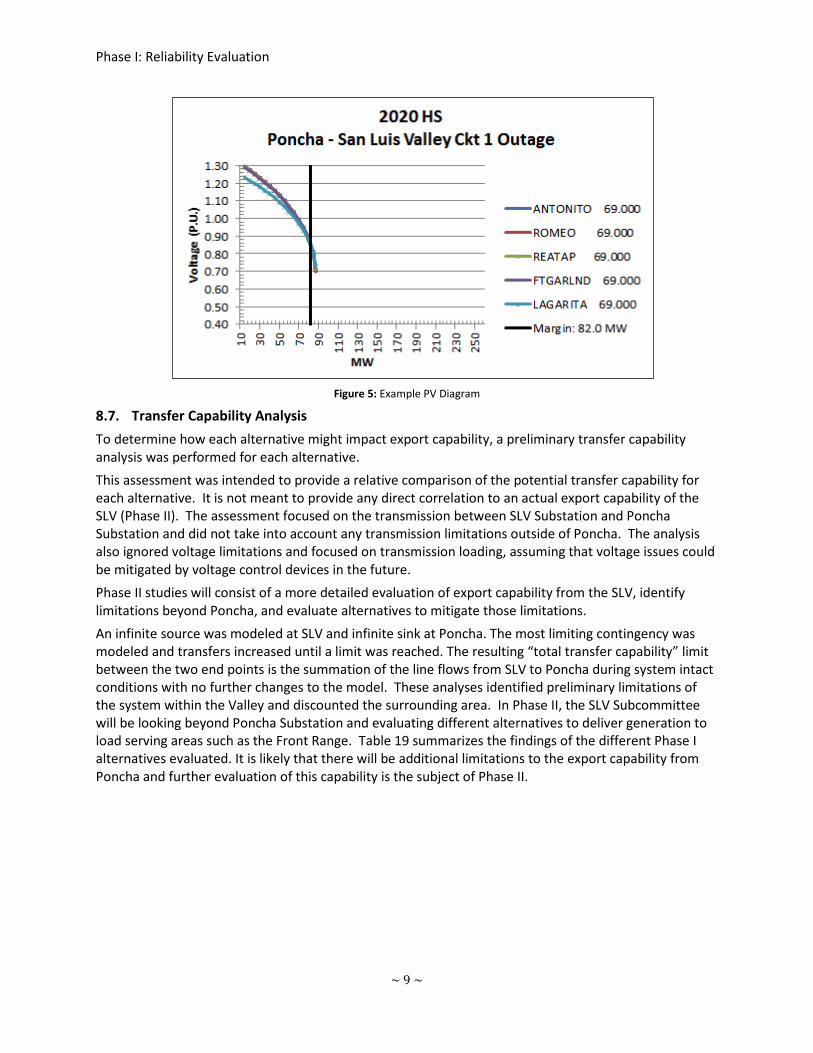
9.1. Alternative 1: 69kV -> 115kV Alternative 1 (shown in Figure 7 below) consists of rebuilding the existing Poncha – Mosca – SLV Sub 69 kV line to 115 kV. Refer to Figure 3 for more detail. Kerber Creek and Saguache are not directly on the line, and they will be served by radial 115 kV lines from the Villa Grove and Mirage Junction switching/breaker station, respectively.
~ 10 ~
Phase I: Reliability Evaluation
Figure 7: Alternative 1
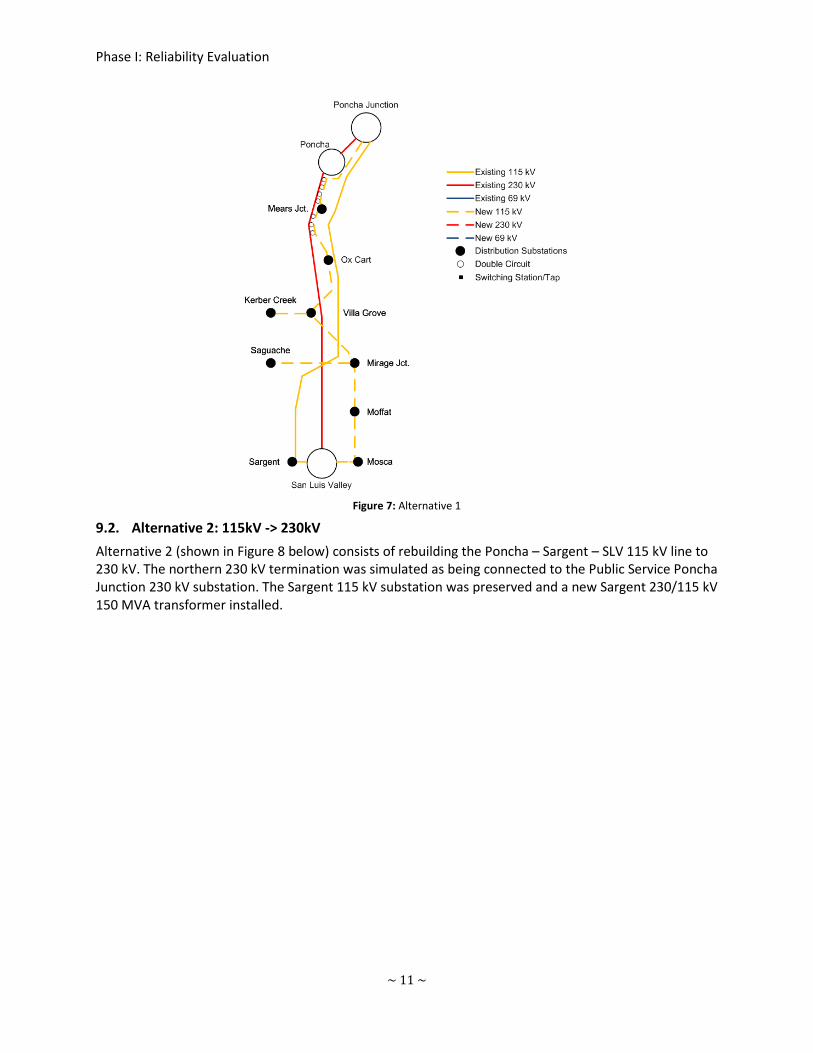
9.2. Alternative 2: 115kV -> 230kV Alternative 2 (shown in Figure 8 below) consists of rebuilding the Poncha – Sargent – SLV 115 kV line to 230 kV. The northern 230 kV termination was simulated as being connected to the Public Service Poncha Junction 230 kV substation. The Sargent 115 kV substation was preserved and a new Sargent 230/115 kV 150 MVA transformer installed.
~ 11 ~
Phase I: Reliability Evaluation
Figure 8: Alternative 2
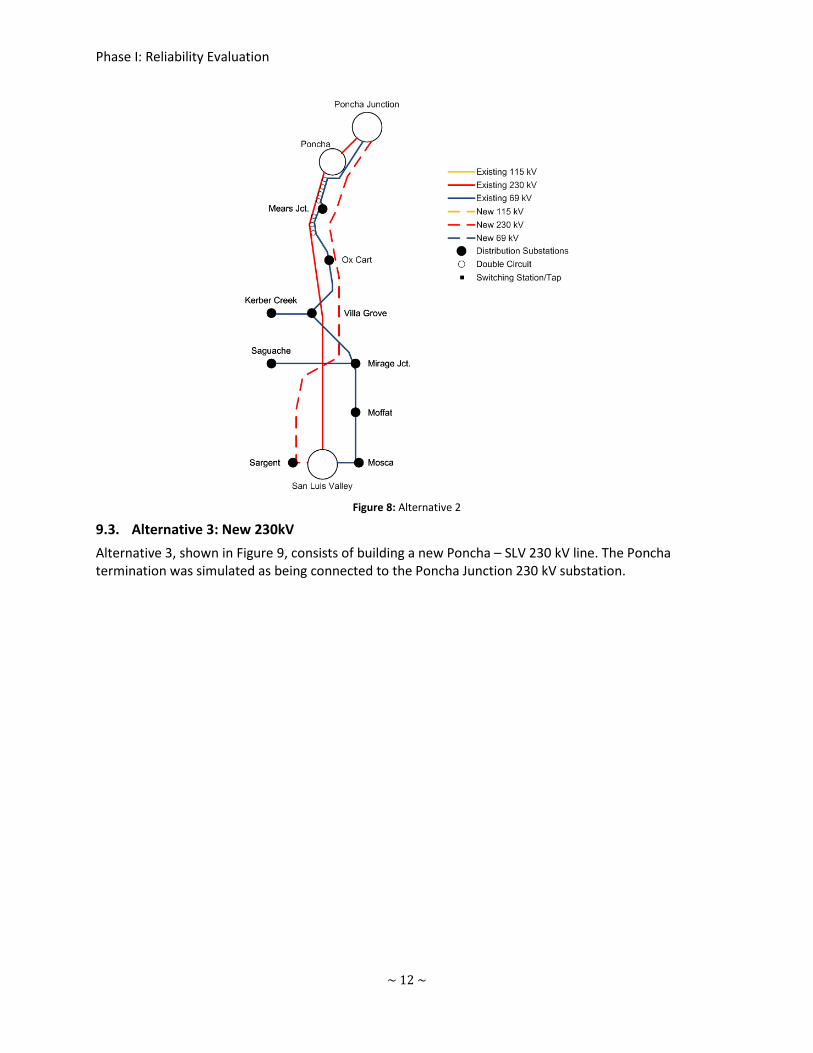
9.3. Alternative 3: New 230kV Alternative 3, shown in Figure 9, consists of building a new Poncha – SLV 230 kV line. The Poncha termination was simulated as being connected to the Poncha Junction 230 kV substation.
~ 12 ~

Phase I: Reliability Evaluation
Figure 9: Alternative 3
9.4. Alternative 4: 115kV -> 230kV and 69kV -> 115kV Alternative 4 combines Alternative 1 and Alternative 2 and can be seen in Figure 10 below.
~ 13 ~

Phase I: Reliability Evaluation
Figure 10: Alternative 4
9.5. Alternative 5: New 230kV and 69kV -> 115kV Alternative 5 combines Alternative 1 and Alternative 3 and is shown in Figure 11 below.
~ 14 ~
Phase I: Reliability Evaluation
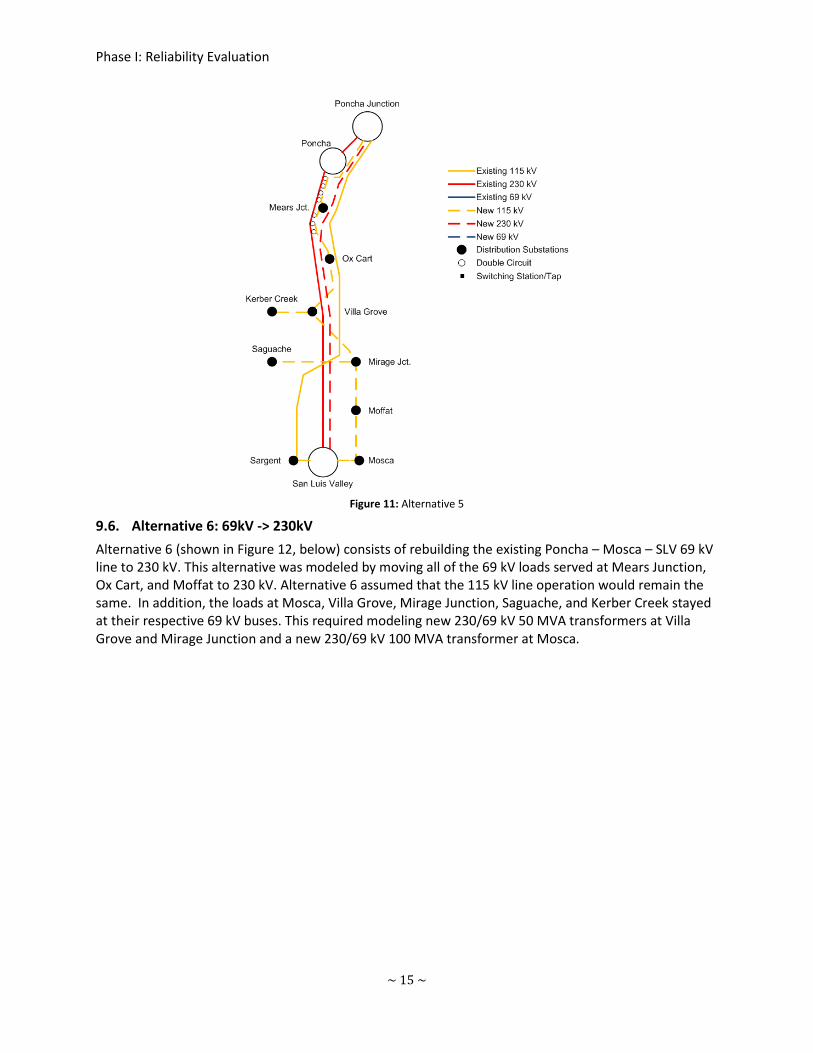
Figure 11: Alternative 5
9.6. Alternative 6: 69kV -> 230kV Alternative 6 (shown in Figure 12, below) consists of rebuilding the existing Poncha – Mosca – SLV 69 kV line to 230 kV. This alternative was modeled by moving all of the 69 kV loads served at Mears Junction, Ox Cart, and Moffat to 230 kV. Alternative 6 assumed that the 115 kV line operation would remain the same. In addition, the loads at Mosca, Villa Grove, Mirage Junction, Saguache, and Kerber Creek stayed at their respective 69 kV buses. This required modeling new 230/69 kV 50 MVA transformers at Villa Grove and Mirage Junction and a new 230/69 kV 100 MVA transformer at Mosca.
~ 15 ~

Phase I: Reliability Evaluation
Figure 12: Alternative 6
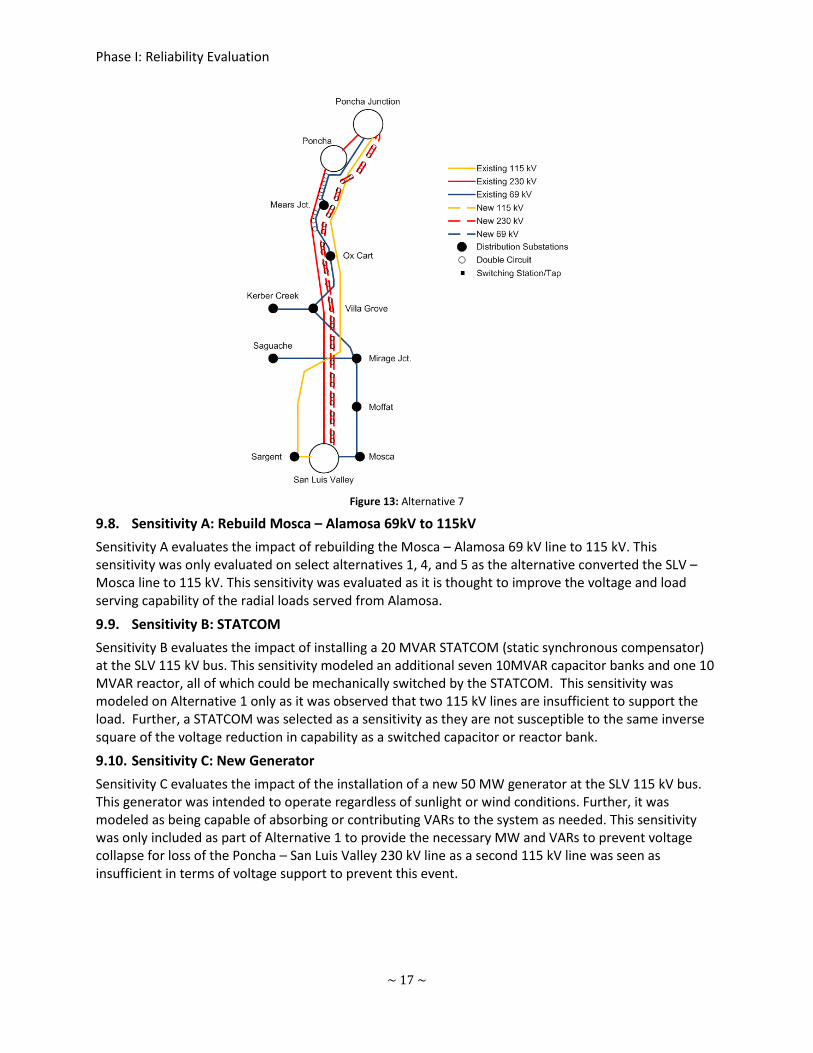
9.7. Alternative 7: New 230kV Double Circuit Line Alternative 7, shown in Figure 13, consists of building a new Poncha – SLV 230 kV double circuit line. The Poncha terminations were simulated as being connected to the Poncha Junction 230 kV substation.
~ 16 ~
Phase I: Reliability Evaluation
Figure 13: Alternative 7
9.8. Sensitivity A: Rebuild Mosca – Alamosa 69kV to 115kV Sensitivity A evaluates the impact of rebuilding the Mosca – Alamosa 69 kV line to 115 kV. This sensitivity was only evaluated on select alternatives 1, 4, and 5 as the alternative converted the SLV – Mosca line to 115 kV. This sensitivity was evaluated as it is thought to improve the voltage and load serving capability of the radial loads served from Alamosa.
9.9. Sensitivity B: STATCOM Sensitivity B evaluates the impact of installing a 20 MVAR STATCOM (static synchronous compensator) at the SLV 115 kV bus. This sensitivity modeled an additional seven 10MVAR capacitor banks and one 10 MVAR reactor, all of which could be mechanically switched by the STATCOM. This sensitivity was modeled on Alternative 1 only as it was observed that two 115 kV lines are insufficient to support the load. Further, a STATCOM was selected as a sensitivity as they are not susceptible to the same inverse square of the voltage reduction in capability as a switched capacitor or reactor bank.
9.10. Sensitivity C: New Generator Sensitivity C evaluates the impact of the installation of a new 50 MW generator at the SLV 115 kV bus. This generator was intended to operate regardless of sunlight or wind conditions. Further, it was modeled as being capable of absorbing or contributing VARs to the system as needed. This sensitivity was only included as part of Alternative 1 to provide the necessary MW and VARs to prevent voltage collapse for loss of the Poncha – San Luis Valley 230 kV line as a second 115 kV line was seen as insufficient in terms of voltage support to prevent this event.
~ 17 ~

Phase I: Reliability Evaluation
10. Results 10.1. Reliability The reliability results discuss the outcomes of the 2020 Heavy Summer (HS) and 2020 Heavy Winter (HW) analysis. The light load case results are not discussed in detail in this report, but the results can be found in the attached appendices.
10.1.1. Base Case The base case was analyzed as part of the comparative process. This was done to provide a base line, identify underlying issues, and determine the impact that each assessed alternative had on meeting the identified objectives. As expected, single contingency analysis revealed that there are existing issues within the SLV area, which are dependent on the load level, load distribution, line ratings internal to the Valley, and reactive compensation available. Table 1 highlights some of the thermal violations observed within the 2020 HS and 2020 HW cases. Each cell gives the contingency causing the worst thermal overload and the percent over the line rating. For example, the SLV – Poncha 230 kV line overloads in the 2020 HW case for loss of the Poncha – Sargent 115 kV line by 106%.
Table 1: Summary of Base Case Thermal Results
Monitored Element 20HS Base Case
20HW Base Case
SLV – Poncha 230 kV Poncha – Sargent 115 kV 106%
Rio Grande – Sargent 69 kV Blanca – Alamosa 115 kV 112%
Blanca – Alamosa 115 kV 178%
SLV - Mosca 69 kV Blanca – Alamosa 115 kV 101%
SYSTEM NORMAL
118%
SLV – Blanca 115 kV SLV – Mosca 115 kV 105%
Table 2 highlights a couple of the voltage issues at the transmission level at 100kV and above. The causing contingency and associated voltage is given for the evaluated case and bus. The SLV-Poncha 230 kV contingency results in voltage collapse within the SLV for the 2020 HS and 2020 HW base cases. Further, the Blanca – Alamosa 115 kV contingency results in voltage below 0.90 p.u. at Alamosa 115 kV in both the HS and HW cases.
Table 2: Summary of Base Case Transmission Voltage Results
Bus 20HS Base Case
20HW Base Case
- SLV – Poncha 230 kV Voltage Collapse
SLV – Poncha 230 kV Voltage Collapse
Alamosa 115 kV Blanca – Alamosa 115 kV 0.83
Blanca – Alamosa 115 kV 0.61
Blanca 115 kV SLV – Blanca 115 kV 0.62
~ 18 ~
Phase I: Reliability Evaluation
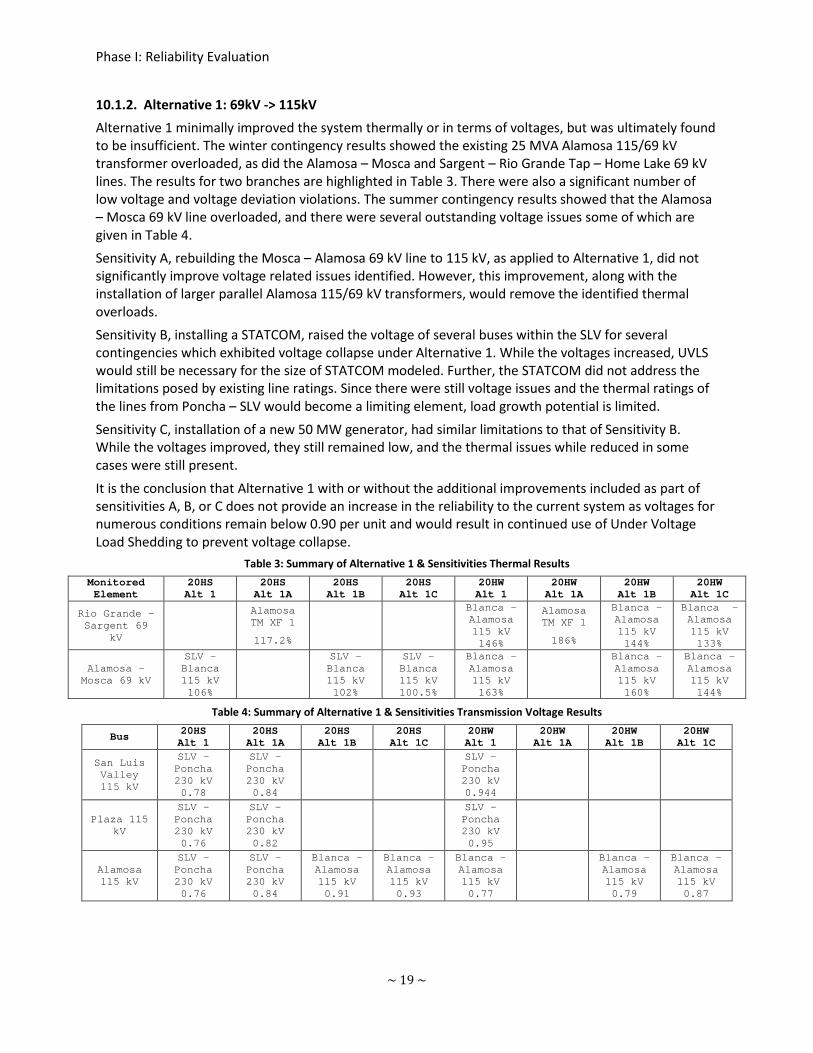
10.1.2. Alternative 1: 69kV -> 115kV Alternative 1 minimally improved the system thermally or in terms of voltages, but was ultimately found to be insufficient. The winter contingency results showed the existing 25 MVA Alamosa 115/69 kV transformer overloaded, as did the Alamosa – Mosca and Sargent – Rio Grande Tap – Home Lake 69 kV lines. The results for two branches are highlighted in Table 3. There were also a significant number of low voltage and voltage deviation violations. The summer contingency results showed that the Alamosa – Mosca 69 kV line overloaded, and there were several outstanding voltage issues some of which are given in Table 4. Sensitivity A, rebuilding the Mosca – Alamosa 69 kV line to 115 kV, as applied to Alternative 1, did not significantly improve voltage related issues identified. However, this improvement, along with the installation of larger parallel Alamosa 115/69 kV transformers, would remove the identified thermal overloads. Sensitivity B, installing a STATCOM, raised the voltage of several buses within the SLV for several contingencies which exhibited voltage collapse under Alternative 1. While the voltages increased, UVLS would still be necessary for the size of STATCOM modeled. Further, the STATCOM did not address the limitations posed by existing line ratings. Since there were still voltage issues and the thermal ratings of the lines from Poncha – SLV would become a limiting element, load growth potential is limited. Sensitivity C, installation of a new 50 MW generator, had similar limitations to that of Sensitivity B. While the voltages improved, they still remained low, and the thermal issues while reduced in some cases were still present. It is the conclusion that Alternative 1 with or without the additional improvements included as part of sensitivities A, B, or C does not provide an increase in the reliability to the current system as voltages for numerous conditions remain below 0.90 per unit and would result in continued use of Under Voltage Load Shedding to prevent voltage collapse.
Table 3: Summary of Alternative 1 & Sensitivities Thermal Results Monitored Element
20HS Alt 1
20HS Alt 1A
20HS Alt 1B
20HS Alt 1C
20HW Alt 1
20HW Alt 1A
20HW Alt 1B
20HW Alt 1C
Rio Grande – Sargent 69
kV
Alamosa TM XF 1
117.2%
Blanca – Alamosa 115 kV 146%
Alamosa TM XF 1
186%
Blanca – Alamosa 115 kV 144%
Blanca - Alamosa 115 kV 133%
Alamosa – Mosca 69 kV
SLV – Blanca 115 kV 106%
SLV – Blanca 115 kV 102%
SLV – Blanca 115 kV 100.5%
Blanca – Alamosa 115 kV 163%
Blanca – Alamosa 115 kV 160%
Blanca – Alamosa 115 kV 144%
Table 4: Summary of Alternative 1 & Sensitivities Transmission Voltage Results
Bus 20HS Alt 1
20HS Alt 1A
20HS Alt 1B
20HS Alt 1C
20HW Alt 1
20HW Alt 1A
20HW Alt 1B
20HW Alt 1C
San Luis Valley 115 kV
SLV – Poncha 230 kV 0.78
SLV – Poncha 230 kV 0.84
SLV – Poncha 230 kV 0.944
Plaza 115 kV
SLV – Poncha 230 kV 0.76
SLV – Poncha 230 kV 0.82
SLV – Poncha 230 kV 0.95
Alamosa 115 kV
SLV – Poncha 230 kV 0.76
SLV – Poncha 230 kV 0.84
Blanca – Alamosa 115 kV 0.91
Blanca – Alamosa 115 kV 0.93
Blanca – Alamosa 115 kV 0.77
Blanca – Alamosa 115 kV 0.79
Blanca – Alamosa 115 kV 0.87
~ 19 ~

Phase I: Reliability Evaluation
10.1.3. Alternative 2: 115kV -> 230kV Alternative 2 shows a marked improvement over the base case. Loss of the SLV – Poncha 230 kV line results in voltages in the 0.86 p.u. range for a number of the radial 69 kV buses. While this is below the 0.90 p.u. criteria, it is a significant increase from voltage collapse of the entire SLV system for loss of same 230 kV line given the current configuration of line supporting the SLV load. Table 5 and Table 6 summarize some of the thermal and voltage issues, respectively. In terms of thermal results, the worst contingency transitions from the SLV – Poncha 230 kV line to a line internal to the SLV. Loss of the Blanca – Alamosa 115 kV line overloads the Rio Grande Tap – Sargent 69 kV line. In terms of voltage issues, the contingency that causes the lowest voltage at the transmission level becomes a line internal to the SLV as well, under Alternative 2. Loss of the Blanca – Alamosa 115 kV line results in Alamosa 115 kV at 0.87 p.u. for the summer case and 0.70 p.u. during the winter as shown in Table 6.
Table 5: Summary of Alternative 2 Thermal Results
Monitored Element 20HS Alt 2
20HW Alt 2
SLV – Poncha 230 kV Poncha – Sargent 115 kV 101%
Rio Grande – Sargent 69 kV Blanca – Alamosa 115 kV 108%
Blanca – Alamosa 115 kV 169%
SLV - Mosca 69 kV Blanca – Alamosa 115 kV 102%
SYSTEM NORMAL
99.9%
Table 6: Summary of Alternative 2 Transmission Voltage Results
Bus 20HS Alt 2
20HW Alt 2
Alamosa 115 kV Blanca – Alamosa 115 kV 0.87
Blanca – Alamosa 115 kV 0.70
Blanca 115 kV SLV – Blanca 115 kV 0.70
10.1.4. Alternative 3: New 230kV Contingency analysis shows that Alternatives 2 and 3 are essentially equal in their performance. There is little difference between the thermal and voltage performances of either alternative for both the winter and summer cases. A summary of the Alternative 3 thermal and voltage results can be found in Tables 7 and 8, respectively.
Table 7: Summary of Alternative 3 Thermal Results
Monitored Element 20HS Alt 3
20HW Alt 3
Rio Grande – Sargent 69 kV Blanca – Alamosa 115 kV 109%
Blanca – Alamosa 115 kV 170%
SLV - Mosca 69 kV Blanca – Alamosa 115 kV 103%
SYSTEM NORMAL
99.9%
~ 20 ~
Phase I: Reliability Evaluation
Table 8: Summary of Alternative 3 Transmission Voltage Results
Bus 20HS Alt 3
20HW Alt 3
Alamosa 115 kV Blanca – Alamosa 115 kV 0.86
Blanca – Alamosa 115 kV 0.69
Blanca 115 kV SLV – Blanca 115 kV 0.70
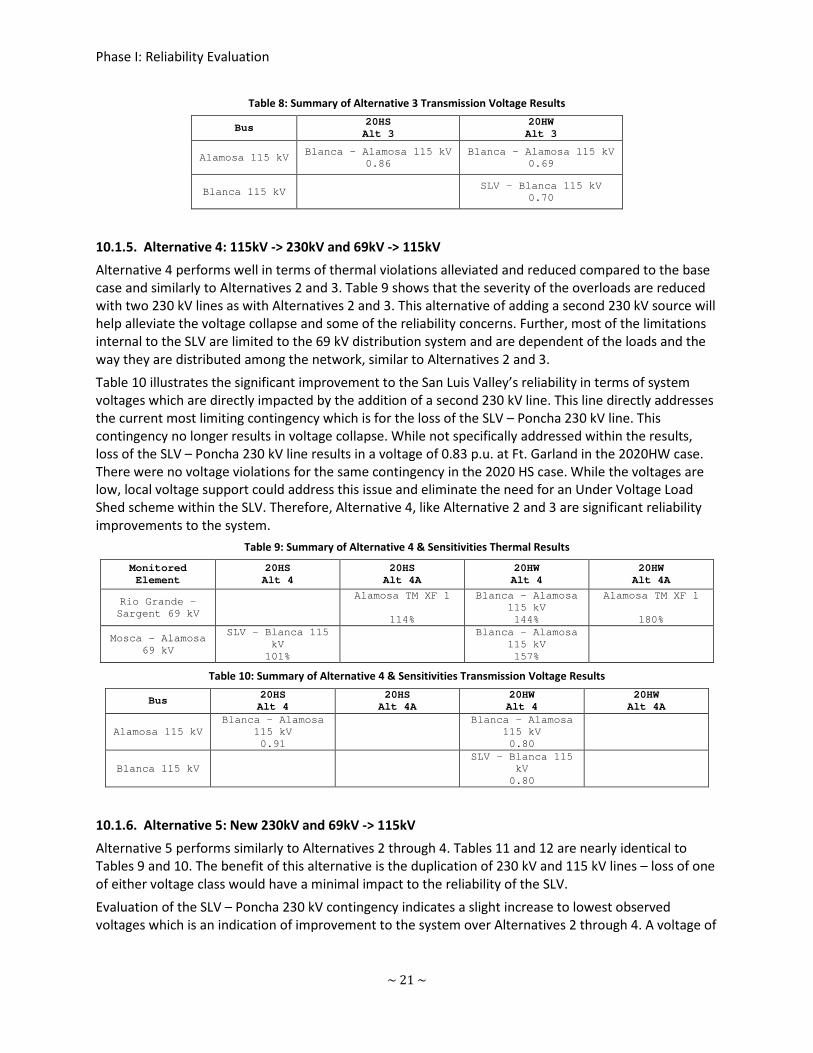
10.1.5. Alternative 4: 115kV -> 230kV and 69kV -> 115kV Alternative 4 performs well in terms of thermal violations alleviated and reduced compared to the base case and similarly to Alternatives 2 and 3. Table 9 shows that the severity of the overloads are reduced with two 230 kV lines as with Alternatives 2 and 3. This alternative of adding a second 230 kV source will help alleviate the voltage collapse and some of the reliability concerns. Further, most of the limitations internal to the SLV are limited to the 69 kV distribution system and are dependent of the loads and the way they are distributed among the network, similar to Alternatives 2 and 3. Table 10 illustrates the significant improvement to the San Luis Valley’s reliability in terms of system voltages which are directly impacted by the addition of a second 230 kV line. This line directly addresses the current most limiting contingency which is for the loss of the SLV – Poncha 230 kV line. This contingency no longer results in voltage collapse. While not specifically addressed within the results, loss of the SLV – Poncha 230 kV line results in a voltage of 0.83 p.u. at Ft. Garland in the 2020HW case. There were no voltage violations for the same contingency in the 2020 HS case. While the voltages are low, local voltage support could address this issue and eliminate the need for an Under Voltage Load Shed scheme within the SLV. Therefore, Alternative 4, like Alternative 2 and 3 are significant reliability improvements to the system.
Table 9: Summary of Alternative 4 & Sensitivities Thermal Results
Monitored Element
20HS Alt 4
20HS Alt 4A
20HW Alt 4
20HW Alt 4A
Rio Grande – Sargent 69 kV
Alamosa TM XF 1
114%
Blanca – Alamosa 115 kV 144%
Alamosa TM XF 1
180%
Mosca – Alamosa 69 kV
SLV – Blanca 115 kV 101%
Blanca – Alamosa
115 kV 157%
Table 10: Summary of Alternative 4 & Sensitivities Transmission Voltage Results
Bus 20HS Alt 4
20HS Alt 4A
20HW Alt 4
20HW Alt 4A
Alamosa 115 kV Blanca – Alamosa
115 kV 0.91
Blanca – Alamosa
115 kV 0.80
Blanca 115 kV SLV – Blanca 115
kV 0.80
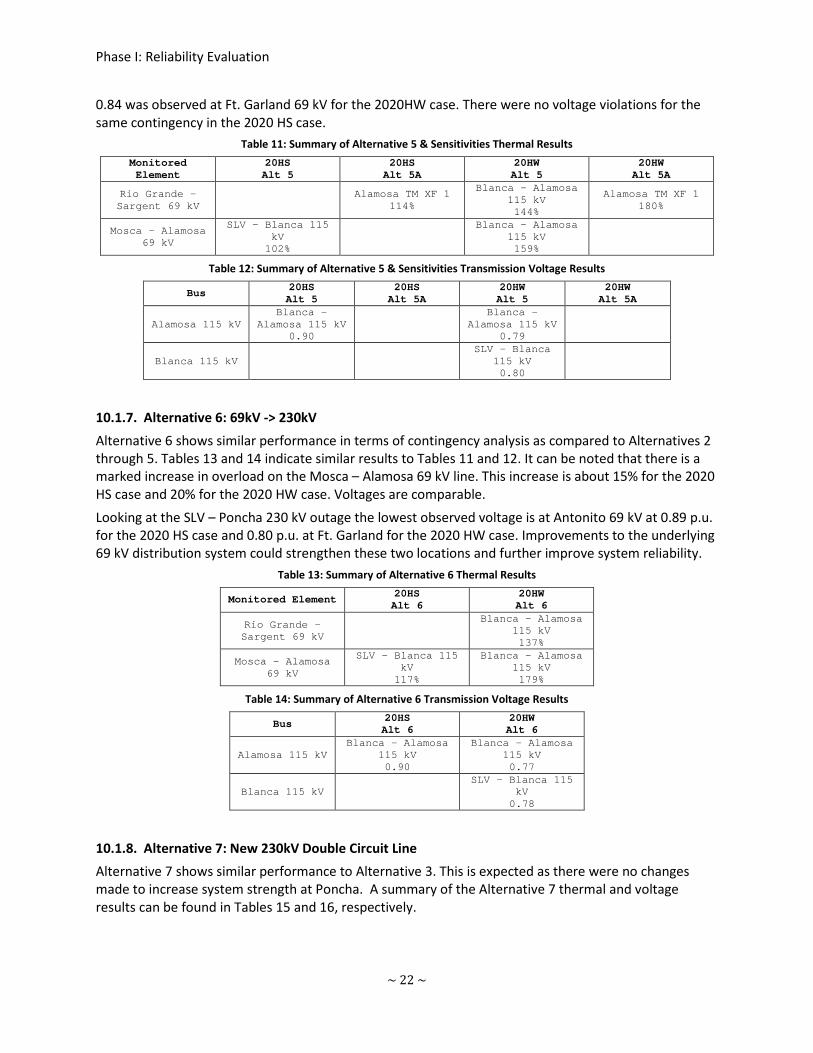
10.1.6. Alternative 5: New 230kV and 69kV -> 115kV Alternative 5 performs similarly to Alternatives 2 through 4. Tables 11 and 12 are nearly identical to Tables 9 and 10. The benefit of this alternative is the duplication of 230 kV and 115 kV lines – loss of one of either voltage class would have a minimal impact to the reliability of the SLV. Evaluation of the SLV – Poncha 230 kV contingency indicates a slight increase to lowest observed voltages which is an indication of improvement to the system over Alternatives 2 through 4. A voltage of
~ 21 ~
Phase I: Reliability Evaluation
0.84 was observed at Ft. Garland 69 kV for the 2020HW case. There were no voltage violations for the same contingency in the 2020 HS case.
Table 11: Summary of Alternative 5 & Sensitivities Thermal Results Monitored Element
20HS Alt 5
20HS Alt 5A
20HW Alt 5
20HW Alt 5A
Rio Grande – Sargent 69 kV Alamosa TM XF 1
114%
Blanca – Alamosa 115 kV 144%
Alamosa TM XF 1 180%
Mosca – Alamosa 69 kV
SLV – Blanca 115 kV 102%
Blanca – Alamosa
115 kV 159%
Table 12: Summary of Alternative 5 & Sensitivities Transmission Voltage Results
Bus 20HS Alt 5
20HS Alt 5A
20HW Alt 5
20HW Alt 5A
Alamosa 115 kV Blanca –
Alamosa 115 kV 0.90
Blanca –
Alamosa 115 kV 0.79
Blanca 115 kV SLV – Blanca
115 kV 0.80
10.1.7. Alternative 6: 69kV -> 230kV Alternative 6 shows similar performance in terms of contingency analysis as compared to Alternatives 2 through 5. Tables 13 and 14 indicate similar results to Tables 11 and 12. It can be noted that there is a marked increase in overload on the Mosca – Alamosa 69 kV line. This increase is about 15% for the 2020 HS case and 20% for the 2020 HW case. Voltages are comparable. Looking at the SLV – Poncha 230 kV outage the lowest observed voltage is at Antonito 69 kV at 0.89 p.u. for the 2020 HS case and 0.80 p.u. at Ft. Garland for the 2020 HW case. Improvements to the underlying 69 kV distribution system could strengthen these two locations and further improve system reliability.
Table 13: Summary of Alternative 6 Thermal Results
Monitored Element 20HS Alt 6
20HW Alt 6
Rio Grande – Sargent 69 kV
Blanca – Alamosa 115 kV 137%
Mosca – Alamosa 69 kV
SLV – Blanca 115 kV 117%
Blanca – Alamosa 115 kV 179%
Table 14: Summary of Alternative 6 Transmission Voltage Results
Bus 20HS Alt 6
20HW Alt 6
Alamosa 115 kV Blanca – Alamosa
115 kV 0.90
Blanca – Alamosa 115 kV 0.77
Blanca 115 kV SLV – Blanca 115
kV 0.78
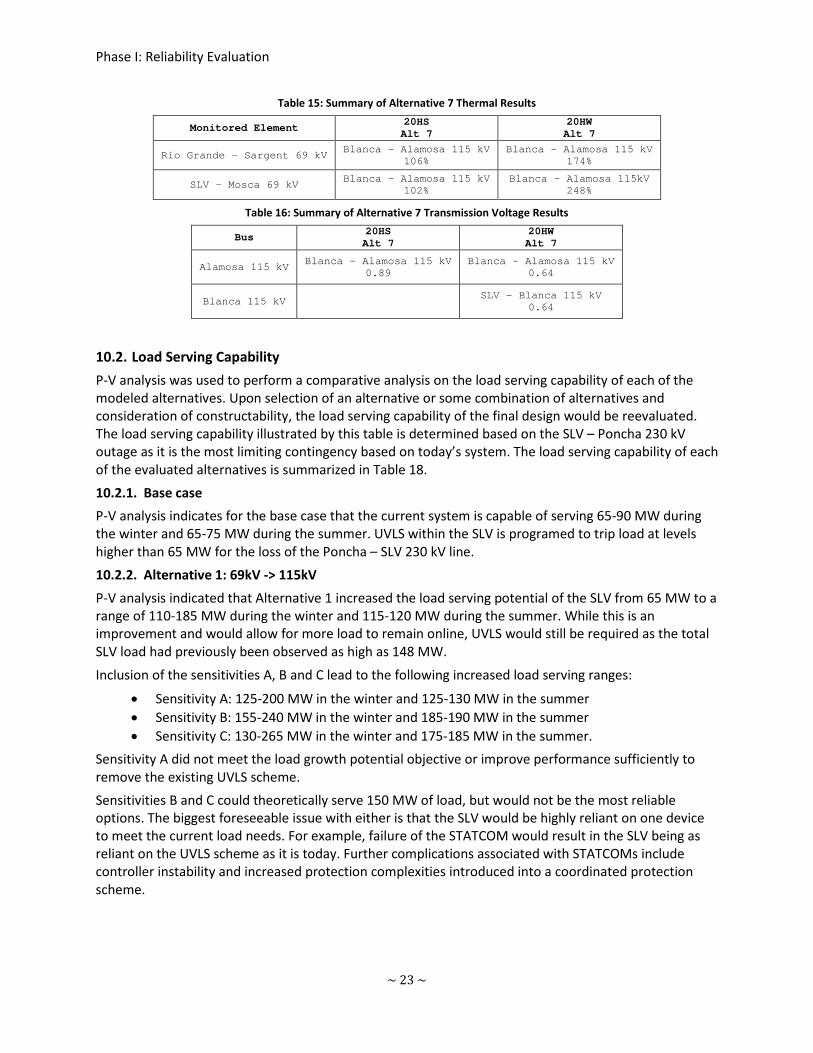
10.1.8. Alternative 7: New 230kV Double Circuit Line Alternative 7 shows similar performance to Alternative 3. This is expected as there were no changes made to increase system strength at Poncha. A summary of the Alternative 7 thermal and voltage results can be found in Tables 15 and 16, respectively.
~ 22 ~
Phase I: Reliability Evaluation
Table 15: Summary of Alternative 7 Thermal Results
Monitored Element 20HS Alt 7
20HW Alt 7
Rio Grande – Sargent 69 kV Blanca – Alamosa 115 kV 106%
Blanca – Alamosa 115 kV 174%
SLV - Mosca 69 kV Blanca – Alamosa 115 kV 102%
Blanca – Alamosa 115kV
248%
Table 16: Summary of Alternative 7 Transmission Voltage Results
Bus 20HS Alt 7
20HW Alt 7
Alamosa 115 kV Blanca – Alamosa 115 kV 0.89
Blanca – Alamosa 115 kV 0.64
Blanca 115 kV SLV – Blanca 115 kV 0.64
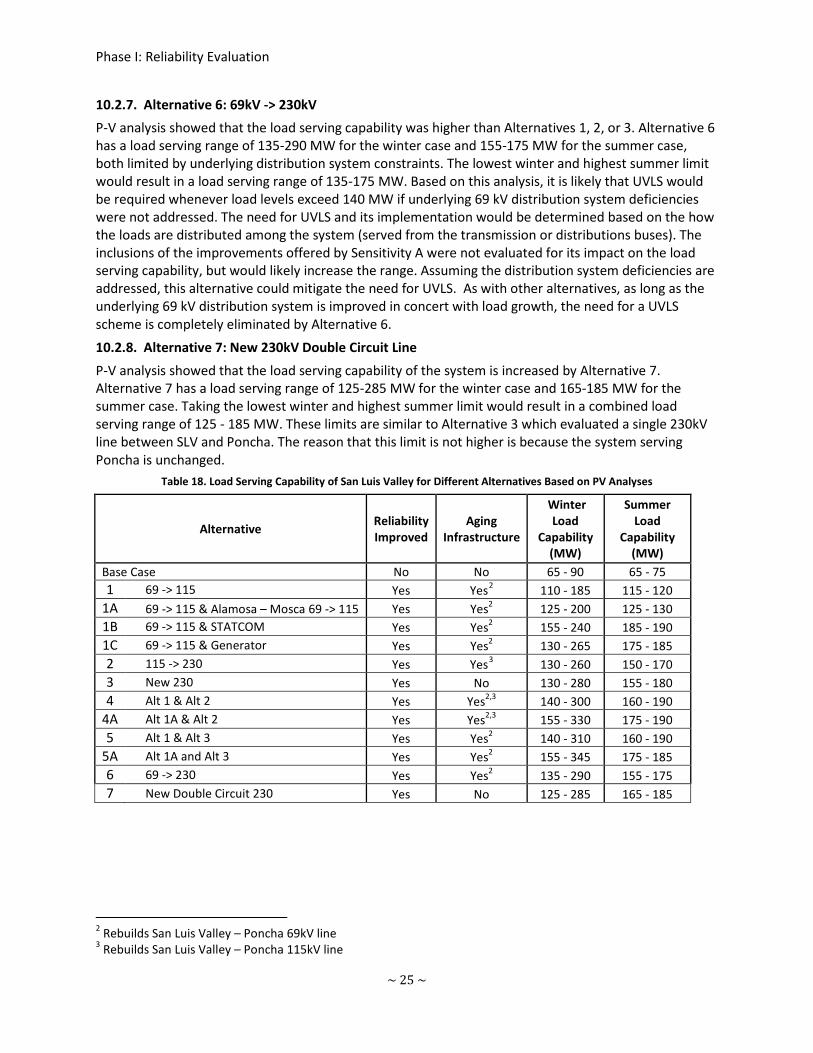
10.2. Load Serving Capability P-V analysis was used to perform a comparative analysis on the load serving capability of each of the modeled alternatives. Upon selection of an alternative or some combination of alternatives and consideration of constructability, the load serving capability of the final design would be reevaluated. The load serving capability illustrated by this table is determined based on the SLV – Poncha 230 kV outage as it is the most limiting contingency based on today’s system. The load serving capability of each of the evaluated alternatives is summarized in Table 18. 10.2.1. Base case P-V analysis indicates for the base case that the current system is capable of serving 65-90 MW during the winter and 65-75 MW during the summer. UVLS within the SLV is programed to trip load at levels higher than 65 MW for the loss of the Poncha – SLV 230 kV line. 10.2.2. Alternative 1: 69kV -> 115kV P-V analysis indicated that Alternative 1 increased the load serving potential of the SLV from 65 MW to a range of 110-185 MW during the winter and 115-120 MW during the summer. While this is an improvement and would allow for more load to remain online, UVLS would still be required as the total SLV load had previously been observed as high as 148 MW.
Inclusion of the sensitivities A, B and C lead to the following increased load serving ranges:
• Sensitivity A: 125-200 MW in the winter and 125-130 MW in the summer • Sensitivity B: 155-240 MW in the winter and 185-190 MW in the summer • Sensitivity C: 130-265 MW in the winter and 175-185 MW in the summer.
Sensitivity A did not meet the load growth potential objective or improve performance sufficiently to remove the existing UVLS scheme. Sensitivities B and C could theoretically serve 150 MW of load, but would not be the most reliable options. The biggest foreseeable issue with either is that the SLV would be highly reliant on one device to meet the current load needs. For example, failure of the STATCOM would result in the SLV being as reliant on the UVLS scheme as it is today. Further complications associated with STATCOMs include controller instability and increased protection complexities introduced into a coordinated protection scheme.
~ 23 ~

Phase I: Reliability Evaluation
10.2.3. Alternative 2: 115kV -> 230kV P-V analysis showed that the load serving capability was higher compared to the base case. It had a load serving range of 130-260 MW for the winter case and 150-170 MW for the summer case. The upper limit is the more flexible limit considering the loads at the transmission buses were the only ones scaled. The lower limit is the conservative limit considering that all loads, including at the distribution level, were scaled based on their percentage of the total load. Taking the lowest winter and highest summer limit would result in a combined load serving range of 130-170 MW. The lower limit is attributed to underlying 69 kV distribution system deficiencies. This is an increase over the current 65 MW limit, but would not accommodate the previously observed maximum load of 148 MW. Lastly, it would leave little to no room to accommodate further increases in firm demand. However, if the distribution system deficiencies are addressed, this alternative would mitigate the need for UVLS.
10.2.4. Alternative 3: New 230kV P-V analysis showed that the load serving capability of the system is increased by Alternative 3. Alternative 3 has a load serving range of 130-280 MW for the winter case and 155-180 MW for the summer case. Taking the lowest winter and highest summer limit would result in a combined load serving range of 130-180 MW. Assuming these distribution system deficiencies are addressed, this alternative would mitigate the need for UVLS.
10.2.5. Alternative 4: 115kV -> 230kV and 69kV -> 115kV P-V analysis showed that the load serving capability was higher than Alternatives 1, 2, or 3 alone. Alternative 4 had a load serving range of 140-300 MW for the winter case and 160-190 MW for the summer case. Taking the lowest summer and highest winter limit would result in a combined load serving range of 140-190 MW. Based on this analysis, it is likely that UVLS would be needed whenever load levels exceed 140 MW due to underlying 69 kV distribution system deficiencies. This is 8 MW below the previously observed maximum of 148 MW for the SLV. The ultimate need for UVLS would be determined based on the how the loads are distributed throughout the underlying distribution system. Inclusion of the distribution system improvements associated with Sensitivity A further increases the load serving ranges to 155-330 MW for the winter case and 175-190 MW for the summer case. As long as the underlying 69 kV distribution system is improved in concert with load growth, the need for a UVLS scheme is completely eliminated. 10.2.6. Alternative 5: New 230kV and 69kV -> 115kV P-V analysis showed that the load serving capability was higher than Alternatives 1, 2, or 3. Alternative 5 has a load serving range of 140-310 MW for the winter case and 160-190 MW for the summer case. The lowest winter and highest summer limit would result in a load serving range of 140-190 MW. It is likely that UVLS would be needed for load levels above 140 MW due to underlying 69 kV distribution system deficiencies. The 140 MW level for UVLS is similar to Alternative 4 and is less than previously observed load levels. The need for UVLS and its implementation would be determined based on how the loads are distributed among the system (served from the transmission or distributions buses). Inclusion of the improvements associated with Sensitivity A further increases the load serving ranges to 155-345 MW and 175-185 MW in the winter and summer cases, respectively. These improvements add support to the radial loads served from Alamosa and makes it possible to serve the previously observed maximum load of 148 MW without the need for UVLS when the existing Poncha – SLV 230 kV line is out-of-service.
~ 24 ~
Phase I: Reliability Evaluation
10.2.7. Alternative 6: 69kV -> 230kV P-V analysis showed that the load serving capability was higher than Alternatives 1, 2, or 3. Alternative 6 has a load serving range of 135-290 MW for the winter case and 155-175 MW for the summer case, both limited by underlying distribution system constraints. The lowest winter and highest summer limit would result in a load serving range of 135-175 MW. Based on this analysis, it is likely that UVLS would be required whenever load levels exceed 140 MW if underlying 69 kV distribution system deficiencies were not addressed. The need for UVLS and its implementation would be determined based on the how the loads are distributed among the system (served from the transmission or distributions buses). The inclusions of the improvements offered by Sensitivity A were not evaluated for its impact on the load serving capability, but would likely increase the range. Assuming the distribution system deficiencies are addressed, this alternative could mitigate the need for UVLS. As with other alternatives, as long as the underlying 69 kV distribution system is improved in concert with load growth, the need for a UVLS scheme is completely eliminated by Alternative 6. 10.2.8. Alternative 7: New 230kV Double Circuit Line P-V analysis showed that the load serving capability of the system is increased by Alternative 7. Alternative 7 has a load serving range of 125-285 MW for the winter case and 165-185 MW for the summer case. Taking the lowest winter and highest summer limit would result in a combined load serving range of 125 - 185 MW. These limits are similar to Alternative 3 which evaluated a single 230kV line between SLV and Poncha. The reason that this limit is not higher is because the system serving Poncha is unchanged.
Table 18. Load Serving Capability of San Luis Valley for Different Alternatives Based on PV Analyses
Alternative Reliability Improved
Aging Infrastructure
Winter Load
Capability (MW)
Summer Load
Capability (MW)
Base Case No No 65 - 90 65 - 75 1 69 -> 115 Yes Yes2 110 - 185 115 - 120
1A 69 -> 115 & Alamosa – Mosca 69 -> 115 Yes Yes2 125 - 200 125 - 130 1B 69 -> 115 & STATCOM Yes Yes2 155 - 240 185 - 190 1C 69 -> 115 & Generator Yes Yes2 130 - 265 175 - 185 2 115 -> 230 Yes Yes3 130 - 260 150 - 170 3 New 230 Yes No 130 - 280 155 - 180 4 Alt 1 & Alt 2 Yes Yes2,3 140 - 300 160 - 190
4A Alt 1A & Alt 2 Yes Yes2,3 155 - 330 175 - 190 5 Alt 1 & Alt 3 Yes Yes2 140 - 310 160 - 190
5A Alt 1A and Alt 3 Yes Yes2 155 - 345 175 - 185 6 69 -> 230 Yes Yes2 135 - 290 155 - 175 7 New Double Circuit 230 Yes No 125 - 285 165 - 185
2 Rebuilds San Luis Valley – Poncha 69kV line 3 Rebuilds San Luis Valley – Poncha 115kV line
~ 25 ~
Phase I: Reliability Evaluation
10.3. Preliminary Transfer Capability Analysis 10.3.1. Base Case The 2020HW WECC base case was used to assess the total transfer capability of the current system in the SLV. Please refer to the methodology section of this report for the process to which the TTC was calculated. For the purpose of this study, one of the assumptions made was all secondary elements were fixed and the only limitation was the thermal rating of the conductor. The loss of the 230 kV line between San Luis Valley and Poncha Substations was found to be the most critical contingency. This outage would cause the 115 kV section between San Luis Valley and Sargent Substations to overload. With that knowledge, the TTC for the base case has been determined to be 94.5 MW. 10.3.2. Alternative 1: 69kV -> 115kV Alternative 1 – upgrade the 69 kV line between San Luis Valley and Poncha Substations to 115 kV. The loss of the 230 kV line between San Luis Valley and Poncha Substations was found to be the most critical contingency. This outage would cause the 115 kV section between San Luis Valley and Sargent Substations to overload. With that knowledge, the TTC for the base case has been determined to be 242 MW.
10.3.3. Alternative 2: 115kV -> 230kV Alternative 2 – upgrade the 115 kV line between San Luis Valley and Poncha Substations to 230 kV. The loss of the 230 kV line between San Luis Valley and Poncha Substations was found to be the most critical contingency. This outage would cause the 230 kV section between San Luis Valley and Sargent Substations to overload. With that knowledge, the TTC for the base case has been determined to be 659 MW.
10.3.4. Alternative 3: New 230kV Alternative 3 – build a brand new 230 kV between San Luis Valley and Poncha Substations. The loss of the 230 kV line between San Luis Valley and Poncha Substations was found to be the most critical contingency. This outage would cause the 115 kV section between San Luis Valley and Sargent Substations to overload. With that knowledge, the TTC for the base case has been determined to be 607 MW.
10.3.5. Alternative 4: 115kV -> 230kV and 69kV -> 115kV Alternative 4 – combination of Alternative 1 and 2. The loss of the 230 kV line between San Luis Valley and Poncha Substations was found to be the most critical contingency. This outage would cause the 230 kV section between San Luis Valley and Sargent Substations to overload. With that knowledge, the TTC for the base case has been determined to be 837 MW.
10.3.6. Alternative 5: New 230kV and 69kV -> 115kV Alternative 5 – combination of Alternative 1 and 3. The loss of the 230 kV line between San Luis Valley and Poncha Substations was found to be the most critical contingency. This outage would cause the 115 kV section between San Luis Valley and Sargent Substations to overload. With that knowledge, the TTC for the base case has been determined to be 787 MW.
10.3.7. Alternative 6: 69kV -> 230kV Alternative 6 – upgrade the 69 kV line between San Luis Valley and Poncha Substations to 230 kV. The loss of the 230 kV line between San Luis Valley and Poncha Substations was found to be the most critical contingency. This outage would cause the 115 kV section between San Luis Valley and Sargent Substations to overload. With that knowledge, the TTC for the base case has been determined to be 730 MW.
~ 26 ~

Phase I: Reliability Evaluation
10.3.8. Alternative 7: New 230kV Double Circuit Line Alternative 7 – build a brand new double circuit 230 kV between San Luis Valley and Poncha Substations. The loss of the 230 kV line between San Luis Valley and Poncha Substations was found to be the most critical contingency. This outage would cause the 115 kV section between San Luis Valley and Sargent Substations to overload. With that knowledge, the TTC for the base case has been determined to be 1083 MW.
Table 19. Phase I – Total Transfer Capability4 Analyses from SLV Substation to Poncha Substation (metered all lines coming into Poncha)
Alt. Description # Lines
TTC (System Intact)
MW Limiting Element Contingency
Base Case
Present System 1x230 1x115 1x69(open)
94.5 MW SLV-Sarg 115 PonBR-SLV 230
1 69 kV rebuilt to 115 kV 115 kV same 230 kV same
1x230 2x115
242 MW SLV-Sarg 115 (120 MVA)
PonBR-SLV 230
2 115 kV rebuilt to 230 kV 69 kV same (norm open) 230 kV same
2x230 1x69(open)
659 MW SLV-Sarg 230 (764 MVA)
PonBR-SLV 230
3 New 230 kV line 69 kV same (norm open) 115 kV same 230 kV same
2x230 1x115 1x69(open)
607 MW SLV-Sarg 115 (120 MVA)
PonBR-SLV 230
4 69 kV rebuilt to 115 kV 115 kV rebuilt to 230 kV 230 kV stays the same
2x230 1x115
837 MW SLV-Sarg 230 (764 MVA) & SLV-Mos 115 (238 MVA)
PonBR-SLV 230
5 69 kV rebuilt to 115 kV New 230 kV line 115 kV same 230 kV same
2x230 2x115
787 MW SLV-Sarg 115 (120 MVA)
PonBR-SLV 230
6 69 kV rebuilt to 230 kV 115 kV same 230 kV same
2x230 1x115
730 MW SLV-Sarg 115 (120 MVA)
PonBR-SLV 230
7 New 230 kV lines (dbl ckt) 69 kV same (norm open) 115 kV same 230 kV same
3x230 1x115 1x69 (open)
1083 MW SLV-Sarg 115 (120 MVA)
PonBR-SLV 230
11. Conclusion The study concluded that, at a minimum, an additional 230 kV line is needed to increase system reliability. Studies show that this could be accomplished by either adding a new 230 kV line or rebuilding an existing lower voltage line to and operating it at 230 kV.
4 Total Transfer Capability (TTC) – The amount of power that can be transferred over the interconnected transmission network in a reliable manner while meeting a specific set of pre and post contingency system conditions. The capacity is defined by the worst contingency for the defined point to point path and the thermal, voltage and/or stability limits of the path.
~ 27 ~

Phase I: Reliability Evaluation
~ 28 ~
Phase I: Reliability Evaluation
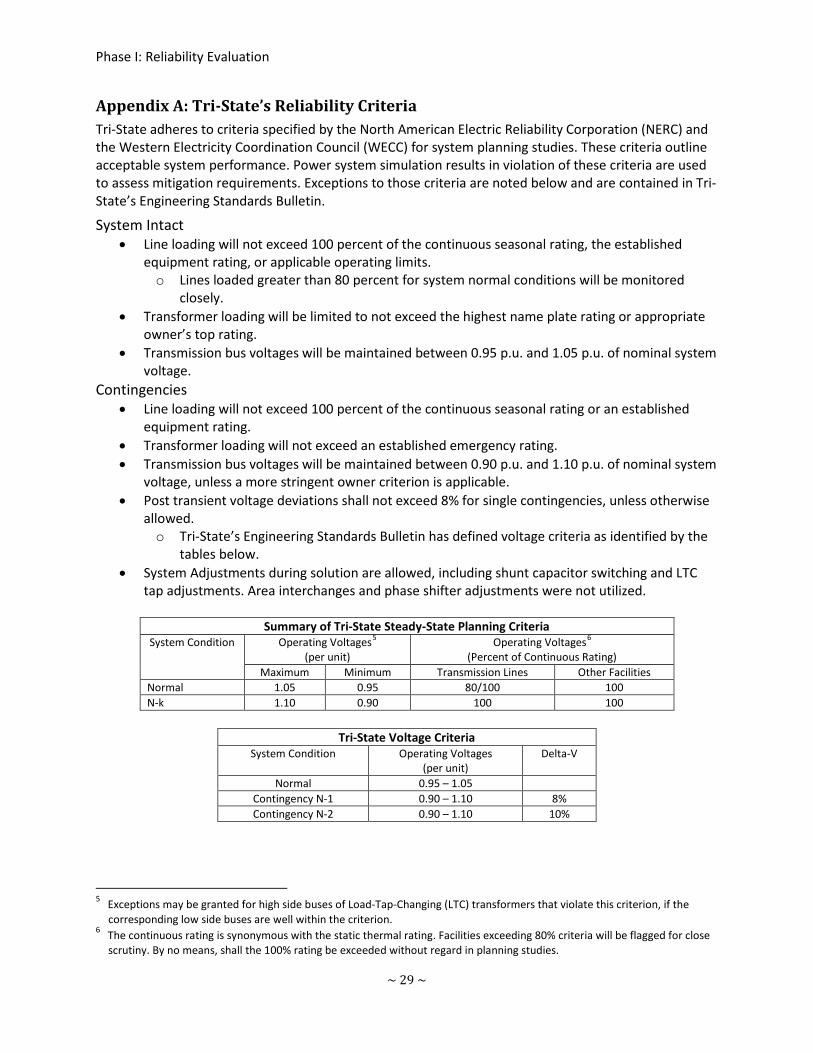
Appendix A: Tri-State’s Reliability Criteria Tri-State adheres to criteria specified by the North American Electric Reliability Corporation (NERC) and the Western Electricity Coordination Council (WECC) for system planning studies. These criteria outline acceptable system performance. Power system simulation results in violation of these criteria are used to assess mitigation requirements. Exceptions to those criteria are noted below and are contained in Tri-State’s Engineering Standards Bulletin.
System Intact • Line loading will not exceed 100 percent of the continuous seasonal rating, the established
equipment rating, or applicable operating limits. o Lines loaded greater than 80 percent for system normal conditions will be monitored
closely. • Transformer loading will be limited to not exceed the highest name plate rating or appropriate
owner’s top rating. • Transmission bus voltages will be maintained between 0.95 p.u. and 1.05 p.u. of nominal system
voltage. Contingencies
• Line loading will not exceed 100 percent of the continuous seasonal rating or an established equipment rating.
• Transformer loading will not exceed an established emergency rating. • Transmission bus voltages will be maintained between 0.90 p.u. and 1.10 p.u. of nominal system
voltage, unless a more stringent owner criterion is applicable. • Post transient voltage deviations shall not exceed 8% for single contingencies, unless otherwise
allowed. o Tri-State’s Engineering Standards Bulletin has defined voltage criteria as identified by the
tables below. • System Adjustments during solution are allowed, including shunt capacitor switching and LTC
tap adjustments. Area interchanges and phase shifter adjustments were not utilized.
Summary of Tri-State Steady-State Planning Criteria System Condition Operating Voltages5
(per unit) Operating Voltages6
(Percent of Continuous Rating) Maximum Minimum Transmission Lines Other Facilities
Normal 1.05 0.95 80/100 100 N-k 1.10 0.90 100 100
Tri-State Voltage Criteria
System Condition Operating Voltages (per unit)
Delta-V
Normal 0.95 – 1.05 Contingency N-1 0.90 – 1.10 8% Contingency N-2 0.90 – 1.10 10%
5 Exceptions may be granted for high side buses of Load-Tap-Changing (LTC) transformers that violate this criterion, if the corresponding low side buses are well within the criterion.
6 The continuous rating is synonymous with the static thermal rating. Facilities exceeding 80% criteria will be flagged for close scrutiny. By no means, shall the 100% rating be exceeded without regard in planning studies.
~ 29 ~
Phase I: Reliability Evaluation
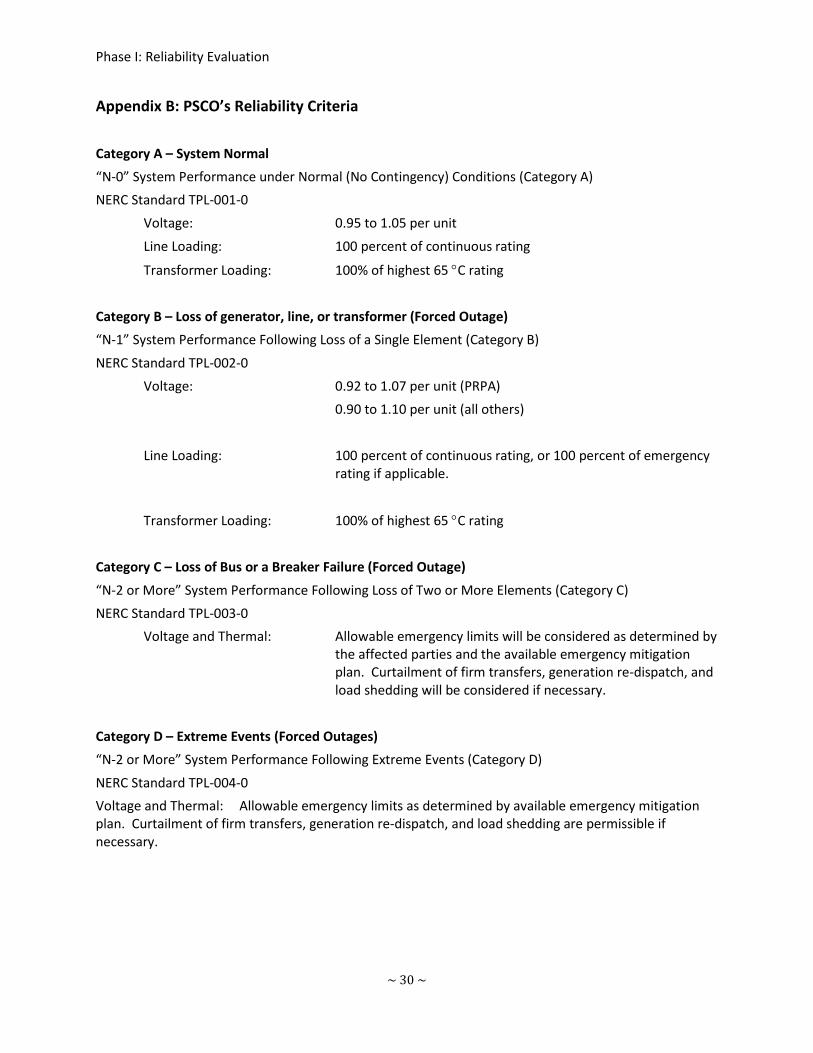
Appendix B: PSCO’s Reliability Criteria
Category A – System Normal “N-0” System Performance under Normal (No Contingency) Conditions (Category A) NERC Standard TPL-001-0
Voltage: 0.95 to 1.05 per unit
Line Loading: 100 percent of continuous rating
Transformer Loading: 100% of highest 65 °C rating Category B – Loss of generator, line, or transformer (Forced Outage) “N-1” System Performance Following Loss of a Single Element (Category B)
NERC Standard TPL-002-0 Voltage: 0.92 to 1.07 per unit (PRPA) 0.90 to 1.10 per unit (all others) Line Loading: 100 percent of continuous rating, or 100 percent of emergency
rating if applicable.
Transformer Loading: 100% of highest 65 °C rating Category C – Loss of Bus or a Breaker Failure (Forced Outage)
“N-2 or More” System Performance Following Loss of Two or More Elements (Category C) NERC Standard TPL-003-0
Voltage and Thermal: Allowable emergency limits will be considered as determined by the affected parties and the available emergency mitigation plan. Curtailment of firm transfers, generation re-dispatch, and load shedding will be considered if necessary.
Category D – Extreme Events (Forced Outages) “N-2 or More” System Performance Following Extreme Events (Category D)
NERC Standard TPL-004-0 Voltage and Thermal: Allowable emergency limits as determined by available emergency mitigation plan. Curtailment of firm transfers, generation re-dispatch, and load shedding are permissible if necessary.
~ 30 ~

Phase I: Reliability Evaluation
Appendix C: Contingency Analysis Results
~ 31 ~