phase 2 – multi-modal alternatives analysis
TRANSCRIPT

I-5 JBLM Vicinity Congestion Relief Study
March 2015
Phase 2 – Multi-modal Alternatives Analysis
||


Table of Contents
I-5 JBLM Vicinity Congestion Relief Study | March 2015 Page | i
TABLE OF CONTENTS I: Introduction and Background Page Purpose and Context of this Report I-1 Study Background I-1 Study Area I-1 Purpose of the Congestion Relief Study I-2 Phase 1 – Corridor Plan Feasibility Study I-2 Phase 2 – Multimodal Alternatives Analysis I-2 Phase 3 – NEPA Documentation and Interchange Justification Report I-3 Report Content and Organization I-3 Design Year and Phased Implementation I-4
II: Stakeholder Coordination and Public Outreach Agency Coordination II-1 Executive Stakeholders Committee II-1 Technical Support Group II-1 Focus Group Meetings II-1 Public Outreach II-2 Public Communications / Project Website II-2 Phase 3 Public Outreach II-2
III: Description of Alternative Packages 2013/2014 Existing Conditions III-1 P1: No Action Alternative – 2020 and 2040 III-2 P2: Enhanced Transit Alternative – 2020 and 2040 III-3 P3: Local Road Improvements with Enhanced Transit Service Alternative – 2020 and 2040 III-4 P4: I-5 Express Lanes Alternative – 2020 and 2040 III-5 P4a: I-5 Express Lanes Alternative with Local Road Improvements – 2020 and 2040 III-6 P5: I-5 HOV and CD/Auxiliary Lanes Alternative – 2020 and 2040 III-7 P5a: I-5 HOV and CD/Auxiliary Lanes Alternative with Local Road Improvements – 2020 and 2040 III-7 P6: I-5 HOV and GP Lanes Alternative – 2020 and 2040 III-8 P6a: I-5 HOV and GP Lanes Alternative with Local Road Improvements – 2020 and 2040 III-8 P7: HOV Lane Alternative – 2020 and 2040 III-9 P7a: HOV Lane Alternative with Local Road Improvements and Transit Enhancements – 2020 and 2040 III-9 P7b: HOV Lane Alternative with Local Road Improvements – 2020 and 2040 III-9 P7c: HOV Lane Alternative with Local Road Improvements, Transit Enhancements and On-Base Frontage Road – 2020 and 2040 ........................................................................................ III-10 Interchange Concepts Assumed for Phase 2B Analysis ........................................................................... III-10
IV: Travel Forecasting Methodology Modeling Components ................................................................................................................................ IV-1 Macroscopic Model ....................................................................................................................... IV-1 Transit Sketch Planning Model ..................................................................................................... IV-1 Mesoscopic Model ........................................................................................................................ IV-1 Modeling Procedure .................................................................................................................................... IV-1 Network Assumptions ................................................................................................................................. IV-2 Existing Network ........................................................................................................................... IV-2 Future No Action Planned Improvements ..................................................................................... IV-2
V: Evaluation Methodology Phase 2B Screening Methodology ............................................................................................................... V-1 Phase 2B Goals ........................................................................................................................................... V-1 Phase 2B Evaluation Criteria ....................................................................................................................... V-1 Quantitative Performance Measures ............................................................................................. V-1 Qualitative Performance Measures ................................................................................................ V-3 Scoring Process ............................................................................................................................. V-3
VI: Performance Analysis of Alternative Packages 2014 Existing Conditions ............................................................................................................................. VI-1 I-5 PM Peak Hour Travel Forecasts .............................................................................................. VI-1 PM Peak Period I-5 Person Trips by Mode and Type ................................................................... VI-1 Percent of I-5 Travel Demand Served during the 2-hour PM Peak Period ................................... VI-2 I-5 PM Peak Hour Travel Speeds ................................................................................................. VI-2 Hours of Congestion during I-5 PM Peak Period .......................................................................... VI-2 Travel Times along I-5 during the PM Peak Period ...................................................................... VI-3 Summary of Existing I-5 Traffic Operations .................................................................................. VI-3 Alternative P1 – No Action .......................................................................................................................... VI-4 I-5 PM Peak Hour Travel Forecasts – 2020 & 2040 ..................................................................... VI-4 PM Peak Period I-5 Person Trips by Mode and Type ................................................................... VI-5 Percent of I-5 Travel Demand Served during the 2-hour PM Peak Period in 2020 & 2040 .......... VI-5 I-5 PM Peak Hour Travel Speeds ................................................................................................. VI-6 I-5 Hours of Congestion – 2020 & 2040 PM Peak Period ............................................................. VI-6 I-5 Travel Times during the 2020 & 2040 PM Peak Period ........................................................... VI-7 Summary of Traffic Operations in 2020 & 2040 for P1 – No Action Alternative ............................ VI-7 Alternative P2 – Enhanced Transit .............................................................................................................. VI-8 I-5 PM Peak Hour Travel Forecasts – 2020 & 2040 ..................................................................... VI-8 PM Peak Period I-5 Person Trips by Mode and Type ................................................................... VI-9 Percent of I-5 Travel Demand Served during the 2-hour PM Peak Period in 2020 & 2040 .......... VI-9 I-5 PM Peak Hour Travel Speeds ............................................................................................... VI-10

Table of Contents
I-5 JBLM Vicinity Congestion Relief Study | March 2015 Page | ii
I-5 Hours of Congestion – 2020 & 2040 PM Peak Period ........................................................... VI-11 I-5 Travel Times during the 2020 & 2040 PM Peak Period ......................................................... VI-11 Summary of Traffic Operations in 2020 & 2040 for P2 – Enhanced Transit Alternatives ............ VI-11 Alternative P3 – Local Road Improvements with Enhanced Transit Service ............................................. VI-12 I-5 PM Peak Hour Travel Forecasts – 2020 & 2040 ..................................................................... VI12 PM Peak Period I-5 Person Trips by Mode and Type ................................................................. VI-13 Percent of I-5 Travel Demand Served during the 2-hour PM Peak Period in 2020 & 2040 ........ VI-14 I-5 PM Peak Hour Travel Speeds ............................................................................................... VI-14 I-5 Hours of Congestion – 2020 & 2040 PM Peak Period ........................................................... VI-15 I-5 Travel Times during the 2020 & 2040 PM Peak Period ......................................................... VI-15 Summary of Traffic Operations in 2020 & 2040 for P3 – Local Road Improvements with Enhanced Transit Service ................................................................. VI-15 Alternative P4 – I-5 Express Lanes ........................................................................................................... VI-16 I-5 PM Peak Hour Travel Forecasts – 2020 & 2040 .................................................................... VI-16 PM Peak Period I-5 Person Trips by Mode and Type ................................................................. VI-17 Percent of I-5 Travel Demand Served during the 2-hour PM Peak Period in 2020 & 2040 ........ VI-17 I-5 PM Peak Hour Travel Speeds ............................................................................................... VI-18 I-5 Hours of Congestion – 2020 & 2040 PM Peak Period ........................................................... VI-19 I-5 Travel Times during the 2020 & 2040 PM Peak Period ......................................................... VI-20 Summary of Traffic Operations in 2020 & 2040 for P4 – Express Lanes .................................... VI-20 Alternative P4a – I-5 Express Lanes Alternative with Local Road Improvements ..................................... VI-21 I-5 PM Peak Hour Travel Forecasts – 2020 & 2040 .................................................................... VI-21 PM Peak Period I-5 Person Trips by Mode and Type ................................................................. VI-22 Percent of I-5 Travel Demand Served during the 2-hour PM Peak Period in 2020 & 2040 ........ VI-22 I-5 PM Peak Hour Travel Speeds ............................................................................................... VI-23 I-5 Hours of Congestion – 2020 & 2040 PM Peak Period ........................................................... VI-24 I-5 Travel Times during the 2020 & 2040 PM Peak Period ......................................................... VI-25 Summary of Traffic Operations in 2020 & 2040 for P4a – Express Lanes with Local Road Improvements ............................................................................................... VI-25 Alternative P5 – HOV and CD Lanes ........................................................................................................ VI-26 I-5 PM Peak Hour Travel Forecasts – 2020 & 2040 .................................................................... VI-26 PM Peak Hour Period I-5 Person Trips by Mode and Type ........................................................ VI-27 Percent of I-5 Travel Demand Served during the 2-hour PM Peak Period in 2020 & 2040 ........ VI-27 I-5 PM Peak Hour Travel Speeds ............................................................................................... VI-28 I-5 Hours of Congestion – 2020 & 2040 PM Peak Period ........................................................... VI-29 I-5 Travel Times during the 2020 & 2040 PM Peak Period ......................................................... VI-29 Summary of Traffic Operations in 2020 & 2040 for P5 – HOV and CD Lanes ............................ VI-29 Alternative Package P5a – HOV and CD Lanes with Local Road Improvements ..................................... VI-30 I-5 PM Peak Hour Travel Forecasts – 2020 & 2040 .................................................................... VI-30 PM Peak Period I-5 Person Trips by Mode and Type ................................................................. VI-31
Percent of I-5 Travel Demand Served during the 2-hour PM Peak Period in 2020 & 2040 ........ VI-31 I-5 PM Peak Hour Travel Speeds ............................................................................................... VI-32 I-5 Hours of Congestion – 2020 & 2040 PM Peak Period ........................................................... VI-33 I-5 Travel Times during the 2020 & 2040 PM Peak Period ......................................................... VI-33 Summary of Traffic Operations in 2020 & 2040 for P5a – HOV and CD Lanes with Local Road Improvements ........................................................................................ VI-33 Alternative Package P6 – HOV and GP Lanes ......................................................................................... VI-34 I-5 PM Peak Hour Travel Forecasts – 2020 & 2040 ................................................................... VI-34 PM Peak Period I-5 Person Trips by Mode and Type ................................................................. VI-35 Percent of I-5 Travel Demand Served during the 2-hour PM Peak Period in 2020 & 2040 ........ VI-35 I-5 PM Peak Hour Travel Speeds ............................................................................................... VI-36 I-5 Hours of Congestion – 2020 & 2040 PM Peak Period ........................................................... VI-37 I-5 Travel Times during the 2020 & 2040 PM Peak Period ......................................................... VI-37 Summary of Traffic Operations in 2020 & 2040 for P6 – HOV and GP Lanes ............................ VI-37 Alternative Package P6a – HOV and GP Lanes with Local Road Improvements ..................................... VI-38 I-5 PM Peak Hour Travel Forecasts – 2020 & 2040 ................................................................... VI-38 PM Peak Period I-5 Person Trips by Mode and Type ................................................................. VI-39 Percent of I-5 Travel Demand Served during the 2-hour PM Peak Period in 2020 & 2040 ........ VI-39 I-5 PM Peak Hour Travel Speeds ............................................................................................... VI-40 I-5 Hours of Congestion – 2020 & 2040 PM Peak Period ........................................................... VI-41 I-5 Travel Times during the 2020 & 2040 PM Peak Period ......................................................... VI-41 Summary of Traffic Operations in 2020 & 2040 for P6a – HOV and GP Lanes .......................... VI-41 Alternative P7 – HOV Lanes ..................................................................................................................... VI-42 I-5 PM Peak Hour Travel Forecasts – 2020 & 2040 ................................................................... VI-42 PM Peak Period I-5 Person Trips by Mode & Type .................................................................... VI-43 Percent of I-5 Travel Demand Served during the 2-hour PM Peak Period in 2020 & 2040 ........ VI-43 I-5 PM Peak Hour Travel Speeds ............................................................................................... VI-44 I-5 Hours of Congestion – 2020 & 2040 PM Peak Period ........................................................... VI-45 I-5 Travel Times during the 2020 & 2040 PM Peak Period ......................................................... VI-45 Summary of Traffic Operations in 2020 & 2040 for P7 – HOV Lanes ......................................... VI-45 Alternative Package P7a – HOV Lanes with Local Road Improvements and Enhanced Transit .............. VI-46 I-5 PM Peak Hour Travel Forecasts – 2020 & 2040 ................................................................... VI-46 PM Peak Period I-5 Person Trips by Mode and Type ................................................................. VI-47 Percent of I-5 Travel Demand Served during the 2-hour PM Peak Period in 2020 & 2040 ........ VI-47 I-5 PM Peak Hour Travel Speeds ............................................................................................... VI-48 I-5 Hours of Congestion – 2020 & 2040 PM Peak Period ........................................................... VI-49 I-5 Travel Times during the 2020 & 2040 PM Peak Period ......................................................... VI-49 Summary of Traffic Operations in 2020 & 2040 for P7a – HOV Lanes with Local Road Improvements and Enhanced Transit ........................................................... VI-49

Table of Contents
I-5 JBLM Vicinity Congestion Relief Study | March 2015 Page | iii
Alternative Package P7b – HOV Lanes with Local Road Improvements .................................................. VI-50 I-5 PM Peak Hour Travel Forecasts – 2020 & 2040 .................................................................... VI-50 PM Peak Period I-5 Person Trips by Mode and Type ................................................................. VI-51 Percent of I-5 Travel Demand Served during the 2-hour PM Peak Period in 2020 & 2040 ........ VI-51 I-5 PM Peak Hour Travel Speeds ............................................................................................... VI-52 I-5 Hours of Congestion – 2020 & 2040 PM Peak Period ........................................................... VI-53 I-5 Travel Times during the 2020 & 2040 PM Peak Period ......................................................... VI-53 Summary of Traffic Operations in 2020 and 2040 for P7b – HOV Lanes with Local Road Improvements ............................................................................................... VI-53
VII: Performance Evaluation of Alternative Packages P1 – No Action Alternative ......................................................................................................................... VII-1 P2 – Enhanced Transit Alternative ............................................................................................................. VII-2 P3 – Local Road Improvements with Enhanced Transit Alternative ........................................................... VII-3 P4 – Express Lanes Alternative ................................................................................................................. VII-4 P4a – Express Lanes Alternative with Local Road Improvements ............................................................. VII-5 P5 – HOV and CD Lanes Alternatives ........................................................................................................ VII-6 P5a – HOV and CD Lanes Alternative with Local Road Improvements ..................................................... VII-7 P6 – HOV and GP Lanes Alternative ......................................................................................................... VII-8 P6a – HOV and GP Lanes Alternative with Local Road Improvements ..................................................... VII-9 P7 – HOV Lanes Alternative .................................................................................................................... VII-10 P7a – HOV and GP Lanes Alternative with Local Road Improvements and Enhanced Transit .............. VIII-11 P7b – HOV and GP Lanes Alternative with Local Road Improvements ................................................... VII-12 Performance Scoring by Alternative Packages and Criteria ..................................................................... VII-13
VIII: Environmental Scan Summary – Phase 2 Results of Alternatives Evaluation ............................................................................................................. VIII-1 Existing Environmental Conditions ............................................................................................................ VIII-2 Wetlands, Streams, and Wildlife ................................................................................................. VIII-2 Groundwater, Surface Water, and Floodplains ........................................................................... VIII-2 Hazardous Materials ................................................................................................................... VIII-2 Cultural and Historical Resources ............................................................................................... VIII-2 Noise Quality ............................................................................................................................... VIII-3 Section 4(f), 6(f) .......................................................................................................................... VIII-3 Social and Environmental Justice ............................................................................................... VIII-3 Summary of Possible Environmental Impacts for the Local Road Improvement Options .......................... VIII-3 Option B-3: Gravelly Lake Drive to Thorne Lane Connector ....................................................... VIII-3 Option C-7: South A Road Extension .......................................................................................... VIII-3 Option C-8: Joint Base Connector Phase 2 ................................................................................ VIII-4 Option C-9: Fairview Road .......................................................................................................... VIII-4
Option C-15a: New Arterial – Mounts Road to Gravelly Lake Drive on New Alignment ............. VIII-4 Option C-15b: New Arterial – Mounts Road to Madigan using Existing Road ............................ VIII-4 References ................................................................................................................................................ VIII-5
IX: Implementation and Staging Results of 2040 Evaluation Alternatives ...................................................................................................... IX-1
X: Alternatives Evaluation and Recommendations Alternatives Evaluation................................................................................................................................. X-1 2020 Evaluation of Alternative Packages ..................................................................................................... X-1 2040 Evaluation of Alternative Packages ..................................................................................................... X-2 Recommended Short List of Alternatives ..................................................................................................... X-2 Stage 1 (2020 Opening Year Target) Improvement Package ........................................................ X-2 Future Stage Improvement Package ............................................................................................. X-3 Staged Implementation ................................................................................................................................ X-3 Corridor Preservation and Future Flexibility ................................................................................................. X-4

Table of Contents
I-5 JBLM Vicinity Congestion Relief Study | March 2015 Page | iv
LIST OF FIGURES I: Introduction and Background Figure I-1 Phase 2 Analysis Study Area ............................................................................................... I-1 Figure I-2 I-5 Study Area Interchanges ................................................................................................. I-1 Figure I-3 Phase 2A Screening process ............................................................................................... I-2 Figure I-4 Phase 2A Step 1 Screening – Fatal Flaws Assessment ...................................................... I-3 Figure I-5 Phase 2A Step 2 Screening – Assess Benefit to I-5 ............................................................ I-3 Figure I-6 Summary of Alternatives Analysis Process .......................................................................... I-3
II: Stakeholder Coordination and Public Outreach Figure II-1 Summary of Key Stakeholder and Public Engagements/Outreach ..................................... II-1 Figure II-2 Sample of WSDOT’s I-5 – JBLM Vicinity – Congestion Relief Website .............................. II-2
III: Description of Alternative Packages Figure III-1 Line Diagram of 2013/2014 Existing Conditions ................................................................. III-1 Figure III-2 2013/2014 Typical I-5 Section ............................................................................................ III-1 Figure III-3 Line Diagram of 2020 and 2040 No Action Alternatives ..................................................... III-2 Figure III-4 TIGER III Improvements ..................................................................................................... III-2 Figure III-5 Access Improvements to Madigan Gate ............................................................................. III-2 Figure III-6 Enhanced Off-Base Bus Service and Expanded On-Base Shuttle Service Area ............... III-3 Figure III-7 Selected Local Road Improvements from Phase 2A .......................................................... III-4 Figure III-8 Line Diagram of 2020 Alternative P4 – Express Lanes ...................................................... III-5 Figure III-9 Line Diagram of 2040 Alternative P4 – Express Lanes ...................................................... III-5 Figure III-10 Typical Cross-Section for Alternative P4 – I-5 Express Lanes ........................................... III-5 Figure III-11 Alternative P4a – Local Road Improvements with Express Lanes ..................................... III-6 Figure III-12 Line Diagram of 2020 Alternative P5 – HOV and CD Lanes .............................................. III-7 Figure III-13 Line Diagram of 2040 Alternative P5 – HOV and CD Lanes .............................................. III-7 Figure III-14 Typical Section for Alternative P5 – HOV and CD/Auxiliary Lanes .................................... III-7 Figure III-15 Line Diagram of 2020 Alternative P6 – HOV and GP Lanes .............................................. III-8 Figure III-16 Line Diagram of 2040 Alternative P6 – HOV and GP Lanes .............................................. III-8 Figure III-17 Typical Section for Alternative P6 – HOV and GP Lanes ................................................... III-8 Figure III-18 Line Diagram of 2020 Alternative P7 – HOV Lanes ........................................................... III-9 Figure III-19 Line Diagram of 2040 Alternative P7 – HOV Lanes ........................................................... III-9 Figure III-20 Typical Section for Alternative P7 – I-5 HOV Lanes ........................................................... III-9 Figure III-21 P7c – JBLM Frontage Road Options C15A with Local Road Improvements .................... III-10 Figure III-22 I-5 Focus Interchanges ..................................................................................................... III-10
IV: Travel Forecasting Methodology Figure IV-1 Model Process Flowchart ................................................................................................... IV-1
V: Evaluation Methodology Figure V-1 Phase 2B Weighting System ............................................................................................... V-3 Figure V-2 Rating Factors ..................................................................................................................... V-3 Figure V-3 Implementation Assessment Elements ............................................................................... V-4 Figure V-4 Phase 2B Scoring Process ................................................................................................. V-4
VI: Performance Analysis of Alternative Packages Figure VI-1 2014 PM Peak Hour Vehicle Trips ..................................................................................... VI-1 Figure VI-2 2014 PM Peak Hour Person Trips ..................................................................................... VI-1 Figure VI-3 I-5 2014 PM 6-Hour Peak Period Person Trips by Mode and Type ................................... VI-1 Figure VI-4 2014 PM Peak Hour Speeds along I-5 ............................................................................... VI-2 Figure VI-5 2014 PM Peak Period Speed-Time Diagram along I-5 ...................................................... VI-2 Figure VI-6 2014 Hours of Congestion by I-5 Segments ...................................................................... VI-2 Figure VI-7 Average PM Peak Period Travel Time along I-5 between Mounts Road and Bridgeport Way by Time of Day ...................................................................................... VI-3 Figure VI-8 Average 2014 Traffic Volume along I-5 during the PM Peak Hour .................................... VI-3 Figure VI-9 2020 and 2040 PM Peak Hour I-5 Vehicle Trips – P1 ........................................................ VI-4 Figure VI-10 2020 and 2040 PM Peak Hour I-5 Person Trips – P1 ........................................................ VI-4 Figure VI-11 Comparison of 2020 & 2040 I-5 PM 6-hour Peak Period Person Trips by Mode and Type – P1 ................................................................................................. VI-5 Figure VI-12 Comparison of Percent of Demand Served in 2020 and 2040 – P1................................... VI-5 Figure VI-13 2020 and 2040 Southbound Travel Speeds during the PM Peak Hour along I-5 – P1 ...... VI-6 Figure VI-14 2020 and 2040 PM Peak Period Speed-Time Diagrams along I-5 – P1 ............................ VI-6 Figure VI-15 Comparison of 2020 and 2040 Hours of Congestion by I-5 Segments – P1 ...................... VI-7 Figure VI-16 Average PM Peak Period Travel Time along I-5 between Mounts Road and Bridgeport Way by Time of Day – P1 ........................................................................ VI-7 Figure VI-17 2020 and 2040 PM Peak Hour I-5 Vehicle Trips – P2 ........................................................ VI-8 Figure VI-18 2020 and 2040 PM Peak Hour I-5 Person Trips – P2 ........................................................ VI-8 Figure VI-19 Comparison of 2020 & 2040 I-5 PM 6-hour Peak Period Person Trips by Mode and Type – P2 ................................................................................................. VI-9 Figure VI-20 Comparison of Percent of Demand Served in 2020 and 2040 – P2................................... VI-9 Figure VI-21 2020 and 2040 Southbound Travel Speeds during the PM Peak Hour along I-5 – P2 .... VI-10 Figure VI-22 2020 and 2040 PM Peak Period Speed-Time Diagrams along I-5 .................................. VI-10 Figure VI-23 Comparison of 2020 and 2040 Hours of Congestion by I-5 Segments – P2 .................... VI-11 Figure VI-24 Average PM Peak Period Travel Time along I-5 between Mounts Road and Bridgeport Way by Time of Day P-2 ........................................................................ VI-11 Figure VI-25 2020 and 2040 PM Peak Hour I-5 Vehicle Trips – P3 ...................................................... VI-12

Table of Contents
I-5 JBLM Vicinity Congestion Relief Study | March 2015 Page | v
Figure VI-26 2020 and 2040 PM Peak Hour I-5 Person Trips – P3 ...................................................... VI-12 Figure VI-27 Comparison of 2020 & 2040 I-5 PM 6-hour Peak Period Person Trips by Mode and Type – P3 ............................................................................................... VI-13 Figure VI-28 Comparison of Percent of Demand Served in 2020 and 2040 – P3 ................................. VI-13 Figure VI-29 2020 and 2040 Southbound Travel Speeds during the PM Peak Hour along I-5 – P3..... VI-14 Figure VI-30 2020 and 2040 PM Peak Period Speed-Time Diagrams along I-5 – P3 .......................... VI-14 Figure VI-31 Comparison of 2020 and 2040 Hours of Congestion by I-5 Segments – P3 .................... VI-15 Figure VI-32 Average PM Peak Period Travel Time along I-5 between Mounts Road and Bridgeport Way by Time of Day P-3 ........................................................................ VI-15 Figure VI-33 2020 and 2040 PM Peak Hour I-5 Vehicle Trips – P4 ...................................................... VI-16 Figure VI-34 2020 and 2040 PM Peak Hour I-5 Person Trips – P4 ...................................................... VI-16 Figure VI-35 Comparison of 2020 & 2040 I-5 PM 6-hour Peak Period Person Trips by Mode and Type – P4 ............................................................................................... VI-17 Figure VI-36 Comparison of Percent of Demand Served in 2020 and 2040 – P4 ................................. VI-17 Figure VI-37 2020 and 2040 Southbound Travel Speeds during the PM Peak Hour along I-5 in Non-Express Lanes – P4 ...................................................................... VI-18 Figure VI-38 2020 PM Peak Period Speed-Time Diagrams along I-5 – P4 .......................................... VI-18 Figure VI-39 2040 PM Peak Period Speed-Time Diagrams along I-5 – P4 .......................................... VI-19 Figure VI-40 Comparison of 2020 and 2040 Hours of Congestion in Non-Express Lanes by I-5 Segments – P4 .............................................................................................. VI-19 Figure VI-41 Average PM Peak Period Travel Time along I-5 between Mounts Road and Bridgeport Way By Time of Day – P-4 ..................................................................... VI-20 Figure VI-42 2020 and 2040 PM Peak Hour I-5 Vehicle Trips – P4a .................................................... VI-21 Figure VI-43 2020 and 2040 PM Peak Hour I-5 Person Trips – P4a .................................................... VI-21 Figure VI-44 Comparison of 2020 and 2040 I-5 PM 6-Hour Peak Period Person Trips by Mode and Type – P4a ............................................................................................. VI-22 Figure VI-45 Comparison of Percent of Demand Served in 2020 and 2040 – P4a ............................... VI-22 Figure VI-46 2020 and 2040 Southbound Travel Speeds during the PM Peak Hour along I-5 in Non-Express Lanes – P4a .................................................................... VI-23 Figure VI-47 2020 PM Peak Period Speed-Time Diagrams along I-5 – P4a ........................................ VI-23 Figure VI-48 2040 PM Peak Period Speed-Time Diagrams along I-5 – P4a ........................................ VI-24 Figure VI-49 Comparison of 2020 and 2040 Hours of Congestion in Non-Express Lanes by I-5 Segments – P4a ............................................................................................ VI-24 Figure VI-50 Average PM Peak Period Travel Time along I-5 between Mounts Road and Bridgeport Way By Time of Day – P4a .................................................................... VI-25 Figure VI-51 2020 and 2040 PM Peak Hour I-5 Vehicle Trips – P5 ...................................................... VI-26 Figure VI-52 2020 and 2040 PM Peak Hour I-5 Person Trips – P5 ...................................................... VI-26 Figure VI-53 Comparison of 2020 and 2040 I-5 PM 6-hour Peak Period Person Trips by Mode and Type – P5 ............................................................................................... VI-27 Figure VI-54 Comparison of Percent of Demand Served in 2020 and 2040 – P5 ................................. VI-27
Figure VI-55 2020 and 2040 Southbound Travel Speeds for all Modes during the PM Peak Hour along I-5 – P5 ........................................................................................ VI-28 Figure VI-56 2020 and 2040 PM Peak Period Speed-Time Diagrams along I-5 – P5 .......................... VI-28 Figure VI-57 Comparison of 2020 and 2040 Hours of Congestion for all Modes by I-5 Segments – P5 .............................................................................................. VI-29 Figure VI-58 Average 2020 and 2040 PM Peak Period Travel Time along I-5 between Mounts Road and Bridgeport Way by Time of Day – P5 ......................................... VI-29 Figure VI-59 2020 and 2040 PM Peak Hour I-5 Vehicle Trips – P5a .................................................... VI-30 Figure VI-60 2020 and 2040 PM Peak Hour I-5 Person Trips – P5a .................................................... VI-30 Figure VI-61 Comparison of 2020 & 2040 I-5 PM 6-hour Peak Period Person Trips by Mode and Type – P5a ............................................................................................. VI-31 Figure VI-62 Comparison of Percent of Demand Served in 2020 and 2040 – P5a............................... VI-31 Figure VI-63 2020 and 2040 Southbound Travel Speeds during the PM Peak Hour along I-5 – P5a .. VI-32 Figure VI-64 2020 and 2040 PM Peak Period Speed-Time Diagrams along I-5 – P5a ........................ VI-32 Figure VI-65 Comparison of 2020 and 2040 Hours of Congestion in Mainline Lanes by I-5 Segments – P5a ................................................................................................ VI-33 Figure VI-66 Average PM Peak Period Travel Time along I-5 between Mounts Road and Bridgeport Way by Time of Day – P5a .................................................................... VI-33 Figure VI-67 2020 and 2040 PM Peak Hour I-5 Vehicle Trips – P6 ...................................................... VI-34 Figure VI-68 2020 and 2040 PM Peak Hour I-5 Person Trips – P6 ...................................................... VI-34 Figure VI-69 Comparison of 2020 and 2040 I-5 PM 6-hour Peak Period Person Trips by Mode and Type – P6 ............................................................................................... VI-35 Figure VI-70 Comparison of Percent of Demand Served in 2020 and 2040 – P6................................. VI-35 Figure VI-71 2020 and 2040 Southbound Travel Speeds during the PM Peak Hour along I-5 – P6 .... VI-36 Figure VI-72 2020 and 2040 PM Peak Period Speed-Time Diagrams along I-5 – P6 .......................... VI-36 Figure VI-73 Comparison of 2020 and 2040 Hours of Congestion in Mainline Lanes by I-5 Segments – P6 .............................................................................................. VI-37 Figure VI-74 Average 2020 and 2040 PM Peak Period Travel Time along I-5 between Mounts Road and Bridgeport Way by Time of Day – P6 ......................................... VI-37 Figure VI-75 2020 and 2040 PM Peak Hour I-5 Vehicle Trips – P6a .................................................... VI-38 Figure VI-76 2020 and 2040 PM Peak Hour I-5 Person Trips – P6a .................................................... VI-38 Figure VI-77 Comparison of 2020 and 2040 I-5 PM 6-hour Peak Period Person Trips by Mode and Type – P6a ............................................................................................. VI-39 Figure VI-78 Comparison of Percent of Demand Served in 2020 & 2040 – P6a .................................. VI-39 Figure VI-79 2020 and 2040 Southbound Travel Speeds during the PM Peak Hour along I-5 – P6a .. VI-40 Figure VI-80 2020 and 2040 PM Peak Period Speed-Time Diagrams along I-5 – P6a ........................ VI-40 Figure VI-81 Comparison of 2020 and 2040 Hours of Congestion in Mainline Lanes by I-5 Segments – P6a ................................................................................. VI-41 Figure VI-82 Average PM Peak Period Travel Time along I-5 between Mounts Road and Bridgeport Way by Time of Day – P6a .................................................................... VI-41

Table of Contents
I-5 JBLM Vicinity Congestion Relief Study | March 2015 Page | vi
Figure VI-83 2020 and 2040 PM Peak Hour I-5 Vehicle Trips – P7 ...................................................... VI-42 Figure VI-84 2020 and 2040 PM Peak Hour I-5 Person Trips – P7 ...................................................... VI-42 Figure VI-85 Comparison of 2020 and 2040 I-5 PM 6-Hour Peak Period Person Trips by Mode and Type – P7 ............................................................................................... VI-43 Figure VI-86 Comparison of Percent of Demand Served in 2020 and 2040 – P7 ................................. VI-43 Figure VI-87 2020 and 2040 Southbound Travel Speeds during the PM Peak Hour along I-5 – P7..... VI-44 Figure VI-88 2020 and 2040 PM Peak Period Speed-Time Diagrams along I-5 – P7 .......................... VI-44 Figure VI-89 Comparison of 2020 and 2040 Hours of Congestion in Mainline by I-5 Segments – P7 .............................................................................................. VI-45 Figure VI-90 Average 2020 and 2040 PM Peak Period Travel Time along I-5 between Mounts Road and Bridgeport Way by Time of Day – P7 ......................................... VI-45 Figure VI-91 2020 and 2040 PM Peak Hour I-5 Vehicle Trips – P7a .................................................... VI-46 Figure VI-92 2020 and 2040 PM Peak Hour I-5 Person Trips – P7a .................................................... VI-46 Figure VI-93 Comparison of 2020 & 2040 I-5 PM 6-hour Peak Period Person Trips by Mode and Type – P7a ............................................................................................. VI-47 Figure VI-94 Comparison of Percent of Demand Served in 2020 and 2040 – P7a ............................... VI-47 Figure VI-95 2020 and 2040 Southbound Travel Speeds during the PM Peak Hour along I-5 – P7a... VI-48 Figure VI-96 2020 and 2040 PM Peak Period Speed-Time Diagrams along I-5 – P7a ........................ VI-48 Figure VI-97 Comparison of 2020 and 2040 Hours of Congestion in Mainline Lanes by I-5 Segments – P7a ............................................................................................ VI-49 Figure VI-98 Average 2020 and 2040 PM Peak Period Travel Time along I-5 between Mounts Road and Bridgeport Way by Time of Day – P7a ....................................... VI-49 Figure VI-99 2020 and 2040 PM Peak Hour I-5 Vehicle Trips – P7b .................................................... VI-50 Figure VI-100 2020 and 2040 PM Peak Hour I-5 Person Trips – P7b .................................................... VI-50 Figure VI-101 Comparison of 2020 and 2040 I-5 PM 6-Hour Peak Period Person Trips by Mode and Type – P7b ............................................................................................. VI-51 Figure VI-102 Comparison of Percent of Demand Served in 2020 and 2040 – P7b ............................... VI-51 Figure VI-103 2020 and 2040 Southbound Travel Speeds during the PM Peak Hour along I-5 – P7b... VI-52 Figure VI-104 2020 and 2040 PM Peak Period Speed-Time Diagrams along I-5 – P7b ........................ VI-52 Figure VI-105 Comparison of 2020 and 2040 Hours of Congestion in Mainline Lanes by I-5 Segments – P7b ............................................................................................ VI-53 Figure VI-106 Average PM Peak Period Travel Time along I-5 between Mounts Road and Bridgeport Way by Time of Day – P7b .................................................................... VI-53
VII: Performance Evaluation of Alternative Packages Figure VII-1 Performance Evaluation: Alternative P1 – No Action ........................................................ VII-1 Figure VII-2 Performance Evaluation: Alternative P2 – Enhance Transit .............................................. VII-2 Figure VII-3 Performance Evaluation: Alternative P3 – Local Road Improvements with Enhanced Transit ..................................................................................................... VII-3 Figure VII-4 Performance Evaluation: Alternative P4 – Express Lanes ................................................ VII-4
Figure VII-5 Performance Evaluation: Alternative P4a – Express Lanes with Local Road Improvements .......................................................................................................... VII-5 Figure VII-6 Performance Evaluation: Alternative P5 – HOV and CD Lanes ........................................ VII-6 Figure VII-7 Performance Evaluation: Alternative P5a – HOV and CD Lanes with Local Road Improvements ................................................................................................. VII-7 Figure VII-8 Performance Evaluation: Alternative P6 – HOV and GP Lanes ........................................ VII-8 Figure VII-9 Performance Evaluation: Alternative P6a – HOV and GP Lanes with Local Road Improvements ................................................................................................. VII-9 Figure VII-10 Performance Evaluation: Alternative P7 – HOV Lanes ................................................... VII-10 Figure VII-11 Performance Evaluation: Alternative P7a – HOV with Local Road Improvements and Enhanced Transit .................................................................... VII-11 Figure VII-12 Performance Evaluation: Alternative P7b – HOV Lanes with Local Road Improvements ........................................................................................................ VII-12 Figure VII-13 Comparison of 2020 Performance Scored by Alternative Packages............................... VII-13 Figure VII-14 Comparison of 2040 Performance Scored by Alternative Packages............................... VII-14
VIII: Environmental Scan Summary – Phase 2 Figure VIII-1 Environmental Scored by Alternative ............................................................................... VIII-1 Figure VIII-2 Wildlife and Habitat (Sheet 1 of 2) ................................................................................... VIII-6 Figure VIII-2 Wildlife and Habitat (Sheet 2 of 2) ................................................................................... VIII-7 Figure VIII-3 Hazardous Materials (Sheet 1 of 2) ................................................................................. VIII-8 Figure VIII-3 Hazardous Materials (Sheet 2 of 2) ................................................................................. VIII-9 Figure VIII-4 Cultural Resources......................................................................................................... VIII-10 Figure VIII-5 Noise Impacts ................................................................................................................ VIII-11 Figure VIII-6 Housing, Schools and Parks .......................................................................................... VIII-12
IX: Implementation and Staging Figure IX-1 Implementation and Weighting Scores by Alternative ........................................................ IX-1
X: Alternatives Evaluation and Recommendations Figure X-1 Evaluation of Alternative Packages Process ....................................................................... X-1 Figure X-2 2020 Alternative Scores ...................................................................................................... X-1 Figure X-3 2040 Alternative Scores by Alternative Packages ............................................................... X-1 Figure X-4 2020 Improvements, Stage 1 Build Alternative ................................................................... X-3 Figure X-5 Express Lanes Improvement Concept ................................................................................ X-3 Figure X-6 Stage 2 Future Improvement, Alternative P4 ...................................................................... X-3 Figure X-7 I-5 Improvements, Staged Implementation Approach ......................................................... X-4
Table of Contents
I-5 JBLM Vicinity Congestion Relief Study | March 2015 Page | vii
LIST OF TABLES IV: Travel Forecasting Methodology Table IV-1 No Action Alternative Planned Improvements .................................................................... IV-2
VI: Performance Analysis of Alternative Packages Table VI-1 2014 PM 6-hour Peak Period – Person Trips by Mode and Type ...................................... VI-1 Table VI-2 2020 PM 6-hour Peak Period – Person Trips by Mode and Type – P1 .............................. VI-5 Table VI-3 2040 PM 6-hour Peak Period – Person Trips by Mode and Type – P1 .............................. VI-5 Table VI-4 2020 PM 6-hour Peak Period – Person Trips by Mode and Type – P2 .............................. VI-9 Table VI-5 2040 PM 6-hour Peak Period – Person Trips by Mode and Type – P2 .............................. VI-9 Table VI-6 2020 PM 6-hour Peak Period – Person Trips by Mode and Type – P3 ............................ VI-13 Table VI-7 2040 PM 6-hour Peak Period – Person Trips by Mode and Type – P3 ............................ VI-13 Table VI-8 2020 PM 6-hour Peak Period – Person Trips by Mode and Type – P4 ............................ VI-16 Table VI-9 2040 PM 6-hour Peak Period – Person Trips by Mode and Type – P4 ............................ VI-16 Table VI-10 2020 PM 6-hour Peak Period – Person Trips by Mode and Type – P4a .......................... VI-22 Table VI-11 2040 PM 6-hour Peak Period – Person Trips by Mode and Type – P4a .......................... VI-22 Table VI-12 2020 PM 6-hour Peak Period – Person Trips by Mode and Type – P5 ............................ VI-27 Table VI-13 2040 PM 6-hour Peak Period – Person Trips by Mode and Type – P5 ............................ VI-27 Table VI-14 2020 PM 6-hour Peak Period – Person Trips by Mode and Type – P5a .......................... VI-31 Table VI-15 2040 PM 6-hour Peak Period – Person Trips by Mode and Type – P5a .......................... VI-31 Table VI-16 2020 PM 6-hour Peak Period – Person Trips by Mode and Type – P6 ............................ VI-35 Table VI-17 2040 PM 6-hour Peak Period – Person Trips by Mode and Type – P6 ............................ VI-35 Table II-18 2020 PM 6-hour Peak Period – Person Trips by Mode and Type – P6a .......................... VI-39 Table VI-19 2040 PM 6-hour Peak Period – Person Trips by Mode and Type – P6a .......................... VI-39 Table VI-20 2020 PM 6-hour Peak Period – Person Trips by Mode and Type – P7 ............................ VI-43 Table VI-21 2040 PM 6-hour Peak Period – Person Trips by Mode and Type – P7 ............................ VI-43 Table VI-22 2020 PM 6-hour Peak Period – Person Trips by Mode and Type – P7a .......................... VI-47 Table VI-23 2040 PM 6-hour Peak Period – Person Trips by Mode and Type – P7a .......................... VI-47 Table II-24 2020 PM 6-hour Peak Period – Person Trips by Mode and Type – P7b .......................... VI-51 Table VI-25 2040 PM 6-hour Peak Period – Person Trips by Mode and Type – P7b .......................... VI-51
VIII. Interchange Concepts Considered Table VIII-1 Scoring of Environmental Factors by Alternative .............................................................. VIII-1
IX: Implementation and Staging Table IX-1 Scoring of Implementation Criterion by Alternative ............................................................ IX-1
X: Alternatives Evaluation and Recommendations Table X-1 2020 Alternative Scores by Alternative Packages ............................................................... X-1 Table X-2 2040 Alternative Scores by Alternative Packages ............................................................... X-2

Table of Contents
I-5 JBLM Vicinity Congestion Relief Study | March 2015 Page | viii
ACRONYMS AC Active Component (part of the Camp Murray training mission) ACP Access Control Point (military installation gate) ADT Average Daily Traffic (volumes) Amtrak American Passenger Rail Corporation BNSF Burlington Northern Santa Fe (railroad) BRAC Base Realignment and Closure Commission CAC Collision Analysis Corridor CAL Collision Analysis Location C/D Collector/Distributor (road) DOD Department of Defense EIS Environmental Impact Statement FAZ Forecast Analysis Zones FHWA Federal Highway Administration GP General Purpose (travel lane) GPS Global Positioning System HOT High Occupancy Toll (travel lane) HOV High Occupancy Vehicle (travel lane) IAL Intersection Analysis Location IJR Interchange Justification Report INRIX Private corporation engaged in roadway operational data collection and reporting IT Intercity Transit ITS Intelligent Transportation Systems JBLM Joint Base Lewis McChord LOS Level of Service LTB Leadership Training Brigade (Western Army National Guard) MP Milepost MVMT Million Vehicle Miles of Travel NCHRP National Cooperative Highway Research Program NCOE Noncommissioned Officer Education System NEPA National Environmental Policy Act OCS Officer Candidate School PSRC Puget Sound Regional Council ROW Right of Way SEPA State Environmental Policy Act SOV Single Occupant Vehicle SR State Route SSMCP South Sound Military Communities Partnership TASS Total Army School System TAZ Transportation Analysis Zone TDM Transportation Demand Management TIGER III Transportation Investment Generating Economic Recovery (federal grant-funding program, third series) TRB Transportation Research Board TRPC Thurston Regional Planning Council USAR United States Army Reserve WSDOT Washington State Department of Transportation
GLOSSARY Auxiliary Lane: Can improve safety and reduce congestion by accommodating cars and trucks entering or exiting the highway or traveling short distances between adjacent interchanges, and reduce conflicting weaving and merging movements. Average Daily Traffic (ADT): The average number of vehicles passing a certain point on a highway, road, or street each day. Cloverleaf Interchange: A two-level interchange where left turns are handled by physically-separated, free-flowing ramps. When viewed from the air this interchanges resemble a four-leaf clover. Collector-Distributor (CD): A roadway that typically parallels a higher capacity and/or limited access roadway. A CD road is designed to accommodate weaving and merging activity separately from the mainline of the higher capacity road and to reduce the number of mainline entrances and exits. Diamond Interchange: The simplest and perhaps most common type of interchange. This type of interchange has two on-ramps and two off-ramps, and forms the shape of a diamond when viewed from the air. Diverging Diamond Interchange: This interchange configuration improves left and right turn movements by removing them from the signal operations into free or yield movements. It also reduces signal operations to two phases and provides more green time for through traffic. Environmental Justice (EJ): Executive Order that ensures that highway projects do not disproportionately impact one segment of the population, e.g., low-income or minorities. Environmental Justice Population: Refers collectively to the low-income and minority populations in a given area. Latent Demand: Travel desire or demand that goes unsatisfied because there is not sufficient capacity on a roadway to accommodate it. Level of Service (LOS): A qualitative measure of transportation system performance. LOS is most commonly used to describe roadway or intersection performance, but can also be applied to pedestrian, bicycle, transit, or other infrastructure elements. The American Association of State Highway and Transportation Officials defines the following levels of service: A= Free flow; B=Reasonably free flow; C=Stable flow; D=Approaching unstable flow; E=Unstable flow; and F=Forced or breakdown flow. Maintenance Area: An area that has a history of not meeting air quality standards for a particular air pollutant, but is now meeting the standards and has a maintenance plan for monitoring levels of that pollutant and ensuring continued conformity to the appropriate standards. Mode Split: The percentage of total travel in a given area by different forms of transportation, typically single-occupant vehicles, high-occupancy vehicles (two or more persons in a car), transit, walk, and bicycle. Moving Washington: A policy-based framework used in Washington State for making transparent, cost-effective decisions about transportation infrastructure improvements. National Environmental Policy Act (NEPA): Established in 1969, this act requires public disclosure of all environmental, social, and economic impacts for federally funded projects with significant impacts. Non-attainment area: An area that fails to meet air quality standards for one or more pollutants. Particulate Matter (PM): A mixture of extremely small particles or liquid droplets suspended in the air. Peak Period: Informally known as “rush hour,” this term refers to the time of the day when traffic volumes in an urban area are the highest and when travel patterns generate the most traffic, especially in a peak direction. Section 4(f): Section 4(f) of the U.S. Department of Transportation Act (49 USC 303) concerns the use of or impacts on any significant public park, recreation area, wildlife or waterfowl refuge, or historic site by a transportation project. Section 4(f) applies to impacts caused by programs and policies undertaken by the USDOT. Section 6(f): Section 6(f) of the Land and Water Conservation Fund Act is similar to Section 4(f) but concerns only those parks and recreational facilities that have received funding through this act. While Section 4(f) applies only to USDOT actions, Section 6(f) applies to impacts caused by programs and policies of any federal agency. Single-Point Urban Interchange (SPUI): This interchange configuration reduces the number of signals to one location in the center of an interchange rather than two signals as is common with the diamond configuration. Left turn movements are combined at a single and more efficient intersection. Transportation Demand Management (TDM): Measures that seek to reduce the number of vehicles using the road system, especially single-occupant vehicles, while providing alternative options to auto travel. Throughput: The number of users being served at any time by the transportation system. Vehicles Miles of Travel (VMT): The number of miles traveled per vehicle multiplied by the total number of vehicles.

Introduction and Background
I-5 JBLM Vicinity Congestion Relief Study | March 2015 Page | I-1
Figure I-2: I-5 Study Area Interchanges
I: Introduction and Background Purpose and Context of this Report This report is one of several documents being prepared as part of the I-5 JBLM Congestion Relief Study. The study is being conducted in three phases and the primary purpose of this document is to memorialize the analysis process of Phase 2B. This report will identify key findings, conclusions, and recommendations focusing on:
Packaging the promising multimodal and local connectivity options into comprehensive alternatives to relief congestion and improve mobility,
Screening these alternatives against a series of high level criteria, and
Determining which alternatives or component elements of alternatives should advance for further evaluation.
The recommended improvements from Phase 2B will be carried forward into Phase 3 for environmental evaluation and documentation under the National Environmental Policy Act (NEPA), as well as for the preparation of an Interchange Justification Report (IJR).
Study Background Interstate 5 (I-5) is a national highway of strategic importance as it extends from the US/Mexico Border to the US/Canada Border. It is the primary highway for the movement of goods and people traveling north and south on the west coast of the United States. In Washington State, I-5 links key population centers, including Vancouver, Olympia, Tacoma, Seattle, Everett and Bellingham. In the corridor study area in south Pierce County, I-5 also serves a function in national defense by providing access to Joint Base Lewis-McChord (JBLM), a secure military facility that is the largest single site employer in the state of Washington. Within the I-5 JBLM project corridor, traffic volumes on I-5 increased 73 percent between 1986 and 2011, to approximately 118,000 vehicles per day. Congested (stop-and-go) traffic has become commonplace during weekday morning and evening peak periods, as well as Sunday afternoons during the summer months. Traffic increase in the study area has been influenced by population and employment growth, as well as by increased economic activity, including a rapid rise in freight movement. Much of this growth in traffic occurred before 2003, when a strategic expansion in employment began occurring at JBLM. This section of I-5 has not been widened since 1975, and is inadequate to meet today’s demand.
Factors contributing to the chronic traffic congestion include:
Heavy existing and expected future through volumes of traffic traveling between Lacey/Olympia and points south to Tacoma/Seattle and points north;
Presence of military base security requirements, and environmental and right-of-way constraints limit access and travel opportunities other than along I-5 within and through the area;
Several closely spaced interchanges (nine) on I-5 over a short distance (11 miles) that are subject to high entering and exiting traffic volumes;
A high volume of vehicle trips to/from DuPont, Lakewood, and JBLM use I-5; Vehicle trips use I-5 for local and short distance travel in the project area; Reduction in number of traffic lanes on I-5 at the Thorne Lane Interchange
(eight lanes north of Thorne, six lanes south of Thorne).
Study Area Figure I-1 illustrates both the focus study area along I-5 between the Mounts Road and SR 512 interchanges (the primary study area of the Phase 1 analysis), as well as the larger influence area that was included in the analysis conducted during Phase 2. Many of the options suggested for consideration during Phase 2 were located outside of the I-5 focus study area, involving local roads, state highways and public transportation systems that are within the influence area but can be some distance from I-5.
The I-5 corridor study area includes nine interchanges running from Mounts Road (Exit 116) on the south to SR 512 (Exit 127) on the north. The study area encompasses all of the interchanges that were identified by the Washington State Legislature for focused analysis and improvement, as well as adjacent or nearby interchanges that could potentially be impacted by modifications at the focus interchanges. The focus interchanges will be more fully addressed in an IJR and are highlighted in green in Figure I-2.
These focus interchanges include: I-5/Steilacoom-DuPont Road Interchange (Exit 119) I-5/41st Division Drive/Main Gate Interchange (Exit 120, commonly known as the
Main Gate interchange) I-5/Berkeley Street Interchange (Exit 122) I-5/Thorne Lane Interchange (Exit 123)
Based on IJR requirements, at a minimum the next interchanges north and south of these four interchanges must also be analyzed. These locations are shown in blue in Figure I-2 and include the interchanges at Center Drive (Exit 118) on the south and Gravelly Lake Drive (Exit 124) on the north, as well as the freeway mainline between Center Drive and Gravelly Lake Drive. Collectively, the minimum study area for an IJR is illustrated in both green and blue.
If impacts extend beyond the minimum focus study area then the boundaries could be extended to include the area shown in purple. This purple area includes the interchange with Mounts Road (Exit 116) on the south, the interchanges with Bridgeport Way (Exit 125) and SR 512 (Exit 127) on the north, and the freeway mainline segments connecting to these interchanges. The areas shown in purple represent the potential IJR influence area, as shown in Figure I-2.
Figure I-1: Phase 2 Analysis Study Area
DuPont
Lakewood
McChord Field
Lewis North
Lacey
Yelm
Lewis Main

Introduction and Background
I-5 JBLM Vicinity Congestion Relief Study | March 2015 Page | I-2
To avoid confusion, for the remainder of this report the combined minimum focus study area and the potential IJR influence area will be referred to as the Corridor Study Area (or study area).
In the Corridor Study Area, I-5 is a limited access highway with four northbound and four southbound lanes north of the Thorne Lane Interchange. South of the Thorne Lane Interchange, I-5 transitions to three northbound and three southbound lanes.
Purpose of the Congestion Relief Study The planning, preliminary design, and environmental work to address existing and expected future congestion problems along I-5 through the JBLM study area is being conducted by WSDOT in cooperation with project stakeholders. The objective of this study is to identify facilities and strategies to relieve chronic traffic congestion, and improve people and freight mobility along this portion of I-5, while providing access to the communities and military installations neighboring the freeway.
The study is being conducted in three phases: Phase 1 – Corridor Plan Feasibility Study to develop an overall strategy for
I-5 between Mounts Road and Gravelly Lake Drive within the context of the larger regional highway system.
Phase 2 – Multimodal Alternatives Analysis to address travel needs and identify potential multimodal improvements beyond the Phase 1 focus on the I-5 mainline and key interchanges.
Phase 3 – NEPA Documentation and Interchange Justification Report to refine project recommendations and secure approval of a preferred phased alternative.
This report documents the results and findings of the second part of Phase 2. To provide context for this report, the key elements of each phase are briefly described below.
Phase 1 – Corridor Plan Feasibility Study In Phase 1, the study team prepared a vision and improvement strategy or “framework plan” for the I-5 corridor to meet 2040 travel demand. This framework plan was essential as there was no existing corridor plan to provide context for a long-range I-5 strategy to help guide the decision-making process for interchange improvements. Accurately identifying the number and type of lanes needed on I-5 is a necessary precursor to designing interchange ramps and bridges.
The framework plan defined and evaluated scenarios for reducing congestion and managing demand for travel along I-5 in the study area. These scenarios centered on various strategies to address existing and expected future deficiencies along the freeway mainline and at the focus interchanges. Phase 1 work was completed in December 2013, and results are documented in the I-5 JBLM Vicinity IJR and Environmental Documentation, Phase 1 – Corridor Plan Feasibility Study, dated January 2014.
The Corridor Plan Feasibility Study also established a vision for I-5 through the JBLM area to achieve a specific series of objectives:
Determine the potential freeway width that future interchanges or other bridges will need to span
Relieve congestion on I-5 within the study area Improve local and mainline system efficiency Enhance mobility Improve safety and operations Increase transit and Transportation Demand Management (TDM)
opportunities
Six mainline scenarios were identified and evaluated as a part of Phase 1, and two of the most promising scenarios were recommended to be carried forward for additional analysis prior to selecting a preferred scenario for the I-5 mainline.
Phase 1 also identified interchange improvement concepts for the four focus interchanges and the most promising concepts were carried forward. An environmental scan was conducted in Phase 1 to identify the presence of sensitive natural and built environment features within or near the corridor that must be taken into consideration as the project moves forward.
Phase 2 – Multimodal Alternatives Analysis Phase 2 of the planning study entailed a multimodal corridor alternatives analysis. This alternatives analysis included:
Evaluating local connectivity options to address the objectives of the project,
Developing alternative packages of selected options, and Determining the most promising set of possible improvements to be
carried forward into the third phase of the study. This effort was conducted in two sub-phases: Phase 2A and Phase 2B.
Phase 2A – Brainstorming and Screening of Promising Improvement Options
Phase 2A involved identification and screening of possible improvement options. The results of this sub-phase were summarized a report entitled Final Phase 2A Alternatives Analysis, Development and Screening of Multimodal Options, dated August 2014.
Phase 2A included two key analysis steps. The first step involved a Fatal Flaw Screening and the second included an assessment of potential benefits of each option to reducing congestion on I-5. The two-step process is illustrated in Figure I-3.
Phase 2A Step 1 fatal flaw screening started with 181 brainstorm options that were identified by project stakeholders and general public. A fatal flaw analysis was conducted using the following criteria:
Regulatory/Legal Considerations I-5 Mainline Operations Local Street Operations Military Security Considerations Reasonableness/Feasibility of the Option
Options for possible improvements were grouped by into the following categories: A. I-5 Access (41 options) B. Off-Base Local Connectivity / unrestricted access (25 options) C. On-Base Local Connectivity / restricted access (31 options) D. Scenario Inputs / modeling sensitivity analysis (10 options) E. Transit (44 options) F. Transportation Demand Management (TDM) and Transportation System
Management & Operations (TSMO) (30 options)
Figure I-3: Phase 2A Screening Process

Introduction and Background
I-5 JBLM Vicinity Congestion Relief Study | March 2015 Page | I-3
Figure I-5: Phase 2A Step 2 Screening – Assess Benefit to I-5 Figure I-6: Summary of the Alternatives Analysis Process As depicted in Figure I-4, out of the 181 original options, 117 were rejected as having some kind of fatal flaw that would preclude practical and cost-effective implementation, or the option was already under consideration as part of another option.
Forty-four options were carried into Phase 2A Step 2 for further analysis using the newly updated study area macroscopic travel demand model developed for the alternative analysis process. These included options for improved I-5 access or local street connectivity enhancements, either with restricted access on JBLM or open to the general public. Twenty of options were set aside to be evaluated in Phase 2B using the new mesoscopic dynamic travel model, developed for the alternatives analysis process. These included various transit, TDM, TSMO, or scenario input options.
Phase 2A Step 2 focused on analyzing and screening the forty-four options in Categories A through C that passed Step 1 screening. These options were modeled to determine their effectiveness in relieving I-5 congestion. Out of this total, only one option passed Step 2 screening as a stand-alone option for consideration in Phase 2B (i.e., the option that would provide barrier-separated express lanes on I-5 through the study area). Twenty-nine of the forty-four options were identified as having potential for reducing congestion and improving mobility along I-5 in the study area, if combined with other improvements. These were carried forward for consideration in the development of packaged alternatives in Phase 2B.
The results of the Phase 2A Step 2 screening process are shown in Figure I-5. Fifteen of the forty-four options were eliminated from further consideration. Full documentation of the findings and conclusions of Step 2 are presented in Final Phase 2A Alternatives Analysis, Development and Screening of Multimodal Options Report, dated August 2014.
Phase 2B – Development and Evaluation of Multimodal Alternatives Phase 2B began with a reassessment of the options carried forward from Phase 1 and Phase 2A to identify potential improvements that had the highest likelihood of reducing congestion along I-5 in the study area. These options were packaged into alternatives using a layering approach that considered a wide range of possibilities and then gradually refined the alternatives to include the most promising projects. See Chapter 3 for a more robust discussion of the development of Phase 2B alternatives. Criteria used in developing and evaluating these packaged alternatives focused largely on two key considerations:
Does the alternative have the potential for reducing or managing congestion along I-5 through the study area?
Will the alternative result in substantive adverse traffic impacts on local streets?
Figure I-6 illustrates the process used to integrate the results of Phase 1 with Phase 2A, leading to the packaged alternatives considered in Phase 2B. It should be noted that, while all brainstormed options were evaluated during the Step 1 screening in Phase 2A, only the options addressing I-5 Access, Off-Base Local Connectivity and On-Base Local Connectivity were assessed in Step 2. Transit, TDM and TSMO options were passed directly to Phase 2B for consideration as multimodal options. Phase 2B analyzed twelve alternative packages, developed by combining Phase 1 and Phase 2A recommendations, as well as the No Action Alternative. These alternative packages were modeled and analyzed for 2020 and 2040 PM peak period conditions. The results of these analyses were used in a weighted evaluation process to determine the most promising alternatives for consideration in the NEPA evaluation. These analyses and results are described in the following chapters.
Phase 3 – NEPA Documentation and Interchange Justification Report Phase 3 will include preparation of an Alternatives Analysis for both NEPA documentation and completion of a project IJR.
Report Content and Organization This report is organized into twelve chapters, the first of which is this Introduction.
Chapter 2 highlights the public outreach and engagement activities conducted during Phase 2B, including involvement by the stakeholder support committees, briefings with elected officials in the corridor, agency focus group meetings, and media and website communications. Chapter 3 discusses the development of alternative packages. A layering approach was used to develop these packages by grouping various options carried forward from Phase 1 and Phase 2A. Chapter 4 presents a short discussion of the process and tools used to develop forecasts of future person trips and to assign these trips to various modes and roadway facilities. Chapter 5 discusses the development of evaluation criteria for use in assessing the performance, benefits, and potential impacts of the alternative packages. Criteria include both quantitative factors (such as speed, travel time, hours of congestion, etc.), and qualitative factors (such as potential environmental impacts and implementation issues).
Figure I-4: Phase 2A Step 1 Screening – Fatal Flaws Assessment

Introduction and Background
I-5 JBLM Vicinity Congestion Relief Study | March 2015 Page | I-4
Chapter 6 illustrates the results of travel demand modeling and operational analysis for each alternative, including person trips and trips made by various vehicular modes (such as single occupant vehicles, high occupant vehicles and transit).
Chapter 7 presents a summary of the performance scoring of each alternative package. Results are summarized by each alternative package.
Chapter 8 summarizes the identification of environmental features in the area of the alternative packages. Factors to be considered include: wildlife and habitat, hazardous materials, cultural and historic resources, Section 4f and 6f, dated August 2014.resources, wetlands and streams, surface and ground water, water quality and hydrology, noise, and socio-economic considerations. A summary of the assessment of the relative environmental impacts of the alternative packages is presented.
Chapter 9 presents the results of an assessment of factors affecting project implementation, including ability to stage construction, relative cost, and potential right-of-way needs.
Chapter 10 documents the evaluation of alternative packages, including consideration of both quantitative and qualitative factors. Total scores for each alternative are calculated and comparisons are made to identify an optimal short-list of the most promising improvements. The recommended alternatives that will be carried forward into Phase 3 for the NEPA environmental analysis are described.
Design Year and Phased Implementation This study uses a potential “build year” of 2020 and a “design year” of 2040 (20 years after the build year), as defined in WSDOT’s Design Manual. Forecasts for traffic demand in the design year will be used to define a facility expected to be necessary for acceptable performance in that year.
Construction of the ultimate (design year) improvements is expected to be implemented in stages, based on both funding availability and growth of traffic demand.
Photo Courtesy of JBLM
Stakeholder Coordination & Public Outreach
I-5 JBLM Vicinity Congestion Relief Study | March 2015 Page | II-1
II: Stakeholder Coordination and Public Outreach
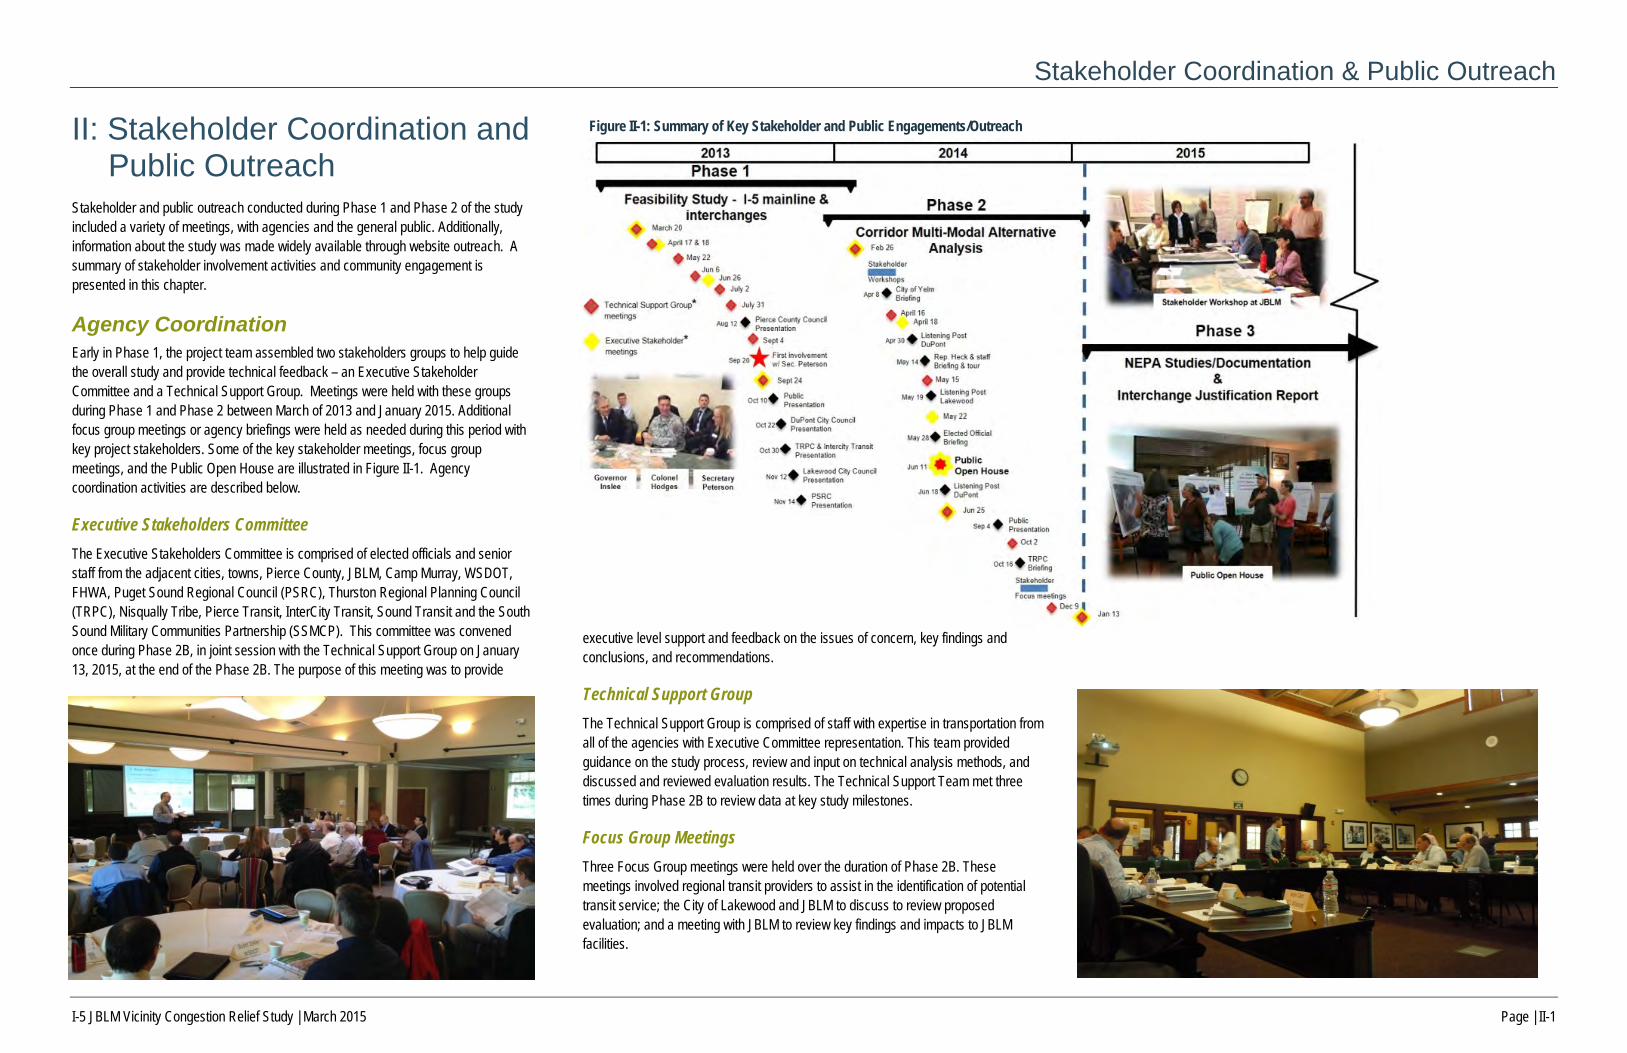
Stakeholder and public outreach conducted during Phase 1 and Phase 2 of the study included a variety of meetings, with agencies and the general public. Additionally, information about the study was made widely available through website outreach. A summary of stakeholder involvement activities and community engagement is presented in this chapter.
Agency Coordination Early in Phase 1, the project team assembled two stakeholders groups to help guide the overall study and provide technical feedback – an Executive Stakeholder Committee and a Technical Support Group. Meetings were held with these groups during Phase 1 and Phase 2 between March of 2013 and January 2015. Additional focus group meetings or agency briefings were held as needed during this period with key project stakeholders. Some of the key stakeholder meetings, focus group meetings, and the Public Open House are illustrated in Figure II-1. Agency coordination activities are described below.
Executive Stakeholders Committee
The Executive Stakeholders Committee is comprised of elected officials and senior staff from the adjacent cities, towns, Pierce County, JBLM, Camp Murray, WSDOT, FHWA, Puget Sound Regional Council (PSRC), Thurston Regional Planning Council (TRPC), Nisqually Tribe, Pierce Transit, InterCity Transit, Sound Transit and the South Sound Military Communities Partnership (SSMCP). This committee was convened once during Phase 2B, in joint session with the Technical Support Group on January 13, 2015, at the end of the Phase 2B. The purpose of this meeting was to provide
executive level support and feedback on the issues of concern, key findings and conclusions, and recommendations.
Technical Support Group The Technical Support Group is comprised of staff with expertise in transportation from all of the agencies with Executive Committee representation. This team provided guidance on the study process, review and input on technical analysis methods, and discussed and reviewed evaluation results. The Technical Support Team met three times during Phase 2B to review data at key study milestones.
Focus Group Meetings Three Focus Group meetings were held over the duration of Phase 2B. These meetings involved regional transit providers to assist in the identification of potential transit service; the City of Lakewood and JBLM to discuss to review proposed evaluation; and a meeting with JBLM to review key findings and impacts to JBLM facilities.
Figure II-1: Summary of Key Stakeholder and Public Engagements/Outreach

Stakeholder Coordination & Public Outreach
I-5 JBLM Vicinity Congestion Relief Study | March 2015 Page | II-2
Figure II-2: Sample of WSDOT’s I-5 – JBLM Vicinity – Congestion Relief Website Public Outreach During Phase 2B public outreach activities focused primarily on communications with affected agencies through focus group meetings with key agency staff. Public communications were also facilitated through the project’s website hosted by WSDOT. These public outreach activities are described below.
Public Communications / Project Website WSDOT’s website has a page dedicated to the I-5 JBLM Vicinity Congestion Relief Study. A snapshot of this page is illustrated in Figure II-2. This page is regularly updated to include new information and links to project documents, including the Phase 1 Corridor Plan Feasibility Study and Summary Report, the Travel Patterns and Characteristics Report, the Phase 2A Alternatives Analysis – Development and Screening of Multimodal Options Report, and graphics related to the project that were presented at the project Open House held on June 11, 2014.
Information available on the WSDOT website also includes discussion of the improvements funded by a recently awarded TIGER III grant, including both the overall improvement package and information on the status of construction.
The project website provides an opportunity for the public to comment on published materials and general project status. These comments are routinely addressed by WSDOT public outreach staff.
Phase 3 Public Outreach At the outset of Phase 3, an in-depth public involvement plan will be developed. This plan will be implemented during the preparation of environmental documentation, and the IJR.

Description of Alternative Packages
I-5 JBLM Vicinity Congestion Relief Study | March 2015 Page | III-1
III. Description of Alternative Packages To develop the alternative packages for future improvements, the recommended scenarios from Phase 1 were combined with various multimodal options, resulting from the Phase 2A screening process, in a layering approach. Overall, 13 future year alternative packages were developed for analysis and evaluation. These alternative packages included the following:
P1 – No Action P2 – Enhanced Transit P3 – Local Street Improvements with Enhanced Transit P4 – I-5 Express Lanes P4a – I-5 Express Lanes with Local Improvements P5 – I-5 HOV Lanes with Collector/Distributor (CD)/Auxiliary Lanes P5a – I-5 HOV Lanes with CD/Auxiliary Lanes with Local Improvements P6 – I-5 HOV Lanes and General Purpose (GP) Lanes P6a – I-5 HOV Lanes and GP Lanes with Local Improvements P7 – I-5 HOV Lanes P7a – I-5 HOV Lanes with Local Improvements and Enhanced Transit P7b – I-5 HOV Lanes with Local Improvements P7c – I-5 HOV Lanes with Local Improvements, Enhanced Transit and On-
Base Frontage road Each of these alternative packages, as well as the 2014 Existing Conditions, are described in the following sections.
2013/2014 Base Conditions Through the study area, I-5 has three general purpose (GP) lanes in each direction south of the Thorne Lane Interchange (Exit 123) and four lanes in each direction north of this interchange, as shown in the line diagram (Figure III-1) below. Auxiliary lanes are located southbound in two areas: 1) between Steilacoom-DuPont Road and Center Drive interchanges and 2) between Center Drive and Mounts Road interchanges. In 2014, an additional southbound auxiliary lane was added as part of the TIGER III project. This auxiliary lane is between Thorne Lane and Berkeley Street interchanges, however it was not included in the base 2013/2014 network. In the northbound direction, there is an auxiliary lane between Center Drive Interchange and the Steilacoom-DuPont Road Interchange.
Between Mounts Road and Bridgeport Way, there are seven interchanges along the nine mile corridor. The interchanges include:
Mounts Road – a diamond interchange Center Drive – a partial cloverleaf interchange Steilacoom-DuPont Road – a diamond interchange Main Gate – a cloverleaf interchange Berkeley Street – a diamond interchange Thorne Lane – a diamond interchange Gravelly Lake Drive – a diamond interchange Bridgeport Way – a diamond interchange
A typical section for I-5 between the Steilacoom-DuPont Road Interchange and the Thorne Lane Interchange is illustrated in Figure III-2.
Figure III-2: 2013/2014 Typical I-5 Section
Figure III-1: Line Diagram of 2013/2014 Base Conditions

Description of Alternative Packages
I-5 JBLM Vicinity Congestion Relief Study | March 2015 Page | III-2
P1: No Action Alternative – 2020 and 2040 The No Action Alternative in 2020 and 2040 is similar to the 2014 existing conditions with the TIGER III Grant projects and the Madigan Gate Access improvements added, as well as area TIP and STIP programs. See Figures III-3, III-4 and III-5. In addition, there are other off-I-5 improvements which include various JBLM gate changes, including Integrity Gate and Mounts Gate which may affect traffic volumes at I-5 interchanges.
Transit service enhancements identified in PSRC 2040 are also assumed and primarily focus on long-term plans of Sound Transit, such as the extension of Sounder Commuter Rail to DuPont. For 2020, the existing transit service is also assumed.
Figure III-5: Access Improvements to Madigan Gate Figure III-4: TIGER III Improvements
Figure III-3: Line Diagram of 2020 and 2040 No Action Alternatives

Description of Alternative Packages
I-5 JBLM Vicinity Congestion Relief Study | March 2015 Page | III-3
P2: Enhanced Transit Alternative – 2020 and 2040 This package contains all elements of the P1 – No Action Alternative. It also adds enhanced transit service, including the following new bus routes with 15-minute headways, during peak commute periods:
Lacey to DuPont P&R to Main Gate to Lakewood Lacey to Yelm to East Gate to Spanaway or Puyallup Lacey to SR 512 P&R to Downtown Tacoma Spanaway to Lakewood to Lacey Lacey to Main Gate to Lakewood
These new routes would essentially be a doubling of existing service along the I-5 corridor
Alternative P2 also assumes an expanded on-Base shuttle system that matches the off-Base transit schedule, as illustrated on Figure III-6
Figure III-6: Enhanced Off-Base Bus Service and Expanded On-Base Shuttle Service Area

Description of Alternative Packages
I-5 JBLM Vicinity Congestion Relief Study | March 2015 Page | III-4
P3: Local Road Improvements with Enhanced Transit Service Alternative – 2020 and 2040 This package contains all elements of the P2 – Enhanced Transit Alternative and also includes the following local road improvements, as illustrated on Figure III-7:
B-3: Gravelly Lake Connector – Add a new 2-lane urban road west of and parallel to I-5 between Thorne Lane and Gravelly Lake Drive.
B-13: SR 507 – Widen 507 to four lanes from McKenna to East Gate Road. B-17: New High Speed Road – Construct a new highway/high speed arterial
road from the Joint Base Connector Road to 176th Street SE. C-7: South A Road Extension – Extend South A Road from Jackson Road to
Logistics Gate.
C-8: Joint Base Connector Phase 2 – Add a new 4-lane higher speed connection between Lewis Main and McChord Field.
C-9: Fairway Road Extension – Improve and extend Fairway Road as 2-lane road from the new Joint Base Connector to Bridgeport Way.
C-15b: New arterial – Add a two-lane urban road close to the I-5 corridor, from Mounts Road to Jackson Avenue.
C-21: New JBLM Collector Street, DuPont Gate to East Gate – Construct or improve a new two-lane road, following rail line and combat vehicle trail.
C-30: On-Base Signalization Improvements – Synchronize existing traffic signal operations on the Pendleton Avenue/Jackson Avenue corridor.
Figure III-7: Selected Local Road Improvements from Phase 2A

Description of Alternative Packages
I-5 JBLM Vicinity Congestion Relief Study | March 2015 Page | III-5
P4: I-5 Express Lanes Alternative – 2020 and 2040 Alternative P4 would add two I-5 express lanes in each direction. The express lanes would extend from north of the Center Drive Interchange to north of the Gravelly Lake Drive Interchange. These express lanes are considered to be ‘managed lanes’ and can evolve over time to best address demand, technology, and future conditions. Some possible options for the managed lanes could include:
Congestion Pricing HOV lane(s) HOT lane(s) Truck only lane Smart Car only lane
For analysis purposes in Phase 2B, it was assumed that the express lanes would include an HOV lane and a GP lane in each direction. A line diagram of the possible 2020 lane configuration for Alternative P4 is illustrated in Figure III-8. A general line diagram of the possible 2040 lane configuration for P4 is illustrated in Figure III-9. For the 2020 analysis one of the existing GP lanes north of the Gravelly Lake Drive Interchange is assumed to be converted to an HOV lane. In the 2040 configuration, an HOV lane is added to the existing four GP lanes at the north end ad to the existing three lanes at the south end of the project. A typical section of the Express Lane Alternative is illustrated in Figure III-10.
Figure III-8: Line Diagram of 2020 Alternative P4 - Express Lanes
Figure III-9: Line Diagram of 2040 Alternative P4 - Express Lanes
Figure III-10: Typical Section for Alternative P4 – I-5 Express Lanes

Description of Alternative Packages
I-5 JBLM Vicinity Congestion Relief Study | March 2015 Page | III-6
P4a: I-5 Express Lanes Alternative with Local Road Improvements – 2020 and 2040 This alternative package includes all the improvements in the P4 – Express Lane Alternative and adds the three local road improvements, illustrated in Figure III-11 and described as follows:
B-3: Gravelly Lake Connector – A new 2-lane urban road west of and parallel to I-5 between Thorne Lane and Gravelly Lake Drive
C-8: Joint Base Connector – A new 4-lane higher speed connection between Fort Lewis and McChord Field.
C-9: Fairway Road Extension – Improve and extend Fairway Road as 2-lane road from the new Joint Base Connector to Bridgeport Way.
These local improvements provide alternative on-Base and off-Base local routes for travel between downtown Lakewood to the Tillicum neighborhood without using I-5, for internal travel between Lewis Main and McChord Field areas of JBLM, and for travel from Lewis Main to Lakewood without using I-5.
Figure III-11: Alternative P4a – Local Road Improvements with Express Lanes

Description of Alternative Packages
I-5 JBLM Vicinity Congestion Relief Study | March 2015 Page | III-7
Figure III-12: Line Diagram of 2020 Alternative P5 – HOV and CD Lanes
Figure III-13: Line Diagram of 2040 Alternative P5 – HOV and CD Lanes
P5: I-5 HOV and CD/Auxiliary Lanes Alternative – 2020 and 2040 Alternative P5 would add an HOV lane in each direction and two sets of Collector/ Distributor (CD) Lanes connected by auxiliary lanes. One set of CD lanes connects the ramps at Mounts Road, Center Drive, and Steilacoom-DuPont Road Interchanges; the other set connects ramps at Berkeley Street and Thorne Lane interchanges with an auxiliary lane to Gravelly Lake Drive. These two sets of CD lanes are connected with auxiliary lanes between the Steilacoom-DuPont CD lanes to the Berkeley CD lanes. A line diagram of the possible 2020 lane configuration for Alternative P5 is illustrated in Figure III-12 with only the Berkeley Street to Thorne Lane CD constructed. For the 2020 analysis one of the existing GP lanes north of the Thorne Lane Interchange is assumed to be converted to an HOV lane.
In the 2040 configuration, an HOV lane is added to the existing four GP lanes at the north end and to the existing three lanes at the south end of the project. A line diagram of the possible 2040 lane configuration for Alternative P5 is illustrated in Figure III-13 with both sets of CD lanes. A typical section of the HOV and CD/Auxiliary Lanes Alternative is illustrated in Figure III-14.
P5a: I-5 HOV and CD/Auxiliary Lanes Alternative with Local Road Improvements – 2020 and 2040 This alternative package includes all the improvements in the P5 – HOV and CD Lanes Alternative and adds the three local road improvement projects, as previously illustrated in Figure III-11. Figure III-14: Typical Section for Alternative P5 – I-5 HOV and CD/Auxiliary Lanes

Description of Alternative Packages
I-5 JBLM Vicinity Congestion Relief Study | March 2015 Page | III-8
P6: I-5 HOV and GP Lanes Alternative – 2020 and 2040 Alternative P6 would add an HOV lane and a GP lane in each direction along I-5. A fourth GP lane is added from Mounts Road to Thorne Lane in each direction. A line diagram of the possible 2020 lane configuration for P6 is illustrated in Figure III-15. For the 2020 analysis, the HOV lanes end south of the Steilacoom-DuPont Interchange and one of the existing GP lanes north of the Thorne Lane Interchange is assumed to be converted to an HOV lane.
In the 2040 configuration, an HOV lane is added to the existing four GP lanes at the north end and to the existing three lanes at the south end of the project. A line diagram of the possible 2040 lane configuration for P6 is illustrated in Figure III-16. For modelling purposes in 2040, the HOV lane is assumed to extend from Thurston County to Tacoma. A typical section of the HOV and GP Lanes Alternative is illustrated in Figure III-17.
P6a: I-5 HOV and GP Lanes Alternative with Local Road Improvements – 2020 and 2040 This alternative package includes all the improvements in the P6 – HOV and GP Lanes Alternative and adds the three local road improvements as previously shown in Figure III-11.
Figure III-15: Line Diagram of 2020 Alternative P6 - HOV and GP Lanes
Figure III-16: Line Diagram of 2040 Alternative P6 - HOV and GP Lanes
Figure III-17: Typical Section for Alternative P6 – I-5 HOV and GP Lanes

Description of Alternative Packages
I-5 JBLM Vicinity Congestion Relief Study | March 2015 Page | III-9
P7: I-5 HOV Lane Alternative – 2020 and 2040 Alternative P7 would add an HOV lane in each direction along I-5. A line diagram of the possible 2020 lane configuration for P7 is illustrated in Figure III-18. For 2020, the extra lanes begin and end at Center Drive Interchange and the inside northbound lane becomes an HOV lane at the Steilacoom-DuPont Interchange. For the 2020 analysis one of the existing GP lanes north of the Thorne Lane Interchange is assumed to be converted to an HOV lane.
In the 2040 configuration, an HOV lane is added to the existing four GP lanes at the north end and to the existing three lanes at the south end of the project. For 2040 modelling purposes, the I-5 configuration assumes the HOV lanes extend from Thurston County to Tacoma. An existing GP lane in each direction north of the Thorne Lane Interchange is converted into an HOV lane. A line diagram of the possible 2040 lane configuration for P7 is illustrated in Figure III-19. A typical section of the HOV Lanes Alternative is illustrated in Figure III-20.
P7a: I-5 HOV Lane Alternative with Local Road Improvements and Transit Enhancements – 2020 and 2040 This alternative package includes all the improvements in the P7 – HOV Lanes Alternative and adds the enhanced transit improvements included in Alternative P2. It also adds the three local road improvement projects, as previously shown in Figure III-11.
P7b: I-5 HOV Lane Alternative with Local Road Improvements – 2020 and 2040 This alternative package is the same as Alternative P7a except the enhanced transit improvements are not included. .
Figure III-18: Line Diagram of 2020 Alternative P7 - HOV Lanes
Figure III-19: Line Diagram of 2040 Alternative P7 - HOV Lanes
Figure III-20: Typical Section for the Alternative P7 – I-5 HOV Lanes

Description of Alternative Packages
I-5 JBLM Vicinity Congestion Relief Study | March 2015 Page | III-10
Figure III-21: P7c – JBLM Frontage Road Option C-15a with Local Road Improvements P7c: I-5 HOV Lane Alternative with Local Road Improvements, Transit Enhancements and On-Base Frontage Road – 2020 and 2040 This alternative package includes the Alternative P7a improvements with an added on-Base frontage road (Option C-15a) from Mounts Road to McChord Drive, as illustrated in Figure III-21. This on-Base frontage road roughly parallels I-5 with grade-separations over non-secure roads. Internal connections to existing military roads are assumed to be located at approximately quarter mile increments.
Based on reviews with JBLM staff, this alternative was considered to be fatally flawed because:
It requires a large amount of JBLM residential land (approximately 96 acres); It impacts approximately 70 single family or multi-family structures; It routes access to the frontage road through low speed residential streets;
and It is not compatible with JBLM’s master plan.
Because of these issues, it was not carried forward for more detailed analysis.
Interchange Concepts Assumed for Phase 2B Analysis As part of the Phase 1 analysis, two to four interchange concepts were recommended for each of the four focus interchanges that are shown on Figure III-22. For this evaluation of alternative packages, one concept was selected from the Phase 1 concepts and held constant for all modeling of the alternative packages in Phase 2B. The following interchange concepts were selected for this analysis:
Steilacoom-DuPont Road Interchange: Option B – A relocated diamond interchange with a modified Access Control Point (ACP).
Main Gate Interchange: Option A – A modified cloverleaf interchange with a grade-separated southbound off-ramp.
Berkeley Street Interchange: Option B – A diamond interchange. Thorne Lane Interchange: Option B – A relocated diamond interchange with
connection to Union Avenue. This does not represent the final interchange solution for each interchange. More detailed analyses will be conducted in Phase 3 (NEPA Environmental Studies and the I-5 JBLM Vicinity Interchange Justification Report) to determine the recommended interchange concepts.
Figure III-22: I-5 Focus Interchanges
Steilacoom-DuPont Road
Main Gate
Berkeley Street
Thorne Lane

Travel Forecasting Methodology
I-5 JBLM Vicinity Congestion Relief Study | March 2015 Page | IV-1
IV: Travel Forecasting Methodology
The travel forecasts for the I-5 JBLM Vicinity Congestion Relief Study were developed using a series of inter-related and complimentary modeling tools that included a Macroscopic Model, Mesoscopic Model and Transit Sketch Model. Each of the three modeling tools were developed and applied specifically for the I-5 JBLM Vicinity Congestion Relief Study and used to evaluate the alternative improvement packages identified in Phase 2B. The Macroscopic Model was originally developed for the Phase 1 – I-5 JBLM Corridor Plan Feasibility Study completed in January 2014, but was refined after the collection of additional origin-destination and mode share travel data, which are summarized in the Travel Patterns and Characteristics Report, August 2014. The data allowed for the model to be expanded to specifically model JBLM on-base roadways and Access Control Point (ACP) operations. To provide for greater sensitivity to the operational challenges identified within the study area, a Mesoscopic Model was developed to account for merging/weaving conflicts along the I-5 mainline, interchange ramp metering, at-grade railroad crossings, and detailed intersection and JBLM ACP operations during the evaluation of the alternative improvement packages. Finally, a Transit Sketch Model was developed to evaluate the effects that commuter oriented transportation demand management programs (subsidized transit passes, vanpools, shuttles, etc.), investments in high-occupancy vehicle facilities, and improvements to commuter transit service can have on congestion along the I-5 corridor. This section provides an overview of the modeling tools, how they are used together, and the no-build future model network assumptions.
Modeling Components A general description is provided of each of the models developed for the I-5 JBLM Vicinity Congestion Relief Study, with a much more detailed description of each model in subsequent chapters.
Macroscopic Model The I-5 JBLM Macroscopic Model (Macro Model) was used to develop travel forecasts in the study area and to understand travel pattern changes that would result from various alternative improvement packages. The Macro Model has a base year of 2010, and two forecast horizon years of 2020 and 2040. The general scope of the model is the area of Pierce County south of the Puyallup River, and also includes roadways in eastern Thurston County. The model includes trip assignments for both high-occupancy vehicle (HOV) and single-occupancy vehicle (SOV) mode splits for three time periods: AM peak period (6am to 9am), midday peak period (11am to 2pm), and PM peak period (3pm to 6pm). The Macro Model is consistent with local and regional land use plans, including the Puget Sound Regional Council (PSRC) and Thurston Regional Planning Council (TRPC) regional models.
Transit Sketch Planning Model The Transit Sketch Planning Model (Transit Model) was developed to provide a more comprehensive, multi-modal assessment of how corridor level improvements can help achieve the congestion reduction goals of the project. The Transit Model captured the effects that commuter oriented transportation demand management programs (subsidized transit passes, vanpools, shuttles, etc.), investments in high-occupancy vehicle facilities, and improvements to commuter transit service can have on congestion in the corridor. The Transit Model also informed the planning process allowing the project team to better understand the commuter transit market in this corridor.
The Transit Model was designed to build upon the existing Macro Model while also integrating with the Meso Model. The Transit Model borrowed data to the extent possible from the established regional models as well as using data which had been identified through industry research as important for forecasting commuter transit ridership. When data was not available from other transportation models, data was aggregated from established data sources like the US Census and regional transit agencies. Once developed, the model was calibrated using PSRC’s model and validated against current commuter transit ridership data. An independent review of the Transit Model confirmed (see Appendix A) that the model captured the key commuter variables, was appropriate for this stage of analysis, and met industry best practices.
The Transit Model was integrated into the overall modeling process, interfacing directly with the Macro Model. A variety of data inputs from the Macro Model fed into the Transit Model including SOV and HOV travel times. Once transit ridership forecasts for each alternative package were developed, the data was input back into the Macro Model to account for the changes in mode share. Ridership forecasts were also used directly in performance assessments of the alternative improvement packages.
Mesoscopic Model The I-5 JBLM Mesoscopic Model (Meso Model) was developed to evaluate a series of detailed transportation performance measures by which to compare each of the alternative improvement packages. The Meso Model was built using Dynameq software and is based upon the Macro Model, so it is also consistent with local and regional land use plans. The general scope of the model is the I-5 corridor between SR 512 and the Nisqually River, including the adjoining local on-Base and off-Base arterials. The Meso Model incorporates specific roadway and intersection operational details such as signal timing, roadway channelization, ramp metering, and merging/weaving conflicts along the I-5 mainline. It also includes operational impacts from at-grade railroad crossings and ACP gate operations.
The Meso Model has a base year of 2013 and two forecast horizon years of 2020 and 2040. The model includes trip assignments for both high-occupancy vehicle (HOV) and single-occupancy vehicle (SOV) modes for two time periods: AM peak
period (5am to 11am) and PM peak period (2pm to 8pm). The 6-hour time periods provide the opportunity to evaluate impacts from increased congestion and peak spreading along the I-5 corridor.
Modeling Procedure Outputs from the modeling effort required coordination between the three different models. Figure IV-1 illustrates the general procedure for modeling each alternative package. Step 1 included coding the Macro Model with the alternative improvement package assumptions, running the model, and outputting SOV and HOV travel time trip tables for use in the Transit Sketch Model. Step 2 included coding the Transit Sketch Model with the alternative improvement package assumptions, running the model, and outputting transit ridership and vehicle trip adjustments (changes in amount of vehicle trips due to changes in transit ridership) for use in the Macro Model. Step 3 included revising the Macro Model with the transit ridership adjustments, re-running the model, and outputting vehicle volume metrics and subarea trip tables for use in the Meso Model. The final step, Step 4, included detailed operational coding of the Meso Model, running the model, and then outputting various performance metrics described later in the report.
Figure IV-1: Model Process Flowchart

Travel Forecasting Methodology
I-5 JBLM Vicinity Congestion Relief Study | March 2015 Page | IV-2
Network Assumptions The networks reflected in each model account for the supply side of the transportation system. Two forecast horizon years of 2020 and 2040 were modeled and evaluated. The future horizon years model how traffic demand responds to changes in the network supply (i.e., roadway improvements). Key features of the existing model network are discussed below, along with the future no-build network assumptions inherent in the various alternative improvement packages tested by the models.
Existing Network The extents of each model are different, with the Macro Model including most roads in Pierce County south of the Puyallup River and major roadways in eastern Thurston County. The Meso Model includes a subset of the roadways within the Macro Model, and focuses on the area between SR 512 and the Nisqually River. The Transit Model has the same approximate extents of the Macro Model.
The alignment and attributes of the existing street network (such as posted speeds, lanes, signal timing, and traffic controls) were obtained from GIS data sources or directly from the local agencies.
Future No Action Planned Improvements The future networks assumed for the models were adapted from the existing street network, but include various planned network improvements. As part of the model development, a future No Action Alternative (P1) was developed. The 2020 and 2040 No Action Alternative (P1) included the planned improvements shown in Table IV-1. The Macro Model and Transit Model are meant to forecast regional travel demands based on major characteristics of the roadway and transit system. Any smaller scale improvement related to traffic operational enhancements such as ramp metering and railroad crossing delays are not explicitly addressed in either the Macro Model or Transit Model, but are accounted for in the more detailed Meso Model.
Table IV-1: No Action Alternative Planned Improvements

Evaluation Methodology
I-5 JBLM Vicinity Congestion Relief Study | March 2015 Page | V-1
V: Evaluation Methodology Phase 2B of the I-5 JBLM Congestion Relief Study is the third step in this study to identify the best performing multimodal corridor improvements to address existing and expected future congestion and mobility problems along I-5 in the JBLM vicinity. The Phase 1 – Corridor Plan Feasibility Study addressed modifications to the I-5 mainline and the four focus interchanges. At the conclusion of Phase 1, two concepts for modifying the I-5 mainline were recommended for further study, and several options for improving the four key study area interchanges were identified. Following the completion of Phase 1, a comprehensive multimodal alternatives analysis (Phase 2) was initiated and two distinct phases of work were developed. Phase 2A explored a series of options for multi-modal and local connectivity improvements to address the objectives of the project. Phase 2A resulted in a shortlist of the most promising options to help alleviate the traffic pressure and congestion on I-5. The focus of Phase 2B was to study a series of alternatives created by packaging the most promising options from Phases 1 and 2A, and identify two or three comprehensive alternative packages to address the congestion and mobility problems along I-5 between Mounts Road and Bridgeport Way. After completion of Phase 2B, the selected alternatives will be advanced for more in-depth analysis and environmental documentation under the requirements of the National Environmental Policy Act (NEPA). To analyze and evaluate the alternative packages in Phase 2B, a revised evaluation methodology and criteria were developed, using the updated travel demand models and additional analysis. The Phase 2B evaluation methodology is presented in the following section.
Phase 2B Screening Methodology The screening process and criteria described in this section was presented and discussed with a project working group drawn from the project’s Technical Support Group, and representatives from the design team. The Phase 2B evaluation methodology was developed by modifying the Phase 1 evaluation process with updated criteria, based on data from the enhanced travel demand models. These models include:
JBLM Area Travel Demand Model (Macro Model) – Used to estimate person and vehicle travel demand for all key roadway links within and to/from the study area based on growth in regional population and employment.
JBLM Area Mesoscopic Model (Meso Model) – Used to convert macro model vehicle forecasts by link into roadway vehicle volume projections based on the limitations of roadway capacity. Where macro model forecasts exceed meso model volumes, unserved demand can be identified.
Transit Sketch Planning Tool (Transit Model) – Used to estimate potential person trips that would use transit service or make trips in a High Occupancy Vehicle (HOV) that could reduce vehicular demand on I-5.
The various criteria were selected based on the project goals and their ability to differentiate between alternatives.
Phase 2B Goals To develop these criteria, a group of the technical stakeholders and the project team was formed into an evaluation subcommittee to review and develop a draft evaluation process and criteria. Meetings were then held to review the evaluation process with several stakeholders.
Phase 2B evaluation criteria were chosen to address not only transportation performance, but also to consider environmental consequences and the complexity of implementation strategies. In order to choose the most meaningful evaluation criteria, it was important to identify the desired outcomes or goals of any future investments made to the I-5 corridor in the study area. Evaluation criteria were then assessed in the context of those project goals to determine the effectiveness, performance and impacts associated of each alternative package. Consistent with the Purpose and Need Statement for the project, overall project goals include:
1. Maximize use of existing facilities and strategically add new improvements or implement TDM strategies to enhance efficiency while reducing the impact of “local” traffic on the freeway.
2. Achieve measurable improvement over baseline operations for transportation reliability, person throughput and freight movement in 2020 (opening year) and 2040. Baseline for the 2020 evaluation will be 2014. Baseline for the 2040 evaluation will be the 2040 no-build condition.
3. Improve attractiveness of HOV travel through the corridor (including vanpools, carpools, transit and other high occupancy vehicle modes).
4. Maximize stewardship of limited public resources by identifying solutions that reduce travel demand in peak periods and/or relieve congestion, can be constructed in phases, and are cost effective.
5. Implement alternatives that avoid or minimize environmental impacts.
The development of the Phase 2B evaluation criteria or performance measures was based on the following process:
The data is reasonably attainable from modeling tools and other data sources; The data will be useful in highlighting key differences among alternatives to
facilitate decision-making; and The data can be used to measure projects goals.
Phase 2B Evaluation Criteria Two categories of evaluation criteria were developed for this Phase 2B evaluation (i.e. quantitative criteria and qualitative criteria). The quantitative criteria are performance-based data derived from the various analysis tools used in this study. The quantitative criteria include:
Travel Speeds along I-5 – PM peak hour speeds for HOV and SOV vehicles; Hours of Congestion – Peak spreading over a 6-hour PM peak period; Travel Time – Average travel time along the I-5 corridor between Mounts
Road and Bridgeport Way for a 3-hour PM peak period; Person Throughput – Regional person trips on I-5 over a 6-hour PM peak
period; Percent of Person Demand Served – Measures percent of projected demand
accommodated along the I-5 corridor over 2-hour PM peak period; and Potential Regional Person Trips via Transit and HOV – Number of transit trips
using the corridor in a 3-hour PM service period and number of HOV trips using the I-5 corridor in a 6-hour PM peak period
The qualitative criteria are based on an assessment of implementation characteristics, and the updated environmental scan conducted for this study. These qualitative criteria include:
Implementation Assessment – A qualitative review of their ability for staged construction, right-of-way needs, and costs of each alternative with respect to other alternatives; and
Environmental Considerations – A qualitative review of the possible environmental impacts for each alternative package with respect to other alternatives.
The following is a brief discussion of each of these criteria by category. The scoring of these criteria follows a Consumer Reports format where the lowest value is represented by a solid red circle and the best value highlighted by a solid green circle. For purposes of this evaluation process, it was decided that each criterion would use a scoring range of five circles as shown below.
Quantitative Performance Measures Project screening thresholds were used to compare and/or rank various alternatives using the quantifiable data developed. For criteria related to speeds, hours of congestion and travel time, five ranks were identified and draft data values that define each rank are presented below. 2020 conditions are considered in relation to the 2014 baseline and 2040 conditions under each alternative are compared the 2040 No Build scenario. For the three criteria related to person travel (i.e., person throughput, percent of person demand served, and regional HOV and transit person trips), data was not grouped into categories based on threshold values. Instead, the data for each alternative was compared to the highest performing alternative, and the results expresses as a ratio.

Evaluation Methodology
I-5 JBLM Vicinity Congestion Relief Study | March 2015 Page | V-2
Person Throughput by Trip Origin/Destination Pattern (Relative percent change from the alternative with the greatest increase in regional trips)
> 90%
70% to 90%
50% to 69%
30% to 49%
< 30%
Percent of Person Demand Served (Relative percent change from the alternative with the greatest increase in percent of Person Demand Served)
> 90%
70% to 90%
50% to 69%
30% to 49%
< 30%
Change in HOV, SOV and All Mode Speeds Scoring (comparison to posted speed)
Change in Hours of Congestion Scoring
< 2 hours of congestion
2 - 3 hours of congestion
> 3 - 4 hours of congestion
> 4 - 5 hours of congestion
> 5 hours of congestion
Travel Time Scoring
< 10 minutes
10 – < 15 minutes
15 - < 20 minutes
20 – 30 minutes
> 30 minutes
1. I-5 Travel Speed Using data from the Meso Model, PM peak hour travel speeds were tracked by HOV and SOV modes and summarized for both directions and by I-5 segment, as well as for CD roads and express freeway sections. Travel speed performance was measured as percent of posted speed for both modes. Data was developed in tabular and graphical form for HOV and SOV modes by direction. Free flow travel speed along I-5 is 60 mph.
2. Hours of Congestion According to WSDOT’s Highway System Plan, congestion was defined as speeds below 70% of the posted speed (42 mph). Using data from the Meso Model, the duration of travel below 42 mph was measured during a typical 2 PM to 8 PM peak period for each alternative. This criterion could also be used as a measure of reliability/predictability for the freeway by looking at patterns within the congested hours. During the 6-hour PM peak period, hours of congestion was estimated for both the HOV and SOV modes on I-5 by freeway segment in northbound and southbound directions. Performance was measured in terms of an absolute number of congested hours. Data was developed in tabular and graphical form for HOV and SOV modes by direction.
3. Travel Time on I-5 (Mounts Road to Bridgeport Way) Average travel between the Mounts Road Interchange and the Bridgeport Way Interchange time in both directions of I-5 was estimated over a 3-hour PM peak period for HOV and SOV traffic, using the data from the Meso Model. Performance was measured as average travel time per vehicle for both modes. Data was developed in tabular and graphical form for HOV and SOV modes by direction. Free flow travel time along I-5 is approximately 9 minutes.
4. Person Throughput by Trip Origin/Destination Pattern (i.e. Regional Person Trips) This criterion measures the level of regional person travel (i.e., trips passing through the entire study area corridor) that could be expected with each alternative. The number of regional trips ( i.e., trips that traveled from Mounts Road to Bridgeport Way without exiting I-5 during the 6-hour PM peak period, was estimated for each alternative, and based on data from the Meso Model and the Transit Model). SOV, HOV and transit regional trips were summarized. Performance was measured as the relative percent change in person trips as compared to the alternative with the greatest increase in regional person throughput over the base conditions. Data was developed in tabular and graphical form.
5. Percent of Person Demand Served (i.e., “Unserved Demand”) This criterion compares the projected demand for transportation service along I-5 with the actual demand that could be accommodated due to capacity limitations. These values were derived from Meso Model input trip table and compared to actual trips using I-5 during a 2-hour PM peak period using person miles of travel in both directions of I-5 between Mounts Road and Bridgeport Way. The identified difference between person miles of travel demand input into the Meso Model and the actual person miles of travel that can be accommodated in the highest 2-hour peak period. Performance was measured as the relative percentage change in person miles of travel demand served for the peak period as compared to the alternative with the greatest increase in average percent change over the base condition.
6. Potential of Regional Person Trips via HOV and Transit This criterion measures the attractiveness of alternative modes of travel, i.e. carpools, vanpools and transit modes and could be used to assess effectiveness in reducing I-5 congestion. This measure uses PM 6-hour peak period HOV trips from the Meso Model and PM 3-hour service period for transit trips from the Transit Model.
HOV Trips: For 6-hour PM peak period for I-5, total regional HOV trips were calculated (i.e., HOV trips traveling entirely through the study area from Mounts Road to Bridgeport Way on I-5).
Transit Trips: Transit trips were regional person trips during the 3-hour PM peak service period and projected to use the transit system to travel through the corridor. The 3-hour analysis period for transit is consistent with PSRC mode split models and peak period transit operations.

Evaluation Methodology
I-5 JBLM Vicinity Congestion Relief Study | March 2015 Page | V-3
Potential of Regional Person Trips via HOV and Transit (Relative percent change to the alternative with the greatest increase in regional HOV or Transit Trips)
> 90%
70% to 90%
50% to 69%
30% to 49%
< 30%
Implementation/Impact Assessment
Score of > 0.75 (easily phased, minimal right-of-way, lower magnitude of costs)
Score of > 0.5 to 0.75 (can be phased, but requires added right-of-way with higher magnitude of costs)
Score of < 0.5 (requires significant construction through corridor with added right-of-way and highest magnitude of costs)
Natural and Built Environmental Performance
Score of > 0.8 (lowest environmental impacts as compared to the base conditions)
Score of > 0.6 to 0.8 (moderately low environmental impacts)
Score of > 0.4 to 0.6 (moderate environmental impacts)
Score of > 0.2 to 0.4 (moderately high environmental impacts)
Score of 0.2 or less (highest environmental impacts)
Separate performance measures were developed for HOV and transit trips. Each performance measure was measured as the relative percent change as compared to the alternative with the greatest increase in regional HOV trips or regional transit trips over the base condition. Data was developed in tabular and graphical form for HOV and transit trips.
Qualitative Performance Measures For the qualitative evaluation involving potential environmental issues and considerations related to implementation characteristics, a multi-level ranking summation was used as summarized below.
Implementation Assessment The principles of Least Cost Planning and Practical Design were used in this assessment. The outcome of least cost planning is a recommended set of multimodal strategies that are cost effective and still meet the goals and objectives set early in the planning process. Practical design is an approach to making project decisions that focuses on the need for the project and looks for the cost-effective solutions. It engages local stakeholders at the earliest stages of defining scope to ensure their input is included at the right stage of project design. Key features include:
Maximum results within limited funding Tailored solutions for the project’s purpose and need Phased solutions that address more critical and current needs, each phase
having independent utility Performance related to lease cost and practical design considerations was measured qualitatively using an estimation of three factors identified as important to assess implementation impacts and complexities that distinguish each alternative in comparison with the No Action condition. These factors included:
Ability to phase or stage construction Order-of-magnitude costs Potential right-of-way acquisition requirements
Environmental Assessment:
This evaluation includes a qualitative assessment of potential environmental impacts associated with the component elements of each packaged alternative. These measures were applied using the environmental scan data from Phase 1 that was updated to include several potential local road improvements identified during Phase 2A. This data was used to ascertain the type and nature of various potential natural and built environmental impacts. Specific environmental impacts identified included:
Wildlife and habitat Hazardous materials Cultural and historic resources Section 4f and 6f resources Wetlands and streams Surface water Ground water Noise Socio-economic
Each of these resources was mapped or otherwise identified and a qualitative, high level assessment was conducted to determine whether there existed a potential for
possible environmental impacts associated with each roadway elements of the packaged alternatives. The effects of each alternative were assessed relative to the base condition.
Scoring Process The evaluation subcommittee developed a weighing system and scoring system to assess the overall performance of each alternative. The weighting system is summarized in Figure V-1. The figure shows the maximum number of points that can be given to any alternative.
For criteria related to speeds, hours of congestion and travel time, five rating factors were identified for each of these three criteria. These rating factors are shown in Figure V-2.
For the three criteria related to person travel (i.e., person throughput, percent of person demand served, and regional HOV and transit person trips), data was compared to the highest performing alternative, and the results expresses as a ratio. This ratio was then applied to the weigh values for these criteria.
Figure V-1: Phase 2B Weighting System
Rating Point Factors
1.0
0.8
0.6
0.4
0.2
Figure V-2: Rating Factors

Evaluation Methodology
I-5 JBLM Vicinity Congestion Relief Study | March 2015 Page | V-4
For the implementation assessment, the evaluation subgroup assigned scores to each alternative from zero to ten for the three implementation elements for each alternative. These elements and maximum scores are shown on Figure V-3.
The scores for the three elements were then totaled for each alternative. These scores were then compared to the highest performing alternative, and the results expresses as a ratio. This ratio was applied to the weigh value for this criterion.
For environmental assessment, the evaluation subgroup assigned rating factors from zero to one for each alternative. These rating values were then multiplied by the weight assigned to this criterion.
Overall, there are 100 point available for the performance criteria and ten points available for the Implementation and Impact criteria. The total performance score was then multiplied by the implementation/impact score to develop a Performance Index (P*I) as illustrated in Figure V-4.
Figure V-4: Phase 2B Scoring Process
Phasing/ Staging, 10
Right-of-Way, 10
Order of Magnitude Cost, 10
Figure V-3: Implementation Assessment Elements