pharmacology, university college, generally physiol-1942.pdfof histamine by h. 0. schild fromthe...
TRANSCRIPT
115
J. Physiol. (I942) IOI, II5-I30 547.78i.5:6i2.0i
A METHOD OF CONDUCTING A BIOLOGICAL ASSAYON A PREPARATION GIVING REPEATED GRADEDRESPONSES ILLUSTRATED BY THE ESTIMATION
OF HISTAMINE
BY H. 0. SCHILDFrom the Department of Pharmacology, University College, London
(Received 21 January 1942)
BIOLOGICAL assays on isolated preparations are generally based on theprinciple of 'bracketing' doses of the unknown with doses of the standarduntil their effects are matched. This method does not lend itself readilyto statistical analysis. Many workers do indeed attempt to estimate theaccuracy of their assays by performing preliminary experiments withsolutions of known composition. Such preliminary experiments aye, how-ever, inefficient and also apt to be misleading, as conditions often do notapproximate to those of a real assay. It is thus preferable to deduct theerror of an assay from the data of the experiment itself.
Special difficulties arise if the object of the experiment is to testwhether two solutions have the same activity. As the two solutions aretested repeatedly chance variations occur, and owing to the lack ofcriteria for dealing with these the result frequently becomes more dubiousthe more the experiment is prolonged. It is in this type of experimentinvolving the setting up and testing of a 'null hypothesis' [Fisher, 1937],that statistical methods are most useful, since they provide a definiteanswer, provided that the question is put in the right terms and theexperiment designed on sound lines.
The object of this paper is to describe a method of conducting a bio-logical assay on a single preparation in such a way that a valid nullhypothesis may be set up and the accuracy of the result may be estimatedfrom the data of the experiment itself. The method has been applied tothe assay of histamine on the guinea-pig's gut. The design is based ona simple plan used in field experiments on adjacent plots [Fisher, 1938].The statistical argument has been largely adapted from the work of
8-2
) by guest on February 4, 2014jp.physoc.orgDownloaded from J Physiol (

H. 0. SCHILD
Gaddum [1933] and Bliss & Marks [1939 a, b]. The performance of theassay and its statistical analysis are discussed in detail, and it is hopedthat readers who are not acquainted with statistical methods will haveno difficulty in following the main argument and performing the test.
METHODSThe experiments were done on preparations of isolated gut from
guinea-pigs. Most assays were performed at 28-32° C. At this tempera-ture no spontaneous contractions of the intestinal strip occurred.
Fig. 1. Pulley system for linear recording of smooth muscle contraction.
A frontal writing lever was used in earlier experiments, but was dis-carded later owing to its relatively large error in recording at high anglesof excursion. Instead, a pulley system of recording, shown in Fig. 1, wasadopted; this provided a faithful record of the intestinal movements.A fine glass frontal writing point is attached to a horizontally movingsilk thread which is kept taut by means of two small balance weights.Light vulcanite pulleys are used, and if magnification is desired it can beDbtained by means of a double pulley as shown in Fig. 1. In the present
116
) by guest on February 4, 2014jp.physoc.orgDownloaded from J Physiol (
BIOLOGICAL ASSAYS ON ISOLATED PREPARATIONS 117
experiments, however, a single pulley without magnification was used inits place.
The bath volume was 25 c.c. and that of the test solutions added tothe bath usually 1 c.c. Solutions were added at intervals of 3 mm.
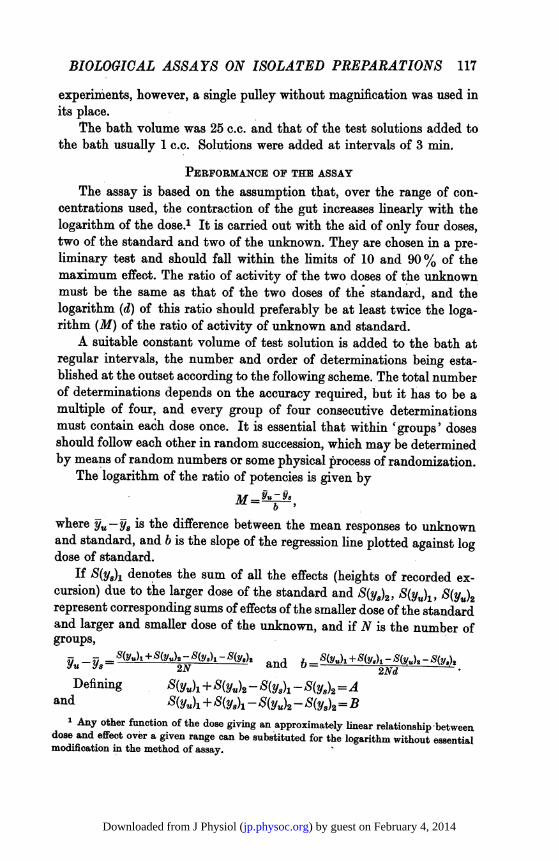
PERFORMANCE OF THE ASSAYThe assay is based on the assumption that, over the range of con-
centrations used, the contraction of the gut increases linearly with thelogarithm of the dose.' It is carried out with the aid of only four doses,two of the standard and two of the unknown. They are chosen in a pre-liminary test and should fall within the limits of 10 and 90% of themaximum effect. The ratio of activity of the two doses of the unknownmust be the same as that of the two doses of the' standard, and thelogarithm (d) of this ratio should preferably be at least twice the loga-rithm (M) of the ratio of activity of unknown and standard.
A suitable constant volume of test solution is added to the bath atregular intervals, the number and order of determinations being esta-blished at the outset according to the following scheme. The total numberof determinations depends on the accuracy required, but it has to be amultiple of four, and every group of four consecutive determinationsmust contain each dose once. It is essential that within 'groups' dosesshould follow each other in random succession, which may be determinedby means of random numbers or some physical process of randomization.
The logarithm of the ratio of potencies is given byM_= Yu-Y8.b
where yu- is the difference between the mean responses to unknownand standard, and b is the slope of the regression line plotted against logdose of standard.
If S(y8)L denotes the sum of all the effects (heights of recorded ex-cursion) due to the larger dose of the standard and S(Y8)2, S(Yu)l, S(YU)2represent corresponding sums of effects of the smaller dose of the standardand larger and smaller dose of the unknown, and if N is the number ofgroups,Y- - 8(Y )+S(Yl)2 -YU2 - S(YS)2 and b =S(YU)1 +S(y) - - S(Y.)2
2N 2NdDefining S(YU),+S(Y)2-S(ys)l -S(Ys)2 =A
and S(YU)l + S(Ys) - S(Yu)2- S(YS)2 =B1 Any other function of the dose giving an approximately linear relationship between
dose and effect over a given range can be substituted for the logarithm without easentialmodification in the method of assay.
) by guest on February 4, 2014jp.physoc.orgDownloaded from J Physiol (

118 H. 0. SCHILD
the expression for M becomesM=Ad.
Graphical presentation. Fig. 2 illustrates an experiment in which twoknown solutions of histamine-termed for convenience 'standard' and
Height ofrecordmm.
a b-70
x
60
0
E . 300~~~0 420 Ys 4
E 300
o -20
. 10
9 5 *6 *7 *8 *9 8*0 9§5 *6 *7 *8 *9 8-0Log concentration of 'standard'
Fig. 2a. Effects of two doses of 'standard' (0) and two doses of 'unknown' (x ). Ratioof activities 4: 5; d=0-30103; N=5.
Fig. 2b. Graphical determination of M. PR is the average regression.
) by guest on February 4, 2014jp.physoc.orgDownloaded from J Physiol (

BIOLOGICAL ASSAYS ON ISOLATED PREPARATIONS 119
'unknown'-were compared. The ratio of activity of the two solutionswas 4: 5, and the concentration ratio of doses was 1: 2 (d=0030103).The effects are plotted against log concentration of standard.
Fig. 2 a shows the scatter of results and the overlapping of effects dueto standard and unknown. In Fig. 2 b the mean effects of the four doseshave been computed, and with their aid and. the use of the mean re-gression line M is determined. The slope of PR, the mean regression line,is an average of the estimated slopes for standard and unknown.
Graphically M works out at about 009, this being the logarithm of1-23, the estimated difference of activity is approximately 23 %. Thedata of this experiment will be worked out in detail in the followingsections.
OUTLINE OF THE STATISTICAL ANALYSIS
Fig. 3a illustrates the sequence of injections and the size of singleresponses in the above experiment, and Fig. 3b once more the meaneffects of the four doses. The first object of the statistical analysis is tofind out whether these mean effects differ from each other significantly,compared with the experimental error. In the simplest type of experi-ment the experimental error would be constituted by the variations inresponse to repeated tests with the same dose of histamine. In thepresent experiment, involving grouping, determination of the experi-mental error is somewhat more complex.
Fig. 3 a shows that the mean 'group' response varies considerably inthe course of the experiment, indicating marked changes in the sensi-tivity of the preparation. The effect of these variations in sensitivity hasbeen largely eliminated from the experimental comparisons by themethod of grouping which ensures that each dose is given at variouslevels of sensitivity and thus provides a well-balanced mean estimate foreach dose. It is essential, however, that the differences between groupsshould be eliminated not only from the experimental comparison but alsofrom the estimate of error, by the methods of the analysis of variancedescribed in the following section. As a result, the estimate of the experi-mental error is reduced to the same value as if the mean sensitivity ofgroups had not changed in the course of the experiment. This is illus-trated by Figs. 3 c and 3d. The former shows the varying effects producedin the course of the assay by the same dose of histamine, the latter thesame effects after eliminating the variations between groups. The ad-justed effects are much more homogeneous and show a marked reductionof the variation ascribable to experimental error.
) by guest on February 4, 2014jp.physoc.orgDownloaded from J Physiol (

120 H. 0. SCHILD
Having thus reduced the experimental error, the next step consistsin extracting the maximum amount of useful information from con-
mrr nmm74
a
54
41
34
21
14
0C)
4l-I00.4Q
61
54
44
34
24
1. a b
,ADC B1 D B AvADBCuDt C_A, BAD (X(B)(C)(DA ~ ~ ~ ~ ~ ~~~=0C5u Unnon
3 r I~~~~~~~C0-2I I~~~=0- tadad
3 I~~~~~~D0-
I I~~~~~
6C
5C
2a
la
Fig. 3. Data from same experiment as in Fig. 2.Fig. 3a. Order of tests and height of responses. Crosses indicate the mean response in
successive groups.Fig. 3b. Mean response to two doses of 'standard' and two doses of 'unknown'.Fig. 3e. Successive responses to the same dose of histamine.Fig. 3d. Values from Fig. 3b corrected. to represent the effects that would have been
obtained if the mean sensitivity of groups had not changed in the course of the assay.
trasting the mean effects of the four. doses as presented in Fig. 2 b.Three 'independent comparisons' can be made, and the significance
) by guest on February 4, 2014jp.physoc.orgDownloaded from J Physiol (

BIOLOGICAL ASSAYS ON ISOLATED PREPARATIONS 121
of each contrast may be assessed by relating it to the experimentalerror.
The effects of the two doses of the standard may be contrasted as agroup with those of the two doses of the unknown.- If variation betweenthe two groups is significantly greater than the experimental error, it maybe concluded without further assumptions that the two solutions differin activity.
Secondly, the effects of the larger doses of both standard and unknownmay be contrasted with those of the smaller doses. This is, in fact, a testfor regression, since unless the larger dose produces a significantly greatereffect than the smaller dose, no estimate of the regression coefficient andconsequently no quantitative estimate of activity can be made.
Lastly, the sum of the effects of the larger dose of the standard andthe smaller dose of the unknown may be contrasted with the sum of theother two effects. This test is a measure of parallelism, since if the twosums are equal the regression lines must be parallel. It cannot, of course,be expected, owing to chance variations, that the mean regression linesof standard and unknown should be perfectly parallel. If, however, thedeviations from parallelism are significantly greater than the experi-mental error great caution must be used in the interpretation of results.
The analysis of varianceThe analysis of variance is 'a simple arithmetical procedure by means
of which the results may be arranged and presented in a single compacttable, which shows both the structure of the experiment and the relevantresults in such a way as to facilitate the necessary tests of their signi-ficance' [Fisher, 1937]. It is essential, with the present method of assay,to compute an analysis of variance for each experiment, since it providesthe error component for determining the limits ofaccuracy ofthe assay andleads to the various tests of significance outlined in the preceding section.
A typical analysis of variance computed from the data of the hista-mine assay previously quoted is shown in Table 2. The variate (Table 1)is the recorded maximum height of contraction produced by the additionof 1 c.c. of histamine solution to the bath. Table 2 shows that in theanalysis five distinct sources of variation have been isolated. For eachsource of variation an expression called the sum of squares (of deviationsfrom the mean) is computed, which divided by the appropriate degrees offreedom (df) yields a mean square. The ratio of two mean squares in con-junction with the degrees of freedom from which they are derived affordsa test of significance.
) by guest on February 4, 2014jp.physoc.orgDownloaded from J Physiol (

H. 0. SCHILD
TABLE 1. Effects of four doses of histamine applied in fivesuccessive randomized groups
Height of response in i mm.Groups
Dose 1 2 3 4 5 Sum0-25 jig. (U1) 131 132 136 112 106 6170-2 ug. (S1) 122 122 118 110 98 5700125 jig. (U2) 103 104 87 74 73 4410.1 sg. (SA) 89 92 84 66 50 381
Sum 445 450 425 362 327 2009
TABLE 2. Analysis of variance of histamine assay
Degrees ofSource of variation Sum of squares freedom Mean square
Between groups 2976-7 4 744-18*Between 'standard' and 'unknown' 572-45 1 572-45*Regression 6661-25 1 6661.25*Deviation from parallelism 8-45 1 8-45Error 330*1 12 27-51Total 10548*95 19
* Highly significant.
The computations leading to the test of significance will be brieflydescribed. The computational scheme is adapted from Snedecor (1938).
Given that S1, S2, ..., SN =each sum of items in a group of four re-sponses (sum of each column of Table 1), and S= SI +S2+ ... +SN thefollowing items are computed and then summarized as shown in Table 2:
(1) The correction term = C =S2/4N- 20092/4 (5) = 201804'05.(2) The sum of the squares of all items
=S(X2) = 1312+ ... +502= 212353.(3) The 'total'sUm ofsquares
= S(X2) -C= 212353 - 201804-05= 10548-95.(4) The sum of squares for groups=(S21+S22+ ... +S2N)/4_C=(4452+
+ 3272)/4 - 201804*05 = 2976-7;and the corresponding mean square by division by (N-1), the cor-responding degrees of freedom: 2976-7/(5 -1) = 744 175.
(5) The sum of squares for(a) variation between standard and unknown
=A2/4N= (617 + 441-570-381)2/4 (5) = 572-45;(b) regression
=B2/4N= (617 + 570-441 -381)2/4 (5) = 6661-25;
122
) by guest on February 4, 2014jp.physoc.orgDownloaded from J Physiol (
BIOLOGICAL ASSA YS ON ISOLATED PREPARATIONS 123
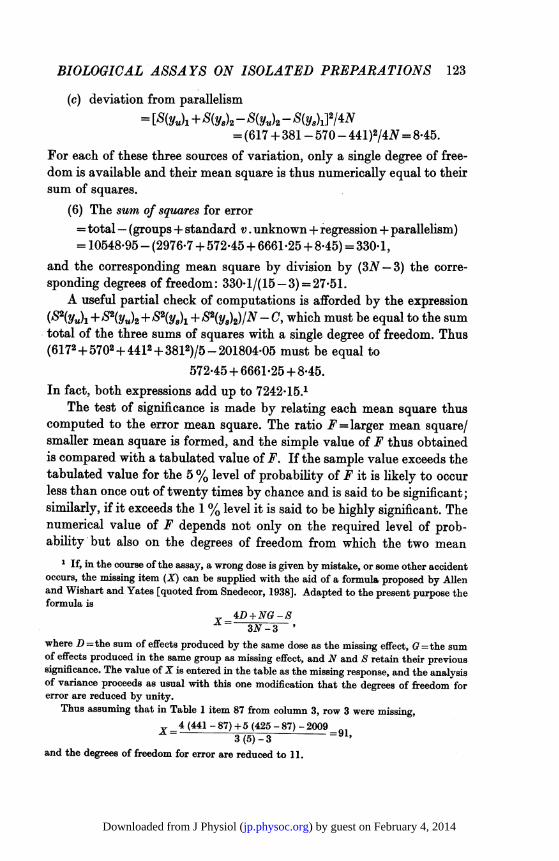
(c) deviation from parallelism= [S(Yu)l + S(YS)2 - S(Yu)2 - S(y8)1]2/4N
= (617 + 381 -570 - 441)2/4N= 8*45.For each of these three sources of variation, only a single degree of free-dom is available and their mean square is thus numerically equal to theirsum of squares.
(6) The sum of squares for error= total - (groups + standard v . unknown+ regression + parallelism)= 10548-95 - (2976.7 + 572-45 + 6661*25 + 8.45) = 330-1,
and the corresponding mean square by division by (3N -3) the corre-sponding degrees of freedom: 330.1/(15 -3) = 27-51.
A useful partial check of computations is afforded by the expression(S2(yu), + 52(Yu)2 + S2(y8), + S2(y8)2)N- C, which must be equal to the sumtotal of the three sums of squares with a single degree of freedom. Thus(6172+ 5702 + 4412+ 3812)/5 - 201804*05 must be equal to
572-45 + 6661*25 + 8*45.In fact, both expressions add up to 7242-15.1
The test of significance is made by relating each mean square thuscomputed to the error mean square. The ratio F=larger mean square/smaller mean square is formed, and the simple value of F thus obtainedis compared with a tabulated value of F. If the sample value exceeds thetabulated value for the 5% level of probability of F it is likely to occurless than once out of twenty times by chance and is said to be significant;similarly, if it exceeds the 1 % level it is said to be highly significant. Thenumerical value of F depends not only on the required level of prob-ability but also on the degrees of freedom from which the two mean
1 If, in the course of the assay, a wrong dose is given by mistake, or some other accidentoccurs, the missing item (X) can be supplied with the aid of a formula proposed by Allenand Wishart and Yates [quoted from Snedecor, 1938]. Adapted to the present purpose theformula is
4D+NG -S3N-3
where D =the sum of effects produced by the same dose as the missing effect, G =the sumof effects produced in the same group as missing effect, and N and S retain their previoussignificance. The value ofX is entered in the table as the missing response, and the analysisof variance proceeds as usual with this one modification that the degrees of freedom forerror are reduced by unity.
Thus assuming that in Table 1 item 87 from column 3, row 3 were missing,
X-4 (441 - 87) + 5 (425 - 87) - 20093 (5)_3391,
and the degrees of freedom for error are reduced to 11.
) by guest on February 4, 2014jp.physoc.orgDownloaded from J Physiol (

1H. 0. SCHILD
squares forming F are derived. Thus if it is desired to find the value ofF derived from n1 and n2 degrees of freedom for a given level of prob-ability, the appropriate table of F by Snedecor [1938] (or the corre-sponding table of e2z by Fisher & Yates [1938]) is entered at the columnheaded df= nl, and the required value is found at the row headed df= n2.
The analysis of variance in Table 2 yields the following F-values:572-45
F for variation between standard and unknown = 257- = 20-81 (the1 % point of F for n1 = ldf and n2 12df is 9.33).
F for regression= 2651 =242-13 (1% point of F=9-33).27-51F for deviations from parallelism= 8-45 = 3-26 (the 5% point of F
for n= 12df and n2= ldf is 243-9).F for groups-=~74418=27O05 (the 1% point of F for n1=4df and
n2= 12df is 5-41).It may be concluded that there is a highly significant difference in
activity between standard and unknown, and a highly significant re-gression between the smaller and the larger dose, making a quantitativeestimate of activity possible. Deviations from parallelism are veryslight, in fact the corresponding mean square is smaller than the errormean square, though not significantly smaller. Lastly, the high F valuefor groups is a justification of the experimental design, showing as it doeshighly significant variations between groups.
The limits of error of the estimate ofMsM, the standard error of M= (Yu- ,)/b, may be computed from the
expressionSM=2ad>/N V(A2+ B2)
B2
where a is the square root of the error mean square in the analysis ofvariance, and the other terms retain their previous significance. Theformula is derived on the assumption that Yu-y. and b are uncorrelated.
The standard error of a quotient whose numerator and denominator are uncorrelated is
8XIV= /81 +8 ),
If Yu - y =A/2N, b =B/2Nd, %(u_-i8) = a/IN and 8b = a/JN d, the above expression for 8Mis obtained. It is equivalent to that given by Bliss & Marks [1939b].
The P 0-99 limits of error of the assay are constituted by M + sA t.The value of t in this expression is obtained from a table of t [Fisher,
1938] for the 1 % level of significance and (3N -3) degrees of freedom,the same number as for error in the analysis of variance.
124
) by guest on February 4, 2014jp.physoc.orgDownloaded from J Physiol (

BIOLOGICAL ASSAYS ON ISOLATED PREPARATIONS 125
In the numerical exampleA 107M=B d=3 x 0-30103=0-08825
and SM = 2 4(27.51) x 0-30103 x 45 x V(1O7 3652 - 0-02016.
Since the value of t for the 1% level and 12df is 3-055,M-3-055sM = 0-02666 and M+ 3-055sM = 0-14984
constitute the P 0-99 limits of error of the assay. Taking the antilogarithmof these numbers and multiplying by 100 the estimate of activity is122-6 %, and the limits of error are 106-3 and 141-2 %. The true activity,125 %, is well within the computed limits of error.'
In interpreting the expression for SM it might profitably be trans-formed to
SM=VN b -2d + )
In this expression the ratio a/b is an absolute measure of the vari-ability of the preparation. Provided it remains constant the standarderror diminishes with the square root of N, the number of groups in theassay. There are thus two factors limiting the accuracy obtainable. Oneis the total number of responses that can be elicited, and the other is theconstancy of the preparation. If towards the end of an experiment thevariability of the preparation increases, any further prolonging of theassay may well increase rather than decrease sM-
SM is reduced by any decrease in the value of the quotient Mld. Inpractice, provided that M/d is not greater than 0-5, any further reductionof the ratio will not markedly alter the value of SM.
The following relationship exists between the limits of error for M as derived from 8M,and the variance ratio test (F test) assessing the significance of the difference betweenstandard and unknown. When M = 0 the result of the two tests is identical, when, however,M>0 the F test is more discriminating. This is due to the fact that the F test is notaffected by variations in the slope of the regression line.
1 Dr I. 0. Irwin has pointed out to me that these limits of error are only approximatesince the t distribution is not strictly applicable to 8M in view of the error in b. He suggestscomputing the exact fiducial limits from an expression equivalent in our notation to
ABd 2 atd 4[N(A2 + B2 - R)1B2R~RB2 -R [A+B-)]
where R=4t2a2N, and the other terms retain their previous significance. Derivations ofsimilar expressions will be found in Bliss [1935] and Fieller [1940]. It will be seen that theformula differs from the previous one by the introduction of the term (R). In our examplethe two methods yield almost identical results, the fiducial limits by the above formulaworking out at 106-9 and 142-7 %, but more important differences may arise if the slope isnot well determined.
) by guest on February 4, 2014jp.physoc.orgDownloaded from J Physiol (
H. 0. SCHILD
ASSAYS WITH SOLUTIONS OF KNOWN COMPOSITION
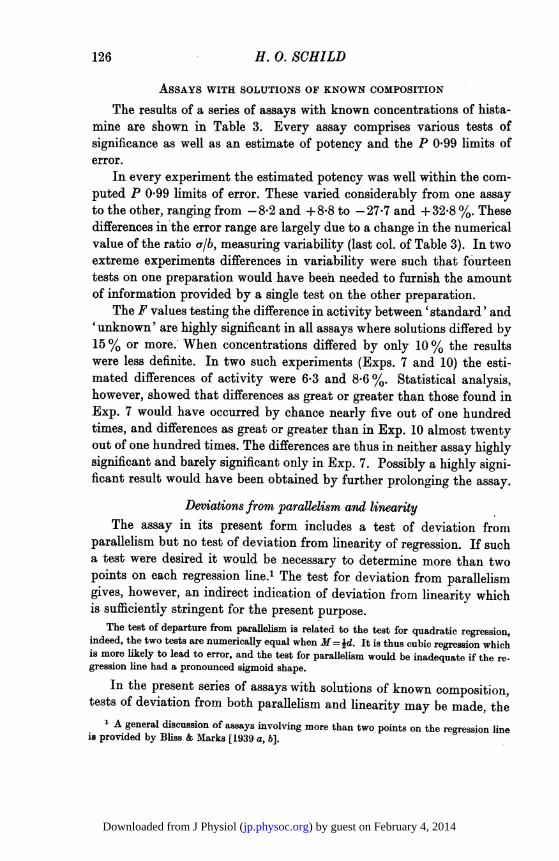
The results of a series of assays with known concentrations of hista-mine are shown in Table 3. Every assay comprises various tests ofsignificance as well as an estimate of potency and the P 0 99 limits oferror.
In every experiment the estimated potency was well within the com-puted P 0*99 limits of error. These varied considerably from one assayto the other, ranging from - 82 and + 8*8 to - 27-7 and + 32-8 %. Thesedifferences in'the error range are largely due to a change in the numericalvalue of the ratio a/b, measuring variability (last col. of Table 3). In twoextreme experiments differences in variability were such that fourteentests on one preparation would have been needed to furnish the amountof information provided by a single test on the other preparation.
The F values testing the difference in activity between 'standard' and'unknown' are highly significant in all assays where solutions differed by15 % or more. When concentrations differed by only 10% the resultswere less definite. In two such experiments (Exps. 7 and 10) the esti-mated differences of activity were 6-3 and 8-6 %. Statistical analysis,however, showed that differences as great or greater than those found inExp. 7 would have occurred by chance nearly five out of one hundredtimes, and differences as great or greater than in Exp. 10 almost twentyout of one hundred times. The differences are thus in neither assay highlysignificant and barely significant only in Exp. 7. Possibly a highly signi-ficant result would have been obtained by further prolonging the assay.
Deviations from parallelism and linearityThe assay in its present form includes a test of deviation from
parallelism but no test of deviation from linearity of regression. If sucha test were desired it would be necessary to determine more than twopoints on each regression line.' The test for deviation from parallelismgives, however, an indirect indication of deviation from linearity whichis sufficiently stringent for the present purpose.
The test of departure from parallelism is related to the test for quadratic regression,indeed, the two tests are numerically equal when M =jd. It is thus cubic regression whichis more likely to lead to error, and the test for parallelism would be inadequate if the re-gression line had a pronounced sigmoid shape.
In the present series of assays with solutions of known composition,tests of deviation from both parallelism and linearity may be made, the
1 A general discussion of assays involving more than two points on the regression lineis provided by Bliss & Marks [1939 a, b].
126
) by guest on February 4, 2014jp.physoc.orgDownloaded from J Physiol (

BIOLOGICAL ASSAYS ON ISOLATED PREPARATIONS 127
t0 m m 3 co cq cq N aije 0 aq co (M> sO ci to
OO° ° 0O 0 O O O10 0 04 04 CO 0410
0 r co
co-@ " aqco 19 . -
aqO~_ > _
PoO0¢ 0
iCD . .
CBCo
Co
Ct o Co
00
Q4
CO
CB04
0
40 CoO 04
lq 0CO " 00 -
r-4-4P-- P-4 P- -4
Z oo oooo oo
c+4.
0
O 0 10 10 0O O O
o c -:c-
10
CO 6 co o qC0 q q qco cO CO CO cO cO cO
4 Cl C4 Ce o _4_4_4_4.4
cClo CIO,0N. ce 11 10 e r- oo (01 o -
"- _-
$3I'*r-
0
00
0
._
0
0
0
CD
*0
*0
04
44Pa
22¢-.
:0PlEq
0
to0
* C
o S)
14
too
0 ,
2A°
toN
IDq
0
110H
*1 +-4-+
) by guest on February 4, 2014jp.physoc.orgDownloaded from J Physiol (

128 H. 0. SCHILD
latter by treating the two doses of 'standard' and 'unknown' as forminga sequence of four different concentrations of the same solution. Suchtests are presented in Table 4. The test of departure from linear regressionwas done according to standard methods [Snedecor, 1938, p. 317].
TABLE 4. Deviations from parallelism and linearityF for deviations F for deviations
from from 5% level 1% levelExp. no. parallelism linearity of F of F
1 0 03 1*55 4-322 30-85 31-40 5 99 13-743 1-45 3-81 4-324 1-06 1-58 5-125 0-31 0-77 4-756 0.05 0-67 4.757 0-29 1-69 4*228 3-81 4-76 5.999 9-23 9-26 4-54 8-6810 036 0-71 4-5411 , 0.95 2-30 6-61
Only in two experiments of the series (Exps. 2 and 9) deviations fromparallelism occurred, and in both instances they were associated withsignificant deviations from linearity. In the rest of the assays there wereno significant deviations from either. Thus in all experiments except twothere was no reason to assume that the regression lines differed fromlinearity within the range of the experiment. Possible reasons for de-parture from linearity were in one experiment the use of a frontal writinglever at a high angle of excursion, and in the other the application of adose producing an effect greater than 90% of the maximum.
Tentative estimates of potency in these experiments, treating dataas if regression were linear, gave results which were surprisingly close tothe true value. This suggests that the assay is relatively insensitive todeviations from parallelism.
Besides non-linearity of regression various other factors may causedeviation from parallelism, such as differential deterioration of histamineduring the period of assay,' failure to dilute standard and unknownequally in preparing the second dose of each and possibly qualitativedifferences between standard and unknown.
The effect of groupingAn indication of the importance of eliminating gradual changes in
sensitivity taking place in the course of the assay is provided by theF value for groups as computed in the analysis of variance. Table 5 shows
1 This is probably due to bacterial action and may be prevented by boiling up solutionsbriefly.
) by guest on February 4, 2014jp.physoc.orgDownloaded from J Physiol (

BIOLOGICAL ASSAYS ON ISOLATED PREPARATIONS 129
TABLE 5. Significance of variations between groups
Degrees offreedom
F Msq. for groups J 5% level 1% levelExp. no. M.sq. for error n1 n2 of F of F
1 16-03 7 21 * 249 3-652* 4.28 3 6 4-76 9*783 2.37 7 21 2-49 3*654 10-40 3 9 3-86 6*995 27*05 4 12 3-26 5-416 2-06 4 12 3*26 5-417 2.40 9 26 2*27 3-178 12*69 2 6 5-14 10*929 2.94 5 15 2-90 4-5610 1-25 5 15 2*90 4-56lit 34*17 2 5 5.79 13.27
* Latin square arrangement.t A somewhat longer time interval occurred between the first and second group.
that in the majority of experiments this value is significant, proving thatthe variations in sensitivity are real. The direction of these changes isillustrated in Fig. 4, which comprises all the significant results. Perhapsthe most common feature is an initial rise in sensitivity followed by agradual decrease.
100
Exp. I Exp. S Exp. 8 Exp. II
80 Exp. 4 Exp. 7 Exp. 9Fig. 4. Mean response in successive 'groups' in terms of maximum response.
In spite of irregularities a slight linear trend is usually discernible, and it is possible thata further, reduction of the experimental error could be effected by other restrictions indesign or the analysis of covariance. In one experiment (Exp. 2) in which a Latin squarearrangement was used in order to equalize the order of tests within groups a substantialmean square was segregated for 'order of injections'. When, however, two further 4 x 4-squares were appended in the same experiment (this part of the assay has been omitted inthe text since some errors occurred) the mean square for order of injections became lessthan the error mean square.
Independence of -Y and bIn deriving the expression for sM, the standard error of the ratio
(Yu-Y)b=M, it was assumed that numerator and denominator of thefraction are independent. This assumption holds only if the slope of the
PH. CI. 9
) by guest on February 4, 2014jp.physoc.orgDownloaded from J Physiol (

H. 0. SCHILD
regression line does not alter in the course of the assay, since any realvariation, as distinct from sampling variation, of the slope entails corre-sponding variations of the differences between effects. If the slope variedthere should thus be significant correlation between mean difference ofeffects and slope in successive groups, or between successive values of(Yu)l + (Yu)2-(Y - (Ys)2 and (yu),+ (Ys)l-(Yu)2- (Ys)2.
The strength of this correlation has been measured in each assay.In no instance did the correlation coefficient attain the 5% level,of sig-nificance. When the correlation coefficients from all assays (exceptExps. 2, 4 and 11) were pooled by means of the z transformation (Fisher,1938) for 31 degrees of freedom, a non-significant negative correlation ofr=-0048 was obtained. On the available evidence there is thus noreason to assume that Yu-Y8 and b are correlated or that a change ofslope of the regression line occurs in the course of the assay.
SUMMARY1. A method is described for conducting a biological assay on an
isolated preparation in such a way that a null hypothesis may be ade-quately tested and the error of the assay may be estimated from the dataof the experiment itself.
2. The method is applicable in its present form, if there is a linearrelationship between log dose and effect over a given range, and if theslope of the regression line does not alter in the course of the experiment.
3. The method has been applied to the assay of histamine on theguinea-pig's intestine. In assays with solutions of known composition theP 0 99 limits of error ranged in different experiments from - 8-2 and+8%8% to -27-7 and + 32-8 %..
I am indebted to Dr I. 0. Irwin and Prof. J. H. Gaddum for reading and criticizing themanuscript. The work was aided by a grant of the T. Smythe Hughes Medical ResearchFund.
REFERENCESBliss, C. I. [1935]. Ann. appl. Biol. 22, 134.Bliss, C. I. & Marks, H. P. [1939 a, b]. Quart. J. Pharm. 12, 82, 182.Fieller, E. C. [1940]. J. Roy. Statist. Soc. Suppl. 7, 1.Fisher, R. A. [1937]..The Design of Experiments, 2nd ed. London and Edinburgh: Oliver
and Boyd.Fisher, R. A. [1938]. Statistical Methods for Research Workers, 7th ed. Edinburgh and
London: Oliver and Boyd.Fisher, R. A. & Yates, F. [1938]. Statistical Tables. Edinburgh and London: Oliver and
Boyd.Gaddum, J. H. [1933]. Spec. Rep. Ser. Med. Res. Coun., Lond., no. 183.Snedecor, G. W. [1938]. Statistical Methods. Ames, Iowa: Collegiate Press, Inc.
130
) by guest on February 4, 2014jp.physoc.orgDownloaded from J Physiol (