pharmacokinetic issues and cns in hiv-infected patients · compound homogen csf plasma unb...
TRANSCRIPT

Pharmacokinetic Issues and CNS in
HIV-infected Patients
10th Symposium on Neuropsychiatry and HIV – Barcelona 26-28 May 2017
Andrea Calcagno
University of Torino, Italy

Outline
1. Pharmacokinetics and the CNS
– The CSF/brain PK?
– Determinants of ARVs’ passage into the CSF
– New drugs
2. PK and antiretrovirals’ efficacy in the CNS
CPE and other “scores” CSF HIV RNA/NC
ARVs’ strategiesCSF HIV RNA/NC
3. PK and Neurotoxicity?

Nightingale S, et al. Lancet Neurology 2014

Summary of PK and CSF/CNS outcomes
CSF HIV RNA < 50 copies/mL
CSF HIV RNA < 0.5-2 copies/mL
Asymptomatic CSF escape
Neuropenetration/Neuroeffectiveness
Symptomatic CSF escape
NC Function
duration of treatment
Several cofactors
LLV?
Nadir CD4, RAMs!
Several cofactors

Summary of PK and CSF/CNS outcomes
Neuropenetration/Neuroeffectiveness
Prevention of NC decline
Improvement in HAND
Several cofactors
Mechanism?

PK and the CNS

Penetrazione omogenea?
1. www.istockphoto.com 2. Williams K C et al. J Exp Med 2001.

Brain “Functional” Lymphatic Vessels
RRansohoff RM, et al. Nat Rev Immunol. 2003, Louveau et al. Nature 2015

Cerebrospinal fluid vs. brain tissue

Brain and Choroid P vs. CSF
Mallard J, et al. CROI 2017 O69

Methodological issues in measuring
CNS PK
1. Drug concentration in tissue
homogenates: average conc in different
CNS compartments preparation and
measurments
2. Microdialysis: extracellular space (but
availability and differences with different
molecules)

CSF PK Brain PK
Liu, X., et al. Drug Metab. Dispos 2009. 37:787–793.
C M
icro
dia
lisis
C M
icro
dia
lisis
C Homogenate C CSF
Compound Homogen CSF Plasma
UNB
Carbamazepine 2 1 1
Citalopram 1 1 1
Ganciclovir 2 1 14
Metoclopramide 1 1 3
Desmethylclozapine 1 1 6
Quinidine 3 2 6
Risperidone 2 2 2
9-OH-Risperidone 2 5 9
Thiopental 4 1 1

CSF PK ECF PK
Rambeck B, et al. Epilepsy 2006
22 pharmacoresistant epilepsy
patients (nine male, 13 female
patients; age 15–54 years)
with complex partial seizures
or secondarily generalized
seizures were involved.
Concentrations of
carbamazepine (CBZ), 10-
hydroxy-carbazepine (10-OH-
CZ, metabolite of oxcar-
bazepine), lamotrigine (LTG),
levetiracetam (LEV),
topiramate, or phenytoin were
determined by using one to
four catheters during IOMD in
the medial temporal gyrus.

Brain tissue concentrations
Predicted Cmax
plasma 3184 ng/mL (2219 - 485)
CSF 49.9 ng/mL (36.6 - 69.7)
brainT 50343 ng/mL (38351 - 65799)
tissue to plasma ratio = 15.8
Observed Cmax - rats
plasma 69.7 ng/mL (44.9 – 130.6)
brainT 702.9 ng/mL (475.5 - 1018)
tissue to plasma ratio = 9.5 (7-10.9)
Curley P, et al. AAC 2016

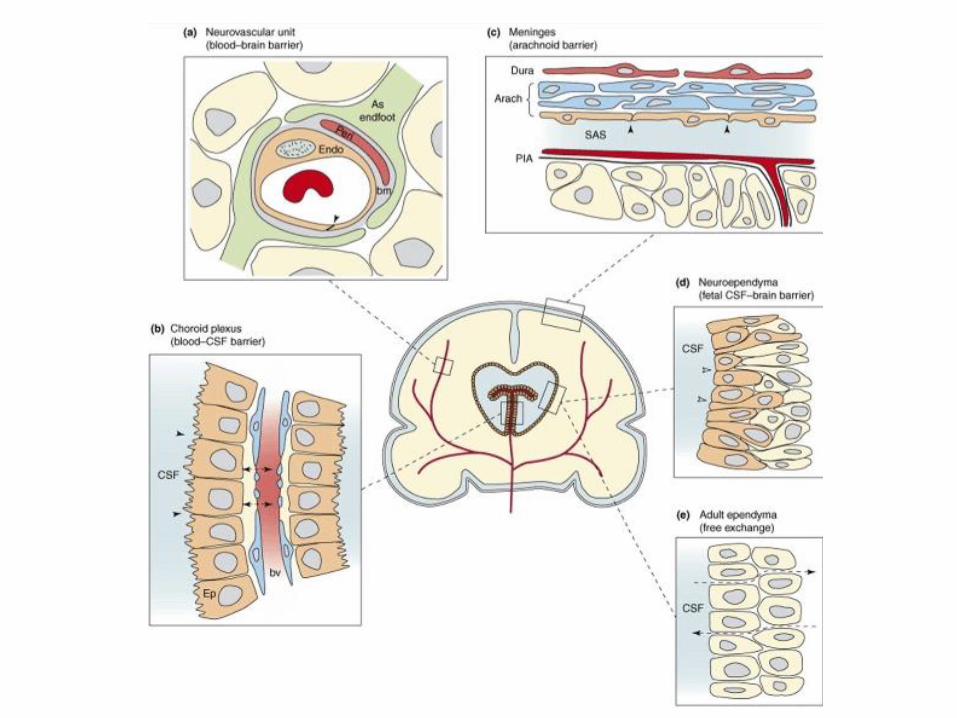
Determinants of ARVs’ passage into the CSF

mostly via the granulations (kind of valves) of the
arachnoid villi, where CSF flows into the blood. This
process is driven by the hydrostatic pressure difference
between the CSF and the cerebral veins [22, 23]. In
addition, spinal venous reabsorption of CSF has been
proven to exist [24].
Fig. 1 Production, circulation
and resorption of cerebrospinal
fluid. The production of CSF
mostly takes place in the
choroid plexus of the ventricles.
CSF circulates from the
ventricles to the subarachnoid
spaces, where resorption takes
place via the arachnoid
granulations and villi during
circulation. From Kandel and
Schwartz, Principles of Neural
Science, Elsevier Science
Publishing, NY, 1985, with
permission
Cerebral blood
Extracellular space
BCSFBBBB
Cis
tern
a M
ag
na
La
tera
l V
en
tric
les
Su
ba
rach
no
ida
l sp
ace
Ep
en
dym
a c
ell
laye
r
Cerebral blood
BCSFBBBB
Extracellular space
Brain
Cells
Lu
mb
ar
sp
ace
Fig. 2 Simplifed and schematic representation of the production, flow and elimination of brain fluids
J Pharmacokinet Pharmacodyn (2013) 40:315–326 317
123
CSF flow and exchange
2/3 CSF from plasma (UF) 1/3 from ECS
CSF production affected by •Age
•Cerebral perfusion pressure
•Drugs (diuretics) •Circadian variations
Bulk flow ECF CSF: Transport >> diffusion
CSF “sink” effect
de Lange ECM, J Pharmacokinet Pharmacodyn (2013) 40:315–326

High variability in CSF exposure
Calcagno A, et al. Clin Pharmac 2014
1
10
100
1000
10000
AB
C
FT
C
FT
C
TD
F
AZ
T
EF
V
ET
V
NV
P
RP
V
AT
V
DR
V
fAP
V
IDV
LP
V
MV
C
DG
V
RA
L
CS
F c
on
cen
trati
on
s (
ng
/mL
)
Max
Min
Median

Determinants of CSF PK
• Patient:
∆ Age (↑infants and older persons: ↓ turnover?)
∆ Meningeal inflammation
∆ CSF flow alterations
• Drug:
Ω Molecular Size
Ω Lipophilicity
Ω Plasma Protein Binding
Ω Ionization
Ω Active Transport

Age
p = .004
p = .05
p = .056
p = .64
Croteau D, et al. CROI2012

Drug
Published
Unbound
Fraction
CSF:
Plasma
Ratio Ratio
Nevirapine 40% 46% 115%
Efavirenz 0.5% 0.5% 100%
Abacavir 51% 36% 71%
Emtricitabine 96% 42% 44%
Etravirine 0,1% 4% 40%
Indinavir 40% 14% 35%
Raltegravir 17% 5.8% 34%
Darunavir 5% 1.4% 28%
Lamivudine 64% 15% 23%
Lopinavir 1-2% 0.23% 23%
Fosamprenavir 10% 1.3% 13%
Maraviroc 24% 2.9% 12%
Atazanavir 14% 1% 7%
Tenofovir 93-99% 5% 5% Used with permission, Copyright
reserved, S.Letendre
Protein binding and penetration

Nguyen A, et al. JAC 2013


BBB and CSF concentrations
Yilmaz A, et al. PlosOne 2009; Calcagno A, et al. AIDS 2011
and JAC 2013
were male except two in the resistant group. The ageswere similarin thetwo groups, but blood CD4 countswere lower in theresistantgroup. Because the HIV-1 RNA measurements in the intensifica-
tion study will be run in batch after enrollment iscompleted, theseresultsare not yet available. CSF wasgenerally non-inflammatory,though eight subjects had elevated WBC counts (seven in the
treatment group with WBC counts between 6 and 22 cells/ ml andone in the intensification group with 8 cells/ ml). Group values of
both CSF albumin and the calculated CSF:plasma albumin ratioswere mildly elevated compared to published normal values
(albumin means for 41–50 year olds 20.4 mg/ dl, SD 5.7 mg/ dland for 51–60 year olds24.2 mg/ dl mean and 7.6 mg/ dl SD; mean
albumin ratios4.6 with SD of 1.3 for 41–50 year oldsand 5.5 withSD of 1.7 for 51–60 year olds [11]). The duration of raltegravir
treatment ranged from 4 days in one subject to 88 weeks, with anoverall median of 11 weeks of treatment. The most common
accompanying antiviral drugs included two nucleoside reversetranscriptase inhibitors (NRTIs) and one protease inhibitor (PI).
Raltegravir concentrationsFigure 1 shows total CSF and plasma raltegravir concentrations
in relation to the time of sampling after the previousdose. Sampleswere obtained at time points following dosing determined by the
parent study with two sample timesextending beyond the 12 hourdosing interval (median 7.8 hours, range 1.2–14 hours). All of the
plasma raltegravir concentrations were above the detection limit
(10 ng/ ml) and the in vitro IC95 (drug concentration needed toinhibit 95% of viral replication) levels from 9.0–15.0 ng/ ml [7]
and ranged from 37 to 5180 ng/ ml (median 448 ng/ ml)(Figure 1A). Twenty-four out of 25 CSF samples had detectableraltegravir levels above the limit of detection (2.0 ng/ ml) ranging
from 2.0 to 126 ng/ ml (median 18.4 ng/ ml) (Figure 1B). Thirteenof the 25 CSF samples had raltegravir concentrations above15.0 ng/ ml, four were between the reported inhibitory concen-
trations of 9.0–15.0 ng/ ml, and eight were below 9.0 ng/ ml. TheCSF:plasma ratios for paired samples ranged from 0.01 to 0.61
(median 0.03) in those with detectable CSF raltegravir. The ratioof the estimated CSF:plasma raltegravir AUCs over the dosing
interval was0.03, thesame asthemedian of the CSF:plasma ratiosof all the paired samples with measureable CSF raltegravir.
Relation to CSF albumin concentrationsWe explored relationships between the CSF raltegravir concen-
trations and other measured variables, including the plasma
raltegravir concentrations, CSF albumin concentrations, the
CSF:plasma albumin ratios, CSF WBC counts and blood CD4+
T cells. Of these, only the related CSF albumin concentrations
(P= 0.028, Spearman’s r = 0.438) and CSF:blood albumin ratios
(P= 0.008, Spearman’sr = 0.517) weresignificant. In Figure1B the
symbol size varies according to the subjects’ albumin ratios at the
time of sampling, allowing direct visualization of the CSF
concentrations in the context of the given albumin ratio ranges.
One of the subjects had three LPs during the course of her
illness and appears to illustrate the effect of altered BBB
permeability on CSF raltegravir levels (Figure 2). This patient
was 22 years old when she presented with multiple cerebral
Mycobacterium aviumbrain abscess. She had previously been treated
with several antiretroviral medications and her virus was
multiresistant. Hence, raltegravir was included in her regimen
which was started at diagnosis, along with treatment of her
mycobacterial infection with rifabutin, azithromycine and etham-
butol. She responded very well to these treatments. As shown in
Figure 2A, her initial CSF raltegravir was relatively high (105 ng/
ml), while the subsequent levelswere lower (31.8 and 23.5 ng/ ml).
This variation in drug concentrations did not correlate with
changes in plasma raltegravir levels (Figure 2B), despite all 3
samplingsbeing taken at a similar, relatively late time in thedosing
interval (8.5–10 hours). By contrast, the pattern of reduction in the
high baseline CSF:plasma albumin ratio (Figure 2C) and CSF
albumin concentration (Figure 2D) paralleled the CSF raltegravir
concentration, suggesting that the lower CSF drug concentration
was related to restoration of the BBB/ BCB as the patient
recovered clinically with reduction of plasma and CSF HIV-1
RNA levels (Figure 2E) and rapid increase in blood CD4+ T cells
(Figure 2F), along with overall clinical improvement.
Discussion
While detected in all but one subject, total (i.e. bound and
unbound) raltegravir CSF concentrations were considerably less
than those of plasma, overall estimated at about three percent.
Figure 1. Raltegravir concentrat ions in plasma (A) and CSF (B) in relat ion to the t ime after the previous dose. Results for individualsubject evaluations and repeat subject evaluations are indicated by the matching color of squares (plasma) and circles (CSF) coded for each subject.A: The horizontal grey fill plots IC95 range of 9.0–15.0 ng/ml, while the lower dashed horizontal line within this zone shows the lower limit ofquantitation (LLQ) for plasma of 10.0 ng/ml. B: The one CSF measurement of raltegravir below the LLQ is plotted as if equal to 1.9 ng/ml (orangecircle). The size of the symbols in B. also varies with the CSF:albumin ratios at the time of sampling as shown by the grey circles in the key: the largestcircles show the one sample with ratio . 10, the next largest the 5 samples for albumin ratios from 7.5–10, the next the 10 samples with ratios from 5–7.4, and the smallest the 9 samples for ratios , 5. The dashed horizontal line within this zone shows the LLQ for CSF of 2.0 ng/ml.doi:10.1371/journal.pone.0006877.g001
CSF Raltegravir
PLoS ONE | www.plosone.org 3 September 2009 | Volume 4 | Issue 9 | e6877
RAL
TFV FTC

Transporters at the BBB and BCB
Chan GNY, et al. Trends in Pharmacological Sciences 2013

PG and CSF concentrations
Wyen C, et al. JAC 2011, Calcagno A, et al. AIDS 2012 and JAC 2013
AA AG AA AG0
50
100
150
Daru
navir
CS
F c
on
cen
trati
on
(n
g/m
l)
OD TD
OATP1A2 38 A>G
2.75 ng/ml
25
10
0
5
10
15
20
25
30
RAL CSF RAL ratio
HNF4 613 CC HNF4 613 CG
27%
12%
EFV RAL DRV/r
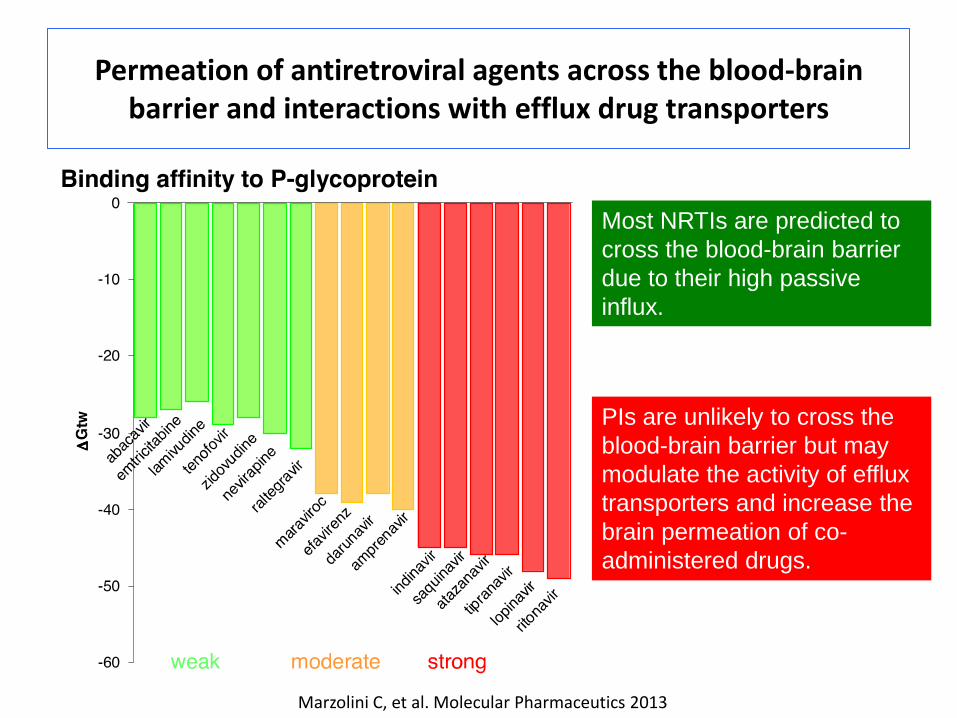
Marzolini C, et al. Molecular Pharmaceutics 2013
Permeation of antiretroviral agents across the blood-brain barrier and interactions with efflux drug transporters
PIs are unlikely to cross the
blood-brain barrier but may
modulate the activity of efflux
transporters and increase the
brain permeation of co-
administered drugs.
Most NRTIs are predicted to
cross the blood-brain barrier
due to their high passive
influx.

PgP in MS and temporal lobe epilepsy
Kooij G, et al. Journal of Autoimmunity 2010; Feldmann M, et al. Lancet Neurol 2013
Loss of
vascular P-gp
expression in
MS lesions
Increased
expression of
P-gp in
hypertrophic
GFAP-positive
astrocytes

Inflammation and cART

Inflammation and cART
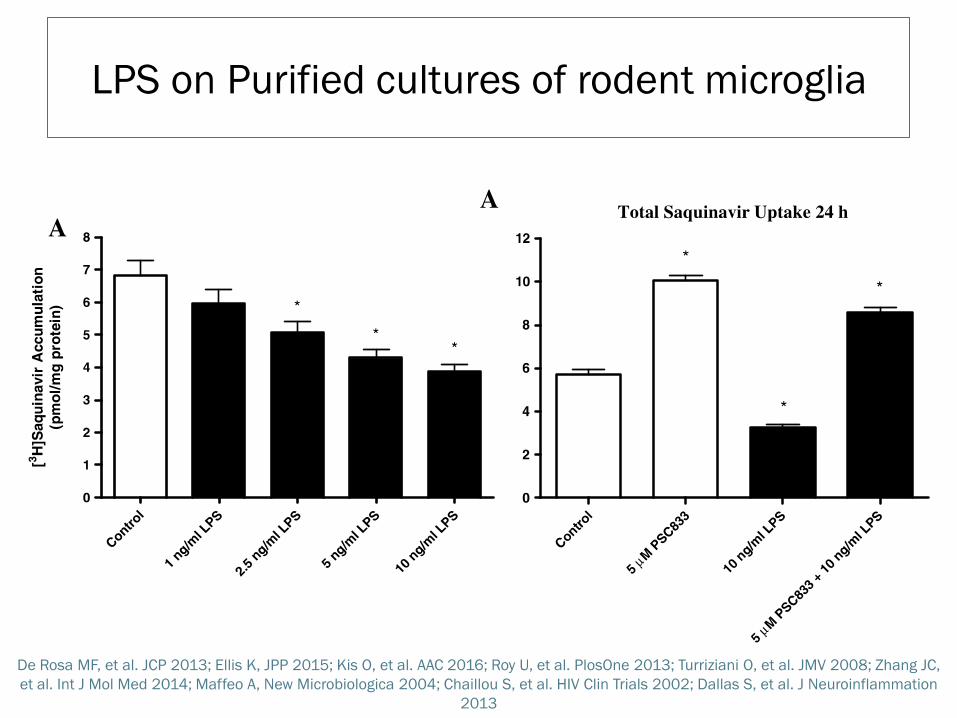
De Rosa MF, et al. JCP 2013; Ellis K, JPP 2015; Kis O, et al. AAC 2016; Roy U, et al. PlosOne 2013; Turriziani O, et al. JMV 2008; Zhang JC,
et al. Int J Mol Med 2014; Maffeo A, New Microbiologica 2004; Chaillou S, et al. HIV Clin Trials 2002; Dallas S, et al. J Neuroinflammation
2013
LPS on Purified cultures of rodent microglia

Determinants of PI CSF to plasma ratios
n=137 (79 DRV/r, 31 ATV/r e 27 LPV/r)
Multivariate linear regression analysis adjusted for
age, CSAR, time after dose and ABCB1 3435C>T
Age (p=0.01) and CSF neopterin (p=0.05)
Scarvaglieri E, et al. In preparation

New drugs
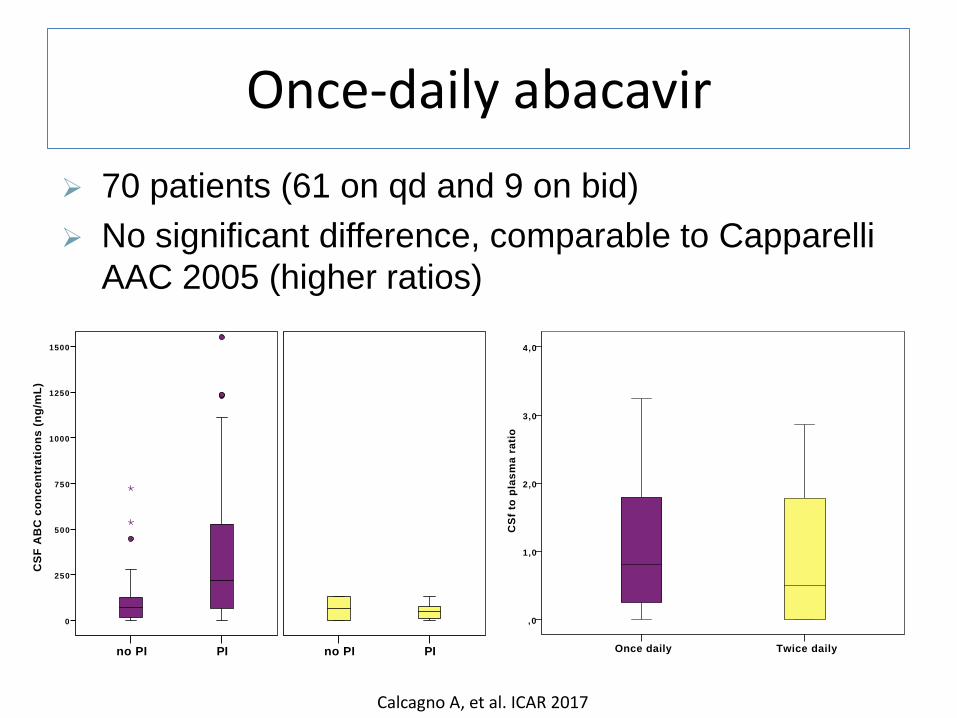
Once-daily abacavir
Calcagno A, et al. ICAR 2017
&[TitoloPagina]
Twice dailyOnce daily
CS
f to
pla
sm
a r
ati
o
4,0
3,0
2,0
1,0
,0
Pagina 1
&[TitoloPagina]
Time after dose (hours)
2 52 01 51 050
CS
F A
BC
co
cn
ce
ntr
ati
on
s (
ng
/mL
)
800
600
400
200
0
Twice daily
Once daily
Pagina 1
&[TitoloPagina]
PIno PI
CS
F A
BC
co
nc
en
tra
tio
ns
(n
g/m
L)
1500
1250
1000
750
500
250
0
PIno PI
21
Pagina 1
70 patients (61 on qd and 9 on bid)
No significant difference, comparable to Capparelli
AAC 2005 (higher ratios)

Rilpivirine
Mora-Peris B, et al. JAC 2014
• 13 patients • from NVP-containing
regimens • ratio= 1.4% • CSF PK correlated
with plasma PK and glucose/protein CSF levels
• No changes in cerebral metabolites

Dolutegravir
Letendre S, et al. CID 2014
• 12 patients • naive • DGV + ABC/3TC
• ratio 0.51% • at week 16 all patients had a CSF VL<50
copies/mL

Elvitegravir
Time
(hours)
Elvitegravir Cobicistat
plasma
(ng/mL)
CSF
(ng/mL) ratio
plasma
(ng/mL)
CSF
(ng/mL) ratio
Patient A 14 1389 11.7 0.0084 344 8.4 0.0244
Patient B 24 676 2.4 0.0035 38 5.8 0.1526
Patient C 24 1197 4.8 0.0040 23 7.3 0.3174
Fig.1 Elvitegravir and cobicistat concentrations in plasma (circles) and cerebrospinal fluid (triangles). The graph is semi-logaritmic (Log10 of elvitegravir concentrations on the y axis).
Dotted lines represent elvitegravir in vitro 50% effective concentration (EC50, 3.9 ng/mL) and 90%
effective concentration (EC90, 54 ng/mL). “CSF”, cerebrospinal fluid.
1
10
100
1000
10000
4 8 12 16 20 24 28
Elv
ite
gra
vir
co
nce
ntr
ati
on
s(L
og
10
ng
/m
L)
Timeafterdrugintake(hours)
Calcagno A, et al. AIDS Res and Human Retrov 2016

TAF
Lee
WA
, et
al. A
AC
20
05

RTV vs. COBI in the CSF? &[TitoloPagina]
Time after dose (hours)
302520151050
CS
F B
oo
ste
r c
on
en
tra
tio
ns
(n
g/m
L)
30
25
20
15
10
5
0
COBI
RTV
Pagina 1

DRV/cobi vs. DRV/r n=7
0
5
10
15
20
25
30
35
RTV COBI
DR
V C
SF c
on
cen
trat
ion
s (n
g/m
L)
Bertels H, et al. PK Workshop 2017
0
0,002
0,004
0,006
0,008
0,01
0,012
0,014
0,016
RTV COBI
DR
V C
SF t
o p
lasm
a ra
tio
s

PK and Antiretrovirals’ efficacy in the CNS

Symptomatic CSF escape
Two case series and few case reports
n=30
Canestri A, et al. CID 2010; Peluso MJ, et al. AIDS 2012; Wendel KA, et al. CID 2003; Bogoch II, et al. J Infect 2011;
Binhgam MR, et al. J Int AIDS Soc 2011; Khouri MN, et al. JNV 2013; Imaz A, AIDS Res and Human Retrov 2014; Beguelin
C, J Int AIDS Soc 2014, Spudich S. Curr Opin HIV/AIDS 2016.
• Acute neurological symptoms
• Resistance associated
mutations
• MRI alterations
• Strong immune response
• Reversibility

Symptomatic CSF escape - India
• 1427 HIV+ patients in India
• 6 months of ART and HIV RNA <1000 copies/mL
• 9.7% with neurological disease at baseline
• Median ART duration 66 months (36-105)
• 79.4% on NNRTIs and 19.8% on PIs
• gait ataxia and tremolousness
31 cases of incident neurological disorders with
20 patients with HIV-encephalitis
Dravid A, HIV Drug Therapy 2016 #214

Symptomatic CSF escape – India (2)
First line EFV, HIV RNA once a year, HAART change to PI/r
(mostly ATV/r) with recycled NRTIs, very low CD4 nadir
Dravid A, HIV Drug Therapy 2016 #214
Pt ART regimen CSF RAMs
NRTI NNRTI PI INI
4 AZT/3TC + LPV/r D67N, K70R, L74I,
M184V, T215V, K219Q
K101E, V108I,
Y181C V82A NO
6 TDF/3TC + ATV/r M41L, D67N, T69N, K70R,
M184V, T215V, K219E
K101E,
Y181C, H221Y I50L NO
10 AZT/3TC/TDF + ATV/r D67N, T69N, K70R,
Q151M, M184V, T215V,
K219E
K101E, V108I,
Y181C, H221Y I50L NO
11 TDF/FTC + ATV/r D67N, T69N, K70R,
M184V, T215V, K219E K103S, G190A M46I NO
12 TDF/FTC + ATV/r M184I K103N NO NO
15 RAL + LPV/r M41L, M184V, T215Y, K103N,
P225H, K238T V82A N155H
16 TDF/FTC + ATV/r K65R, M184V V179O,
Y181C, Y188L NO NO

Longitudinal - Eden Acc
epte
d M
anus
crip
t
13
Figure 1. Overview of study CSF samples
CSF samples were collected longitudinally. Rows represent individual patients. Clear circles represent
CSF HIV-1 RNA <20 copies/ml (lower limit of quantification). Filled circles represent CSF samples with
HIV-1 RNA >20 copies/ml. Median number of CSF samples was 5 (IQR 3-8). Twenty-seven patients
(36%) had ≥1 CSF HIV-1 RNA >LLQ.
at Un
iversity
of T
orin
o o
n O
ctob
er 11
, 20
16
http
://jid.o
xfo
rdjo
urn
als.o
rg/
Dow
nlo
aded fro
m
1 subject with 2 consecutive CSF
VL >50
CSF VL>20 associated with CSF neopterin
but not NFL
Twenty-seven (36%) patients had ≥1 CSF-HIV-RNA >20 copies/ml (23% >50), in median 50 (IQR 32-77) copies/ml.
Eden A, et al. JID 2016

CSF low level replication &
neopterin
Eden A, et al. JID 2010; Yilmaz A, et al. JAIDS 2008; Dahl V, et al. AIDS 2014; Motta I, et al. Under review

Determinants WMA in HIV
Haddow LJ, et al. AIDS care and STDs 2014
• retrospective, cross-sectional study • 254 patients: 70% male, 53% white, mean age 42 years,
median current CD4 count 240 cells/mm3, and 41% not taking antiretroviral therapy (ART)
Diffuse WMA 32%
Small Vessel
Disease 22%
Large asymmetric
al WMA 13%
Normal 33% • Black Ethnicity
• Age • CV risk factors

WMA and CSF escape
Kugathasan R, et al. CID 2017
14,1%
6,0% 0%
10%
20%
30%
40%
50%
CSF plasma discordance (0.5 Log10 higher) CSF escape
• 163 LPs
Acute Neurology
Chronic symptoms
(NCI?)
Subacute Neurologi
cal
Missinf infos
Follow up

CPE and other scores

Studies on the CPE score
Reference n Design
CPE CSF VL
CPE NC testing Areas NC CPE cut off
Cysique et al. 37 prospective single arm lower CSF VL better 6 ≥2
Tozzi et al. 185 prospective single arm not done better 4 and 8 no
Marra et al. 26 prospective single arm lower CSF VL worse 8 ≥2
Winston et al. 30 prospective randomized not done better Cogstate no
Smurzynski et al. 2636 prospective single arm not done better >3 drugs 3 no
Arendt et al. 3883 prospective single arm lower CSF VL better 2 no
Garvey et al. 101 retrospective single arm not done no effect Cogstate no
Rourke et al. 545 prospective single arm not done better 4 ≥1.5 (2008)
Robertson et al. 860 prospective randomized not done no effect 4 no
Ciccarelli et al. 101 prospective single arm not done better 8 ≥6
Kahouadji et al. 54 prospective single arm not done worse 2 no
Ellis et al. 49 prospective randomized no effect no effect – trend
to lower 8 (2.5 vs. 1)
Vassallo et al. 246 prospective controlled not done stable or better 8 (8.1 vs. 6.9)
Baker et al. 64 prospective single arm not done no effect 4 7
Carvahal 417 prospective single arm not done better 4 no


Prospective studies
Vassallo M, et al. AIDS 2014 Force G, et al. CROI and Glasgow 2016
Gates TM, et al. AIDS 2016 Ellis R, et al. CID 2014

CSF IQ95
0%
10%
20%
30%
40%
50%
60%
70%
80%
90%
100%
> IC50 < > IC95 <
Calcagno A, et al. CID 2014 e unpublished
p=0.14 p=0.01
BID DRV/r QD DRV/r LPV/r ATV/r ATV EFV ETV RAL
0
10
20
30
40
CS
F 9
5 In
hib
tory
Qu
otie
nts

CSF IQ90 INSTIs
RAL EVG DTG
0
10
20
30
40
CS
F In
hib
ito
ry q
uo
tie
nts
90
(d
eri
ve
d f
rom
PA
EC
90
s)
n=62 n=4 n=6

Microglial Activation
Vera JH, et al. Eur J Nucl Med Mol Imaging 2017; Yilmaz A, et al. J Neuroinflammation 2013

Ex vivo efficacy
Patients’ CSF on PBMCs,
glioblastoma/astrocytoma and astrocytoma cells
• TDF/FTC+LPV/r+MVC > TDF/FTC+RPV
• CSF LPV and RPV concentrations associated
with antiviral effect and MRS changes
Mora-Perris B, et al. JAC 2015

Microglia-targeted treatment?
Shikuma C, et al. Antiviral Therapy 2012

PK and Antiretroviral strategies

CSF escape e LLV
17.5% 0-11.5%
Nightingale S, et al. JNV 2016
CSF RAMs in 5 pts in the LLV group and 6 in the clinical cohort

Fabbiani M, et al. Antiv Ther 2015

• Beclomethasone/formeterol 2 puff x 2
• Tiotropium (bromide) 2 puff
• Pregabalin 150 mg x 2
• Oxcarbamazepine 300 mg x 2
• Pantoprazole 20 mg
• Delorazepam 0.5 mg x 2
• Flumazepam 15 mg
• Methadon 125 mg (!)
• Calcium/colecalciferol 1g/d – XXVIII/w
Patient A.G.
o Atazanavir 200 mg x 2
o Raltegravir 400 mg x 2
o Ceftazidim 1g x3
o Amikacin 600 mg
o methylprednisolone 20 mgx2

Symptomatic CSF escape
CSF HIV RNA 579 copies/mL (plasma >20)
plasma PK CSF PK
ATV 54 0.9 1.7%
RAL 296 19 6.4%
Pantoprazole
lowers ATV (70-
90%)
N155H and K95Q
on CSF
RAL functional
monotherapy in
the CSF/CNS

Maraviroc effect
Souliè C, et al. JAIDS 2009; Li G-H, et al. AIDS 2015; Garvey L, et al. JAC 2012; Vera JH, et al. HIV Clin Trials 2012;
Ndhlovu LC, et al. JNV 2014
• Antiviral? CSF viruses often R5 tropic
– Astrocyte infected via CXCR4
• Protective for SIV infection in macaques
• Maraviroc intensification
– increase in MRS Naa/Cr (neuronal integrity)
– reduction in CSF CXCL10 (IP-10)
– better with higher MVC plasma conc
– Reduction in CD16+ monocytes, monocyte-associated HIV DNA and NC function

Maraviroc effect (2)
Gates TM, et al. AIDS 2016
14 virally-suppressed (blood and CSF) HIV+ males
on stable cART with recent progression to HAND
Open-label RCT of MVC-intensification
Introduction
The prevalence of HIV-associated neurocognitive
disorders (HAND) remains high despite the
introduction of combined antiretroviral therapy
(cART).This may reflect ongoing low-level viral
replication and/or chronic inflammation in the brain
There are no clear guidelines for managing HAND
in those with viral suppression in blood and CSF.
cART enhancement with maraviroc (MA) may be
one option as MA can penetrate the CNS and has
dual antiretroviral/anti-inflammatory activity
AIMS
1. To determine whether MA-enhanced cART
leads to improved neurocognition (NC) over
12 months relative to existing therapy and
generate preliminary effect sizes
2. To examine MA-related changes in major
cerebral metabolites in the frontal white
matter (FWM) and basal ganglia (BG) using
single-voxel magnetic resonance
spectroscopy (1H-MRS)
Methods
Design
12 month prospective, double observer-blinded,
open label pilot RCT
Randomization
1:1 MA-enhancement (MA arm) vs. existing cART
(control arm)
Subjects
•19 virally-suppressed (blood and CSF) HIV+ males
on stable cART with recent progression to HAND
•14 completed study (Table 1). 3 screen fails, 1
control withdrew for personal reasons, 1 control lost
to follow-up prior to 6-months
•2 MA, 1 control CXCR4-tropic; 1 control CCR5-
tropic. Data unavailable for others
Procedures
•Brief 5-domain NC battery (see Table 2) at
baseline, 6-months and 12-months
•1H-MRS study (Phillips Achieva 3T MRI; PRESS
sequence with short TE; Figure 1) at baseline and
12-months
Outcomes and Analyses
1. NC change (global z-score averaging age-
adjusted z-scores for each test) across study period
•Mixed effects regression model with fixed effects:
arm, time, arm*time interaction and subject as
random effect
2. Change in cerebral metabolites (LC-model) in
FWM and BG from baseline to 12-months
•Repeated measures ANOVA with same fixed
effects
Results
•Clinically relevant effect sizes detected in favour of
improved global NC in MA arm over time, with a
large effect at 6-months and moderate effect at 12-
months
•Glutamate concentration (a marker of
excitotoxicity) in BG was stable in MA arm but
increased in control arm at 12-months
Conclusion
•This pilot study provides feasibility, tolerability,
proof-of-concept and preliminary evidence for
clinically relevant improvement with MA-enhanced
cART in virally suppressed HAND patients
•If replicated in a larger study, these findings have
important implications for managing HAND by
supporting MA enhancement over cautious
monitoring of patients over time
Acknowledgements
ViiV Healthcare Australia provided MA and financial support through
an investigator-initiated study educational grant (Protocol#114560).
Clinicalttrials.gov ID: NCT01449006. Local ethics approval granted by
St Vincent’s Hospital HREC.
We would like to thank Prof Matthew Law for developing the
randomization program, Kirsten Moffat for providing voxel positioning
images and study coordinators Brett Sinclair, Fiona Kilkenny, and
Serena Knowles.
Corresponding author:
Prof. Bruce Brew. Dept of Neurology, St Vincent’s Hospital, Sydney,
Australia
Maraviroc-Enhanced cART Improves Cognition in Virally-
Suppressed HAND: A Pilot Study Gates TM1, Cysique LA2, Chaganti J1, Siefried KJ1,3, Brew BJ1,3
-1.4
-1.2
-1.0
-0.8
-0.6
-0.4
-0.2
Baseline 6 month 12 month
.
Glo
bal N
euroc
og
nitive
P
erfo
rm
ance
(z-sc
ore
)
6
8
10
12
14
Baseline 12 month
.
control
maraviroc
Glu
/H
2O
C
MR
Figure 2. (Left) Mean ( SE) global NC performance over time based on model least mean squares and adjusted for attrition (arm*time interaction
p<.05; 6-months: d=.77, 90%CI=-.19,1.71; 12-months: d=.55, 90%CI=-.47,1.55) (41 data-points; MA: n=27, control: n=14); (Right) Mean ( SE) change
in glutamate concentration over time (arm*time interaction: Std β=-.40, 90%CI=-.04,-.78; p<.07) (data-points: MA: n=9 pairs; control: n=4 pairs)
.
1Departments of HIV Medicine and Neurology, St Vincent’s Hospital and Peter Duncan Neurosciences Unit, St Vincent’s Centre for Applied Medical Research, Sydney, Australia 2Neurosciences Research Australia, Sydney, Australia 3Faculty of Medicine, The University of New South Wales, Sydney, Australia
Cognitive Domain Tests
Speed of information
processing
CogStateTM Detection Task
CogStateTM Identification Task
Trail Making Test – Part A
Trail-Making Test – Part B
WAIS-III Digit-Symbol Coding
Attention/working memory CogStateTM 1-Back Task
CogStateTM 2-Back Task
Motor Functioning
Grooved Pegboard – Dominant Hand
Grooved Pegboard – Non-Dominant
Hand
Verbal Learning CogStateTM International Shopping
List Task: Learning
Verbal Memory CogStateTM International Shopping
List Task: Delayed Recall
Table 2. Tests included in brief NC battery.
Figure 1. Voxel positioning for acquisition of FWM (size=20mm3; no.
acquisitions=128; Panel A) and BG (size=15mm3; no. acquisitions=64;
Panel B) spectra via PRESS (TE32/TR2000msec; 2.0kHz bandwidth).
Panel A
Panel B
Table 1. Sample Demographic and Clinical Characteristics
MA arm (n=9)
Control arm (n=5)
p
Age (years) 52.2 (3.7) 60.0 (9.4) .14 Gender (M:F) 9:0 5:0 1.0 Ethnicity Caucasian Other
9 0
5 0
1.0
Education (years) 12.3 (2.8) 11.6 (2.3) .61 Premorbid IQ
(NART errors) 102.2 (16.3) 104.4 (18.9) .83
Nadir CD4 150 (220) 310 (339) .35 Current CD4 Baseline 12 month
499 (489.5) 484 (270.5)
980 (493) 829 (574.5)
.06
.14

MVC DOSE!
trial Study drugs Virological
Efficacy
Immunologica
l efficacy
MODERN DRV/R + MVC 150 QD Inferior (stopped) equal
A4401078 ATV/R + MVC 150 QD Inferior (slightly) equal
VEMAN LPV/rR+ MVC 150 QD equal superior
Stellbrink HJ, et al. AIDS 2016; Mills A, et al. JAIDS 2013;
Nozza S, et al. Clin Micr Infe 2015; Okoli C, et al. JAC 2012;
Garvey L, et al. JAC 2012

PK and Neurotoxicity

Hategan A, et al. Nature Structural and Molecular Biology 2017

Neurotoxicity
① In vitro and in macaques neuronal toxicity
② Improvement in neurocognitive functioning at
ARVs interruption (better in EFV recipients);
③Beta amyloid metabolism interference (EFV
and PIs)
④EFV and neurocognitive disorders
⑤PIs disrupt astrocytic glutamate transporter
function and neurobehavioral performance
⑥Might be dose-dependant (EFV)
Tovar-y-Romo LB, et al. J Pharmacol Exp Ther, 2012; Robertson K, et al. JNV 2012; Akay C, et al. JNV 2014; Giunta B, et al. Mol
Brain 2011; Robertson K, et al. Neurology 2010; Achim CL, et al. J Neuroimmune Pharmacol 2009; Ortega M and Ances BM, J
Neuroimmune Pharmacol 2014; Ciccarelli N, et al. Neurology 2011; Vivithanaporn P, et al. AIDS 2016

• Fetal rat
cortical neuron
cultures
• Some degree
of functional
injury seen with
all drugs
• EFV>others>
FTC,DRV,MVC
• no additive
effect
In vitro neurotoxicity
Dendritic
Beading Normal
Dendritic
Simplification
Neuronal
Shrinkage
Robertson K, et al. JNV 2012

Neurotoxicity @ CROI2016
Neurotoxicity Screening of Antiretroviral Drugs With Human iPSC-Derived Neurons
Sandy Hinckley1, Sean Sherman1, Brookie Best2, Jeremiah Momper2, Qing Ma3, Scott Letendre2, Ronald Ellis2, & Anne Bang1
1Sanford Burnham Prebys Medical Discovery Institute, 2University of California San Diego, 3State University of New York at Buffalo
#395
Introduction While antiretroviral therapy (ART) has become increasingly effective and well-tolerated, there remains a patient subset that experience central nervous system (CNS) side effects, and neurocognitive performance may actually improve following change in specific ART agents. Understanding the risk associated with these drugs will allow informed selection of optimal therapy. Using human induced pluripotent stem cell-derived neurons (hiPSC), we screened 10 ART drugs and generated a neurotoxicity profile based on mitochondrial membrane potential, reactive oxygen species, cell health and neurite growth. The ART drugs in our screening set were chosen for their characterization as the current recommended (ABC, TDF, DRV, DTG, EVG) or first alternative (EFV, RPV, ATV) treatment for antiretroviral-naïve adults1.
Methods 10 antiretroviral therapy (ART) drugs were acquired by the NIH AIDS drug repository. hIPSC derived iCell cortical neurons (Cellular Dynamics International) were plated on high throughput 384 well plates for assay screening. Both neurite growth and mitochondrial function were assessed on the Opera High Content Screening System (Perkin Elmer) and analyzed with Acapella software. The 10 ARV drugs in addition to the control (Menadione) were screened for mitochondrial function in a multiplexed, live cell assay. iCell neurons were loaded with the mitochondrial membrane potentiometric dye TMRE and reactive oxygen species sensor CellROX deep red. The cells were exposed to drugs in 7-point dose response in duplicate for 4 hours followed by Hoechst stain and imaging. The 10 ARV drugs in addition to the controls (Staurosporine and BIO) were screened for neurite growth after a 3 day drug exposure in 7-point dose response (n=4 wells/dose). Neurons were fixed and immunostained for the neuronal marker TUJ1 and nuclei marker Hoechst. Statistical significance was determined as Z-score greater than 2 standard deviations from the mean of the DMSO control.
Acknowledgements
Funding to support this research K24 MH097673 from NIMH R01 MH101012-03 ELLIS, RONALD J. (PI) 05/01/13-01/31/16 HNRC P30 MH062512
Conclusions We characterized toxicity of 10 ART drugs and linked the majority with impacts either on mitochondrial function, neurite growth, or both. Although immature, hiPSC neurons are human and scalable for drug screening. Further studies are needed to determine whether our in vitro assays reflect neurotoxicity in vivo, but our results suggest that increased drug concentrations in the CNS could have adverse clinical consequences. • NNRTIs were strongest neurotoxins in drug set
• 8/10 antiretroviral drugs had a direct effect on neuronal mitochondrial function, morphology, and/or health
Mitochondrial Toxicity Of Antiretroviral Drugs
Neurite Outgrowth During Antiretroviral Drug Treatment
Results Overview
Mitochondrial Toxicity High Content Screening
Neurite Outgrowth High Content Screening
-5 5 Max. Z-score
NRTI
NNRTI
INSTI
PI
PK enhancer
Control
Mitochondrial Assay Neurite Outgrowth Assay
• NNRTI and EVG were mitotoxic resulting in neurite retraction/cytotoxicity
• In contrast, PI were mitotoxic but did not significantly impact neuronal morphology or long-term cell health
Min e ffe ctive dose
Drug Mito N e urite
A bacavir 0 0
Te nofovir 0 0
Efav ire nz 50uM 10uM
Rilp iv irine 33uM 10uM
Elv ite grav ir 5uM 33uM
Dolute grav ir 0 33uM
Ritonavir 15uM 0
A tazanavir 150uM 0
Darunavir 50uM 0
Cobicistat 5uM 33uM
Mitochondrial Membrane Potential Depolarized and Reactive Oxygen Species Generated
Day 0: Plate Neurons Day 1:Compound Addition Day 4:Neurite Staining
No Effect on Neurite Growth or Cell Health
• Elvitegravir • Atazanavir • Ritonavir • Cobicstat
• Efavirenz • Rilpivirine • Darunavir
• Abacavir • Tenofovir • Atazanavir • Darunavir • Ritonavir
Mitochondrial Membrane Potential Dysfunction Neurite Outgrowth
• Efavirenz • Dolutegravir
Z -s c o re s D o lu te g ra v ir
-7 -6 -5 -4
-2
0
2
4
6
C o n c e n tra tio n ( lo g M )
Z -s c o re s E fa v ire n z
-7 -6 -5 -4
-6
-4
-2
0
2
4
C o n c e n tra tio n ( lo g M )
EFV 10uM
DLT 33uM
TUJ1
Ho
ech
st
EFV 33uM C o b ic is ta t
- 8 -7 -6 -5 - 4
0
1 0 0
2 0 0
3 0 0
T o ta l n e u r ite le n g th
N u m b e r o f n u c le i
C o n c e n tra t io n ( lo g M )
DMSO
TUJ1
Ho
ech
st
Ne
uri
te m
ask
BIO Staurosporine
Z -s c o re s S ta u ro s p o r in e
-9 -8 -7 -6 -5
-5
0
5
1 0
C o n c e n tra t io n ( lo g M )
Z -s c o re s E fa v ire n z
-7 -6 -5 -4
-6
-4
-2
0
2
4
C o n c e n tra t io n ( lo g M )
Z -s c o re s B IO
-8 -7 -6 -5
-6
-4
-2
0
2
4
C o n c e n tra tio n ( lo g M )
C o b ic is ta t
- 8 -7 -6 -5 - 4
0
1 0 0
2 0 0
3 0 0
T o ta l n e u r ite le n g th
N u m b e r o f n u c le i
C o n c e n tra t io n ( lo g M )
Z -s c o re s A b a c a v ir
-7 -6 -5 -4
-1
0
1
2
3
C o n c e n tra t io n ( lo g M )
Z -sc o re s A ta za n a v ir
-7 -6 -5 -4
-2
-1
0
1
2
3
C o n c e n tra t io n ( lo g M )
Z -s c o re s D a ru n a v ir
-7 -6 -5 -4
-2
-1
0
1
2
C o n c e n tra tio n ( lo g M )
Z -s c o re s R ito n a v ir
-7 -6 -5 -4
-3
-2
-1
0
1
2
C o n c e n tra t io n ( lo g M )
Z -s c o re s T e n o fo v ir
-7 -6 -5 -4
-2
-1
0
1
2
C o n c e n tra t io n ( lo g M )
C o b ic is ta t
- 8 -7 -6 -5 - 4
0
1 0 0
2 0 0
3 0 0
T o ta l n e u r ite le n g th
N u m b e r o f n u c le i
C o n c e n tra t io n ( lo g M )
Z -s c o re s R ito n a v ir
-7 -6 -5 -4
-3
-2
-1
0
1
2
C o n c e n tra t io n ( lo g M )
Cytotoxicity with Neurite Degeneration
• Elvitegravir • Cobicstat
TUJ1
Ho
ech
st
Cobicstat Elvitegravir
Z -s c o re s C o b ic is ta t
-7 -6 -5 -4
-3
-2
-1
0
1
2
C o n c e n tra tio n ( lo g M )
Z -s c o re s E lv ite g ra v ir
-7 -6 -5 -4
-3
-2
-1
0
1
2
C o n c e n tra tio n ( lo g M )
C o b ic is ta t
- 8 -7 -6 -5 - 4
0
1 0 0
2 0 0
3 0 0
T o ta l n e u r ite le n g th
N u m b e r o f n u c le i
C o n c e n tra t io n ( lo g M )
Neurite Retraction
• Rilpivirine
Z -s c o re s B IO
-8 -7 -6 -5
-6
-4
-2
0
2
4
C o n c e n tra tio n ( lo g M )
Z -s c o re s R ilp iv ir in e
-7 -6 -5 -4
-6
-4
-2
0
2
C o n c e n tra tio n ( lo g M )
RPV 10uM RPV 33uM
C o b ic is ta t
- 8 -7 -6 -5 - 4
0
1 0 0
2 0 0
3 0 0
T o ta l n e u r ite le n g th
N u m b e r o f n u c le i
C o n c e n tra t io n ( lo g M )
TUJ1
Ho
ech
st
Antiretroviral Screening Set
Re
ado
ut
Time A ssay P lasm a
Drug Mitochondrial N e urite
A ve rage ste ady
state [] P rote in b ind ing
A bacavir 0.15-150uM 0.033-33uM 1.75uM 50%
Te nofovir 0.25-25uM 0.033-10uM 0.91uM 0.7-7.2%
Efav ire nz 0.15-150uM 0.033-33uM 7.6uM 99.5-99.75%
Rilp iv irine 0.10-50uM 0.033-33uM 0.25uM 99.7%
Elv ite grav ir 0.15-150uM 0.033-33uM 1.67uM 98-99%
Dolute gravir 0.075-75uM 0.033-33uM 7.44uM 99%
A tazanavir 0.15-150uM 0.033-33uM 2.96uM 86%
Darunavir 0.15-150uM 0.033-33uM 7.68uM 95%
Ritonavir 0.15-150uM 0.033-33uM 7.88uM 98-99%
Cobicistat 0.15-150uM 0.033-33uM 0.39uM 97-98%
-1 0 0
-5 0
0
1 0 -1 1 0 0 1 0 1 1 0 2
0
1
2
3
[M e n a d io n e ], M
% c
ha
ng
e r
ela
tiv
e t
o c
on
tro
l:
TM
RE
cy
top
las
mic
in
ten
sit
y o
r
nu
cle
i a
re
a
Ce
llRO
X: fo
ld in
cre
as
e
cy
top
las
mic
inte
ns
ity
0
T M R E
C e llR O X
N u c le i A re a
MMP TMRE
ROS CellROX
Nuclei Hoechst
Merge
Co
ntr
ol
7.5
uM
Me
nad
ion
e
% c
han
ge r
elat
ive
to c
on
tro
l:
MR
E cy
top
lasm
ic in
ten
sity
or
n
ucl
ei a
rea
Ce
llRO
X: fo
ld in
crease
cytop
lasmic in
ten
sity
-1 0 0
-5 0
0
1 0 -1 1 0 0 1 0 1 1 0 2
0
1
2
3
[M e n a d io n e ], M
% c
ha
ng
e r
ela
tiv
e t
o c
on
tro
l:
TM
RE
cy
top
las
mic
in
ten
sit
y o
r
nu
cle
i a
re
a
Ce
llRO
X: fo
ld in
cre
as
e
cy
top
las
mic
inte
ns
ity
0
T M R E
C e llR O X
N u c le i A re aMMP TMRE
ROS CellROX
Nuclei Hoechst
Merge
Co
ntr
ol
15
0 u
M R
ito
nav
ir
% c
han
ge r
ela
tive
to
co
ntr
ol:
M
RE
cyto
pla
smic
inte
nsi
ty o
r
nu
cle
i are
a
CellR
OX
: fold
increase
cytop
lasmic in
tensity
-1 0 0
-5 0
0
1 0 -1 1 0 0 1 0 1 1 0 2
0
1
2
3
[M e n a d io n e ], M
% c
ha
ng
e r
ela
tiv
e t
o c
on
tro
l:
TM
RE
cy
top
las
mic
in
ten
sit
y o
r
nu
cle
i a
re
a
Ce
llRO
X: fo
ld in
cre
as
e
cy
top
las
mic
inte
ns
ity
0
T M R E
C e llR O X
N u c le i A re a
MMP ROS Cytotx Outgrowth Retraction Cytotx
length branch length branch
Abacavir 1.6 1.1 -0.2 1.1 1.0 0.1 -0.2 -0.6
Tenofovir 1.6 0.0 -0.5 0.5 0.5 -1.6 -1.0 0.4
Efavirenz -13.6 0.5 -6.8 2.9 1.1 -3.3 -0.6 -2.6
Rilpivirine -6.2 1.0 -0.7 1.3 1.0 -2.8 -1.9 -2.2
Elvitegravir -10.4 2.1 -1.5 0.8 0.5 -1.5 -1.2 -1.7
Dolutegravir 1.0 0.5 -0.5 3.2 4.0 -0.5 0.3 -0.5
Atazanavir -2.4 1.9 -0.5 1.4 1.0 -0.5 -1.3 -0.5
Darunavir 2.1 0.4 -0.4 1.2 0.8 0.0 -0.3 -0.8
Ritonavir -5.2 2.8 -0.4 0.2 0.3 -1.7 -0.5 -0.8
Cobicstat -12.0 7.7 1.0 1.1 1.1 -1.6 -2.4 -1.7
Menadione -12.0 10.6 -20.9
Staurosporine 7.1 9.6 -0.9 0.2 -1.2
BIO -2.2 -0.4 -3.6 -2.2 0.6
No Effect on Mitochondrial Function or Cell Health
• Abacavir • Tenofovir • Dolutegravir
-1 0 0
-5 0
0
1 0 -1 1 0 0 1 0 1 1 0 2
0
1
2
3
[M e n a d io n e ], M
% c
ha
ng
e r
ela
tiv
e t
o c
on
tro
l:
TM
RE
cy
top
las
mic
in
ten
sit
y o
r
nu
cle
i a
re
a
Ce
llRO
X: fo
ld in
cre
as
e
cy
top
las
mic
inte
ns
ity
0
T M R E
C e llR O X
N u c le i A re a
% c
han
ge r
ela
tive
to
co
ntr
ol:
M
RE
cyto
pla
smic
inte
nsi
ty o
r
nu
cle
i are
a
CellR
OX
: fold
incre
ase
cytop
lasmic in
tensity
1 Panel on Antiretroviral Guidelines for Adults and Adolescents. Guidelines for the use of antiretroviral agents in HIV-1-infected
adults and adolescents. Department of Health and Human Services. Available at http://www.aidsinfo.nih.gov/ContentFiles/AdultandAdolescentGL. pdf. Accessed February 21, 2016. Page 58, Table F3
-1 0 0
-5 0
0
1 0 -1 1 0 0 1 0 1 1 0 2
0
1
2
3
[M e n a d io n e ] , u M
% c
ha
ng
e r
ela
tiv
e t
o c
on
tro
l:
TM
RE
cy
top
las
mic
in
ten
sit
y o
r
nu
cle
i a
re
a
Ce
llRO
X: fo
ld in
cre
as
e
cy
top
las
mic
inte
ns
ity
0
T M R E
C e llR O X
N u c le i A re a
-1 0 0
-5 0
0
1 0 -1 1 0 0 1 0 1 1 0 2 1 0 3
0
1
2
3
[D a ru n a v ir ] , u M
0
-1 0 0
-5 0
0
1 0 -1 1 0 0 1 0 1 1 0 2 1 0 3
0
1
2
3
[A b a c a v ir ] , u M
0
-1 0 0
-5 0
0
1 0 -1 1 0 0 1 0 1 1 0 2
0
1
2
3
[T e n o fo v ir ] , u M
0
-1 0 0
-5 0
0
1 0 -1 1 0 0 1 0 1 1 0 2
0
1
2
3
[D o lu te g ra v ir ] , u M
0
1 0 -1 1 0 0 1 0 1 1 0 2 1 0 3
0
1
2
3
[C o b ic s ta t ] , u M
01 0 -1 1 0 0 1 0 1 1 0 2 1 0 3
[A ta z a n a v ir ] , u M
0 1 0 -1 1 0 0 1 0 1 1 0 2 1 0 3
[R ito n a v ir ] , u M
0
-1 0 0
-5 0
0
1 0 -1 1 0 0 1 0 1 1 0 2 1 0 3
[E lv ite g ra v ir ] , u M
0
-1 0 0
-5 0
0
1 0 -1 1 0 0 1 0 1 1 0 2 1 0 3
0
1
2
3
[E fa v ire n z ] , u M
0
-1 0 0
- 5 0
0
1 0 -1 1 0 0 1 0 1 1 0 2 1 0 3
0
1
2
3
[R ilp iv ir in e ], u M
0
Hinckley S, et al. CROI 2016 #395

EFV dose and NP symptoms
Haas et al. AIDS 2004; Gatanaga et al., CID 2011; Wyen C et al J Antimicrob Chemother 2011; Ciccarelli et al., Neurology 2011;
Johnson et al. BJCP 2012; Winston A, et al. CID 2015; Mollan KR, et al. IAS 2015; Johnson DH, et al. BJCP 2012
Dose reductions (either TDM or PG/TDM based) were
associated with improvements in neuropsychiatric symptoms
PG (CYP2B6, CAR) associated with symptoms, drug
discontinuation and suicidaility
ENCORE1: 400 mg EFV
associated with fewer
CNS adverse events
vs. 600 mg
Single-dose EFV: PK and
PG association with
Grooved pegboard
Debated association between EFV use and HAND

EFV/8-OH EFV and NC performances
Tovar-y-Romo LB, et al. J Pharmacol Exp Ther 2012 ; Winston A, et al. CID 2015; Sandkovski U, et al. JAC 2017
8-OH EFV showed in vitro direct neurotoxicity

Dolutegravir
Contrasting data on DTG neuropsychiatric
side effects
no signal in RCTs
higher incidence in SINGLE (vs. efavirenz)
higher incidence in some but not all observational
studies: mild and reversible
Neurotoxicity?
PK matters?
higher incidence in patients on concomitant abacavir,
female and older subjects
De Boer MG, AIDS 2016; Hoffman C, et al. HIV Medicine 2017; Fettiplace A, et al. JAIDS 2016; Bonfanti P, et al. AIDS 2017

Dolutegravir and PK?
0 5 10 150
20
40
60
80
DTG plasma concentrations (mg/L)
Ag
e (ye
ars
)
Cmax (0.5-4 hours)
0 2 4 6 80
20
40
60
80
Ctrough (21-27 hours)
DTG plasma concentrations (mg/L)A
ge
(ye
ars
)

Drug CPE score
95% Inhibitory Quotients
Macrophage efficacy score
in vitro neurotox N
RTI
s
Abacavir 3 NA 3 +
Emtricitabine 3 NA 12.5 0
Lamivudine 2 NA 50 +
Tenofovir disoproxil fumarate 1 NA 50 0
Zidovudine 4 NA 50 +
NN
RTI
s
Nevirapine 4 NA 20 +
Efavirenz 3 6.4 100 ++
Etravirine 2 5.1 NA +
Rilpivirine 3? NA NA +
PIs
Atazanavir 2 0.4 NA +
Atazanavir/r 2 2.8 NA +
Darunavir/r 3 8.2-18.5 NA 0
Lopinavir/r 3 1.5 NA NA
INIs
Raltegravir 3 0.7 NA +
Elvitegravir/r 3? NA NA +
Dolutegravir 4? NA NA +?
EIs Maraviroc 3 NA NA 0
Enfuvirtide 1 NA 50 NA
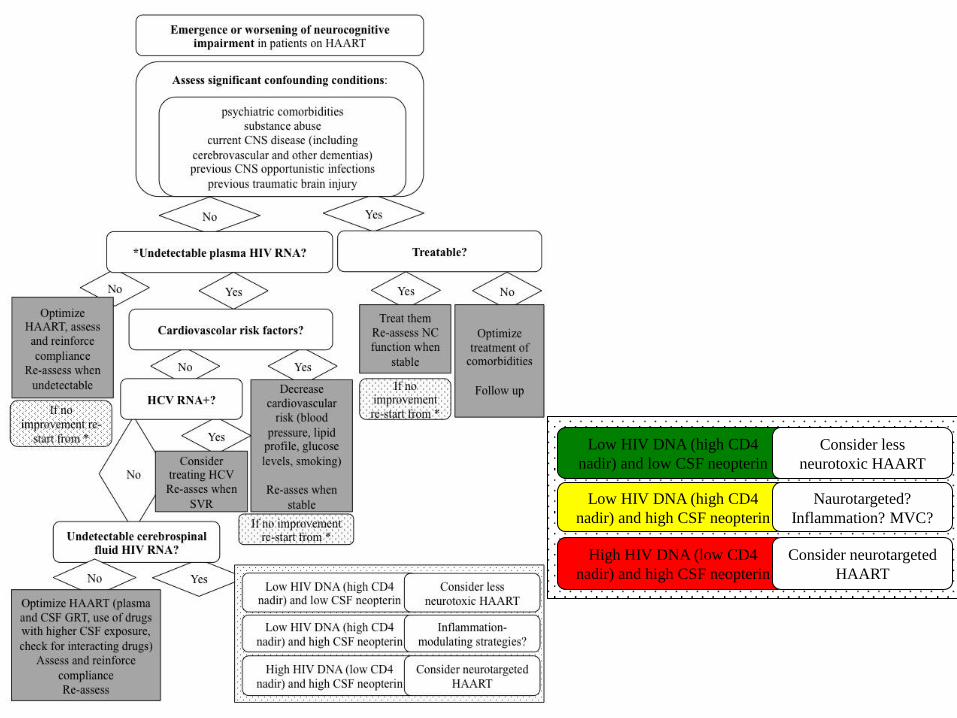
Low HIV DNA (high CD4
nadir) and low CSF neopterin
Consider less
neurotoxic HAART
Low HIV DNA (high CD4
nadir) and high CSF neopterin
Naurotargeted?
Inflammation? MVC?
High HIV DNA (low CD4
nadir) and high CSF neopterin
Consider neurotargeted
HAART

HIV DNA/CD4 nadir
1: Circulating HIV DNA Correlates With Neurocognitive Impairment in Older HIV-infected Adults on Suppressive ART. Oliveira MF et al. Sci Rep. 2015
2: Peripheral blood mononuclear cells HIV DNA levels impact intermittently on neurocognition. Cysique LA, et al. PLoS One. 2015
3: HIV DNA in CD14+ reservoirs is associated with regional brain atrophy in patients naive to combination antiretroviral therapy. Kallianpur KJ et al. AIDS. 2014
4: Peripheral blood HIV DNA is associated with atrophy of cerebellar and subcortical gray matter. Kallianpur KJ, et al. Neurology. 2013
5: Regional cortical thinning associated with detectable levels of HIV DNA. Kallianpur KJ et al. Cereb Cortex. 2012
6: Amount of HIV DNA in peripheral blood mononuclear cells is proportional to the severity of HIV-1-associated neurocognitive disorders. et al. J Neuropsychiatry Clin Neurosci. 2009


Acknowledgements
Prof. G Di Perri
Prof. S Bonora
Laura Trentini
Cristina Tettoni
Roberto Bertucci
Sabrina Audagnotto
Letizia Marinaro
Ilaria Motta
Alice Trentalange
Elisabetta Scarvaglieri
Elisa Scabini
Chiara Cardellino
Antonio D’Avolio
Jessica Cusato
Marco Simiele
Alessandra Ariaudo
Fabio Favata
Daniele Imperiale
Cristiana Atzori
Daniela Vai
Alessandra Romito
Prof. P Cassoni
Luca Bertero
Prof. F Condorelli
Ilaria Gnemmi Prof. S Letendre
Enrica Amasio
Sebastiano Catera
Valeria Ghisetti
Tiziano Allice