pharmacoepidemiologic studies: an...
TRANSCRIPT

i
PHARMACOEPIDEMIOLOGIC STUDIES: AN INTERRUPTED-TIME SERIES ANALYSIS ON DRUG UTILIZATION AND EVALUATION OF BENEFICIAL OR
ADVERSE DRUG EFFECTS
by
Wei-Hsuan Lo-Ciganic
BS, National Taiwan University, Taiwan, 2003
MS, National Cheng-Kung University, Taiwan, 2005
MS, University of Pittsburgh, 2010
Submitted to the Graduate Faculty of
Graduate School of Public Health in partial fulfillment
of the requirements for the degree of
Doctor of Philosophy
University of Pittsburgh
2013

ii
UNIVERSITY OF PITTSBURGH
GRADUATE SCHOOL OF PUBLIC HEALTH
This dissertation was presented
by
Wei-Hsuan Lo-Ciganic
It was defended on July 24, 2013 and approved by
Dissertation Chair: Janice C. Zgibor, RPh, PhD
Associate Professor Department of Epidemiology
Graduate School of Public Health University of Pittsburgh
Committee Members:
Robert Boudreau, PhD Assistant Professor
Department of Epidemiology Graduate School of Public Health
University of Pittsburgh
Clareann H. Bunker, PhD Associate Professor
Department of Epidemiology Graduate School of Public Health
University of Pittsburgh
Julie M. Donohue, PhD Associate Professor
Department of Health Policy & Management Graduate School of Public Health
University of Pittsburgh
Joseph T. Hanlon, PharmD, MS Professor
Department of Medicine, Division of Geriatric Medicine University of Pittsburgh
Elsa S. Strotmeyer, PhD, MPH
Assistant Professor Department of Epidemiology
Graduate School of Public Health University of Pittsburgh

iii
Copyright © by Wei-Hsuan Lo-Ciganic
2013

iv
ABSTRACT
Background: Pharmacoepidemiologic research is a valuable tool to enable one to understand
medication utilization patterns, beneficial/harmful outcomes of drug therapy, and to evaluate the
impact of other interventions on outcomes of drug therapy in “real-world” settings.
Objectives: This dissertation aimed to apply pharmacoepidemiologic methods to examine (1)
changes in utilization patterns of cholesterol-lowering medications following the release of the
guidelines and evidence-based data, (2) the associations between statin use and gait speed
decline in older adults, and (3) the associations between aspirin, non-aspirin nonsteroidal anti-
inflammatory drugs or acetaminophen and risk of ovarian cancer.
Methods: The study samples were from two sources including (1) community-dwelling older
adults in the Health, Aging and Body Composition Study, and (2) 902 women with ovarian
cancer and 1,802 controls in a population-based case-control study. An interrupted time-series
analysis, multivariable generalized estimating equations, and multivariable logistic regression
were used to examine our three objectives, respectively.
PHARMACOEPIDEMIOLOGIC STUDIES: AN INTERRUPTED-TIME SERIES
ANALYSIS ON DRUG UTILIZATION AND EVALUATION OF BENEFICIAL OR
ADVERSE DRUG EFFECTS
Wei-Hsuan Lo-Ciganic, PhD
University of Pittsburgh

v
Results: First, the use of cholesterol-lowering medication increased substantially over a decade
in older adults, but was not related to a change in level or trend following the release of the
evidence-based guidelines. Secondly, statin use had a decreased risk of gait speed decline.
Thirdly, risk reductions of ovarian cancer were observed with the use of aspirin or selective
COX-2 inhibitors.
Conclusion: These findings suggest that further studies are needed to investigate risk-benefit
balance of cholesterol-lowering therapy and the potential benefits/barriers of the treatment
among adults aged ≥ 80 years. Moreover, further investigations are warranted to confirm the
risk-benefit balance of statin use and physical function decline in older adults. Future research
on the associations between aspirin use and the risk of ovarian cancer should better characterize
accompanying medical conditions, health and lifestyle behaviors, genetic susceptibility, and the
overall risk-benefit balance. The public health relevance of these findings is that understanding
the utilization patterns of cholesterol-lowering therapy and potential benefits of statins on
physical function may prevent cardiovascular disease and disability in older adults. In addition,
aspirin or COX-2 inhibitors may be potential agents for the prevention of ovarian cancer, the
second leading gynecologic cancer in the US.
vi
TABLE OF CONTENTS
ACKNOWLEDGEMENT ......................................................................................................... XV
1.0 INTRODUCTION ........................................................................................................ 1
1.1 PHARMACOEPIDEMIOLOGY ....................................................................... 1
1.2 STUDY DESIGNS USED IN PHARMACOEPIDEMIOLOGY ..................... 4
1.2.1 Case Report or Case Series and Post-Marketing Spontaneous
Pharmacovigilance Reporting Systems .................................................................... 11
1.2.2 Analyses of Secular Trends (or Ecological Studies) ................................... 13
1.2.3 Cross-Sectional studies .................................................................................. 14
1.2.4 Case-Control Studies ..................................................................................... 15
1.2.5 Cohort Studies................................................................................................ 17
1.2.6 Efficient Sampling Designs within a Cohort Study .................................... 20
1.2.7 Case-Crossover, Case-Time-Control, and Self-Controlled Case Series
Studies.. ....................................................................................................................... 24
1.2.8 Randomized Clinical Trials (RCT) .............................................................. 28
1.2.9 Quantitative Synthesis Studies: Meta-analysis, Decision analysis, and
Cost-Effectiveness Analysis ....................................................................................... 30
1.2.10 Summary ....................................................................................................... 36

vii
1.3 SOURCES OF DATA TO ASSESS SAFETY/BENEFIT OF DRUGS ........ 37
1.3.1 Automated Data Systems (or Computerized Healthcare Data) ................ 41
1.3.2 Field Study (or Ad Hoc Studies) ................................................................... 44
1.3.3 Case-Control Surveillance, Prescription-Event Monitoring, and Registry
………………………………………………………………………………. 46
1.3.4 Summary ........................................................................................................ 49
1.4 AVAILABLE DRUG CODING SCHEMES AND CLASSIFICATION
SYSTEMS ........................................................................................................................... 50
1.4.1 National Drug Code (NDC) in the US .......................................................... 53
1.4.2 The Anatomical Therapeutic Chemical (ATC) Classification System and
WHO Drug Dictionary (WHO-DD) ......................................................................... 53
1.4.3 The American Hospital Formulary Service (AHFS) Pharmacologic-
Therapeutic Classification® and Related Coding Schemes ................................... 54
1.4.4 US National Drug File Reference Terminology (NDF-RT) and Veterans
Health Administration (VA) Drug Class Index ....................................................... 58
1.4.5 RxNorm by US National Library of Medicine (NLM) ............................... 59
1.4.6 Summary ........................................................................................................ 59
1.5 BIAS AND CONFOUNDING IN PHARMACOEPIDEMIOLOGY ............ 61
1.5.1 Bias and Available Solutions ........................................................................ 61
1.5.1.1 Selection Bias ....................................................................................... 64
1.5.1.2 Misclassification Bias .......................................................................... 67
1.5.2 Confounding ................................................................................................... 70
1.5.3 Available Solutions to the Confounding ...................................................... 73

viii
1.5.3.1 Control for Measured Confounders at the Design Stage ................ 74
1.5.3.2 Control for Measured Confounders at the Analysis Stage ............. 75
1.5.3.3 Unmeasured Confounders that Can be Measured in A Validation
Study ……………………………………………………………………….. 79
1.5.3.4 Control for Unmeasured Confounders at the Design Stage ............ 80
1.5.3.5 Control for Unmeasured Confounders at the Analysis Stage ......... 81
1.5.4 Healthy-User Effect and Related Confounding and Biases in
Observational Studies of Preventive Interventions ................................................. 84
1.5.5 Summary ........................................................................................................ 86
2.0 OBJECTIVES AND SPECIFIC AIMS .................................................................... 88
3.0 MANUSCRIPT 1: CHANGES IN CHOLESTEROL-LOWERING
MEDICATIONS USE OVER A DECADE IN COMMUNITY-DWELLING OLDER
ADULTS…………… .................................................................................................................. 90
3.1 ABSTRACT........................................................................................................ 92
3.2 INTRODUCTION ............................................................................................. 93
3.2.1 Epidemiology of Cardiovascular Disease and Dyslipidemia in the Elderly
……………………………………………………………………………… 93
3.2.2 Drugs for Lipid Lowering Therapy ............................................................. 95
3.2.3 Statin Therapy for Secondary Prevention of Cardiovascular Disease in
the Elderly ................................................................................................................... 95
3.2.4 Statin Therapy for Primary Prevention of Cardiovascular Disease in the
Elderly ......................................................................................................................... 97
3.2.5 Lipid-Lowering with Non-Statin Drugs in the Elderly .............................. 97

ix
3.2.6 Significance of Current Study ...................................................................... 98
3.3 METHODS ....................................................................................................... 100
3.3.1 Study Design, Sample, and Source of Data ............................................... 100
3.3.2 Data Collection and Data Management..................................................... 100
3.3.3 Outcome Variable: Cholesterol-Lowering Medication Use..................... 101
3.3.4 Primary Independent Variable .................................................................. 102
3.3.5 Covariates ..................................................................................................... 102
3.3.6 Main Statistical Analyses ............................................................................ 103
3.3.7 Sensitivity Analysis and Stratified Analysis .............................................. 104
3.4 RESULTS ......................................................................................................... 106
3.5 DISCUSSION ................................................................................................... 108
3.6 CONCLUSION ................................................................................................ 111
3.7 LITERATURE CITED ................................................................................... 112
3.8 TABLES AND FIGURES ............................................................................... 117
4.0 MANUSCRIPT 2: ASSOCIATIONS BETWEEN STATIN USE AND GAIT-
SPEED DECLINE IN COMMUNITY-DWELLING OLDER ADULTS ........................... 124
4.1 ABSTRACT...................................................................................................... 126
4.2 INTRODUCTION ........................................................................................... 128
4.2.1 Epidemiology of Impaired Physical Function and Disability in the Elderly
……………………………………………………………………………... 128
4.2.2 Gait Speed and Potential Factors that Influence Gait Speed .................. 129
4.2.3 Potential Mechanisms that How Statins Affect Physical Function ......... 131
4.2.4 Significance of the Current Study .............................................................. 133

x
4.3 METHODS ....................................................................................................... 134
4.3.1 Study Design, Sample, and Source of Data ............................................... 134
4.3.2 Study Subsample.......................................................................................... 135
4.3.3 Data Collection and Data Management..................................................... 135
4.3.4 Independent Variables ................................................................................ 136
4.3.5 Primary Outcome Measure: Gait Speed Decline per year ...................... 138
4.3.6 Covariates ..................................................................................................... 138
4.3.7 Main Statistical Analysis ............................................................................. 140
4.3.8 Sensitivity and Stratification Analyses ...................................................... 141
4.4 RESULTS ......................................................................................................... 142
4.5 DISCUSSION ................................................................................................... 144
4.6 CONCLUSION ................................................................................................ 146
4.7 LITERATURE CITED ................................................................................... 147
4.8 TABLES............................................................................................................ 155
5.0 MANUSCRIPT 3: ASPIRIN, NON-ASPIRIN NONSTEROIDAL ANTI-
INFLAMMATORY DRUGS, OR ACETAMINOPHEN AND RISK OF OVARIAN
CANCER ................................................................................................................................... 163
5.1 ABSTRACT...................................................................................................... 164
5.2 INTRODUCTION ........................................................................................... 165
5.3 METHODS ....................................................................................................... 167
5.3.1 The HOPE study .......................................................................................... 167
5.3.2 Assessment of aspirin, NA-NSAIDs and acetaminophen use .................. 168
5.3.3 Statistical Methods ...................................................................................... 169

xi
5.4 RESULTS ......................................................................................................... 172
5.5 DISCUSSION ................................................................................................... 173
5.6 LITERATURE CITED ................................................................................... 179
5.7 TABLES............................................................................................................ 182
6.0 DISCUSSION ........................................................................................................... 191
6.1 SUMMARY OF STUDY FINDINGS AND CONTRIBUTIONS TO THE
LITERATURE .................................................................................................................. 191
6.1.1 Changes in Cholesterol-Lowering Medication Use Over a Decade in
Community-Dwelling Older Adults........................................................................ 191
6.1.2 Associations between Statin Use and Gait-Speed Decline in Community-
Dwelling Older Adults ............................................................................................. 192
6.1.3 Aspirin, non-aspirin nonsteroidal anti-inflammatory drugs, or
acetaminophen and risk of ovarian cancer ............................................................ 193
6.2 PUBLIC HEALTH SIGNIFICANCE............................................................ 194
6.3 STUDY LIMITATIONS ................................................................................. 196
6.4 FUTURE RESEARCH .................................................................................... 198
APPENDIX: OTHER MEDICATIONS WITH ANTI-INFLAMMATORY EFFECTS.... 199
BIBLIOGRAPHY ..................................................................................................................... 200

xii
LIST OF TABLES
Table 1. Summary of Study Designs Used in Pharmacoepidemiology Research .......................... 7
Table 2. Overview of Types of Decision Analyses in Pharmacoeconomic Research .................. 35
Table 3. Overview of Sources of Data to Access Safety/Benefit of Drugs .................................. 38
Table 4. Overview of Available Drug Coding Schemes............................................................... 51
Table 5. Common Biases and Potential Solutions in Pharmacoepidemiology ............................. 62
Table 6. NCEP ATP Guidelines Recommended Drug Therapy According to LDL-C Levels .... 96
Table 7. Baseline Characteristics of the Health ABC Cohort and Four Subgroups (N=3,055) . 117
Table 8. Prevalence of Cholesterol-Lowering Medication Use from 1997-2008 ....................... 121
Table 9. Effect of the Release of the NCEP ATP III Guidelines and Results from PROSPER
Study in 2002 on Cholesterol-Lowering Medications Use ......................................................... 122
Table 10. Baseline Characteristics of the Health ABC Cohort and According to Statin Usea .. 155
Table 11. Prevalence of Statin Use Over Timea ......................................................................... 159
Table 12. Gait Speed and Change in Gait Speed According to Statin Use Over time ............... 160
Table 13. Univariate and Multivariate Associations between Statin Use and Gait Speed Decline
of 0.05 m/s or More Per Year ..................................................................................................... 161
Table 14. Univariate and Multivariate Associations between Statin Use and Gait Speed Decline
of 0.1 m/s or More Per Year ....................................................................................................... 162

xiii
Table 15. Characteristics of Ovarian Cancer Cases and Controls in the HOPE Study .............. 182
Table 16. Regular Use of Aspirin or NA-NSAIDs and Risk of Ovarian Cancer in the HOPE
study ............................................................................................................................................ 184
Table 17. Regular use of Aspirin by Self-Reported Indications and Risk of Ovarian Cancer in the
HOPE study ................................................................................................................................ 186
Table 18. Regular Use of Non-Selective or Selective NA-NSAID and Risk of Ovarian Cancer
among NA-NSAID Only Users in the HOPE Study .................................................................. 186
Table 19. Regular use of Acetaminophen and risk of ovarian cancer in the HOPE study ......... 187
Table 20. Regular use of NA-NSAIDs only or Acetaminophen by self-reported indications and
risk of ovarian cancer in the HOPE study ................................................................................... 188
Table 21. Regular use of Aspirin, NA-NSAID, Acetaminophen and Risk of Ovarian Cancer by
Tumor Behaviors and Histologic Types in the HOPE study ...................................................... 189
Table 22. Regular Use of Aspirin, NA-NSAID or Acetaminophen and Risks of Ovarian Cancer
in the HOPE Study (Definition of non-users: without use any analgesics regularly) ................ 190

xiv
LIST OF FIGURES
Figure 1. Study Designs Used in Pharmacoepidemiology.............................................................. 4
Figure 2. Approach to Build the Propensity Score ....................................................................... 78
Figure 3. Yearly Prevalence of Cholesterol-Lowering Medication Use by Four Groups from
1997-2008 ................................................................................................................................... 123

xv
ACKNOWLEDGEMENT
First, I want to give Jesus Christ, who is my Savior, Lord and King, all the glory and honor, and
praise for giving me the strength and ability to finish my study and dissertation. I am very
thankful to Dr. Janice Zgibor for her help, understanding and advisory in the past seven years.
My special thanks are to Dr. Joseph Hanlon, for his guidance and sharing his wealth of
pharmacoepidemiologic knowledge and experience with me. In addition, I want to express my
great gratitude toward Dr. Robert Boudreau. Dr. Julie Donohue, Dr. Elsa Strotmeyer, Dr.
Clareann Bunker, Dr. Roberta Ness, Dr, Subashan Perera, Dr. Shelly Gray, and Dr. Zachary
Marcum for their guidance, help and time spent helping me prepare this dissertation.
Most importantly, I want to thank my dearest husband, Adrian, and my children (Daniel
and Michel) for being great blessings in my life and being on my side to support me. I thank my
lovely family in Taiwan for your love, patience and support for all of my life. I thank my
mother-in-law, Ksenija, who has offered a great help of babysitting my children in the past 3
years. I give special thanks to my friends, Bruce and Elena Lewis, Bob and Ardith Hamilton,
David and Chris Whitcomb, Bill and Jeanne Griffith, Scott Boyd, Amy Yu, Manyu Li and all
other friends for your prayers, support, love and encouragement. It would be impossible to
accomplish my study without your prayers, love and support.

1
1.0 INTRODUCTION
1.1 PHARMACOEPIDEMIOLOGY
Pharmacoepidemiology is the application of epidemiologic knowledge, methods, measurements,
analysis, and reasoning to study the uses, beneficial and adverse effects of drugs (including
biologics, vaccines, and therapeutic devices) in defined human populations.1 It is an applied
field bridging between clinical pharmacology (including pharmacokinetics and
pharmacodynamics) and epidemiology.2 Moreover, pharmacoepidemiology integrates with
therapeutic risk management to minimize risks throughout the whole life cycle of a drug (i.e.,
from the time when it is first discovered or synthesized until it is no longer sold as a drug), and
optimize its benefit/risk balance.1,3
In the United States (US), the current drug approval process includes preclinical testing
followed by three phases of clinical testing. Phase I trials are generally conducted in a few
healthy volunteers to determine the pharmacologic and pharmacokinetic actions, a safe dosage
range of a drug, and to exclude any extremely common toxic reactions which are unique to
humans. The goals of Phase II trials are to obtain more information on the pharmacokinetics,
common adverse reactions, initial possible efficacy, and to determine daily dosage of a drug in a
small number of patients (typically up to 300). The goals of Phase III trials are to rigorously

2
evaluate and confirm earlier efficacy studies and identify common adverse effects in a much
larger number of patients (approximately 500-3,000).1,2 To meet Food and Drug Administration
(FDA) standards, at least one (traditionally two) of the Phase III trials needs to be a randomized
clinical trial (RCT). However, the pre-marketing studies are inherently limited to detect a drug’s
long-term effects, uncommon or delayed adverse effects, adverse drug withdrawal events,
relative effectiveness in special populations (e.g., children, pregnant women or elderly),
modifiers of efficacy (i.e., with concurrent drugs, disease severity, and lifestyle), and
consequences due to misuse of the drugs by prescribers or patients.1 Once marketing approval of
a drug is granted, phase IV studies (or post-marketing surveillance), which are usually non-
experimental epidemiologic studies, play a role to monitor its use and effectiveness in the usual
clinical care conditions.
The traditional field of pharmacoepidemiology primarily focuses on the study of adverse
drug effects and drug utilization. During the past two decades, the field of
pharmacoepidemiology has increasingly shifted to study beneficial or harmful effects,
pharmacoeconomics, pharmacogenetics, quality of life, meta-analysis of drug use, and health
service research on studying if interventions improve drug use. The potential contributions of
pharmacoepidemiology include: (1) supplemental information to premarketing studies and better
quantifying the incidence of known adverse and beneficial effects in certain populations not
studied prior to marketing (e.g., elderly, children, or pregnant women), (2) new types of
information not available from premarketing studies (e.g., undetected adverse and beneficial
effects, patterns of utilization), and (3) reassurances about drug safety and fulfillment of ethical
3
and legal obligations.2 In summary, questions that pharmacoepidemiologic studies can answer
include: 4
(1) How and why is drug therapy being used/misused or prescribed?
(2) What are the beneficial and harmful outcomes of drug therapy?
(3) What interventions are effective in modifying the use and outcomes of drug therapy?

4
1.2 STUDY DESIGNS USED IN PHARMACOEPIDEMIOLOGY
Figure 1. Study Designs Used in Pharmacoepidemiology
The types of study designs applied in pharmacoepidemiology differ with respect to several
dimensions including direction of outcome measurement (e.g., prospective or retrospective), the
unit (individual or group), number (one or more) of observations made, and methods and timing
of data collection.5 In Figure 1, case report, case-series, secular trend analysis (also called

5
ecologic study), cross-sectional, case-control and cohort studies are observational studies.6,7 In
observational studies, investigators do not control the therapy, but simply observes and evaluates
the results of ongoing medical care. Case reports, case series, analyses of secular trends and
cross-sectional studies are also referred to as descriptive studies. Through the use of descriptive
study designs in pharmacoepidemiology, investigators may establish drug utilization patterns and
quality of drug use in a population and provide data to be used not only for health policy and
planning, but also as preliminary information to consider possible associations between exposure
and outcome.7 Due to intrinsic limitations that are described later, descriptive studies are
sometimes called “hypothesis generating” studies, in which the proposed association will need to
undergo further study.7 Case-control studies, cohort studies, and RCTs all have control groups,
and are considered to be analytic studies (i.e., hypothesis testing). Randomized clinical trials
(RCTs) are experimental studies in which investigators control the therapy to participants.8 In
addition to the applications of traditional epidemiologic study designs, methodological advances
in the design and analysis (e.g., nested case-control, case-cohort, multitime case-control, cross-
over design) were developed to solve specific challenges in the conduct of research on drug
effects during the past two decades. Moreover, quantitative synthesis studies including meta-
analysis and decision analysis takes part of the medical literature or clinical experience, attempt
to create an answer to a defined problem, resolve uncertainty and facilitate decision making in
health care.9
In order to clarify different study designs used in pharmacoepidemiology, each study
design and its characteristics, advantages, disadvantages and examples will be discussed in turn

6
and summarized in Table 1. The details of bias and confounding in pharmacoepidemiology will
be discussed in Section 1.5.

7
Table 1. Summary of Study Designs Used in Pharmacoepidemiology Research
Study Design Characteristics Measures of Association
Advantages Disadvantages Main Applications/Examples (Ex)
Case series, case reports
• Observational, descriptive
• Participants identified based on outcome
• Generate information on natural history of disease and case definition
Not available • Identifying new/rare disease/condition
• Cheap and easy method for generating hypothesis
• No control group • Rates or measures of
association cannot be calculated
• Monitor or capture adverse drug events or drug-drug interactions after marketing or in specific populations
• Post-marketing spontaneous pharmacovigilance report
• Ex: SSRIs induced serotonin syndrome in children10,11
• Ex: Moxifloxacin-wafarin drug interaction12
Analyses of secular trends (ecological studies)
• Observational, descriptive
• Trends in drug use and outcomes coinciding overtime for groups
Correlation • Can provide rapid answers
• Relatively quick and inexpensive
• No control of confounding
• Ecologic fallacy • Changes in diagnosis,
coding systems overtime
• Correlations between drug use and outcome overtime for groups
• Ex: MMR immunization and autism occurrence among young children in California, US 13
Cross-sectional • Observational, descriptive
• Study the distributions of drug use and disease in a populations
Prevalence • Relatively quick and inexpensive
• Valuable to estimate prevalence of drug use and disease
• Temporal association cannot be established
• Limited generalizability if choosing a convenience sample
• Drug utilization study or snap-shot of the possible beneficial/harmful effects of drugs
• Ex: Whether statin use was associated with a higher prevalence of musculoskeletal pain using NHANES data 14
Case-control • Observational, analytic • Participants identified
based on outcome • Can study rare
outcomes or outcomes with long latency periods
OR • Can study multiple exposures
• Logistically easier and faster, cheaper than RCTs
• Problematic control selection
• Possibly biased exposure data
• Recall limitation, recall bias, selection bias, temporal bias
• Study relative rare outcome related to certain medication use
• Ex: Use of diethylstilbestrol in pregnant women and the risk of vaginal cancer in the off-spring15

8
Table 1 (Continued)
Study Design
Characteristics Measures of Association
Advantages Disadvantages Main Applications/Examples
Cohort • Observational, analytic • Participants identified
based on exposure • Can study relatively rare
exposures
Absolute risk (NNT/NNH), RR,
• Can study multiple outcomes • Temporal association
established • Unbiased exposure data • Generally cheaper than RCTs
• Immortal-time, loss-to-follow-up biases, misclassification
• Time-consuming if done prospectively
• Post-marketing surveillance studies or study potential effects of drugs use or factors to influence medication use
• Ex: statin use and cholesterol associations with incident dementia and mild cognitive impairment 16
Nested case-control
• Efficient sampling designs within a cohort
• A type of case-control study
• Controls are matched by certain variables and time of enrollment of cases
Allow to estimate absolute risk (NNT/NNH) and RR
• Minimize recall or selection bias (baseline data were obtained on exposure status)
• Cost-intensive tests of biological samples can be carried out in a subset of cohort
• Loss-to-follow-up • May not be representative
of all controls if outcome of interest is not rare
• Drug use may change over time
• Ex: Whether statin use was associated with risk of cancer using 574 UK general practices cohort 17
Case-cohort (case-base)
• Efficient sampling designs within a cohort
• A type of case-control study
• Controls are randomly selected from the rest of cohort
Allow to estimate absolute risk (NNT/NNH) and RR
• Same as nested case-control studies, plus
• Controls may be used for multiple case groups
• Loss-to-follow-up • May need to select more
controls since some controls who develop the diseases of interest may enter the study as cases
• Drug use may change over time
• Ex: Associations of maximum prescribed daily opioid dose and dosing schedule with the risk of opioid overdose death among patients with cancer, chronic pain, substance use disorders using Veteran Health Administration Database18
Multitime case-control
• Efficient sampling designs within a cohort
• A type of case-control study
• Measure drug exposure at different time points to increase “numbers of observations per control”
Allow to estimate absolute risk (NNT/NNH) and RR
• Improve the precision of the RR and power without additional controls and cost
• Not suitable for chronic or cumulative drug exposure
• Must correct for within-subject correlation
• For acute/transient drug exposure
• Antibiotic use associated AMI 1:1 case-control: OR=2 (95% CI: 1.16–3.44); 1: 10 case-control: OR=2.13 (95% CI: 1.48-3.05); multitime case-control: OR=1.99 (95% CI: 1.36-2.90)19

9
Table 1 (Continued)
Study Design Characteristics Measures of Association
Advantages Disadvantages Main Applications/Examples
Case-crossover • Assess the exposed versus unexposed periods of a drug in the same individuals
• Study a transient exposure and acute events
OR • Control for time-invariant confounders since each person serves as his/her control
• Statistically efficient (require less sample size)
• Recall or selection bias • Not feasible for curative or
rapid changing conditions • Inefficient if exposure does
not shift frequently • Limited use in claim data • Need to specify the length of
the effect period
• Examine the effects of drug use in patients with disease that worsen over time, various disease severity among patients, or the intermittent drug use
• Ex: Study the association between sumatriptan and MI20
Case-time control
• Extension of case-crossover design
• Controls are selected from a cohort with similar synchronization with cases
OR • Similar to case-crossover • Situations where trends
that may change overtime may be adjusted
• May not be valid when time-dependent confounders exist
• Control the time-trend in drug use and indication for drug use or disease severity
• Ex: Examine the use of inhaled β-agonists and asthma death.21
Self-controlled case series
• Study a transient exposure and acute events
• Drug exposure distribution doesn’t need to be stationary
• Adjust time-invariant confounders by self-controlled method
RR • Efficient and cheaper • Allow temporal
confounders (e.g. season), multiple risk periods and repeat exposures
• Able to handle automated data, indefinite exposure (timeline is not censored at end-point)
• Would fail if outcome only occur at a determined age
• May bias results if reporting strongly depend on the time interval between exposure and event
• Mainly use in vaccine surveillance
• Ex: Study the influenza vaccine and acute asthma exacerbations in the 2 weeks following exacerbation22
Randomized clinical trial
• Experimental study • Investigator controls
the exposure or therapy • A gold standard among
all study designs • Also useful in post-
marketing surveillance
Absolute risk (NNT/NNH), RR
• Only design which can control for unknown or unmeasured confounders
• Most expensive • Limited generalizability • Logistically most difficult • Ethical objections for proven
therapies
• Can be used for post-marketing RCTs or comparative effectiveness research
• Ex: A prospective study, ALLHAT, compared the four antihypertensive medications in those with hypertension and multiple comorbidities.23
10
Table 1 (Continued)
Study Design Characteristics Measures of Association
Advantages Disadvantages Main Applications/Examples
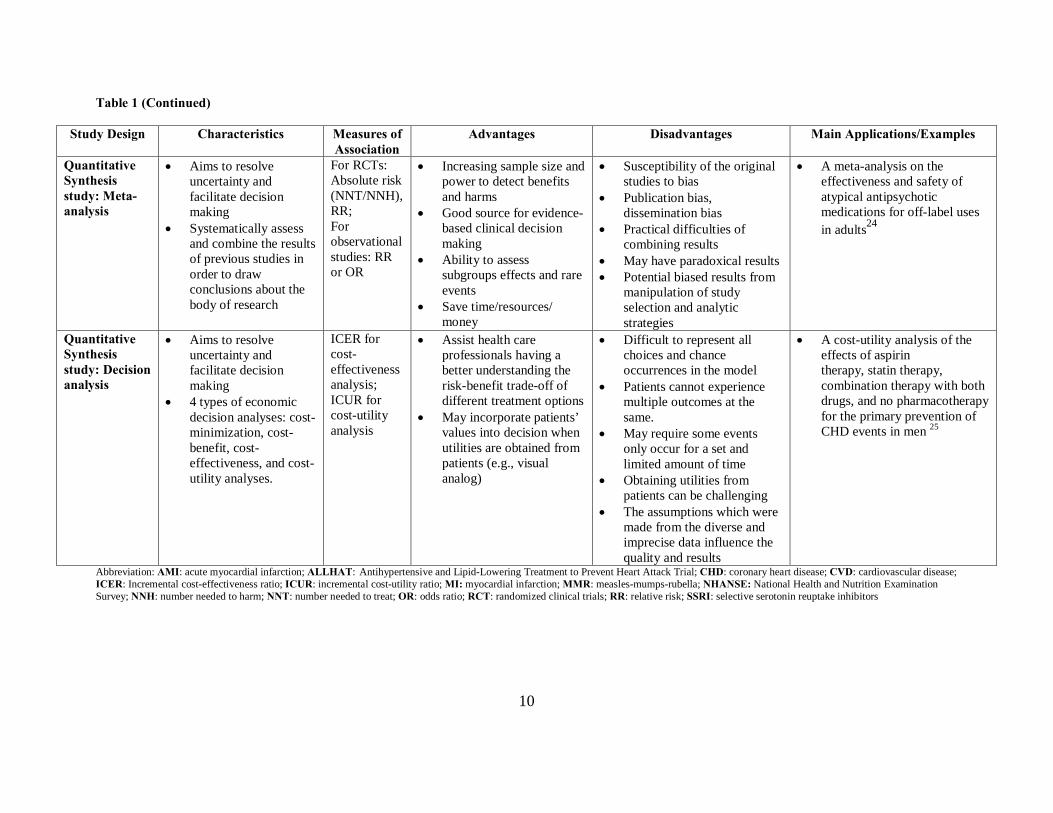
Quantitative Synthesis study: Meta-analysis
• Aims to resolve uncertainty and facilitate decision making
• Systematically assess and combine the results of previous studies in order to draw conclusions about the body of research
For RCTs: Absolute risk (NNT/NNH), RR; For observational studies: RR or OR
• Increasing sample size and power to detect benefits and harms
• Good source for evidence-based clinical decision making
• Ability to assess subgroups effects and rare events
• Save time/resources/ money
• Susceptibility of the original studies to bias
• Publication bias, dissemination bias
• Practical difficulties of combining results
• May have paradoxical results • Potential biased results from
manipulation of study selection and analytic strategies
• A meta-analysis on the effectiveness and safety of atypical antipsychotic medications for off-label uses in adults24
Quantitative Synthesis study: Decision analysis
• Aims to resolve uncertainty and facilitate decision making
• 4 types of economic decision analyses: cost-minimization, cost-benefit, cost-effectiveness, and cost-utility analyses.
ICER for cost-effectiveness analysis; ICUR for cost-utility analysis
• Assist health care professionals having a better understanding the risk-benefit trade-off of different treatment options
• May incorporate patients’ values into decision when utilities are obtained from patients (e.g., visual analog)
• Difficult to represent all choices and chance occurrences in the model
• Patients cannot experience multiple outcomes at the same.
• May require some events only occur for a set and limited amount of time
• Obtaining utilities from patients can be challenging
• The assumptions which were made from the diverse and imprecise data influence the quality and results
• A cost-utility analysis of the effects of aspirin therapy, statin therapy, combination therapy with both drugs, and no pharmacotherapy for the primary prevention of CHD events in men 25
Abbreviation: AMI: acute myocardial infarction; ALLHAT: Antihypertensive and Lipid-Lowering Treatment to Prevent Heart Attack Trial; CHD: coronary heart disease; CVD: cardiovascular disease; ICER: Incremental cost-effectiveness ratio; ICUR: incremental cost-utility ratio; MI: myocardial infarction; MMR: measles-mumps-rubella; NHANSE: National Health and Nutrition Examination Survey; NNH: number needed to harm; NNT: number needed to treat; OR: odds ratio; RCT: randomized clinical trials; RR: relative risk; SSRI: selective serotonin reuptake inhibitors

11
1.2.1 Case Report or Case Series and Post-Marketing Spontaneous Pharmacovigilance
Reporting Systems
Recently, pharmacovigilance has been widely used to denote post-marketing safety activities and
is defined by the World Health Organization (WHO) as “the science and activities relating to the
detection, assessment, understanding and prevention of adverse effects or any other drug-related
problems.”26 The goal of a post-marketing spontaneous pharmacovigilance reporting system
(briefly called spontaneous reporting systems) is to identify drug-related adverse events or
adverse drug reactions (ADRs) that were not identified prior to approval, to refine knowledge of
the known adverse effects of a drug, and to better understand the conditions under which the safe
use of a drug can be assured.27
A case report or case series describes one or a number of interesting clinical cases who
were exposed to a particular drug(s), usually having an adverse outcome, and observed by health
care professionals from a single hospital or a specific geographic region.5,6 Case reports or case
series provide clinical descriptions after patients receive a particular drug. All voluntary case
reports of adverse events or ADRs from health care professionals, patients/consumers or
manufacturers that are received by regional or national monitoring systems are called
spontaneous reports.27,28 Once reports are received and entered into adverse events or ADR
databases, these databases can then be inspected for drug safety signals, which form the basis of
further study, necessary regulatory action or both. In the US, the individual spontaneous
reports of ADRs, medication errors and product quality problems are sent directly to the FDA

12
through the MedWatch program or to the manufacturer, and then indirectly from the
manufacturer to the FDA.28 In addition, two international reporting and database systems are
available: EudraVigilance in the European Union (run by the European Medicines Agency,
EMA)29 and WHO VigiBase, which pools data from the approximately 100 member countries of
the WHO International Drug Monitoring Program (run by the Uppsala Monitoring Centre,
UMC).30
Assessment of the drug-adverse event causality for a particular case report or series in the
databases can be quite challenging. Useful factors for assessing causality between a drug and
reported adverse events include: (1) chronology of administration of a drug (including beginning
and ending of treatment and adverse event onset), (2) course of adverse event when the suspected
agent continued or discontinued, (3) etiologic roles of agents and diseases in relation to adverse
event, (4) response to re-challenge of agent, (5) laboratory test results, and (6) previously known
toxicity of agent.28,31 Naranjo’s ADR causality algorithm is the method commonly used in
clinical pharmacy to evaluate the probability of ADRs.31 Rarely, definitive inference about
causality can be made base on case reports or case series or from a spontaneous reporting
database. In the absence of a control group, one cannot determine with certainty which features
in the description of the patients are unique to the drug exposure. Measures such as incidence or
prevalence rates cannot be calculated, as complete counts of all cases and/or the population at
risk are usually not available.5
Reports detected from spontaneous reporting databases have several advantages
including their large-scale, inexpensiveness, coverage of the population represented (including
special subgroups), ability for signal detection, hypothesis generation, providing an opportunity

13
for healthcare professionals or the public to report adverse events/ADRs, and lack of interference
with prescribing habits27,32,33 Some limitations of spontaneous reporting include difficulties with
adverse event recognitions, quality of reports (e.g., require detailed clinical information for a
thorough case evaluation), under-reporting due to voluntary systems, inability to calculate
population-based incidence of adverse events/ADRs (reporting ratio is used), non-uniform
temporal trends in reporting (i.e., the frequency of adverse events/ADR reports per unit of drug
utilization is not likely to be constant over time), and duplicated reports.27,28,33 Due to the above
limitations, interpretation of spontaneous reports always requires careful analysis and clear
communication of results, conclusions, and limitations.
For example, numerous case reports of serotonin syndrome, a potentially life-threatening
condition, in children being treated with selective serotonin reuptake inhibitors triggered the
need to study the safety of antidepressants in children.10,11 Furthermore, an example of a case
series is the description of five cases of moxifloxacin-warfarin drug interaction, which resulted
elevated international normalized ratios, prolonged hospitalization in two cases and clinically
significant hemorrhage in one case. This case series helped health professionals detect this
potential interaction, which was not indicated in the moxifloxacin product monograph at that
time, and subsequently prevent this interaction in future patients.12
1.2.2 Analyses of Secular Trends (or Ecological Studies)
Analyses of secular trends (or ecological studies) examine trends in exposure (drug use) and
outcomes when they coincide over time for groups (i.e., communities, counties or population

14
level) or across geographic boundaries.6,34 One of the best-known sources of data on drug
utilization is Intercontinental Marketing Services (IMS), tracking more than 80% of global
pharmaceutical sales activity.35 Vital statistics, such as National Death Index, are often used as a
source of disease incidence in these studies.6 The measure of association for an analysis of
secular trends is correlation.7 Analyses for secular trends are useful for rapidly providing
evidence for hypothesis generation and preliminary research. However, a major limitation of
this study design is “ecologic fallacy”, a term used to represent the fact that associations
observed at the level of the group or population may not represent the association at the
individual level.7 Thus, analyses of secular trends are unable to differentiate which factor is
likely to be the true cause of the outcome of interest and establish a causal relationship between
the drug exposure and the outcome of interest on an individual level.6,7 Other potential problems
using vital statistics include changes in diagnostic methods or terminology, coding systems, and
population demographics overtime.36
For example, Dales et al. conducted a study in California, US to determine if a correlation
exists between measles-mumps-rubella (MMR) immunization coverage among young children
and autism occurrence between 1980 and 1994.13 The study did not find a positive correlation
between MMR immunization and autism occurrence among young children.
1.2.3 Cross-Sectional studies
Cross-sectional studies (also called prevalence studies) are useful when investigators are
interested in gathering information on drug use and the extent of disease in a particular

15
population or in characterizing or comparing populations.5 Information on drug use and/or
disease are usually collected in a single visit or through a survey.37 Cross-sectional studies are
often quick, easy, inexpensive, and can be effectively estimate the prevalence of disease and/or
drug exposures. They provide information on distributions of drug use and diseases in
populations and can allow clinicians, public health professionals, and health policy makers to
design and implement appropriate interventions or to allocate resources effectively. However,
major limitations include the inability to establish a temporal association and sometimes the
necessary restriction to studying rare diseases or diseases with short duration.5,7 In addition,
investigators sometimes elect to study a convenience sample, which may limit the reliability and
generalizability of the study results.7
An article published in 2008 provides an example of a cross-sectional study using data
from the National Health and Nutrition Examination Survey (NHANES) 1999-2002.14
Investigators sought to evaluate whether statin use was associated with a higher prevalence of
musculoskeletal pain in a nationally representative sample. In this study, statin users were
significantly more likely to report musculoskeletal pain.
1.2.4 Case-Control Studies
Case-control studies are analytic observational studies that compare cases with a disease (or an
adverse event) to controls without the disease, looking for differences in preceding drug(s) use.34
The common sources for selecting cases with the outcome of interest include case-control
surveillance and registries.36 It is critical to select representative controls that have the same risk

16
of exposure as cases. Poor choice of controls can lead to both wrong results and possible
medical harm. Controls can be recruited from known or unknown study populations (or study
group or base). In general, when a study population is known, a sample of the population can be
used as controls by using a population roster or techniques such as random-digit dialing. If study
population is unknown, hospital controls, neighborhood controls, and friend, associate, or
relative controls can be used.38-42 However, it is challenging to define the group or population
from which controls should come. For example, since endometriosis needs an operation for the
diagnosis, investigators frequently select women having laparoscopy or laparotomy without
diagnosis of endometriosis. But women having operations are unlikely to be representative of all
those at risk of developing endometriosis, since operations do not occur at random.43
Case-control studies are advantageous to assess relatively rare outcomes (e.g., ovarian
cancer), outcomes with long latency periods, or multiple possible causes of a single outcome.7,34
Other advantages of case-control studies include being less expensive and quicker to complete
than RCTs. Potential biases while conducting case-control studies may include selection, recall,
and/or temporal biases.44 One of the common limitations in case-control studies is the validity of
retrospectively collected drug use information, which is mainly obtained by administering
questionnaires or interviews. In addition, selecting cases and controls properly can be
challenging and inappropriate control selection can lead to a selection bias and invalid results.6,34
However, when case-control studies are done well, subsequent well-designed cohort studies or
RCTs can generally confirm their results.6 In case-control studies, one cannot determine the size
of either the populations with or without drugs exposure (i.e., denominators) from which the
cases and controls were drawn. Therefore, incidence rates of disease among individuals with or

17
without drugs exposure are not calculable. Thus, the measure of association obtained from a
case-control study is an odds ratio (OR).7 In addition, attributable risk cannot be directly
calculated from a case-control study since incidence rates are not available.
One of the seminal case-control studies was conducted by Herbst et al., who examined
the association between the use of diethylstilbestrol (DES) in pregnant women (for the
prevention of spontaneous abortion) and the risk of vaginal cancer in the off-spring.15 This study
included 8 cases and 32 age-matched controls. The association between DES and vaginal cancer
was very strong (7 of the 8 cases, but none of the 32 controls were prenatally exposed to DES).
Even this small sample size provided sufficient power to reach statistical significance.
1.2.5 Cohort Studies
Cohort studies are essential to pharmacoepidemiology since they form the basis for the
quantification of drug risk and benefit assessments. Cohort studies are studies that identify
subsets of a defined population, based on the presence or absence of a particular drug use, and
follow them over time, looking for differences in the outcome of interest.6,34 Cohort studies
generally are used to compare drug-exposed patients to unexposed patients, but they can be used
to compare one drug use to another drug or treatment. The major sources of information about
drug exposures are billing claims or automated databases, physicians (e.g., sent questionnaires in
the prescription event monitoring in UK), pharmacies (e.g., pharmacy-based surveillance), and
self-reports from patients.36

18
Cohort studies can be performed prospectively, retrospectively or ambispectively.34
Prospective cohort studies have fewer problems with validity compared to retrospectively
collected drug data.6 Retrospective cohort studies use historical data to reconstruct an
individual’s past drug use status at baseline (or time zero) and subsequent outcomes that have
occurred and have been recorded prior to the study.45 The ambispective cohort design is a blend
of the retrospective and prospective designs; retrospective data are used to determine drug status,
and participants are then followed into the future to obtain outcome status.45 Retrospective and
ambispective cohort studies require reliable historical drug use data in order to be considered
effective.
Cohort studies are particularly useful to study multiple possible outcomes and relatively
infrequent drug use. They can be used in post-marketing drug surveillance studies to look at any
possible effect of a newly marked drug.6 However, they are not practical to study rare outcomes
as the sample size needed to detect such outcomes would be extremely large.46 In addition,
prospective cohort studies can require a prolonged time period to study delayed drug effects.6
Further, cohort studies may be susceptible to immortal-time bias, loss-to-follow-up bias, and
misclassification of drug use (especially drug use changes during a period of follow-up
duration).45,46 Incidence rates can be calculated within a cohort study which enables estimation
of risks such as the relative risk and attributable risk (also called risk difference or excess risk).
The relative risk is the ratio of the incidence rate of an outcome in the drug exposed group to that
in the unexposed group. The relative risk is more important in considering questions of
causation. The attributable risk is more important in considering the public health impact of an
association, as it represents the absolute increased rate of disease due to the drug exposure. It is

19
simply the arithmetic difference between the risk in the treatment group and the risk in the
control group. A statistic that is directly related to the absolute risk but that offers a different
prospective is the number needed to treat (NNT) or number needed to harm (NNH). NNT tells
us how the many persons would have to be given a beneficial intervention to prevent 1 case of
disease. NNH tells us how many people would have to be given a harmful intervention to cause
1 excess of disease. The NNT or NNH is equal to the inverse of the absolute risk difference.47,48
For example, treating 10,000 women with estrogen plus progestin for 1 year yields 8 excess
cases of breast cancer. Thus, one would need to treat 10,000/8 = 1,250 women for 1 year to
cause a single excess case. Although the risks to a given women are small, the overall public
health impact could be large if many women were taking hormone therapy.
For example, Beydoun et al. examined statin use and cholesterol associations with
incident dementia and mild cognitive impairment using the data from Baltimore Longitudinal
Study of Aging (a prospective cohort study).16 1604 and 1345 eligible participants were
followed after age 50 for a median time of 25 years to examine the incidence dementia and mild
cognitive impairment. The authors found that statin users had about 60% risk reduction of
developing dementia, but not mild cognitive impairment, when considering “time-dependent”
statin use with propensity score model adjustment. This association remained significantly
independently of serum cholesterol levels. The authors suggest statins may have multifactorial
effects on dementia.

20
1.2.6 Efficient Sampling Designs within a Cohort Study
Conducting a cohort study in pharmacoepidemiology is constrained by the following challenges:
(1) expensive and time-consuming to collect data on all cohort members; (2) may require
additional and validated data to control the confounding when using automated databases; (3)
technically infeasible in data analysis of a cohort with multiple and time-dependent drug
exposures, particularly if the cohort size and number of outcome events are large.49 To
overcome these difficulties, three sampling designs within a cohort (i.e., nested case–control,
case–cohort designs, and the multi-time case–control) have been proposed and applied
successfully in pharmacoepidemiology. Different from the traditional case-control and cohort
studies, these sampling designs within a cohort permit the precise estimation of relative risk
measures with negligible losses in precision.50,51
In nested case-control studies, cases are usually matched by certain variables such as
sex, age, and “time of enrollment” into the cohort.44,50 Matching on calendar time is crucial in
studies where the drug prevalence and outcome incidence both vary substantially over time,
which is not uncommon in pharmacoepidemiology.51 A control may later become a case,
however, this does not typically occur when the outcome of interest is uncommon.50 A major
advantage of this study design is that since baseline drug use and other clinical data were
obtained, certain biases such as recall and selection biases may be minimized.52 The design of
nested case-control allows for the estimation of absolute and relative risk.53 Limitations with this
study design may arise; for example, if controls are samples at the end of the study period, issues
such as loss to follow-up and representation of all controls may need to be considered.53 In
21
addition, it is challenging when subjects are possibly selected more than once in the sample when
the drug exposure and covariate factors are time-dependent, particularly when the data are
obtained by questionnaire where the respondent would have to answer questions regarding
multiple time points in their history.49 An example of nested case-control studies is a series
of studies conducted covering 574 UK general practices investigating the effect of statins on
cancer incidence.17 Within the cohort, cases were patients with primary cancers diagnosed
between 1998 and 2008. Each case was linked to 5 controls alive and registered with the
practice at the time of diagnosis of the case and matched by age, sex, and practice and calendar
time. The study showed that prolonged use of statins was not associated with an increased risk of
cancer at any of the most common sites, except for colorectal cancer, bladder cancer and lung
cancer, while there was a reduced risk of hematological malignancies.
Unlike a nested case-control study where controls are usually matched to cases on time of
entry into the cohort, in a case-cohort study (also called case-base study) every individual in
the cohort has an equal probability of being a control since the control groups are randomly
selected (or called unmatched nested case-control design).50 Similar to nested case-control
studies, case-cohort studies allow investigators obtain certain information for only a subset of all
controls, potentially saving time and money and minimizing certain biases in traditional case-
control studies.44,50 The group of individuals serving as controls may be used for multiple case
groups.50 Controls that later develop the outcome(s) of interest may become cases; therefore,
investigators have to select more controls for each case than they would in a traditional case-
control study to attain the same level of statistical precision.50 Potential limitations of case-
cohort studies are loss to follow-up and the possibility of drug use changing over time.44,50 The

22
analytic method must take into account the overlap of cohort members induced by the sampling
strategy.49 Bohnert et al. recently published a case-cohort study to examine the association of
maximum prescribed daily opioid dose and dosing schedule (i.e., as needed, regularly scheduled
or both) with the risk of opioid overdose death among patients with cancer, chronic pain, acute
pain and substance use disorders.18 In this study, 750 incident cases of unintentional
prescription opioid overdose decedents in a Veteran Health Administration database from 2004-
2008 were sampled, in addition to a random sample (n=154,684) who used medical services in
2004 or 2005 and received opioid therapy for pain from this same cohort. Among patients
receiving an opioid prescription for pain, higher opioid doses were associated with an increased
risk of opioid overdose death. The risk of opioid overdose should continue to be evaluated
relative to the need to reduce pain and suffering and should be considered along with other risk
factors.
The case–cohort design has some advantages over the nested case–control design: (1)
simpler in sampling; (2) flexible to use the same sample to study several different types of events
and each can be analyzed with the same “control” subcohort (whereas the nested case–control
design requires different control groups for each type of event because the selection depends on
event times); (3) case–cohort design allows one to change the primary time axis of analysis from
calendar to disease time and vice versa; and (4) easier to perform external comparisons.49,54
Conversely, the nested case–control design has some advantages over the case–cohort design: (1)
easier to perform power calculation or equivalently sample size determination (whereas a case–
cohort design requires more complicated calculation due to the overlap in risk-sets); (2) data on
time-dependent exposure and covariates need only be collected up to the time of the risk-set

23
(while the collection must be exhaustive for the case–cohort); and (3) despite the accessibility of
software for data analysis of case–cohort data, these can quickly become surpassed and even
infeasible with larger sample sizes and time-dependent exposures. In this situation, the nested
case–control design, with its single risk-set per case, is not only advantageous but also the only
solution.49,54
Suissa et al. recently proposed the multitime case–control design as an alternative
strategy to improve the precision of the OR in a case–control study with “acute or transient”
time-varying exposures, especially when increasing the number of control subjects is too
costly.19 This approach measures drug exposure at many different points in time to increase “the
number of observations per control subject”, which must however be corrected for within-subject
correlation.19 Traditionally, case–control studies usually collect extensive data on time-
dependent drug exposures, but only use a portion of these data in calculating OR. The advantage
of a multitime case-control study is to improve the precision of OR and increase the power
without adding additional controls and costs. However, the multitime case-control design is not
suitable for chronic or cumulative drug exposure because the OR varies as a function of the
duration of drug exposure. For example, in a nested case–control study within a cohort of
12,090 patients with chronic obstructive pulmonary disease, there were 245 incident cases of
acute myocardial infarction (AMI) that occurred during follow-up, for whom 1 and 10 controls
per case were identified. The OR of AMI associated with use of antibiotics in the month prior to
the index date was 2.00 (95% CI: 1.16–3.44) with one control per case. The precision (as
reflected in the confidence intervals) was improved by increasing to 10 controls per case with a
rate ratio of 2.13 (95% CI: 1.48–3.05). Alternatively, keeping only one control patient per case,

24
but increasing the number of control time windows per subject from 1 to 10 (taken as 10 control
exposure measures, one for each of the 10 months prior to the index date) also improved the
precision with a rate ratio of 1.99 (95% CI: 1.36–2.90). 19
1.2.7 Case-Crossover, Case-Time-Control, and Self-Controlled Case Series Studies
Pharmacoepidemiology is frequently faced with the assessment of the risk of acute adverse
events resulting from transient drug effects. For example, this is the case in trying to study the
risk of ventricular tachycardia, from hypokalemia and prolonged Q-T intervals, associated with
the use of inhaled β-agonists in asthma.51 Traditional study designs may be challenging because
of the acuteness of the adverse event, difficulties in determining the timing of drug exposure, and
possible confounding by indications. Three other study designs were devised to counter these
complexities in pharmacoepidemiology: case-crossover study, case-time-control study and
self-controlled case series study.6,34,55
A case-crossover study is similar to an experimental study in that the same individual is
assessed during the periods of a specific drug exposure and periods without that exposure
(control period).56-58 In other words, the case has the outcome of interest and serves as its own
control. Two assumptions need to be held for the case-cross over study, including: (1) the effect
of the drug exposure is not cumulative nor does not extend beyond the risk period, and (2) the
outcome of interest is without a preclinical stage that may influence the exposure.55,57,59,60 In
addition, the outcome of interest must be a discrete event, a risk period (between drug exposure
and outcome) should be specified, and the data on the usual drug use pattern are necessary to

25
determine the typical probability of exposure during the time window of effect.49,55,57 The design
is particularly useful for examining the effects of drug use in patients with diseases that worsen
over time or vary in severity from patient to patient or require intermittent drug use.56,59 Another
advantage of this design is that it eliminates the problem of time-invariant measurable (e.g.,
gender, race) or unmeasurable confounders (e.g., genetic factors). Limitations of case-crossover
studies include selection bias (if case selection is related to the drug exposure), information bias
(if differential quality of recent and past drug exposure data is present), restrictions of using
automated data due to logistical issues, confounders that change over time that cannot be
controlled for, and having the assumption of the absence of a time trend in the drug exposure
prevalence.34,51,55,57 Ottervanger et al. conducted a case-crossover study to examine the
association between sumatriptan and myocardial infarction (MI) in the Netherlands.20
Sumatriptan is used to abort an acute migraine (transient basis) and has a relatively fast onset of
action (12 minutes, injectable formulation) and about 2-4 hours duration of action.61 The
investigator asked the subjects whether they took sumatriptan during the 2-4 hours immediately
before the MI (risk period). Then the subjects were asked if they took sumatriptan 1 week
before the MI (control period). The investigators found that young age, hypertension, general
complaints of abdominal pain, and a family history of myocardial infarction are associated with
an increased risk of chest pain attributed to sumatriptan. Sex is an effective modifier of risk
factors of sumatriptan-induced chest pain. In particular, hypertension is a strong risk factor in
men.
The case-time-control study design is an extension of the case-crossover design. In
1995, this study design was proposed for controlling for confounding by indication (e.g., disease

26
severity), which was not measured because of the within-subject analysis.21 It is used to examine
associations that may exist between drug use and an outcome in situations where trends that may
change over time (such as prescribing patterns or disease severity) could confound the
association.59,60 For example, a standard case-crossover study is not suitable for studying events
related to drug use during pregnancy because drug use often changes during gestation. A control
group is selected within a cohort and with an approximate synchronization with cases. Both
cases and controls are examined for drug exposure status during the control period and during
the time period corresponding to the outcome of interest.57 As cases and controls were selected
from approximately the same time period, changes in trends over time may be adjusted for,
although this is not guaranteed and may itself introduce other bias.57 An example of the use of a
case-time-control design was the study to examine the use of inhaled β-agonists and its potential
association with asthma death. In Spitzer et al’s previous work, the used of inhaled β-agonists
were associated with the increased risk of asthma death.62 However, they argued that one
potential explanation for the increase in deaths (despite adjustment of potential confounders)
may be a natural increase in the use of inhaled β-agonists overtime (e.g., due to increase in
physician prescribing, more evidence of drug efficacy and better compliance with the drug). The
same group of investigators conducted a case-time-control study and showed that inhaled β-
agonists may not play the leading role attributed to the risk of fatal or near-fatal asthma, as was
previously suspected.21
Self-controlled case series studies can be used to study the temporal association
between a time-varying drug exposure and an adverse event using data on cases only.55 Self-
controlled case series studies require the following three key assumptions to be applicable: (1)
27
events arise in a non-homogeneous Poisson process; (2) the occurrence of an event must not alter
the probability of subsequent exposure; and (3) the occurrence of the event of interest must not
censor or affect the observation period.55 Data are usually collected during a predefined study
period given in terms of calendar time and possibly age boundaries, typically determined by the
availability of database records. The main advantages are that it often has high efficiency
relative to the cohort method and that is self-controlled for time-invariant confounders (such as
gender, location, genetics, and underlying health status).55 Time varying confounders such as
age and season can be allowed for in the baseline incidence. For example, ages at vaccination
are regarded as fixed, and the random variable of interest is the age at adverse event, conditioned
on its occurrence within a pre-determined observation period.55 The self-controlled case series
method shares in all the benefits of the case-crossover method, but has two important advantages
over the case-crossover method. The first is that there is no requirement of stationary or
exchangeability of times of exposure (e.g., vaccination).63 For example, the case-crossover
method would not be appropriate for the seasonal influenza vaccination. Secondly, in conditions
of high vaccine coverage, the method is nearly as powerful as a full cohort analysis.63 This is
because non-cases contribute very little information about the vaccine effect. However, it would
fail in the unlikely event that the adverse event could only occur at a determinate age, since no
within-individual variation would then be possible. If on the other hand vaccination times were
determinate, then age and vaccine effects would be confounded, and an unvaccinated group of
cases would be required to disentangle their independent effects. Generally, the greater the
variability in vaccination ages within the observation period, the more powerful the study.63
Kramarz et al. investigated whether administration of influenza vaccine to asthmatic children

28
(aged < 6 years) caused acute asthma exacerbations in the 2 weeks following vaccination in
1993-1996.22 Using the self-controlled case series analysis, which automatically adjusts
completely for underlying disease severity, the vaccine appears to be protective.
1.2.8 Randomized Clinical Trials (RCT)
A RCT is an experimental study in which investigators control the intervention and randomly
allocate patients among the study groups. The major strength of this approach is random
assignment, which is the only way to ensure that the study groups are comparable in potential
unknown or unmeasurable confounding variables. RCTs are considered to be the most
scientifically rigorous method for hypothesis testing and remain the “gold standard” against
which other studies are judged.6,64 However, investigators may be limited in their ability to use
a RCT design because of issues related to feasibility, sample size, length of follow-up, ethics, or
cost.64 If the incidence of an adverse event is very rare or if the adverse event only arises in the
long term, this potential safety issue will not be detected through RCTs. In addition, RCTs are
more expensive and may not generalize to population. In the past, RCTs are used less after
marketing; however, there is an increased concern about relying solely on non-experimental
methods to study drug safety after marketing. Therefore, large RCTs are emerging as a part of
post-marketing surveillance.6
Moreover, comparative effectiveness research (CER) has become the spotlight after the
introduction of the American Recovery and Reinvestment Act, which provided $US1.1 billion
over two years to support CER.65 CER has two major components including the comparison of

29
two or more agents or interventions that are considered true therapeutic alternative, and the
examination of effects (or outcomes) in actual practice.66 CER may include prospective clinical
trials (also called large simple clinical trials or pragmatic clinical trial), observational studies, or
synthesis studies. A traditional phase III RCT, which is an explanatory trial, aims to establish
the efficacy of a new drug in narrowly selected population in a controlled setting. They usually
compares the new drug with placebo or an inferior treatment option rather than legitimate
alternative treatment option. Explanatory RCTs often evaluate a single main measure of clinical
outcomes, which are often short-term, surrogate or intermediate endpoints.66,67
In contrast, pragmatic clinical trials, which may be randomized or non-randomized, aim
to demonstrate effectiveness of a drug in a diverse population and heterogeneous practice
settings, and answer the questions faced by decision makers. Pragmatic clinical trials may use
wide range of outcomes which are more informative for decision makers (e.g., participants,
funders, communities, and healthcare practitioners).66-68 For example, in trials of back pain, the
Cochrane Collaboration recommends that outcomes should include pain, functional status, ability
to work, and satisfaction with treatment. However, increasing the number of measures in a trial
increases the probability that one will reach statistically significance on the basis of chance
alone. This needs to be taken into account in the sample size calculation. In general, more
subjects are needed when several outcomes are being measured.
An example of a comparative effectiveness trial is Antihypertensive and Lipid-Lowering
Treatment to Prevent Heart Attack Trial (ALLHAT study).69 ALLHAT compared the
effectiveness of four antihypertensive medications in general population with hypertension and
multiple comorbidities. The primary outcome was combined fatal CHD or nonfatal myocardial

30
infarction, rather than surrogate measures. Findings of the ALLHAT have influential effects on
the treatment of hypertension in current practice. For example, thiazide-type diuretics are
superior in preventing one or more major forms of cardiovascular disease and are less expensive.
They should be preferred for first-step antihypertensive therapy.23
1.2.9 Quantitative Synthesis Studies: Meta-analysis, Decision analysis, and Cost-
Effectiveness Analysis
Meta-analysis and decision analysis have in common that they synthesized knowledge.9 Each
method takes parts of the medical literature or clinical experience and, based on this information,
attempts to create a whole answer to a defined problem. In addition, they are quantitative, using
statistical and numerical analysis, aims to resolve uncertainty and facilitate decision making.
Each plays a prominent role in the formulation of clinical and public policy in health care.9
Meta-analysis is a qualitative and quantitative approach for systematically assessing and
combining the results of previous studies in order to draw conclusions about the body of
research.9 Studies of a topic are first systematically identified, and inclusion and exclusion
criteria are defined. In traditional meta-analysis, data from the eligible studies are abstracted or
collected from the investigators of the study. The data are then analyzed and the heterogeneity
of the results is tested. If the results are homogenous, a summary estimate of the size of the
effect of treatment is estimated. If the results are heterogeneous clinically or statistically, the
heterogeneity needs to be further explored.70,71 Ideally, meta-analysis is applied most
appropriately to RCTs and provides most powerful evidence. When in cases of RCTs are

31
impossible, meta-analysis of observational studies is useful to explore dose-response
relationship, to understand reasons for discrepancies among the results of difference studies, and
to assess the possibility of differences in the effects of the drug exposure in subgroups.70
Another type of meta-analysis, pooled analysis, obtains and analyzes the “individual” data from
participants in a systematically ascertained group of studies. Pool analysis of individual level
data has the same concept and aim as traditional meta-analysis.9 When systematic review and
meta-analysis are used to compare alternative treatments from the standpoint of real-world health
care decision, they are considered as secondary comparative effectiveness studies.66
The use of meta-analysis has been growing since 1987, the advantages of meta-analysis
include increasing sample size and power to detect benefits and harms of a drug or treatment,
good source for evidence-based clinical decision making, ability to assess subgroups effects and
rare events, ability of indirect comparison and simultaneous evaluation of treatment therapies
available for special conditions, and saving time, resources and money.72 In addition, cumulative
meta-analysis could be as a tool to detect safety signal earlier. The disadvantages of meta-
analysis include susceptibility of the original studies to bias (garbage in and garbage out),
publication and dissemination bias, practical difficulties of combining results from different
studies (i.e., variations in study designs, subject characteristics, drug exposures, and outcomes),
paradoxical results due to combining different studies, potential biased results from manipulation
of study selection and analytic strategies, and challenges of including advanced study designs
(e.g., case-crossover, clustered randomized trials).72
For example, Maher et al. performed a systematic review and meta-analysis on the
effectiveness and safety of atypical antipsychotic medications for off-label uses in adults.24 The

32
authors found that benefits and harms vary among atypical antipsychotic medications for off-
label use. For global behavioral symptom scores associated with dementia in elderly patients,
small but statistically significant benefits for global behavioral symptom scores associated with
dementia in elderly patients were observed for aripiprazole, olanzapine, and risperidone.
Quetiapine was associated with benefits in the treatment of generalized anxiety disorder, and
risperidone was associated with benefits in the treatment of obsessive-compulsive disorder;
however, adverse events were common.
Decision analysis is a quantitative approach that assesses the relative value of different
decision options.9 It is a method of probabilistic reasoning and decision-making under
conditions of uncertainty.73 In other words, when some uncertainty about the appropriate clinical
strategy for patients with a given health state and there is a meaningful tradeoff in the problem, it
is appropriate to conduct a decision analysis.74 Decision analysis always requires comparison of
at least two clinical strategies with advantages and countervailing disadvantages.74 The results
from decision analysis are used to decide how to manage an individual patient and to formulate
policy recommendations about a group of similar patients. Briefly, performing a decision
analysis involves (1) defining a specific question, (2) creating a model (usually a decision tree or
MarKov model) to frame the question, (3) assessing utilities or values to outcomes in the model,
(4) assigning probabilities to chance events in the model based on direct assessment, literature or
expert opinion, (5) identifying the best strategy within the model, (6) sensitivity analysis (to
determine the robustness of the results), and (7) model refinement based on the internal, external,
between-model consistency and predictive validity of the model.9,74

33
When an economic perspective is assumed, values of the outcome are assigned in terms
of their monetary cost. Economic decision analysis research is increasingly used to inform
funding decisions for new therapies (e.g., incorporation as part of phase III trials), and deliver
high-quality care within the constraints of limited budgets or reduced fee schedules.75 Types of
economic decision analyses in pharmacoeconomic research considering both costs and utilities
of outcome include cost-minimization, cost-effectiveness, cost-utility, and cost-benefit
analyses (Table 2).73,75 Cost-minimization analysis (or cost-identification analysis) assumes
that alternative treatment result in the same outcome, and value or decision is assigned entirely
based on the lowest cost. It is appropriate only if treatment outcomes or benefits are equivalent
among the therapies being evaluated.75 Cost-benefit analysis remains a less common used
technique in economic assessments of health care in the US, because it is difficult to translate all
outcomes into monetary measures.9 Cost-effectiveness analysis assumes that cost and the
effectiveness of interventions vary, and uses natural units as outcome measures. Consequently,
value is assigned by the cost per unit improvement of a health status, such as dollars per years of
life saved. Cost-utility analysis, a type of cost-effectiveness analysis, often presents the
outcome as cost per quality-adjusted life-year. The advantage of cost-utility analysis is that the
utility assignment can be generalized to all health states.
For example, Pignone et al. performed a cost-utility analysis of the effects of aspirin
therapy, statin therapy, combination therapy with both drugs, and no pharmacotherapy for the
primary prevention of CHD events in middle-aged men.25 Compared with no treatment, aspirin
is less costly and more effective for preventing CHD events in middle-aged men with a 10-year
risk for CHD ≥ 7.5%. The addition of a statin to aspirin therapy becomes more cost-effective (an

34
incremental cost-utility ratio of 42,500 dollars per quality-adjusted life-year gained) in men with
a 10-year CHD risk ≥ 10% at baseline.
The main advantage of decision analysis is that it assists health care professionals having
a better understanding the risk-benefit trade-off of different treatment options. Another
advantage is that decision analysis incorporates patients’ values into decision when utilities are
obtained from patient populations (e.g., visual analog, stand gambling, or time trade-off
methods).76 The decision analysis has inherent limitations. Oftentimes, the tree may need to be
simplified to show only major choices and outcomes rather than all choices and chance
occurrences.77 For example, treatments vary among physicians and that heterogeneity may not
be easily represented. In addition, the decision tree is limited that in that patients cannot
experience multiple outcomes at the same.77 Furthermore, many decision tree analyses require
that some chance events occur for a set and limited amount of time. Eliciting utilities can be
challenging, even using the most reliable methods such as time trade-off and standard gamble
methods.73 Lastly, using the assumptions made from the diverse and imprecise data in the
decision analysis may heavily influence the quality and conclusions of the results.

35
Table 2. Overview of Types of Decision Analyses in Pharmacoeconomic Research
Type of Analysis
Measurement of Costs
Measurement of Outcome
Common Presentation for
the Results
Characteristics and Other Comments
Example
Cost-minimization (or cost-identification)
Monetary units
None Cost per unit or service provide
• Outcome is assumed to be the same
• Not often used due to outcomes are usually different
• Appropriate only if treatment outcomes or benefits are equivalent among the therapies being evaluated
Evaluation of brand-name vs. generic drugs (with same outcome or indication)
Cost-benefit Monetary units
Monetary units Net benefits or cost-benefit ratios
• More commonly used in economics and policy than in health care (due to difficulties in assigning a cost to many outcomes)
Pharmacist-managed clinic for a disease vs. cardiac rehabilitation program
Cost-effectiveness
Monetary units
Natural units (e.g., life-years gained, disability-days saved, reduction of blood pressures)
ICER is presented (e.g., $100,000 dollars per life saved)
• Same outcome measured for the drugs/services being compared
• Can be challenging to compare different outcome measures across different studies
Cost/mmHg decrease in blood pressure treatment
Cost-utility Monetary units
Utility or healthy years (typically measured as QALY)
ICUR is presented (e.g., $100,000 dollars per QALY gained)
• Combine quantity and quality of life
• A type of cost-effectiveness analysis
Cost/QALY gained for aspirin, statins, or both drugs for the primary prevention of coronary heart disease events in men
Abbreviations: ICER: incremental cost-effectiveness ratio; ICUR: incremental cost-utility ratio; QALY: quality-adjusted life-year;

36
1.2.10 Summary
Each study design described above can be applied in pharmacoepidemiology research. In
general, science proceeds from the case reports toward RCTs. Case reports and case series are
useful for suggesting an association, while analyses of trends and case-control studies are useful
for exploring these associations. Observational study designs are important approaches to
identify and evaluate of drug effects that would not be ethical to conduct in experimental studies.
Observational studies also allow one to examine drug effects in more diverse or special
populations (e.g., elders or children), assess drug effects that are uncommon or latent, or that are
the result from drug over-dose or off-label use.34 Case-crossover, case-time-control, and self-
controlled case series methods are increasingly used in pharmacoepidemiology, particularly in
vaccine safety studies. These methods are typically used to evaluate the association between a
transient exposure and acute event. Decision analysis provides a way to quantify preferences,
and when it is evaluated in conjunction with cost data, this analytic tool may provide additional
evidence for clinical decision making. In summary, traditional study designs can generally
optimize the conduct of research in pharmacoepidemiology, and further enhancements of novel
approaches or tools have been developed specifically to solve challenges in
pharmacoepidemiology. The common aim of using an appropriate study design in
pharmacoepidemiology is to investigate the optimal use of therapeutic agents and contribute to
evidence-based decision-making in clinic settings and for overall public health.

37
1.3 SOURCES OF DATA TO ASSESS SAFETY/BENEFIT OF DRUGS
While premarketing studies identify many aspects of drug safety, the full safety and benefit
profiles can only be identified when the drug is used in large numbers of patients in “real world”
settings. The major sources of data to assess safety or benefit of drugs include automated health
data systems, field studies (or ad-hoc studies), and other special ad-hoc studies (e.g., case-control
surveillance, prescription-event monitoring, and registries). Main medication use sources will be
reviewed in this section. The details of each source/database are beyond the scope in this
section. Table 3 summarizes the characteristics, advantages, disadvantages and examples of
these medication data sources. The US National Cancer Institute also provides some available
pharmacoepidemiology sources (see http://riskfactor.cancer.gov/tools/pharmaco/epi/).

38
Table 3. Overview of Sources of Data to Access Safety/Benefit of Drugs
Sources Characteristics Advantages Limitations / Biases Examples Automated Data Systems: Often considered as the gold standard for medication data Administrative claims databases (claims databases)
• Arises from a person’s use of health care system and the submission of claims to insurance companies for payment (health insurer databases)
• Uncommon outcomes can often be studied
• Can study drugs and devices as used in real-world clinical practices
• Include membership data, physician services, outpatient pharmacy claims, hospital services, laboratory services
• Large sample, quicker, less expensive
• Very high-quality data on drug exposure
• Minimize recall/interview bias • Usually have standard formats
• Uncertain validity on diagnosis data (especially outpatient)
• Unavailable confounders • Limited medication coverage • Lack of information on clinical
data, patient history, OTC drugs, outside of the insurance’s plan, or uninsured population, patient’s adherence
• Instability of the population (e.g., job changes)
• US: HMO, Medicare, Medicaid, State blue cross/blue shield plans, commercial insurance (e.g., HealthCore, UnitedHealth group, Ingenix Research database)
• Canada: Canadian provincial databases (e.g., BCLHD)
Electronic health records (EHRs), or Electronic medical records (EMRs)
• Used by healthcare professionals in the delivery of care to patients
• Uncommon outcomes can often be studied
• Can study drugs and devices as used in real-world clinical practices
• Include patient data, activity, prescription, clinical/lab observations, orders (diagnosis and procedure codes)
• Large sample, quicker, less expensive
• Better quality on diagnoses • Minimize recall/interview bias • Able to extract data from clinical
text (e.g., through natural language processing method)
• Require data manipulation • Uncertain completeness of data
from other physicians/sites • Unavailable confounders • Lack of information on clinical
data, OTC drugs, patient’s adherence
• Complex and costly of computer hardware and software
• US: HMORN, VA data, PPD, Cerner’s Health Facts Database
• UK: GPRD, THIN • The Netherlands:
PHARMO • Denmark: OPED,
AUHD • Other: IMS Disease
Analyzer Ad-Hoc Studies De Novo: Field study
• Epidemiologic studies in which data are collected in the field for evaluating specific hypothesis
• At least partially enroll the subjects and collect data
• Mostly, self-reported data about medication use (recall or brown bag medication inventory)
• More rigorous defined outcomes • Feasible to enroll subjects with
very rare conditions • Feasible to obtain
information/confounders not collected in the pre-existing databases
• Capture actual medication use (prescription, OTC medications and dietary/herbal supplements)
• Time-consuming • Relatively expensive • Logistic challenges • Completeness of ascertainment
of drug exposure varies from different study designs: e.g., recall accuracy on drug exposure in case-control study
• Potential biases influencing study validity
Studies in the elderly: CHS, EPESE, Health ABC, NSHAP, MrOS, SOF, WHAS, WHI

39
Table 3 (Continued)
Sources Characteristics Advantages Limitations / Biases Examples Special Types of Ad-Hoc Studies Case-control surveillance (CCS)
• Started in 1976 at collaborating hospitals in Boston, Baltimore, New York and Pennsylvania, U.S, A
• Multiple case-control studies are conducted simultaneously
• Relies on self-reported of regular or long-term medication and dietary supplement use for 43 indications or medication categories
• Large sample size • Including OTC and dietary
supplement • Ability to access the effect of
a drug use that occurred in the distant past or long duration of exposure
• Accurate outcome data from hospital discharge summary and pathology reports
• Selection bias due to hospital-based case-control studies
• Difficulties in validating self-reported OTC medication and dietary supplements
• Potential misclassification of drug use
• Dose of drugs was not collected
Slone Survey
Prescription-event monitoring (PEM)
• Also called yellow-card system • Since 1981, PEM systematically
monitors the safety of targeted medications in cohorts of 10,000-15,000 patients in England
• Questionnaires are sent to general practitioners to request information on specific drug use and events
• Single-cohort design
• Large sample size • Representativeness of patients
treated in real-world clinical practices
• Ability to examine adherence to prescribing guidelines
• Examine drug utilization and safety in special populations
• Medication exposures derived from dispensed prescriptions with validations from prescribers
• Complete collections of outcome events
• Absence of data on an unexposed comparator
• Selection bias from preferential prescribing
• Unpredicted patterns of adoption of a new drug
• Non-response questionnaires • Possible under-reporting of
serious/fatal adverse events • Misclassification bias depend on
patient’s adherence, accuracy in physicians’ diagnosis
• Inability to control/adjust all the confounders
• Cannot study drugs used in hospitals
Specifically refer to PEM in England

40
Table 3 (Continued)
Sources Characteristics Advantages Limitations / Biases Examples Registry • An organized system that uses
observational study methods to collect uniform data to evaluate specified outcome of a population defined by a particular disease, condition or exposure
• Used for monitoring public health intervention and systematic collections of data on people with shared characteristics
• Uses extended to patient support effectiveness/safety evaluations, characterization of clinical presentation of diseases
• Ability to simultaneously collect detail clinical, administrative information
• Flexibility to adapt over time to accommodate new research questions and purposes
• Better representing the situations in real-world practices
• Ability to follow patients over long periods of time
• Lack of pre-specified hypotheses if registries are designed to provide an adaptive framework for evaluating treatment
• Difficulties in explaining the observed effects if lack of comparison groups
• Selection bias if recruiting subjects preferentially
• Discouraging reporting rate if data collection systems are hard-to-use
The Surveillance, Epidemiology, and End Results (SEER) program of the National Cancer Institute in the US
Abbreviations: AUHD: Arhus University Prescription Database; BCLHD: British Columbia Linked Health Database; CHS: Cardiovascular Health Study, EPESE: Established Population for Epidemiological Studies of the Elderly, FDA: US Food and Drug Administration; GPRD: General Practice Research Database; Health ABC: Healthy, Aging and Body Composition Study, HMORN: Health Maintenance Organization Research Network; IMS: Intercontinental Marketing Services; NSHAP: National Social Life, Health and Aging Project, MrOS: Osteoporotic Fractures in Men, OPED: Odense University Phamacoepidemiological Database; OTC: over-the-counter; PHARMO: PHARmacoMOrbidity Linkage System Database; PPD: Premier ProspectiveTM Database; SOF: Study of Osteoporosis Fractures, THIN: The Health Improvement Network; VA: Department of Veterans Affairs Heath Care System; WHAS: Women’s Health and Aging Study, WHI: Women’s Health Initiative; WHO: World Health Organization

41
1.3.1 Automated Data Systems (or Computerized Healthcare Data)
Since 1980, automated databases (or computerized healthcare data) containing medical care data
became an excellent source of data for pharmacoepidemiologic studies, especially for very rare
adverse events (incidence rate <1 in 10,000).78 Databases that contain health information can be
generally divided into two categories: administrative/claims database and electronic health
records (EHR, or electronic medical records [EMR]). Claims data arise from a person’s use
of the health care system (pharmacy, hospital, physician) and the submission of claims to
insurance companies for payment.78 EHRs are used by clinicians in the delivery of care to
patients. They consist of pharmacy, primary care and hospital databases including information
such as clinical observations, lab test results, and prescriptions.78 Since claims data arise from a
system not designed for research or clinical care, linking to EHRs improves the range of data for
research purposes. A research study may link de-identified claims data from a population of
patients diagnosed with a particular condition such as hypertension, with de-identified clinical
data on everything from a patient’s body mass index, blood pressure, symptoms and more, while
maintaining patient privacy and full compliance with HIPAA standards. This linkage enables
researchers to assess the effectiveness of medical treatments, prescription adherence, and disease
management based on extensive clinical and administrative data including hospitalizations,
ambulatory visits, filled prescription, cost, and reimbursements. The existing automated
databases in the US available for pharmacoepidemiologic research include Health Maintenance
Organization Research Network (HMORN), Kaiser Permanente Medical Care Program (KP-
MCP), Group Health Cooperative (GHC), US government claims databases (e.g., Medicaid,
Medicare), other commercial insurances (e.g., HealthCore, UnitedHealth group, Ingenix

42
Research database), and in-hospital databases (e.g., Pediatric Health Information System and
Premier ProspectiveTM Database).78-82 The General Practice Research Database (GPRD), the
Health Improvement Network (THIN) in UK, the Department of Veterans Affairs (VA) Heath
Care System in the US, and the Intercontinental Marketing Services (IMS) Disease Analyzer are
the most well-known and widely used examples of EHRs.83 Moreover, pharmacy-based medical
record linkage systems, which integrate multiple autonomous databases with a primary
pharmacy-based dispensing database into a single system, have been established in the Nordic
countries (e.g., Danish Odense University Pharmacoepidemiologic Database [OPED] and Arhus
University Prescription Database [AUHD]] and the Netherlands (PHARmacoMorbidity linkage
system [PHARMO]).84 The International Society for Pharmacoeconomics and Outcomes
Research (ISPOR) provides a useful electronic index (digest) of 327 databases worldwide (119
in the US; available at http://www.ispor.org/DigestOfIntDB/CountryList.aspx). The Digest
consists of key attributes of each health care database. It is grouped by country and allows both
key word searches and searches by type of database.85
In general, automated databases are quite accurate representations of drug prescribing and
are often considered the “gold standard” among medication data sources.86,87 The major
advantages of automated databases are their ability to provide very large sample sizes, relatively
inexpensive, minimization of recall and interviewer biases, and ability to calculate incidence
rates (mainly for claim database; some EHRs can only obtain prevalence).88-90 Automated
databases can also be used to assess clinician and patient adherence to evidence-based
pharmacotherapy.91 Grymonpre et al. showed the high concordance between the rates of
prescription refills from and pill counts.92 In addition, one may extract valuable, research-quality
data from clinical texts in EHRs through developing methods (e.g., natural language processing

43
methods).83 Several limitations of the automated databases include the uncertain validity of
diagnosis data (especially for the claims databases and outpatient data), lack of information on
some potential confounding variables (e.g., alcohol consumption, diet, physical activity), lack of
information on non-prescription medications (e.g., non-steroidal anti-inflammatory drugs) or
outside of the particular insurance carrier’s prescription plan, instability of the population due to
job changes or employment status (for claim-based data), restricted generalizability to certain
population (e.g., patients without coverage or with insufficient insurance not included), expense
or difficulty in obtaining permission to use the data, and lack of information on actual use by
patients and adherence to treatments.88-90 Although the size of most individual automated
databases is quite large, a study using these might still be underpowered to detect very rare
outcomes or outcomes that only occur a long time after drug exposure. The power can further be
increased by combining data from different region- or country-specific databases into one
analysis set through the unique linkage system. This is relatively new development within the
field of pharmacoepidemiologic research. For example, this principle of database linkage is
being used in studies of the potential teratogenic effects of a drug where a prescription database
is linked to a pharmacy database and a birth registry.93
Research based on automated data plays an important role in pharmacoepidemiology.
Automated data systems will become even more evaluable as larger, more effective records
linkage systems are implemented. The ideal automated database would include records from
both in- and outpatient care, emergency care, mental care, clinical measurements (laboratory,
radiological, pathology tests), medication data (prescription, over-the-counter [OTC]
medications, dietary/herbal supplements), and other potential confounders (e.g., smoking status,
alcohol use, body mass index, disease severity marker, physical activity). Other requirements of

44
an ideal database are population-based, that all parts are easily linked by means of a patient’s
unique identifier, that the records are updated regularly, verifiable/traceable, and reliable.78,89
1.3.2 Field Study (or Ad Hoc Studies)
Epidemiologic studies in which data are collected in the field for the purpose of evaluating a
specific hypothesis are known as “field” or “ad hoc” studies.94 In contrast with studies using
pre-existing data, field studies enroll the subjects and collect data (at least partially) to answer a
specific research question. Several special types of ongoing field studies such as case-control
surveillance, prescription event monitoring, and registries will be described in the next section.
The completeness of ascertainment of drug exposure varies across different study designs
depending on how the participant is questioned and the specificity of the questions asked. In
case-control studies, questions on medication use can range from open-ended (e.g., did you take
any drugs in the last month?), to ask about the use of specific medications of interest by name,
and to even showing the participants cards with specific drug names on them.94 Mitchell et al.
found that 0-45% of the use of a number of drugs was identified by asking an open-ended
question, 35-81% by asking a structured list of selected indications, and 19-48% by asking a
specific name.95 A diary of life events is commonly used as a memory aid for obtaining drug
exposure information. For obtaining recent medication use, requesting subjects to check the
medication packages or using product photographs seems to be helpful.96 However, case-
controls studies may be more likely to have recall bias (e.g., cases are more likely to remember
drug use than controls).

45
In cohort studies, a “brown bag” medication inventory through in-person interviews or
phone surveys is used to collect actual medication use.97,98 Typically, for prescription
medications, interviewers will either read or ask the participant to read the name, strength,
frequency of the medication and the direction for use of the labels from the original prescription
bottle. Asking participants how many units or tablets/capsules they took over the previous day,
week or month is helpful to assess consistency with the prescribed directions.99 A similar
technique is repeated for over-the-counter medications and dietary/herbal supplements, except
that strength and directions for use are not usually queried because many of these drugs are taken
as needed and having multiple ingredients. The correct coding and identification of dietary
supplements can be difficult since many pharmacotherapy sources do not have complete
information regarding these agents.99 A common approach is for interviewers to ask the
participants to identify the supplement’s manufacturer so a further search may be conducted.
Several studies show that the validity of self-reported medication use by older adults is
reliable.100-102 The recall accuracy for past medication use leads most surveys of older adults to
limit the recall period to the recent past (e.g., 1-4 weeks).99
Compared to studies using information from pre-existing databases, the strengths of field
studies include more rigorously defined outcomes (not only replying on diagnosis codes),
increased feasibility of enrolling subjects with very rare conditions (unless using a large
government databases or linking multiple databases for other sources), and increased feasibility
of obtaining more comprehensive information (e.g., OTC drugs, herbals and other supplements,
alcohol and tobacco consumption, and patient-reported quality of life).94 The limitations of field
studies include being time-consuming, relatively expensive, having logistical challenges in
enrollment and data collections, and potential biases that can influence study validity. In

46
addition, many questions in pharmacoepidemiology are urgent in nature, especially if driven by
regulatory concerns; thus, the long lead-time required to conduct field studies can be a
significant barrier that must be balanced against the requirement for information that cannot be
obtained by other approaches.94
1.3.3 Case-Control Surveillance, Prescription-Event Monitoring, and Registry
Case-Control Surveillance (CCS) was begun in 1976 and the data collection took place at
collaborating hospitals in Boston, Baltimore, New York and Pennsylvania until 2009.103 In CCS,
multiple case-control studies are conducted simultaneously in order to monitor the effects of
prescription and OTC medications and dietary/herbal supplements on the risk of various
diseases, particularly cancers. CCS relies on self-report of regular or long-term medication and
dietary supplement use (name, timing, frequency and duration) for 43 indications or medication
categories (e.g., headache, cholesterol-lowering). CCS collects many factors that may confound
or modify drug-disease association. The strengths of CCS include its large sample size and high
statistical power, systematically assessing OTC medications and dietary/herbal supplements in
addition to prescription medications, ability to assess the effect of drug use that occurred in the
distant past or use with long duration of exposure, ability to control for potential confounders,
and accurate outcome data (confirmed from the hospital discharge summary and pathology
report). Several limitations of CCS include potential selection bias due to hospital-based case-
control studies, difficulty in validating self-reported OTC medications and dietary/herbal
supplement use, potential misclassification of drug use, and lack of dosage information.32,103

47
Since 1981, Prescription-Event Monitoring (PEM, or yellow-card system)
systematically monitors the safety of targeted new medicines in cohorts of 10,000-15,000
patients in England. PEM is complementary to spontaneous reporting of suspected ADRs.104
PEM selects new medicinal products which are expected to be widely used in general practice, or
established products with a new indication or extending usage to a new population, and sends
questionnaires to general practitioners to request information on specific medications use and
medical events. PEM offers opportunities for better quantification of ADRs and identifies and
characterizes some ADRs which were unrecognized during premarketing development and are
not possible to quantify through spontaneous reporting.104 The strengths of PEM include: (1)
large sample size, (2) representativeness of patients treated in “real-world” clinical practices, (3)
ability to examine adherence to prescribing guidelines and drug utilization and safety in special
populations (e.g., children, elderly, pregnant women and with off-label use), (4) opportunities for
following up subgroups of patients of interest and generating or strengthening signals of ADRs
or diseases, (5) more accurate medication exposure data derived from dispensed prescriptions
with validation from prescribers, and (6) complete collections of outcome events (regardless of
recognized ADRs or unrecognized syndromes). Several limitations of PEM include: (1) absence
of data on an unexposed comparator due to the single-group cohort design, (2) potential selection
bias from preferential prescribing, (3) unpredicted patterns of adoption of a new drug, (4) non-
response to questionnaires, (5) possible under-reporting of serious and fatal adverse event, and
(6) misclassification bias depending on patients’ adherence and the accuracy and thoroughness of
the general practitioners in diagnosis. Furthermore, there is an inability to collect and control for
all potential confounders, a restricted statistical power and sample size to detect very rare ADR,
and an inability to study drugs used in the hospital.104,105

48
A registry is an organized system that uses observational study methods to collect
uniform data to evaluate specified outcomes for a population defined by a particular disease,
condition, or exposure and serves a predetermined scientific, clinical or policy purpose.106
Traditionally, registries were either population-based tools for monitoring public health
interventions (e.g., records of receipt of childhood vaccines), collections of data on people with
shared characteristics (e.g., disease registries, birth defects, HIV) or other systematic programs
for case ascertainment and recruitment. Recently, registry methods extend to a variety of
purposes such as patient support activities, evaluating safety and effectiveness of marketed
products, health interventions, and characterizing clinical presentation and progression of
diseases. The strengths of registries include: (1) the ability to simultaneously collect detailed
information (e.g., clinical and medical data, paper/electronic health records, and administrative
data), (2) flexibility to adapt over time to accommodate new research questions and purposes, (3)
better at reflecting the safety and effectiveness of medical interventions in real-world practice
than clinical trials, and (4) ability to follow patients over long periods of time. The limitations of
registries include: (1) a lack of pre-specified hypotheses of registries that are designed provide an
adaptive framework for evaluating new treatment, (2) having difficulties in explaining whether
the observed effects are due to the intervention or are merely a characteristic of the type of
people if lack of comparison groups, (3) selection bias if recruiting subjects non-randomly or
preferentially, and (4) discouraging reporting rate if data collection systems are hard-to-use.107
For example, the Surveillance, Epidemiology, and End Results (SEER) program of the National
Cancer Institute in the US provides statistics for monitoring of cancer disease burden since 1973,
drawing on 18 cancer registries in 14 states that collectively represent 28% the US population.108
In pharmacoepidemiology studies, with approval, researchers may be granted access to the

49
SEER-Medicare linked data files to obtain medication use information prior to, during, and
following cancer diagnosis and treatment in the elderly.109
1.3.4 Summary
It is important to tailor the choice of pharmacoepidemiology data sources to the research
question to be addressed. More than one data collection strategy or sources, in parallel or
combination may be used. By considering the characteristics of pharmacoepidemiology
resources available, as well as the characteristics of the research question to be addressed,
choices of data resources that are best suited to addressing the question at hand can be made.

50
1.4 AVAILABLE DRUG CODING SCHEMES AND CLASSIFICATION SYSTEMS
Appropriate coding and classification of medications can make a major contribution to efficient
data management and analyses. However, little is published reviewing and comparing different
drug coding schemes and classification systems. In this section, major available drug coding
schemes including the National Drug Code (NDC),110 WHO Drug Dictionary (WHO-DD),111
Iowa Drug Information System (IDIS)112, the Slone Drug Dictionary,113,114 Medi-Span®, Lexi-
DataTM (or Cerner Multum’s Lexicon),90 First DataBank,115 Veteran Health Administration
(VA) National Drug File Reference Terminology (NDF-RT) and RxNorm/RxNav116 will be
described. Table 4 summarizes the characteristics of each coding scheme and its classification
system. These drug coding schemes integrated with the classification systems facilitate the
identification and grouping of agents with similar pharmacologic properties and therapeutic uses.
Two systems, the Anatomical Therapeutic Chemical (ATC) Classification System and American
Hospital Formulary Service (AHFS) Pharmacologic-Therapeutic Classification®, are commonly
used in pharmacoepidemiologic studies. While no single classification system is comprehensive
for all medications, both are well suited for coding most drugs used in Europe and the U.S,
respectively and are proven practical useful.112

51
Table 4. Overview of Available Drug Coding Schemes
Coding Schemes (Abbreviations)
Characteristics Coding Example (Simvastatin)
Example(s) Using the Coding Scheme
National Drug Code (NDC)110
• Maintain by the U.S Food and Drug Administration • Designed for inventory management and reimbursement • 10 digits (3 segment code):distributor/manufacturer/re-packager,
product, and package size • Do not provide unique codes for drug ingredients
0006-0740-31 Manufacturer: Merck, Sharp & Dohme; Product: Zocor® 20mg/tablet; Package size: 30 tablets/bottle
Community and nursing home pharmacies
WHO Drug Dictionary (WHO-DD)111
• ATC classification system conjunction with the DDD method • ATC system: 5 hierarchical levels: a main anatomical group; 2
therapeutic subgroups, a chemical –therapeutic subgroup, and a chemical substance subgroup
• Contains primarily European drug names and their ingredients • Contains an herbal dictionary based on the Herbal ATC system • Yearly updated
C10AA01 C: cardiovascular system; C10: Lipid modifying agents; C10A: Lipid modifying agents, plain; C10AA: HMG CoA reductase inhibitors
Italian group of pharmacosurveillance in the elderly study (Gruppo Italiano di Farmacovigilanza nell’ Anziano GIFA) study112
Iowa Drug Information System (IDIS)112
• Modified version of AHFS Pharmacologic Therapeutic Classification • 4 hierarchical levels: 3 levels of therapeutic categories and one level
of chemical ingredient category • Mostly US prescription drug names linked to their therapeutic class
24060205 24: Cardiovascular agents 2406: Antilipemic agents 240602: Antilipemic agents-HMG-CoA reducatase Inhibitors
Health ABC,117 EPESE112
Slone Drug Dictionary114
• Use AHFS Pharmacologic Therapeutic Classification • Contains US and non-US drugs, and supplements and other non-
prescription products • Multi-component products are cross-linked with their individual
ingredients • Have “Coalitions”, epidemiologist-defined groups
560622: Simvastatin, single component drug, under AHFS classification code 24:06:08:00 (cardiovascular/antilipemic/HMG-CoA reductase inhibitors), under coalition 790106 (HMG-CoA reductase inhibitors)
Studies using data from Slone Survey96,118
Medispan®119 • Use the Generic Product Identifier (GPI) system • Modified AHFS Pharmacologic Therapeutic Classification • Includes drug information, clinical decision support and disease suite
modules, and application programming surface • Includes NDC, Universal product codes • Cross reference to RxNorm, uniform system of classification
GPI (14 digits): 394000750003XX 39 (drug group): cardiovascular agents; 3940 (drug class): HMG-CoA reductase inhibitors; 394000 (drug subclass): none; 39400075 (drug name): simvastatin; 3940007500 (drug name extension): none; 394000750003 (dosage form): Tablet 39400075000330 (strength): 20 mg
CHS98

52
Table 4 (Continued)
Coding Schemes (Abbreviations)
Characteristics Coding Example (Simvastatin)
Example(s) Using the Coding Scheme
Lexi-DataTM (or Multum®)120
• Use Multum’s Therapeutic Categorizations that are organized into a 3-level hierarchy permitting classification at the therapeutic, pharmacological and drug category levels.
• Modified AHFS Pharmacologic Therapeutic Classification • Monthly update the new drug availability and other drug
information from FDA and pharmaceutical manufacturer announcements and publications to research findings
• Can cross-link to NDC and therapeutic drug classes
• Simvastatin 20mg oral table: Multum Mediasource Lexicon (MMSL) numeric code: 3083; or MMSL with term type: CD3083, CD indicates as clinical drug;
• Linked to 3-levels: level 1=358 (metabolic agents), level 2=019 (anti-hyperlipidemic agents), level 3=173 (HMG-CoA reductase inhibitors)
NHANES,121 MEPS,122,123 NSHAP120, NAMCS and NHAMCS124
First DataBank (FDB)115 • Use FDB Enhanced Therapeutic Classification system, an 8-character numeric identifier (ETC_ID)
• Aggregates drug information on indications, drug-disease contraindications, side effects, drug/drug and drug/food interaction, allergy
ETC_ID level 1: cardiovascular therapy agents: 00002553 (or 2553), ETC_ID level 2: antihyperlipidemic agents: 00000263 (or 263), and ETC_ID level 3: HMG-CoA reductase inhibitors: 00002747 (or 2747).
A data book of Medicare Part D Program from the MedPAC 125
Veterans Health Administration (VA) National Drug File-Reference Terminology (NDF-RT)126
• Non-proprietary drug terminology system • NDF-RT includes drug knowledge (e.g., disease-based
interactions) and classifies drugs, most notably by mechanism of action, physiologic effect, and therapeutic categories
• Use five-character alpha-numeric codes for classify a drug
Simvastatin under drug class CV350 CV350: Antilipemic drugs; CV: Cardiovascular medication
Studies using VA medication data
RxNorm/ RxNav116 • Non-proprietary drug terminology system • NLM repository of standard names (active ingredient, strength,
dose form) for clinical drugs and assign a concept unique identifier (CUI)
• Generic and branded normalized forms are related to each other and to the names of their individual components by a well-defined set of named relationships
• Link to First DataBank National Drug Data File Plus, Micromedex, Medi-Span®, Gold Standard, Multum, and VA NDF-RT
• Does not include drug knowledge
Simvastatin 20 mg oral tablet [Zocor®] RXCUI: 104491
TEDDY127
Abbreviations: AHFS: American Hospital Formulary Service; ATC: Anatomic Therapeutic Chemical; CHS: Cardiovascular Health Study; DDD: defined daily dose; EPESE: Epidemiologic Studies of the Elderly survey; Health ABC: Healthy Aging and Body Composition Study; MedPAC: Medicare Payment Advisory Commission; MEPS: Medical Expenditure Panel Survey; NAMCS: National Ambulatory Medical Care Survey; NHAMCS: National Hospital Ambulatory Medical Care Survey; NHANES: National Health and Nutrition Examination Survey; NLM: National Library of Medicine; NSHAP: National Social Life, Health and Aging Project; TEDDY: The Environmental Determinants of Type 1 Diabetes in the Young; WHO: World Health Organization

53
1.4.1 National Drug Code (NDC) in the US
Most pharmacies in the U.S use computer systems that automatically convert alphabetically
entered drug product names into corresponding NDC numbers. The NDC was designed for
inventory management and reimbursement. The NDC is 10-digit-code consisting of three parts
delimited by dashes: a manufacturer code, a product code and a package size code (e.g., 0006-
0740-31: Merck Sharp & Dohme, Zocor® 20mg/tablet, 30 tablets/bottle).110 It does not provide
unique codes for drug ingredients. For example, any one drug product (e.g., simvastatin 20 mg
tablet) can be represented by numerous codes since there may be various manufacturers (brand
and generic) and package sizes (e.g., 100-count bottles, unit-dose packages). To avoid problems
associated with numerous NDC codes for each drug, other drug coding schemes with
hierarchical levels (e.g., WHO-DD or IDIS) can be combined with NDC codes to facilitate
analytical process.
1.4.2 The Anatomical Therapeutic Chemical (ATC) Classification System and WHO
Drug Dictionary (WHO-DD)
The WHO-DD includes drug names linked to the ATC Classification System, which is generally
used in conjunction with the defined daily dose (DDD) method to standardize doses.128 The
WHO-DD contains primarily European drug names and their ingredients, and an herbal
dictionary based on the Herbal ATC system (HATC) as well.129 This is a five-level hierarchical
system including a main anatomical group, two therapeutic subgroups, a chemical/therapeutic

54
subgroup, and a chemical ingredient (e.g., simvastatin: C10AA01). Products are classified
according to the main therapeutic indication for the principal active ingredient. Most products
are assigned only one ATC code. However, some active ingredients may have more than one
ATC code, if the drug has different uses at different strengths (e.g., aspirin as a platelet
aggregation inhibitor and as an analgesic–antipyretic), dosage forms (e.g., timolol to treat
hypertension and to treat glaucoma) or both (e.g., medroxyprogesterone for cancer therapy and
as a sex hormone).130 Prednisolone is an example of a drug that has six different codes. Fixed
dose combination products pose classification difficulties. For example, a combination product
that contains and analgesic and a tranquilizer is classified as an analgesic, even though it also
contains a psychotropic substance.130 In addition, the ATC does not distinguish chemicals by
dose-form or strength and assigns classes based on main therapeutic indication, so less common
uses may be omitted.131
1.4.3 The American Hospital Formulary Service (AHFS) Pharmacologic-Therapeutic
Classification® and Related Coding Schemes
The AHFS Pharmacologic-Therapeutic Classification® was developed and is maintained by the
American Society of Health-System Pharmacists (ASHP). The AHFS Pharmacologic-
Therapeutic classification® allows the grouping of drugs with similar pharmacologic,
therapeutic, and/or chemical characteristics in a 4-tier hierarchy. There are 31 classifications in
the first tier, 185 in the second tier, 256 in the third tier, and 94 in the fourth tier.132 For example,
the AHFS classification number for aspirin is 28:08.08.24 (Central Nervous System Agents:
28:00; Analgesics and Antipyretics: 28:08; Nonsteroidal Anti-inflammatory Agents: 28:08.04;

55
Salicylates: 28:08.04.24).133 A drug may have multiple classes (due to its indication, mechanism
of action, or route of administration) and all classes for a drug are considered equally valid. For
example, labetalol has AHFS classification numbers: 24:24 (β-Adrenergic Blocking Agents),
24:04.04.16 (Class II Antiarrhythmics), 24:08.04 (α-Adrenergic Blocking Agents), and 24:08.08
(β-Adrenergic Blocking Agents). In addition, combination products inherit all of the
classifications of the individual active ingredients since the AHFS classification is assigned to
the active ingredient.132 In the next few paragraphs, coding schemes based on the modifications
of AHFS Pharmacologic-Therapeutic Classification® will be briefly described.
The IDIS scheme represents a modification of the AHFS Pharmacologic Therapeutic
Classification.133 The IDIS scheme includes most of the US prescription drug names linked to
their therapeutic class. The IDIS code has eight numeric digits, two digits per level. The first six
digits of the drug code identify the hierarchical therapeutic class to which the drug term was
assigned (e.g., simvastatin: 24060205).112 The seventh and eighth digits are assigned by the IDIS
and had no hierarchical meaning. The main difference between WHO-DD and IDIS scheme is
that WHO-DD has specific codes for combinations of ingredients, while IDIS codes each
ingredient separately.112 The advantage of IDIS over the NDC and other coding systems is that it
provides codes for OTC medications and dietary supplements.
The Slone dictionary developed and maintained by the Slone Epidemiology Center, is a
computerized linkage system composed of single medication components and multi-component
products. The Slone dictionary contains US and non-US prescription drugs, and in addition it
includes OTC products, vitamins and dietary supplements.113,134 Each product is assigned a
unique number and links to its active ingredients; each active ingredient is classified by AHFS
Pharmacologic Therapeutic Classification; the Dictionary includes “coalitions”, which are

56
epidemiologist-defined groupings of drugs and drug products that can be used in various
analyses.113 The Slone Survey was used in many pharmacoepidemiologic studies and the Slone
Epidemiology Data Center published three annual reports (2004-2006) on medication use in the
U.S.135
Other drug coding schemes use principles similar to those of AHFS and ATC
classification systems and provide tables for mapping NDCs to their clinical drug codes, which
offers increased flexibility or specificity for an individual drug product. These commercial
coding schemes usually integrate with drug information or knowledge databases (e.g., pricing,
adverse effects, dosing, and cross-references to NDC, RxNorm or other coding systems or
schemes), clinical decision support and disease suite modules and other applications or
programs. Other systems used in commercial drug coding schemes such as the Generic Product
Identifier (GPI) system from Medi-Span® (Wolters-Kluwer Health, Inc., Conshohocken, PA),119
Multum’s Therapeutic Categorization in the Lexi-DataTM (Cerner Multum, Inc. Denver, CO),90
and First DataBank Enhanced Therapeutic ClassificationTM System (First DataBank, Inc., San
Bruno, CA)®.115
Medi-Span® incorporates the AHFS Pharmacologic-Therapeutic System and groups
drugs with comparable compounds in the same therapeutic class through the GPI. 119 The GPI, a
hierarchical classification scheme, is a 14-digit field consisting of seven subsets, each providing
increasingly more specific information about the drug (i.e., drug group, class, sub-class, name,
name extension, dosage form, and strength). 136 For example, the GPI for simvastatin tablet 20
mg is 39400075000330 (39: cardiovascular agents; 3940: HMG-CoA reductase inhibitors;
394000: no sub class; 39400075: simvastatin; 3940007503: tablet (PO); 394000750330: 20 mg).
Products having the same 14-digit GPI are identical with respect to active ingredient(s), dosage

57
form, route of administration and strength or concentration.136 The same drug may be classified
in multiple therapeutic classes.
Lexi-DataTM incorporates four distinct therapeutic/chemical classification systems
including Multum’s Therapeutic Categorization, Lexi-Comp’s Pharmacologic Category,
Therapeutic Duplication Categorization, and Allergic Cross-Reactivity Categorization, to support
different types of use.137 In general, Multum’s therapeutic categorizations are based on the
AHFS therapeutic categories and are organized into a 3-level hierarchy permitting classification
at the therapeutic level, pharmacological level and drug category level.120 For example, for
simvastatin: the broadest category is metabolic agents [level 1=358]; the more detailed category
is antihyperlipidemic agents [level 2=019]; and the most detailed category is HMG-CoA
reductase inhibitors [level 3=713]). Not all drugs have three classification levels; some may
only have two [e.g. for digoxin: cardiovascular agents [level 1]; inotropic agents [level 2]),
others only have one.124 Beginning with 2006, multiple-ingredient drugs are assigned a single
generic drug code encompassing all of a drug's ingredients, rather than being assigned generic
drug codes for each ingredient.124
The First DataBank Enhanced Therapeutic Classification System is an advanced drug
classification system with virtually unlimited levels of specificity, for easy formulary
maintenance and drug selection. It allows drugs to reside in multiple therapeutic classes, with
links to drug concepts at any level of the hierarchy.115 The First DataBank Enhanced
Therapeutic Classification identifier (ETC_ID) is an eight-character numeric column that
identifies a unique therapeutic classification. This number is a stable identifier permanently
associated with the ETC description. For example, simvastatin has three levels of ETC_ID:
ETC_ID level 1: cardiovascular therapy: 00002553 (or 2553), ETC_ID level 2:

58
antihyperlipidemic agents: 00000263 (or 263), and ETC_ID level 3: HMG-CoA reductase
inhibitors: 00002747 (or 2747).115 In addition, multi-ingredient formulations are represented
with a single class description (for example, ACE inhibitor and calcium channel blocker
combination).
1.4.4 US National Drug File Reference Terminology (NDF-RT) and Veterans Health
Administration (VA) Drug Class Index
The VA NDF-RT is a non-proprietary drug reference terminology that includes drug knowledge
and classifies drugs, most notably by mechanism of action, physiologic effect and therapeutic
category.126 The VA drug classes (approximately 400) are similar to the categories and classes
in the other classification systems. NDF-RT along with RxNorm (see the section 1.4.5) has been
accepted by a federal standards-setting body, as recommended standards. The VA drug
classification system uses five-character alpha-numeric code specifies a broad classification and
a specific type of product. The first two characters are letters and form the mnemonic for the
major classification. Character 3 through 5 are numbers and form the basis for sub-
classificaiton. For example, simvastatin is assigned to CV350 (CV: cardiovascular agents,
CV350: Antilipemic drugs). NDF-RT supports multiple indications and can identify specific
characteristics of each drug, which is a crucial capability of a classification system. The NDF-
RT contains a novel reference hierarchy to describe physiologic effects of drugs.126 The
physiologic effects reference hierarchy contains 1699 concepts arranged into two broad
categories organ specific and generalized systemic effects.126

59
1.4.5 RxNorm by US National Library of Medicine (NLM)
The lack of interoperability of among the terminologies used in the commercial coding schemes
was the primary motivation for the US National Library of Medician (NLM) to develop a public-
use coding scheme, RxNorm.116 RxNorm contains the names of prescription and many OTC
formulations that exist in the United States. A drug is assigned to a concept unique identifier
(CUI). Drugs whose names map to the same CUI are taken to be the same drug (i.e., identical as
to active ingredient, strength and dosage form). For example, the CUI for Simvastatin 20 mg
oral tablet [Zocor®] is 104491. RxNorm also provides normalized names for clinical drugs and
links drug names to other drug coding schemes including National Drug Data File Plus,
Micromedex, Medi-Span®, Gold Standard, and Multum. RxNorm also includes the NDF-RT
from the VA. The goal of the RxNorm is to allow various systems using different drug
nomenclatures to share data efficiently at the appropriate level of abstraction. The RxNorm
Navigator (RxNav) allows you to query the RxNorm database by any of its components.138
1.4.6 Summary
The coding system to be utilized depends on the objective of the study. Analyses of focusing on
beneficial or adverse effects of medications must consider drug ingredient. Therefore, the
coding system must allow for easy identification of the ingredients or combinations of
ingredients contained in the drug products.112 Drug coding schemes with hierarchical codes for
drug ingredients also make analysis easier and save time on programming. In other potential
studies involving the costs of drugs, it is essential to identify with a unique code the

60
manufacturer and the dosage form of each single drug product. However, various drug coding
schemes, while working well on their own, present a barrier when medical information systems
containing these varying names and codes need to be cross-linked or reconciled.139 An
international standardized nomenclature of drug names, codes and classification system will be
an ultimate solution to conducting global pharmacoepidemiologic studies and exchanging and
comparing health information and research outcome in public health.

61
1.5 BIAS AND CONFOUNDING IN PHARMACOEPIDEMIOLOGY
In order to obtain accurate and valid results derived from observational studies in
pharmacoepidemiology, several factors that must be considered including appropriate study
designs, inclusion/exclusion criteria, drug exposure and outcome measurements, the changing
phenomenon of drug exposure, potential biases, confounding factors (e.g., indications for
prescribing), medical adherence, and the natural course of the disease.140,141 In this section, the
importance of biases, sources of confounding and available solutions specifically for
pharmacoepidemiologic studies will be discussed and summarized in Table 5.
1.5.1 Bias and Available Solutions
In general, common threats to internal validity in pharmacoepidmeiology include selection bias
and information or misclassification bias. Bias must be prevented through attention to the proper
design and conduct of a study and cannot be routinely addressed at the analysis stage.142
Conceptually, bias can be introduced by factors related to who is included in the study (selection
bias), and errors of assessment and measurement (differential misclassification bias).

62
Table 5. Common Biases and Potential Solutions in Pharmacoepidemiology
Bias Definition/Characteristics Example Potential Solutions Selection Bias (the selection into the study groups of subjects who differ in characteristics from those in the target population) Referral • Occurs when drug exposure is associated with
the likelihood of referral into the institution where the study takes place (e.g., hospitals)
• Typically in hospital-based case-control studies • Frequently when a known/suspected association
of the drug with the outcome • Usually occurs when an outcome presents in a
manner such that an accurate diagnosis is not always obtained immediately
• From a perspective of medical surveillance, referral bias can be regarded as a type of detection bias
• Patients taking NSAIDs and presenting with mild abdominal pain may be more likely to be suspected as having a gastric ulcer and sent for further tests than patients with similar pain but without taking (results would be biased upward)
• Women exposed to oral contraceptives may be more likely to be subjected to diagnostic tests for deep venous thrombosis compared to women not exposed
• Restrict the participants to more serious cases of the disease
• Identify cases and controls from the same screening program
Self-selection • When study participants themselves decide to participate or leave a study based on drug exposure or change in health status
• Those who did not join the study might belong to a special disease-exposure category
• Particularly in case-control and retrospective cohort studies
• Mothers of children with birth defects who also have something to report (e.g., medications) may be more likely to participate (biased towards an increased risk)
• Systematically identify and recruit all eligible cases (e.g., select from population-based registries and prescription drug databases)
Prevalence • When prevalent cases rather than new (incident) cases are selected, usually in case-control studies
• Patients who stay on treatment for a longer time may be less susceptible to the event of interest
• Reflect an association with a prognostic factor rather than with incidence
• Observational studies “failed” to show initial harmful effect of hormone replacement therapy (biased towards null) due to combination of prevalent users who tolerate therapy (survivor cohort effect)
• Limit study recruitment incident cases with a clearly documented calendar time of diagnosis
Protopathic • Occur when the initiation, discontinuation, or modification of a drug occurs in response to a symptom of the outcome (at this point undiagnosed)
• Reflect a reversal association between outcome and drug exposure
• Usually in retrospective studies
• Estrogen was prescribed for uterine bleeding (before the diagnosis of endometrial cancer). This biased the result to increased risk of endometrial cancer with estrogen use.
• Have a full-understanding of the pathophysiologic mechanism of disease development
• Using “lag-time” (or an index date) to define drug exposure periods

63
Table 5 (Continued)
Bias Definition/Characteristics Example Potential Solutions Misclassification Bias (An error occurs when each time participants in a study are classified with regard to their drug exposure and disease status) Recall • A differential misclassification bias
• Systematic differences in how exposure groups or disease groups remember certain information
• More likely happen in retrospective studies, particularly case-control studies
• Mothers with children having birth defects may give more valid and complete report of their drug exposures during the pregnancy
• Select controls who are likely to have the same cognitive processes affecting memory of past drug exposures (e.g., alternative birth defects)
Detection • A differential misclassification bias • Can affect either cohort or case-control studies • Occurs when a presumably drug exposure leads
to a closer surveillance that may result in a higher probability of detection of subclinical outcomes in exposed individuals
• In case-control studies, if cases are more likely to be identified (or selected into the study) due to the exposure to a drug, detection bias can be regarded as a type of selection bias (i.e., referral bias)
• In a cohort study, women taking postmenopausal hormonal supplements are more likely to see their doctors and be detected cancer at early stages than other women. This differential follow-up may lead to an excess number of diagnosed diseases in the treated group and falsely elevated risk, or to more complete preventive care leading to decreased risk.
• In case-control studies, it occurs when the procedures for obtaining drug exposures are not similar in cases and controls (e.g., drug assessment is more thorough among cases)
• Blinding of relevant study personnel
• Standardization of the measurement process (e.g., specific training of interviewers)
• For the analytic purpose to detect the possibility of detection bias, information should be obtained on the frequency of access to medical care and health awareness by participants. Stratification by disease severity helps too.
Immortal-time • A differential misclassification bias • The exposed subjects will have a major survival
advantage over their exposed counterparts because they are guaranteed to survive or to be event-free at least until their drug was dispensed.
• Results of improper exposure definitions and analyses that cause serious misclassification
• More likely to occur in cohort studies
• Definition of exposed to inhaled corticosteroid: subjects who received their first prescription for an inhaled corticosteroid 90 days after cohort entry (90 days immortal time period)
• Time-dependent methods for analyzing risks may be used to account for complex changes in drug exposure and confounders over time (e.g., Cox proportional hazard models with time-dependent exposures)
• Nested case-control design • Active comparative groups
Abbreviations: NSAIDs: non-steroidal anti-inflammatory drugs

64
1.5.1.1 Selection Bias
Selection bias is a distortion of an estimated effect due to the selection into the study groups of
subjects who differ in characteristics from those in the target population.141 In
pharmacoepidemiology, four types of selection bias seem particularly important: referral bias,
self-selection bias, prevalence study bias and protopathic bias.140
Referral bias (or referral filter bias or Berkson’s bias or admission rate bias) can
occur when drug exposure is associated with the likelihood of referral into the institution where
the study takes place (often a hospital).143 Referral bias typically occurs in hospital-based case-
control studies and leads to a higher exposure rate among the hospital cases than the hospital
controls.144,145 This is frequently in the case when there is already a known or suspected
association of the drug with the outcome of interest, so referral to an institution where the
diagnosis is made is more likely for patients taking this drug.143 In addition, it usually occurs
when an illness or outcome presents in a manner such that an accurate diagnosis is not always
obtained immediately.140 From a perspective of medical surveillance, referral bias can be
regarded as a type of detection bias.144 An example of referral bias is a study of gastric ulcer in
which cases and controls are identified in the same referral hospital. Because a patient taking a
non-steroidal anti-inflammatory drug (NSAID) and presenting with mild abdominal pain may be
more likely to be suspected as having a gastric ulcer and sent for further tests than a patient with
similar pain but who is not taking a NSAID. This may bias the results towards increased risk
between NSAIDs use and mild non-bleeding gastric ulcer. Another example, knowledge of a
well-established association between deep venous thrombosis (DVT) and oral contraceptives
may make women exposed to oral contraceptives more likely to be subjected to diagnostic tests

65
for DVT compared to women not exposed. A general solution for addressing referral bias is to
restrict the study participants to more serious cases of the disease. The reason for this is that it
can be expected that for most diseases, regardless of previous drug exposure, all serious cases
will eventually be diagnosed correctly.140 Identifying cases and controls from the same
screening program can be another solution.144
Self-selection bias may occur when study participants themselves decide to participate or
leave a study based on both drug exposure and change in health status.140 Self-selection bias
may particularly occur in case-control or retrospective cohort studies because both outcome and
exposure are already manifested when study subjects are recruited. For example, mothers of
children with birth defects who also have something to report (e.g., medications) may be more
(or less) likely to participate. Also, those who are lost to follow-up in cohort studies might
belong to a special disease-exposure category. This can be controlled for by systematically
identifying and recruiting all eligible cases. Relying on population-based registries for case and
prescription drug ascertainment is an excellent way to minimize the occurrence of selection
bias.140
Prevalence bias may occur when prevalent cases rather than new (incident) cases are
selected for a study, which may occur in case-control studies. An association between drug use
and prevalent cases could thus reflect an association with a prognostic factor rather than with
incidence. In addition, patients who stay on treatment for a longer time (i.e., prevalent to drug
exposure) may be less susceptible to the event of interest. Limiting study recruitment to newly
diagnosed or incident cases with a clearly documented calendar time of diagnosis favors the
ascertainment of drug exposures that are relevant to disease incidence.140

66
Protopathic bias (or reverse causality bias) occurs when the initiation, discontinuation,
or modification of a drug occurs in response to a symptom of the outcome (at this point
undiagnosed).143 Protopathic bias reflects a reversal association between outcome and drug
exposure. It may particularly occur in case-control studies. For example, analgesics were used
in response to the pain caused by an undiagnosed tumor.146 Another example is that patients
could stop taking aspirin because of the presence of bloody stools. If the presence of blood was
the first expression of colon cancer, we would subsequently find a negative association between
current aspirin use and colon cancer. This scenario may particularly occur in
pharmacoepidemiology because diseases are often identified after their first clinical expression
and because exposure to drugs may change from day to day, frequently with changes in actual or
perceived health status. Therefore, it is critically important to have a full-understanding of the
pathophysiologic mechanism of disease development when designing pharmacoepidemiology
studies.140 A general solution to prevent protopathic bias is the use of “lag-time” (or an index
date) to define drug exposure periods. Using this approach, a specific time period before the
date of diagnosis with the disease under study would be excluded from the exposure assessment.
Tamim et al showed that the ORs stabilized at lag-time around 6 months using two methods.147
The goal to prevent selection bias is to recruit a study population that accurately
represents the target population concerning the drug exposure and outcome association.
Remedial strategies include random sampling from the source population, systematically
recruiting a series of consecutive subjects, implementing a tracking procedure for those who drop
out (e.g., document the reason and their health status), restricting to incident cases, and
minimizing the number of lost to follow-up (e.g., select adherent patients).

67
1.5.1.2 Misclassification Bias
Misclassification bias refers to the possibility of error when participants are classified with
regard to their drug exposure and disease status. There are two types of misclassification bias:
non-differential (or random) misclassification and differential misclassification (also called
information bias). Non-differential misclassification occurs when the degree of
misclassification is random or similar for all patients and independent of both drug exposure and
outcome status. It usually biases the results toward the null value, but may reverse the measure
of effect in some extreme circumstances. Differential or systematic misclassification can occur
when misclassification is related to drug exposure-outcome association. Differential
misclassification can bias results toward or away from the null hypothesis based on the
situations.141 In pharmacoepidemiology, common differential misclassification biases include
recall bias, detection bias, and immortal time bias.
Recall bias occurs if individual’s memories of exposure or outcome systematically differ
based on exposure or outcome status.142 It is more likely to happen in retrospective studies,
particularly case-control studies. For example, mothers with children having birth defects may
give more valid and complete report of their drug exposures during the pregnancy compared to
mothers with children without birth defects. In order to minimize this type bias, it is important to
select controls who are likely to have the same cognitive processes affecting memory of past
drug exposures (e.g., alternative birth defects). 140
Detection bias (or medical surveillance bias) can occur in cohort studies or case-control
studies. It occurs when a presumably drug exposure leads to a closer surveillance that may result
in a higher probability of detection of subclinical outcomes in exposed individuals (i.e., when
identification of the outcome is not independent of the knowledge of exposure).144,148 In cohort

68
studies, it is particularly likely when an exposure of a drug or therapy leads to frequent and
thorough checkups, and the outcome is a disease that characterized by a high proportion of
subclinical cases.141 For example, women taking postmenopausal hormonal supplements are
more likely to see their doctors and be detected cancer at early stages than other women. This
differential follow-up may lead to an excess number of diagnosed diseases in the treated group
and falsely elevated risk, or to more complete preventive care leading to decreased risk.140 In
case-control studies, it occurs when the procedures for obtaining drug exposures are not similar
in cases and controls (e.g., drug assessment is more thorough among cases). If cases are more
likely to be identified (or selected into the study) due to the exposure to a drug, detection bias
can be regarded as a type of selection bias (i.e., referral bias, see more details in the previous
discussion of referral bias).144 The potential solutions include blinding of relevant study
personnel and systematic standardization of the measurement process (e.g., specific training of
interviewers).140 If these strategies are not feasible (especially in case-control studies), to
examine the occurrence of this bias in the analysis stage, information should be obtained on the
frequency and quality of medical care received by the study participants, and variables that
indicate awareness of health problems.144 Finally, when detection bias occurs, the proportion of
less advanced disease in a cohort study is higher in the exposed group. In a case-control study,
the association is found to be stronger or present for less advanced cases. Therefore,
stratification by disease severity at diagnosis is an additional strategy to examine and take into
consideration the possibility of detection bias.144
In addition, immortal time bias (or immortal person-time) is increasingly common in
cohort studies of drug effects because drug exposure often changes over time (i.e., time-varying).
Immortal time usually arises when the determination of an individual’s treatment status involves

69
a delay or wait period during which follow-up time is accrued. This wait period is considered
immortal because individuals who end up in the treated group have to survive until treatment
definition is fulfilled.149 It is particularly problematic because it necessarily biases the results in
favor of the treatment under study by defining an artificial survival advantage to the treatment
group. Several criteria can be used to identify immortal time bias: (1) Was treatment status
determined after the start of follow up or defined using follow-up time? (2) Was the start of
follow-up different for the treated and untreated group relative to the date of diagnosis? (3) Were
the treatment groups identified hierarchically (one before the other)? (4) Were subjects excluded
on the basis of treatment identified during follow-up? (5) Was a time fixed analysis used?149 For
example, Sin et al. suggested inhaled corticosteroids given after hospital discharge were
associated with a 29% reduction in the rate of all-cause mortality among elderly patients
hospitalized for chronic obstructive pulmonary disease.150 The results may be biased due to the
immortal time bias. The exposed subjects who received their first prescription for an inhaled
corticosteroid 80 days after cohort entry had to be alive on day 90. Thus, the drug exposed
subjects will have a major survival advantage over their exposed counterparts because they are
guaranteed to survive or to be event-free (e.g., immortal time period: 90 days) at least until their
drug was dispensed. Time-dependent methods (e.g., Cox proportional hazard models with time-
dependent exposures) or nested case-control designs are recommended to use to account for
complex changes in drug exposure and confounders over time.51,151

70
1.5.2 Confounding
The biggest challenge in pharmacoepidemiology is to identify the appropriate designs, measures,
and analytic techniques to avoid or control confounding. Confounding occurs when the
estimates of a measure of association between drug exposure and the outcome(s) of interest is
masked by the effect of one or several extraneous variables that are also associated with drug
exposure and the outcome of interest (but not part of the causal pathway).140,152 Failing to
control for confounders can lead to spurious results.
Confounding by indication is probably the most important and challenging confounder
in pharmacoepidemiology. It is also widely referred to as indication bias, channeling,
confounding by severity, or contraindication bias.60,140,153 In general, confounding by
indication occurs when an observed association between a drug and an outcome is due to the
underlying diagnosis or other clinical features and not to any effect of the drug. Confounding by
indication describes the various factors related to an individual’s condition that determine the
initiation and choice of a specific drug (e.g., statins for patients with high cholesterol), and thus
comparisons of drug users to nonusers usually have to be made for patients sharing similar
indications or conditions, as the condition itself is commonly one of the most important risk
factors for the outcome of interest.143,154 The term broadly covers the more subtle considerations
affecting the choice of a specific drug among patients with similar indications (sometimes
referred to as channeling), relating to disease severity (confounding by severity), comorbid
conditions, contraindications, patient demographics, the drug’s adverse-effect profile, and
subjective impressions of the prescribing physician.143 For example, Laporte et al. reported that

71
upper gastrointestinal (GI) bleeding was associated with the use of selective COX-2 inhibitors.155
These results were confounded by the fact that the patients who were treated with COX-2
inhibitors were at higher risk of developing a GI hemorrhage independent of the COX-2 inhibitor
use. A possible solution in this scenario would be to select patients without any history of GI
bleeding and new users of NSAIDs.
However, Salas et al. suggested applying the term “confounding by severity” specifically
to the situation in which the severity of disease acts a confounder.156 Confounding by severity
should be considered a special form of confounding by indication, in which not only the disease
that forms the indication but also its severity (and complications) is a potential confounder. If
one controls for the disease (or indication) but not for its severity, the possibility of residual
confounding remains. Moreover, in the product information of registered medicines, the
indications for treatment pertain to diagnoses itself rather than to the severity of the
manifestation of their clinical patterns. Thus, when drug treatments are compared, controlling
for these indications does not preclude confounding by severity.156 In patients with type 2
diabetes, for instance, oral hypoglycemic agents are used early in the course of the disease, and
insulin is reserved for patients who have more severe disease or who have not responded to oral
agents. Because treatment type is correlated with disease severity and duration, it is difficult to
design a convincing observational study that compares oral agents with insulin for outcomes that
are related to disease duration or severity. Confounding by severity in observational studies
usually makes the therapy appears to be less effective it appeared in the experimental studies
(RCT can balance the severity distribution of the compared group).157 However, confounding by
severity can be useful for other purposes. For example, although a positive association between

72
β-agonists and asthma death was suspected to be confounded by disease severity, it can be
informative because the amount of β-agonist used can be a proxy of prognosis.158
Confounding by indication usually is not a problem or concern when a study is focusing
on unexpected drug effects or side effects (because the indication is usually not related to the
outcome), or the decision about whether to treat is not based on a formal indication (usually in
primary prevention such as routine measles vaccination in healthy infants).154 Ideally, under the
assumption of the choice between alternative treatments is effectively random, confounding by
indication may seem less of a problem when doing comparisons among multiple alternative
treatments. In practice, it is challenging to control for confounding by indication because
“indication” is a complex and multi-factorial phenomenon involving the physician’s knowledge,
the longitudinal nature of disease and other factors which may not be entirely evident and which
may act in different directions.140 If confounding by indication cannot be ruled out, RCTs are
preferred over non-experimental studies. If RCTs cannot be used, non-experimental study
designs can be used to qualitatively demonstrate some degree of beneficial effect. Specifically, if
confounding by indication is such that treated patients would have a worse clinical outcome than
untreated patients, yet the outcome observed in treated patients is better than that observed in
untreated patients, some degree of confidence that the drug has a beneficial effect can be built.154
Moreover, some potential solutions to prevent or control confounding by indication should be
considered (see section 1.5.3 for potential solutions) in non-experimental studies.
Moreover, when effect modification (or interaction) exists, the stratum-specific effect
provides more information than the overall adjusted results. Effect modification indicates a
variation in the drug effect, according to different levels of a third variable. Consequences of
this may lead to changes in prescribing practice or a better understanding of mechanisms.140 For

73
example, different dosage and potency are likely to have different effects that should be
presented in the analysis. Reducing the information related to drug exposure into an exposed
versus non-exposed group increases the possibility of misclassification, biasing the results
towards the null. It is important in pharmacoepidemiology to consider differences in drug dose
and potency in studying drug effects.
1.5.3 Available Solutions to the Confounding
The solutions available to minimize confounding in pharmacoepidemiologic can be broadly
categorized into: (1) approaches that collect more information on potential confounders and
apply efficient sampling designs to reduce the time and resources it takes to complete the study,
and (2) analytic approaches that try to make better use of the existing data with the goal of
improved control of confounding.49 Strategies to adjust confounding (at the design and/or
analysis levels) in non-experimental studies vary depending on several aspects, especially on
whether the potential confounders can be measured in a given study.158 At the design stage,
matching and restriction can be used to control for measured confounders, and crossover design
and active comparative group can be used to control for unmeasured confounders. Several
“analytic” methods can be used to overcome the confounding including standardization,
stratification, multivariate analysis, propensity scores, marginal structural models, two-stage
sampling, external adjustment, sensitivity analysis, and instrumental variable approach.159 Each
of them will be described briefly and subsequently.

74
1.5.3.1 Control for Measured Confounders at the Design Stage
Restriction and matching have in common that they can only adjust factors that are measured and
are then used either to restrict the study population or to identify strata of patients that are
homogeneous with regard to the risk of study outcome. Briefly, restriction allows the
investigators to examine one stratum of the confounding variable, which effectively removes the
effect of the confounder on the outcome. For example, if age is a confounder, then investigators
can restrict the study population to older adults. Similarly, matching removes the effects of the
confounder by forcing its distribution to be identical between groups of comparison.160
Matching is commonly used in case-control studies. Common matching factors are age, race,
sex, socioeconomic status and occupation. Matching may be of two types: (1) group match (or
frequency matching) and (2) individual matching. Group matching consists of selecting the
controls in a manner that the proportion of controls with a certain characteristics is identical to
the proportion of cases with the same characteristic (e.g., 25% married). This type of matching
generally requires that all of the cases be selected first. For individual matching, for each case
selected, a control is selected who is similar to the case in terms of specific variable(s).44 It
limits the generalizability to other populations if one chooses many variables to restrict study
participants. Similarly, the more variables that one chooses to match, the more difficult it will be
to find a suitable control. Once restriction or matching is used, one cannot study that
characteristic.44
75
1.5.3.2 Control for Measured Confounders at the Analysis Stage
Under the assumptions of no unmeasured confounding, usual strategies for controlling
confounding can be applied at the analysis stage including standardization, stratification,
multivariate modeling and marginal structural models.
Standardization is often used for comparing vital statistics from populations that have
different age or sex distribution. A standardized rate is a weighted average of stratum-specific
rates. There are two methods of standardization: direct and indirect. The factors that can be
managed by standardization are limited (two to three at most). Use of standardization in
pharmacoepidemiology is limited since pharmacoepidemiologic research usually requires the
manipulation more than three factors.140
Stratification uses confounding factors to identify strata of patients that are homogenous
with regard to the risk for the outcome. The limitation of stratification is that each time a new
factor is added, stratum-specific cell sizes become smaller, and the probability of having people
not exposed or not sick in each stratum becomes larger. The stratum specific estimate of the
measure of association cannot then be computed or provide any statistical information due to a
lack of power.140
Multivariate modeling allows many factors to be adjusted at the same time in a
mathematical model and is the most common technique used to adjust for confounding. The
estimate represents the individual contribution of each factor for the risk of the outcome,
adjusted for all other factors. In order to maintain reasonably stable estimates of parameters,
there are general rules of thumb for ensuring an optimal sample size: approximately 10
observations are required per factor in a multiple regression model where the outcome is
continuous, and approximately 10 events per factor for logistic regression models where the

76
outcome is binary.161 In addition, the most frequently applied empirical assessment of
confounding includes comparing changes in the estimate of the drug-outcome association as a
function of increasing adjustment until the incremental change in estimate becomes small (i.e., a
change of less than 10% was suggested as a cut-off point).162 Hence, while multivariate analysis
provides a more efficient tool of controlling for several confounders simultaneously, the
adequacy of the data in meeting these requirement and assumptions required for each model
must be examined.
The above methods, however, are constrained to a limited number of covariates (or
limited number of covariates per outcome). In an effort to overcome this limitation, the
exposure propensity score (or propensity score, PS) analyses, developed by Rosenbaum and
Rubin, have become a widespread tool to combine information from various confounding factors
into a single variable in many research fields.107,108 This approach is useful when many
confounders or rare outcomes exist in pharmacoepidemiologic studies (especially in automated
databases). A PS is the probability (or propensity) that an individual would be treated given their
individual measured covariates. It can be estimated by using multivariate logistic regression
model where the dependent variable is drug exposure, and the independent variables are
covariates related to drug exposure.
Each participant is assigned an estimated probability of drug exposure ranging from 0 to
1 that reflects the probability of being prescribed a given drug, given all measured confounders.
The probability of being prescribed a drug or assigned a treatment is dependent only on the PS
covariates otherwise treatment assignment is random. The 3 techniques most commonly used to
control for confounding based on the PS are: (1) as a matching factor prior to analysis (e.g.,
Greedy matching technique),163 (2) stratification on the PS during analysis (e.g., use quintiles of

77
the PS of the entire study population),164 or (3) as a covariate in multivariate analyses.165 The
use of propensity score-based weighting (e.g., inverse-probability-of-treatment weighted
estimator or standardized mortality/morbidity ratio weight) has also been proposed.166,167 Figure
2 summarizes the methodological approach to building the propensity score. All methods have
advantages and disadvantages and also involve different underlying assumptions that have to be
considered. The PS method has extended uses in estimating treatment effects conditional on
pretreatment variables in a way that treatment can be continuous, ordinal or discrete, and in case-
cohort studies as well.168 The PS method’s advantages including the ability to deal with many
covariates, frequent exposures, or rare outcomes (to avoid the risk of over-fitting in the model) in
the automated databases, and offer increased feasibility compared to RCTs in situations where
ethical or cost concerns are relevant.169 By using the PS method, the effects of all of the
prognostic covariates used in estimating the treatment effect are removed from the estimation of
treatment effect, thus reducing the bias. However, the analysis of drug exposure-outcome
association may lack transparency because a number of covariates are bundled into one
propensity score. It also has been postulated that, if a variable is more of a risk factor for an
outcome than it is a predictor of treatment, confounding might be better controlled by inclusion
of the variable as an individual confounder of the outcome rather than in the PS model.170
Further, PS methods only have advantages when there are seven or fewer outcome events per
confounder. When there are eight or more outcome events per confounder, logistic regression
represents a preferable approach.171 Another limitation of using a PS approach is that residual
confounding cannot be excluded when unmeasured or imperfectly measured confounders exist in
the databases.

78
Figure 2. Approach to Build the Propensity Score
The techniques discussed above may be inadequate in longitudinal observational studies
when more complex biases are present, such as when exposure is time-dependent and time-
varying confounders are present. A time-varying confounder is a variable affected by prior
exposure that predicts both subsequent outcome and subsequent exposure. One solution to this
problem is to employ a more complex analytical approach that incorporates prediction of
treatment as well as censoring in specific time intervals. Robins et al. developed a new model
called marginal structural models.166 Marginal structural models use inverse-probability of
exposure weights to create an artificial population in which covariate imbalances are removed
and causal effects can be accurately estimated.172 With respect to the PS approach, the marginal
structural model is an extension of the inverse-probability of treatment weighted estimator.
Stabilized inverse-probability weights and the mean of the stabilized inverse-probability close to
79
one can be used to evaluate whether the marginal structural model performs appropriately.172
Stabilized inverse-probability weights with a mean far from one may indicate a violation of some
of the hypotheses of the model (e.g., a misspecification of the weight model or a violation of the
positivity assumption).172,173 Compared with the standard errors in the conventional models,
marginal structural models increase the median standard error of the estimates nearly 20% while
controlling for time-varying confounding.172 This increase in standard error is a trade-off
between bias and precision. 173 Marginal structural models can be used in observational studies
with time-varying confounding, as well as in RCTs if the study is randomized at baseline but
post-baseline changes in treatment are not randomized.172
1.5.3.3 Unmeasured Confounders that Can be Measured in A Validation Study
If confounders that are unmeasurable in the main study but measurable in validation sub-studies,
two-stage sampling or external adjustment may be considered. Two-stage sampling designs
rely on an internal validation study to collect information on covariates that were not measured
in the main study.140 In stage one, information is collected on drug exposure and disease
outcomes for the entire cohort (main study) such as a large automated database. To use the
resource optimally, in stage two, a subgroup of the main study will be sampled and contacted,
and detailed information will then be obtained. Regression coefficients and standard errors will
then be weighted for multivariate analysis according to the specific sampling fraction.174 The
balanced design, wherein an equal number of individuals in each cell of the second stage’s 2×2
table, is usually the most efficient strategy compared to random and disease- or drug-exposure-
based sampling.175 This strategy decreases the occurrence of small cells (which are responsible
for large variance) by forcing an over-representation of individuals who belong to small groups

80
in the drug-disease cross classification.140 Interaction can also be evaluated in the two-stage
sampling. Two-stage sampling designs can be valuable tools to adjust for unmeasured
confounders if access to individual patients is possible in the automated databases in
pharmacoepidemiology.158 However, two-stage sampling can be time-consuming to identify a
subgroup and can lead to additional data collection.
If internal validation studies are not feasible or too costly, external adjustment (i.e.,
using external data sources) can be used under certain assumptions (e.g., similar characteristics
of participants in the main and external datasets). For example, the Medicare Current
Beneficiary Survey studies a representative sample of Medicare beneficiaries to measure a wide
variety of characteristics (e.g., limitations of daily living activities, cognitive impairment) that
are not captured in Medicare claims data. Traditionally, these external variables can be further
added as additional confounders in the model. A new technique of propensity score calibration
was developed to apply in external adjustments. The error component of the PS in the validation
study is then quantified and can be used to correct the PS in the main study, using established
regression calibration techniques.176 The advantage of PS calibration is that it implicitly takes
into account the joint effect of unmeasured confounders, as well as the relation between
measured and unmeasured confounders.158
1.5.3.4 Control for Unmeasured Confounders at the Design Stage
If residual confounding by unmeasured factors is suspected and unmeasured confounders are
truly unmeasured because of technical difficulties or factors were unknown to the investigators,
strategies to adjust unmeasured confounding including application of an active comparison
group and/or crossover study designs (see section 1.2.7 for details) at the design stage.

81
Active (or competing) comparator design can be seen as a special type of restriction
because the choice of a comparator group is restricted to patients with similar indications. When
comparing the effects of two active therapies that are prescribed under the assumption of similar
effectiveness and safety, it is less likely that predictors of the outcome are imbalanced and will
cause confounding.158 For example, two similar selective COX-2 inhibitors, rofecoxib and
celecoxib, were likely to be equally prescribed to patients at risk for cardiovascular events, so
that an increased risk of myocardial infarction associated with one compared with the other is
unlikely to be attributable to confounding by indication.177 The measurement of association
while using active comparative group design is “relative excess risk” as a comparative relative
risk adjusted for the baseline risk, or “absolute excess risks”.158,178
1.5.3.5 Control for Unmeasured Confounders at the Analysis Stage
Proxy adjustment, instrumental variable and/or sensitivity analysis can be used to control for
unmeasured confounders at the analysis stage. Proxy adjustment refers to adjusting for a
surrogate of an unmeasured factor is equivalent to adjusting for the factor itself. For example,
older age serves as a proxy for many factors, including co-morbidity, frailty, and cognitive
decline. Further, having regular annual check-ups is indicative of a health-seeking lifestyle and
is likely to be a proxy for increased overall treatment adherence.49 The number of prescription
drugs dispensed, the number of physician visits, and hospitalizations before the index drug
exposure are frequently used proxies in pharmacoepidemiology. If many proxies are identified,
they can then be adjusted for in a large PS model. Collinearity may likely occur but is irrelevant,
as the individual parameters estimated in the large PS regression will not be interpreted but only

82
used for predicting treatment.179 However, it is challenging empirically to know with enough
certainty whether a variable is a proxy confounder or an instrument.
By adjusting for an instrument variable, the indication for treatment may be controlled
for under the following assumptions that an instrumental variable is: (1) causally related to the
treatment, (2) weakly associated or not associated with any potential confounder, and (3) not
associated with the outcome other than through the treatment.154 Thus, an instrument is an
external factor that influences an outcome only through its effect on treatment. However, it is
extremely challenging to find good instruments for studying the effectiveness and safety of drugs.
In addition, instruments used in healthcare services research are often only weakly associated
with the actual treatment, which leads to imprecise estimates and requires large sample sizes.
Adjusting for an instrumental variable is useful when the choice of medication used is influenced
more by prescriber preference than patient risk factors (i.e., there is exposure variation between
providers). This can be further adjusted for measured patient or physician characteristics.158
Some instruments used in pharmacoepidemiology include regulatory or coverage interventions
and provider treatment preference (e.g., distance to specialist provider, physician prescribing
preference, regional treatment preference, hospital formulary, surgeon treatment preference,
medication co-payment level, and dialysis preference level).49 For example, strong prescriber
preference was observed among patients starting NSAID therapy either with non-selective
NSAIDs or COX-2 inhibitors. An instrumental variable can be used such as grouping physicians
into those who always initially prescribed non-selective NSAIDs (instrumental variable=0) and
those who always started with prescribing COX-2 –selective NSAIDs (instrumental
variable=1).180

83
Sensitivity analysis, defined as a quantitative analysis of the potential for systematic
error, is a more formal approach used to communicate this uncertainty with respect to the
validity of findings (i.e., how robust study findings are to implicit and explicit assumptions).140
In other words, sensitivity analyses make informed assumptions about potential residual
confounding and calculate its effect on the risk estimate of the drug-outcome association.
Existing approaches include an array approach which is helpful to explore the effect of residual
confounding over a wide range of parameter constellations,181 and a rule-out approach to assess
how much confounding would have to be present to fully explain the observed findings (i.e.,
observed point estimate would move to the null).182 The details and calculations of these two
approaches are beyond the scope of this review, however, we can easily perform these sensitivity
analyses using a spreadsheet program available at http://www.drugepi.org/dope-downloads/.181
Sensitivity analysis not only brings to the forefront the important issues related to the validity of
results but it is also provides a means for presenting objective evidence that may be used by
readers to evaluate the magnitude of the threat to validity and give them a sense of confidence in
the study results. In addition, it can provide direction for future research by serving in a
hypothesis-generating manner. Sensitivity analysis is limited to one binary confounder, which
may not be helpful if several confounders are unmeasured and the joint effect of such
confounders is unknown.

84
1.5.4 Healthy-User Effect and Related Confounding and Biases in Observational Studies
of Preventive Interventions
Because numerous high-profile observational studies of the effect of prevention on health
outcomes reported exaggerated relationships that were later contradicted by RCTs recently, a
growing body of research identifies sources of bias and confounding in observational studies that
are related to patient behaviors or underlying patient characteristics, known as the healthy user
effect, the healthy adherer effect, confounding by functional status or cognitive impairment,
and confounding by selective prescribing.183 These special confounding and biases resulting
from patient-level tendencies to engage in healthy behaviors or physician’s perceptions of the
health of patients, and potential solutions will be described specifically and briefly in this section.
The healthy user effect is described as patients who receive preventive therapies or tests
are more likely to seek other preventive service or partake in other healthy behavior (e.g., healthy
diet, exercise, or avoid tobacco).184 An observational study evaluating the effect of a preventive
therapy (e.g., hormone replacement therapy) on a related outcome (e.g., cardiovascular disease)
without adjusting for other related preventive behaviors will tend to overstate the effect of the
preventive therapy under study. Similarly, the healthy adherer effect arises when patients who
adhere to preventive tests or therapies are more likely to pursue health-seeking behaviors than
their non-adherent counterparts.183 For example, in a study of elderly patients initiating statins,
patients who filled ≥ 2 statin prescriptions during a 1-year ascertainment period were more likely
than patients who filled only one prescription to receive prostate-specific antigen tests, fecal
occult blood tests, screening mammograms, influenza vaccinations, and pneumococcal
vaccinations during follow-up.185 In addition, confounding by functional status or cognitive

85
impairment refers to poor functional or cognitive status limits some patients’ interest in, or
ability to visit, their physician.183 Studies do not account for functional status or cognitive
impairment will overstate the effect of a preventive therapy. For example, Jackson LA et al.
found that elderly women with higher levels of functional impairment had significantly lower
rates of breast and cervical cancer screening.186 Confounding by selective prescribing refers to
physicians are less likely to prescribe preventive treatments patients who are frail, have terminal,
or acute illness (both in the inpatient and outpatient settings).187 For example, patients with
terminal cancer or end-stage renal disease, may be less likely to receive or more likely to
discontinue a preventive therapy. Failing to account for selective prescribing that correlate with
the health of patients will lead to overestimation of the benefits of a preventive therapy.
Several approaches can be used to minimize these bias and confounders, and affirm the
validity of the results in pharmacoepidemiology. The approaches include: (1) using new user
designs; (2) restricting the study population to subjects who are similar in having similar patterns
of the use of preventive tests or therapies; (3) using an intention-to-treat analysis; (4) using an
active comparator (i.e., another preventive therapy); (5) adjusting for functional status, cognitive
impairment, frailty, or disease severity; (6) identifying proxies for further adjustment (e.g.,
vaccines, mammography, colonoscopy, or medications for dementia); (7) adjusting for
unmeasured confounders using propensity score or instrumental variables; and (8) conducting
sensitivity or secondary analyses (e.g., evaluating negative control outcomes events that should
not be affected by the treatment under study, but may confound or bias the results).183
86
1.5.5 Summary
A thorough understanding of the potential sources of bias and confounding in non-experimental
studies is important to designing studies that minimize their influence on results. Several
strategies can be used to avoid major bias in pharmacoepidemiology including: (1) restricting the
design to new (or incident) users, those without contraindications, and those who are adherent to
prevent prevalent bias; (2) systematically identify and recruit all eligible cases to prevent self-
selection bias ; (3) applying “lag-time” (or an index date) to define drug exposure periods to
prevent protopathic bias; (4) restricting the outcome of interest to more serious cases (instead of
mild or subclinical diagnosis) to prevent referral bias; (5) selecting controls who are likely to
have the same cognitive processes affecting memory of past drug exposures to prevent recall
bias; (6) to prevent detection bias, blinding relevant study personnel, standardizing the
measurement process, and/or obtaining information on the frequency of access to medical care
and health awareness by participants; (7) to prevent immortal-time bias, using nested case-
control or active comparative design, and time-dependent statistical methods to account for
complex changes in drug exposure and time-varying confounders.
Strategies used to control confounding in non-experimental studies in
pharmacoepidemiology vary from whether confounders can be measured or not. For measurable
confounders, one can use restriction and/or matching (including matching by PS) at the design
stage, or apply standardization, stratification, multivariate analysis (including PS adjustment), or
marginal structural model at the analysis stage. For confounders cannot be measured in the main
study, but can be measured in a validation study, two –stage sampling or external adjustment can
be used to control these confounders. For confounders that are truly unmeasured, crossover

87
design or active comparative group can be used at the design stage. Crossover design is usually
used to evaluate the association between a transient exposure and acute event (e.g., vaccine
safety). In addition, proxy adjustment, instrumental variables, and/or sensitivity analysis may be
potential approaches to control for unmeasured confounders at the analysis stage. Beyond the
above strategies and under a distinctive set of challenges and unique set of resources,
pharmacoepidemiologists are developing and implementing innovative study designs and new
analytic approaches in order to maximize the validity of results from non-experimental studies.

88
2.0 OBJECTIVES AND SPECIFIC AIMS
The burdens of chronic diseases and functional disability increase with age. Chronic diseases are
costly health conditions which negatively affect quality of life, contributing to declines in
functioning and the inability to remain in the community.188 Hypertension, cardiovascular
disease (CVD), stroke, chronic lower respiratory disease, cancer, diabetes, arthritis, dementia,
depression, and some infectious diseases are common health threats in the US population.188 The
prevalence of multi-morbidity, referring to co-occurrence of several medical conditions within an
individual, also increases with age. CVD and cancer are the top two leading causes of death
among all people age ≥ 65 years, irrespective of sex, race, or Hispanic origin.188 Prevention and
control of hypertension, dyslipidemia, diabetes, cancer, and disability, are key strategies to
promote health and well-being at all ages.
While clinical risks associated with chronic disease are well-known, the use of
medication and therapeutic risk-benefit balance are often under recognized. Improved
methodology in pharmacoepidemiologic research may extend new understanding of the
medication use and enable one to evaluate the influence of the policy and evidence-based studies
(e.g., guidelines), and the effectiveness or therapeutic risk-benefit balance of the treatments in
“real-world” practices. There is also growing interest in potential agents or medications to
prevent or slow cancer development or progression. The overall aim of this dissertation is to

89
apply pharmacoepidemiologic methodology to examine medication utilization, therapeutic risk-
benefit balance in older adults and evaluate potential chemopreventive agents for ovarian cancer
prevention.
Specific Aims:
Aim 1: The aim of the first study is to examine whether utilization patterns of cholesterol-
lowering medications in community-dwelling older adults changed following the release of the
National Cholesterol Education Program Adult Treatment Panel III guidelines and results from
the Prospective Study of Pravastatin in the Elderly at Risk in 2002, using the data from Health,
Aging and Body Composition (Health ABC) study.
Aim 2: The aim of the second study is to examine whether the use of statins is associated with a
decreased risk of gait speed declines of 0.05 m/s or more and 0.1 m/s or more per year in
community-dwelling older adults in the Health ABC study.
Aim 3: The aim of the third study is to evaluate the associations of aspirin, NA-NSAIDs, or
acetaminophen use with the risk of incident ovarian cancer, using the data from Hormones and
Ovarian Cancer Prediction (HOPE) study, the second-largest population-based case-control
study on ovarian cancer in the US.

90
3.0 MANUSCRIPT 1: CHANGES IN CHOLESTEROL-LOWERING MEDICATIONS
USE OVER A DECADE IN COMMUNITY-DWELLING OLDER ADULTS
Published Manuscript (Ann Pharmacother. 2013 Jun 18. [Epub ahead of print])
Wei-Hsuan Lo-Ciganic, MSCP, MS1,10; Robert Boudreau, PhD1; Shelly L. Gray, PharmD, MS2;
Janice C. Zgibor, RPh, PhD1; Julie M. Donohue, PhD3; Subashan Perera, PhD4; Anne B.
Newman, MD, MPH1,4; Eleanor Simonsick, PhD5; Douglas C. Bauer, MD6; Suzanne Satterfield,
MD, MPH, DrPH7; Joseph T. Hanlon, PharmD, MS1,4, 8,9,10 for the Health, Aging and Body
Composition Study
AUTHORS’ AFFILIATIONS: 1) Department of Epidemiology, Graduate School of Public
Health, University of Pittsburgh, Pittsburgh, PA, 2) School of Pharmacy, University of
Washington, Seattle, WA, 3) Department of Health Policy and Management, Graduate School of
Public Health, University of Pittsburgh, Pittsburgh, PA, 4) Division of Geriatrics, Department of
Medicine, School of Medicine, University of Pittsburgh, Pittsburgh, PA, 5) Laboratory of
Epidemiology, Demography, and Biometry, Intramural research Program, National Institute on
Aging, Bethesda, MD, 6) Division of General Medicine, University of California at San
Francisco, San Francisco, CA, 7) Department of Preventive Medicine, University of Tennessee
Health Science Center, Memphis, TN, 8) Center for Health Equity Research and Geriatric

91
Research Education and Clinical Center, Veterans Affairs Pittsburgh Healthcare System,
Pittsburgh, PA, 9) Department of Pharmacy and Therapeutics, School of Pharmacy, University
of Pittsburgh, Pittsburgh, PA, 10) Geriatric Pharmaceutical Outcomes and Gero-Informatics
Research and Training Program, University of Pittsburgh, Pittsburgh, PA

92
3.1 ABSTRACT
Background: The impact of evidence-based guidelines and controlled trial data on use of
cholesterol-lowering medications in older adults is unclear.
Objective: To examine whether utilization patterns of cholesterol-lowering medications in
community-dwelling older adults changed following the release of the National Cholesterol
Education Program Adult Treatment Panel III guidelines and results from the Prospective Study
of Pravastatin in the Elderly at Risk in 2002.
Methods: Community dwelling older adults who were enrolled in the Health, Aging and Body
Composition Study in 1997-1998 were followed for up to 11 years. An interrupted time-series
analysis with multivariable generalized estimating equations (GEE) was used to examine level
and trend changes in cholesterol-lowering medication use before and after 2002, adjusting for
sociodemographics, health-related behaviors and health status.
Results: Cholesterol-lowering medication use increased nearly 3-fold from 14.9% in 1997-1998
to 42.6% in 2007-2008, with statins representing the most common class used (87%-94%).
Multivariable GEE results revealed no difference in the level of cholesterol-lowering medication
use after 2002 (adjusted odds ratio: 0.95, 95% confidence interval [CI] 0.89-1.02). Multivariable
GEE results revealed trends changes in the rate of increase in cholesterol-lowering medication
declined after 2002 (adjusted ratio of odds ratios 0.92, 95% CI 0.89-0.95).

93
Conclusions: The use of cholesterol-lowering medication increased substantially over a decade
in community dwelling elders, but was not related to a change in level or trend following the
release of the guidelines and evidence-based data.
3.2 INTRODUCTION
3.2.1 Epidemiology of Cardiovascular Disease and Dyslipidemia in the Elderly
Cardiovascular disease remains the leading cause of death and disability among the elderly in the
US, with the average age of first myocardial infarction being 65 years for men and 70 years for
women.1 Approximately 60% of hospital admissions for acute myocardial infarction and 81% of
coronary heart disease (CHD) mortality are in people aged ≥ 65 years.1, 2 Although
cardiovascular disease remains the leading cause of death and disability among the elderly in the
US, the incidence of coronary heart disease (CHD) and associated mortality actually declined by
approximately 25% from 1997 to 2007.1-3 This decline may be due to improved medical care
and use of evidence-based preventive medications, including cholesterol-lowering therapy.3, 4
With regard to further reducing the burden of CHD morbidity and mortality, the emphasis
is on the treatment of acute events and secondary or primary prevention through treatment and
control of risk factors. A meta-analysis of individual data from 61 prospective studies reaffirmed
that higher total cholesterol, non-high-density lipoprotein cholesterol (non-HDL-C) and lower
high-density lipoprotein cholesterol (HDL-C) are associated with higher risk of CHD mortality
in both men and women in different age groups.5 Although the relative risk for CHD mortality

94
associated with high total cholesterol or low HDL-C decreases with advancing age, this lower
relative risk is offset by the greater absolute and attributable risk for CHD in the elderly.6
From the National Health and Nutrition Examination Survey (NHANES) years 1999 –
2004 (n=3,810 aged ≥ 65 years),7 women had a higher prevalence of hypertension than men
(77% vs. 63%, p ≤ 0.001), a similar rate (76%) of awareness of hypertension, and a lower rate of
control on treatment (43% vs. 58%, p ≤ 0.001). Diabetes affected approximately 22% of older
males and females. Women had a higher rate of awareness of diabetes than men (79% vs. 64%,
p ≤ 0.01). About 50% prevalent diabetic older males and females were treated
pharmacologically and goal attainment among those treated with diabetes was 50%. Overall,
dyslipidemia prevalence was 60% (men: 62% vs. women: 59%). Men were less likely to be
aware of their dyslipidemia than women (59% vs. 71%, p ≤ 0.001), although both genders were
equally likely to be treated (41% vs. 45%). Compared to those aged of 65-74 years, those aged ≥
85 years had a lower prevalence of dyslipidemia (64% vs. 46%, p ≤ 0.001), a lower rate of
awareness of dyslipidemia (68% vs. 39%, p ≤ 0.001), had a lower treatment rate (45% vs. 24%, p
≤ 0.001). Sixty-five percent of the older male and female medically treated for dyslipidemia
reached their LDL cholesterol goal. Age of 85 years and above was negatively associated with
awareness and treatment of dyslipidemia. Low annual household income (< $15,000 in 2002
dollars) was negatively associated with awareness and controlled on treatment of dyslipidemia.
Female, higher education, and more doctor visits in the past year were positively and strongly
associated with awareness, treatment of dyslipidemia.

95
3.2.2 Drugs for Lipid Lowering Therapy
The treatment of dyslipidemia may require two approaches, therapeutic lifestyle changes and
medications. In the cases that cholesterol levels cannot reduced effectively by dietary
modification and increased physical activity, or for persons with other risk factors of CHD, the
use of cholesterol-lowering medications is recommended.8 There are several classes of
cholesterol-lowering drugs, but statins (or HMG-CoA reductase inhibitors) are the drug class of
choice because of their demonstrated safety and efficacy in lowering LDL-C and reduction in
cardiovascular mortality. Other available cholesterol-lowering medications including bile acid
sequestrants (colesevelam, colestipol, cholestyramine), cholesterol absorption inhibitor
(ezetimibe), fibrates (gemfibrozil, fenofibrate, fenofibric acid), niacin, and fish oil capsules, may
be required in patients who are statin-intolerant, have mixed dyslipidemia, or in whom standard
doses of statins may not be sufficient to achieve LDL-C goals.9
3.2.3 Statin Therapy for Secondary Prevention of Cardiovascular Disease in the Elderly
Recommendations for the detection and control of hypercholesterolemia for adults have been
offered since 1988 (Table 6), by the National Cholesterol Education Program (NCEP) Adult
Treatment Panel (ATP).8, 10-12 Results from several meta-analyses13-15 and subgroup analyses of
randomized clinical trials (RCTs)16-26 show that statins have benefits of lowering the risk of all-
cause mortality and CHD mortality, reduce cardiovascular events, stroke, and the need for
revascularization among patients (aged 60-82) with established CHD. In a meta-analysis of data
from 90,056 patients in 14 RCTs (47% of patients had pre-existing CHD), statins reduced the

96
risk of major coronary events similarly among those aged < 65 years and ≥ 65 years (22% vs.
19%).13 In another meta-analysis of 18 RCTs (n=51,351) conducted by Robert et al,14 62% of
the participants were aged ≥ 60 and 12% were aged ≥ 70 years. Statins reduced risk of all-cause
mortality and CHD mortality by 15% for those aged ≥ 60 and 23% for those aged ≥ 70 years,
respectively. Afilalo et al. conducted a meta-analysis from the individual data of nine RCTs
(four were unpublished data), in which 19,569 participants were aged 65 to 82.15 Statins reduced
risks of all-cause mortality by 22%, CHD mortality by 30%, nonfatal MI by 26%, need for
revascularization by 30% and stroke by 25%.
Table 6. NCEP ATP Guidelines Recommended Drug Therapy According to LDL-C Levels
NCEP Guidelines (first published year)
Risk groups LDL-C levels (mg/dL) to initiate drug therapy
Minimal Goals of LDL-C levels (mg/dL) if under drug treatment
ATP I (1988)11 With CHD or ≥ 2 risk factora ≥ 160 < 130 Without CHD and with < 2 risk factorsa ≥ 190 < 160
ATP II (1993)12 With CHD ≥ 130 < 100 Without CHD and ≥ 2 risk factorsb ≥ 160 < 130 Without CHD and with < 2 risk factorsb
≥ 190 < 160
ATP III (2002)9 High risk: with CHD or CHD risk equivalentc (10-year risk > 20%)
≥ 100 < 100 (optimal <70)
Moderate-high risk: ≥ 2 risk factorsd (10-year risk of 10-20%)
≥ 130 < 130
Moderate risk: < 2 risk factorsd (10-year risk < 10%)
≥ 160 <130
Low risk: 0-1 risk factor d ≥ 190 < 160 Abbreviations: CHD: coronary heart disease; HDL-C: high-density lipoprotein cholesterol ; LDL-C: low-density lipoprotein cholesterol; NCEP ATP: National Cholesterol Education Panel Adult Treatment Panel a: Risk factors include male sex, family history of premature CHD, cigarette smoking, hypertension, low levels of HDL cholesterol (<35 mg/dL), diabetes, definite cerebrovascular or peripheral vascular disease, or severe obesity; b: Positive Risk factors include age (men ≥ 45 years and women ≥ 55 years), family history of premature CHD, current cigarette smoking, hypertension, low levels of HDL-C (<35 mg/dL), diabetes. Negative risk factors include high HDL-C (≥ 60 mg/dL). c: CHD risk equivalents include clinical manifestations of non-coronary forms of atherosclerotic disease (peripheral arterial disease, abdominal aortic aneurysm, and carotid artery disease, transient ischemic attacks or stroke of carotid origin or >50% obstruction of a carotid artery), diabetes, and 2+risk factors with 10-year risk for hard CHD 20%. d: Risk factors include cigarette smoking, hypertension, low HDL cholesterol (<40 mg/dL), family history of premature CHD (CHD in male first-degree relative <55 years of age; CHD in female first-degree relative <65 years of age), and age (men ≥ 45 years; women ≥ 55 years).

97
3.2.4 Statin Therapy for Primary Prevention of Cardiovascular Disease in the Elderly
Limited data are available for elderly patients without CHD.27 Other subgroup analysis from the
RCTs suggested that statins reduced the incidence of major cardiovascular events in both those
aged < 65 and ≥ 65 years, without known CHD, regardless their baseline cholesterol levels.20, 28-
33 This shifted primary prevention toward an emphasis on the consideration of the patient’s
global risk for CHD rather than focusing only on lipid levels when determining those who would
benefit from primary prevention.
3.2.5 Lipid-Lowering with Non-Statin Drugs in the Elderly
Except fibrates, little evidence shows that other lipid-lowering medications have benefits to
reduce CHD risk in older adults. Only three RCTs of non-statin drugs were for primary
prevention of CHD,34-36 but none of them enrolled participants aged > 75 years. The studies of
other lipid-lowering medications mainly focused on the efficacy and safety in lowering
cholesterols in older adults. No differences in safety and efficacy of colesevelam, ezetimibe, and
niacin were observed between those aged < 65 years and ≥ 65 years.37-39
The results from the RCTs of fibrates in older adults are mixed in reducing the risk of
cardiovascular disease. Of 2,531 men with CHD, HDL-C ≤ 40 mg/dL and LDL-C ≤ 140 mg/dL
in Veterans Affairs High Density Lipoprotein Intervention Trial (VA-HIT),40 the mean age of
participants was 64 years (50% were aged ≥ 66 years). After one-year treatment, Gemfibrozil
significantly reduced the risk of the composite outcomes (CHD death, nonfatal myocardial
infarction, or stroke) by 24%, compared to placebos. Risk reductions were similar between
98
those aged < 66 years (26%) and those aged ≥ 66 years (22%). The Fenofibrates Intervention
and Event Lowering in Diabetes (FIELD) study did not show an overall decrease in CHD events
with fenofibrate in diabetic patients aged 50–75 years (with or without CHD), but did reduce
total cardiovascular events (the composite of CVD death, myocardial infarction, stroke and
coronary and carotid revascularization).35 However, a subgroup analysis by age showed a
significant decrease in total cardiovascular events in those aged < 65 years, but not in patients
aged ≥ 65 years.
3.2.6 Significance of Current Study
In 2002, NCEP ATP III guidelines were published and for the first time strongly recommended
the use of statins for older persons with established CHD or at high risk for developing CHD
(e.g., diabetes mellitus).8 These recommendations were based in part upon the results from the
subgroup analysis of several previous trials with statins,15-18, 20 and the 2002 Prospective Study of
Pravastatin in the Elderly at Risk (PROSPER).19 Conclusively extrapolating the results from
subgroup analysis to all older adults was controversial, in part because most of these trials had
defined an upper age limit (70-75 years of age) that favored the inclusion of only “younger”
older adults.16-18 The 2002 Medical Research Council/British Heart Foundation Heart Protection
Study (HPS) included an appropriate proportion (28%) of participants aged ≥ 70 years.20 Among
1,263 individuals aged 75 to 80 years at baseline, the rate of major coronary events was
significantly lower in the statin group than placebo group.20 The PROSPER is the only trial
focused on an exclusively elderly cohort involving 5804 older men and women (aged 70 to 82
years).19 They found that that the risk of CHD death, or non-fatal myocardial infarction was

99
significantly reduced in those with established CHD, but not in those receiving the drug for
primary prevention (e.g., diabetes mellitus).19
There is limited information about the use of cholesterol-lowering medications before
and after 2002 in older adults aged ≥ 75 years. From the National Health and Nutrition
Examination Survey 1999-2002 to 2003-2006, cholesterol-lowering medication use significantly
increased in older adults aged ≥ 60 years (46% vs. 57%), but no information was reported in
those aged ≥ 60 years with CHD and/or with diabetes.41 Physician prescribing inertia despite
clinical practice guidelines or evidence-based data may be due to lack of familiarity of the
benefits of specific pharmacotherapy, or difficulty in balancing the impact on quality of life with
patient’s comorbidities, functional status, life expectancy and preferences.42 In addition, these
publications are somewhat inconsistent regarding the need for cholesterol-lowering medications
in the elderly (e.g., those with diabetes but without CHD).8, 19, 43-46 To date, no formal
assessment of the impact of these publications on use of cholesterol-lowering medications in the
elderly has been undertaken. Therefore this study compares the utilization patterns of
cholesterol-lowering medications in community-dwelling older adults before and after the
release of the NCEP ATP III guidelines and results from the PROSPER in 2002. The Health,
Aging and Body Composition Study, a cohort study enrolled the well-functioning elders aged ≥
70 years, provided a great opportunity to examine our research question.

100
3.3 METHODS
3.3.1 Study Design, Sample, and Source of Data
An interrupted time-series analysis was used to examine yearly level and slope (trend) changes in
the utilization of cholesterol-lowering medications.47 A random sample of 3075 black and white
men and women, aged 70-79, were recruited from Medicare beneficiaries residing in Pittsburgh,
PA and Memphis, TN.48, 49 The baseline visit of the Health Aging and Body Composition Study
occurred in 1997/1998 at which time participants were aged 70 to 79 and reported no difficulty
walking one-quarter of a mile (400 m), climbing 10 steps without resting, performing basic
activities of daily living; no use of a cane, walker, crutches or other special equipment to
ambulate. 48, 49 Twenty baseline participants were excluded because of missing medication
information. The study was approved by the Institutional Review Boards of the Universities of
Pittsburgh and Tennessee, and written informed consent was obtained from each participant.
3.3.2 Data Collection and Data Management
The information collected annually during in-person visits by trained interviewers included
blood samples, a battery of detailed physiological measurements and questionnaire material
regarding sociodemographic characteristics, multiple aspects of health status, and medication
use.48, 49 From the collected fasting blood samples obtained in 1997-1998, 2002-2003, 2004-
2005, 2007-2008, serum cholesterol, HDL-C and triglyceride values were determined by a
colorimetric technique on a Vitros 950 analyzer (Johnson & Johnson, New Brunswick, NJ).

101
LDL-C was calculated using the Friedewald equation.50, 51 Both health and behavior factor and
medication use data were used to define specific conditions of interest in this study (i.e., diabetes
mellitus and hypertension). Hypertension was defined by self-reported diagnosis of hypertension
and use of anti-hypertensive medications.52 Diabetes was defined by self-reported diagnosis of
diabetes or use of anti-diabetic medications.53 Several comorbidities examined in the current
study (i.e., CHD, stroke, or peripheral artery disease [PAD]) were centrally adjudicated by a post
hoc committee based on conclusive evidence from hospitalization or death records.48, 49
For medications, at baseline (1997-1998), and annually for 10 years (except years 2000-
2001, 2003-2004, and 2005-2006), participants were asked to bring all prescription medications
taken in the previous month. Trained interviewers transcribed information from the medication
containers on medication name, dosage form, and whether the medication was taken as needed.
The medication data were coded using the Iowa Drug Information System and then entered into
a computerized database.54 These methods of medication data collection are considered highly
accurate and concordant with information contained in pharmacy claims data.55
3.3.3 Outcome Variable: Cholesterol-Lowering Medication Use
The dichotomous outcome variable was use of any cholesterol-lowering medication from any of
two discrete classes: 1) statins, and 2) others (i.e., fibrates, bile acid binding resin agents,
probucol, niacin, and cholesterol absorption inhibitors (i.e., ezetimibe)). These two classes
correspond to IDIS codes 24060009-24060404 and 88080004.54

102
3.3.4 Primary Independent Variable
The independent variable for these analyses was time (i.e., baseline [1997-1998] and each
follow-up year). The year 2002 was the year in which the NCEP ATP III guidelines and the
results of the PROSPER were released. Therefore, two non-overlapping time segments were
defined for the time series: 1997-2002 and 2003-2008.
3.3.5 Covariates
Several characteristics that could potentially confound or modify cholesterol-lowering
medication use were adjusted for in the analysis, and were grouped into three domains: 1)
sociodemographic, and 2) health-related behaviors and 3) health status.56-59 Sociodemographic
factors that were characterized as categorical variables included race (black, white), sex, study
site, education (postsecondary education, high school graduate, and less than high school
graduate), and living status (alone, not alone). Age was considered as a continuous variable. A
dichotomous time-varying variable for prescription drug coverage was also included to account
for patients on and off insurance over the study period.
Health-related behaviors were characterized as categorical variables for smoking status
and alcohol use (current, past, or never). Health status factors were characterized as
dichotomous measures (present vs. absent) for self-reported health conditions, including
congestive heart failure, kidney disease, pulmonary disease, and cancer. A time-varying
dichotomous variable was created for self-rated health (excellent/good vs. not excellent/good).
A categorical variable for body mass index (BMI- underweight or normal [<25.0 kg/m2],

103
overweight [25.0–29.9 kg/m2], or obese [≥30.0 kg/m2] was created.60 The number of overall
prescription medications (excluding cholesterol-lowering drugs) was included as a time-varying
continuous variable as a proxy for comorbidity.61 Dichotomous variables were created for
cognitive impairment (3MS < 80) and high depressive symptoms (Center for Epidemiologic
Studies Depression Scale score >15).62, 63 Interviewers were trained with the standard manual of
operation and certificated for all the clinical assessments (e.g., 3MS test).64
3.3.6 Main Statistical Analyses
All analyses were performed using SAS® version 9.3 (SAS Institute Inc. Cary, NC).
Appropriate descriptive statistics (mean, standard deviation, frequency and percentage) were
employed to summarize participant characteristics and main analytic variables. For descriptive
purposes, we also reported the prevalence of fibrate and ezetimibe use separately from other non-
statin agents because fibrates were the second commonly used cholesterol lowering medications
and ezetimibe was introduced to the market in 2002.41 We conducted a multivariable interrupted
time-series analysis (using generalized estimating equations [GEE]) to estimate changes in the
level and the slope (trend) of the outcome rates after 2002.47, 65 This analysis used the SAS®
GENMOD procedure with an autoregressive working correlation structure to account for
potential multiple years of data from the same participants and the resulting stochastic non-
independence of observations.47, 65 Specifically, level changes were calculated by comparing the
predicted prevalence use in the year 2002-2003, which was extrapolated from the slope of the
time series 1997-2002, with the observed prevalence use in the year 2002-2003. The level
changes were calculated as an adjusted odds ratio (OR) and 95 percent confidence interval (95%

104
CI). An odds ratio greater than one for level changes would indicate that the 2002 publications
did have an immediate impact on cholesterol-lowering medication use. Slope or trend changes
were calculated as the ratio of adjusted odds ratios and 95% CI. This approach estimates the
change in cholesterol-lowering medication use following 2002 publications controlling historical
year-to-year changes prior to 2002 as well sociodemographic, health-related behaviors and health
status factors.66 A ratio of adjusted odds ratios for slope or trend changes greater than one would
indicate that the guidelines had an impact on yearly rate of increase in cholesterol-lowering
medication use. Both sociodemographic, health-related behaviors and health status factors were
controlled for in these multivariable analyses.
3.3.7 Sensitivity Analysis and Stratified Analysis
A series of sensitivity analyses were conducted to better understand and assure the robustness of
the main findings. First, changes in utilization patterns of cholesterol-lowering medications were
evaluated among four mutually exclusive subgroups using the definitions of risk factors based on
the 2002 NCEP ATP III guidelines.8 The four subgroups were: 1) any CHD (including
myocardial infarction, angina pectoris, surgical or percutaneous revascularization); 2) no CHD,
diabetes only (CHD risk equivalent); 3) no CHD or diabetes, but either with PAD, stroke, or ≥ 2
CHD risk factors (hypertension, current smoking, or low-levels of HDL-C [i.e., < 35 mg/dL]),
and 4) no CHD or diabetes or PAD or stroke, and < 2 CHD risk factors. Those with PAD (n=83)
or stroke only (n=86) were considered into group 3 because of insufficient sample sizes for
examining the impact of these conditions separately, and many of these elders had multiple
comorbidities/risk factors. The composition of each risk group changed over time as it gained

105
(or lost) participants who developed or acquired some risk factors (or died). However, once
participants were considered to have the comorbidities including CHD, diabetes, hypertension,
PAD, and stroke, these conditions were considered permanently. For the second sensitivity
analyses, we replaced missing covariate values with those generated using the multiple
imputation.67 Most demographic and health behavior/status covariates had complete
information, and none had more than 5% with missing information. The third sensitivity
analysis was performed by restricting the analysis to only those with data for the entire 10 year
time period. The final sensitivity analyses used 2004-2005 as the index year to separate the pre-
and post-guideline periods and allow for a potential lag effect from dissemination and physician
awareness of the guidelines. A year lag effect was selected because it may take at least 1 to 1.5
years for physicians being informed about these publications through different sources.68, 69
Finally, stratification analyses by sex, age and race were conducted to examine any differences in
utilization patterns.
106
3.4 RESULTS
The baseline characteristics are shown in Table 7 according to all participants. Among 3055
participants, mean age was 74 years, 52% were female, 41% were black, 30% lived alone, 62%
had prescription medications coverage, 5% had severe depressive symptoms, and 10% had
cognitive impairment. Table 8 shows the prevalence of cholesterol-lowering medication use in
the elderly from 1997-2008. Overall, 14.9% of the elders took cholesterol-lowering drugs at
baseline (1997-1998) with statins accounting for 87% of the overall rate. The overall rate of
cholesterol-lowering drugs use increased to 26.7% in 2001-2002 and to 42.6% by 2007/2008. In
particular, statin use increased to 24.9% in 2001-2002 and to 39.1% in 2007-2008. The use of
fibrates slightly increased from 1% in 1997-1998 to 2% in 2007-2008, and the use of bile acid
sequestrants, probucol, and niacin remained the same over that 10 year time period (about 1.5%).
The use of ezetimibe increased from 0.1% in 2002 when introduced to the market to 5% in 2007-
2008.
Table 9 shows the results of the multivariable interrupted time-series analysis estimating
changes in the level and the slope (trend) of cholesterol lower drug use rates after 2002. There
was no level change of any cholesterol-lowering medication use the year before compared with
the year after 2002 (adjusted OR 0.95, 95% CI 0.89 to 1.02). The multivariable results also
revealed a decline in trend changes for the rate of increase in cholesterol-lowering medication
after 2002 (adjusted ratio of odds ratios 0.92, 95% CI 0.89 to 0.95). Similar results for lack of

107
change in level but changes in trend were seen for statin and other cholesterol lowering
medications (Table 9).
Sensitivity and Stratification Analyses
At baseline, 18% had any history of CHD, 11% had diabetes only, 27% were in the group
that had PAD, stroke or 2 or more risk factors, and 43% were in the group of less than 2 risk
factors (Table 7). The prevalence of cholesterol-lowering medication use in 1997-1998 was
30.6% among those with any history of CHD; 11.8% among those with diabetes only; 14.0% for
those who had PAD, stroke, or 2 or more risk factors; and 9.7% for those with no CHD, DM,
PAD or stroke and less than 2 risk factors (Figure 3). For these same groups, the percentage of
elderly patients who took cholesterol-lowering medications in 2001-2002 was 49.9%, 30.1%,
24.0% and 14.6%, respectively, and 68.8%, 46.1%, 35.4%, and 26.6%, respectively took
cholesterol-lowering medications in 2007-2008. A similar pattern was seen with statins for each
of the four groups. Similar findings were also seen for level and trend changes as noted for the
overall sample (data not shown). None of the additional sensitivity analyses appreciably
changed our main findings (data not shown). Females were less likely than males to take any
cholesterol-lowering medications (females vs. males: 15.1% vs. 14.8% in 1997-1998; 24.5% vs.
29.2% in 2001-2002; and 37.4% vs. 48.9% in 2007-2008, respectively). Older adults aged ≥ 75
years were less likely than those aged < 75 years to take any cholesterol-lowering medications
(aged ≥ 75 vs. age < 75 years: 13.7% vs. 15.8% in 1997-1998; 24.6% vs. 27.9% in 2001-2002;
and 41.2% vs. 43.3% in 2007-2008, respectively). Blacks were less likely than whites to take
any cholesterol-lowering medications (whites vs. blacks: 17.2% vs. 11.8% in 1997-1998; 30.2%
vs. 21.2% in 2001-2002; and 45.7% vs. 36.8% in 2007-2008, respectively). Similar findings
were also seen by sex, age, and race for level and trend changes (data not shown).

108
3.5 DISCUSSION
Our study found that the use of cholesterol-lowering medications in the elderly nearly tripled
during the period of 1997-2008 (14.9% to 42.6%). Moreover, as one might expect given their
greater ability to reduce LDL-C, statins were the most common drug class used. These findings
are consistent with that reported by other studies.41, 59, 70-72 It was interesting to find that only half
of those with known CHD and/or diabetes received any cholesterol lowering agent. It is difficult
to determine if this represents under use of an important medication for secondary prevention as
shown in other studies,73-75 or rational omission since published data is only valid for those up to
82 years of age,19, 76 and the mean age of Health ABC study participants in 2007-2008 was 82.4
± 2.8 years. It is also notable that use of cholesterol lowering agents for primary prevention (i.e.,
those without CHD equivalent risk factors) occurred in up to 26.6% participants despite the lack
of convincing efficacy evidence and the potential for greater adverse drug effects in older
adults.27 Similar to the reports by other studies,41, 59, 70 despite the observed increase in
cholesterol-lowering medication use in both racial groups, blacks remained less likely than
whites to take cholesterol-lowering medications. A possible explanation is that long-term
persistence in statin use has been shown to be worse in older blacks than whites.77
We hypothesized that after the release of the NCEP ATP III guidelines and the results
from the PROSPER Study in 2002, that the use of cholesterol-lowering medication would
increase immediately (i.e., change in level). However, our study showed this new data in 2002
had no immediate impact on cholesterol-lowering medication use. One possible explanation for
this finding is that the dissemination and implementation of clinical guidelines and evidence-
based results are complex and take years to overcome barriers in clinical practice.78,79 Additional

109
unique factors in the elderly that may further contribute to the lag in dissemination of evidenced-
based guidelines in to clinical practice for the elderly include difficulty in translating the results
from highly selective trial populations to a heterogeneous community population, competing
causes of morbidity and mortality (e.g., cancer), polypharmacy and drug interactions, short
remaining life expectancy, reported poor adherence of statins, and patient economic concerns.77,
80-82
We also hypothesized that after 2002 that there would be an increase in yearly rate of
cholesterol-lowering medication use (i.e., change in slope). Instead, we saw that there was a
decrease in the yearly rate of increase of cholesterol-lowering medication use. Although the use
of cholesterol-lowering medication in the elderly has increased substantially over time, the
change in slope declined with advancing age is consistent with the findings from other studies.73-
75
So what are the clinical implications of these study findings for clinical pharmacy
practice? The potential underuse of cholesterol lowering therapy in those elders aged ≥ 80 with
CHD or risk equivalent that was observed in this study may be appropriate as summarized by a
recent review.44 The authors concluded that there is insufficient evidence to support the
initiation or continuation of cholesterol-lowering treatment in this patient group.44 Moreover, it
may also be appropriate to not utilize cholesterol-lowering medications in those elders with CHD
or risk equivalent that also have a limited life expectancy given that it takes 2 to 5 years of statin
treatment to reduce the risk of cardiovascular events.15 Lack of secondary prevention with
cholesterol-lowering medications in older adults may also be justified given that they are at
higher risk to experience adverse effects (e.g., myalgia with statins). This increase in the risk of
cholesterol-lowering medication adverse effects may be due to a number of factors including: 1)

110
age-related decline in systemic clearance, 2) multiple comorbidities and medications, 3) drug
interactions (e.g. macrolides inhibiting CYP3A4 hepatic enzyme metabolism of atorvastatin,
lovastatin or simvastatin), and 4) medication adherence difficulties that can be seen especially in
those with cognitive impairment.83, 84 Having said this, the use of these agents should not be
considered as contraindicated for elders aged ≥ 80 years in good health since the potential benefit
may be most pronounced in this patient group due to the known increased risk of coronary heart
disease with increasing age. It is important for health care professionals to discuss these
potential benefits and risks with older patients with CHD or risk equivalent and take into account
their informed preferences.82
Some limitations should be taken into account when interpreting the results of this study.
Inherent to most longitudinal studies examining a broad range of older adults, the potential for
survivor bias should be considered. However, the results from a sensitivity analysis, restricted to
participants in the study from 1997-2008, yielded similar results. It is also possible that any use
of cholesterol-lowering medications may be underestimated as medication use was measured at
multiple fixed annual time points. We also cannot rule out potential confounding by such factors
as family history of premature CHD, dietary therapy, and adherence to medications as
information about these were not collected in the Health ABC study. Lastly, the study sample
was drawn from two US cities and may not be generalizable to all other populations.

111
3.6 CONCLUSION
This study found that the use of cholesterol-lowering medication increased substantially over a
decade in community dwelling elders, but was not related to a change in level or trend following
the release of the guidelines and evidence-based data. Further studies are warranted to better
guide cholesterol-lowering therapy and investigate the potential benefits and barriers of
treatment among the oldest old elders (≥85 years) with CHD or at high risk.

112
3.7 LITERATURE CITED
1. Roger VL, Go AS, Lloyd-Jones DM, et al. Heart Disease and Stroke Statistics--2012 Update: A Report From the American Heart Association. Circulation 2012;125:e2-e220. Epub 2011/12/20. DOI 10.1161/CIR.0b013e31823ac046
2. Schwartz JB, Zipes DP. Cardiovascular Disease in the Elderly. In: Bonow RO, Mann DL, Zipes DP, Libby P, eds. Bonow: Braunwald's Heart Disease - A Textbook of Cardiovascular Medicine. 9 ed. Philadelphia, PA: Saunders, An Imprint of Elsevier, 2011:1727-57.
3. National Center for Health Statistics. Health, United States, 2010: With Special Features on Death and Dying. Hyattsville, MD., 2011.
4. Ford ES, Ajani UA, Croft JB, et al. Explaining the decrease in U.S. deaths from coronary disease, 1980-2000. N Engl J Med 2007;356:2388-98. Epub 2007/06/08. DOI 10.1056/NEJMsa053935
5. Lewington S, Whitlock G, Clarke R, et al. Blood cholesterol and vascular mortality by age, sex, and blood pressure: a meta-analysis of individual data from 61 prospective studies with 55,000 vascular deaths. Lancet 2007;370:1829-39. Epub 2007/12/07. DOI 10.1016/S0140-6736(07)61778-4
6. Wenger NK. Dyslipidemia as a risk factor at elderly age. Am J Geriatr Cardiol 2004;13:4-9. Epub 2004/05/11. DOI
7. McDonald M, Hertz RP, Unger AN, Lustik MB. Prevalence, awareness, and management of hypertension, dyslipidemia, and diabetes among United States adults aged 65 and older. J Gerontol A Biol Sci Med Sci 2009;64:256-63. Epub 2009/02/03. DOI 10.1093/gerona/gln016
8. Third Report of the National Cholesterol Education Program (NCEP) Expert Panel on Detection, Evaluation, and Treatment of High Blood Cholesterol in Adults (Adult Treatment Panel III) final report. Circulation 2002;106:3143-421. Epub 2002/12/18. DOI
9. Drugs for lipids. Treatment guidelines from the Medical Letter 2011;9:13-20. Epub 2011/02/26. DOI 10. Report of the National Cholesterol Education Program Expert Panel on Detection, Evaluation, and
Treatment of High Blood Cholesterol in Adults. The Expert Panel. Arch Intern Med 1988;148:36-69. Epub 1988/01/01. DOI
11. Summary of the second report of the National Cholesterol Education Program (NCEP) Expert Panel on Detection, Evaluation, and Treatment of High Blood Cholesterol in Adults (Adult Treatment Panel II). JAMA 1993;269:3015-23. Epub 1993/06/16. DOI
12. Grundy SM, Cleeman JI, Merz CN, et al. Implications of recent clinical trials for the National Cholesterol Education Program Adult Treatment Panel III guidelines. Circulation 2004;110:227-39. Epub 2004/07/14. DOI 10.1161/01.CIR.0000133317.49796.0E110/2/227 [pii]
13. Baigent C, Keech A, Kearney PM, et al. Efficacy and safety of cholesterol-lowering treatment: prospective meta-analysis of data from 90,056 participants in 14 randomised trials of statins. Lancet 2005;366:1267-78. Epub 2005/10/11. DOI 10.1016/S0140-6736(05)67394-1
14. Roberts CG, Guallar E, Rodriguez A. Efficacy and safety of statin monotherapy in older adults: a meta-analysis. J Gerontol A Biol Sci Med Sci 2007;62:879-87. Epub 2007/08/19. DOI
15. Afilalo J, Duque G, Steele R, Jukema JW, de Craen AJ, Eisenberg MJ. Statins for secondary prevention in elderly patients: a hierarchical bayesian meta-analysis. J Am Coll Cardiol 2008;51:37-45. Epub 2008/01/05. DOI 10.1016/j.jacc.2007.06.063

113
16. Miettinen TA, Pyorala K, Olsson AG, et al. Cholesterol-lowering therapy in women and elderly patients with myocardial infarction or angina pectoris: findings from the Scandinavian Simvastatin Survival Study (4S). Circulation 1997;96:4211-8. Epub 1998/01/07. DOI
17. Lewis SJ, Moye LA, Sacks FM, et al. Effect of pravastatin on cardiovascular events in older patients with myocardial infarction and cholesterol levels in the average range. Results of the Cholesterol and Recurrent Events (CARE) trial. Ann Intern Med 1998;129:681-9. Epub 1998/12/05. DOI
18. Hunt D, Young P, Simes J, et al. Benefits of pravastatin on cardiovascular events and mortality in older patients with coronary heart disease are equal to or exceed those seen in younger patients: Results from the LIPID trial. Ann Intern Med 2001;134:931-40. Epub 2001/05/16. DOI
19. Shepherd J, Blauw GJ, Murphy MB, et al. Pravastatin in elderly individuals at risk of vascular disease (PROSPER): a randomised controlled trial. Lancet 2002;360:1623-30. Epub 2002/11/30. DOI S014067360211600X [pii]
20. MRC/BHF Heart Protection Study of cholesterol lowering with simvastatin in 20,536 high-risk individuals: a randomised placebo-controlled trial. Lancet 2002;360:7-22. Epub 2002/07/13. DOI 10.1016/S0140-6736(02)09327-3
21. Schwartz GG, Olsson AG, Ezekowitz MD, et al. Effects of atorvastatin on early recurrent ischemic events in acute coronary syndromes: the MIRACL study: a randomized controlled trial. JAMA 2001;285:1711-8. Epub 2001/04/13. DOI
22. Cannon CP, Braunwald E, McCabe CH, et al. Intensive versus moderate lipid lowering with statins after acute coronary syndromes. N Engl J Med 2004;350:1495-504. Epub 2004/03/10. DOI 10.1056/NEJMoa040583
23. de Lemos JA, Blazing MA, Wiviott SD, et al. Early intensive vs a delayed conservative simvastatin strategy in patients with acute coronary syndromes: phase Z of the A to Z trial. JAMA 2004;292:1307-16. Epub 2004/09/01. DOI 10.1001/jama.292.11.1307
24. Wenger NK, Lewis SJ, Herrington DM, Bittner V, Welty FK. Outcomes of using high- or low-dose atorvastatin in patients 65 years of age or older with stable coronary heart disease. Ann Intern Med 2007;147:1-9. Epub 2007/07/04. DOI
25. Sacks FM, Pfeffer MA, Moye LA, et al. The effect of pravastatin on coronary events after myocardial infarction in patients with average cholesterol levels. Cholesterol and Recurrent Events Trial investigators. N Engl J Med 1996;335:1001-9. Epub 1996/10/03. DOI 10.1056/NEJM199610033351401
26. Tikkanen MJ, Holme I, Cater NB, et al. Comparison of efficacy and safety of atorvastatin (80 mg) to simvastatin (20 to 40 mg) in patients aged <65 versus >or=65 years with coronary heart disease (from the Incremental DEcrease through Aggressive Lipid Lowering [IDEAL] study). Am J Cardiol 2009;103:577-82. Epub 2009/02/24. DOI 10.1016/j.amjcard.2008.10.029
27. Robinson JG. Lipid-lowering therapy for the primary prevention of cardiovascular disease in the elderly: opportunities and challenges. Drugs Aging 2009;26:917-31. Epub 2009/10/24. DOI 10.2165/11318270-000000000-00000
28. Downs JR, Clearfield M, Weis S, et al. Primary prevention of acute coronary events with lovastatin in men and women with average cholesterol levels: results of AFCAPS/TexCAPS. Air Force/Texas Coronary Atherosclerosis Prevention Study. JAMA 1998;279:1615-22. Epub 1998/06/05. DOI
29. Major outcomes in moderately hypercholesterolemic, hypertensive patients randomized to pravastatin vs usual care: The Antihypertensive and Lipid-Lowering Treatment to Prevent Heart Attack Trial (ALLHAT-LLT). JAMA 2002;288:2998-3007. Epub 2002/12/20. DOI joc21963 [pii]
30. Sever PS, Dahlof B, Poulter NR, et al. Prevention of coronary and stroke events with atorvastatin in hypertensive patients who have average or lower-than-average cholesterol concentrations, in the Anglo-Scandinavian Cardiac Outcomes Trial--Lipid Lowering Arm (ASCOT-LLA): a multicentre randomised controlled trial. Lancet 2003;361:1149-58. Epub 2003/04/11. DOI 10.1016/S0140-6736(03)12948-0

114
31. Neil HA, DeMicco DA, Luo D, et al. Analysis of efficacy and safety in patients aged 65-75 years at randomization: Collaborative Atorvastatin Diabetes Study (CARDS). Diabetes care 2006;29:2378-84. Epub 2006/10/27. DOI 10.2337/dc06-0872
32. Chaturvedi S, Zivin J, Breazna A, et al. Effect of atorvastatin in elderly patients with a recent stroke or transient ischemic attack. Neurology 2009;72:688-94. Epub 2008/09/05. DOI 10.1212/01.wnl.0000327339.55844.1a
33. Glynn RJ, Koenig W, Nordestgaard BG, Shepherd J, Ridker PM. Rosuvastatin for primary prevention in older persons with elevated C-reactive protein and low to average low-density lipoprotein cholesterol levels: exploratory analysis of a randomized trial. Ann Intern Med 2010;152:488-96, W174. Epub 2010/04/21. DOI 10.1059/0003-4819-152-8-201004200-00005
34. Manninen V, Elo MO, Frick MH, et al. Lipid alterations and decline in the incidence of coronary heart disease in the Helsinki Heart Study. JAMA 1988;260:641-51. Epub 1988/08/05. DOI
35. Keech A, Simes RJ, Barter P, et al. Effects of long-term fenofibrate therapy on cardiovascular events in 9795 people with type 2 diabetes mellitus (the FIELD study): randomised controlled trial. Lancet 2005;366:1849-61. Epub 2005/11/29. DOI 10.1016/S0140-6736(05)67667-2
36. The Lipid Research Clinics Coronary Primary Prevention Trial results. I. Reduction in incidence of coronary heart disease. JAMA 1984;251:351-64. Epub 1984/01/20. DOI
37. WelcholTM (Colesevelam hydrochloride): US prescribing information. Parsippany (NJ): Daiichi Sankyo, 2008 [Online]. 2008.
38. Robinson JG, Davidson MH, Shah A, et al. Efficacy and safety of ezetimibe and ezetimibe plus statin therapy in patients aged under 65, 65--74 and 75 years and older. Aging Health 2007;3:691-705.
39. Niaspan (niacin extended-release tablets): US prescribing information. North Chicago (IL): Abbott Laboratories,2009 [online].
40. Rubins HB, Robins SJ, Collins D, et al. Gemfibrozil for the secondary prevention of coronary heart disease in men with low levels of high-density lipoprotein cholesterol. Veterans Affairs High-Density Lipoprotein Cholesterol Intervention Trial Study Group. N Engl J Med 1999;341:410-8. Epub 1999/08/07. DOI 10.1056/NEJM199908053410604
41. Li M, Ong KL, Tse HF, Cheung BM. Utilization of lipid lowering medications among adults in the United States 1999-2006. Atherosclerosis 2010;208:456-60. Epub 2009/08/25. DOI 10.1016/j.atherosclerosis.2009.08.001
42. Cabana MD, Rand CS, Powe NR, et al. Why don't physicians follow clinical practice guidelines? A framework for improvement. JAMA 1999;282:1458-65. Epub 1999/10/27. DOI jrv90041 [pii]
43. Kamari Y, Bitzur R, Cohen H, Shaish A, Harats D. Should all diabetic patients be treated with a statin? Diabetes care 2009;32 Suppl 2:S378-83. Epub 2009/11/13. DOI 32/suppl_2/S378 [pii]10.2337/dc09-S344
44. Petersen LK, Christensen K, Kragstrup J. Lipid-lowering treatment to the end? A review of observational studies and RCTs on cholesterol and mortality in 80+-year olds. Age Ageing 2010;39:674-80. Epub 2010/10/19. DOI 10.1093/ageing/afq129
45. The effects of cholesterol lowering with simvastatin on cause-specific mortality and on cancer incidence in 20,536 high-risk people: a randomised placebo-controlled trial [ISRCTN48489393]. BMC medicine 2005;3:6. Epub 2005/03/18. DOI 10.1186/1741-7015-3-6
46. Kjekshus J, Apetrei E, Barrios V, et al. Rosuvastatin in older patients with systolic heart failure. N Engl J Med 2007;357:2248-61. Epub 2007/11/07. DOI 10.1056/NEJMoa0706201
47. Wagner AK, Soumerai SB, Zhang F, Ross-Degnan D. Segmented regression analysis of interrupted time series studies in medication use research. J Clin Pharm Ther 2002;27:299-309. Epub 2002/08/14. DOI 430 [pii]
48. Simonsick EM, Newman AB, Nevitt MC, et al. Measuring higher level physical function in well-functioning older adults: expanding familiar approaches in the Health ABC study. J Gerontol A Biol Sci Med Sci 2001;56:M644-9. Epub 2001/10/05. DOI

115
49. Newman AB, Haggerty CL, Kritchevsky SB, Nevitt MC, Simonsick EM. Walking performance and cardiovascular response: associations with age and morbidity--the Health, Aging and Body Composition Study. J Gerontol A Biol Sci Med Sci 2003;58:715-20. Epub 2003/08/07. DOI
50. Holvoet P, Harris TB, Tracy RP, et al. Association of high coronary heart disease risk status with circulating oxidized LDL in the well-functioning elderly: findings from the Health, Aging, and Body Composition study. Arterioscler Thromb Vasc Biol 2003;23:1444-8. Epub 2003/06/07. DOI 10.1161/01.ATV.0000080379.05071.2201.ATV.0000080379.05071.22 [pii]
51. Friedewald WT, Levy RI, Fredrickson DS. Estimation of the concentration of low-density lipoprotein cholesterol in plasma, without use of the preparative ultracentrifuge. Clin Chem 1972;18:499-502. Epub 1972/06/01. DOI
52. Newman AB, Simonsick EM, Naydeck BL, et al. Association of long-distance corridor walk performance with mortality, cardiovascular disease, mobility limitation, and disability. JAMA 2006;295:2018-26. Epub 2006/05/04. DOI 295/17/2018[pii]10.1001/jama.295.17.2018
53. de Rekeneire N, Rooks RN, Simonsick EM, et al. Racial differences in glycemic control in a well-functioning older diabetic population: findings from the Health, Aging and Body Composition Study. Diabetes care 2003;26:1986-92. Epub 2003/07/02. DOI
54. Pahor M, Chrischilles EA, Guralnik JM, Brown SL, Wallace RB, Carbonin P. Drug data coding and analysis in epidemiologic studies. Eur J Epidemiol 1994;10:405-11. Epub 1994/08/01. DOI
55. Psaty BM, Lee M, Savage PJ, Rutan GH, German PS, Lyles M. Assessing the use of medications in the elderly: methods and initial experience in the Cardiovascular Health Study. The Cardiovascular Health Study Collaborative Research Group. J Clin Epidemiol 1992;45:683-92. Epub 1992/06/01. DOI
56. Setoguchi S, Glynn RJ, Avorn J, Levin R, Winkelmayer WC. Ten-year trends of cardiovascular drug use after myocardial infarction among community-dwelling persons > or =65 years of age. Am J Cardiol 2007;100:1061-7. Epub 2007/09/22. DOI 10.1016/j.amjcard.2007.04.052
57. Lemaitre RN, Furberg CD, Newman AB, et al. Time trends in the use of cholesterol-lowering agents in older adults: the Cardiovascular Health Study. Arch Intern Med 1998;158:1761-8. Epub 1998/09/17. DOI
58. Jackevicius CA, Tu JV, Ross JS, Ko DT, Carreon D, Krumholz HM. Use of fibrates in the United States and Canada. JAMA 2011;305:1217-24. Epub 2011/03/24. DOI 305/12/1217 [pii]10.1001/jama.2011.353
59. Mann D, Reynolds K, Smith D, Muntner P. Trends in statin use and low-density lipoprotein cholesterol levels among US adults: impact of the 2001 National Cholesterol Education Program guidelines. Ann Pharmacother 2008;42:1208-15. Epub 2008/07/24. DOI 10.1345/aph.1L181
60. National Heart, Lung, and Blood Institute (NHLBI) Clinical Guidelines on Identification, Evaluation and Treatment of Overweight and Obesity in Adults 1998., 1998.
61. Schneeweiss S, Wang PS, Avorn J, Glynn RJ. Improved comorbidity adjustment for predicting mortality in Medicare populations. Health Serv Res 2003;38:1103-20. Epub 2003/09/13. DOI
62. Teng EL, Chui HC. The Modified Mini-Mental State (3MS) examination. J Clin Psychiatry 1987;48:314-8. Epub 1987/08/01. DOI
63. Radloff LS. The CES-D Scale: A Self-Report Depression Scale for Research in the General Population. Appl Psych Measur 1977;1:385-401. 0.1177/014662167700100306
64. Yaffe K, Lindquist K, Penninx BW, et al. Inflammatory markers and cognition in well-functioning African-American and white elders. Neurology 2003;61:76-80. Epub 2003/07/09. DOI
65. Diggle PJ, Heagerty P, Liang K-Y, Zeger SL, eds. Analysis of Longitudinal Data 2nd ed. New York: Oxford University Press Inc., 2002.
66. Madden JM, Graves AJ, Zhang F, et al. Cost-related medication nonadherence and spending on basic needs following implementation of Medicare Part D. JAMA 2008;299:1922-8. Epub 2008/04/24. DOI 10.1001/jama.299.16.1922

116
67. Rubin DB, ed. Multiple Imputation for Nonresponse in Surveys. New Yok: John Wiley and Sons, 1987.
68. Grol R, Zwaard A, Mokkink H, Dalhuijsen J, Casparie A. Dissemination of guidelines: which sources do physicians use in order to be informed? Int J Qual Health Care 1998;10:135-40. Epub 1998/08/05. DOI
69. Mosca L, Linfante AH, Benjamin EJ, et al. National study of physician awareness and adherence to cardiovascular disease prevention guidelines. Circulation 2005;111:499-510. Epub 2005/02/03. DOI 111/4/499 [pii]10.1161/01.CIR.0000154568.43333.82
70. Robinson JG, Booth B. Statin use and lipid levels in older adults: National Health and Nutrition Examination Survey, 2001 to 2006. J Clin Lipidol 2010;4:483-90. Epub 2010/12/03. DOI 10.1016/j.jacl.2010.10.002
71. Siegel D, Lopez J, Meier J. Use of cholesterol-lowering medications in the United States from 1991 to 1997. Am J Med 2000;108:496-9. Epub 2000/04/27. DOI
72. Riahi S, Fonager K, Toft E, et al. Use of lipid-lowering drugs during 1991-98 in Northern Jutland, Denmark. Br J Clin Pharmacol 2001;52:307-11. Epub 2001/09/19. DOI
73. Ko DT, Mamdani M, Alter DA. Lipid-lowering therapy with statins in high-risk elderly patients: the treatment-risk paradox. JAMA 2004;291:1864-70. Epub 2004/04/22. DOI 10.1001/jama.291.15.1864
74. Aronow WS. Underutilization of lipid-lowering drugs in older persons with prior myocardial infarction and a serum low-density lipoprotein cholesterol > 125 mg/dl. Am J Cardiol 1998;82:668-9, A6, A8. Epub 1998/09/11. DOI
75. Massing MW, Sueta CA, Chowdhury M, Biggs DP, Simpson RJ, Jr. Lipid management among coronary artery disease patients with diabetes mellitus or advanced age. Am J Cardiol 2001;87:646-9, A10. Epub 2001/03/07. DOI
76. Thomas JE, Tershakovec AM, Jones-Burton C, Sayeed RA, Foody JM. Lipid lowering for secondary prevention of cardiovascular disease in older adults. Drugs Aging 2010;27:959-72. Epub 2010/11/23. DOI 10.2165/11539550-000000000-00000
77. Benner JS, Glynn RJ, Mogun H, Neumann PJ, Weinstein MC, Avorn J. Long-term persistence in use of statin therapy in elderly patients. JAMA 2002;288:455-61. Epub 2002/07/23. DOI joc11856 [pii]
78. Field MJ, Lohr KN, eds. Guidelines for Clinical Practice: From Development to Use Washington, D.C: National Academy Press, 1992.
79. Green LW. Making research relevant: if it is an evidence-based practice, where's the practice-based evidence? Family practice 2008;25 Suppl 1:i20-4. Epub 2008/09/17. DOI 10.1093/fampra/cmn055
80. Cournot M, Cambou JP, Quentzel S, Danchin N. Key factors associated with the under-prescription of statins in elderly coronary heart disease patients: Results from the ELIAGE and ELICOEUR surveys. Int J Cardiol 2006;111:12-8. Epub 2005/07/28. DOI 10.1016/j.ijcard.2005.06.039
81. Morley JE. The cholesterol conundrum. J Am Geriatr Soc 2011;59:1955-6. Epub 2011/11/19. DOI 10.1111/j.1532-5415.2011.03594.x
82. Tinetti ME, McAvay GJ, Fried TR, et al. Health outcome priorities among competing cardiovascular, fall injury, and medication-related symptom outcomes. J Am Geriatr Soc 2008;56:1409-16. Epub 2008/07/30. DOI 10.1111/j.1532-5415.2008.01815.x
83. Raffel OC, White HD. Drug insight: Statin use in the elderly. Nat Clin Pract Cardiovasc Med 2006;3:318-28.
84. Jacobson TA. Overcoming 'ageism' bias in the treatment of hypercholesterolaemia : a review of safety issues with statins in the elderly. Drug Saf 2006;29:421-48.

117
3.8 TABLES AND FIGURES
Table 7. Baseline Characteristics of the Health ABC Cohort and Four Subgroups (N=3,055)a
Sociodemographic
Factors
All
(n=3,055)
Any CHD
(n=556)
Diabetes
only
(n=349)
PAD, or
Stroke or 2+
risk factors
(n=836)
<2 risk
factors
(n=1314)
Age, mean (SD) 73.6 (2.9) 74.0 (2.9) 73.5 (2.9) 73.4 (2.9) 73.6 (2.9)
Female sex 1574 (51.5) 202 (36.3) 169 (48.4) 404 (48.3) 799 (60.8)
Black race 1266 (41.4) 220 (39.6) 211 (60.5) 372 (44.5) 463 (35.2)
Pittsburgh site 1516 (49.6) 305 (54.9) 164 (47.0) 401 (48.0) 646 (49.2)
Education
Postsecondary 1285 (42.2) 227 (40.8) 117 (33.7) 355 (42.7) 586 (44.6)
High school 996 (32.7) 182 (32.7) 105 (30.3) 283 (34.1) 426 (32.4)
Less than high
school graduate
766 (25.1) 147 (26.4) 125 (36.0) 193 (23.2) 301 (22.9)
Living alone 920 (30.2) 146 (26.3) 111 (31.8) 257 (30.7) 406 (30.9)
Prescription drug
coverage
1883 (61.7) 383 (68.9) 213 (61.2) 499 (59.9) 788 (60.0)

118
Table 7 (Continued)
Health-related
behaviors
All
(n=3,055)
Any CHD
(n=556)
Diabetes
only
(n=349)
PAD, Stroke,
or 2+ risk
factors
(n=836)
< 2 risk
factors
(n=1314)
Smoking status
Current 316 (10.4) 53 (9.6) 30 (8.7) 187 (22.4) 46 (3.5)
Past 1397 (45.8) 311 (56.0) 165 (47.6) 324 (38.8) 597 (45.5)
Never 1337 (43.8) 191 (34.4) 151 (43.80) 324 (38.8) 670 (51.0)
Alcohol use
Current 1505 (49.5) 276 (49.8) 100 (28.7) 422 (50.8) 707 (54.0)
Past 677 (22.3) 141 (25.5) 134 (38.5) 192 (23.1) 210 (16.0)
Never 859 (28.3) 137 (24.7) 114 (32.8) 216 (26.0) 392 (30.0)

119
Table 7 (Continued)
Health Status
Factors
All
(n=3,055)
Any CHD
(n=556)
Diabetes
only
(n=349)
PAD, Stroke,
or 2+ risk
factors
(n=836)
< 2 risk
factors
(n=1314)
Congestive heart
failure
40 (1.3) 22 (4.2) 6 (1.7) 10 (1.2) 2 (0.2)
Chronic kidney disease 45 (1.5) 11 (2.0) 5 (1.4) 12 (1.4) 17 (1.3)
Pulmonary disease 127 (4.2) 26 (4.7) 20 (5.8) 26 (3.1) 55 (4.2)
Cancer 577 (18.9) 112 (20.2) 57 (16.3) 164 (19.6) 244 (18.6)
Excellent/good self-
rated health
2558 (83.8) 418 (75.2) 261 (74.8) 691 (82.8) 1188 (90.4)
Body mass index
Under/Normal 982 (32.1) 173 (31.1) 71 (20.3) 233 (27.9) 505 (38.4)
Overweight 1293 (42.3) 237 (42.6) 146 (41.8) 364 (43.5) 546 (41.6)
Obese 780 (25.5) 146 (26.3) 132 (37.8) 239 (28.6) 263 (20.0)
Number of prescription
drugs, mean (SD)
2.9 (2.6) 4.4 (2.9) 4.0 (2.7) 2.9 (2.4) 2.1 (2.3)
Severe depressive
symptoms (CES-D
> 15)
144 (4.8) 31 (5.6) 15 (4.4) 41 (4.9) 57 (4.4)
Cognitive impairment
(3MS< 80)
304 (10.0) 59 (10.7) 44 (12.7) 89 (10.7) 112 (8.6)

120
Table 7 (Continued)
Lipid profiles All
(n=3,055)
Any CHD
(n=556)
Diabetes
only
(n=349)
PAD, Stroke,
or 2+ risk
factors
(n=836)
< 2 Risk
factors
(n=1314)
Total cholesterol
(mg/dL), mean (SD)
202.8 (38.7) 193.7 (39.5) 201.1 (39.4) 199.7 (40.0) 209.0 (36.3)
LDL-C (mg/dL),
mean (SD)
121.7 (34.8) 115.5 (35.5) 122.3 (35.4) 122.7 (35.7) 123.4 (33.4)
HDL-C (mg/dL),
mean (SD)
53.9 (17.0) 49.3 (16.4) 50.6 (15.6) 46.8 (12.4) 61.2 (17.2)
Triglyceride
(mg/dL), mean (SD)
138.7 (82.9) 148.3 (87.1) 144.1 (91.7) 156.2 (102.6) 122.3 (58.3)
a Data represented as N (%), unless otherwise stated; Abbreviations: CES-D: Center for Epidemiologic Studies-Depression scale; HDL-C: high-density lipoprotein cholesterol; LDL-C: low-density lipoprotein cholesterol, PAD: peripheral artery disease

121
Table 8. Prevalence of Cholesterol-Lowering Medication Use from 1997-2008
1997-
1998
(n=3055)
n (%)
1998-
1999
(n=2908)
n (%)
1999-
2000
(n=2820)
n (%)
2001-
2002
(n=2631)
n (%)
2002-
2003
(n=2515)
n (%)
2004-
2005
(n=1780)
n (%)
2006-
2007
(n=1592)
n (%)
2007-
2008
(n=1344)
n (%)
Any
cholesterol
lowering
medications
456
(14.9)
509
(17.5)
586
(20.8)
702
(26.7)
737
(29.3)
656
(36.9)
676
(42.5)
573
(42.6)
Any statins 395
(12.9)
461
(15.9)
542
(19.2)
654
(24.9)
695
(27.6)
615
(34.6)
620
(38.9)
525
(39.1)
Any fibrates 35 (1.2) 30 (1.0) 32 (1.1) 33 (1.3) 29 (1.2) 29 (1.6) 33 (2.0) 28 (2.1)
Any bile acid
sequestrants,
probucol,
niacins
43 (1.4) 33 (1.1) 33 (1.2) 35 (1.3) 40 (1.6) 21 (1.2) 21 (1.3) 21 (1.6)
Any
ezetimibe
0 (0) 0 (0) 0 (0) 0 (0) 2 (0.1) 38 (2.1) 77 (4.8) 69 (5.1)

122
Table 9. Effect of the Release of the NCEP ATP III Guidelines and Results from PROSPER Study in 2002 on Cholesterol-Lowering Medications Usea
Drug Class
Level Changes Slope (Trend) Changes
Observed vs.
Predicted (using
pre-guideline trend)
Difference in Use
in year 2003
(Adjusted OR, 95%
CI) a
P-
value
Pre-
Guideline
Trend per
year
(Adjusted
OR and 95%
CI) a
Post-
Guideline
Trend per year
(Adjusted OR
and 95% CI) a
Post- vs. Pre-
Guideline
Difference in
Trends Over
Time per year
(Adjusted ROR,
95% CI) a
p-
value
Any Cholesterol Lowering
Medication Use
0.95 (0.89, 1.02) 0.18 1.18 (1.15, 1.20) 1.09 (1.02, 1.15) 0.92 (0.89, 0.95) <0.0001
Any Statin Use 0.95 (0.88, 1.01) 0.12 1.19 (1.16, 1.22) 1.07 (1.01, 1.13) 0.90 (0.87, 0.93) <0.0001
Any Fibrate/Other Use 1.04 (0.83, 1.30) 0.74 1.02 (0.93, 1.08) 1.24 (1.01, 1.46) 1.22 (1.10, 1.35) 0.0003 a Multivariate generalized estimating equations models adjusted for sociodemographics (race, age, sex, site, education, living status), health behavior (alcohol use), and health status (pulmonary disease, body mass index, polypharmacy, and prescription medications coverage). Polypharmacy and prescription coverage are time-varying variables. Abbreviations: CI: confidence interval; OR: odds ratio; ROR: ratio of odds ratio

123
Figure 3. Yearly Prevalence of Cholesterol-Lowering Medication Use by Four Groups from 1997-
2008

124
4.0 MANUSCRIPT 2: ASSOCIATIONS BETWEEN STATIN USE AND GAIT-SPEED
DECLINE IN COMMUNITY-DWELLING OLDER ADULTS
Wei-Hsuan Lo-Ciganic, MSCP, MS1,2; Subashan Perera, PhD3; Shelly L. Gray, PharmD, MS4;
Robert Boudreau, PhD1; Janice C. Zgibor, RPh, PhD1; Elsa S. Strotmeyer, PhD, MPH1; Julie M.
Donohue, PhD5; Clareann H Bunker, PhD1; Anne B. Newman, MD, MPH1,3; Eleanor Simonsick,
PhD6; Douglas C. Bauer, MD7; Suzanne Satterfield, MD, MPH, DrPH8; Paolo Caserotti, PhD9;
Tamara Harris, MD, MS10; Ronald I Shorr, MD, MPH11; Joseph T. Hanlon, PharmD, MS1,2, 3,12,13
for the Health, Aging and Body Composition Study
AUTHORS’ AFFILIATIONS: 1) Department of Epidemiology, Graduate School of Public
Health, University of Pittsburgh, Pittsburgh, PA, 2) Geriatric Pharmaceutical Outcomes and
Gero-Informatics Research and Training Program, University of Pittsburgh, Pittsburgh, PA, 3)
Division of Geriatrics, Department of Medicine, School of Medicine, University of Pittsburgh,
Pittsburgh, PA, 4) School of Pharmacy, University of Washington, Seattle, WA, 5) Department
of Health Policy and Management, Graduate School of Public Health, University of Pittsburgh,
Pittsburgh, PA, 6) Laboratory of Epidemiology, Demography, and Biometry, Intramural
Research Program, National Institute on Aging, Bethesda, MD, 7) Division of General Medicine,
University of California at San Francisco, San Francisco, CA, 8) Department of Preventive
Medicine, University of Tennessee Health Science Center, Memphis, TN, 9) Institute of Sports

125
Science and Clinical Biomechanics, University of Southern Denmark, 11) Laboratory of
Epidemiology, Demography, and Biometry, Geriatric Epidemiology Section, National Institute
on Aging, Bethesda, MD, 11) Department of Epidemiology, University of Florida, 12) Center for
Health Equity Research and Geriatric Research Education and Clinical Center, Veterans Affairs
Pittsburgh Healthcare System, Pittsburgh, PA, 13) Department of Pharmacy and Therapeutics,
School of Pharmacy, University of Pittsburgh, Pittsburgh, PA

126
4.1 ABSTRACT
Background: The evidence that statin use may impact physical function decline in older adults
is mixed.
Objective: To examine whether the use of statins is associated with a lower risk of gait speed
decline of 0.05 m/s or more and 0.1 m/s or more per year in community-dwelling older adults.
Design: Longitudinal cohort study.
Setting: Health, Aging and Body Composition study.
Participants: 2405 participants with medication and gait speed data 1998-1999 and 1999-2000
were included.
Measurements: Any use, summated standardized daily doses (low, moderate, high) and duration
(<2 years, ≥ 2 years) of statin use were computed. The effect of lipophilic/hydrophilic statins on
gait speed decline was also evaluated. The primary outcomes were small, meaningful decline in
usual gait speed (≥ 0.05 m/s), and substantial usual gait speed decline (≥ 0.1 m/s per year) during
a 20-m walk annually over a four-year time period. Multivariable generalized estimating
equations (GEEs) were used, adjusting for demographic, health-related behaviors and health
status factors.
Results: The use of statins increased from 16.2% in 1998-1999 to 25.6% in 2002-2003.
Approximately 34% to 38% of participants had gait speed decline ≥ 0.05 m/s per year, and 23%
of participants had decline ≥ 0.1 m/s per year. Compared to non-users, any statin use was
associated with a 16% risk reduction of gait speed decline ≥ 0.05 m/s per year (aOR = 0.84, 95%

127
CI = 0.74-0.96). A similar finding was seen in low-dose, long-term, and hydrophilic statin users.
However, only low-dose statin users had a 22% decrease in the risk of gait speed decline ≥ 0.1
m/s per year (aOR = 0.78, 95% CI = 0.61-0.99).
Conclusion: Statin use may decrease the risk of gait speed decline, suggesting low-dose statin
may be a treatment option for older adults.

128
4.2 INTRODUCTION
4.2.1 Epidemiology of Impaired Physical Function and Disability in the Elderly
The public health challenge of age-related disability and loss in physical function emerges an
important topic in our rapidly aging population (1, 2). Maintenance of physical function is
important in the elderly because of its relationship to the ability to live independently and to
overall quality of life (3). The prevalence of physical limitations varies by age, sex, race, and
education (2). National Health Interview Survey 2001-2007 showed that the prevalence of one
or more physical limitations increases with advancing age (age of 50-59: 16.5%; age of 60-69:
22.9%; age of 70-79: 31.4%; age of 80 and over: 42.9%), as does the prevalence of having three
or more physical limitations (age of 50-59: 8.1%; age of 60-69: 11.5%; age of 70-79: 16.2%; age
of 80 and over: 26.7%) (2). Non-Hispanic black adults aged ≥ 50 years have higher prevalence
of physical limitations compared to non-Hispanic white (age of 50-59: 24.1% vs. 17.2%; age of
60-69: 33.9% vs. 24.4%; age of 70-79: 43.9% vs. 35.2%; age of 80 and over: 58.4% vs. 52.1%)
(2). For both non-Hispanic white and black older adults aged ≥ 50 years, women are more likely
than men of the same age to have one or more physical limitations (white: age of 50-59: 20.5%
vs. 13.8%; age of 60-69: 28.2% vs. 20.3%; age of 70-79: 39.5% vs. 29.6%; age of 80 and over:
55.4% vs. 46.3%; black: age of 50-59: 27.8% vs. 19.5%; age of 60-69: 39.8% vs. 26.7%; age of
70-79: 50.4% vs. 33.8%; age of 80 and over: 63.5% vs. 48.2%) (2). For both non-Hispanic

129
white and black older adults aged ≥ 50 years with less than a high school education have higher a
prevalence of physical limitations than those with at least a high school diploma (2).
4.2.2 Gait Speed and Potential Factors that Influence Gait Speed
The ability to walk underlies many basic and community functions necessary for independence
(4). The appearance of difficulties in walking marks a critical point such that assessment of gait
speed has been described as the “sixth vital sign”(5), with the potential to serve as a core
indicator of health and function in aging and disease (4).
Judgment about how an individual’s gait speed compares with those of the population to
which they belong requires the availability of reference values (6, 7). Gait speed is determined
by physical features such as age, sex, height, presence or absence of disease and physical fitness
(8, 9). Numerous large scale epidemiological studies have documented gait speed in healthy,
community-dwelling older adults (10, 11), and normative values have been established specific
to this group (6, 12). The usual gait speed for healthy women aged between 70-79 years is 1.13
m/s and for men 1.26 m/s (12). For women and men aged 80-99, the values are 0.94 m/s and
0.97 m/s, respectively (12). For well-functioning older adults, the gait speed < 0.80 m/s is an
indicator of prevalent mobility limitations, <1.0 m/s is associated with adverse health outcomes
and mortality in well-functioning older adults, and <1.2 m/s is associated with difficulty in
crossing streets in the community (11, 13-15). A recent meta-analysis showed that the gait
speed estimate for usual pace was 0.58 m/s (95% CI: 0.75-1.02) in older adults aged ≥ 70 years
across the hospital settings, and 0.46 m/s (95% CI: 0.65-0.83) in acute care settings (16).
Abellan et al. proposed a gait speed of 0.8 m/s as a predictor of poor clinical outcomes and 0.6

130
m/s as a threshold to predict further functional decline in those older adults already impaired
(10).
Slowing of movement with aging appears to be a universal biological phenomenon and is
likely to reflect the integrated performance of numerous organ systems. Factors that influence
walking ability can be classified into six main physiological subsystems: central nervous system,
perceptual system, peripheral nervous system, muscles, bone, and/or joints, and energy
production and/or delivery (17). Impaired physical function and subsequent disability can occur
as a result of age-related losses of muscle mass and strength or an acute event (e.g., stroke or hip
fracture), or as a consequence of chronic disease (e.g., osteoarthritis or congestive heart failure)
(18). Neurologic and musculoskeletal deficits linked with reductions in motor discharge rate,
lower activation of muscle fibers, poor balance performance, physical fitness are other
contributing factors (6, 9). In addition, area with growing body of evidence suggests a
relationship between chronic inflammation and age-related muscle and strength loss, risk of
disability, frailty, and physical function decline (18-28). Inflammatory cytokines have a
catabolic effect on muscle (22, 29-31), and have been implicated in the pathogenesis of
musculoskeletal disorders such as osteoarthritis (32). Higher IL-6 levels were significantly
associated with lower muscle mass (30), weaker grip strength (30) and lower gait speed (33). A
recent study showed that each doubling in CRP and IL-6 change over 9 years was associated
with higher risk of physical or cognitive impairment (odds ratio for CRP: 1.29 [95% CI 1.15-
1.45] and odds ratio for IL-6: 1.45 [95% CI 1.20-1.76]) among 1051 participants in the
Cardiovascular Health Study All Starts Study (34).

131
4.2.3 Potential Mechanisms that How Statins Affect Physical Function
Multiple factors appear to be involved in frailty and age-related physical function decline (25,
26, 35). The Muscial effect of statins on physical performance may be explained by three
mechanisms. Firstly, statins might affect physical function by retarding the deleterious effects of
atherosclerosis on blood vessels in skeletal muscle, ensuring better perfusion and therefore,
preventing muscle wasting and reducing muscle weakness and/or fatigue (36, 37). Indeed,
statins increase the production of nitric oxide in the endothelium which has local vasodilator
properties, in addition to antithrombogenic, antiproliferative and leukocyte adhesion inhibiting
effects (36, 37). Secondly, statins may elicit their effect by reducing the risk of incident of
cardiovascular events, which are major determinants of physical performance in older adults
(38). The literatures suggest that statins may exert a beneficial effect on stroke (39) and
dementia (40-42) prevention. Recent studies show that statins improve endothelial function in
peripheral arteries (43). Finally, the most intriguing hypothesis is that statins may reduce chronic
inflammation, which, in turn, is an important determinant of disability and impaired function
(20). Anti-inflammatory effects of statins may affect type II (fast-twitch) muscle fibers to a
greater degree than type I (slow-twitch) muscle fibers. Indeed, in older adults, higher levels of
inflammatory markers are strong independent predictors of incident disability probably through
an accelerated muscle catabolism leading to muscle wasting (23). Several studies have
demonstrated that statins reduce levels of CRP and other inflammatory markers independent of
their effects on cholesterol (44-47). Therefore, the evidence appears to provide a rationale for a
direct effect of statins on physical function impairment or disability.

132
It is possible that the potential beneficial effect of statins may be counteracted by the
muscle-related adverse events (e.g., myalgia, muscle weakness, cramps) (48-54). The incidence
of myopathy among statin users was as high as 5%-10% (55, 56). A variety of different
hypotheses have been suggested to account for the myotoxic effects of statins (57). These
included statin-induced interruption of glycoprotein synthesis in the muscle membrane (58),
deficiency in chloride channel activation in the muscle membrane (59), and increased
intracellular calcium concentrations leading to impaired membrane function (60), all of which
may result in myocyte injury. Decreased intracellular cholesterol which is associated with low
plasma cholesterol from statin therapy may result in reduced membrane lipid content, which in
turn may cause physical modification of membrane fluidity and a decrease in cell proliferation
(61). In addition, HMG-CoA reductase catalyses the formation of mevalonate from HMG-CoA.
Mevalonate is an important precursor not only of cholesterol but also of ubiquinone (co-enzyme
Q), dolichols and isopentenyl adenine. All these products are involved in cell replication and
dolichols is required for glycoprotein synthesis (62). Deficits in these products may adversely
affect myocyte duplication and cause disruption of the cell membrane, predisposing to myotoxic
consequences. Ubiquinone is utilized by mitochondria for electron transport, reduced synthesis
of ubiquinone may result in defective mitochondrial myopathies (63) and defective ATP
synthesis predisposing myocyte instability (64). However, the precise mechanisms remain
unclear and there is no clear consensus of opinion regarding which is more likely to be
responsible.

133
4.2.4 Significance of the Current Study
The preservation of physical function is critically important for prolonged, independent living
and overall quality of life for older adults (3). Hence, identifying modifiable factors to delay
physical function decline in older adults is a significant priority of public health interest.
Gait speed is a simple, but important indicator of functional status in older adults (10, 11, 65).
Declines in gait speed consistently predict future physical disability, mortality, and major health-
related outcomes (e.g., hospitalizations, nursing home admissions, falls, cognitive
decline/dementia and poor quality of life) in older adults (10, 11, 13, 66-68). In older adults,
every 0.1 m/s slower gait speed is associated with a 12% higher mortality (11). Despite the
importance of gait speed decline, a paucity of literature has identified risk or protective factors,
other than physical exercise, for age-related gait speed decline, or the magnitude of important
gait decline in gait speed associated with these factors (69).
Evidence suggests that statins have anti-inflammatory effects, which is beyond their
cholesterol-lowering and anti-atherosclerosis effect, and therefore may be candidates for
preventing physical disability and related outcomes (10, 44-47, 70-76). The evidence that exists
shows mixed results. Previous studies showed that statin use was associated with improved
walking speed, walking distance, better physical performance, and improved physical activity in
individuals with peripheral arterial disease (PAD) (77-81). However, Gray SL et al. did not find
that statin use, regardless of any use, dose- and duration-response, lower risk of mobility
limitation or physical function decline in community-dwelling older adults aged 65-79 years at
baseline (82, 83) over 6 years of follow-up.

134
To our knowledge, the association between statin use and gait-speed decline over a 20-m
walk in community-dwelling older adults has not been previously explored. The objective of
this study was to examine whether the use of statins is associated with a decreased risk of
clinically meaningful gait speed decline (i.e., 0.05 m/s or more and 0.1 m/s or more per year) in
community-dwelling older adults. We hypothesized that statin users when compared to non-
users had a decreased risk of gait speed decline. Dose-response, duration-response, and
lipophilicity/hydrophilicity of statin use were also examined. We hypothesized that high-dose,
long-term and hydrophilic statin use was associated with a decreased risk of gait speed decline
compared to non-users.
4.3 METHODS
4.3.1 Study Design, Sample, and Source of Data
Participants were from the Health, Aging and Body Composition (Health ABC) Study, which is
a prospective cohort study of 3,075 initially well-functioning white and black adults aged 70-79
years (84, 85). Participants were recruited in 1997 and 1998 from a random sample of Medicare
beneficiaries residing in Pittsburgh, Pennsylvania and Memphis, Tennessee. Eligibility criteria
included no self-reported difficulty in walking one-quarter of a mile (400 m), climbing 10 steps
without resting, and performing basic activities of daily living. In addition, eligible participants
could not use a cane, walker, crutches or other special equipment to ambulate (84, 85). The

135
study was approved by the Institutional Review Boards of the Universities of Pittsburgh and
Tennessee, and written informed consent was obtained from each participant.
4.3.2 Study Subsample
The Year 2 (1998-1999) Health ABC visit was used as baseline since serial testing of 20-m gait
speed began at this visit. A total of 2,045 participants who had both medication information and
gait speed data from the 1998-1999 and 1999-2000 clinic visits were included in the current
analysis.
4.3.3 Data Collection and Data Management
The data collected during annual in-person visits included results from blood tests (e.g., serum
creatinine), a battery of detailed physiological measurements using standardized methods and
responses to questionnaires regarding sociodemographic characteristics, multiple aspects of
health behavior and status, and medication use (84, 85). Health behavior and health status
factors, as well as medication use, were used to define a numbers of conditions of interest for this
study (e.g., diabetes mellitus and hypertension) (86, 87). Several comorbidities examined in the
current study (i.e., coronary heart disease [CHD), congestive heart failure [CHF], stroke, or
peripheral artery disease [PAD]) were centrally adjudicated by a post hoc committee based on
conclusive evidence from hospitalization or death records (84, 85).
At baseline (1998-1999) and annually for four years (except year 2000-2001), participants were
asked to bring all prescription medications taken in the previous month. Trained interviewers
136
transcribed information from the medication containers on medication name, dosage form, dose,
and whether the medication was taken as needed. The medication data were coded using the
Iowa Drug Information Service (IDIS) and then entered into a computerized database (88).
These methods of medication data collection are considered highly accurate and concordant with
information contained in pharmacy claims data (89).
Gait speed was measured over a 20-m course in an unobstructed corridor at baseline
(1998-1999) and continued annually for the next four years (90, 91). A 20-m gait speed was
summarized in meters per second (m/s). Participants were instructed to walk at their usual pace
from a starting point and walk past an orange cone indicating the end of the course. Timing
started with the first step after the starting line and ended after the first step over the finishing
line. Participants were allowed to use walking aids during the test, such as cane. Gait speed has
high test-retest reliability in older adults with intraclass correlation coefficients greater than 0.9
(8).
4.3.4 Independent Variables
Statin use was determined from the coded prescription medication data, corresponding to IDIS
codes 24060202-24060208. The primary independent variable was use versus no use of statins
at baseline and annually (as a dichotomous time-varying variable). Statin exposure had to
precede the ascertainment of gait speed measures in the subsequent year. For example, statin use
in 1998-1999 was a potential risk/protective factor for gait speed measure assessed in 1999-2000.
Statin nonusers were always the reference group for all of the analyses.

137
Several operational definitions of statin use (i.e., dose, duration, and lipophilicity/ hydrophilicity)
were used to examine the robustness of the findings. A priori standardized daily dose (SDD)
was used to test dose-response relationships between time-varying exposure of statin doses and
gait speed measures (92). For current users of each individual statin medication at baseline,
1999-2000, and 2001-2002, we calculated the daily dose by multiplying the number of dosage
forms taken the previous day by medication strength. Little information is available regarding
the comparative effect of statins on inflammatory markers. Some studies suggest that effects on
C-reactive protein (CRP), may be independent of degree of lipid lowering, but comparative
metrics are not available for anti-inflammatory effects (75, 93). To compare across statins, we
converted the daily dose to units of equivalent dose reported to decrease LDL-C by 37% (94,
95). The following daily doses were considered to equal one unit of equivalent dose
(atorvastatin 10mg, fluvastatin 80 mg, lovastatin 40 mg, pravastatin 40 mg, simvastatin 20 mg,
rosuvastatin 5 mg) (94, 95). The SDD were operationally defined based on the distribution of
the data and clinical relevance into three categories: low-dose (<1.0 SDD), moderate-dose (1.0
SDD), and high-dose (> 1.0 SDD) use.
To examine the relationship between the duration of statin use and outcome measures, we
operationally defined a time-varying independent categorical variable (i.e., short-term: use < 2
years vs. long-term: use ≥ 2 years) for the duration of each statin use based on the data
distribution. For example, at baseline, duration of use of statin was operationally defined as
either “long-term” (e.g., continuous use for previous 2 years) or “short-term” (use only at the
baseline in-person medication review). At follow-up, duration of use among current users was
operationally defined as either long-term (use of any statin medications at most recent and

138
previous in-person medication reviews) or short-term (use at most recent in-person medication
review only).
In addition to this, some in vitro and in vivo experiments suggest that lipophilic statins
(i.e., lovastatin, simvastatin, atorvastatin, fluvastatin) might be more likely to produce muscular
adverse effects than relatively hydrophilic statins (i.e., pravastatin, rosuvastatin) (96). Therefore,
analyses were stratified by lipophilic versus hydrophilic of statins.
4.3.5 Primary Outcome Measure: Gait Speed Decline per year
Previous studies show that gait speed alone is strongly associated with morbidity and mortality in
older adults (11, 13, 97). The best initial estimates of small meaningful change for gait speed
are near 0.05 m/s. The best estimates of substantial change for clinical and research use are near
0.10 m/s for gait speed (98). The primary outcome variables were gait speed decline 1) by 0.05
m/s or more, and 2) gait speed decline by 0.1 m/s or more per year (98).
4.3.6 Covariates
Several characteristics that could confound or modify the association between statin use and gait
speed were adjusted for in the analysis, and were grouped into three domains: (1)
sociodemographic factors, (2) health-related behaviors and (3) health status (99-102). Age was
considered as a continuous variable. Other sociodemographic factors that were characterized as
categorical variables included race (black or white), sex, study site, education (postsecondary
education, high school graduate, or less than high school graduate), and living status (alone or

139
not alone). A dichotomous time-varying variable for prescription drug coverage was also
included to account for patients who were on and off insurance over the study period.
Health-related behaviors were characterized as categorical variables for smoking status,
alcohol use (current, past, or never), and exercise level (yes vs. no) which was based on self-
report of having high to moderate intensity exercise in the previous week. Health status factors
were characterized as time-varying dichotomous measures (present vs. absent) for comorbidities
including hypertension, diabetes, CHD, CHF, stroke and PAD to control the confounding by
indications. Hypertension was defined by self-reported diagnosis of hypertension and use of
anti-hypertensive medications (86). Diabetes was defined by self-reported diagnosis of diabetes
or use of anti-diabetic medications (87). Chronic kidney disease (CKD) was defined as
estimated glomerular filtration rate (eGFR) less than 60 ml/min, which was calculated using the
four-variable version of the Modification of Diet in Renal Disease equation (103, 104).
Dichotomous measures (present vs. absent) were used for self-reported pulmonary disease,
osteoarthritis, and Parkinson disease at initial baseline for the Health ABC. A time-varying
dichotomous variable was created for self-rated health (excellent/good vs. not excellent/good).
A categorical variable for body mass index (BMI: underweight or normal [<25.0 kg/m2],
overweight [25.0–29.9 kg/m2], or obese [≥30.0 kg/m2]) was created (105). Dichotomous
variables were created for cognitive impairment (Modified Mini-Mental State [3MS] < 80) (106)
and high depressive symptoms (Center for Epidemiologic Studies Depression Scale score >15)
(107). Two continuous variables were considered, leg muscle strength (i.e., average maximum
torque [Nm]) and body composition (i.e., average total body lean mass [kg]) (52). Time-varying
variables (yes vs. no) of medications related to falls and mobility problems including

140
benzodiazepines, and anticholinergic medications were also controlled (92, 108-110). In
addition, three dichotomous time-varying variables (yes/no) for other medications with anti-
inflammatory effects were created including (1) angiotensin converting enzyme inhibitors
(ACEIs), (2) non-steroidal anti-inflammatory drugs (NSAIDs), and (3) other medications (i.e.,
systematic glucocorticoids, immunosuppressive medications, and some medications for
rheumatoid arthritis, asthma, inflammatory bowel diseases, systemic lupus erythematosus and
other systemic inflammatory diseases [Appendix]) (111-116). The number of overall
prescription medications (excluding statins, benzodiazepine, ACEIs, and anti-inflammatory
drugs) was included as a time-varying continuous variable as a proxy for comorbidity (117).
4.3.7 Main Statistical Analysis
All analyses were performed using SAS® version 9.3 (SAS Institute Inc. Cary, NC).
Appropriate descriptive statistics (mean, standard deviation, frequency and percentage)
were used to summarize participant characteristics and main analytic variables. For descriptive
purposes, the prevalence of statin use and gait speed decline over time were reported. For
primary outcome (gait speed decline ≥ 0.1 m/s per year), multivariable generalized estimating
equations [GEEs] models was conducted to examine the association between statin use and gait
speed decline. This analysis used the SAS® GENMOD procedure with an autoregressive
working correlation structure to account for potential multiple years of data from the same
participants and the resulting stochastic non-independence of observations (118). A forward
selection procedure was performed to determine the impact of each variable on the association of
statin use and gait speed decline. In the final multivariate models, odds ratios (ORs) and 95%
141
confidence intervals (CI) for statin use were computed adjusted for demographics, baseline gait
speed measures and covariates with a p-value less than 0.15 from the forward selection
procedure. A similar approach adjusted for same covariates was conducted using other
operational definitions of statin use as main predictors to test dose-response, duration-response,
and lipophilicity or hydrophilicity of statin use.
4.3.8 Sensitivity and Stratification Analyses
A series of sensitivity analyses were conducted to better understand and assure the robustness of
the main findings. First, we assessed change in gait speed (m/s) per year as a continuous
outcome variable, and examined the associations between statin use using a series of conditional
linear mixed model implemented in SAS® MIXED procedure (119, 120). The subject-specific
random effect was used to accommodate the likely correlation between repeated measurements
for the same participants. The change in gait speed was the successive difference in the
particular functional performance measure of interest (i.e., from baseline to 1999-2000, from
1999-2000 to 2000-2001, from 2001-2002 to 2002-2003). Similar to the main analyses, other
operational definitions of statin use were evaluated based on dose-response, duration, and
lipophilicity of statins, separately. The second sensitivity analysis was performed by restricting
the analysis to only those with data for the entire five year time period. The last sensitivity
analysis was to determine if the cut point for meaningful change in gait speed for a 20-m walk is
the same as the one derived from 10 feet to 10-m walk in Perera S’s study (98). Finally, a
stratification analyses were conducted by race, sex, and baseline gait speed (<1.0 m/s, 1.0-1.22
m/s and >1.22 m/s) due to the flooring and ceiling effects of gait speed decline. Walking 1.22

142
m/s is a minimum speed needed to cross a street at a timed crosswalk (15), and walking less than
1.0 m/s is a risk factor for mortality (13).
4.4 RESULTS
The baseline characteristics of the overall participants and according to statin use are shown in
Table 10. Of the 2,405 participants, the mean age was 74.6 years, 51% were female, 37% were
black, and 63% had prescription medication coverage. Among 2,405 participants, 390 (16.2%)
participants used statins. Compared with non-users, statin users were more likely than non-users
to be younger, white, from Pittsburgh site, have prescription drug coverage, smoke previously,
drink alcohol currently, have high- or moderate-intensity exercise, have more chronic
comorbidities (i.e., hypertension, diabetes, CHD, CHF, stroke, PAD, and CKD). Statin users
were also more likely to be benzodiazepine and ACEI users and took more prescription drugs.
Table 11 provides the information on statin use over the study period. At baseline, 390
(16.2%) older adults used a statin, with 48% using low doses, 71% had been taking a statin for 2
years or longer, and 86% used lipophilic statins. Statin use increased steadily over the course of
the study, to 20.1% in 1999-2000 and 25.6% in 2001-2002.
Table 12 describes the prevalence of gait speed decline for the overall participants and
according to statin use over time. Statin users had a faster gait speed at baseline (1.17 m/s vs.
1.14 m/s, p=0.02), and this trend was seen during the follow-up years. The overall gait speed
decline of 0.1 m/s or more per year changed slightly from 22.2% in 1999-2000 to 23.9% in 2002-
2003. Compared to non-users, statin users had less gait speed decline of 0.05 m/s or more per
143
year (34.5% vs. 28.7% p =0.03) , and decline of 0.1 m/s or more per year (23.3% vs. 18%, p
=0.03) in 1999-2000. However, statin users had similar proportions of gait speed decline of 0.05
m/s or more and 0.1 m/s or more per year as non-users in 2000-2002 and 2002-2003.
Table 13 shows the univariate and multivariate associations between statin use and gait
speed decline of 0.05 m/s or more per year. There was a 16% risk reduction in gait speed decline
of 0.05 m/s or more per year among any statin users compared to non-users (adjusted OR 0.84;
95% CI 0.74-0.96). A similar protective effect was seen in low- and high-dose, long-term and
hydrophilic statin use.
Table 14 shows the univariate and multivariate associations between statin use and gait
speed decline of 0.1 m/s or more per year. Compared with non-users, any statin use was likely to
decrease the risk of gait speed decline of 0.1 m/s or more per year (adjusted OR 0.89; 95% CI
0.76-1.05), but was not statistically significant. A similar finding was seen in high-dose, long-
term and hydrophilic of statin use when individually compared to nonusers. However, there was
a 22% risk reduction in gait speed decline of 0.1 m/s or more per year among low-dose users
compared to non-users of statins (adjusted OR 0.78; 95% CI 0.61-0.99).
Sensitivity and Stratification Analyses
None of the additional sensitivity analyses appreciably changed our main findings. First,
the results from the mixed models revealed that any statin users (0.011 m/s, 95% CI 0.002-
0.020), low-dose (0.021 m/s, 95% CI 0.008-0.034) and long-term (0.012 m/s, 95% CI 0.002-
0.022) statin use had a less mean gait speed decline per year compared to non-users. Secondly,
the restriction of the analysis to only those with data for the entire time period had similar
findings (data not shown). Thirdly, the results from testing different cut points showed that
statins use had a decreased risk of gait speed decline between 0.04-0.06 m/s per year (data not

144
shown). Lastly, the analysis stratified by sex yielded similar results. However, any statin use
reduced the risk of gait speed was more predominant in blacks (OR: 0.76, 95% CI: 0.58-1.01)
than in whites (OR: 0.94, 95% CI: 0.78-1.08). The stratification analysis only supported that any
statin use reduced the risk of gait speed decline among those with baseline gait speed between
1.0 to 1.22 m/s (OR: 0.73, 95% CI: 0.55-0.98) compared to non-users, but not among those with
baseline gait speed less than 1.0 m/s (OR: 0.92, 95% CI: 0.63-1.36) or 1.22 m/s or greater (OR:
1.05, 95% CI: 0.83-1.32).
4.5 DISCUSSION
Our study showed that statin use, compared to non-users, had a decreased risk of decline in gait
speed of 0.05 m/s or more per year in community-dwelling older adults (98). In addition, low-
dose statin use had a decreased risk of gait speed decline of 0.1 m/s or more per year (98), which
has been related to outcomes of self-reported motility and other health-related adverse events.
These findings are consistent with the protective effects of statins in physical function decline
from two small randomized trials (81, 121), and two longitudinal studies (77, 78) in individuals
with PAD. The overall protective association between any statin use and risk of small
meaningful decline in gait speed is reassuring in the context of concerns of statin-related
muscular adverse events in older adults. Furthermore, the muscle-related adverse events of statin
use are associated with dose and blood level (122, 123). The statin-related muscular adverse
events may occur in up to 10% of the adults receiving high-dose statins (56), however, the
precise estimate is unknown for older frail adults. Low-dose statin use may minimize muscle-

145
related adverse effects in older adults, and therefore may be less likely to counteract beneficial
effects on slower gait speed decline due to anti-inflammatory effect. The beneficial effects of
statins in gait speed decline may be due to better endothelial function resulting in enhanced
lower extremity blood flow (77), besides a reduction in inflammation-mediated sarcopenia.
Regression of arterial plaque may be responsible for these associations. However, our study
findings were in contrast of previous studies conducted in other community-dwelling
populations, which were not restricted to a specific disease (i.e., PAD) (50, 82, 83, 124).
Possible explanations of these discrepancies of the association with physical function decline
include different populations (e.g., women only, younger baseline age), without testing for dose-
and duration-response, and less precise outcome measure (e.g., self-reported outcomes vs.
objectively assessed physical function measures).
It is also notable that hydrophilic statins may have better beneficial effect in gait speed
decline than lipophilic statins. Hydrophilic statins are less capable of entering nonhepatic cells.
This is one possible reason why statin-related muscular adverse events appear to be reported less
frequently with the use of hydrophilic statins. However, due to limited sample size of
hydrophilic statin users, further studies will be required to elucidate how different statins with
different lipophilic properties and safety profiles are associated with the risk of myotoxicity (125,
126).
Strengths of this study include the prospective design in a large sample of community-
dwelling older adults, well-collected medication information, the availability of serially obtained,
standardized gait speed measures, and the ability to adjust for numerous potential confounders.
However, some limitations should be considered when interpreting the results of this study.
Inherent to most longitudinal studies examining older adults, the potential for survivor bias

146
should be considered. This may lead to an underestimation of the association because
individuals who missed follow-up assessments (e.g., due to health problems or death) were more
likely to have gait speed decline than included participants. However, the results from a
sensitivity analysis, restricted to participants in the study from 1998-2003, yielded similar results
(data not shown). It is also possible that any use of statins may be underestimated as medication
use was measured at multiple fixed annual time points. We also cannot rule out potential
confounding by such factors as adherence to medications and use of health care services because
information about these was not collected in the Health ABC study. Given the high rates of non-
adherence in statin users, it is possible that the protective effects of statins from gait speed
decline were underestimated. Despite employing several strategies, unmeasured confounding by
indications cannot be ruled out completely (127). Lastly, the study sample was drawn from two
US cities and may not be generalizable to all other populations.
4.6 CONCLUSION
In conclusion, findings from this study suggest that statin use may benefit in a decreased risk of
age-related gait speed decline. Although our results do not suggest any negative effects on gait
speed decline at higher dose, given that older adults are at higher risk to experience other adverse
effects of statin use, low-dose statins are suggested for older adults to start with, and hydrophilic
statins may be used for those with multiple comorbidities and medications. Further studies and
randomized clinical trials are needed to confirm the observed associations between statin use and
declines in gait speed in other older adults populations.

147
4.7 LITERATURE CITED
1. Verghese J, LeValley A, Hall CB, Katz MJ, Ambrose AF, Lipton RB. Epidemiology of gait disorders in community-residing older adults. J Am Geriatr Soc 2006;54(2):255-61.
2. Holmes J, Powell-Griner E, Lethbridge-Cejku M, Heyman K. Aging Differently: Physical Limitations among Adults Aged 50 years and Over: United States, 2001-2007. NCHS data brief, no 20. Hyattsville, MD: National Center for Health Statistics, 2009.
3. Kaplan GA. Maintenance of functioning in the elderly. Ann Epidemiol 1992;2(6):823-34. 4. Studenski S. Bradypedia: is gait speed ready for clinical use? J Nutr Health Aging
2009;13(10):878-80. 5. Fritz S, Lusardi M. White paper: "walking speed: the sixth vital sign". J Geriatr Phys Ther
2009;32(2):46-9. 6. Bohannon RW, Andrews AW, Thomas MW. Walking speed: reference values and correlates for
older adults. J Orthop Sports Phys Ther 1996;24(2):86-90. 7. Oberg T, Karsznia A, Oberg K. Basic gait parameters: reference data for normal subjects, 10-79
years of age. J Rehabil Res Dev 1993;30(2):210-23. 8. Steffen TM, Hacker TA, Mollinger L. Age- and gender-related test performance in community-
dwelling elderly people: Six-Minute Walk Test, Berg Balance Scale, Timed Up & Go Test, and gait speeds. Phys Ther 2002;82(2):128-37.
9. Dumurgier J, Elbaz A, Ducimetiere P, Tavernier B, Alperovitch A, Tzourio C. Slow walking speed and cardiovascular death in well functioning older adults: prospective cohort study. BMJ 2009;339:b4460.
10. Abellan van Kan G, Rolland Y, Andrieu S, Bauer J, Beauchet O, Bonnefoy M, Cesari M, Donini LM, Gillette Guyonnet S, Inzitari M, Nourhashemi F, Onder G, Ritz P, Salva A, Visser M, Vellas B. Gait speed at usual pace as a predictor of adverse outcomes in community-dwelling older people an International Academy on Nutrition and Aging (IANA) Task Force. J Nutr Health Aging 2009;13(10):881-9.
11. Studenski S, Perera S, Patel K, Rosano C, Faulkner K, Inzitari M, Brach J, Chandler J, Cawthon P, Connor EB, Nevitt M, Visser M, Kritchevsky S, Badinelli S, Harris T, Newman AB, Cauley J, Ferrucci L, Guralnik J. Gait speed and survival in older adults. JAMA 2011;305(1):50-8.
12. Bohannon RW, Williams Andrews A. Normal walking speed: a descriptive meta-analysis. Physiotherapy 2011;97(3):182-9.
13. Cesari M, Kritchevsky SB, Penninx BW, Nicklas BJ, Simonsick EM, Newman AB, Tylavsky FA, Brach JS, Satterfield S, Bauer DC, Visser M, Rubin SM, Harris TB, Pahor M. Prognostic value of usual gait speed in well-functioning older people--results from the Health, Aging and Body Composition Study. J Am Geriatr Soc 2005;53(10):1675-80.
14. Shumway-Cook A, Patla AE, Stewart A, Ferrucci L, Ciol MA, Guralnik JM. Environmental demands associated with community mobility in older adults with and without mobility disabilities. Phys Ther 2002;82(7):670-81.
15. Langlois JA, Keyl PM, Guralnik JM, Foley DJ, Marottoli RA, Wallace RB. Characteristics of older pedestrians who have difficulty crossing the street. Am J Public Health 1997;87(3):393-7.
16. Peel NM, Kuys SS, Klein K. Gait speed as a measure in geriatric assessment in clinical settings: a systematic review. J Gerontol A Biol Sci Med Sci 2012;68(1):39-46.

148
17. Ferrucci L, Bandinelli S, Benvenuti E, Di Iorio A, Macchi C, Harris TB, Guralnik JM. Subsystems contributing to the decline in ability to walk: bridging the gap between epidemiology and geriatric practice in the InCHIANTI study. J Am Geriatr Soc 2000;48(12):1618-25.
18. Brinkley TE, Leng X, Miller ME, Kitzman DW, Pahor M, Berry MJ, Marsh AP, Kritchevsky SB, Nicklas BJ. Chronic inflammation is associated with low physical function in older adults across multiple comorbidities. J Gerontol A Biol Sci Med Sci 2009;64(4):455-61.
19. Cohen HJ, Pieper CF, Harris T, Rao KM, Currie MS. The association of plasma IL-6 levels with functional disability in community-dwelling elderly. J Gerontol A Biol Sci Med Sci 1997;52(4):M201-8.
20. Ferrucci L, Harris TB, Guralnik JM, Tracy RP, Corti MC, Cohen HJ, Penninx B, Pahor M, Wallace R, Havlik RJ. Serum IL-6 level and the development of disability in older persons. J Am Geriatr Soc 1999;47(6):639-46.
21. Cesari M, Penninx BW, Pahor M, Lauretani F, Corsi AM, Rhys Williams G, Guralnik JM, Ferrucci L. Inflammatory markers and physical performance in older persons: the InCHIANTI study. J Gerontol A Biol Sci Med Sci 2004;59(3):242-8.
22. Taaffe DR, Harris TB, Ferrucci L, Rowe J, Seeman TE. Cross-sectional and prospective relationships of interleukin-6 and C-reactive protein with physical performance in elderly persons: MacArthur studies of successful aging. J Gerontol A Biol Sci Med Sci 2000;55(12):M709-15.
23. Ferrucci L, Penninx BW, Volpato S, Harris TB, Bandeen-Roche K, Balfour J, Leveille SG, Fried LP, Md JM. Change in muscle strength explains accelerated decline of physical function in older women with high interleukin-6 serum levels. J Am Geriatr Soc 2002;50(12):1947-54.
24. Schaap LA, Pluijm SM, Deeg DJ, Harris TB, Kritchevsky SB, Newman AB, Colbert LH, Pahor M, Rubin SM, Tylavsky FA, Visser M. Higher inflammatory marker levels in older persons: associations with 5-year change in muscle mass and muscle strength. J Gerontol A Biol Sci Med Sci 2009;64(11):1183-9.
25. Burton LA, Sumukadas D. Optimal management of sarcopenia. Clin Interv Aging 2010;5:217-28. 26. Corsonello A, Garasto S, Abbatecola AM, Rose G, Passarino G, Mazzei B, Pranno L, Guffanti
EE, Bustacchini S, Lattanzio F. Targeting inflammation to slow or delay functional decline: where are we? Biogerontology 2010;11(5):603-14.
27. Penninx BW, Kritchevsky SB, Newman AB, Nicklas BJ, Simonsick EM, Rubin S, Nevitt M, Visser M, Harris T, Pahor M. Inflammatory markers and incident mobility limitation in the elderly. J Am Geriatr Soc 2004;52(7):1105-13.
28. Walston J, McBurnie MA, Newman A, Tracy RP, Kop WJ, Hirsch CH, Gottdiener J, Fried LP. Frailty and activation of the inflammation and coagulation systems with and without clinical comorbidities: results from the Cardiovascular Health Study. Arch Intern Med 2002;162(20):2333-41.
29. Tiainen K, Hurme M, Hervonen A, Luukkaala T, Jylha M. Inflammatory markers and physical performance among nonagenarians. J Gerontol A Biol Sci Med Sci 2010;65(6):658-63.
30. Visser M, Pahor M, Taaffe DR, Goodpaster BH, Simonsick EM, Newman AB, Nevitt M, Harris TB. Relationship of interleukin-6 and tumor necrosis factor-alpha with muscle mass and muscle strength in elderly men and women: the Health ABC Study. J Gerontol A Biol Sci Med Sci 2002;57(5):M326-32.
31. Schaap LA, Pluijm SM, Deeg DJ, Visser M. Inflammatory markers and loss of muscle mass (sarcopenia) and strength. Am J Med 2006;119(6):526 e9-17.
32. Goekoop RJ, Kloppenburg M, Kroon HM, Frolich M, Huizinga TW, Westendorp RG, Gussekloo J. Low innate production of interleukin-1beta and interleukin-6 is associated with the absence of osteoarthritis in old age. Osteoarthritis Cartilage 2010;18(7):942-7.

149
33. Verghese J, Holtzer R, Oh-Park M, Derby CA, Lipton RB, Wang C. Inflammatory markers and gait speed decline in older adults. J Gerontol A Biol Sci Med Sci 2011;66(10):1083-9.
34. Jenny NS, French B, Arnold AM, Strotmeyer ES, Cushman M, Chaves PH, Ding J, Fried LP, Kritchevsky SB, Rifkin DE, Sarnak MJ, Newman AB. Long-term assessment of inflammation and healthy aging in late life: the Cardiovascular Health Study All Stars. J Gerontol A Biol Sci Med Sci 2012;67(9):970-6.
35. Walston J, Hadley EC, Ferrucci L, Guralnik JM, Newman AB, Studenski SA, Ershler WB, Harris T, Fried LP. Research agenda for frailty in older adults: toward a better understanding of physiology and etiology: summary from the American Geriatrics Society/National Institute on Aging Research Conference on Frailty in Older Adults. J Am Geriatr Soc 2006;54(6):991-1001.
36. Kolyada AY, Fedtsov A, Madias NE. 3-hydroxy-3-methylglutaryl coenzyme A reductase inhibitors upregulate inducible NO synthase expression and activity in vascular smooth muscle cells. Hypertension 2001;38(5):1024-9.
37. Hess DC, Fagan SC. Pharmacology and clinical experience with simvastatin. Expert Opin Pharmacother 2001;2(1):153-63.
38. Corti MC, Guralnik JM, Sartori L, Baggio G, Manzato E, Pezzotti P, Barbato G, Zambon S, Ferrucci L, Minervini S, Musacchio E, Crepaldi G. The effect of cardiovascular and osteoarticular diseases on disability in older Italian men and women: rationale, design, and sample characteristics of the Progetto Veneto Anziani (PRO.V.A.) study. J Am Geriatr Soc 2002;50(9):1535-40.
39. Corvol JC, Bouzamondo A, Sirol M, Hulot JS, Sanchez P, Lechat P. Differential effects of lipid-lowering therapies on stroke prevention: a meta-analysis of randomized trials. Arch Intern Med 2003;163(6):669-76.
40. Etminan M, Gill S, Samii A. The role of lipid-lowering drugs in cognitive function: a meta-analysis of observational studies. Pharmacotherapy 2003;23(6):726-30.
41. Yaffe K, Barrett-Connor E, Lin F, Grady D. Serum lipoprotein levels, statin use, and cognitive function in older women. Arch Neurol 2002;59(3):378-84.
42. Rockwood K, Kirkland S, Hogan DB, MacKnight C, Merry H, Verreault R, Wolfson C, McDowell I. Use of lipid-lowering agents, indication bias, and the risk of dementia in community-dwelling elderly people. Arch Neurol 2002;59(2):223-7.
43. Tousoulis D, Antoniades C, Bosinakou E, Kotsopoulou M, Pitsavos C, Vlachopoulos C, Panagiotakos D, Stefanadis C. Effects of atorvastatin on reactive hyperemia and inflammatory process in patients with congestive heart failure. Atherosclerosis 2005;178(2):359-63.
44. Blake GJ, Ridker PM. Are statins anti-inflammatory? Curr Control Trials Cardiovasc Med 2000;1(3):161-165.
45. Ridker PM, Rifai N, Clearfield M, Downs JR, Weis SE, Miles JS, Gotto AM, Jr. Measurement of C-reactive protein for the targeting of statin therapy in the primary prevention of acute coronary events. N Engl J Med 2001;344(26):1959-65.
46. Ridker PM, Rifai N, Pfeffer MA, Sacks F, Braunwald E. Long-term effects of pravastatin on plasma concentration of C-reactive protein. The Cholesterol and Recurrent Events (CARE) Investigators. Circulation 1999;100(3):230-5.
47. MRC/BHF Heart Protection Study of cholesterol lowering with simvastatin in 20,536 high-risk individuals: a randomised placebo-controlled trial. Lancet 2002;360(9326):7-22.
48. Agostini JV, Tinetti ME, Han L, McAvay G, Foody JM, Concato J. Effects of statin use on muscle strength, cognition, and depressive symptoms in older adults. J Am Geriatr Soc 2007;55(3):420-5.
49. Chatzizisis YS, Koskinas KC, Misirli G, Vaklavas C, Hatzitolios A, Giannoglou GD. Risk factors and drug interactions predisposing to statin-induced myopathy: implications for risk assessment, prevention and treatment. Drug Saf 2010;33(3):171-87.

150
50. LaCroix AZ, Gray SL, Aragaki A, Cochrane BB, Newman AB, Kooperberg CL, Black H, Curb JD, Greenland P, Woods NF. Statin use and incident frailty in women aged 65 years or older: prospective findings from the Women's Health Initiative Observational Study. J Gerontol A Biol Sci Med Sci 2008;63(4):369-75.
51. Phillips PS, Haas RH, Bannykh S, Hathaway S, Gray NL, Kimura BJ, Vladutiu GD, England JD. Statin-associated myopathy with normal creatine kinase levels. Ann Intern Med 2002;137(7):581-5.
52. Scott D, Blizzard L, Fell J, Jones G. Statin therapy, muscle function and falls risk in community-dwelling older adults. QJM 2009;102(9):625-33.
53. Silva MA, Swanson AC, Gandhi PJ, Tataronis GR. Statin-related adverse events: a meta-analysis. Clin Ther 2006;28(1):26-35.
54. Golomb BA, Evans MA. Statin adverse effects : a review of the literature and evidence for a mitochondrial mechanism. Am J Cardiovasc Drugs 2008;8(6):373-418.
55. Nichols GA, Koro CE. Does statin therapy initiation increase the risk for myopathy? An observational study of 32,225 diabetic and nondiabetic patients. Clin Ther 2007;29(8):1761-70.
56. Bruckert E, Hayem G, Dejager S, Yau C, Begaud B. Mild to moderate muscular symptoms with high-dosage statin therapy in hyperlipidemic patients--the PRIMO study. Cardiovasc Drugs Ther 2005;19(6):403-14.
57. Evans M, Rees A. Effects of HMG-CoA reductase inhibitors on skeletal muscle: are all statins the same? Drug Saf 2002;25(9):649-63.
58. Sonoda Y, Gotow T, Kuriyama M, Nakahara K, Arimura K, Osame M. Electrical myotonia of rabbit skeletal muscles by HMG-CoA reductase inhibitors. Muscle Nerve 1994;17(8):891-7.
59. Gadbut AP, Caruso AP, Galper JB. Differential sensitivity of C2-C12 striated muscle cells to lovastatin and pravastatin. J Mol Cell Cardiol 1995;27(10):2397-402.
60. Hochgraf E, Levy Y, Aviram M, Brook JG, Cogan U. Lovastatin decreases plasma and platelet cholesterol levels and normalizes elevated platelet fluidity and aggregation in hypercholesterolemic patients. Metabolism 1994;43(1):11-7.
61. Lijnen P, Celis H, Fagard R, Staessen J, Amery A. Influence of cholesterol lowering on plasma membrane lipids and cationic transport systems. J Hypertens 1994;12(1):59-64.
62. Gebhard RL, Ewing SL, Schlasner LA, Hunninghake DB, Prigge WF. Effect of 3-hydroxy-3-methylglutaryl coenzyme A reductase inhibition on human gut mucosa. Lipids 1991;26(7):492-4.
63. DiMauro S, Bonilla E, Davidson M, Hirano M, Schon EA. Mitochondria in neuromuscular disorders. Biochim Biophys Acta 1998;1366(1-2):199-210.
64. Laaksonen R, Jokelainen K, Sahi T, Tikkanen MJ, Himberg JJ. Decreases in serum ubiquinone concentrations do not result in reduced levels in muscle tissue during short-term simvastatin treatment in humans. Clin Pharmacol Ther 1995;57(1):62-6.
65. Verghese J, Wang C, Lipton RB, Holtzer R, Xue X. Quantitative gait dysfunction and risk of cognitive decline and dementia. J Neurol Neurosurg Psychiatry 2007;78(9):929-35.
66. Guralnik JM, Ferrucci L, Pieper CF, Leveille SG, Markides KS, Ostir GV, Studenski S, Berkman LF, Wallace RB. Lower extremity function and subsequent disability: consistency across studies, predictive models, and value of gait speed alone compared with the short physical performance battery. J Gerontol A Biol Sci Med Sci 2000;55(4):M221-31.
67. Vermeulen J, Neyens JC, van Rossum E, Spreeuwenberg MD, de Witte LP. Predicting ADL disability in community-dwelling elderly people using physical frailty indicators: a systematic review. BMC Geriatr 2011;11:33.
68. Cooper R, Kuh D, Hardy R. Objectively measured physical capability levels and mortality: systematic review and meta-analysis. BMJ 2010;341:c4467.
151
69. Shumway-Cook A, Guralnik JM, Phillips CL, Coppin AK, Ciol MA, Bandinelli S, Ferrucci L. Age-associated declines in complex walking task performance: the Walking InCHIANTI toolkit. J Am Geriatr Soc 2007;55(1):58-65.
70. Spite M, Serhan CN. Novel lipid mediators promote resolution of acute inflammation: impact of aspirin and statins. Circ Res 2010;107(10):1170-84.
71. Albert MA, Danielson E, Rifai N, Ridker PM, for the PRINCE Investigators. Effect of Statin Therapy on C-Reactive Protein Levels: The Pravastatin Inflammation/CRP Evaluation (PRINCE): A Randomized Trial and Cohort Study. JAMA 2001;286(1):64-70.
72. Arnaud C, Burger F, Steffens S, Veillard NR, Nguyen TH, Trono D, Mach F. Statins reduce interleukin-6-induced C-reactive protein in human hepatocytes: new evidence for direct antiinflammatory effects of statins. Arterioscler Thromb Vasc Biol 2005;25(6):1231-6.
73. Ridker PM, Danielson E, Fonseca FA, Genest J, Gotto AM, Jr., Kastelein JJ, Koenig W, Libby P, Lorenzatti AJ, MacFadyen JG, Nordestgaard BG, Shepherd J, Willerson JT, Glynn RJ. Rosuvastatin to prevent vascular events in men and women with elevated C-reactive protein. N Engl J Med 2008;359(21):2195-207.
74. Joshi PH, Jacobson TA. Therapeutic options to further lower C-reactive protein for patients on statin treatment. Curr Atheroscler Rep 2010;12(1):34-42.
75. Albert MA, Staggers J, Chew P, Ridker PM. The pravastatin inflammation CRP evaluation (PRINCE): rationale and design. Am Heart J 2001;141(6):893-8.
76. Bonnet J, McPherson R, Tedgui A, Simoneau D, Nozza A, Martineau P, Davignon J. Comparative effects of 10-mg versus 80-mg Atorvastatin on high-sensitivity C-reactive protein in patients with stable coronary artery disease: results of the CAP (Comparative Atorvastatin Pleiotropic effects) study. Clin Ther 2008;30(12):2298-313.
77. Giri J, McDermott MM, Greenland P, Guralnik JM, Criqui MH, Liu K, Ferrucci L, Green D, Schneider JR, Tian L. Statin use and functional decline in patients with and without peripheral arterial disease. J Am Coll Cardiol 2006;47(5):998-1004.
78. McDermott MM, Guralnik JM, Greenland P, Pearce WH, Criqui MH, Liu K, Taylor L, Chan C, Sharma L, Schneider JR, Ridker PM, Green D, Quann M. Statin use and leg functioning in patients with and without lower-extremity peripheral arterial disease. Circulation 2003;107(5):757-61.
79. Mondillo S, Ballo P, Barbati R, Guerrini F, Ammaturo T, Agricola E, Pastore M, Borrello F, Belcastro M, Picchi A, Nami R. Effects of simvastatin on walking performance and symptoms of intermittent claudication in hypercholesterolemic patients with peripheral vascular disease. The American Journal of Medicine 2003;114(5):359-364.
80. Mohler ER, III, Hiatt WR, Creager MA, for the Study Investigators. Cholesterol Reduction With Atorvastatin Improves Walking Distance in Patients With Peripheral Arterial Disease. Circulation 2003;108(12):1481-1486.
81. Mondillo S, Ballo P, Barbati R, Guerrini F, Ammaturo T, Agricola E, Pastore M, Borrello F, Belcastro M, Picchi A, Nami R. Effects of simvastatin on walking performance and symptoms of intermittent claudication in hypercholesterolemic patients with peripheral vascular disease. Am J Med 2003;114(5):359-64.
82. Gray SL, Boudreau RM, Newman AB, Studenski SA, Shorr RI, Bauer DC, Simonsick EM, Hanlon JT. Angiotensin-converting enzyme inhibitor and statin use and incident mobility limitation in community-dwelling older adults: the Health, Aging and Body Composition study. J Am Geriatr Soc 2011;59(12):2226-32.
83. Gray SL, Aragaki AK, LaMonte MJ, Cochrane BB, Kooperberg C, Robinson JG, Woods NF, LaCroix AZ. Statins, angiotensin-converting enzyme inhibitors, and physical performance in older women. J Am Geriatr Soc 2012;60(12):2206-14.

152
84. Simonsick EM, Newman AB, Nevitt MC, Kritchevsky SB, Ferrucci L, Guralnik JM, Harris T. Measuring higher level physical function in well-functioning older adults: expanding familiar approaches in the Health ABC study. J Gerontol A Biol Sci Med Sci 2001;56(10):M644-9.
85. Newman AB, Haggerty CL, Kritchevsky SB, Nevitt MC, Simonsick EM. Walking performance and cardiovascular response: associations with age and morbidity--the Health, Aging and Body Composition Study. J Gerontol A Biol Sci Med Sci 2003;58(8):715-20.
86. Newman AB, Simonsick EM, Naydeck BL, Boudreau RM, Kritchevsky SB, Nevitt MC, Pahor M, Satterfield S, Brach JS, Studenski SA, Harris TB. Association of long-distance corridor walk performance with mortality, cardiovascular disease, mobility limitation, and disability. JAMA 2006;295(17):2018-26.
87. de Rekeneire N, Rooks RN, Simonsick EM, Shorr RI, Kuller LH, Schwartz AV, Harris TB. Racial differences in glycemic control in a well-functioning older diabetic population: findings from the Health, Aging and Body Composition Study. Diabetes Care 2003;26(7):1986-92.
88. Pahor M, Chrischilles EA, Guralnik JM, Brown SL, Wallace RB, Carbonin P. Drug data coding and analysis in epidemiologic studies. Eur J Epidemiol 1994;10(4):405-11.
89. Psaty BM, Lee M, Savage PJ, Rutan GH, German PS, Lyles M. Assessing the use of medications in the elderly: methods and initial experience in the Cardiovascular Health Study. The Cardiovascular Health Study Collaborative Research Group. J Clin Epidemiol 1992;45(6):683-92.
90. Simonsick EM, Montgomery PS, Newman AB, Bauer DC, Harris T. Measuring fitness in healthy older adults: the Health ABC Long Distance Corridor Walk. J Am Geriatr Soc 2001;49(11):1544-8.
91. White DK, Neogi T, Nevitt MC, Peloquin CE, Zhu Y, Boudreau RM, Cauley JA, Ferrucci L, Harris TB, Satterfield SM, Simonsick EM, Strotmeyer ES, Zhang Y. Trajectories of gait speed predict mortality in well-functioning older adults: the Health, Aging and Body Composition study. J Gerontol A Biol Sci Med Sci 2013;68(4):456-64.
92. Hanlon JT, Boudreau RM, Roumani YF, Newman AB, Ruby CM, Wright RM, Hilmer SN, Shorr RI, Bauer DC, Simonsick EM, Studenski SA. Number and dosage of central nervous system medications on recurrent falls in community elders: the Health, Aging and Body Composition study. J Gerontol A Biol Sci Med Sci 2009;64(4):492-8.
93. Biasucci LM, Biasillo G, Stefanelli A. Inflammatory markers, cholesterol and statins: pathophysiological role and clinical importance. Clin Chem Lab Med 2010;48(12):1685-91.
94. Jones P, Kafonek S, Laurora I, Hunninghake D. Comparative dose efficacy study of atorvastatin versus simvastatin, pravastatin, lovastatin, and fluvastatin in patients with hypercholesterolemia (the CURVES study). Am J Cardiol 1998;81(5):582-7.
95. Jones PH, Davidson MH, Stein EA, Bays HE, McKenney JM, Miller E, Cain VA, Blasetto JW. Comparison of the efficacy and safety of rosuvastatin versus atorvastatin, simvastatin, and pravastatin across doses (STELLAR* Trial). Am J Cardiol 2003;92(2):152-60.
96. Hamelin BA, Turgeon J. Hydrophilicity/lipophilicity: relevance for the pharmacology and clinical effects of HMG-CoA reductase inhibitors. Trends Pharmacol Sci 1998;19(1):26-37.
97. Cesari M, Kritchevsky SB, Newman AB, Simonsick EM, Harris TB, Penninx BW, Brach JS, Tylavsky FA, Satterfield S, Bauer DC, Rubin SM, Visser M, Pahor M. Added value of physical performance measures in predicting adverse health-related events: results from the Health, Aging And Body Composition Study. J Am Geriatr Soc 2009;57(2):251-9.
98. Perera S, Mody SH, Woodman RC, Studenski SA. Meaningful change and responsiveness in common physical performance measures in older adults. J Am Geriatr Soc 2006;54(5):743-9.
99. Setoguchi S, Glynn RJ, Avorn J, Levin R, Winkelmayer WC. Ten-year trends of cardiovascular drug use after myocardial infarction among community-dwelling persons > or =65 years of age. Am J Cardiol 2007;100(7):1061-7.

153
100. Lemaitre RN, Furberg CD, Newman AB, Hulley SB, Gordon DJ, Gottdiener JS, McDonald RH, Jr., Psaty BM. Time trends in the use of cholesterol-lowering agents in older adults: the Cardiovascular Health Study. Arch Intern Med 1998;158(16):1761-8.
101. Jackevicius CA, Tu JV, Ross JS, Ko DT, Carreon D, Krumholz HM. Use of fibrates in the United States and Canada. JAMA 2011;305(12):1217-24.
102. Mann D, Reynolds K, Smith D, Muntner P. Trends in statin use and low-density lipoprotein cholesterol levels among US adults: impact of the 2001 National Cholesterol Education Program guidelines. Ann Pharmacother 2008;42(9):1208-15.
103. Fried LF, Boudreau R, Lee JS, Chertow G, Kurella-Tamura M, Shlipak MG, Ding J, Sellmeyer D, Tylavsky FA, Simsonick E, Kritchevsky SB, Harris TB, Newman AB. Kidney function as a predictor of loss of lean mass in older adults: health, aging and body composition study. J Am Geriatr Soc 2007;55(10):1578-84.
104. K/DOQI clinical practice guidelines for chronic kidney disease: evaluation, classification, and stratification. Am J Kidney Dis 2002;39(2 Suppl 1):S1-266.
105. National Heart, Lung, and Blood Institute (NHLBI) Clinical Guidelines on Identification, Evaluation and Treatment of Overweight and Obesity in Adults 1998. http://www.nhlbi.nih.gov/guidelines/obesity/ob_home.htm Accessed 06/10, 2013.
106. Teng EL, Chui HC. The Modified Mini-Mental State (3MS) examination. J Clin Psychiatry 1987;48(8):314-8.
107. Radloff LS. The CES-D Scale: A Self-Report Depression Scale for Research in the General Population. Appl Psych Measur. 1977;1(3):385-401.
108. Boudreau RM, Hanlon JT, Roumani YF, Studenski SA, Ruby CM, Wright RM, Hilmer SN, Shorr RI, Bauer DC, Simonsick EM, Newman AB. Central nervous system medication use and incident mobility limitation in community elders: the Health, Aging, and Body Composition study. Pharmacoepidemiol Drug Saf 2009;18(10):916-22.
109. Leipzig RM, Cumming RG, Tinetti ME. Drugs and falls in older people: a systematic review and meta-analysis: II. Cardiac and analgesic drugs. J Am Geriatr Soc 1999;47(1):40-50.
110. Peron EP, Gray SL, Hanlon JT. Medication use and functional status decline in older adults: a narrative review. Am J Geriatr Pharmacother 2011;9(6):378-91.
111. Goldfine AB, Fonseca V, Shoelson SE. Therapeutic approaches to target inflammation in type 2 diabetes. Clin Chem 2011;57(2):162-7.
112. Roberts CG, Guallar E, Rodriguez A. Efficacy and safety of statin monotherapy in older adults: a meta-analysis. J Gerontol A Biol Sci Med Sci 2007;62(8):879-87.
113. Drugs for acne, rosacea and psoriasis. Treat Guidel Med Lett 2008;6(75):75-82. 114. Ford ES, Ajani UA, Croft JB, Critchley JA, Labarthe DR, Kottke TE, Giles WH, Capewell S.
Explaining the decrease in U.S. deaths from coronary disease, 1980-2000. N Engl J Med 2007;356(23):2388-98.
115. Drugs for lipids. Treat Guidel Med Lett 2011;9(103):13-20. 116. Baigent C, Blackwell L, Emberson J, Holland LE, Reith C, Bhala N, Peto R, Barnes EH, Keech
A, Simes J, Collins R. Efficacy and safety of more intensive lowering of LDL cholesterol: a meta-analysis of data from 170,000 participants in 26 randomised trials. Lancet 2010;376(9753):1670-81.
117. Schneeweiss S, Wang PS, Avorn J, Glynn RJ. Improved comorbidity adjustment for predicting mortality in Medicare populations. Health Serv Res 2003;38(4):1103-20.
118. Diggle PJ, Heagerty P, Liang K-Y, Zeger SL, eds. Analysis of Longitudinal Data 2nd ed. New York: Oxford University Press Inc., 2002.
119. Littell RC, Milliken GA, Stroup WW, Wolfinger RD, Schabenberger O. SAS System for Mixed Models. Cary, NC: SAS Institute 2006.

154
120. Verbeke G, Molenberghs G. Conditional Linear Mixed Models. Linear Mixed Models for Longitudinal Data. 2 ed. New York: Springer, 2009;189-200.
121. Mohler ER, 3rd, Hiatt WR, Creager MA. Cholesterol reduction with atorvastatin improves walking distance in patients with peripheral arterial disease. Circulation 2003;108(12):1481-6.
122. Pasternak RC, Smith SC, Jr., Bairey-Merz CN, Grundy SM, Cleeman JI, Lenfant C. ACC/AHA/NHLBI Clinical Advisory on the Use and Safety of Statins. Circulation 2002;106(8):1024-8.
123. Thompson PD, Clarkson PM, Rosenson RS. An assessment of statin safety by muscle experts. Am J Cardiol 2006;97(8A):69C-76C.
124. Shepherd J, Blauw GJ, Murphy MB, Bollen EL, Buckley BM, Cobbe SM, Ford I, Gaw A, Hyland M, Jukema JW, Kamper AM, Macfarlane PW, Meinders AE, Norrie J, Packard CJ, Perry IJ, Stott DJ, Sweeney BJ, Twomey C, Westendorp RG. Pravastatin in elderly individuals at risk of vascular disease (PROSPER): a randomised controlled trial. Lancet 2002;360(9346):1623-30.
125. Sathasivam S. Statin induced myotoxicity. Eur J Intern Med 2012;23(4):317-24. 126. Rallidis LS, Fountoulaki K, Anastasiou-Nana M. Managing the underestimated risk of statin-
associated myopathy. Int J Cardiol 2012;159(3):169-76. 127. Psaty BM, Koepsell TD, Lin D, Weiss NS, Siscovick DS, Rosendaal FR, Pahor M, Furberg CD.
Assessment and control for confounding by indication in observational studies. J Am Geriatr Soc 1999;47(6):749-54.

155
4.8 TABLES
Table 10. Baseline Characteristics of the Health ABC Cohort and According to Statin Usea
All cohort
(N= 2405)
Statin Users
(N= 390)
Statin Non-Users
(N= 2015)
Sociodemographics
Age, mean (SD) ǂ 74.6 (2.8) 74.3 (2.7)* 74.7 (2.9)
Female sex 1235 (51.4) 195 (50.0) 1040 (51.6)
Black race 894 (37.2) 114 (29.2)*** 780 (38.7)
Pittsburgh site 1257 (52.3) 239 (61.3)**** 1018 (50.5)
Education
Postsecondary 1084 (45.2) 192 (49.4) 892 (44.4)
High school 793 (33.1) 129 (33.1) 664 (33.0)
Less than high school
graduate
522 (21.8) 68 (17.5) 454 (22.6)
Living alone 697 (29.0) 105 (26.9) 592 (29.4)
Prescription drug coverage 1521 (63.3) 282 (72.3)*** 1239 (61.6)

156
Table 10 (Continued)
All cohort
(N= 2405)
Statin Users
(N= 390)
Statin Non-Users
(N= 2015)
Health-related behaviors
Smoking status
Current 206 (8.6) 22 (5.6)*** 184 (9.2)
Past 1119 (46.6) 219 (56.2) 900 (44.7)
Never 1077 (44.8) 149 (38.2) 928 (46.1)
Alcohol use
Current 1226 (51.2) 223 (57.2)* 1003 (50.0)
Past 507 (21.2) 79 (20.3) 428 (21.3)
Never 663 (27.7) 88 (22.5) 575 (28.7)
Having high or moderate-
intensity exercise in the
past 7 days
690 (28.7) 141 (36.2)*** 549 (27.3)
Health Status Factors
Hypertensionǂ 1104 (45.9) 220 (56.4)**** 884 (43.9)
Diabetes mellitusǂ 363 (15.1) 75 (19.2)* 288 (14.3)
Coronary artery diseaseǂ 450 (18.7) 165 (42.3)**** 285 (14.1)
Congestive heart failureǂ 103 (4.3) 28 (7.2)** 75 (3.7)
Strokeǂ 133 (5.5) 33 (8.5)** 100 (5.0)
Peripheral artery diseaseǂ 151 (6.3) 48 (12.3)**** 103 (5.1)

157
Table 10 (Continued)
All cohort
(N= 2405)
Statin Users
(N= 390)
Statin Non-Users
(N= 2015)
Health Status Factors
Chronic kidney disease 484 (20.3) 108 (27.8)**** 376 (18.8)
Pulmonary disease 99 (4.1) 10 (2.6) 89 (4.4)
Osteoarthritis 1345 (55.9) 219 (56.2) 1126 (55.9)
Parkinson disease 15 (0.6) 0 (0) 15 (0.7)
Excellent/good self-rated
health
2057 (85.5) 327 (83.9) 1730 (85.9)
Body mass index
Under/Normal 798 (33.2) 110 (28.2)* 688 (34.1)
Overweight 1030 (42.8) 187 (48.0) 843 (41.8)
Obese 577 (24.0) 93 (23.8) 484 (24.0)
Severe depression
symptoms (CES-D >15)
102 (4.3) 16 (4.1) 86 (4.3)
Cognitive impairment
(3MS < 80)
187 (7.8) 22 (5.6) 165 (8.2)

158
Table 10 (Continued)
All cohort
(N= 2405)
Statin Users
(N= 390)
Statin Non-Users
(N= 2015)
Leg muscle strength:
Average maximum torque
(Nm), Mean (SD)
104.6 (37.3)
106.1 (38.5)
104.4 (37.1)
Body composition: Total
body lean mass (Kg), Mean
(SD)
48.8 (10.3)
48.6 (9.7)
48.8 (10.4)
Anticholinergic useǂ 345 (14.4) 52 (13.3) 293 (14.5)
Benzodiazepinesǂ 146 (6.1) 33 (8.5)* 113 (5.6)
ACEIǂ 402 (16.7) 90 (23.1)*** 312 (15.5)
NSAID usebǂ 513 (21.3) 71 (18.2) 442 (21.9)
Other drugs with anti-
inflammatory effect use cǂ
96 (4.0) 17 (4.4) 79 (3.9)
Number of prescription
drugs, mean (SD)dǂ
2.7 (2.4) 3.4 (2.5)**** 2.6 (2.3)
Abbreviations: ACEI: angiotensin converting enzyme inhibitors; CES-D: Center for Epidemiologic Studies-Depression scale; CNS: central nervous system; 3MS: Mini-Mental Status examination; NSAID: non-steroidal anti-inflammatory drugs; SD: standard deviation a Data represented as N (%), unless otherwise stated; Numbers of missing information: education (n=6), prescription drug coverage (n=4), smoking (n=4), alcohol drinking (n= 11), history of congestive heart failure (n=36), kidney disease (n=19), pulmonary disease (n=8), severe depression (n=19), and cognitive impairment (n=2). b Including non-aspirin NSAIDs aspirin use ≥ 1200 mg/day, and prescription salicylates medications.
c Other drugs with anti-inflammtory effect include systemic glucocorticoids, immunosuppressive agents, Alefacept , Anakinra, Antithymocyte globulin, Olsalazine, Efalizumab, Etanercept, Hydroxycholoroquine, Infliximab, Muromonab-CD3 (OKT3), Montelukast, Natalizumab, Omalizumab, Rituximab, Sulfasalazine, Thalidomide, Zafirlukast, Zileuton d numbers of total prescription drugs – numbers of prescription statin, anticholinergic, benzodiazepines ACEI, NSAID, and other drugs with anti-inflammatory effect *: P <0.05, **: P < 0.01, ***: P<0.001, ****: P<0.0001 from chi-square or t-test between statin users and non-users. ǂ: time-varying variables

159
Table 11. Prevalence of Statin Use Over Timea
1998-1999
(Year 2)
(N= 2405), N%
1999-2000
(Year 3)
(N= 2206), N%
2001-2002 (Year
5)
(N= 1968), N%
Statin Use: Any users 390 (16.2) 444 (20.1) 504 (25.6)
High-dose (>1 SDD) 59 (2.5) 76 (3.5) 137 (7.0)
Moderate-dose (1 SDD) 143 (6.0) 195 (8.8) 235 (11.9)
Low-dose (< 1 SDD) 188 (7.8) 173 (7.8) 132 (7.0)
Long-term (≥ 2 years) 278 (11.6) 321 (14.6) 338 (17.2)
Short-term (< 2 years) 112 (4.7) 123 (5.6) 166 (8.4)
Lipophilic statin useb 334 (13.9) 398 (18.0) 461 (23.4)
Hydrophilic statin useb 56 (2.3) 46 (2.1) 43 (2.2)
Abbreviations: SDD: standardized daily dose; a Detail medication information were only collected from Years 1, 2, 3, 5 and 6. b: Lipophilic statins include atorvastatin, lovastatin, fluvastatin and simvastatin, and hydrophilic statins include pravastatin and rosuvastatin

160
Table 12. Gait Speed and Change in Gait Speed According to Statin Use Over time
Variables 1998-1999
(Year 2)a
(N=2405)
1999-2000
(Year 3)
(N=2405)
2000-2001
(Year 4)
(N=2206)
2002-2003
(Year 6)
(N=1968)
Gait speed in m/s (mean [SD]) 1.14 (0.23) 1.15 (0.22) 1.15 (0.22) 1.10 (0.22)
Statin users 1.17 (0.22)* 1.19 (0.20)**** 1.17 (0.22) 1.11 (0.20)
Statin non-users 1.14 (0.23) 1.14 (0.22) 1.15 (0.22) 1.10 (0.22)
Gait speed decline ≥ 0.05 m/s per
year, N (%)
Overall -- 807 (33.6) 805 (36.5) 754 (38.3)
Statin users -- 112 (28.7)* 166 (37.4) 185 (36.7)
Statin non-users -- 695 (34.5) 639 (36.3) 569 (38.9)
Gait speed decline ≥ 0.1 m/s per
year, N (%)
Overall -- 534 (22.2) 501 (22.7) 470 (23.9)
Statin users -- 70 (18.0)* 114 (25.7) 119 (23.6)
Statin non-users -- 464 (23.3) 387 (22.0) 351 (24.0)
a: Year 1 (1997-1998) did not measure a 20-m gait speed; Year 4 (2000-2001) did not collect medication data. P values (statin users versus nonusers): * P <0.05, **: P < 0.01, ***: P<0.001, ****: P<0.0001
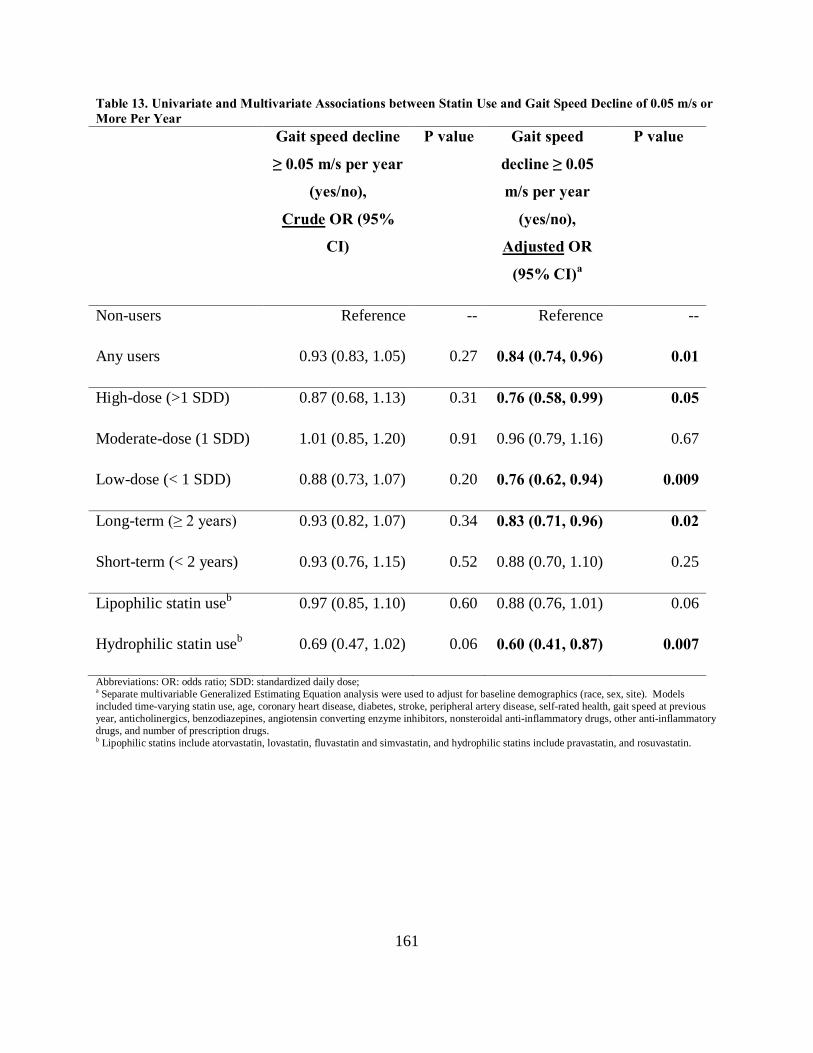
161
Table 13. Univariate and Multivariate Associations between Statin Use and Gait Speed Decline of 0.05 m/s or More Per Year Gait speed decline
≥ 0.05 m/s per year
(yes/no),
Crude OR (95%
CI)
P value Gait speed
decline ≥ 0.05
m/s per year
(yes/no),
Adjusted OR
(95% CI)a
P value
Non-users Reference -- Reference --
Any users 0.93 (0.83, 1.05) 0.27 0.84 (0.74, 0.96) 0.01
High-dose (>1 SDD) 0.87 (0.68, 1.13) 0.31 0.76 (0.58, 0.99) 0.05
Moderate-dose (1 SDD) 1.01 (0.85, 1.20) 0.91 0.96 (0.79, 1.16) 0.67
Low-dose (< 1 SDD) 0.88 (0.73, 1.07) 0.20 0.76 (0.62, 0.94) 0.009
Long-term (≥ 2 years) 0.93 (0.82, 1.07) 0.34 0.83 (0.71, 0.96) 0.02
Short-term (< 2 years) 0.93 (0.76, 1.15) 0.52 0.88 (0.70, 1.10) 0.25
Lipophilic statin useb 0.97 (0.85, 1.10) 0.60 0.88 (0.76, 1.01) 0.06
Hydrophilic statin useb 0.69 (0.47, 1.02) 0.06 0.60 (0.41, 0.87) 0.007
Abbreviations: OR: odds ratio; SDD: standardized daily dose; a Separate multivariable Generalized Estimating Equation analysis were used to adjust for baseline demographics (race, sex, site). Models included time-varying statin use, age, coronary heart disease, diabetes, stroke, peripheral artery disease, self-rated health, gait speed at previous year, anticholinergics, benzodiazepines, angiotensin converting enzyme inhibitors, nonsteroidal anti-inflammatory drugs, other anti-inflammatory drugs, and number of prescription drugs. b Lipophilic statins include atorvastatin, lovastatin, fluvastatin and simvastatin, and hydrophilic statins include pravastatin, and rosuvastatin.

162
Table 14. Univariate and Multivariate Associations between Statin Use and Gait Speed Decline of 0.1 m/s or More Per Year Gait speed
decline ≥ 0.1 m/s
per year (yes/no),
Crude OR (95%
CI)
P value Gait speed decline
≥ 0.1 m/s per year
(yes/no),
Adjusted OR
(95% CI)a
P value
Non-users Reference -- Reference --
Any users 0.99 (0.86, 1.14) 0.87 0.89 (0.76, 1.05) 0.17
High-dose (>1 SDD) 1.00 (0.75, 1.34) 0.98 0.89 (0.66, 1.20) 0.45
Moderate-dose (1 SDD) 1.06 (0.86, 1.30) 0.59 1.01 (0.81, 1.26) 0.91
Low-dose (< 1 SDD) 0.91 (0.73, 1.13) 0.40 0.78 (0.61, 0.99) 0.04
Long-term (≥ 2 years) 0.96 (0.82, 1.13) 0.65 0.85 (0.71, 1.01) 0.07
Short-term (< 2 years) 1.06 (0.84, 1.35) 0.61 1.02 (0.79, 1.31) 0.89
Lipophilic statin useb 1.01 (0.87, 1.17) 0.88 0.92 (0.78, 1.08) 0.31
Hydrophilic statin useb 0.83 (0.54, 1.27) 0.39 0.72 (0.47, 1.12) 0.15
Abbreviations: OR: odds ratio; SDD: standardized daily dose; a Separate multivariable Generalized Estimating Equation analysis were used to adjust for baseline demographics (race, sex, site). Models included time-varying statin use, age, coronary heart disease, diabetes, stroke, peripheral artery disease, self-rated health, gait speed at previous year, anticholinergics, benzodiazepines, angiotensin converting enzyme inhibitors, nonsteroidal anti-inflammatory drugs, other anti-inflammatory drugs, and number of prescription drugs. b Lipophilic statins include atorvastatin, lovastatin, fluvastatin and simvastatin, and hydrophilic statins include pravastatin, and rosuvastatin.

163
5.0 MANUSCRIPT 3: ASPIRIN, NON-ASPIRIN NONSTEROIDAL ANTI-
INFLAMMATORY DRUGS, OR ACETAMINOPHEN AND RISK OF OVARIAN
CANCER
Published Manuscript (Epidemiology 2012; 23: 311-319)
Wei-Hsuan Lo-Ciganic, 1 Janice C. Zgibor,1 Clareann H Bunker,1 Kirsten B. Moysich,2 Robert
P. Edwards,3 Roberta B. Ness4
1Department of Epidemiology, University of Pittsburgh, Pittsburgh, PA,
2Department of Cancer Prevention and Control, Division of Cancer Prevention and Population
Science, and Department of Cancer Pathology and Prevention, Roswell Park Cancer Institute,
Buffalo, NY
3 Department of Obstetrics, Gynecology & Reproductive Sciences, Magee-Womens Hospital of
UPMC, University of Pittsburgh, Pittsburgh, PA
4School of Public Health, The University of Texas Health Science Center at Houston, Houston,
TX

164
5.1 ABSTRACT
Background: Aspirin, non-aspirin nonsteroidal anti-inflammatory drugs (NA-NSAIDs) and
acetaminophen all have biological effects that might reduce the risk of ovarian cancer. However,
epidemiologic data on this question are mixed.
Methods: A population-based, case-control study in western Pennsylvania, eastern Ohio, and
western New York State included 902 women with incident epithelial ovarian cancer who were
diagnosed between February 2003 to November 2008 and 1,802 matched controls. Regular use
(at least 2 tablets per week for 6 months or more) of aspirin, NA-NSAIDs, and acetaminophen
before the reference date (9 months before interview date) was assessed by in-person interview.
We used logistic regression to calculate adjusted odds ratios (ORs) and 95% confidence intervals
(CIs).
Results: The OR for aspirin use was 0.81 (95% CI= 0.63–1.03). Decreased risks were found
among women who used aspirin continuously (0.71 [0.54–0.94]) or at a low-standardized daily
dose (0.72 [0.53–0.97]), who used aspirin for the prevention of cardiovascular disease (0.72
[0.57–0.97]), who used aspirin more recently, or who used selective COX-2 inhibitors (0.60
[0.39–0.94]). No associations were observed among women using non-selective NA-NSAIDs or
acetaminophen.
Conclusions: Risk reductions of ovarian cancer were observed with use of aspirin or selective
COX-2 inhibitors. However, the results should be interpreted with caution due to the inherent
study limitations and biases.

165
5.2 INTRODUCTION
Ovarian cancer is the second leading gynecologic cancer, following cancer of the uterine corpus,
and causes more deaths per year than any other cancer of the female reproductive system.1 It
afflicts about 1 in 70 women, and is the fifth leading cause of cancer death among women in the
United States.1,2 Approximately 21,550 new cases of ovarian cancer are diagnosed annually,
resulting in 14,600 deaths.1,2 Thus, strategies that focus on prevention may provide the most
rational approach for meaningful reductions in incidence and deaths attributable to ovarian
cancer.
Ovarian cancer has a poorly understood etiology and natural history. Two dominant
hypotheses explain the genesis of the disease.3 The ovulation hypothesis relates ovarian cancer
risk to incessant ovulation, while the pituitary gonadotropin hypothesis implicates elevations in
gonadotropin/estrogen levels. Epidemiologic and biologic observations do not entirely support
either hypothesis. Previous work has suggested that ovarian cancer may be related to chronic
pelvic inflammation that acts in concert with ovulation.4 This theory could be an important
consideration for prevention of ovarian cancer and is supported by the mechanism of action of
non-steroidal anti-inflammatory drugs (NSAIDs). NSAIDs, including aspirin and non-aspirin
NSAIDs (NA-NSAIDs), act through non-competitive and irreversible inhibition of
cycloxygenase-1 (COX-1) and cyclooxygenase-2 (COX-2) enzymes in the synthesis of
prostaglandins to produce anti-inflammatory and anti-neoplastic effects.5 In addition, NSAIDs
may suppress ovulation and affect cell proliferation, angiogenesis, and apoptosis of the
epithelium in ovarian cancer cell lines.6 Acetaminophen, another commonly used analgesic and
antipyretic drug, has weak anti-inflammatory activity and may have an anti-gonadotropic effect.7

166
Acetaminophen may also inhibit ovarian carcinogenesis through the depletion of glutathione
leading to necrosis.8 Therefore, aspirin, NA-NSAIDs, or acetaminophen may be potential agents
for the chemoprevention of ovarian cancer. NSAIDs and acetaminophen are two of the most
frequently used classes of medication in the United States.9,10 NSAIDs generated about $14
billion in sales world-wide in 2008.11 Because of the widespread use of aspirin, NA-NSAIDs
and acetaminophen, any association with an increased or decreased cancer risk may have
important public health implications.
Several studies have described associations between aspirin or NA-NSAIDs use and the
risk of ovarian cancer, but the findings are contradictory and inconclusive. Previous studies were
relatively small and lacked information or statistical power to assess the effects of dose, duration,
drug classes, or indications. The purpose of this study was to describe the associations of
aspirin, NA-NSAIDs, or acetaminophen use with ovarian cancer risk, using the data from
Hormones and Ovarian Cancer Prediction (HOPE) study, the second-largest population-based
case-control study on ovarian cancer.

167
5.3 METHODS
5.3.1 The HOPE study
Study population and recruitment details have been published previously.12 Briefly, this is a
case-control study involving 902 women with incident ovarian cancer (cases) from a contiguous
region comprising western Pennsylvania, eastern Ohio, and western New York State. Cases
were residents of this region with histologically confirmed, primary, epithelial ovarian, fallopian
tube, or peritoneal cancer diagnosed between February 2003 and November 2008. Both
borderline/low-malignant potential and invasive tumors were included. For brevity, the term
“ovarian cancer” is used here to describe all cases. Women were referred from comprehensive
hospital tumor registries, clinical practices, or pathology databases and contacted with the
permission of their gynecologists. Age-adjusted incidence rates for 2003-2007 for the catchment
counties in our study were similar to the rates based on the Surveillance and Epidemiology End
Results (SEER) data (overall incidence rate in SEER was 14 vs. HOPE, 13 cases per 100,000).
The ascertained cases were representative of the population from this region and considered as
population-based. Eligible women had to be at least 25 years of age and recruited within 9
months of initial diagnosis. We excluded a total of 1,608 women (ineligible on the basis of age
and time since diagnosis, residence outside of the counties in which referral hospitals were
located, prior diagnosis of ovarian cancer, being non-English-speaking, or dead). Of 1,270
eligible cases, 902 completed the interview.

168
Controls were identified through random-digit-dialed phone numbers. Controls consisted
of women at least age 25 who lived in the same telephone exchanges as cases. These women
were further screened to ensure that they had no previous oophorectomy or diagnosis of ovarian
cancer. Controls were frequency matched to cases by 5-year age groups and telephone exchange
in approximately a 2:1 ratio. Overall, 1,802 eligible controls completed interviews (Figure).
A standardized 2-hour interview (see eAppendix [http://links.lww.com] for
questionnaire) was conducted by trained interviewers in the homes of participating women. The
questionnaire included a reproductive and gynecologic history, a contraceptive history, a medical
history, a family history, and information on lifestyle practices. A life-events calendar, which
marked milestones such as marriages and births, was used to aid recall of reproductive history,
infertility treatment, hormone use, and use of aspirin, over-the-counter (OTC) and prescription
pain relievers until the reference date. The reference date was calculated as 9 months before the
interview (for both cases and controls) to ensure that exposures occurred before the ovarian
cancer diagnosis in cases and within a similar time frame for cases and controls. The study
protocol was approved by the University of Pittsburgh Institutional Review Board and by the
human subject committees at each hospital where cases were identified. All study subjects gave
informed consent.
5.3.2 Assessment of aspirin, NA-NSAIDs and acetaminophen use
Since most analgesic use is sporadic, regular use was defined as at least 2 tablets/week for 6
months or more. This definition created an exposure group that was homogeneous in its
consistency of usage, and thus maximized the likelihood of detecting an association with ovarian

169
cancer. Women who used less than this minimal level were defined as non-users. Participants
were first asked if they took any aspirin, OTC pain relievers or NA-NSAIDs, or prescription
medications for pain or inflammation on a regular basis before the reference date. Women who
responded affirmatively were then asked the drug name, dose and frequency (numbers of pills
taken per day, week, or month), the age at which they started, and duration (months or years) of
use. For each episode, the primary reason for using the drug was recorded. The conditions were
grouped as arthritis/burstitis/rheumatism, gout, menstrual cramps, injury, surgical/dental pain,
back pain, headache, muscle ache, heart disease prevention (only listed for aspirin), others, or
unknown. Aspirin products were defined as any product containing generic aspirin. NA-
NSAIDs included celecoxib, diclofenac, etodolac, fenoprofen, flurbiprofen, ibuprofen,
indomethacin, ketoprofen, ketorolac, meclofenamate, mefenamic acid, nabumatone,
naproxen/naproxen sodium, rofecoxib, sulindac, valdecoxib, or other NA-NSAIDs.
Acetaminophen products were defined as any product containing acetaminophen.
5.3.3 Statistical Methods
Student’s t test was used for continuous variables, and the Chi-square test for categorical
variables to compare differences between cases and controls. Unconditional logistic regression
was used to calculate multivariable-adjusted odds ratios (ORs) as estimates of the relative risk
and related 95% confidence intervals (95% CIs) for analgesics use. Potential confounders fell
into 2 groups: those variables that (1) a priori were thought to be related to the exposure and also
were risk factors for ovarian cancer and (2) those variables that previously published studies
considered confounders. Confounders included the following: age (at reference year); interview
170
year; region of residence (western Pennsylvania, eastern Ohio, and western New York);
education; race; religion; parity; breastfeeding; history of infertility; contraceptive use and
duration; menstrual status (age at menarche, menopausal status and age at menopause); use of
postmenopausal hormone and duration; indications for aspirin, NA-NSAIDs, or acetaminophen
use; prior hysterectomy or tubal ligation; history of endometriosis; history of pelvic
inflammatory disease; family history of breast cancer or ovarian cancer in first-degree relative;
body mass index; cigarette smoking; alcohol consumption; comorbidities; and yearly household
income.
Data were analyzed initially by constructing frequency counts of cases and controls by
exposure variables and calculating ORs adjusted for age, region of residence, and interview year
(Table 1). Second, confounders were forced into the models but were kept in the final regression
model only if they changed the parameter estimates by at least 15%. The final multivariate
model included age, region of residence, interview year, race, education, breastfeeding, numbers
of full-term births, duration of oral contraceptive use, body mass index, postmenopausal
hormone use, prior tubal ligation, arthritis, and diabetes (Tables 2-4). For the primary analyses
of NSAIDs, women who had never used aspirin or NA-NSAIDs on a regular basis were the
referent group. Risk was assessed separately among the subgroups of women who had used
aspirin only, NA-NSAIDs only, and any NSAIDs (aspirin plus NA-NSAIDs). For the
acetaminophen analyses, nonusers were considered as never having used acetaminophen
regularly (but did not exclude aspirin or NA-NSAIDs use) before the reference date.
Duration of use was defined by three indicators as follows: (1) continuous (had used for
at least 1 year and until or beyond the reference date); (2) current (used only less than a year and
used on the reference date); and (3) past (discontinued use at least 1 year before the reference

171
date). To examine dose-response effects, the average daily dose was calculated by multiplying
the number of dosage forms per day with the strength of the medication taken during the most
recent period before the reference date. For aspirin, the average daily dose was converted to a
standardized daily dose by dividing it by 325 mg, assuming it was used as antithrombotic therapy
for cardiovascular disease based on the dosage suggested by American College of Chest
Physicians Evidence-Based Clinical Practice Guidelines.13 For NA-NSAIDs and
acetaminophen, the average daily dose was then converted to a standardized daily dose by
dividing it into minimal effective analgesic doses per day.14 The minimal effective analgesic
doses per day for individual agents were as follows: acetaminophen (1500 mg), celecoxib (200
mg), diclofenac (100 mg), etodolac (400 mg), fenoprofen (800 mg), flurbiprofen (150 mg),
ibuprofen (1200 mg), indomethacin (75 mg), ketorolac (40 mg), ketoprofen (75 mg),
mecolfenamate (150 mg), meloxicam (7.5 mg), nabumetone (1000 mg), naproxen (500 mg),
piroxicam (20 mg), rofecoxib (25 mg), tolmetin (600 mg), sulindac (300 mg), and valdecoxib (10
mg).15-17 Dosages were categorized into three clinically relevant categories: low-dose (≤ 0.5
standardized daily dose), moderate-dose (0.5-1 standardized dose) and high-dose (> 1
standardized dose).14 Morever, the subgroup analyses were conducted by recency of use (e.g.,
age at first/last time use), self-reported indication and two types of NA-NSAIDs (i.e., non-
selective NA-NSAIDs and selective COX-2 inhibitors). For the analysis on indications for
analgesics, women who used different analgesics or the same analgesics but for different
indications were considered separately. Analyses were also conducted separately among women
with borderline and invasive epithelial ovarian tumors, and various histologic subgroups (i.e.,
serous, mucinous, endometrioid, clear cell, mixed cell and other epithelial cells); age less than 55
and 55 or more years; with and without arthritis; and with and without diabetes. All analyses

172
were carried out using STATA, version 11.0, statistical package (StataCorp LP, College Station,
Texas, USA).
5.4 RESULTS
Population characteristics are described in Table 15. Ninety-seven percent of the women were
white; 61% of cases and 57% of controls were older than age 55. Cases were more likely to be
older, black, and nulliparous, and to have a body mass index of 30 kg/m2 or more. Controls were
more likely to be educated beyond high school, to have breastfed, have used oral contraceptives
or postmenopausal hormones, have a history of tubal ligation, and have cormobidities including
arthritis and diabetes. Overall, 489 cases and 1,015 controls reported having used aspirin, NA-
NSAIDs, or acetaminophen on a regular basis.
Table 16 describes the regular use of aspirin or NA-NSAIDs and risks of ovarian cancer.
The adjusted OR for regular use (versus never-use) of aspirin was 0.81 (95% CI= 0.63–1.03).
ORs were reduced among continuous users (0.71 [0.54–0.94]), women who had used aspirin at
low-standardized daily dose (0.72 [0.53–0.97]), women who began using aspirin only after age
45 (0.66 [0.50–0.88]), and women who stopped using after age 55 (0.70 [0.53–0.93]). Of those
in the low-standardized daily dose group, the OR for using aspirin at daily doses of ≤81 mg was
0.66 (0.48–0.90). There were no associations between NA-NSAIDs or acetaminophen and
ovarian cancer (Table 19).
In Table 17, the adjusted OR for regular use of aspirin for prevention of cardiovascular
disease was 0.72 (0.57–0.97). Seventy-one percent of women had used aspirin 81 mg daily for

173
this purpose. A decreased OR was more evident among women who used aspirin for
cardiovascular prevention for at least 5 years (0.66 [0.48–0.92]). Risk patterns remained
essentially unchanged when stratified by indications for NA-NSAIDs use (Table 20).
ORs were reduced among women who used selective COX-2 inhibitors (0.60 [0.39–0.94]), but
not in users of non-selective NA-NSAIDs (Table 18). The protective effects of selective COX-2
inhibitors were found only in women who used celecoxib (0.46 [0.25–0.84]), with no evidence of
association in women who used rofecoxib or valdecoxib.
Cases included 677 women with invasive epithelial ovarian tumors, 97 with borderline or
low-malignant potential epithelial ovarian tumors, 75 with peritoneal tumors, 32 with fallopian
tumors, and 21 with “other/missing” type. Among the various histologic types of ovarian cancer,
516 cases were diagnosed with serous, 66 with mucinous, 100 with endometrioid, 54 with clear
cell, 77 with mixed cells and 89 with other epithelial tumors. The results were similar for
borderline or low-malignant potential and invasive tumors, and across categories of histologic
types (Table 21). Stratification by age (less than 55 and 55 or more), arthritis status, and
diabetes status, did not reveal any important differences in the associations between aspirin, NA-
NSAIDs, or acetaminophen use and ovarian cancer.
5.5 DISCUSSION
Aspirin or selective COX-2 inhibitors were associated with reduced risk of ovarian cancer,
especially among middle aged and older women who took aspirin at low doses (or for prevention
of cardiovascular disease) continuously over a long period of time. The results do not support

174
the regular use of non-selective NA-NSAIDs and acetaminophen in the chemoprevention of
ovarian cancer. We were able to evaluate dose-effects comprehensively among NSAIDs by
using a standardized daily dose, and we had sufficient sample size to perform stratified analyses
by indications of analgesic use and types of NA-NSAIDs.
Our results provide an additional direction for future study on the relationship between
aspirin use and risk of ovarian cancer. Low-dose and continuous aspirin use had modest
protective association with about 20 to 30% risk reduction, but without a dose-response
relationship. A protective effect was not found in moderate to high-dose groups, which could
have been due to smaller sample sizes with insufficient power. Our results agree with a study
conducted by Hannibal et al.,18 in which there were similar findings with aspirin use. However,
findings were null in a randomized controlled trial19 and 521-25 of 8 cohort studies,20-27 and
inconsistent in 12 previous case-control studies.7,18,28-37 Ten7,20,22-24,28,30,31,34,35 studies found no
association with aspirin use regardless of the duration or frequency of use, 4 studies found
protective effects,25,32,33,36 and 2 studies found harmful effects on ovarian cancer.18,37 Our results
of null associations with NA-NSAIDs use support findings in 57,23,24,26,,30 of 9 previous
studies.7,20,23, 24,26,,27,30,32,37 Two studies7,31 showed protective results of acetaminophen, not found
in our study or 10 others.18,20,21,23,24,25,29,32,33,37 These inconsistent findings may reflect inhibition
of the progression, rather than the induction, of ovarian cancer; differences in the definition of
regular analgesics use; incomplete or lack of information of dose, frequency, indication, and the
list of medications queried; and different exposure assessments. Most analgesic use is sporadic,
and recall of sporadic use may be less accurate. Furthermore, cumulative exposure could be
assessed only approximately, due to incomplete information on dose and duration. Some studies
evaluated dose in numbers of pills or tablets per week. However, different brands may not

175
contain standardized amounts of the active ingredient. The list of NA-NSAIDs queried is
heterogeneous and not comprehensive. This could lead to a misclassification of users and non-
users, which would bias the results towards the null and attenuate the protective effect. The
methodologic differences in assessing exposure remains an issue until validated operational
definitions can be developed.
Given that most analgesic use may be episodic, it is conceivable that low-dose and
continuous aspirin use for antithrombotic therapy may be more effective than sporadic use in
reducing the synthesis of prostaglandins, further inhibiting chronic inflammation, cell
proliferation, DNA synthesis, and suppressing immune response to neoplastic cells.38 The
biologic explanations for the protective association between aspirin or selective COX-2
inhibitors and ovarian cancer could be due to anti-carcinogenic effects via inhibition of COX-2
and COX-independent mechanisms. Aspirin and selective COX-2 inhibitors could also suppress
carcinogenesis through pathways independent of prostaglandins. Increased COX-2 expression
appears to be involved in the development of cancer by promoting cell division, inhibiting
apoptosis, altering cell adhesion and stimulating angiogenesis. Some tumors expressing COX-2
are reported to exhibit more aggressive phenotype and poor clinical prognosis.39 Recent
preclinical data demonstrated that prostaglandin E2 is strongly associated with surrounding
stroma in the tumor microenvironment in ovarian cancer and tumor progression.40 COX-2 is
expressed in epithelial ovarian cancer; the rate of expression ranges from 31% to 89%.39
Furthermore, aspirin and selective COX-2 inhibitors could act indirectly by inhibiting
ovulation.41 In our study, the protective effect of selective COX-2 inhibitors was only found in
using celecoxib. Rofecoxib is a more potent COX-2 inhibitor than celecoxib, although Gorsch et
al42 found that celecoxib had unique and stronger anti-carcinogenic activity.

176
Our study is the second largest case-control study in ovarian cancer research, with a
population-based design that contributes to generalizability of the results. The population had
relatively high use of OTC and prescription analgesics, and provided detailed information on
types, frequency, dose, duration and indications. The study collected data on a large number of
potential confounders, which allowed for robust multivariate analyses. Complete dosage
information allowed us to evaluate the risk by standardized daily doses and to conduct stratified
analysis of selective COX-2 inhibitors.
Our study has certain limitations and biases that may have contributed to the observed
results. First, we had no data on the characteristics of excluded and non-responding cases.
Based on additional sensitivity analyses, the protective results for aspirin at low-standardized
daily dose, continuously and recently, would be nullified if the responding controls had at least
twice the exposure of non-responding controls, or if non-responding cases had at least 1.7 times
the exposure of the responding cases. Although responders and non-responders might not have
the same analgesic exposure, it is unlikely that non-responders in either the case or control
groups would have double or half of the exposure of the responders. Therefore, we believe the
results are robust even with the non-responders. Second, cases may be more motivated to
remember their analgesic use than controls. However, any tendency for the cases to better recall
exposures would result in ORs greater than 1.0 rather than the protective effects observed here.
Alternatively, controls might exaggerate their exposure relative to cases, if controls believed
analgesics have a chemoprotective effect. This bias could over-estimate the protective effect.
To reduce the impact of recall bias, a defined reference date was used for assessing exposures.
The protective effects of recent aspirin use might be due to recall limitation since patients were
more likely to recall the medications used recently. Third, measurement and misclassification

177
errors are presumably present when relying on self-reported and single measurement of
analgesics use without verification.43 Regular use was defined to improve recall; however, this
means that sporadic analgesic use could not be assessed. Including sporadic use in the non-user
group, or evaluating aspirin/NA-NSAID use without excluding acetaminophen users, might
attenuate the association and bias results toward the null. The results from additional analyses
were similar when comparing non-regular users of any analgesics with 7 mutually exclusive
groups (aspirin only, NA-NSAID only, aspirin plus NA-NSAID, acetaminophen only, aspirin
plus acetaminophen, NA-NSAID plus acetaminophen, aspirin plus NA-NSAID plus
acetaminophen) (Table 22). However, duration and dose-response effects could not be
evaluated due to small sample sizes in the last 4 of these subgroups.
Fourth, we did not collect comprehensive information on medical co-morbidities related
to cardiovascular disease, health-conscious behaviors, or factors related to adverse histories of
aspirin use. Although the observed effect might be biased by the residual or unmeasured
confounding, little change was found when two health-related behavior factors (i.e., how often
having a routine gynecologic check-up or engaging in physical activities) were included in a
separate analysis (for aspirin use, OR= 0.79 [95% CI= 0.62–0.99]; for NA-NSAIDs, 1.04 [0.82–
1.32]). Fifth, while different NA-NSAIDs may have different effects on ovarian cancer, all were
grouped into a single category. This limits our ability to evaluate the effect of individual NA-
NSAIDs. Sixth, survival bias is possible. Since aspirin is used in the primary and secondary
prevention of coronary heart disease, especially among high-risk women, it is possible that
earlier mortality among aspirin users (e.g., from heart disease) precludes diagnosis of ovarian
cancer and therefore produces a false impression of beneficial effect. Finally, the majority of
women were white, limiting generalizability of the results to other ethnicities.

178
Our data suggest a lower risk of ovarian cancer among women who used aspirin at a low-
standardized daily dose continuously, or who used selective COX-2 inhibitors. These results
should be interpreted with caution due to inherent study limitations and biases. Future research
on these associations should better characterize accompanying medical conditions, health and
lifestyle behaviors, the dose, frequency, and duration of analgesic use, age of therapy initiation,
genetic susceptibility, and the overall risk-benefit balance.

179
5.6 LITERATURE CITED
1. Jemal A, Siegel R, Ward E, Hao Y, Xu J, Thun MJ. Cancer statistics, 2009. CA Cancer J Clin 2009;59(4):225-49.
2. American Cancer Society. Cancer Facts and Figures 2009. Atlanta: American Cancer Society. 2009.
3. Cramer DW, Welch WR. Determinants of ovarian cancer risk. II. Inferences regarding pathogenesis. J Natl Cancer Inst 1983;71(4):717-21.
4. Ness RB, Grisso JA, Cottreau C, Klapper J, Vergona R, Wheeler JE, Morgan M, Schlesselman JJ. Factors related to inflammation of the ovarian epithelium and risk of ovarian cancer. Epidemiology 2000;11(2):111-7.
5. Altinoz MA, Korkmaz R. NF-kappaB, macrophage migration inhibitory factor and cyclooxygenase-inhibitions as likely mechanisms behind the acetaminophen- and NSAID-prevention of the ovarian cancer. Neoplasma 2004;51(4):239-47.
6. Rodriguez-Burford C, Barnes MN, Oelschlager DK, Myers RB, Talley LI, Partridge EE, Grizzle WE. Effects of nonsteroidal anti-inflammatory agents (NSAIDs) on ovarian carcinoma cell lines: preclinical evaluation of NSAIDs as chemopreventive agents. Clin Cancer Res 2002;8(1):202-9.
7. Cramer DW, Harlow BL, Titus-Ernstoff L, Bohlke K, Welch WR, Greenberg ER. Over-the-counter analgesics and risk of ovarian cancer. Lancet 1998;351(9096):104-7.
8. Lawson JA, Fisher MA, Simmons CA, Farhood A, Jaeschke H. Inhibition of Fas receptor (CD95)-induced hepatic caspase activation and apoptosis by acetaminophen in mice. Toxicol Appl Pharmacol 1999;156(3):179-86.
9. Gabriel SE, Fehring RA. Trends in the utilization of non-steroidal anti-inflammatory drugs in the United States, 1986-1990. J Clin Epidemiol 1992;45(9):1041-4.
10. Banthin JS, Zodet M. Trends in the Use and Expenditures for COX-2 Inhibitors and Traditional Nonsteroidal Anti-inflammatory Drugs, 1997–2003. Statistical Brief #139. . Rockville, MD: Agency for Healthcare Research and Quality, 2006.
11. IMS Top Line Industry Data 2008, Ernst & Young 2008 Beyond Borders, Datamonitor. Vol. 2010 IMS Health.
12. Ness RB, Dodge RC, Edwards RP, Baker JA, Moysich KB. Contraception methods, beyond oral contraceptives and tubal ligation, and risk of ovarian cancer. Ann Epidemiol 2011;21(3):188-96.
13. Becker RC, Meade TW, Berger PB, Ezekowitz M, O'Connor CM, Vorchheimer DA, Guyatt GH, Mark DB, Harrington RA. The primary and secondary prevention of coronary artery disease: American College of Chest Physicians Evidence-Based Clinical Practice Guidelines (8th Edition). Chest 2008;133(6 Suppl):776S-814S.
14. Hanlon JT, Schmader KE, Landerman LR, Horner RD, Fillenbaum GG, Pieper CF, Wall WE, Jr., Koronkowski MJ, Cohen HJ. Relation of prescription nonsteroidal antiinflammatory drug use to cognitive function among community-dwelling elderly. Ann Epidemiol 1997;7(2):87-94.
15. Drugs for pain. Treat Guidel Med Lett 2010;8(92):25-34. 16. DRUGDEX® System [Internet database]. Greenwood Village, Colo:Thomson Reuters
(Healthcare) Inc..Updated periodically. 17. McEvoy GK, ed. AHFS Drug Information 2011. Bethesda, MD: American Society of Health-
System Pharmacists, Inc., 2011.

180
18. Hannibal CG, Rossing MA, Wicklund KG, Cushing-Haugen KL. Analgesic drug use and risk of epithelial ovarian cancer. Am J Epidemiol 2008;167(12):1430-7.
19. Cook NR, Lee IM, Gaziano JM, Gordon D, Ridker PM, Manson JE, Hennekens CH, Buring JE. Low-dose aspirin in the primary prevention of cancer: the Women's Health Study: a randomized controlled trial. JAMA 2005;294(1):47-55.
20. Fairfield KM, Hunter DJ, Fuchs CS, Colditz GA, Hankinson SE. Aspirin, other NSAIDs, and ovarian cancer risk (United States). Cancer Causes Control 2002;13(6):535-42.
21. Friis S, Nielsen GL, Mellemkjaer L, McLaughlin JK, Thulstrup AM, Blot WJ, Lipworth L, Vilstrup H, Olsen JH. Cancer risk in persons receiving prescriptions for paracetamol: a Danish cohort study. Int J Cancer 2002;97(1):96-101.
22. Friis S, Sorensen HT, McLaughlin JK, Johnsen SP, Blot WJ, Olsen JH. A population-based cohort study of the risk of colorectal and other cancers among users of low-dose aspirin. Br J Cancer 2003;88(5):684-8.
23. Lacey JV, Jr., Sherman ME, Hartge P, Schatzkin A, Schairer C. Medication use and risk of ovarian carcinoma: a prospective study. Int J Cancer 2004;108(2):281-6.
24. Pinheiro SP, Tworoger SS, Cramer DW, Rosner BA, Hankinson SE. Use of nonsteroidal antiinflammatory agents and incidence of ovarian cancer in 2 large prospective cohorts. Am J Epidemiol 2009;169(11):1378-87.
25. Rodriguez C, Henley SJ, Calle EE, Thun MJ. Paracetamol and risk of ovarian cancer mortality in a prospective study of women in the USA. Lancet 1998;352(9137):1354-5.
26. Prizment AE, Folsom AR, Anderson KE. Nonsteroidal anti-inflammatory drugs and risk for ovarian and endometrial cancers in the Iowa Women's Health Study. Cancer Epidemiol Biomarkers Prev 2010;19(2):435-42.
27. Sorensen HT, Friis S, Norgard B, Mellemkjaer L, Blot WJ, McLaughlin JK, Ekbom A, Baron JA. Risk of cancer in a large cohort of nonaspirin NSAID users: a population-based study. Br J Cancer 2003;88(11):1687-92.
28. Akhmedkhanov A, Toniolo P, Zeleniuch-Jacquotte A, Kato I, Koenig KL, Shore RE. Aspirin and epithelial ovarian cancer. Prev Med 2001;33(6):682-7.
29. Meier CR, Schmitz S, Jick H. Association between acetaminophen or nonsteroidal antiinflammatory drugs and risk of developing ovarian, breast, or colon cancer. Pharmacotherapy 2002;22(3):303-9.
30. Merritt MA, Green AC, Nagle CM, Webb PM. Talcum powder, chronic pelvic inflammation and NSAIDs in relation to risk of epithelial ovarian cancer. Int J Cancer 2008;122(1):170-6.
31. Moysich KB, Mettlin C, Piver MS, Natarajan N, Menezes RJ, Swede H. Regular use of analgesic drugs and ovarian cancer risk. Cancer Epidemiol Biomarkers Prev 2001;10(8):903-6.
32. Rosenberg L, Palmer JR, Rao RS, Coogan PF, Strom BL, Zauber AG, Stolley PD, Shapiro S. A case-control study of analgesic use and ovarian cancer. Cancer Epidemiol Biomarkers Prev 2000;9(9):933-7.
33. Schildkraut JM, Moorman PG, Halabi S, Calingaert B, Marks JR, Berchuck A. Analgesic drug use and risk of ovarian cancer. Epidemiology 2006;17(1):104-7.
34. Tavani A, Gallus S, La Vecchia C, Conti E, Montella M, Franceschi S. Aspirin and ovarian cancer: an Italian case-control study. Ann Oncol 2000;11(9):1171-3.
35. Tzonou A, Polychronopoulou A, Hsieh CC, Rebelakos A, Karakatsani A, Trichopoulos D. Hair dyes, analgesics, tranquilizers and perineal talc application as risk factors for ovarian cancer. Int J Cancer 1993;55(3):408-10.
36. Wernli KJ, Newcomb PA, Hampton JM, Trentham-Dietz A, Egan KM. Inverse association of NSAID use and ovarian cancer in relation to oral contraceptive use and parity. Br J Cancer 2008;98(11):1781-3.

181
37. Wu AH, Pearce CL, Tseng CC, Templeman C, Pike MC. Markers of inflammation and risk of ovarian cancer in Los Angeles County. Int J Cancer 2009;124(6):1409-15.
38. Kurman RJ, Visvanathan K, Roden R, Wu TC, Shih Ie M. Early detection and treatment of ovarian cancer: shifting from early stage to minimal volume of disease based on a new model of carcinogenesis. Am J Obstet Gynecol 2008;198(4):351-6.
39. Menczer J. Cox-2 expression in ovarian malignancies: a review of the clinical aspects. Eur J Obstet Gynecol Reprod Biol 2009;146(2):129-32.
40. Obermajer N, Muthuswamy R, Lesnock J, Edwards RP, Kalinski P. Positive feedback between PGE2 and COX2 redirects the differentiation of human dendritic cells toward stable myeloid-derived suppressor cells. Blood 2011;118(20):5498-505.
41. Smith G, Roberts R, Hall C, Nuki G. Reversible ovulatory failure associated with the development of luteinized unruptured follicles in women with inflammatory arthritis taking non-steroidal anti-inflammatory drugs. Br J Rheumatol 1996;35(5):458-62.
42. Grosch S, Maier TJ, Schiffmann S, Geisslinger G. Cyclooxygenase-2 (COX-2)-independent anticarcinogenic effects of selective COX-2 inhibitors. J Natl Cancer Inst 2006;98(11):736-47.
43. West SL, Savitz DA, Koch G, Strom BL, Guess HA, Hartzema A. Recall accuracy for prescription medications: self-report compared with database information. Am J Epidemiol 1995;142(10):1103-12.

182
5.7 TABLES
Table 15. Characteristics of Ovarian Cancer Cases and Controls in the HOPE Study
Case (n = 902) No. (%)a
Control (n = 1,802) No. (%)a
ORb (95% CI)
Age (years); mean (SD) 58.29 (12.8) 57.02 (12.4) - Race Whitec Black Other
856 (95) 35 (4) 11 (1)
1758 (97) 29 (2) 15 (1)
1.00 2.23 (1.35–3.68) 1.43 (0.65–3.14)
Education Not high school graduatec High school graduate Post-high school College graduate or post-college
83 (9) 303 (34) 251 (28) 265 (29)
82 (4) 535 (30) 553 (31) 632 (35)
1.00 0.56 (0.40–0.78) 0.45 (0.32–0.64) 0.43 (0.30–0.60)
Contraceptive used Never usec Any hormonal Non-hormonal
120 (13) 481 (53) 297 (33)
121 (7) 1168 (65) 508 (28)
1.00 0.41 (0.31–0.55) 0.58 (0.43–0.77)
Oral contraception used, years Never usec <1-4 <5-9 >9
367 (41) 321 (35) 142 (16) 71 (8)
531 (30) 667 (37) 331 (18) 273 (15)
1.00 0.69 (0.56–0.85) 0.61 (0.47–0.78) 0.37 (0.27–0.51)
No. of full-term birthse(%) Never pregnantc 0 1 2 ≥ 3
167 (19) 46 (5) 120 (13) 264 (29) 305 (34)
167 (9) 63 (4) 231 (13) 601 (33) 740 (41)
1.00 0.75 (0.49–1.17) 0.52 (0.38–0.71) 0.43 (0.33–0.56) 0.37 (0.29–0.48)
Ever breastfeeding Never pregnantc Ever pregnant but never breastfeeding Any breastfeeding
167 (18) 432 (48) 303 (34)
167 (9) 747 (42) 888 (49)
1.00 0.56 (0.44–0.72) 0.33 (0.26–0.43)
Postmenopausal hormone used Never usec Estrogen only Estrogen + Progesterone
603 (67) 155 (17) 118 (13)
1137 (63) 304 (17) 307 (17)
1.00 0.87 (0.69–1.09) 0.67 (0.53–0.85)

183
Table 15 (Continued)
Case (n = 902) No. (%)a
Control (n = 1,802) No. (%)a
ORb (95% CI)
History of tubal ligationd Noc Yes
666 (74) 201 (22)
1162 (65) 616 (34)
1.00 0.57 (0.47–0.68)
BMI (kg/m2)d < 25c 25-29 ≥ 30
300 (33) 267 (30) 334 (37)
670 (37) 528 (29) 603 (34)
1.00 1.12 (0.91–1.37) 1.25 (1.03–1.51)
Self-reported comorbiditiesf Arthritis Hypertension Diabetes
335 (37) 329 (37) 86 (10)
825 (46) 662 (37) 217 (12)
0.63 (0.51–0.73) 0.90 (0.76–1.09) 0.74 (0.57–0.96)
Family history of breast and ovarian cancers in first-degree relativesd,g No known family historyc Breast cancer only Ovarian cancer only Breast and ovarian cancer
715 (79) 147 (16) 32 (4) 6 (1)
1491 (83) 255 (14) 44 (2) 10 (1)
1.00 1.16 (0.93–1.45) 1.49 (0.93–2.37) 1.24 (0.45–3.46)
Annual household incomed < $20,000c $20,000 – $34,999 $35,000 – $69,999 ≥ $70,000 Refused
137 (15) 166 (19) 304 (34) 201 (23) 75 (9)
245 (14) 307 (17) 615 (35) 436 (25) 151 (9)
1.00 0.99 (0.74–1.31) 0.96 (0.74–1.24) 0.87 (0.66–1.16) 0.96 (0.68–1.37)
NSAIDsh regular usei Non-users c, j Aspirin only NA-NSAIDs only Aspirin plus NA-NSAIDs
456 (51) 169 (19) 167 (18) 110 (12)
850 (47) 360 (20) 336 (19) 256 (14)
1.00 0.79 (0.63–0.98) 0.91 (0.73–1.13) 0.74 (0.57–0.95)
Acetaminophen regular usei Non-users c, k Acetaminophen
738 (82) 164 (18)
1447 (80) 355 (20)
1.00 0.90 (0.73–1.11)
a Except for age b:Except for age, all the ORs were adjusted by age (continuous), region of residence, interview calendar year in the logistic regression. c Reference category. d Data were not summed to total due to the missing or unknown values. e Number of full-term births, including both live and stillbirths; full-term is >6 months; twins and other multiples count as 1. f Reference category is no arthritis, no hypertension, and no diabetes; respectively g first-degree relatives including natural father and mother and blood-related brothers, sisters, sons and daughters. h NSAID: includes aspirin or all other reported NA-NSAIDS. i Regular use defined as ≥ 2 tablets/week for ≥ 6 months. i Non-user: women who indicated that they didn’t use aspirin or NA-NSAID (but might or might not have used acetaminophen) ≥ 2 tablets/week for ≥ 6 months (“minimal level”). k Non-user: women who indicated that they didn’t used acetaminophen (but might or might not have used aspirin or NA-NSAID)≥ 2 tablets/ week for ≥ 6 months (“minimal level”).

184
Table 16. Regular Use of Aspirin or NA-NSAIDs and Risk of Ovarian Cancer in the HOPE study
Aspirin only NA-NSAID only Aspirin plus NA-NSAID
No. Cases
No. Controls
OR (95% CI)a
No. Cases
No. Controls
OR (95% CI)a
No. Cases
No. Controls
OR (95% CI)a
Nonusers b 456 850 1.00 456 850 1.00 456 850 1.00
Regular users c 169 360 0.81 (0.63–1.03) 167 336 1.06 (0.83–1.36) 110 256 0.95 (0.70–1.27)
Types of users d
Continuous 121 283 0.71 (0.54–0.94) 96 199 1.10 (0.78–1.55) 93 211 0.99 (0.72–1.36)
Current 6 17 0.50 (0.19–1.32) 11 31 0.93 (0.64–1.37) 4 12 0.76 (0.23–2.57)
Past 42 60 1.34 (0.86–2.10) 60 106 1.19 (0.77–1.84) 13 33 0.76 (0.37–1.55)
Standardized-daily dosee
Low 92 227 0.72 (0.53–0.97) 102 189 1.12 (0.83–1.51) 69 163 0.88 (0.62–1.24)
Moderate 46 81 0.84 (0.55–1.28) 42 97 0.96 (0.62–1.47) 26 57 1.21 (0.72–2.05)
High 31 52 1.08 (0.66–1.79) 23 50 1.01 (0.58–1.78) 15 36 0.90 (0.46–1.75)

185
Table 16 (Continued)
Aspirin only NA-NSAID only Aspirin plus NA-NSAID
No. Cases
No. Controls
OR (95% CI)a
No. Cases
No. Controls
OR (95% CI)a
No. Cases
No. Controls
OR (95% CI)a
Age at first use (years)
< 45 50 75 1.32 (0.73–1.61) 77 162 1.04 (0.74–1.46) 62 79 1.10 (0.77–1.59)
≥ 45 119 285 0.66 (0.50–0.88) 90 174 1.08 (0.78–1.49) 48 177 0.79 (0.53–1.17)
Age at last use (years)
< 55 48 90 1.08 (0.73–1.61) 91 200 1.04 (0.76–1.42) 40 79 1.12 (0.73–1.75)
≥ 55 121 270 0.70 (0.53–0.93) 76 136 1.10 (0.77–1.56) 70 177 0.85 (0.59–1.21)
a: The ORs were adjusted by age at reference year, interview year, region of residence, race, education, breastfeeding, numbers of full-term births , duration of oral contraception use (years), body mass index, postmenopausal hormone use, arthritis, diabetes, and prior tubal ligation. b: Non-user: Women who indicated that they did not use aspirin or NA-NSAIDs ≥ 2 tablets/week for ≥ 6 months (“minimal level”). Reference category. c: Regular user: women who indicated that they had used aspirin/NA-NSAIDs/aspirin plus NA-NSAIDs ≥ 2 tablets/week for ≥ 6 months d: Duration of use was defined by three indicators: (1) continuous (had used for at least 1 year and until or beyond the reference date); (2) current (used only less than a year and used on the reference date); (3) past users (discontinued use at least 1 year before the reference date). e: To examine dose-response effects, the average daily dose was converted to a standardized daily dose by dividing by 325 mg for aspirin and minimal effective analgesic doses per day for other agents. Dosages were categorized into three clinically relevant categories: low-dose (≤ 0.5 standardized daily dose), moderate-dose (0.5-1 standardized daily dose) and high-dose (> 1 standardized daily dose).

186
Table 17. Regular use of Aspirin by Self-Reported Indications and Risk of Ovarian Cancer in the HOPE study
No. Cases No. Controls OR (95% CI)a
Nonusers b 623 1186 1.00
Regular usersc by indicationsd
Prevention for CVD 159 392 0.72 (0.57–0.97)
Arthritis/bursitis, rheumatism 44 93 0.80 (0.53–1.21)
Headache 51 94 1.04 (0.71–1.52)
Other pain or injuries 50 75 1.27 (0.85–1.90) a: ORs and p-values were adjusted by age at reference year, interview year, region of residence, race, education, breastfeeding, numbers of full-term births, duration of oral contraception use (years), body mass index, postmenopausal hormone use, arthritis, diabetes, and prior tubal ligation. b: Non-user: women who indicated that they had not used aspirin ≥ 2 tablets/week for ≥ 6 months (“minimal level”). Reference category. c: Regular user: women who indicated that they had used aspirin ≥ 2 tablets/week for ≥ 6 months d: If patients used aspirin for different major indications before the reference date, each episode was counted separately
Table 18. Regular Use of Non-Selective or Selective NA-NSAID and Risk of Ovarian Cancer among NA-NSAID Only Users in the HOPE Study
No. Cases No. Controls OR (95% CI)a
Nonusers b 456 850 1.00
Non-selective NA-NSAIDs c users 139 261 1.00 (0.78–1.30)
Selective COX-2 NA-NSAIDsc users 28 75 0.60 (0.39–0.94) a: ORs and p-values were adjusted by age at reference year, interview year, region of residence, race, education, breastfeeding, numbers of full-term births, duration of oral contraception use (years), body mass index, postmenopausal hormone use, arthritis, diabetes, and prior tubal ligation. b: Non-user: women who indicated that they had not used aspirin or NA-NSAIDs ≥ 2 tablets/week for ≥ 6 months (“minimal level”). Reference category. c: selective COX-2 NA-NSAIDs users include rofecoxib, celecoxib and valdecoxib, and the rest of NA-NSAIDs were included in non-selective NA-NSAIDs based on the most recent record daily dose of acetaminophen, so we combined moderate- and high-standardized daily dose into one group (moderate-high)

187
Table 19. Regular use of Acetaminophen and risk of ovarian cancer in the HOPE study
No of Cases No. of Controls OR (95% CI)a
Nonuserb 738 1,447 1.00 Regular usersc 164 355 0.98 (0.79, 1.23) Types of usersd Continuous Current Past
98 9
57
212 24
119
0.98 (0.74, 1.30) 0.81 (0.36, 1.83) 1.02 (0.72, 1.45)
Standardized daily dosee Low Moderate-High
136 28
291 64
0.99 (0.77, 1.26) 0.98 (0.60, 1.60)
Age at first use (years) < 45 ≥ 45
86 78
175 180
1.02 (0.75, 1.37) 0.95 (0.70, 1.30)
Age at last use (years) < 55 ≥ 55
84 80
183 172
0.98 (0.72, 1.32) 0.99 (0.73, 1.35)
Time since first use (years) < 10 ≥ 10
82 81
167 188
1.05 (0.78, 1.43) 0.91 (0.68, 1.23)
Time since last use (years) < 4 ≥ 4
114 49
256 99
0.94 (0.72, 1.22) 1.08 (0.74, 1.56)
a: ORs and p-values are adjusted by age at reference year, interview year, study center, race, education, breastfeeding, numbers of full-term, duration of oral contraception use (years), body mass index, postmenopausal hormone use, arthritis, diabetes, and prior tubal ligation. b: Non-user: Women who indicated that they had not used acetaminophen (but may or may not use aspirin or NA-NSAIDs) ≥ 2 tablets/per week for at least 6 months (“minimal level”). Reference category. c: Regular user: women who indicated that they had used acetaminophen (but may or may not use aspirin or NA-NSAIDs) ≥ 2 tablets/per week for at least 6 months d: Duration of use was defined by three indicators: (1) continuous (had used for at least 1 year and until or beyond the reference date); (2) current (used only less than a year and used on the reference date); (3) past users (discontinued use at least 1 year before the reference date). e: Only 6 cases and 9 controls used high standardized daily dose of acetaminophen, so we combined moderate- and high-standardized daily dose into one group (moderate-high)

188
Table 20. Regular use of NA-NSAIDs only or Acetaminophen by self-reported indications and risk of ovarian cancer in the HOPE study
NA-NSAIDs only Acetaminophen
No. Cases No. Controls OR (95% CI)a No. Cases No. Controls OR (95% CI)a
Nonusers b 456 850 1.00 738 1447 1.00
Regular usersc by indicationsd
Arthritis/bursitis,
rheumatism
74 191 0.85 (0.59, 1.21) 62 161 0.88 (0.62, 1.25)
Headache 16 38 0.99 (0.51, 1.91) 50 100 1.05 (0.72, 1.53)
Other pain or injuries 85 127 1.33 (0.96, 1.85) 65 125 1.04 (0.73, 1.46) a: ORs and p-values were adjusted by age at reference year, interview year, region of residence, race, education, breastfeeding, numbers of full-term births, duration of oral contraception use (years), body mass index, postmenopausal hormone use, arthritis, diabetes, and prior tubal ligation. b: Non-user: for NA-NSAIDs only, women who indicated that they had not used aspirin or NA-NSAIDs ≥ 2 tablets/week for ≥ 6 months (“minimal level”); for acetaminophen, Women who indicated that they had not used acetaminophen (but may or may not use aspirin or NA-NSAIDs) ≥ 2 tablets/per week for at least 6 months. Reference category. c: Regular user: women who indicated that they had used aspirin ≥ 2 tablets/week for ≥ 6 months d: If patients used NA-NSAIDs (or acetaminophen) for different major indications before the reference date, each episode (indication) was counted separately

189
Table 21. Regular use of Aspirin, NA-NSAID, Acetaminophen and Risk of Ovarian Cancer by Tumor Behaviors and Histologic Types in the HOPE study
OR (95% CI)a among Regular usersb
Aspirin only NA-NSAID only Aspirin plus NA-NSAID
Nonusers c 1.00 1.00 1.00
Tumor Behaviors
Borderline or low-malignant potential 0.66 (0.43, 1.02) 1.04 (0.60, 1.60) 0.74 (0.44, 1.24)
Invasive 0.79 (0.62, 1.02) 1.06 (0.82, 1.39) 0.99 (0.73, 1.34)
Histologic Types
Serous 0.79 (0.59, 1.05) 0.95 (0.70, 1.30) 0.75 (0.52, 1.08)
Non-Serouse 0.83 (0.58, 1.19) 1.27 (0.90, 1.78) 1.30 (0.87, 1.93) a: The ORs were adjusted by age at reference year, interview year, region of residence, race, education, breastfeeding, numbers of full-term births , duration of oral contraception use (years), body mass index, postmenopausal hormone use, arthritis, diabetes, and prior tubal ligation. b: Regular user: women who indicated that they had used aspirin/NA-NSAIDs/aspirin plus NA-NSAIDs ≥ 2 tablets/week for ≥ 6 months
c: Non-user: Women who indicated that they did not use aspirin or NA-NSAIDs ≥ 2 tablets/week for ≥ 6 months (“minimal level”). Reference category e: Non-serous types include mucinous (n=66), endometrioid (n=100), clear cell (n=54), mixed cells (n=77), and other/unknown epithelial tumors (n=89). Except serous type, other histologic types had small sample sizes, resulting in imprecise estimates.

190
Table 22. Regular Use of Aspirin, NA-NSAID or Acetaminophen and Risks of Ovarian Cancer in the HOPE Study (Definition of non-users: without use any analgesics regularly)
No. of Cases No. of Controls OR (95% CI)a Nonuserb 411 784 1.00 Regular users 491 1018 0.97 (0.81, 1.16) Aspirin only 136 285 0.79 (0.61, 1.04) Types of users c Continuous 102 234 0.73 (0.54, 0.98)
Current 5 15 0.50 (1.18, 1.44) Past 29 36 1.43 (0.82, 2.51)
SDDd Low 77 197 0.68 (0.49,0.94) Moderate 41 61 0.97 (0.62, 1.53) High 18 27 1.07 (0.54, 2.10)
NA-NSAID only 119 232 1.13 (0.86, 1.49) Types of users c
Continuous 65 131 1.14 (0.80, 1.62) Current 8 22 0.85 (0.35, 2.06) Past 46 79 1.30 (0.85, 2.01)
SDDd Low 68 120 1.25 (0.88, 1.79) Moderate 24 58 0.96 (0.56, 1.65) High 27 54 1.19 (0.70, 2.02)
Aspirin + NA-NSAID 72 146 1.09 (0.76, 1.55) Types of users c
Continuous 61 125 1.07 (0.74, 1.57) Current 4 5 2.62 (0.63, 0.80) Past 7 16 0.82 (0.31, 2.16)
Standardized daily dosed Low 42 94 0.89 (0.58, 1.38) Moderate 17 34 1.39 (0.72, 2.67) High 13 18 1.70 (0.78, 3.70)
Acetaminophen onlye 45 66 1.26 (0.81, 1.95) Aspirin plus Acetaminophene
33 75 0.92 (0.58, 1.47)
Acetaminophen plus NA-NSAIDe
48 104 0.94 (0.62, 1.44)
Aspirin plus Acetaminophen plus NA-NSAID
38 110 0.83 (0.53, 1.30)
a: The ORs were adjusted by age at reference year, interview year, region of residence, race, education, breastfeeding, numbers of full-term births, duration of oral contraception use (years), body mass index, postmenopausal hormone use, arthritis, diabetes, and prior tubal ligation. b: Non-user: Women who indicated that they did not used any aspirin, NA-NSAIDs or acetaminophen ≥ 2 tablets/week for ≥ 6 months (“minimal level”). Reference category. c: Duration of use was defined by three indicators: (1) continuous (had used for at least 1 year and until or beyond the reference date); (2) current (used only less than a year and used on the reference date); (3) past users (discontinued use at least 1 year before the reference date). d: To examine dose-response effects, the average daily dose was converted to a standardized daily dose by dividing it minimal effective analgesic doses per day. Dosages were categorized into two clinically relevant categories: low-dose (≤ 0.5SDD), moderate-to-high dose (>0.5 SDD). e: Subgroup analyses of dose- and duration-effects were not shown due to relatively small sample size in cases.

191
6.0 DISCUSSION
6.1 SUMMARY OF STUDY FINDINGS AND CONTRIBUTIONS TO THE
LITERATURE
6.1.1 Changes in Cholesterol-Lowering Medication Use Over a Decade in Community-
Dwelling Older Adults
The first study of this dissertation found that the use of cholesterol-lowering medications in the
elderly nearly tripled during the period of 1997-2008 (14.9% to 42.6%). As expected, statins
were the most common drug class used in the cohort studied. It was interesting to find that only
half of those with known CHD and/or diabetes received any cholesterol lowering agent. In
addition, this study showed that the release of guideline and evidence-based data had no
immediate impact (i.e., change in level) on cholesterol-lowering medication use. Instead, there
was a decrease in the yearly rate of increase (i.e., decrease in slopes) of cholesterol-lowering
medication use.
To the best knowledge of the author, our study was the first one to formally assess the
impact that the guideline publications and evidence-based data had on use of cholesterol-
lowering medications in the elderly. The recommendation to use statins for older adults with
established CHD or at high risk for developing CHD were primarily based on the results from
subgroup analyses in clinical trials.189-193 Conclusively extrapolating the results from the

192
subgroup analyses to all older adults is controversial, since most of these trials had a defined
inclusion upper age limit of 70-75 years.190,191,193 There is limited information about the use of
cholesterol-lowering medications before and after 2002 in older adults aged ≥ 85 years.194 In
addition, these publications are somewhat inconsistent regarding the need for cholesterol-
lowering medications in the elderly (e.g., those with diabetes but without CHD).195-200 The
findings from this work are significant and help to fill the gap in the literature by examining the
utilization patterns of cholesterol-lowering medications in community-dwelling older adults aged
70 and older before and after the release of the NCEP ATP III guidelines195 and results from the
PROSPER in 2002.196
6.1.2 Associations between Statin Use and Gait-Speed Decline in Community-Dwelling
Older Adults
The second study of this dissertation showed that statin use, compared to non-users, had a
decreased risk decline in gait speed of 0.05 m/s or more per year in community-dwelling older
adults.201 In addition, low-dose statin use had a decreased risk of gait speed decline of 0.1 m/s or
more per year.201
Gait speed is a simple, but important indicator of functional status in older adults.202-204
Declines in gait speed consistently predict future physical disability, mortality, and major health-
related outcomes in older adults.4,6-10 Despite its importance, a paucity of literature has identified
risk or protective factors (except for physical exercise) for age-related gait speed decline, or the
magnitude of important gait decline in gait speed associated with these factors.205 The evidence
that exists shows the mixed results. The beneficial effects of statins in physical function decline
were mainly found in smaller studies in individuals that had PAD.85,206-209 In contrast, two large
193
longitudinal cohort studies did not find that statins lowered the risk of self-reported mobility
limitation in older women, or physical function decline in community-dwelling older
adults.210,211 These later findings may be related to muscle-related adverse events may occur
with statin use.212-218 The contribution of this study to literature is that this is the first study to
examine statin use and gait-speed decline over a 20-m walk in community-dwelling older adults.
Given the controversial findings previously described, the overall results of this dissertation
work provide additional information to a growing body of literature suggesting that low-dose
statin may be beneficial for slowing age-related decline in physical function in community-
dwelling adults. It is also encouraging that there is no evidence from this study that statin use is
associated with deteriorating gait speed decline. Having said this, the muscle-related adverse
events should not be a concern of the use of low-dose statins, especially in the older adults with
CHD, who received statins for secondary prevention.
6.1.3 Aspirin, non-aspirin nonsteroidal anti-inflammatory drugs, or acetaminophen and
risk of ovarian cancer
The third study of this dissertation found that aspirin or selective COX-2 inhibitors were
associated with reduced risk of ovarian cancer, especially among middle aged and older women
who took aspirin at low doses (or for prevention of cardiovascular disease) continuously over a
long period of time. The results do not support the regular use of non-selective NA-NSAIDs and
acetaminophen in the chemoprevention of ovarian cancer.
Several studies have examined associations between aspirin or NA-NSAIDs use and the
risk of ovarian cancer, but the findings have been contradictory and inconclusive. Previous
studies were relatively small and lacked information or statistical power to assess the effects of

194
dose, duration, drug classes, or indications. This is the first study able to evaluate the risk of
ovarian cancer and examine dose-response and duration-response relationships comprehensively.
This is also the first study with sufficient sample size to perform stratified analyses by indication
for analgesic use and by types of NA-NSAIDs.
6.2 PUBLIC HEALTH SIGNIFICANCE
In general, pharmacoepidemiologic studies have emerged as an important tool for comparative
effectiveness research of treatment effects, especially in populations with multiple chronic
conditions, or older adults aged ≥ 80 years, which were usually excluded from RCTs. In
addition, pharmacoepidemiologic studies are robust tools to screen for adverse drugs effects,
understand barriers to drug use and to improve health outcomes and quality. Data derived from
pharmacoepidemiologic studies inform clinical medicine, health promotion, health policy and
planning in public health.
Cardiovascular disease remains the leading cause of death and disability among the
elderly in the US. With regard to further reducing the burden of CHD morbidity and mortality,
the emphasis is on the treatment of acute events and secondary or primary prevention through
treatment and control of risk factors, such as control of dyslipidemia. However, most of the
clinical trials reviewed did not include older adults aged ≥ 80 years or those with multiple
comorbidities. Therefore, it is important and relevant to public health to better understand the
utilization patterns of cholesterol-lowering medication use and the impact of guidelines and
evidence-based data on their use in older adults. The public health significance of the first study
is that the results suggest that more efforts are needed to overcome barriers to disseminate and

195
implement of clinical guidelines of cholesterol-lowering medication use in clinical practice.
Different dissemination methods may be needed for clinicians to quickly accept evidence-based
data.
The public health challenge of age-related disability and loss in physical function will
continue to grow in our rapidly aging population.219 Loss in physical function seriously
threatens the independence and quality of life for older adults and has a significant impact on
family and society as well.220 Maintaining function and preventing or reducing disability are
areas of interests to clinicians, policymakers, and older adults themselves.221,222 Gait speed is a
simple, but important indicator of functional status in older adults.202-204 Declines in gait speed
consistently predict future physical disability, mortality, and major health-related outcomes in
older adults.193,195-199 Despite its importance, a paucity of literature has identified risk or
protective factors other than physical exercise for age-related gait speed decline, or the
magnitude of important gait decline in gait speed associated with these factors.205 Therefore,
identifying modifiable factors to delay age-related gait speed decline in older adults is emerging
as a significant priority of public health interest. The results of the second study (i.e., statin use
and gait speed decline) in this dissertation provide additional evidence and new insight that statin
use may have a decreased risk of clinically important gait speed decline. Low-dose and
hydrophilic statin use may reassure in the context of concerns of statin-related muscular adverse
events, especially in older adults.
Ovarian cancer is the second most common gynecologic cancer, following uterine cancer,
and causes more deaths per year than any other cancer of the female reproductive system.223 It
afflicts approximately 1 in 70 women, and is the fifth leading cause of cancer death among
females in the United States.5,223 However, ovarian cancer has a poorly understood etiology

196
and natural history. Thus, strategies that focus on prevention may provide the most rational
approach for meaningful reductions in the incidence and deaths attributable to ovarian cancer.
Moreover, aspirin, NA-NSAIDs and acetaminophen are three of the most frequently used
medication classes in the United States,224,225 Because of the widespread use of aspirin, NA-
NSAIDs and acetaminophen, any association with an increased or decreased cancer risk may
influence many users. The results of the third study (i.e., analgesics use and risk of ovarian
cancer) in this dissertation suggest that aspirin or selective COX-2 inhibitors were associated
with a decreased risk of ovarian cancer, especially among middle aged and older women who
took aspirin at low doses continuously over a long period of time. The regular use of non-
selective NA-NSAIDs and acetaminophen were not associated with the risk of ovarian cancer.
The risk-benefit balance need to be evaluated in the use of aspirin or COX-2 inhibitors in older
adults because of potential gastric side effects (e.g., peptic ulcer disease) from aspirin use and
cardiovascular side effects from COX-2 inhibitor use.
6.3 STUDY LIMITATIONS
The results in this dissertation work should be interpreted with caution due to inherent study
design, limitations and potential biases. In general, despite employing several strategies to
address confounding by indication, including adjustment, sensitivity and subgroup analyses, all
observational studies of pharmacological exposures are subject to this problem.182 This could
obscure or mask protective association of medication use because of initial poorer health status
of users compared to non-users.

197
Some limitations should be considered when interpreting the results of the “Changes in
Cholesterol-Lowering Medications Use over a Decade” and “Statin Use and Gait Speed Decline”
Studies using the data from the Health ABC study. Inherent to most longitudinal studies
examining older adults, the potential for survivor bias should be considered. This may bias the
results towards null. However, the results from sensitivity analyses, restricted to participants in
the study for the entire period of follow-up, yielded similar results. It is also possible that use of
medications may be underestimated as medication use was measured at multiple fixed annual
time points. Unmeasured confounders such as family history of CHD, adherence to medications
which were not collected in the Health ABC study, cannot be ruled out. Given the high rates of
non-adherence in statin users, it is possible that the protective effects of statins from gait speed
decline were underestimated.
The third study of examining analgesics and the risk of ovarian cancer in a case-control
study has several limitations and biases. First, we had no data on the characteristics of excluded
and non-responding cases. The protective results for aspirin use would be nullified if non-
responders in either the case or control groups would have had double or half of the exposure of
the responders. Second, cases may be more motivated to remember their analgesic use than
controls. However, any tendency for the cases to better recall exposures would result in ORs
greater than 1.0 rather than the protective effects observed here. To reduce the impact of recall
bias, a defined reference date was used for assessing exposures. The protective effects of recent
aspirin use might be due to recall limitation since patients were more likely to recall the
medications used recently. Third, measurement and misclassification errors are presumably
present when relying on self-reported and single measurement of analgesics use without
verification.43 Fourth, we did not collect comprehensive information on medical co-morbidities

198
related to cardiovascular disease, health-conscious behaviors, or factors related to adverse
histories of aspirin use. The observed effect might be biased by the residual or unmeasured
confounding.
Finally, limiting generalizability of the results to other populations (e.g., different
ethnicities) should be considered in all of the three studies.
6.4 FUTURE RESEARCH
The findings from the study that examined the changes in cholesterol-lowering medication use
from 1997-2008 implicate the need for future studies to better guide cholesterol-lowering therapy
and investigate the potential barriers of treatment among the oldest old elders (≥ 80 years) with
CHD or at high risk. The results from the study that evaluated the association between statin use
and gait speed decline was the first study to show that statin user may benefit in a decreased risk
of clinically important age-related gait speed decline over a 20-m walk. Taken together with
mixed results of statin use and physical function decline, further studies and RCTs are needed to
confirm the observed associations between statin use and declines in gait speed in diverse
populations (e.g., aged 85 years and older). The results from the study regarding analgesic use
and risk of ovarian cancer call for future research with better characterized accompanying
medical conditions, health and lifestyle behaviors, genetic susceptibility, and the overall risk-
benefit balance of low-dose aspirin use. Ultimately and ideally, randomized, controlled trials are
warranted to confirm the beneficial effects of low-dose statin in preventing or delaying
functional decline, and the effects of low-dose aspirin use in preventing ovarian cancer.

199
APPENDIX
OTHER MEDICATIONS WITH ANTI-INFLAMMATORY EFFECTS
Type Non-steroidal anti-inflammatory Drugs
(NSAIDs)
Other drugs with anti-inflammatory effect Systematic
glucocorticosteroids (Oral only)
Immunosuppressive drugs
Other Miscellaneous Drugs
Medication (by alphabetical order)
Aspirin( > 1200mg/day), Celecoxib, Choline salicylate, magnesium salicylate, Diclofenac, Diflunisal, Etodolac, Fenoprofen, Flubiprofen, Ibuprofen, Indomethacin, Ketoprofen, Ketorolac, Meclofenamate Mefenamic acid, Meloxicam, Nabumetone, Naproxen, Oxaprozin, Phenyl salicylate, Piroxicam, Rofecoxib, Salicylamide, Salsalate, Sulindac, Tolmetin, Trolamine salicylate Valdecoxib
Budesonide, Hydrocortisone, Methylprednisolone, Prednisolone, Prednisone, Triamcinolone acetonide Dexamethasone
Azathioprine, Chlorambucil Cyclophosphamide, Cyclosporine, Leflunomide, Methotrexate, Mercaptopurine, Mycophenolate mofetil, Sirolimus, Tacrolimus
Alefacept Anakinra, Anti-thymocyte globulin, Olsalazine, Efalizumab, Etanercept, Hydroxychloroquine, Infliximab, Muromonab-CD3 (OKT3), Montelukast, Natalizumab, Omalizumab, Rituximab, Sulfasalazine, Thalidomide, Zafirlukast, Zileuton

200
BIBLIOGRAPHY
1. Hartzema AG, Tilson HH, Chan KA. The Contribution of Pharmacoepidemiology to the Study ofDrug Uses and Effects, and Risk Management. In: Hartzema AG, Tilson HH, Chan KA, eds.Pharmacoepidemiology And Therapeutic Risk Management. 1 ed. Cincinnati, OH: HarveyWhitney Books, 2008;1-38.
2. Strom BL. What is Pharmacoepidemiology? In: Storm BL, Kimmel SE, Hennessy S, eds.Pharmacoepidemiology. 5 ed. England: John Wiley & Sons Ltd, 2012;3-22.
3. FDA Concept Paper "Risk Management Programs".http://www.fda.gov/ohrms/dockets/ac/03/briefing/3978B1_03_FDA-Tab%202.pdf Accessed02/17, 2012.
4. Stewart RB. The clinical pharmacist in drug research and development. Pharmacoepidemiology.Drug Intell Clin Pharm 1987;21(1 Pt 2):121-4.
5. Epidemiologyical study design and principles of data analysis: an integrated suite of methods. In:Bhopal R, ed. Concepts of Epidemiology: Integrating the ideas, theories, principles and methodsof epidemiology. New York, NY: Oxford University Press, 2008;285-346.
6. Strom BL. Study designs available for pharmacoepidemiology studies. In: Storm BL, KimmelSE, eds. Textbook of Pharmacoepidemiology. England: John Wiley & Sons Ltd, 2006;13-23.
7. Study designs: ecologic, cross-sectional, case-control. In: Friis RH, Sellers T, eds. EpidemiologyFor Public Health Practice. 3 ed. Sudbury, PA: Jones and Bartlett, 2004;213-47.
8. Assessing the efficacy of prevention and therapeutic measures: randomized trials. In: Gordis L,ed. Epidemiology. Philadelphia, PA: Saunders, and imprint of Elsevier Inc., 2009;131-46.
9. Petitti DB. Introduction. Meta-analysis, Decision analysis, and Cost-effective analysis: Methodsfor Quantative Synthesis in Medicine. Newy York, New York: Oxford University Press, Inc,2000;1-12.
10. Likasitwattanakul S. Serotonin syndrome: a case report. J Med Assoc Thai 2005;88(7):993-6.11. Phan H, Casavant MJ, Crockett S, Lee A, Hall MW, Nahata MC. Serotonin syndrome following a
single 50 mg dose of sertraline in a child. Clin Toxicol (Phila) 2008;46(9):845-9.12. Elbe DH, Chang SW. Moxifloxacin-warfarin interaction: a series of five case reports. Ann
Pharmacother 2005;39(2):361-4.13. Dales L, Hammer SJ, Smith NJ. Time trends in autism and in MMR immunization coverage in
California. JAMA 2001;285(9):1183-5.14. Buettner C, Davis RB, Leveille SG, Mittleman MA, Mukamal KJ. Prevalence of musculoskeletal
pain and statin use. J Gen Intern Med 2008;23(8):1182-6.15. Herbst AL, Ulfelder H, Poskanzer DC. Adenocarcinoma of the vagina. Association of maternal
stilbestrol therapy with tumor appearance in young women. N Engl J Med 1971;284(15):878-81.16. Beydoun MA, Beason-Held LL, Kitner-Triolo MH, Beydoun HA, Ferrucci L, Resnick SM,
Zonderman AB. Statins and serum cholesterol's associations with incident dementia and mildcognitive impairment. J Epidemiol Community Health 2011;65(11):949-57.
17. Vinogradova Y, Coupland C, Hippisley-Cox J. Exposure to statins and risk of common cancers: aseries of nested case-control studies. BMC Cancer 2011;11(1):409.
18. Bohnert AS, Valenstein M, Bair MJ, Ganoczy D, McCarthy JF, Ilgen MA, Blow FC. Associationbetween opioid prescribing patterns and opioid overdose-related deaths. JAMA2011;305(13):1315-21.

201
19. Suissa S, Dell'Aniello S, Martinez C. The multitime case-control design for time-varying exposures. Epidemiology 2010;21(6):876-83.
20. Ottervanger JP, Valkenburg HA, Grobbee DE, Stricker BH. Characteristics and determinants of sumatriptan-associated chest pain. Arch Neurol 1997;54(11):1387-92.
21. Suissa S. The case-time-control design. Epidemiology 1995;6(3):248-53. 22. Kramarz P, DeStefano F, Gargiullo PM, Davis RL, Chen RT, Mullooly JP, Black SB, Shinefield
HR, Bohlke K, Ward JI, Marcy MS. Does influenza vaccination exacerbate asthma? Analysis of a large cohort of children with asthma. Vaccine Safety Datalink Team. Arch Fam Med 2000;9(7):617-23.
23. Major outcomes in high-risk hypertensive patients randomized to angiotensin-converting enzyme inhibitor or calcium channel blocker vs diuretic: The Antihypertensive and Lipid-Lowering Treatment to Prevent Heart Attack Trial (ALLHAT). JAMA 2002;288(23):2981-97.
24. Maher AR, Maglione M, Bagley S, Suttorp M, Hu JH, Ewing B, Wang Z, Timmer M, Sultzer D, Shekelle PG. Efficacy and comparative effectiveness of atypical antipsychotic medications for off-label uses in adults: a systematic review and meta-analysis. JAMA 2011;306(12):1359-69.
25. Pignone M, Earnshaw S, Tice JA, Pletcher MJ. Aspirin, statins, or both drugs for the primary prevention of coronary heart disease events in men: a cost-utility analysis. Ann Intern Med 2006;144(5):326-36.
26. Uppsala Monitoring Centre. Definitions: Glossary of Terms in Pharmacovigilance. http://who-umc.org/DynPage.aspx?id=97224&mn1=7347&mn2=7252&mn3=7257 Accessed 02/05, 2012.
27. Dal Pan GJ, Lindquist M, Gelperin K. Pharmacovigilance Reporting Systems. In: Storm BL, Kimmel SE, Hennessy S, eds. Pharmacoepidemiology. 5 ed. England: John Wiley & Sons Ltd, 2012;137-157.
28. Ahmad SR, Marks NS, Goetsch RA. Spontaneous Reporting in the United States. In: Storm BL, Kimmel SE, eds. Textbook of Pharmacoepidemiology. England: John Wiley & Sons Ltd, 2006;91-136.
29. EudraVigilance. Pharmacovigilance in EEA. http://eudravigilance.ema.europa.eu/human/index.asp Accessed 02/06, 2012.
30. Uppsala Monitoring Centre. VagibaseTM Services. http://www.umc-products.com/DynPage.aspx?id=4910 Accessed 02/06, 2012.
31. Naranjo CA, Busto U, Sellers EM, Sandor P, Ruiz I, Roberts EA, Janecek E, Domecq C, Greenblatt DJ. A method for estimating the probability of adverse drug reactions. Clin Pharmacol Ther 1981;30(2):239-45.
32. Rosenberg L, Coogan PF, Palmer JR. Case-Control Surveillance. In: Storm BL, Kimmel SE, eds. Textbook of Pharmacoepidemiology. England: John Wiley & Sons Ltd, 2006;137-149.
33. Edwards IR, Olsson S, Lindquist M, Hugman B. Global Drug Surveillance: The WHO Programme for International Drug Monitoring. In: Storm BL, Kimmel SE, eds. Textbook of Pharmacoepidemiology. England: John Wiley & Sons Ltd, 2006;117-149.
34. DiPietro NA. Methods in epidemiology: observational study designs. Pharmacotherapy 2010;30(10):973-84.
35. Effects of pravastatin in patients with serum total cholesterol levels from 5.2 to 7.8 mmol/liter (200 to 300 mg/dl) plus two additional atherosclerotic risk factors. The Pravastatin Multinational Study Group for Cardiac Risk Patients. Am J Cardiol 1993;72(14):1031-7.
36. Strom BL. Other Approaches to Pharmacoepidemiology Studies. In: Storm BL, Kimmel SE, eds. Textbook of Pharmacoepidemiology. England: John Wiley & Sons Ltd, 2006;215-226.
37. Rothman KJ, Greenland S, Lash TL. Types of epidemiologic studies. In: Rothman KJ, Greenland S, Lash TL, eds. Modern Epidemiology. Philadelphia, PA: Lippincott Williams & Wilkins, 2008;87-99.
38. Grimes DA, Schulz KF. Compared to what? Finding controls for case-control studies. Lancet 2005;365(9468):1429-33.
39. Wacholder S. Design issues in case-control studies. Stat Methods Med Res 1995;4(4):293-309.

202
40. Wacholder S, Silverman DT, McLaughlin JK, Mandel JS. Selection of controls in case-control studies. III. Design options. Am J Epidemiol 1992;135(9):1042-50.
41. Wacholder S, Silverman DT, McLaughlin JK, Mandel JS. Selection of controls in case-control studies. II. Types of controls. Am J Epidemiol 1992;135(9):1029-41.
42. Wacholder S, McLaughlin JK, Silverman DT, Mandel JS. Selection of controls in case-control studies. I. Principles. Am J Epidemiol 1992;135(9):1019-28.
43. Zondervan KT, Cardon LR, Kennedy SH. What makes a good case-control study? Design issues for complex traits such as endometriosis. Hum Reprod 2002;17(6):1415-23.
44. Case-control studies and other study design. In: Gordis L, ed. Epidemiology. Philadelphia, PA: Saunders, and imprint of Elsevier Inc., 2009;117-200.
45. Study designs: cohort studies. In: Friis RH, Sellers T, eds. Epidemiology For Public Health Practice. 3 ed. Sudbury, PA: Jones and Bartlett, 2004;253-87.
46. Rothman KJ, Greenland S, Lash TL. Cohort studies. In: Rothman KJ, Greenland S, Lash TL, eds. Modern Epidemiology. Philadelphia, PA: Lippincott Williams & Wilkins, 2008;100-10.
47. Wen L, Badgett R, Cornell J. Number needed to treat: a descriptor for weighing therapeutic options. Am J Health Syst Pharm 2005;62(19):2031-6.
48. Sainani KL. Communicating risks clearly: absolute risk and number needed to treat. PM R 2012;4(3):220-2.
49. Schneeweiss S, Suissa S. Advanced Approaches to Controlling Confounding in Pharmacoepidemiologic Studies. In: Storm BL, Kimmel SE, Hennessy S, eds. Pharmacoepidemiology. 5 ed. England: John Wiley & Sons Ltd, 2012;868-892.
50. Rothman KJ, Greenland S, Lash TL. Case-control studies. In: Rothman KJ, Greenland S, Lash TL, eds. Modern Epidemiology. Philadelphia, PA: Lippincott Williams & Wilkins, 2008;100-27.
51. Suissa S. Novel Approaches to Pharmacoepidemiology Study Design and Statistical Analysis. In: Storm BL, Kimmel SE, eds. Textbook of Pharmacoepidemiology. England: John Wiley & Sons Ltd, 2006;383-395.
52. Basic study designs in analytical epidemiology. In: Szklo M, Nieto J, eds. Epidemiology: beyond the basics. Sudbury, MA: Jones and Bartlett, 2004;3-44.
53. Breslow NE. Statistics in epidemiology: the case-control study. J Am Stat Assoc 1996;91(433):14-28.
54. Wacholder S. Practical considerations in choosing between the case-cohort and nested case-control designs. Epidemiology 1991;2(2):155-8.
55. Whitaker HJ, Hocine MN, Farrington CP. The methodology of self-controlled case series studies. Stat Methods Med Res 2009;18(1):7-26.
56. Delaney JA, Suissa S. The case-crossover study design in pharmacoepidemiology. Stat Methods Med Res 2009;18(1):53-65.
57. Schneeweiss S, Sturmer T, Maclure M. Case-crossover and case-time-control designs as alternatives in pharmacoepidemiologic research. Pharmacoepidemiol Drug Saf 1997;6 Suppl 3:S51-9.
58. Maclure M. The case-crossover design: a method for studying transient effects on the risk of acute events. Am J Epidemiol 1991;133(2):144-53.
59. Donnan PT, Wang J. The case-crossover and case-time-control designs in pharmacoepidemiology. Pharmacoepidemiol Drug Saf 2001;10(3):259-62.
60. Etminan M, Samii A. Pharmacoepidemiology I: a review of pharmacoepidemiologic study designs. Pharmacotherapy 2004;24(8):964-9.
61. Tfelt-Hansen P, De Vries P, Saxena PR. Triptans in migraine: a comparative review of pharmacology, pharmacokinetics and efficacy. Drugs 2000;60(6):1259-87.
62. Spitzer WO, Suissa S, Ernst P, Horwitz RI, Habbick B, Cockcroft D, Boivin JF, McNutt M, Buist AS, Rebuck AS. The use of beta-agonists and the risk of death and near death from asthma. N Engl J Med 1992;326(8):501-6.

203
63. Farrington CP. Control without separate controls: evaluation of vaccine safety using case-only methods. Vaccine 2004;22(15-16):2064-70.
64. Hennekens CH, Buring JE. Intervention studies. In: Mayrent SL, ed. Epidemiology in Medicine. Philadelphia, PA: Lippincott Williams & Wilkins, 1987;178-214.
65. Steinbrook R. Health care and the American Recovery and Reinvestment Act. N Engl J Med 2009;360(11):1057-60.
66. Schumock GT, Pickard AS. Comparative effectiveness research: Relevance and applications to pharmacy. Am J Health Syst Pharm 2009;66(14):1278-86.
67. Treweek S, Zwarenstein M. Making trials matter: pragmatic and explanatory trials and the problem of applicability. Trials 2009;10:37.
68. Zwarenstein M, Treweek S, Gagnier JJ, Altman DG, Tunis S, Haynes B, Oxman AD, Moher D. Improving the reporting of pragmatic trials: an extension of the CONSORT statement. BMJ 2008;337:a2390.
69. Major cardiovascular events in hypertensive patients randomized to doxazosin vs chlorthalidone: the antihypertensive and lipid-lowering treatment to prevent heart attack trial (ALLHAT). ALLHAT Collaborative Research Group. JAMA 2000;283(15):1967-75.
70. Petitti DB. Overview of the Methods. Meta-analysis, Decision analysis, and Cost-effective analysis: Methods for Quantative Synthesis in Medicine. Newy York, New York: Oxford University Press, Inc, 2000;13-32.
71. Lau J, Ioannidis JP, Schmid CH. Quantitative synthesis in systematic reviews. Ann Intern Med 1997;127(9):820-6.
72. Berline JA, Cepeda MS, Kim CJ. The Use of Meta-analysis in Pharmacoepidemiology. In: Storm BL, Kimmel SE, Hennessy S, eds. Pharmacoepidemiology. 5 ed. England: John Wiley & Sons Ltd, 2012;723-756.
73. Chen NC, Shauver MJ, Chung KC. A primer on use of decision analysis methodology in hand surgery. J Hand Surg Am 2009;34(6):983-90.
74. Detsky AS, Naglie G, Krahn MD, Naimark D, Redelmeier DA. Primer on medical decision analysis: Part 1--Getting started. Med Decis Making 1997;17(2):123-5.
75. Schulman KA, Glick HA, Polsky D, Reed SD. Pharmacoeconomics: Economic Evaluation of Pharmaceuticals. In: Storm BL, Kimmel SE, Hennessy S, eds. Pharmacoepidemiology. 5 ed. England: John Wiley & Sons Ltd, 2012;678-708.
76. Elwyn G, Edwards A, Eccles M, Rovner D. Decision analysis in patient care. Lancet 2001;358(9281):571-4.
77. Davis Sears E, Chung KC. Decision analysis in plastic surgery: a primer. Plast Reconstr Surg 2010;126(4):1373-80.
78. Strom BL. Overview of Automated Databases in Pharmacoepidemiology. In: Storm BL, Kimmel SE, Hennessy S, eds. Pharmacoepidemiology. 5 ed. England: John Wiley & Sons Ltd, 2012;158-162.
79. Andrade SE, Raebel MA, Boudreau D, Davis RL, Haffenreffer K, Pawloski PA, Toh S, Platt R. Health Maintenance Organizations/Health Plans. In: Storm BL, Kimmel SE, Hennessy S, eds. Pharmacoepidemiology. 5 ed. England: John Wiley & Sons Ltd, 2012;163-188.
80. Fisher BT, Lindenauer PK, Feudtner C. In-hospital Databases. In: Storm BL, Kimmel SE, Hennessy S, eds. Pharmacoepidemiology. 5 ed. England: John Wiley & Sons Ltd, 2012;244-258.
81. Hennessy S, Freeman CP, Cunningham F. US Govermment Claims Databases. In: Storm BL, Kimmel SE, Hennessy S, eds. Pharmacoepidemiology. 5 ed. England: John Wiley & Sons Ltd, 2012;209-223.
82. Seeger J, Daniel DW. Commericial Insurance Databases. In: Storm BL, Kimmel SE, Hennessy S, eds. Pharmacoepidemiology. 5 ed. England: John Wiley & Sons Ltd, 2012;189-208.
83. Ogdie A, Langan SM, Parkinson J, Dattani H, Kostev K, Gelfand JM. Medical Record Databases. In: Storm BL, Kimmel SE, Hennessy S, eds. Pharmacoepidemiology. 5 ed. England: John Wiley & Sons Ltd, 2012;224-243.
204
84. Herings RMG, Pedersen L. Pharmacy-based Medical Record Linkage Systems. In: Storm BL, Kimmel SE, Hennessy S, eds. Pharmacoepidemiology. 5 ed. England: John Wiley & Sons Ltd, 2012;270-286.
85. McDermott MM, Guralnik JM, Greenland P, Pearce WH, Criqui MH, Liu K, Taylor L, Chan C, Sharma L, Schneider JR, Ridker PM, Green D, Quann M. Statin use and leg functioning in patients with and without lower-extremity peripheral arterial disease. Circulation 2003;107(5):757-61.
86. Lau HS, de Boer A, Beuning KS, Porsius A. Validation of pharmacy records in drug exposure assessment. J Clin Epidemiol 1997;50(5):619-25.
87. Glintborg B, Hillestrom PR, Olsen LH, Dalhoff KP, Poulsen HE. Are patients reliable when self-reporting medication use? Validation of structured drug interviews and home visits by drug analysis and prescription data in acutely hospitalized patients. J Clin Pharmacol 2007;47(11):1440-9.
88. Strom BL. Overview of Automated Databases in Pharmacoepidemiology. In: Storm BL, Kimmel SE, eds. Textbook of Pharmacoepidemiology. England: John Wiley & Sons Ltd, 2006;167-171.
89. Park BJ, Stergachis A. Automated Databases in Pharmacoepidemiologic Studies. In: Hartzema AG, Tilson HH, Chan KA, eds. Pharmacoepidemiology and Therapeutic Risk Management. 1 ed. Cincinnati, OH: Harvey Whitney Books Company, 2008;519-543.
90. Harpe SE. Using secondary data sources for pharmacoepidemiology and outcomes research. Pharmacotherapy 2009;29(2):138-53.
91. Andrade SE, Kahler KH, Frech F, Chan KA. Methods for evaluation of medication adherence and persistence using automated databases. Pharmacoepidemiol Drug Saf 2006;15(8):565-74; discussion 575-7.
92. Grymonpre R, Cheang M, Fraser M, Metge C, Sitar DS. Validity of a prescription claims database to estimate medication adherence in older persons. Med Care 2006;44(5):471-7.
93. Verhamme K, Sturkenboom M. Study designs in paediatric pharmacoepidemiology. Eur J Clin Pharmacol 2011;67 Suppl 1:67-74.
94. Kaufman DW. Field Studies. In: Storm BL, Kimmel SE, Hennessy S, eds. Pharmacoepidemiology. 5 ed. England: John Wiley & Sons Ltd, 2012;347-363.
95. Mitchell AA, Cottler LB, Shapiro S. Effect of questionnaire design on recall of drug exposure in pregnancy. Am J Epidemiol 1986;123(4):670-6.
96. Kaufman DW, Kelly JP, Rosenberg L, Anderson TE, Mitchell AA. Recent patterns of medication use in the ambulatory adult population of the United States: the Slone survey. JAMA 2002;287(3):337-44.
97. Landry JA, Smyer MA, Tubman JG, Lago DJ, Roberts J, Simonson W. Validation of two methods of data collection of self-reported medicine use among the elderly. Gerontologist 1988;28(5):672-6.
98. Psaty BM, Lee M, Savage PJ, Rutan GH, German PS, Lyles M. Assessing the use of medications in the elderly: methods and initial experience in the Cardiovascular Health Study. The Cardiovascular Health Study Collaborative Research Group. J Clin Epidemiol 1992;45(6):683-92.
99. Marcum ZA, Peron EP, Hanlon JT. Medication use in the older adults. In: Newman AB, ed. The Epidemiology of Aging. New York: Springer Publishing Company, 2011.
100. Smith NL, Psaty BM, Heckbert SR, Tracy RP, Cornell ES. The reliability of medication inventory methods compared to serum levels of cardiovascular drugs in the elderly. J Clin Epidemiol 1999;52(2):143-6.
101. Pit SW, Byles JE, Cockburn J. Accuracy of telephone self-report of drug use in older people and agreement with pharmaceutical claims data. Drugs Aging 2008;25(1):71-80.
102. Caskie GI, Willis SL, Warner Schaie K, Zanjani FA. Congruence of medication information from a brown bag data collection and pharmacy records: findings from the Seattle longitudinal study. Exp Aging Res 2006;32(1):79-103.

205
103. Rosenberg L, Coogan PF, Palmer JR. Case-Control Surveillance. In: Storm BL, Kimmel SE, Hennessy S, eds. Pharmacoepidemiology. 5 ed. England: John Wiley & Sons Ltd, 2012;287-300.
104. Shakir SAW. Prescription-Event Monitoring. In: Storm BL, Kimmel SE, eds. Textbook of Pharmacoepidemiology. England: John Wiley & Sons Ltd, 2006;151-165.
105. Layton D, Shakir SAW. Prescription-Event Monitoring. In: Storm BL, Kimmel SE, Hennessy S, eds. Pharmacoepidemiology. 5 ed. England: John Wiley & Sons Ltd, 2012;301-330.
106. Gliklich RE, Dreyer NA, eds. Registries for Evaluating Patient Outcomes: A User’s Guide. 2nd ed. (Prepared by Outcome DEcIDE Center [Outcome Sciences, Inc. d/b/a Outcome] under Contract No. HHSA29020050035I TO3.). Rockville, MD: Agency for Healthcare Research and Quality: AHRQ Publication No.10-EHC049.
107. Dreyer NA, Velentgas P. Registries. In: Storm BL, Kimmel SE, Hennessy S, eds. Pharmacoepidemiology. 5 ed. England: John Wiley & Sons Ltd, 2012;331-346.
108. Institute NC. Surveillance, Epidemiology, and End Results (SEER) program. http://seer.cancer.gov/ Accessed 01/27, 2012.
109. Institute NC. Surveillance, Epidemiology, and End Results (SEER) program. SEER-Medicare Link Database. http://seer.cancer.gov/resources/seermedicare.html Accessed 01/27, 2012.
110. National Drug Code Directory. http://www.fda.gov/Drugs/InformationOnDrugs/ucm142438.htm Accessed 01/29, 2012.
111. Uppsala Monitoring Center. World Health Organization (WHO) Drug Dictionary http://www.umc-products.com/ Accessed 01/29, 2012.
112. Pahor M, Chrischilles EA, Guralnik JM, Brown SL, Wallace RB, Carbonin P. Drug data coding and analysis in epidemiologic studies. Eur J Epidemiol 1994;10(4):405-11.
113. The Slone Epidemiology Data Center at Boston University. The Slone Drug Dictionary. http://slone-web.bu.edu/slonedrugdictionary/index.php Accessed 02/03, 2012.
114. K E Kelley, Kelley TP, Kaufman DW, Mitchell AA. The Slone Drug Dictionary: a research driven pharmacoepidemiology tool. Pharmacoepidemiol Drug Saf 2003;12(suppl):S168-S169.
115. First DataBank: FDB MEDKNOWLEDGE™. http://www.fdbhealth.com/fdb-medknowledge-foundations/ Accessed 4/2, 2012.
116. Unified Medical Language System® (UMLS®): RxNorm. http://www.nlm.nih.gov/research/umls/rxnorm/index.html Accessed 02/01, 2012.
117. Hanlon JT, Boudreau RM, Roumani YF, Newman AB, Ruby CM, Wright RM, Hilmer SN, Shorr RI, Bauer DC, Simonsick EM, Studenski SA. Number and dosage of central nervous system medications on recurrent falls in community elders: the Health, Aging and Body Composition study. J Gerontol A Biol Sci Med Sci 2009;64(4):492-8.
118. Slone Survey. Patterns of medication use in the United States: A report from the Slone Survey. http://www.bu.edu/slone/SloneSurvey/AnnualRpt/SloneSurveyWebReport2006.pdf Accessed 02/03, 2009.
119. Medi-Span: Drug Database Products. http://www.medispan.com/drug-database.aspx Accessed 02/02, 2012.
120. Qato DM, Schumm LP, Johnson M, Mihai A, Lindau ST. Medication data collection and coding in a home-based survey of older adults. J Gerontol B Psychol Sci Soc Sci 2009;64 Suppl 1:i86-93.
121. Centers for Disease Control and Prevention. National Health and Nutrition Examination Survey. 1988 - 2008 Data Documentation, Codebook, and Frequencies. Prescription Medications – Drug Information (RXQ_DRUG ). http://www.cdc.gov/nchs/nhanes/nhanes2007-2008/RXQ_DRUG.htm#Appendix_2:_Multum_Lexicon_Therapeutic_Classification_Scheme Accessed 02/03, 2012.
122. Stagnitti MN. The Top Five Therapeutic Classes of Outpatient Prescription Drugs Ranked by Total Expense for the Medicare Population Age 65 and Older in the U.S. Civilian Noninstitutionalized Population, 2004. Rockville, MD: Agency for Healthcare Research and Quality, 2006.

206
123. Daniel GW, Malone DC. Characteristics of older adults who meet the annual prescription drug expenditure threshold for medicare medication therapy management programs. J Manag Care Pharm 2007;13(2):142-54.
124. The National Center for Health Statistics (NCHS): Trend Analysis Using NAMCS and NHAMCS Drug Data http://www.cdc.gov/nchs/ahcd/trend_analysis.htm Accessed 04/04, 2012.
125. Data book: Medicare Part D program (March 2010). http://www.medpac.gov/documents/Mar10_PartDDataBook.pdf Accessed 04/06, 2012.
126. Scichilone RA. Coding Frame. In: Vogenberg FR, ed. Understanding Pharmacy Reimbursement Bethesda, MD: American Society of Health-System Pharmacists, 2006;43-62.
127. Moyers S, Richesson R, Krischer J. Trans-atlantic data harmonization in the classification of medicines and dietary supplements: a challenge for epidemiologic study and clinical research. Int J Med Inform 2008;77(1):58-67.
128. WHO Collaborating Centre for Drug Statistics Methodology. Guidelines for ATC Classification and DDD Assignment. 2012. http://www.whocc.no/atc_ddd_index/ Accessed 01/30, 2012.
129. Uppsala Monitoring Centre. Herbal ATC Guidelines and Index. http://www.umc-products.com/DynPage.aspx?id=73570&mn1=1107&mn2=1135&mn3=6054 Accessed 01/30, 2012.
130. Lee D, Bergman U. Studies for Drug Utilization. In: Storm BL, Kimmel SE, Hennessy S, eds. Pharmacoepidemiology. 5 ed. England: John Wiley & Sons Ltd, 2012;379-401.
131. Mahoney A, Evans J. Comparing drug classification systems. AMIA Annu Symp Proc 2008:1039. 132. Sever PS, Dahlof B, Poulter NR, Wedel H, Beevers G, Caulfield M, Collins R, Kjeldsen SE,
Kristinsson A, McInnes GT, Mehlsen J, Nieminen M, O'Brien E, Ostergren J. Prevention of coronary and stroke events with atorvastatin in hypertensive patients who have average or lower-than-average cholesterol concentrations, in the Anglo-Scandinavian Cardiac Outcomes Trial--Lipid Lowering Arm (ASCOT-LLA): a multicentre randomised controlled trial. Lancet 2003;361(9364):1149-58.
133. AHFS Drug Information®. Bethesda, MD: American Society of Health-System Pharmacists, Inc., 2012.
134. Kelley KE, Kelly TP, Kaufman DW, Mitchell AA. The Slone Drug Dictionary: a research driven pharmacoepidemiology tool. Pharmacoepidemiol Drug Saf 2003;12(suppl 1):S168-9.
135. Grundy SM, Cleeman JI, Merz CN, Brewer HB, Jr., Clark LT, Hunninghake DB, Pasternak RC, Smith SC, Jr., Stone NJ. Implications of recent clinical trials for the National Cholesterol Education Program Adult Treatment Panel III guidelines. Circulation 2004;110(2):227-39.
136. Data and Variables Used for Hospice in Nursing Facility Analyses: Appendix A. http://aspe.hhs.gov/daltcp/reports/rpt4-5ap.htm Accessed 4/2, 2012.
137. Lexi-Comp’s Approach to Drug Classification. Lexo-CompTM Intergrated and Multum Information Service., 2012.
138. Unified Medical Language System® (UMLS®): RxNav: A Semantic Navigation Tool for Clinical Drugs. http://rxnav.nlm.nih.gov/ Accessed 02/01, 2012.
139. Nelson SJ, Zeng K, Kilbourne J, Powell T, Moore R. Normalized names for clinical drugs: RxNorm at 6 years. J Am Med Inform Assoc 2011;18(4):441-8.
140. Csizmadi I, Collet J-P. Bias and Confounding in Pharmacoepidemiology. In: Storm BL, Kimmel SE, eds. Textbook of Pharmacoepidemiology. England: John Wiley & Sons Ltd, 2006;262-275.
141. Shields KM, DiPietro NA, Kier KL. Principles of drug literature evaluation for observational study designs. Pharmacotherapy 2011;31(2):115-27.
142. Hennekens CH, Buring JE. Analysis of epidemiologic studies: evaluating the role of bias. In: Mayrent SL, ed. Epidemiology in Medicine. Philadelphia, PA: Lippincott Williams & Wilkins, 1987;272-286.
143. Gerhard T. Bias: considerations for research practice. Am J Health Syst Pharm 2008;65(22):2159-68.

207
144. Understanding Lack of Validity: Bias. In: Szklo M, Nieto J, eds. Epidemiology: beyond the basics. Sudbury, MA: Jones and Bartlett, 2004;109-49.
145. Berkson J. Limitations of the application of fourfold table analysis to hospital data. Biometrics 1946;2(3):47-53.
146. Horwitz RI, Feinstein AR. The problem of "protopathic bias" in case-control studies. Am J Med 1980;68(2):255-8.
147. Tamim H, Monfared AA, LeLorier J. Application of lag-time into exposure definitions to control for protopathic bias. Pharmacoepidemiol Drug Saf 2007;16(3):250-8.
148. Silber AL, Horwitz RI. Detection bias and relation of benign breast disease to breast cancer. Lancet 1986;1(8482):638-40.
149. Levesque LE, Hanley JA, Kezouh A, Suissa S. Problem of immortal time bias in cohort studies: example using statins for preventing progression of diabetes. BMJ 2010;340:b5087.
150. Sin DD, Tu JV. Inhaled corticosteroids and the risk of mortality and readmission in elderly patients with chronic obstructive pulmonary disease. Am J Respir Crit Care Med 2001;164(4):580-4.
151. Garbe E, Suissa S. Pharmacoepidemiology. In: Ahrens W, Pigeot I, eds. Handbook of Epidemiology. Berlin Heidelberg, Germany: Springer, 2004;1225-1266.
152. Hennekens CH, Buring JE. Analysis of epidemiologic studies: evaluating the role of confounding. In: Mayrent SL, ed. Epidemiology in Medicine. Philadelphia, PA: Lippincott Williams & Wilkins, 1987;287-326.
153. Walker AM. Confounding by indication. Epidemiology 1996;7(4):335-6. 154. Strom BL, Melmon KL. The Use of Pharmacoepidemiology to Study Beneficial Drug Effects. In:
Storm BL, Kimmel SE, Hennessy S, eds. Pharmacoepidemiology. 5 ed. England: John Wiley & Sons Ltd, 2012;655-677.
155. Laporte JR, Ibanez L, Vidal X, Vendrell L, Leone R. Upper gastrointestinal bleeding associated with the use of NSAIDs: newer versus older agents. Drug Saf 2004;27(6):411-20.
156. Salas M, Hofman A, Stricker BH. Confounding by indication: an example of variation in the use of epidemiologic terminology. Am J Epidemiol 1999;149(11):981-3.
157. Confounding. In: Aschengrau A, Seage GR, eds. Essentials of Epidemiology in Public Health. 2 ed. Sudbury, MA: Hones and Bartlett Publishers, 2008;287-306.
158. Schneeweiss S. Confounding. In: Hartzema AG, Tilson HH, Chan KA, eds. Pharmacoepidemiology and Therapeutic Risk Management. 1 ed. Cincinnati, OH: Harvey Whitney Books Company, 2008;273-300.
159. Haro JM, Kontodimas S, Negrin MA, Ratcliffe M, Suarez D, Windmeijer F. Methodological aspects in the assessment of treatment effects in observational health outcomes studies. Appl Health Econ Health Policy 2006;5(1):11-25.
160. Suruki RY, Chan KA. Basic Pharmacoepidemiology Methods. In: Hartzema AG, Tilson HH, Chan KA, eds. Pharmacoepidemiology and Therapeutic Risk Management. 1 ed. Cincinnati, OH: Harvey Whitney Books Company, 2008;219-38.
161. Peduzzi P, Concato J, Kemper E, Holford TR, Feinstein AR. A simulation study of the number of events per variable in logistic regression analysis. J Clin Epidemiol 1996;49(12):1373-9.
162. Maldonado G, Greenland S. Simulation study of confounder-selection strategies. Am J Epidemiol 1993;138(11):923-36.
163. Parsons LS. Reducing Bias in a Propensity Score Matched-Pair Sample using Greedy Matching Techniques. http://www2.sas.com/proceedings/sugi26/p214-26.pdf SAS.
164. Rosenbaum PR, Rubin DB. Reducing Bias in Observational Studies Using Subclassification on the Propensity Score. J Am Stat Assoc 1984;79(387):516-24.
165. Weitzen S, Lapane KL, Toledano AY, Hume AL, Mor V. Principles for modeling propensity scores in medical research: a systematic literature review. Pharmacoepidemiol Drug Saf 2004;13(12):841-53.

208
166. Robins JM, Hernan MA, Brumback B. Marginal structural models and causal inference in epidemiology. Epidemiology 2000;11(5):550-60.
167. Sato T, Matsuyama Y. Marginal structural models as a tool for standardization. Epidemiology 2003;14(6):680-6.
168. Kurth T, Seeger JD. Propensity Score Analysis in Pharmacoepidemiology. In: Hartzema AG, Tilson HH, Chan KA, eds. Pharmacoepidemiology and Therapeutic Risk Management. 1 ed. Cincinnati, OH: Harvey Whitney Books Company, 2008;301-324.
169. Braitman LE, Rosenbaum PR. Rare outcomes, common treatments: analytic strategies using propensity scores. Ann Intern Med 2002;137(8):693-5.
170. Brookhart MA, Schneeweiss S, Rothman KJ, Glynn RJ, Avorn J, Sturmer T. Variable selection for propensity score models. Am J Epidemiol 2006;163(12):1149-56.
171. Cepeda MS, Boston R, Farrar JT, Strom BL. Comparison of logistic regression versus propensity score when the number of events is low and there are multiple confounders. Am J Epidemiol 2003;158(3):280-7.
172. Suarez D, Borras R, Basagana X. Differences between marginal structural models and conventional models in their exposure effect estimates: a systematic review. Epidemiology 2011;22(4):586-8.
173. Cole SR, Hernan MA. Constructing inverse probability weights for marginal structural models. Am J Epidemiol 2008;168(6):656-64.
174. Cain KC, Breslow NE. Logistic regression analysis and efficient design for two-stage studies. Am J Epidemiol 1988;128(6):1198-206.
175. Flanders WD, Greenland S. Analytic methods for two-stage case-control studies and other stratified designs. Stat Med 1991;10(5):739-47.
176. Sturmer T, Schneeweiss S, Avorn J, Glynn RJ. Adjusting effect estimates for unmeasured confounding with validation data using propensity score calibration. Am J Epidemiol 2005;162(3):279-89.
177. Solomon DH, Schneeweiss S, Glynn RJ, Kiyota Y, Levin R, Mogun H, Avorn J. Relationship between selective cyclooxygenase-2 inhibitors and acute myocardial infarction in older adults. Circulation 2004;109(17):2068-73.
178. Suissa S. Relative excess risk: an alternative measure of comparative risk. Am J Epidemiol 1999;150(3):279-82.
179. Rubin DB. Estimating causal effects from large data sets using propensity scores. Ann Intern Med 1997;127(8 Pt 2):757-63.
180. Schneeweiss S, Glynn RJ, Avorn J, Solomon DH. A Medicare database review found that physician preferences increasingly outweighed patient characteristics as determinants of first-time prescriptions for COX-2 inhibitors. J Clin Epidemiol 2005;58(1):98-102.
181. Schneeweiss S. Sensitivity analysis and external adjustment for unmeasured confounders in epidemiologic database studies of therapeutics. Pharmacoepidemiol Drug Saf 2006;15(5):291-303.
182. Psaty BM, Koepsell TD, Lin D, Weiss NS, Siscovick DS, Rosendaal FR, Pahor M, Furberg CD. Assessment and control for confounding by indication in observational studies. J Am Geriatr Soc 1999;47(6):749-54.
183. Shrank WH, Patrick AR, Brookhart MA. Healthy user and related biases in observational studies of preventive interventions: a primer for physicians. J Gen Intern Med 2011;26(5):546-50.
184. Matthews KA, Kuller LH, Wing RR, Meilahn EN, Plantinga P. Prior to use of estrogen replacement therapy, are users healthier than nonusers? Am J Epidemiol 1996;143(10):971-8.
185. Brookhart MA, Patrick AR, Dormuth C, Avorn J, Shrank W, Cadarette SM, Solomon DH. Adherence to lipid-lowering therapy and the use of preventive health services: an investigation of the healthy user effect. Am J Epidemiol 2007;166(3):348-54.

209
186. Jackson LA, Nelson JC, Benson P, Neuzil KM, Reid RJ, Psaty BM, Heckbert SR, Larson EB, Weiss NS. Functional status is a confounder of the association of influenza vaccine and risk of all cause mortality in seniors. Int J Epidemiol 2006;35(2):345-52.
187. Glynn RJ, Knight EL, Levin R, Avorn J. Paradoxical relations of drug treatment with mortality in older persons. Epidemiology 2001;12(6):682-9.
188. Federal Interagency Forum on Aging-Related Statistics. Older Americans 2010: Key Indicators of Well-Being. Washington, DC: Federal Interagency Forum on Aging-Related Statistics., 2010.
189. Afilalo J, Duque G, Steele R, Jukema JW, de Craen AJ, Eisenberg MJ. Statins for secondary prevention in elderly patients: a hierarchical bayesian meta-analysis. J Am Coll Cardiol 2008;51(1):37-45.
190. Miettinen TA, Pyorala K, Olsson AG, Musliner TA, Cook TJ, Faergeman O, Berg K, Pedersen T, Kjekshus J. Cholesterol-lowering therapy in women and elderly patients with myocardial infarction or angina pectoris: findings from the Scandinavian Simvastatin Survival Study (4S). Circulation 1997;96(12):4211-8.
191. Lewis SJ, Moye LA, Sacks FM, Johnstone DE, Timmis G, Mitchell J, Limacher M, Kell S, Glasser SP, Grant J, Davis BR, Pfeffer MA, Braunwald E. Effect of pravastatin on cardiovascular events in older patients with myocardial infarction and cholesterol levels in the average range. Results of the Cholesterol and Recurrent Events (CARE) trial. Ann Intern Med 1998;129(9):681-9.
192. MRC/BHF Heart Protection Study of cholesterol lowering with simvastatin in 20,536 high-risk individuals: a randomised placebo-controlled trial. Lancet 2002;360(9326):7-22.
193. Hunt D, Young P, Simes J, Hague W, Mann S, Owensby D, Lane G, Tonkin A. Benefits of pravastatin on cardiovascular events and mortality in older patients with coronary heart disease are equal to or exceed those seen in younger patients: Results from the LIPID trial. Ann Intern Med 2001;134(10):931-40.
194. Li M, Ong KL, Tse HF, Cheung BM. Utilization of lipid lowering medications among adults in the United States 1999-2006. Atherosclerosis 2010;208(2):456-60.
195. Third Report of the National Cholesterol Education Program (NCEP) Expert Panel on Detection, Evaluation, and Treatment of High Blood Cholesterol in Adults (Adult Treatment Panel III) final report. Circulation 2002;106(25):3143-421.
196. Shepherd J, Blauw GJ, Murphy MB, Bollen EL, Buckley BM, Cobbe SM, Ford I, Gaw A, Hyland M, Jukema JW, Kamper AM, Macfarlane PW, Meinders AE, Norrie J, Packard CJ, Perry IJ, Stott DJ, Sweeney BJ, Twomey C, Westendorp RG. Pravastatin in elderly individuals at risk of vascular disease (PROSPER): a randomised controlled trial. Lancet 2002;360(9346):1623-30.
197. Kamari Y, Bitzur R, Cohen H, Shaish A, Harats D. Should all diabetic patients be treated with a statin? Diabetes Care 2009;32 Suppl 2:S378-83.
198. Petersen LK, Christensen K, Kragstrup J. Lipid-lowering treatment to the end? A review of observational studies and RCTs on cholesterol and mortality in 80+-year olds. Age Ageing 2010;39(6):674-80.
199. The effects of cholesterol lowering with simvastatin on cause-specific mortality and on cancer incidence in 20,536 high-risk people: a randomised placebo-controlled trial [ISRCTN48489393]. BMC Med 2005;3:6.
200. Kjekshus J, Apetrei E, Barrios V, Bohm M, Cleland JG, Cornel JH, Dunselman P, Fonseca C, Goudev A, Grande P, Gullestad L, Hjalmarson A, Hradec J, Janosi A, Kamensky G, Komajda M, Korewicki J, Kuusi T, Mach F, Mareev V, McMurray JJ, Ranjith N, Schaufelberger M, Vanhaecke J, van Veldhuisen DJ, Waagstein F, Wedel H, Wikstrand J. Rosuvastatin in older patients with systolic heart failure. N Engl J Med 2007;357(22):2248-61.
201. Perera S, Mody SH, Woodman RC, Studenski SA. Meaningful change and responsiveness in common physical performance measures in older adults. J Am Geriatr Soc 2006;54(5):743-9.

210
202. Studenski S, Perera S, Patel K, Rosano C, Faulkner K, Inzitari M, Brach J, Chandler J, Cawthon P, Connor EB, Nevitt M, Visser M, Kritchevsky S, Badinelli S, Harris T, Newman AB, Cauley J, Ferrucci L, Guralnik J. Gait speed and survival in older adults. JAMA 2011;305(1):50-8.
203. Verghese J, Wang C, Lipton RB, Holtzer R, Xue X. Quantitative gait dysfunction and risk of cognitive decline and dementia. J Neurol Neurosurg Psychiatry 2007;78(9):929-35.
204. Abellan van Kan G, Rolland Y, Andrieu S, Bauer J, Beauchet O, Bonnefoy M, Cesari M, Donini LM, Gillette Guyonnet S, Inzitari M, Nourhashemi F, Onder G, Ritz P, Salva A, Visser M, Vellas B. Gait speed at usual pace as a predictor of adverse outcomes in community-dwelling older people an International Academy on Nutrition and Aging (IANA) Task Force. J Nutr Health Aging 2009;13(10):881-9.
205. Shumway-Cook A, Guralnik JM, Phillips CL, Coppin AK, Ciol MA, Bandinelli S, Ferrucci L. Age-associated declines in complex walking task performance: the Walking InCHIANTI toolkit. J Am Geriatr Soc 2007;55(1):58-65.
206. Giri J, McDermott MM, Greenland P, Guralnik JM, Criqui MH, Liu K, Ferrucci L, Green D, Schneider JR, Tian L. Statin use and functional decline in patients with and without peripheral arterial disease. J Am Coll Cardiol 2006;47(5):998-1004.
207. Mondillo S, Ballo P, Barbati R, Guerrini F, Ammaturo T, Agricola E, Pastore M, Borrello F, Belcastro M, Picchi A, Nami R. Effects of simvastatin on walking performance and symptoms of intermittent claudication in hypercholesterolemic patients with peripheral vascular disease. The American Journal of Medicine 2003;114(5):359-364.
208. Mohler ER, III, Hiatt WR, Creager MA, for the Study Investigators. Cholesterol Reduction With Atorvastatin Improves Walking Distance in Patients With Peripheral Arterial Disease. Circulation 2003;108(12):1481-1486.
209. Mondillo S, Ballo P, Barbati R, Guerrini F, Ammaturo T, Agricola E, Pastore M, Borrello F, Belcastro M, Picchi A, Nami R. Effects of simvastatin on walking performance and symptoms of intermittent claudication in hypercholesterolemic patients with peripheral vascular disease. Am J Med 2003;114(5):359-64.
210. Gray SL, Boudreau RM, Newman AB, Studenski SA, Shorr RI, Bauer DC, Simonsick EM, Hanlon JT. Angiotensin-converting enzyme inhibitor and statin use and incident mobility limitation in community-dwelling older adults: the Health, Aging and Body Composition study. J Am Geriatr Soc 2011;59(12):2226-32.
211. Gray SL, Aragaki AK, LaMonte MJ, Cochrane BB, Kooperberg C, Robinson JG, Woods NF, LaCroix AZ. Statins, angiotensin-converting enzyme inhibitors, and physical performance in older women. J Am Geriatr Soc 2012;60(12):2206-14.
212. Agostini JV, Tinetti ME, Han L, McAvay G, Foody JM, Concato J. Effects of statin use on muscle strength, cognition, and depressive symptoms in older adults. J Am Geriatr Soc 2007;55(3):420-5.
213. Chatzizisis YS, Koskinas KC, Misirli G, Vaklavas C, Hatzitolios A, Giannoglou GD. Risk factors and drug interactions predisposing to statin-induced myopathy: implications for risk assessment, prevention and treatment. Drug Saf 2010;33(3):171-87.
214. LaCroix AZ, Gray SL, Aragaki A, Cochrane BB, Newman AB, Kooperberg CL, Black H, Curb JD, Greenland P, Woods NF. Statin use and incident frailty in women aged 65 years or older: prospective findings from the Women's Health Initiative Observational Study. J Gerontol A Biol Sci Med Sci 2008;63(4):369-75.
215. Phillips PS, Haas RH, Bannykh S, Hathaway S, Gray NL, Kimura BJ, Vladutiu GD, England JD. Statin-associated myopathy with normal creatine kinase levels. Ann Intern Med 2002;137(7):581-5.
216. Scott D, Blizzard L, Fell J, Jones G. Statin therapy, muscle function and falls risk in community-dwelling older adults. QJM 2009;102(9):625-33.
217. Silva MA, Swanson AC, Gandhi PJ, Tataronis GR. Statin-related adverse events: a meta-analysis. Clin Ther 2006;28(1):26-35.

211
218. Golomb BA, Evans MA. Statin adverse effects : a review of the literature and evidence for a mitochondrial mechanism. Am J Cardiovasc Drugs 2008;8(6):373-418.
219. Verghese J, LeValley A, Hall CB, Katz MJ, Ambrose AF, Lipton RB. Epidemiology of gait disorders in community-residing older adults. J Am Geriatr Soc 2006;54(2):255-61.
220. Janssen I, Shepard DS, Katzmarzyk PT, Roubenoff R. The healthcare costs of sarcopenia in the United States. J Am Geriatr Soc 2004;52(1):80-5.
221. Guralnik JM, Fried LP, Salive ME. Disability as a public health outcome in the aging population. Annu Rev Public Health 1996;17:25-46.
222. Fried TR, Bradley EH, Williams CS, Tinetti ME. Functional disability and health care expenditures for older persons. Arch Intern Med 2001;161(21):2602-7.
223. Jemal A, Siegel R, Ward E, Hao Y, Xu J, Thun MJ. Cancer statistics, 2009. CA Cancer J Clin 2009;59(4):225-49.
224. Gabriel SE, Fehring RA. Trends in the utilization of non-steroidal anti-inflammatory drugs in the United States, 1986-1990. J Clin Epidemiol 1992;45(9):1041-4.
225. Banthin JS, Zodet M. Trends in the Use and Expenditures for COX-2 Inhibitors and Traditional Nonsteroidal Anti-inflammatory Drugs, 1997–2003. Statistical Brief #139. . Rockville, MD: Agency for Healthcare Research and Quality, 2006.