phan c5tc00125k revised supporting information 2 01 … · 2015-02-04 · novagen bugbuster ®...
TRANSCRIPT

1
Infrared Invisibility Stickers Inspired By Cephalopods
Long Phan,a David D. Ordinario,a Emil Karshalev,a Ward G. Walkup IV,a Michael A. Shenk,a
Alon A. Gorodetsky*ab
aDepartment of Chemical Engineering and Materials Science, University of California, Irvine,
Irvine, CA 92697, USA
bDepartment of Chemistry, University of California, Irvine, Irvine, CA 92697, USA
*Correspondence to: [email protected]
(I) Design and Cloning of the Reflectin A1 Gene: An E. coli codon optimized gene coding for 6x histidine tagged wild type reflectin A1 protein from Doryteuthis (formerly Loligo) pealeii (Genbank: ACZ57764.1) was synthesized and cloned into pJExpress414 vector (DNA2.0). (II) Expression and Purification of Reflectin A1: A general previously reported protocol was used for the expression and purification of wild type reflectin A1.17,18 In brief, the pJExpress414 expression vectors containing wild type reflectin were transformed into BL21(DE3) cells (Novagen). Reflectins were expressed at 37 °C using Overnight Express Instant Terrific Broth (TB) media (Novagen) supplemented with 100 µg mL-1 Carbenicillin. Reflectin was completely insoluble when expressed at 37 °C and was sequestered in inclusion bodies prepared using Novagen BugBuster® according to the manufacturer’s suggested protocol. Reflectin inclusion bodies were then solubilized in denaturing buffer (pH 7.4, 50 mM sodium phosphate, 300 mM sodium chloride, 6M guanidine hydrochloride) and purified under denaturing conditions on HisPur Cobalt Resin (Thermo Scientific) immobilized metal affinity chromatography (IMAC) gravity columns according to the manufacturer’s protocols. The protein was eluted by using denaturing buffer supplemented with 250 mM imidazole. The fractions containing reflectin were pooled and concentrated on Millipore Amicon Concentrators before further purification with high-performance liquid chromatography (HPLC) on an Agilent 1260 Infinity system using an Agilent reverse phase C18 column with a gradient evolved from 95% Buffer A:5% Buffer B to 5% Buffer A:95% Buffer B at a flow rate of 1 mL min-1 over 30 minutes (Buffer A: 99.9% H2O, 0.1% TFA; Buffer B: 95% acetonitrile, 4.9% H2O, 0.1% TFA). The pure reflectin fractions were pooled, flash frozen in liquid nitrogen, and lyophilized. Protein concentrations and yields were quantified via a Bradford protein assay with bovine serum albumin (BSA) as a standard (BioRad). (III) Characterization of Reflectin A1: A general previously reported protocol was used for assaying the purity and confirming the sequence of reflectin A1.17,18 In brief, purified and unpurified reflectin samples were analyzed by SDS-PAGE and GelCode Blue Staining (Thermo Scientific) on an Invitrogen XCell SureLock Mini using NuPAGE Novex 4-12% Bis-Tris gels, with NuPAGE MOPS as the running buffer under reducing conditions. Stained protein bands were subjected to in-gel tryptic digestion, performed according to literature procedures.17,18 After digestion, the peptides were separated on a C18 chromatography column and analyzed by mass
Electronic Supplementary Material (ESI) for Journal of Materials Chemistry C.This journal is © The Royal Society of Chemistry 2015

2
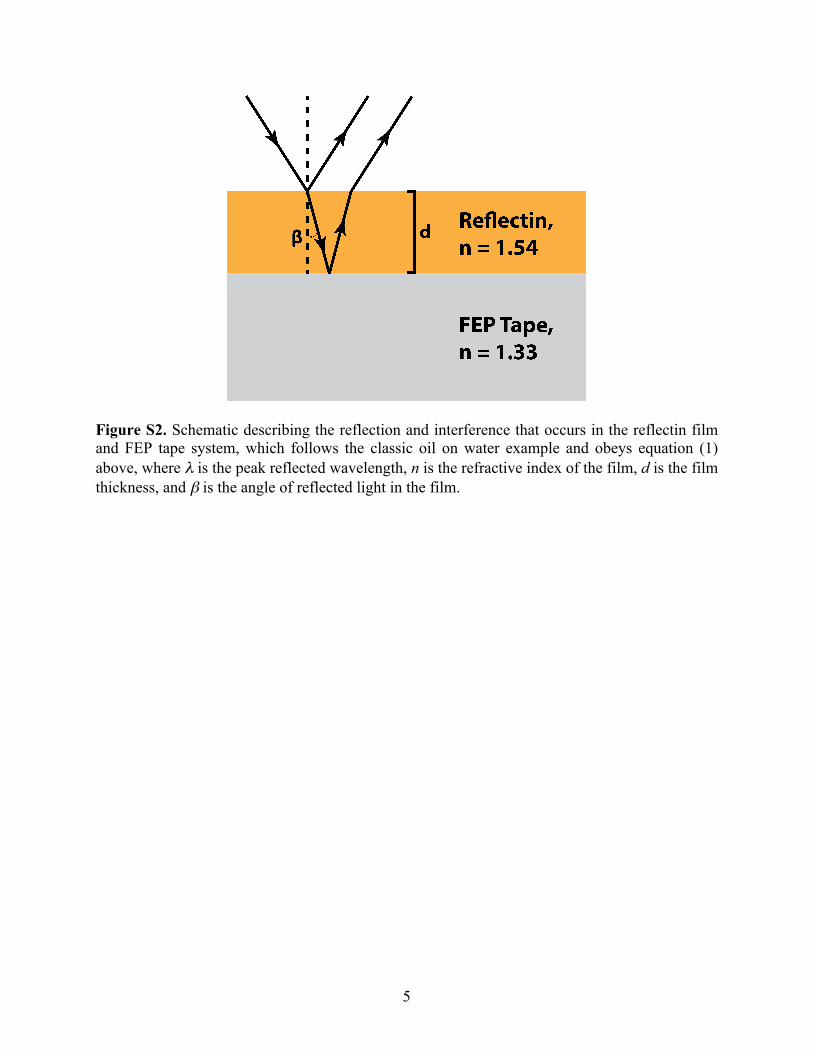
spectrometry on a Thermo Orbitrap mass spectrometry instrument outfitted with an electrospray ionization source. The resulting sequence coverage was 94% for the wild type reflectin A1. (IV) Fabrication of Reflectin-Coated Fluorinated Ethylene Propylene Substrates: In a typical procedure, a strip of Fluorinated Ethylene Propylene (FEP) tape (McMaster-Carr) was first adhered to a glass substrate (Fisher), in preparation for coating. Spacer rails of Teflon tape (McMaster-Carr) were then applied to the edges of the FEP tape. The tape was coated with graphene oxide (Graphene Marketplace) on a hot plate at 60 ºC to provide an adhesion layer for the protein. The reflectin protein solution was then cast onto the FEP tape in front of the blade, which was translated at a constant speed across the surface to produce thin films. To promote water evaporation and uniform film formation, the coating procedure was performed at 80°C. The film thickness was controlled by varying the reflectin concentration. (V) Atomic Force Microscopy Characterization of Reflectin-Coated Substrates: The thicknesses of all reflectin films were measured with atomic force microscopy (AFM) by examining trenches scribed directly into the films. Topographical images were also collected to confirm uniformity for all substrates. The measurements were performed with iridium coated silicon probes (Asylum Research ASYELEC-01) with a spring constant of 2 N m-1, resonance frequency of 70 kHz, and tip radius of 28 nm. The scans were typically rastered either at 0.17 Hz or at 1.0 Hz and normalized using polynomial subtraction for improved image quality. A representative AFM topography scan for a reflectin-coated substrate is shown in Fig. S1. (VI) Optical Characterization of Reflectin-Coated Substrates: The reflectin-coated substrates were characterized with optical microscopy and reflectance measurements according to established protocols.18 Optical images were obtained on a Carl Zeiss Axio Imager A1M microscope outfitted with an Epiplan lens (20X, NA = 0.4) and processed with the manufacturer’s AxioVision AC4.5 software. Reflectance spectra were measured in the presence and absence of applied strain on one of three instruments: 1) an Ocean Optics SD2000 Miniature Fiber Optic Spectrometer, outfitted with an LS-1 tungsten-halogen white light source and a R400-7 Reflection/Backscattering Probe (effective wavelength range of λ = 340 nm to λ = 950 nm); 2) a Perkin-Elmer Lambda 950 Spectrometer, outfitted with deuterium and tungsten-halogen white light sources and a 60 mm integrating sphere (effective wavelength range of λ = 190 nm to λ = 3300 nm); and 3) a Filmetrics F40-NSR microscope system, outfitted with a Tungsten-Halogen white light source (effective wavelength range of λ = 400 nm to λ = 800 nm). Measurements on the Filmetrics F40-NSR microscope system allowed for confirmation of the film thickness determined by AFM and profilometry. The integrating sphere reflectance data were acquired at an angle of 8º to the substrate surface, and all measurements were referenced to a SpectraLabs Spectralon standard (unless otherwise noted). (VII) Detailed Description of the Reflectin Film Thickness Calculations: The theoretical film thicknesses were calculated based on thin-film interference theory.S1,S2 Our system closely follows the well-known oil on water example, due to reflectin’s refractive index of ~1.5418 and FEP’s refractive index of ~1.33.25-27 Thus, at non-normal incidence, the reflected light obeys the equation: (1)

3
where m is an integer that describes wavelength order, λ is the peak reflected wavelength, n is the refractive index of the film, d is the film thickness, and β is the angle in the film (Fig. S2). Note that the graphene oxide adhesion layer used in our experiments was very thin, so it did not dramatically influence the calculated values. The refractive indices used for the calculations were obtained from the literature18,25-27 and confirmed at Filmetrics (San Diego, CA) using a Filmetrics F20-UV spectrophotometer. (VIII) Description of the Imaging and Stretching Experiments: The reflectin-coated FEP tape was mounted between two anchoring substrates. The camouflage-patterned fabric was then placed underneath the reflectin-coated substrate, highlighting the active area of the film. The film was first imaged in the absence of strain with an optical camera under white light illumination, and then again with an infrared camera under infrared light illumination. The infrared imaging experiments employed a Nikon D-70 camera equipped with a 50 mm f/1.8 AF-S DX Lens (Nikon) and a RM-72 infrared filter (Hoya). The infrared illumination light source consisted of a home-built 26 LED array (XtraLED). The images were captured with an exposure time of 5 seconds, aperture setting of f/8, and ISO of 200. The film was subsequently stretched, inducing a uniaxial strain (tension) and imaged again with the optical and infrared cameras, as described above. (IX) Description of the Heat-Induced Substrate Regeneration Experiments: The reflectin-coated FEP tape was stretched as described above. After the final desired strain was reached, the sample was regenerated by direct exposure to hot air from a heat gun (Grizzly Industrial, model H0800) for a maximum duration of 2 seconds at the gun’s “low” setting. (X) Supplementary References: (S1) A. Lipson, S. G. Lipson and H. Lipson, Optical Physics, 4th edn, Cambridge University Press, Cambridge, 2010. (S2) Oil Film Interference, http://hyperphysics.phy-astr.gsu.edu/hbase/phyopt/oilfilm.html#c1, (accessed December 2014).

4
Figure S1. A typical atomic force microscopy image for a reflectin film on an FEP substrate. The film corresponds to Figure 2 in the main text. The RMS roughness was ~ 1.5 nm.
5
Figure S2. Schematic describing the reflection and interference that occurs in the reflectin film and FEP tape system, which follows the classic oil on water example and obeys equation (1) above, where λ is the peak reflected wavelength, n is the refractive index of the film, d is the film thickness, and β is the angle of reflected light in the film.

6
Figure S3. A) An optical camera image of a camouflage fatigue overlaid with a piece of reflectin-coated fluorinated ethylene propylene tape in the absence of strain. The tape is transparent and nearly invisible, enabling visualization of the underlying fatigue. B) An optical camera image of the same camouflage fatigue and reflectin-coated fluorinated ethylene propylene tape in the presence of strain. The tape is no longer transparent and appears colored, obscuring the underlying fatigue. C) An optical camera image of the same camouflage fatigue and reflectin-coated fluorinated ethylene propylene tape in the absence of strain after regeneration with heat. The tape has recovered its transparency, again enabling visualization of the underlying fatigue.