phages manuscript hhmi (1)
TRANSCRIPT
Dramatic variation in phage genome structures revealed by whole genome comparisons
Welkin Pope1, Charles Bowman1, SEA-PHAGES2, PHIRE3, K-RITH MGC4, Deborah Jacobs-Sera1, Daniel A. Russell1, Steven Cresawn5, William R. Jacobs Jr.6, Jeffrey G. Lawrence1,
Roger W. Hendrix1, and Graham F. Hatfull1*.
1Department of Biological Sciences, University of Pittsburgh, Pittsburgh, PA 15260 2Science Education Alliance Phage Hunters Advancing Genomics and Evolutionary Science
3Phage Hunters Integrating Research and Education 4KwaZulu-Natal Institute for TB and HIV research Mycobacterial Genetics Course
5Department of Biology, James Madison University, Harrisonburg, VA 6Department of Microbiology and Immunology, Albert Einstein College of Medicine, NY
*Corresponding Author

2
Bacteriophages are the dark matter of the biological universe1, forming a vast, dynamic,
old, and genetically diverse population2. Horizontal exchange generates pervasive
genome mosaicism, with different genome segments having distinct evolutionary
histories3. Phages of phylogenetically distant hosts typically share low nucleic acid
sequence similarity, and few share genes with amino acid sequence similarity2. Phages
of a single common host can also span considerable sequence diversity even though
they are in direct genetic contact1. Comparative genomics of a large collection of phages
isolated on Mycobacterium smegmatis provides insights into the size and diversity of
groups of related phages and the extent to which the groups are discrete and genetically
isolated from other phages. We show that both the diversity and genetic isolation of
phage groups varies enormously. Some are discrete and share few genes with other
phages, whereas others are genetically connected to many other phages. The phage
population thus spans a continuum of relationships, but with phages of different types
varying enormously in prevalence. The reticulate relationships resulting from pervasively
mosaic architectures confound hierarchical taxonomic phage classification or
application of simple numerical values to distinguish among phage genomic types.
Bacteriophages are the most abundant organisms in the biosphere, and the ~1031 tailed phage
particles participate in ~1023 infections per second on a global scale, with the entire population
turning over every few days4. Virion structures suggest the population is also extremely old5 and
thus the great genetic diversity of phages is not surprising2. Phages likely evolved with common
ancestry and access to a large common gene pool3, although rates of horizontal exchange are
heterogeneous, being influenced by host range, varying phage migration rates across the
microbial landscape, and lifestyle (temperate or virulent)6. Multiple processes determine this
including local host diversity and mutation rates, as well as resistance mechanisms such as
receptor availability, restriction, CRISPRs, and abortive infection systems6,7. Constraints on

3
gene acquisition may also be imposed by synteny – particularly among virion structural genes –
and by size limits of DNA packaging2,8.
Genomic comparison of phages infecting a common host provides insights into evolutionary
mechanisms and the structure of their genetic diversity9. Relatively small numbers of phage
genomes have been sequenced for hosts such as Escherichia coli, Salmonella,
Staphylococcus, Pseudomonas, and Propionibacterium10-13 revealing varying degrees of genetic
diversity. Mycobacteriophages isolated from environmental samples using Mycobacterium
smegmatis mc2155 as a host are architecturally mosaic1 and span considerable diversity, but
can be grouped into ‘clusters’ of related phages that share little or no nucleotide sequence
similarity with other phages1,14-18. Some clusters are heterogeneous and can be readily divided
into subclusters by their nucleotide similarities. Recent analysis of phages adsorbed to
Synechococcus revealed 26 discrete ‘populations’, although they were obtained from a single
sample and are predominantly morphologically myoviral (T4-like)9. However, these populations
likely represent only a small portion Synechococcus phages because the genomes of 17 fully
sequenced phages infecting Synechoccocus or closely-related hosts fail to associate with these
“populations”9. These populations may thus reflect sampling bias of the single environment
examined, and extensive genomic mosaicism found in phages of Synechococcus and other
hosts1,3,19 warrants caution in extrapolation of the concept of discrete phage populations in the
absence of complete genome sequences.
The Howards Hughes Medical Institute (HHMI) Science Education Alliance Phage Hunters
Advancing Genomics and Evolutionary Science (SEA-PHAGES) program has facilitated
expansion of the number of sequenced mycobacteriophage genomes to 627 (Table S1) by
engaging large numbers of undergraduates in phage discovery and genomics20. The size of this
collection now provides sufficient resolution to offer insights into the diversity and genetic
4
isolation of phage genome types. Here we address the question of whether the groups of
related phages represent primarily discrete populations or genetically intermixed groups.
Although the collection excludes viruses that don’t form plaques under laboratory conditions, the
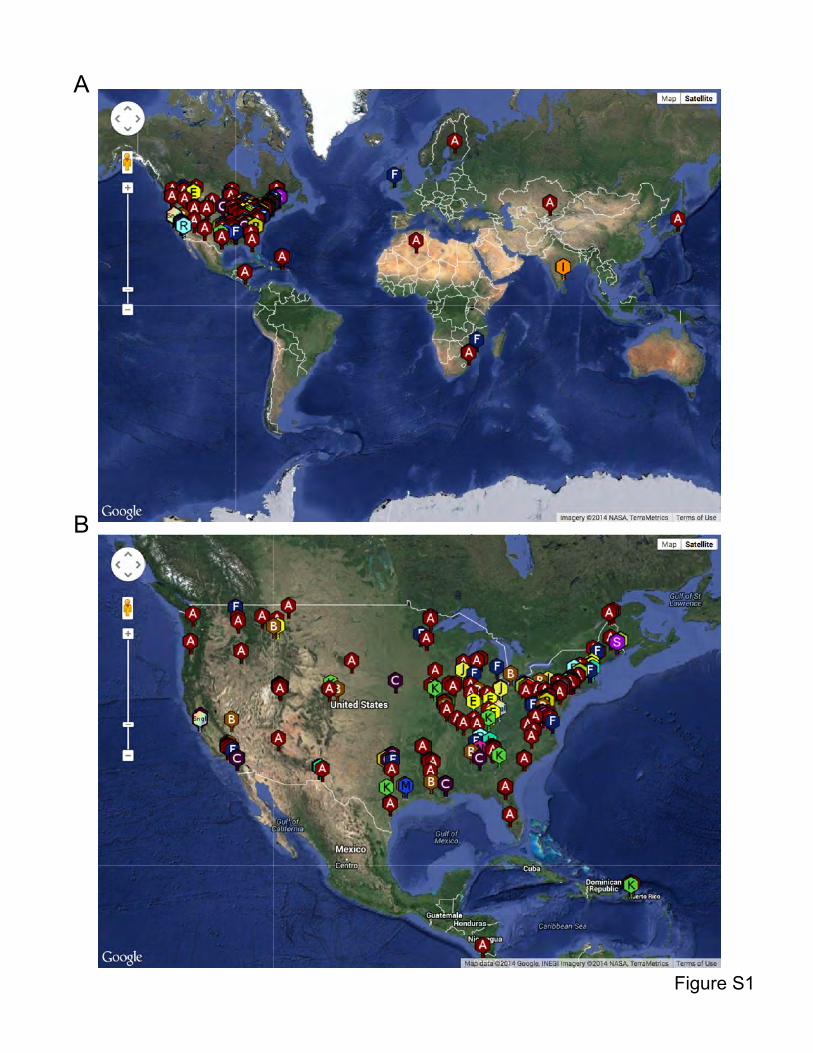
phages were isolated from widely dispersed geographical locations, including nine countries
and 36 of the continental United States (Fig. S1), over a dozen or more years. All are dsDNA
tailed phages (Caudovirales), and are morphologically siphoviral, except cluster C myoviruses.
Most have isometric heads except for singleton MooMoo and the Cluster I and O phages, which
have prolate heads21.
Using previously reported parameters15 the 627 genomes were assembled into 20 clusters (A –
T) and 8 singletons (with no close relatives) with large variations in Cluster sizes (Table 1, Fig.
S2); 11 clusters can be subdivided into 2 to 11 subclusters (Table 1). Clustered phages typically
share genome architectures; for example, Cluster A phages are similar in size, transcriptional
organization, and share an unusual immunity system16,22. A different set of clustering
parameters would generate different profiles, but not alter the core observation that there are
large variations among the different phage types. Cluster designation is simple for some phage
types because of extensive nucleotide similarity (e.g. Cluster C; Fig. S2), and if all clusters
resembled Cluster C, our data would be congruent with the Synechococcus populations 9. But
many do not, revealing more complex relationships.
To compare mycobacteriophage gene contents we grouped related genes into phamilies using
Phamerator23, modified to use kclust24. The 69,633 genes assembled into 5,205 phams of which
1,613 (31%) are orphams14 (single-gene phamilies), and the gene content relationships are
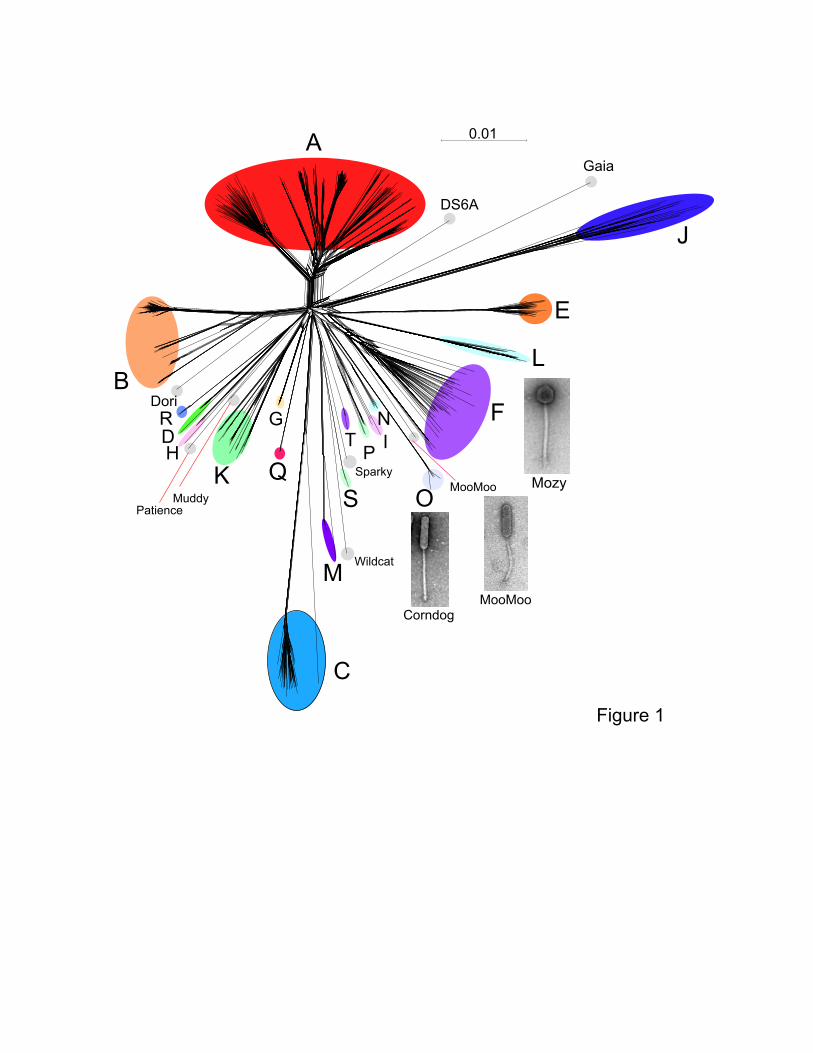
represented as a network phylogeny in Fig. 1. In general, branch lengths provide strong support
for cluster and subcluster designations (Table 1, Fig. S2); the proportions of orphams per
genome provide additional support, which as expected is highest for singletons and single-
5
genome subclusters (Fig. S3). Determination of the proportions of shared genes by pairwise
comparisons reveals the complexity of the genetic relationships (Fig. 2), and three major
features are apparent.
First, the overall phage relationships closely mirror the cluster and subcluster designations
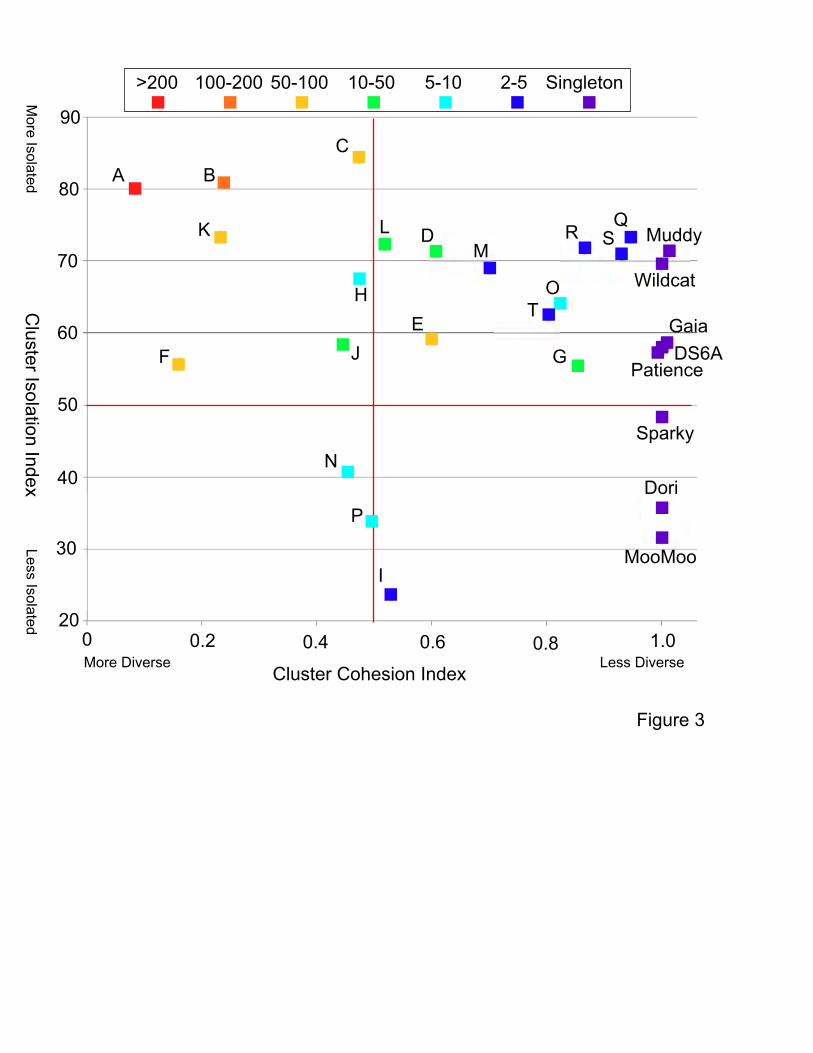
derived by DNA similarities (Fig. S2). Secondly, the intra-cluster and intra-subcluster diversity
varies enormously, and this is quantified as the Cluster Cohesion Index (CCI, average number
of genes/genome divided by the total number of phamilies in the cluster; Table 1, Fig. 3). Thus
in clusters such as Cluster A (CCI, 0.08), the total number of phamilies is vastly greater than the
average number of genes per genome, indicating high diversity. The diversity of the A
subclusters is also highly varied with CCI values ranging from 0.22 to 0.91 (Table S1). In
contrast, Clusters G and O have low diversity (high CCI values) and closely related genomes
(Table 1; Fig. 3).
Thirdly, the degree to which clusters are genetically connected to other phages varies greatly,
and is quantified as the Cluster Isolation Index (CII, the percentage of phamilies not present in
genomes outside of the cluster; Table 1, Fig. 3). Some clusters such as Clusters A, B, C, and Q
share relatively few genes (<25%) with other phages and have high CCI values (Fig. 3). Other
groups, such as Clusters I and P, share >60% of their genes with other phages (Table 1),
reflecting the DNA relationships (Fig. S4). There are therefore no universally applicable values
of either diversity or isolation for different phage groups, and the most striking picture emerging
is one of great diversity with unequal representation of different types (Fig. 3). This is in marked
contrast to the discreet populations reported for Synechococcus phages9.
These comparisons reveal additional complexities arising from highly mosaic genomes (Figs.
S5-S8). For example, Dori is clearly related to Cluster B phages (Fig. 1) with which it shares 20-
6
26% of its genes and limited DNA similarity (Fig. S5), but also has nucleotide similarity and
shares genes with Cluster N and I2 phages, among others (Fig. S5, S7A), as reflected in its low
CII (Table 1, Fig. 3). Likewise, the singleton MooMoo has segments of DNA similarity and
shares ~20% of its genes with Cluster F phages (Fig. 1, S6, S7B), but also has similarity to
Clusters N and I; it also has a low CII (Table 1, Fig. 3). It has low DNA similarity to Cluster O
(Fig. S6), but shares several genes and has the same unusual prolate morphology (Fig. 1).
Complex relationships are also seen in the singletons Gaia and Sparky (Fig. S8).
Bacteriophage taxonomic classification reflecting phylogeny presents substantial challenges
because of genome mosaicism25. Classification by viral morphology is well established, but may
not accurately report the genetic relationships, as observed for the prolate-headed MooMoo
(Fig. 1). We also note that the mycobacteriophage myoviruses have a high CII and form a
discrete group (Table 1) as for the Synechococcus phages9, perhaps reflecting a virulent
lifestyle that constrains productive gene exchange; host range mutability may also differ in
phages with different morphotypes, limiting access to the gene pool. Although grouping phages
into clusters and subclusters provides analytical advantages because of the wide range in
prevalence of the different types (Table 1), it is not suitable as a broadly applicable hierarchical
taxonomic system. Reticulate taxonomies more accurately reflect the phylogenetic
complexities25,26.
Given the sampling ranges of these phages, it seems unlikely that the population profile
reported here is specific for M. smegmatis mc2155 phages and we predict that related profiles
will be found for phages isolated from similar environments using different hosts. However,
phage types occurring rarely in M. smegmatis may be abundant in phylogenetically proximal
hosts, and we predict that phage populations at large – regardless of host – represent a
continuum of complex reticulate relationships. Finally, we predict that the overall diversity of the
7
phage population is in large part a consequence of narrow but mutable viral host ranges, which
promotes local genetic isolation and constrains access to the common gene pool.
METHODS
In addition to extant GenBank sequence information, mycobacteriophages were isolated,
sequenced, and annotated in the Phage Hunters Integrating Research and Education (PHIRE)
or Science Education Alliance Phage Hunters Advancing Genomics and Evolutionary Science
(SEA-PHAGES) programs. All genome sequences are publically available at phagesDB.org or
in GenBank. Nucleotide comparisons used BlastN or Gepard27. To create database
Mykobacteriophage_627, phamilies were constructed by first clustering to an equivalent of 70%
amino acid sequence identity and a 25% size threshold, followed by multiple sequence
alignment using kAlign28. Consensus sequences were extracted using hhmake and
hhconsensus29, and passed through a second iteration of kClust, clustering proteins above a
threshold e-value of 10-4. CCI values were calculated as the average number of genes/genome
divided by the total number of phams in that cluster. Thus if all genomes in a cluster are
identical (and if phamilies occur only once in a genome), CCI would be one; the CCI for two sets
of five randomly chosen genomes is ~0.02. CII is the percentage of phams present within a
cluster that are not present in other mycobacteriophage genomes. Students, faculty and their
contributions to authorship are listed in Table S3.
ACKNOWLEDGEMENTS
This work was supported in part by the Howard Hughes Medical Institute SEA-PHAGES
program, by the Howard Hughes Medical Institute through its Professorship grant to GFH, and
by NIH grant GM51975 to GFH.

8
Author Contributions
Authors and contributions are listed in Table S3.

9
References
1 Pedulla, M. L. et al. Origins of highly mosaic mycobacteriophage genomes. Cell 113, 171-
182 (2003).
2 Hatfull, G. F. & Hendrix, R. W. Bacteriophages and their Genomes. Current Opinions in
Virology 1, 298-303 (2011).
3 Hendrix, R. W., Smith, M. C., Burns, R. N., Ford, M. E. & Hatfull, G. F. Evolutionary
relationships among diverse bacteriophages and prophages: all the world's a phage. Proc
Natl Acad Sci U S A 96, 2192-2197 (1999).
4 Suttle, C. A. Marine viruses--major players in the global ecosystem. Nat Rev Microbiol 5,
801-812 (2007).
5 Krupovic, M. & Bamford, D. H. Order to the viral universe. J Virol 84, 12476-12479,
doi:10.1128/JVI.01489-10 (2010).
6 Jacobs-Sera, D. et al. On the nature of mycobacteriophage diversity and host preference.
Virology 434, 187-201, doi:10.1016/j.virol.2012.09.026 (2012).
7 Buckling, A. & Brockhurst, M. Bacteria-virus coevolution. Adv Exp Med Biol 751, 347-370,
doi:10.1007/978-1-4614-3567-9_16 (2012).
8 Juhala, R. J. et al. Genomic sequences of bacteriophages HK97 and HK022: pervasive
genetic mosaicism in the lambdoid bacteriophages. J Mol Biol 299, 27-51,
doi:10.1006/jmbi.2000.3729 (2000).
9 Deng, L. et al. Viral tagging reveals discrete populations in Synechococcus viral genome
sequence space. Nature 513, 242-245, doi:10.1038/nature13459 (2014).
10 Kwan, T., Liu, J., DuBow, M., Gros, P. & Pelletier, J. The complete genomes and
proteomes of 27 Staphylococcus aureus bacteriophages. Proc Natl Acad Sci U S A 102,
5174-5179 (2005).
11 Kwan, T., Liu, J., Dubow, M., Gros, P. & Pelletier, J. Comparative genomic analysis of 18
Pseudomonas aeruginosa bacteriophages. J Bacteriol 188, 1184-1187 (2006).
10
12 Kropinski, A. M., Sulakvelidze, A., Konczy, P. & Poppe, C. Salmonella phages and
prophages--genomics and practical aspects. Methods Mol Biol 394, 133-175 (2007).
13 Marinelli, L. J. et al. Propionibacterium acnes bacteriophages display limited genetic
diversity and broad killing activity against bacterial skin isolates. MBio 3,
doi:10.1128/mBio.00279-12 (2012).
14 Hatfull, G. F. et al. Comparative genomic analysis of 60 Mycobacteriophage genomes:
genome clustering, gene acquisition, and gene size. J Mol Biol 397, 119-143,
doi:10.1016/j.jmb.2010.01.011 (2010).
15 Hatfull, G. F. et al. Exploring the mycobacteriophage metaproteome: phage genomics as an
educational platform. PLoS Genet 2, e92 (2006).
16 Pope, W. H. et al. Expanding the Diversity of Mycobacteriophages: Insights into Genome
Architecture and Evolution. PLoS ONE 6, e16329 (2011).
17 Hatfull, G. F. et al. Complete genome sequences of 63 mycobacteriophages. Genome
announcements 1, doi:10.1128/genomeA.00847-13 (2013).
18 Hatfull, G. F. et al. Complete genome sequences of 138 mycobacteriophages. J Virol 86,
2382-2384, doi:10.1128/JVI.06870-11 (2012).
19 Hendrix, R. W., Hatfull, G. F. & Smith, M. C. Bacteriophages with tails: chasing their origins
and evolution. Res Microbiol 154, 253-257 (2003).
20 Jordan, T. C. et al. A broadly implementable research course in phage discovery and
genomics for first-year undergraduate students. MBio 5, e01051-01013,
doi:10.1128/mBio.01051-13 (2014).
21 Hatfull, G. F. The secret lives of mycobacteriophages. Adv Virus Res 82, 179-288,
doi:10.1016/B978-0-12-394621-8.00015-7 (2012).
22 Brown, K. L., Sarkis, G. J., Wadsworth, C. & Hatfull, G. F. Transcriptional silencing by the
mycobacteriophage L5 repressor. Embo J 16, 5914-5921, doi:10.1093/emboj/16.19.5914
(1997).

11
23 Cresawn, S. G. et al. Phamerator: a bioinformatic tool for comparative bacteriophage
genomics. BMC Bioinformatics 12, 395, doi:10.1186/1471-2105-12-395 (2011).
24 Hauser, M., Mayer, C. E. & Soding, J. kClust: fast and sensitive clustering of large protein
sequence databases. BMC Bioinformatics 14, 248, doi:10.1186/1471-2105-14-248 (2013).
25 Lawrence, J. G., Hatfull, G. F. & Hendrix, R. W. Imbroglios of viral taxonomy: genetic
exchange and failings of phenetic approaches. J Bacteriol 184, 4891-4905 (2002).
26 Lima-Mendez, G., Toussaint, A. & Leplae, R. Analysis of the phage sequence space: the
benefit of structured information. Virology 365, 241-249 (2007).
27 Krumsiek, J., Arnold, R. & Rattei, T. Gepard: a rapid and sensitive tool for creating dotplots
on genome scale. Bioinformatics 23, 1026-1028 (2007).
28 Lassmann, T. & Sonnhammer, E. L. Kalign--an accurate and fast multiple sequence
alignment algorithm. BMC Bioinformatics 6, 298, doi:10.1186/1471-2105-6-298 (2005).
29 Remmert, M., Biegert, A., Hauser, A. & Soding, J. HHblits: lightning-fast iterative protein
sequence searching by HMM-HMM alignment. Nat Methods 9, 173-175,
doi:10.1038/nmeth.1818 (2012).
30 Huson, D. H. & Bryant, D. Application of phylogenetic networks in evolutionary studies. Mol
Biol Evol 23, 254-267, doi:10.1093/molbev/msj030 (2006).
12
Figure Legends
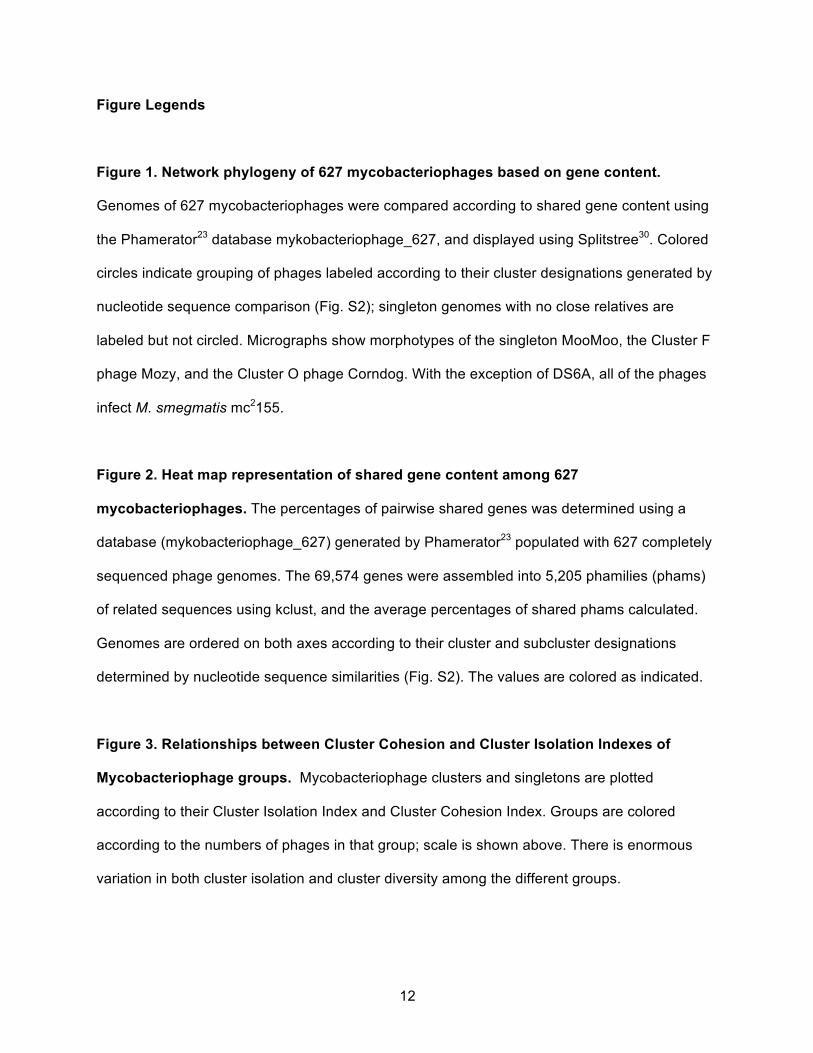
Figure 1. Network phylogeny of 627 mycobacteriophages based on gene content.
Genomes of 627 mycobacteriophages were compared according to shared gene content using
the Phamerator23 database mykobacteriophage_627, and displayed using Splitstree30. Colored
circles indicate grouping of phages labeled according to their cluster designations generated by
nucleotide sequence comparison (Fig. S2); singleton genomes with no close relatives are
labeled but not circled. Micrographs show morphotypes of the singleton MooMoo, the Cluster F
phage Mozy, and the Cluster O phage Corndog. With the exception of DS6A, all of the phages
infect M. smegmatis mc2155.
Figure 2. Heat map representation of shared gene content among 627
mycobacteriophages. The percentages of pairwise shared genes was determined using a
database (mykobacteriophage_627) generated by Phamerator23 populated with 627 completely
sequenced phage genomes. The 69,574 genes were assembled into 5,205 phamilies (phams)
of related sequences using kclust, and the average percentages of shared phams calculated.
Genomes are ordered on both axes according to their cluster and subcluster designations
determined by nucleotide sequence similarities (Fig. S2). The values are colored as indicated.
Figure 3. Relationships between Cluster Cohesion and Cluster Isolation Indexes of
Mycobacteriophage groups. Mycobacteriophage clusters and singletons are plotted
according to their Cluster Isolation Index and Cluster Cohesion Index. Groups are colored
according to the numbers of phages in that group; scale is shown above. There is enormous
variation in both cluster isolation and cluster diversity among the different groups.
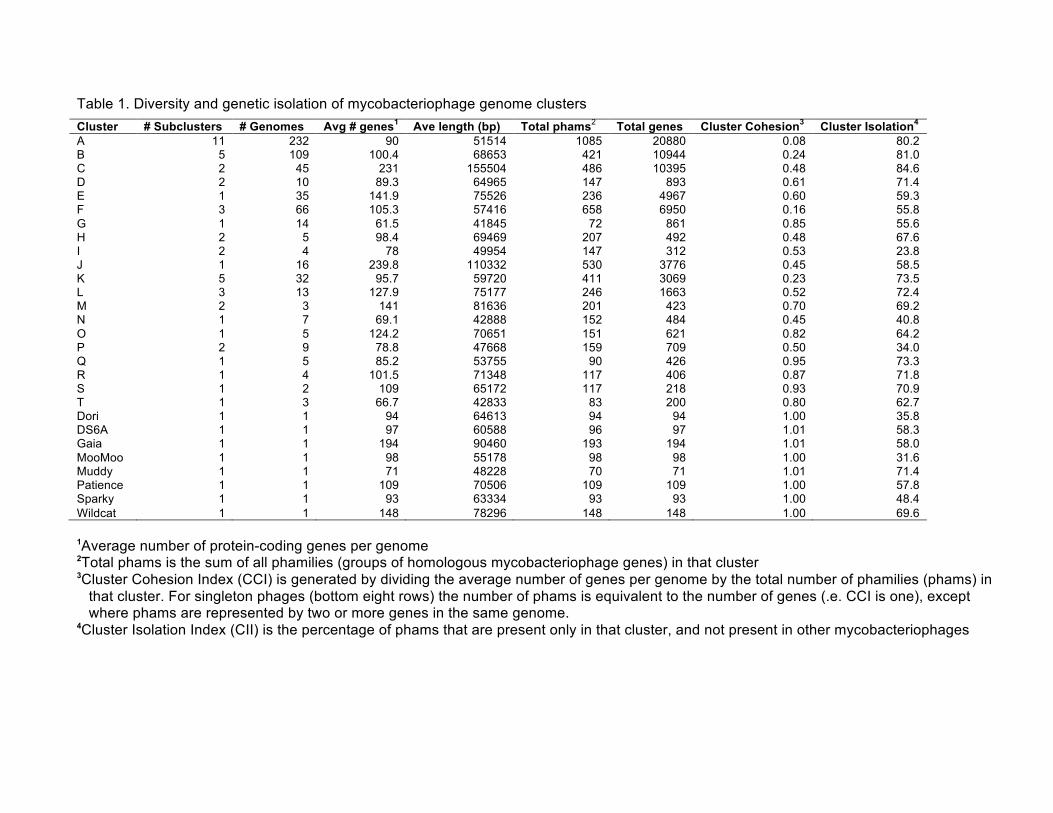
Table 1. Diversity and genetic isolation of mycobacteriophage genome clusters Cluster # Subclusters # Genomes Avg # genes1 Ave length (bp) Total phams2 Total genes Cluster Cohesion3 Cluster Isolation4 A 11 232 90 51514 1085 20880 0.08 80.2 B 5 109 100.4 68653 421 10944 0.24 81.0 C 2 45 231 155504 486 10395 0.48 84.6 D 2 10 89.3 64965 147 893 0.61 71.4 E 1 35 141.9 75526 236 4967 0.60 59.3 F 3 66 105.3 57416 658 6950 0.16 55.8 G 1 14 61.5 41845 72 861 0.85 55.6 H 2 5 98.4 69469 207 492 0.48 67.6 I 2 4 78 49954 147 312 0.53 23.8 J 1 16 239.8 110332 530 3776 0.45 58.5 K 5 32 95.7 59720 411 3069 0.23 73.5 L 3 13 127.9 75177 246 1663 0.52 72.4 M 2 3 141 81636 201 423 0.70 69.2 N 1 7 69.1 42888 152 484 0.45 40.8 O 1 5 124.2 70651 151 621 0.82 64.2 P 2 9 78.8 47668 159 709 0.50 34.0 Q 1 5 85.2 53755 90 426 0.95 73.3 R 1 4 101.5 71348 117 406 0.87 71.8 S 1 2 109 65172 117 218 0.93 70.9 T 1 3 66.7 42833 83 200 0.80 62.7 Dori 1 1 94 64613 94 94 1.00 35.8 DS6A 1 1 97 60588 96 97 1.01 58.3 Gaia 1 1 194 90460 193 194 1.01 58.0 MooMoo 1 1 98 55178 98 98 1.00 31.6 Muddy 1 1 71 48228 70 71 1.01 71.4 Patience 1 1 109 70506 109 109 1.00 57.8 Sparky 1 1 93 63334 93 93 1.00 48.4 Wildcat 1 1 148 78296 148 148 1.00 69.6 1Average number of protein-coding genes per genome
2Total phams is the sum of all phamilies (groups of homologous mycobacteriophage genes) in that cluster
3Cluster Cohesion Index (CCI) is generated by dividing the average number of genes per genome by the total number of phamilies (phams) in that cluster. For singleton phages (bottom eight rows) the number of phams is equivalent to the number of genes (.e. CCI is one), except where phams are represented by two or more genes in the same genome.
4Cluster Isolation Index (CII) is the percentage of phams that are present only in that cluster, and not present in other mycobacteriophages
MMoorrgguusshhii
0.01
M Wildcat
C
Sparky
S O MooMoo
L
FNT IP
Q
G
KMuddy
Patience
RDH
DoriB
A
DS6A
Gaia
J
E
Figure 1
MooMooCorndog
Mozy
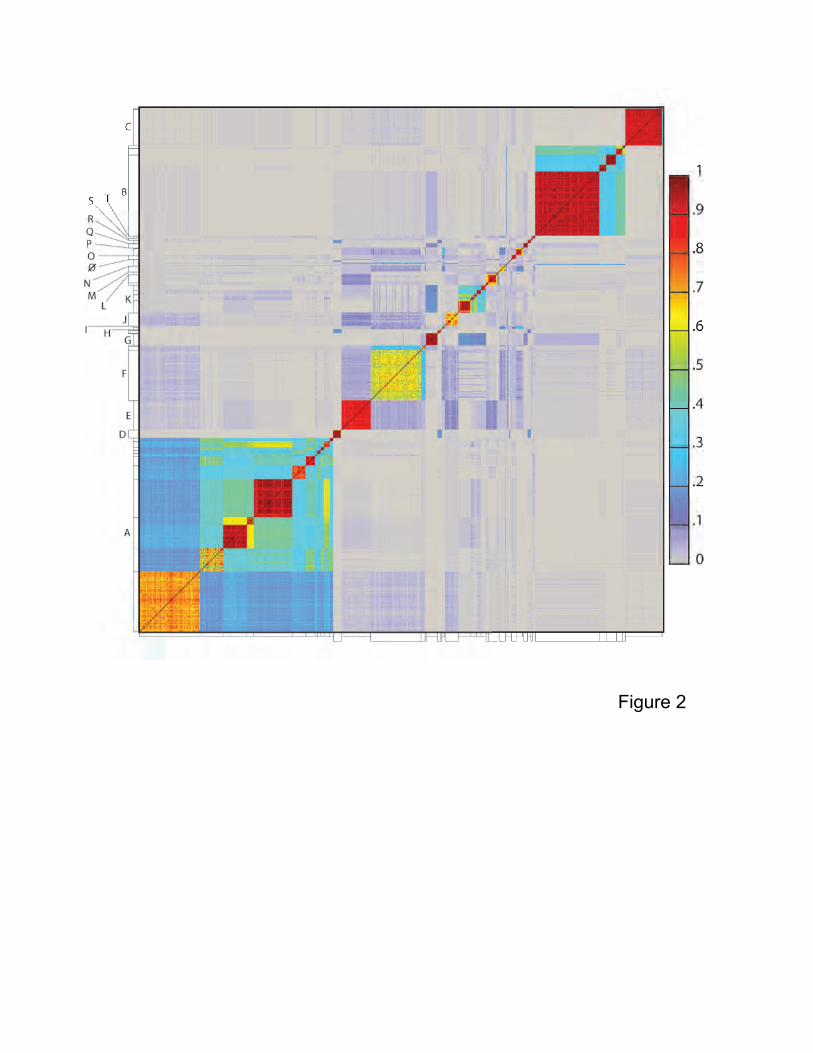
Figure 2
A BC
K
F
N
P
I
J
H
L DM
E
OT
R SQ
G
ClusterIsolation
IndexM
oreIsolated
LessIsolated
Cluster Cohesion IndexLess DiverseMore Diverse
0 0.2 0.4 0.6 0.8 1.020
30
40
50
60
70
80
90
Wildcat
Muddy
MooMoo
Dori
Sparky
GaiaDS6A
Patience
>200 100-200 50-100 10-50 5-10 2-5 Singleton
Figure 3

SUPPLEMENTARY DATA
Supplementary Tables
Table S1. Phages used in this study and their cluster designation
Table S2. Genometrics and Cluster Cohesion Index of mycobacteriophages.
Supplementary Figures
Figure S1. Geographical distribution of sequenced mycobacteriophages. (A) Locations of
sequenced mycobacteriophages across the globe. (B) Locations of sequenced
mycobacteriophages across the United States. Data from www.phagesDB.org.
Figure S2. Nucleotide sequence comparison of 627 mycobacteriophages displayed as a
dotplot. Complete genome sequences of 627 mycobacteriophages were concatenated into a
single file and compared with itself using Gepard1 and displayed as a dotplot. The order of the
genomes is as listed in Table S1. Nucleotide similarity is a primary component in assembling
phages into Clusters, which typically requires evident DNA similarity spanning more than 50% of
the genome lengths.
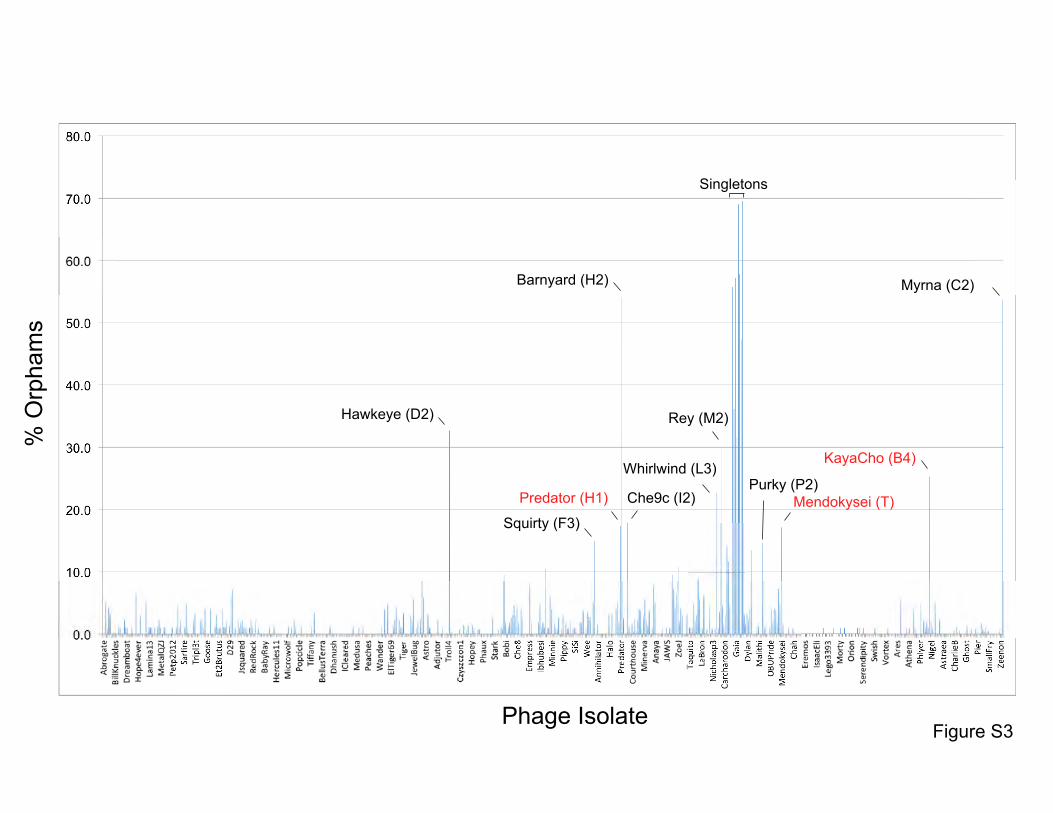
Figure S3. Proportions of orphams in mycobacteriophage genomes. The proportions of
genes that are orphams (i.e. single-gene phamilies with no homologues within the
mycobacteriophage dataset) are shown for each phage. The order of the phages is as shown in
Table S1. All of the singleton genomes have >30% orphams, and most of the other genomes
with relatively high proportions of orphams are the single-genome subclusters (see Table S2)
including Hawkeye (D2), Myrna (C2), Squirty (F3), Barnyard (H2), Che9c (I2), Whirlwind (L3),
Rey (M2), and Purky (P2). Three phages shown in red type are not singletons or single-
genome subclusters but have relatively high proportion of orphams. Predator and Menkokysei
are members of the diverse and small clusters (5 or fewer genomes) H, and T respectively;
KayaCho is a member of Subcluster B4 but has a sufficiently high proportion of orphams to
arguably warrant formation of a new subcluster, B6.
Figure S4. Dotplot of phages in Clusters I, N, P and the singleton Sparky. Dotplot was
generated using a concatenated file of genome sequences using Gepard1. The complexity of
the genome relationships is illustrated by the Cluster I phages which share varying degrees of
similarity to phages in Clusters N and P, as well as the singleton Sparky. Because inclusion of
a phage in a cluster typically requires sharing a span of similarity over half of the genome
lengths, these phages are not assembled into a single larger cluster.
Figure S5. Dotplot of Carcharodon, Che9c, Kheth and Dori. The dotplot of concatenated
genome sequences illustrates the ambiguity of whether the singleton Dori warrants inclusion in
Cluster B. Dori shares DNA sequence similarity with its closest relative Kheth (Subcluster B2),
but it does not span 50% of the genome lengths. Dori also share DNA sequence similarity with
Che9c (Cluster I2) and Carcharodon (Cluster N).
Figure S6. Dotplot of Corndog, Brujita, SG4, Yoshi, and MooMoo. The dotplot of
concatenated genome sequences illustrates the complex relationships between the singleton
MooMoo and other phages. MooMoo shares DNA sequence similarity with SG4 (Subcluster F1)
and Yoshi (Subcluster F2), but also with Brujita (Subcluster I1). MooMoo has barely detectable
DNA sequence similarity with Corndog (Cluster O), but has a similar prolate virion morphology.
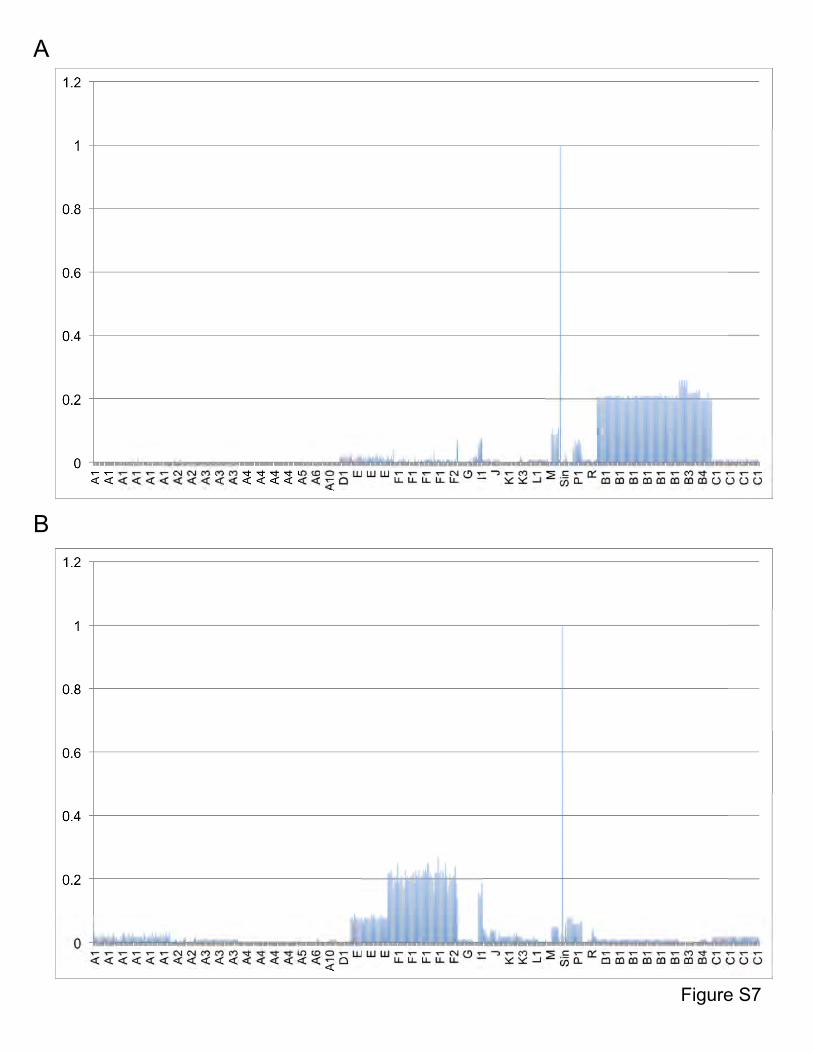
Figure S7. Shared gene content between Dori, MooMoo, and other mycobacteriophages.
A. Average percentages of genes shared between Dori and other mycobacteriophages. B.
Average percentages of genes shared between MooMoo and other mycobacteriophages.
Genomes on the x axis are listed in the same order as in Table S1 and the cluster designations
are indicated.
Figure S8. Shared gene content between Gaia, Sparky, and other mycobacteriophages.
A. Average percentages of genes shared between Gaia and other mycobacteriophages. B.
Average percentages of genes shared between Sparky and other mycobacteriophages.
Genomes on the x axis are listed in the same order as in Table S1 and the cluster designations
are indicated.
References
1 Krumsiek, J., Arnold, R. & Rattei, T. Gepard: a rapid and sensitive tool for creating dotplots
on genome scale. Bioinformatics 23, 1026-1028 (2007).
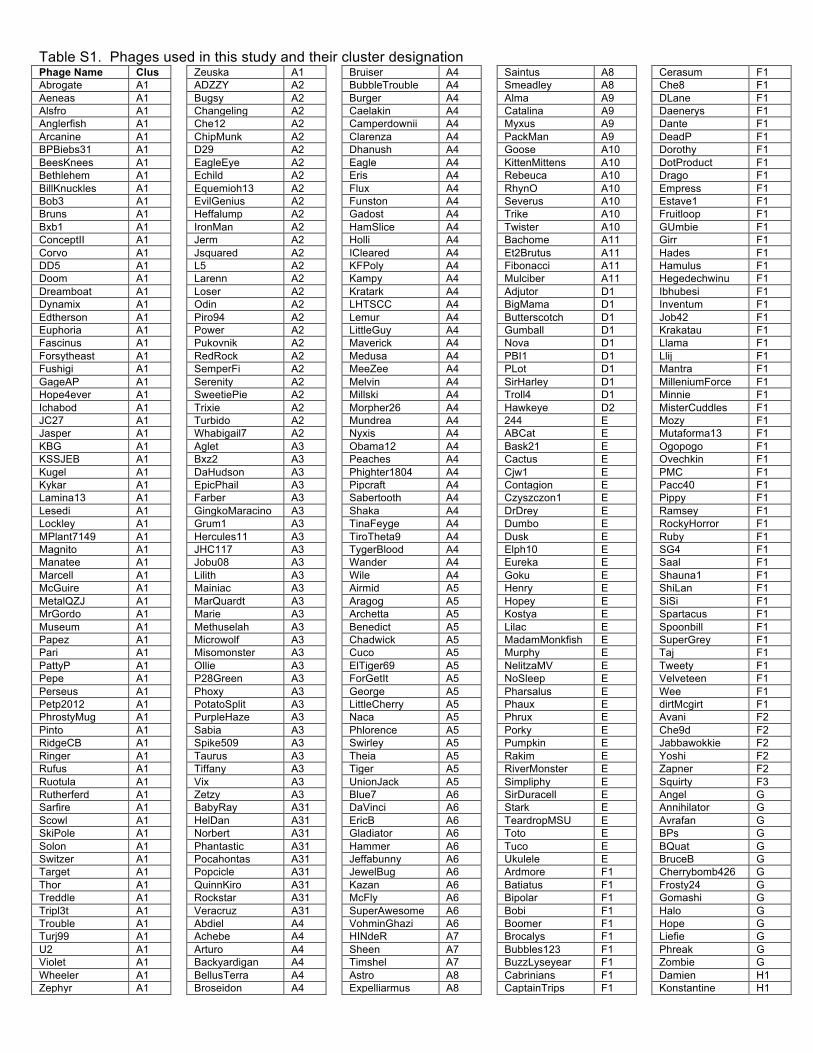
Table S1. Phages used in this study and their cluster designation Phage Name Clus Abrogate A1 Aeneas A1 Alsfro A1 Anglerfish A1 Arcanine A1 BPBiebs31 A1 BeesKnees A1 Bethlehem A1 BillKnuckles A1 Bob3 A1 Bruns A1 Bxb1 A1 ConceptII A1 Corvo A1 DD5 A1 Doom A1 Dreamboat A1 Dynamix A1 Edtherson A1 Euphoria A1 Fascinus A1 Forsytheast A1 Fushigi A1 GageAP A1 Hope4ever A1 Ichabod A1 JC27 A1 Jasper A1 KBG A1 KSSJEB A1 Kugel A1 Kykar A1 Lamina13 A1 Lesedi A1 Lockley A1 MPlant7149 A1 Magnito A1 Manatee A1 Marcell A1 McGuire A1 MetalQZJ A1 MrGordo A1 Museum A1 Papez A1 Pari A1 PattyP A1 Pepe A1 Perseus A1 Petp2012 A1 PhrostyMug A1 Pinto A1 RidgeCB A1 Ringer A1 Rufus A1 Ruotula A1 Rutherferd A1 Sarfire A1 Scowl A1 SkiPole A1 Solon A1 Switzer A1 Target A1 Thor A1 Treddle A1 Tripl3t A1 Trouble A1 Turj99 A1 U2 A1 Violet A1 Wheeler A1 Zephyr A1
Zeuska A1 ADZZY A2 Bugsy A2 Changeling A2 Che12 A2 ChipMunk A2 D29 A2 EagleEye A2 Echild A2 Equemioh13 A2 EvilGenius A2 Heffalump A2 IronMan A2 Jerm A2 Jsquared A2 L5 A2 Larenn A2 Loser A2 Odin A2 Piro94 A2 Power A2 Pukovnik A2 RedRock A2 SemperFi A2 Serenity A2 SweetiePie A2 Trixie A2 Turbido A2 Whabigail7 A2 Aglet A3 Bxz2 A3 DaHudson A3 EpicPhail A3 Farber A3 GingkoMaracino A3 Grum1 A3 Hercules11 A3 JHC117 A3 Jobu08 A3 Lilith A3 Mainiac A3 MarQuardt A3 Marie A3 Methuselah A3 Microwolf A3 Misomonster A3 Ollie A3 P28Green A3 Phoxy A3 PotatoSplit A3 PurpleHaze A3 Sabia A3 Spike509 A3 Taurus A3 Tiffany A3 Vix A3 Zetzy A3 BabyRay A31 HelDan A31 Norbert A31 Phantastic A31 Pocahontas A31 Popcicle A31 QuinnKiro A31 Rockstar A31 Veracruz A31 Abdiel A4 Achebe A4 Arturo A4 Backyardigan A4 BellusTerra A4 Broseidon A4
Bruiser A4 BubbleTrouble A4 Burger A4 Caelakin A4 Camperdownii A4 Clarenza A4 Dhanush A4 Eagle A4 Eris A4 Flux A4 Funston A4 Gadost A4 HamSlice A4 Holli A4 ICleared A4 KFPoly A4 Kampy A4 Kratark A4 LHTSCC A4 Lemur A4 LittleGuy A4 Maverick A4 Medusa A4 MeeZee A4 Melvin A4 Millski A4 Morpher26 A4 Mundrea A4 Nyxis A4 Obama12 A4 Peaches A4 Phighter1804 A4 Pipcraft A4 Sabertooth A4 Shaka A4 TinaFeyge A4 TiroTheta9 A4 TygerBlood A4 Wander A4 Wile A4 Airmid A5 Aragog A5 Archetta A5 Benedict A5 Chadwick A5 Cuco A5 ElTiger69 A5 ForGetIt A5 George A5 LittleCherry A5 Naca A5 Phlorence A5 Swirley A5 Theia A5 Tiger A5 UnionJack A5 Blue7 A6 DaVinci A6 EricB A6 Gladiator A6 Hammer A6 Jeffabunny A6 JewelBug A6 Kazan A6 McFly A6 SuperAwesome A6 VohminGhazi A6 HINdeR A7 Sheen A7 Timshel A7 Astro A8 Expelliarmus A8
Saintus A8 Smeadley A8 Alma A9 Catalina A9 Myxus A9 PackMan A9 Goose A10 KittenMittens A10 Rebeuca A10 RhynO A10 Severus A10 Trike A10 Twister A10 Bachome A11 Et2Brutus A11 Fibonacci A11 Mulciber A11 Adjutor D1 BigMama D1 Butterscotch D1 Gumball D1 Nova D1 PBI1 D1 PLot D1 SirHarley D1 Troll4 D1 Hawkeye D2 244 E ABCat E Bask21 E Cactus E Cjw1 E Contagion E Czyszczon1 E DrDrey E Dumbo E Dusk E Elph10 E Eureka E Goku E Henry E Hopey E Kostya E Lilac E MadamMonkfish E Murphy E NelitzaMV E NoSleep E Pharsalus E Phaux E Phrux E Porky E Pumpkin E Rakim E RiverMonster E Simpliphy E SirDuracell E Stark E TeardropMSU E Toto E Tuco E Ukulele E Ardmore F1 Batiatus F1 Bipolar F1 Bobi F1 Boomer F1 Brocalys F1 Bubbles123 F1 BuzzLyseyear F1 Cabrinians F1 CaptainTrips F1
Cerasum F1 Che8 F1 DLane F1 Daenerys F1 Dante F1 DeadP F1 Dorothy F1 DotProduct F1 Drago F1 Empress F1 Estave1 F1 Fruitloop F1 GUmbie F1 Girr F1 Hades F1 Hamulus F1 Hegedechwinu F1 Ibhubesi F1 Inventum F1 Job42 F1 Krakatau F1 Llama F1 Llij F1 Mantra F1 MilleniumForce F1 Minnie F1 MisterCuddles F1 Mozy F1 Mutaforma13 F1 Ogopogo F1 Ovechkin F1 PMC F1 Pacc40 F1 Pippy F1 Ramsey F1 RockyHorror F1 Ruby F1 SG4 F1 Saal F1 Shauna1 F1 ShiLan F1 SiSi F1 Spartacus F1 Spoonbill F1 SuperGrey F1 Taj F1 Tweety F1 Velveteen F1 Wee F1 dirtMcgirt F1 Avani F2 Che9d F2 Jabbawokkie F2 Yoshi F2 Zapner F2 Squirty F3 Angel G Annihilator G Avrafan G BPs G BQuat G BruceB G Cherrybomb426 G Frosty24 G Gomashi G Halo G Hope G Liefie G Phreak G Zombie G Damien H1 Konstantine H1
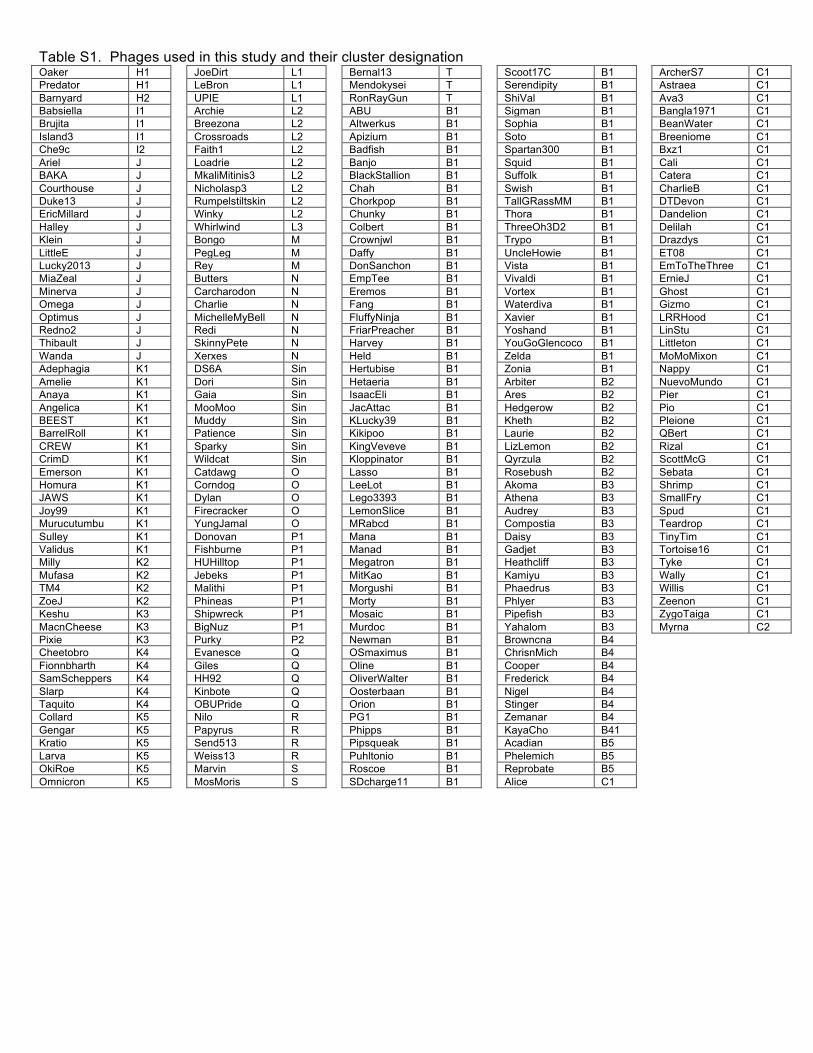
Table S1. Phages used in this study and their cluster designation Oaker H1 Predator H1 Barnyard H2 Babsiella I1 Brujita I1 Island3 I1 Che9c I2 Ariel J BAKA J Courthouse J Duke13 J EricMillard J Halley J Klein J LittleE J Lucky2013 J MiaZeal J Minerva J Omega J Optimus J Redno2 J Thibault J Wanda J Adephagia K1 Amelie K1 Anaya K1 Angelica K1 BEEST K1 BarrelRoll K1 CREW K1 CrimD K1 Emerson K1 Homura K1 JAWS K1 Joy99 K1 Murucutumbu K1 Sulley K1 Validus K1 Milly K2 Mufasa K2 TM4 K2 ZoeJ K2 Keshu K3 MacnCheese K3 Pixie K3 Cheetobro K4 Fionnbharth K4 SamScheppers K4 Slarp K4 Taquito K4 Collard K5 Gengar K5 Kratio K5 Larva K5 OkiRoe K5 Omnicron K5
JoeDirt L1 LeBron L1 UPIE L1 Archie L2 Breezona L2 Crossroads L2 Faith1 L2 Loadrie L2 MkaliMitinis3 L2 Nicholasp3 L2 Rumpelstiltskin L2 Winky L2 Whirlwind L3 Bongo M PegLeg M Rey M Butters N Carcharodon N Charlie N MichelleMyBell N Redi N SkinnyPete N Xerxes N DS6A Sin Dori Sin Gaia Sin MooMoo Sin Muddy Sin Patience Sin Sparky Sin Wildcat Sin Catdawg O Corndog O Dylan O Firecracker O YungJamal O Donovan P1 Fishburne P1 HUHilltop P1 Jebeks P1 Malithi P1 Phineas P1 Shipwreck P1 BigNuz P1 Purky P2 Evanesce Q Giles Q HH92 Q Kinbote Q OBUPride Q Nilo R Papyrus R Send513 R Weiss13 R Marvin S MosMoris S
Bernal13 T Mendokysei T RonRayGun T ABU B1 Altwerkus B1 Apizium B1 Badfish B1 Banjo B1 BlackStallion B1 Chah B1 Chorkpop B1 Chunky B1 Colbert B1 Crownjwl B1 Daffy B1 DonSanchon B1 EmpTee B1 Eremos B1 Fang B1 FluffyNinja B1 FriarPreacher B1 Harvey B1 Held B1 Hertubise B1 Hetaeria B1 IsaacEli B1 JacAttac B1 KLucky39 B1 Kikipoo B1 KingVeveve B1 Kloppinator B1 Lasso B1 LeeLot B1 Lego3393 B1 LemonSlice B1 MRabcd B1 Mana B1 Manad B1 Megatron B1 MitKao B1 Morgushi B1 Morty B1 Mosaic B1 Murdoc B1 Newman B1 OSmaximus B1 Oline B1 OliverWalter B1 Oosterbaan B1 Orion B1 PG1 B1 Phipps B1 Pipsqueak B1 Puhltonio B1 Roscoe B1 SDcharge11 B1
Scoot17C B1 Serendipity B1 ShiVal B1 Sigman B1 Sophia B1 Soto B1 Spartan300 B1 Squid B1 Suffolk B1 Swish B1 TallGRassMM B1 Thora B1 ThreeOh3D2 B1 Trypo B1 UncleHowie B1 Vista B1 Vivaldi B1 Vortex B1 Waterdiva B1 Xavier B1 Yoshand B1 YouGoGlencoco B1 Zelda B1 Zonia B1 Arbiter B2 Ares B2 Hedgerow B2 Kheth B2 Laurie B2 LizLemon B2 Qyrzula B2 Rosebush B2 Akoma B3 Athena B3 Audrey B3 Compostia B3 Daisy B3 Gadjet B3 Heathcliff B3 Kamiyu B3 Phaedrus B3 Phlyer B3 Pipefish B3 Yahalom B3 Browncna B4 ChrisnMich B4 Cooper B4 Frederick B4 Nigel B4 Stinger B4 Zemanar B4 KayaCho B41 Acadian B5 Phelemich B5 Reprobate B5 Alice C1
ArcherS7 C1 Astraea C1 Ava3 C1 Bangla1971 C1 BeanWater C1 Breeniome C1 Bxz1 C1 Cali C1 Catera C1 CharlieB C1 DTDevon C1 Dandelion C1 Delilah C1 Drazdys C1 ET08 C1 EmToTheThree C1 ErnieJ C1 Ghost C1 Gizmo C1 LRRHood C1 LinStu C1 Littleton C1 MoMoMixon C1 Nappy C1 NuevoMundo C1 Pier C1 Pio C1 Pleione C1 QBert C1 Rizal C1 ScottMcG C1 Sebata C1 Shrimp C1 SmallFry C1 Spud C1 Teardrop C1 TinyTim C1 Tortoise16 C1 Tyke C1 Wally C1 Willis C1 Zeenon C1 ZygoTaiga C1 Myrna C2
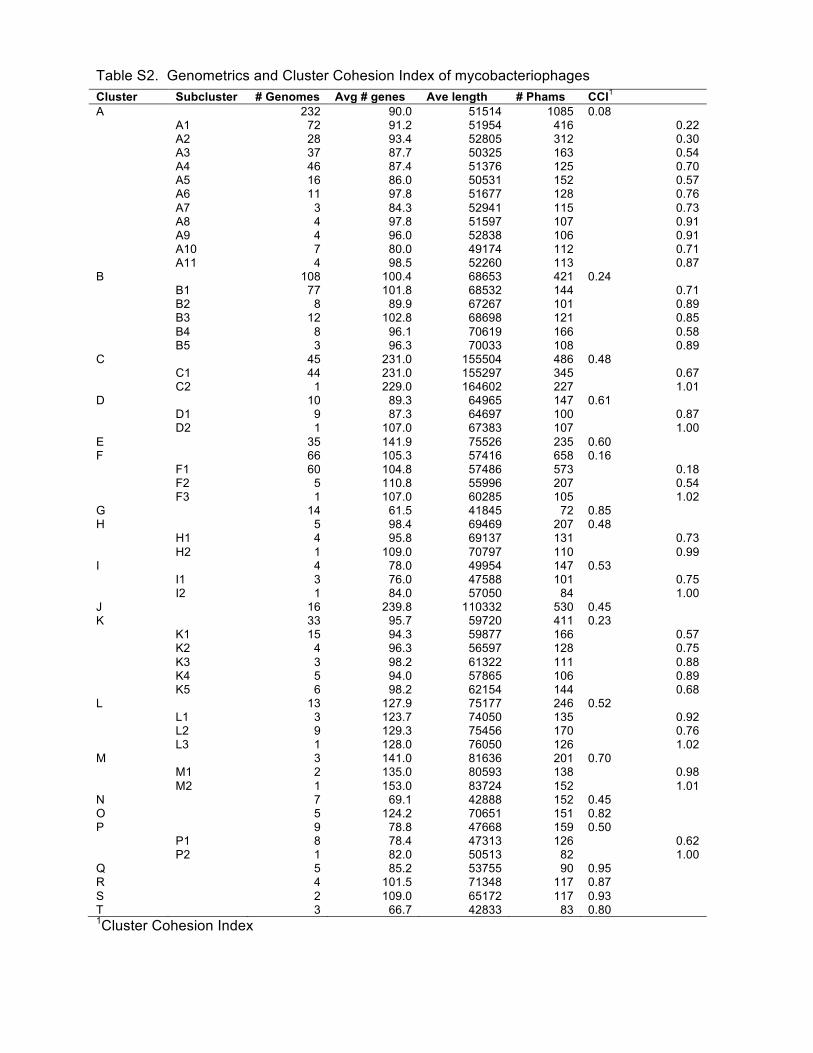
Table S2. Genometrics and Cluster Cohesion Index of mycobacteriophages Cluster Subcluster # Genomes Avg # genes Ave length # Phams CCI1 A 232 90.0 51514 1085 0.08 A1 72 91.2 51954 416 0.22 A2 28 93.4 52805 312 0.30 A3 37 87.7 50325 163 0.54 A4 46 87.4 51376 125 0.70 A5 16 86.0 50531 152 0.57 A6 11 97.8 51677 128 0.76 A7 3 84.3 52941 115 0.73 A8 4 97.8 51597 107 0.91 A9 4 96.0 52838 106 0.91 A10 7 80.0 49174 112 0.71 A11 4 98.5 52260 113 0.87 B 108 100.4 68653 421 0.24 B1 77 101.8 68532 144 0.71 B2 8 89.9 67267 101 0.89 B3 12 102.8 68698 121 0.85 B4 8 96.1 70619 166 0.58 B5 3 96.3 70033 108 0.89 C 45 231.0 155504 486 0.48 C1 44 231.0 155297 345 0.67 C2 1 229.0 164602 227 1.01 D 10 89.3 64965 147 0.61 D1 9 87.3 64697 100 0.87 D2 1 107.0 67383 107 1.00 E 35 141.9 75526 235 0.60 F 66 105.3 57416 658 0.16 F1 60 104.8 57486 573 0.18 F2 5 110.8 55996 207 0.54 F3 1 107.0 60285 105 1.02 G 14 61.5 41845 72 0.85 H 5 98.4 69469 207 0.48 H1 4 95.8 69137 131 0.73 H2 1 109.0 70797 110 0.99 I 4 78.0 49954 147 0.53 I1 3 76.0 47588 101 0.75 I2 1 84.0 57050 84 1.00 J 16 239.8 110332 530 0.45 K 33 95.7 59720 411 0.23 K1 15 94.3 59877 166 0.57 K2 4 96.3 56597 128 0.75 K3 3 98.2 61322 111 0.88 K4 5 94.0 57865 106 0.89 K5 6 98.2 62154 144 0.68 L 13 127.9 75177 246 0.52 L1 3 123.7 74050 135 0.92 L2 9 129.3 75456 170 0.76 L3 1 128.0 76050 126 1.02 M 3 141.0 81636 201 0.70 M1 2 135.0 80593 138 0.98 M2 1 153.0 83724 152 1.01 N 7 69.1 42888 152 0.45 O 5 124.2 70651 151 0.82 P 9 78.8 47668 159 0.50 P1 8 78.4 47313 126 0.62 P2 1 82.0 50513 82 1.00 Q 5 85.2 53755 90 0.95 R 4 101.5 71348 117 0.87 S 2 109.0 65172 117 0.93 T 3 66.7 42833 83 0.80 1Cluster Cohesion Index
A
B
Figure S1
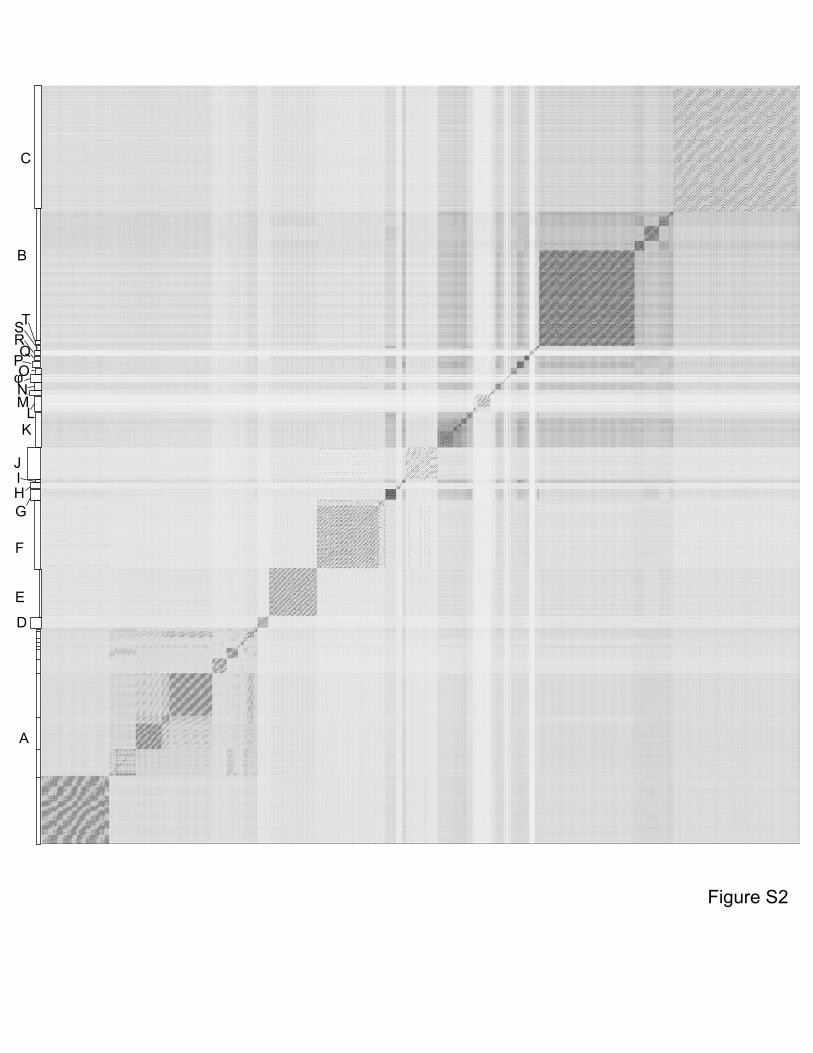
Figure S2
A
D
E
F
G
J
KL
B
C
MN
HI
OPQRST
φ
Barnyard (H2)
Singletons
Myrna (C2)
KayaCho (B4)
Hawkeye (D2) Rey (M2)
Whirlwind (L3)
Che9c (I2)
Squirty (F3)
Predator (H1) Mendokysei (T)
Phage Isolate
%O
rpha
ms
Figure S3
Purky (P2)
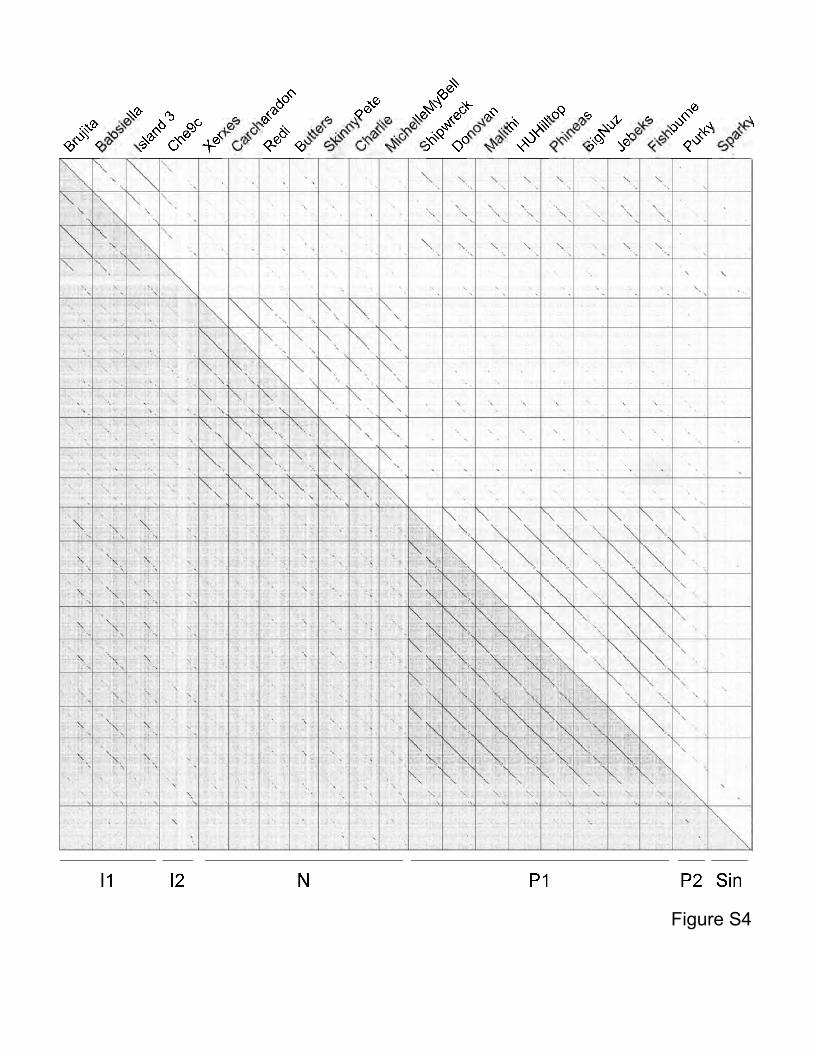
Figure S4

Carcharodon Che9c Kheth Dori
Carcharodon
Che9c
Kheth
Dori
N I2 B2 Singleton
Figure S5

MooMooCorndog Brujita SG4 Yoshi
MooM
ooC
orndogB
rujitaS
G4
Yoshi
O I1 F2 SingletonF1
Figure S6
A
B
Figure S7

A
B
Figure S8