ph measurement and control opportunities
TRANSCRIPT

Standards
Certification
Education & Training
Publishing
Conferences & Exhibits 1
pH Measurement and Control Opportunities
22
Presenter
– Greg is a retired Senior Fellow from Solutia/Monsanto and an ISA Fellow. Greg was an adjunct professor in the Washington University Saint Louis Chemical Engineering Department 2001-2004. Presently, Greg contracts as a consultant in DeltaV R&D via CDI Process & Industrial and is a part time employee of Experitec and MYNAH. Greg received the ISA “Kermit Fischer Environmental” Award for pH control in 1991, the Control Magazine “Engineer of the Year” Award for the Process Industry in 1994, was inducted into the Control “Process Automation Hall of Fame” in 2001, was honored by InTech Magazine in 2003 as one of the most influential innovators in automation, and received the ISA Life Achievement Award in 2010. Greg is the author of numerous books on process control, his most recent being Advanced Temperature Measurement and Control.Greg has been the monthly “Control Talk” columnist for Controlmagazine since 2002. Greg’s expertise is available on the web site: http://www.modelingandcontrol.com/
3
Food is burning in the operators’ kitchenThe only loop mode configured is manualAn operator puts his fist through the screenYou trip over a pile of used pH electrodes The technicians ask: “what is a positioner?”The technicians stick electrodes up your noseThe environmental engineer is wearing a maskThe plant manager leaves the countryLawyers pull the plugs on the consolesThe president is on the phone holding for you
Top Ten Signs of a Rough pH Startup
4
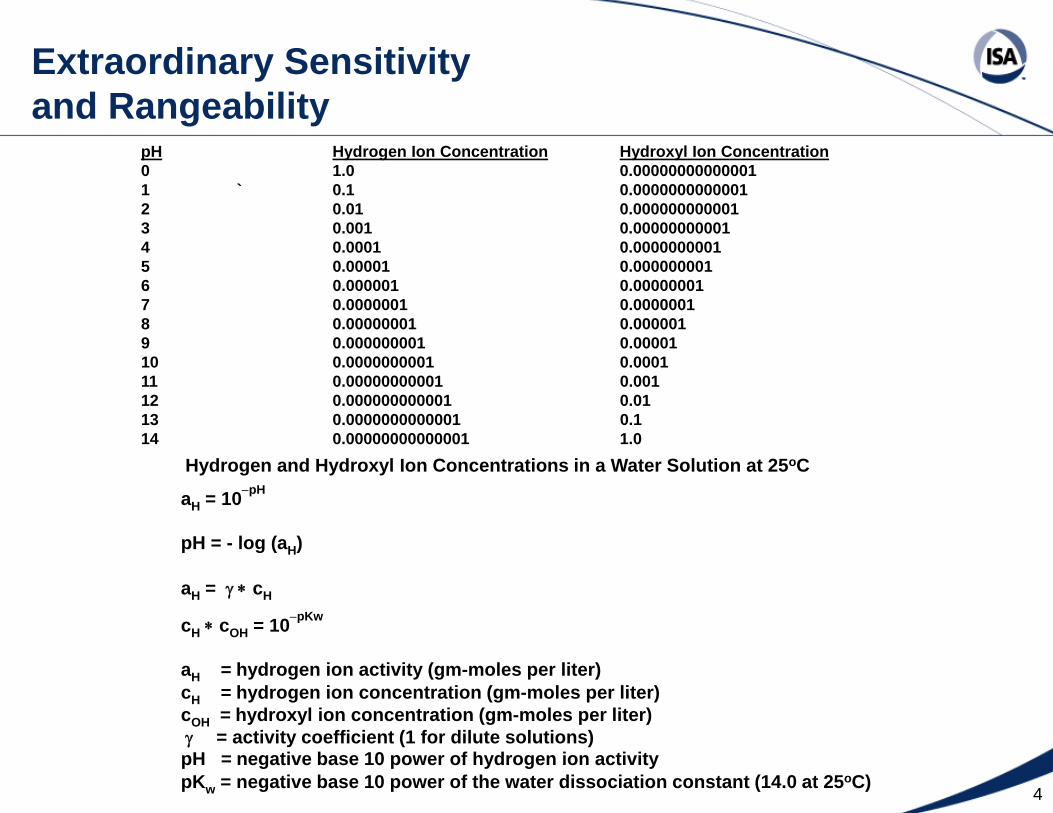
pH Hydrogen Ion Concentration Hydroxyl Ion Concentration0 1.0 0.000000000000011 ` 0.1 0.00000000000012 0.01 0.0000000000013 0.001 0.000000000014 0.0001 0.00000000015 0.00001 0.0000000016 0.000001 0.000000017 0.0000001 0.00000018 0.00000001 0.0000019 0.000000001 0.0000110 0.0000000001 0.000111 0.00000000001 0.00112 0.000000000001 0.0113 0.0000000000001 0.114 0.00000000000001 1.0
aH = 10−pH
pH = - log (aH)
aH = γ ∗ cH
cH ∗ cOH = 10−pKw
aH = hydrogen ion activity (gm-moles per liter)cH = hydrogen ion concentration (gm-moles per liter)cOH = hydroxyl ion concentration (gm-moles per liter)γ = activity coefficient (1 for dilute solutions)pH = negative base 10 power of hydrogen ion activitypKw = negative base 10 power of the water dissociation constant (14.0 at 25oC)
Hydrogen and Hydroxyl Ion Concentrations in a Water Solution at 25oC
Extraordinary Sensitivity and Rangeability
5
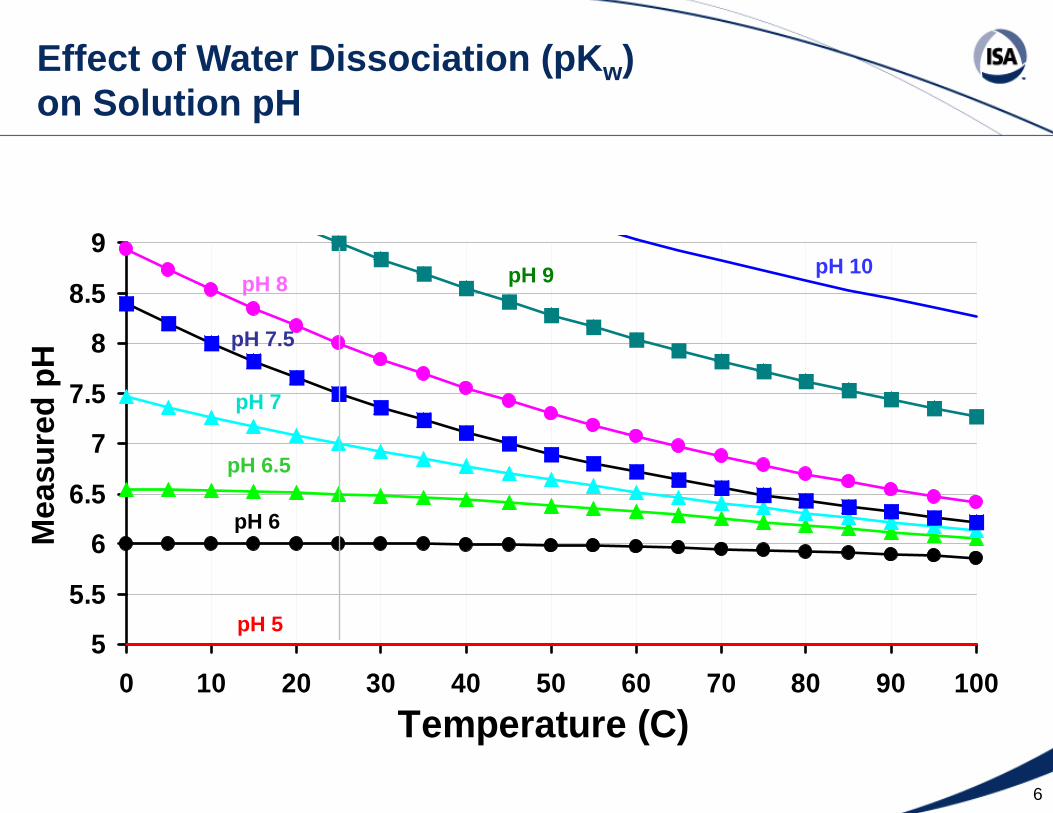
Effect of Temperature on Water Dissociation (pKw)
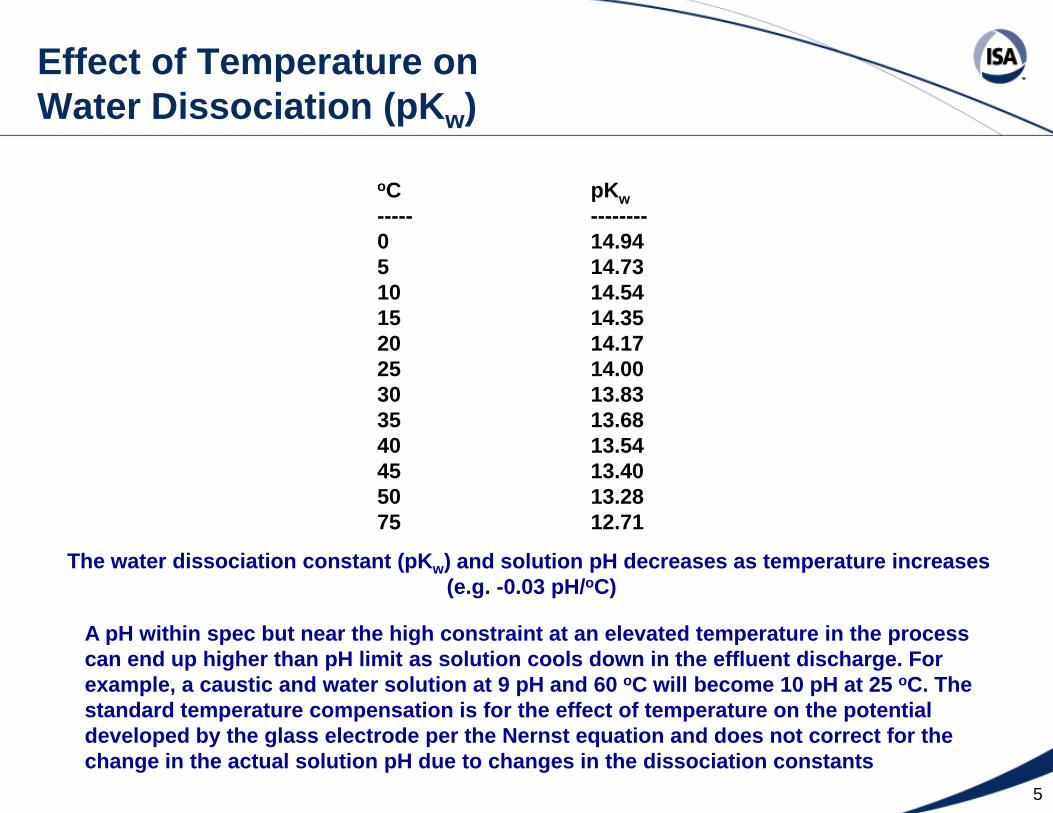
oC pKw----- --------0 14.945 14.7310 14.5415 14.3520 14.1725 14.0030 13.8335 13.6840 13.5445 13.4050 13.2875 12.71
The water dissociation constant (pKw) and solution pH decreases as temperature increases (e.g. -0.03 pH/oC)
A pH within spec but near the high constraint at an elevated temperature in the process can end up higher than pH limit as solution cools down in the effluent discharge. For example, a caustic and water solution at 9 pH and 60 oC will become 10 pH at 25 oC. The standard temperature compensation is for the effect of temperature on the potential developed by the glass electrode per the Nernst equation and does not correct for the change in the actual solution pH due to changes in the dissociation constants
6
Mea
sure
d pH
5
5.5
6
6.5
7
7.5
8
8.5
9
0 10 20 30 40 50 60 70 80 90 100Temperature (C)
pH 5
pH 6
pH 6.5
pH 7
pH 7.5
pH 9 pH 10pH 8
Effect of Water Dissociation (pKw) on Solution pH

7
Hidden Assumptions in Nernst Equation
For the interior and exteriors surface of the pH glass electrode:
E1 = Kg1 + 0.1984∗(T+ 273.16)∗[log (a1) – log (ag1)] (4-1c)
E2 = Kg2 + 0.1984∗(T + 273.16)∗[log (a2) – log (ag2)] (4-1e)
If parameters are identical for inner and outer gel layers (Kg1 = Kg2), then:
E1 – E2 = 0.1984∗(T + 273.16)∗[log (a1) – log (ag1) + log (ag2) – log (a2)] (4-1f)
If activities are identical for inner and outer gel layers (ag1 = ag2), then:
E1 – E2 = 0.1984∗(T + 273.16)∗[log (a1) – log (a2)] (4-1g)
Since pH1 = – log (a1) for external process and pH2 = – log (a2) for internal electrolyte:
E1 – E2 = 0.1984∗(T + 273.16)∗(pH2 – pH1) (4-1h)
We end up with equation seen if the internal buffer of the glass electrode is 7 pH:
E1 – E2 = 0.1984∗(T + 273.16)∗(7 − pH1) (4-1i)
8
11
10
9
8
7
6
5
4
3
pH
Reagent / Influent Ratio
14
12
10
8
6
4
2
0
pH
Reagent / Influent Ratio
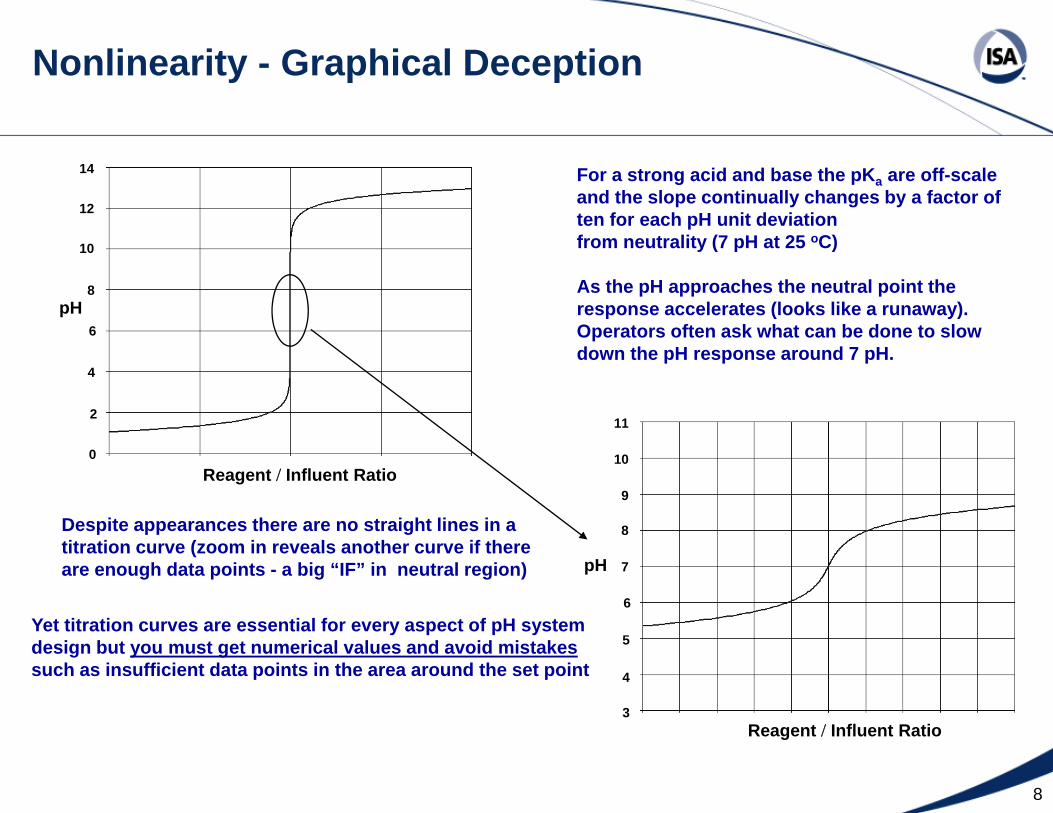
Despite appearances there are no straight lines in a titration curve (zoom in reveals another curve if there are enough data points - a big “IF” in neutral region)
For a strong acid and base the pKa are off-scale and the slope continually changes by a factor of ten for each pH unit deviationfrom neutrality (7 pH at 25 oC)
As the pH approaches the neutral point the response accelerates (looks like a runaway). Operators often ask what can be done to slow down the pH response around 7 pH.
Yet titration curves are essential for every aspect of pH systemdesign but you must get numerical values and avoid mistakessuch as insufficient data points in the area around the set point
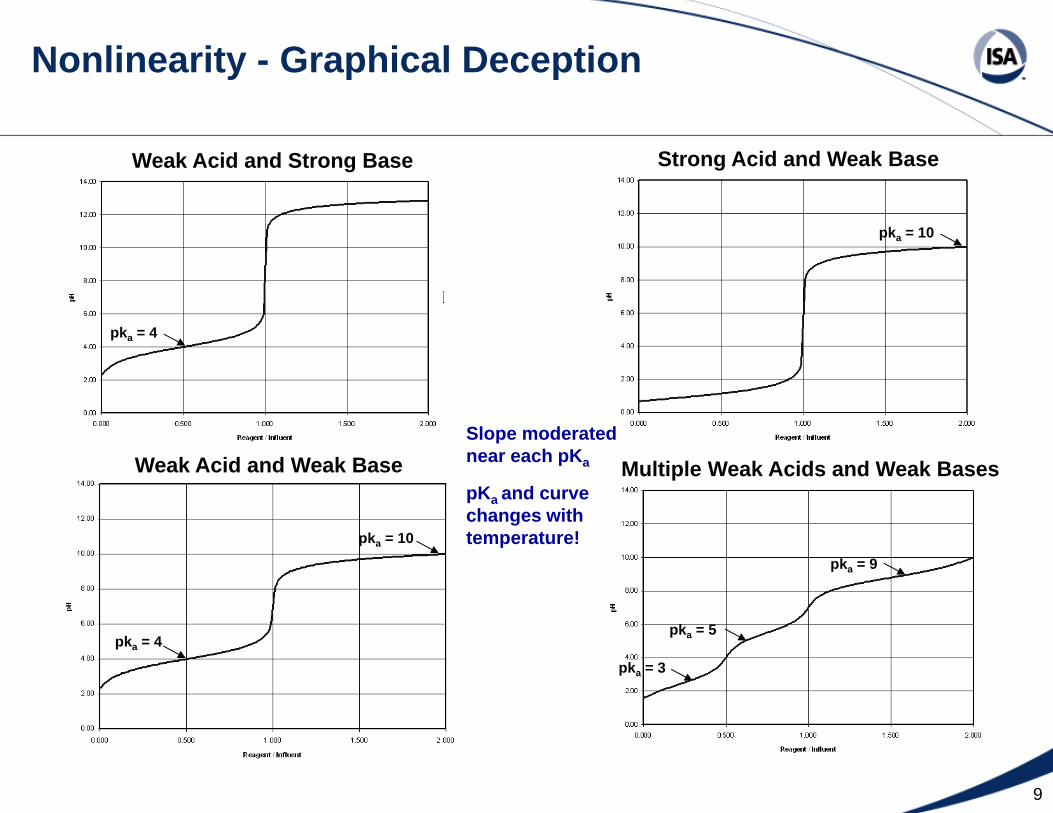
Nonlinearity - Graphical Deception
9
Weak Acid and Strong Base
pka = 4
Strong Acid and Weak Base
pka = 10
Multiple Weak Acids and Weak Bases
pka = 3
pka = 5
pka = 9
Nonlinearity - Graphical Deception
Slope moderatednear each pKa
pKa and curve changes with temperature!
Weak Acid and Weak Base
pka = 4
pka = 10
10
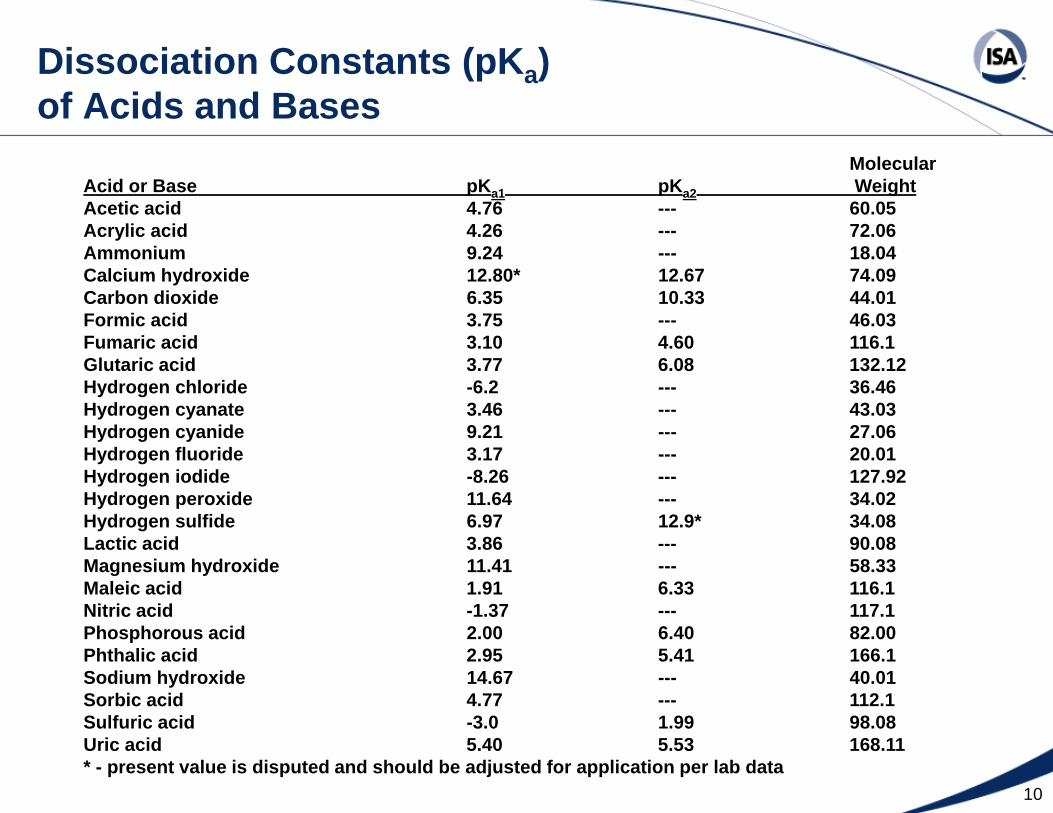
Dissociation Constants (pKa) of Acids and Bases
MolecularAcid or Base pKa1 pKa2 WeightAcetic acid 4.76 --- 60.05Acrylic acid 4.26 --- 72.06Ammonium 9.24 --- 18.04Calcium hydroxide 12.80* 12.67 74.09Carbon dioxide 6.35 10.33 44.01Formic acid 3.75 --- 46.03Fumaric acid 3.10 4.60 116.1Glutaric acid 3.77 6.08 132.12Hydrogen chloride -6.2 --- 36.46Hydrogen cyanate 3.46 --- 43.03Hydrogen cyanide 9.21 --- 27.06Hydrogen fluoride 3.17 --- 20.01Hydrogen iodide -8.26 --- 127.92Hydrogen peroxide 11.64 --- 34.02Hydrogen sulfide 6.97 12.9* 34.08Lactic acid 3.86 --- 90.08Magnesium hydroxide 11.41 --- 58.33Maleic acid 1.91 6.33 116.1Nitric acid -1.37 --- 117.1Phosphorous acid 2.00 6.40 82.00Phthalic acid 2.95 5.41 166.1Sodium hydroxide 14.67 --- 40.01Sorbic acid 4.77 --- 112.1Sulfuric acid -3.0 1.99 98.08Uric acid 5.40 5.53 168.11* - present value is disputed and should be adjusted for application per lab data
11
Common Problems with Titration Curves
• Insufficient number of data points were generated near the equivalence point • Starting pH (influent pH) data were not plotted for all operating conditions• Curve doesn’t cover the whole operating range and control system overshoot• No separate curve that zooms in to show the curvature in the control region• No separate curve for each different split ranged reagent• Sequence of the different split ranged reagents was not analyzed• Back mixing of different split ranged reagents was not considered• Overshoot and oscillation at the split ranged point was not included• Sample or reagent solids dissolution time effect was not quantified• Sample or reagent gaseous dissolution time and escape was not quantified• Sample volume was not specified • Sample time was not specified• Reagent concentration was not specified • Sample temperature during titration was different than the process temperature • Sample was contaminated by absorption of carbon dioxide from the air • Sample was contaminated by absorption of ions from the glass beaker• Sample composition was altered by evaporation, reaction, or dissolution • Laboratory and field measurement electrodes had different types of electrodes • Composite sample instead of individual samples was titrated • Laboratory and field used different reagents
Representative titration curves with enough data pointsare essential for pH system design and analysis
12
The Essential Uses of the Titration Curve
• The titration curve is the essential tool for every aspect of pH system design and analysis.– Model fidelity– Valve sizing and resolution requirements– Feedforward control– Reagent demand control– Controller Tuning– Performance analysis– Disturbance analysis
• The first step in the design of a pH system is to generate a titration curve at the process temperature with enough data points to cover the range of operation and show the curvature within the control band (absolute magnitude of the difference between the maximum and minimum allowable pH).
• For a set point on the steepest part of the titration curve, one stage of neutralization is needed for every two pH units away from set point. Advanced control and precise valves can eliminate one stage.
13
Effect of Sensor Drift on Reagent Calculations
pH
Reagent to Feed Flow Ratio
4
10
6
8
FeedforwardReagent Error
FeedforwardpH Error
Sensor Drift
pH Set PointInfluent pH
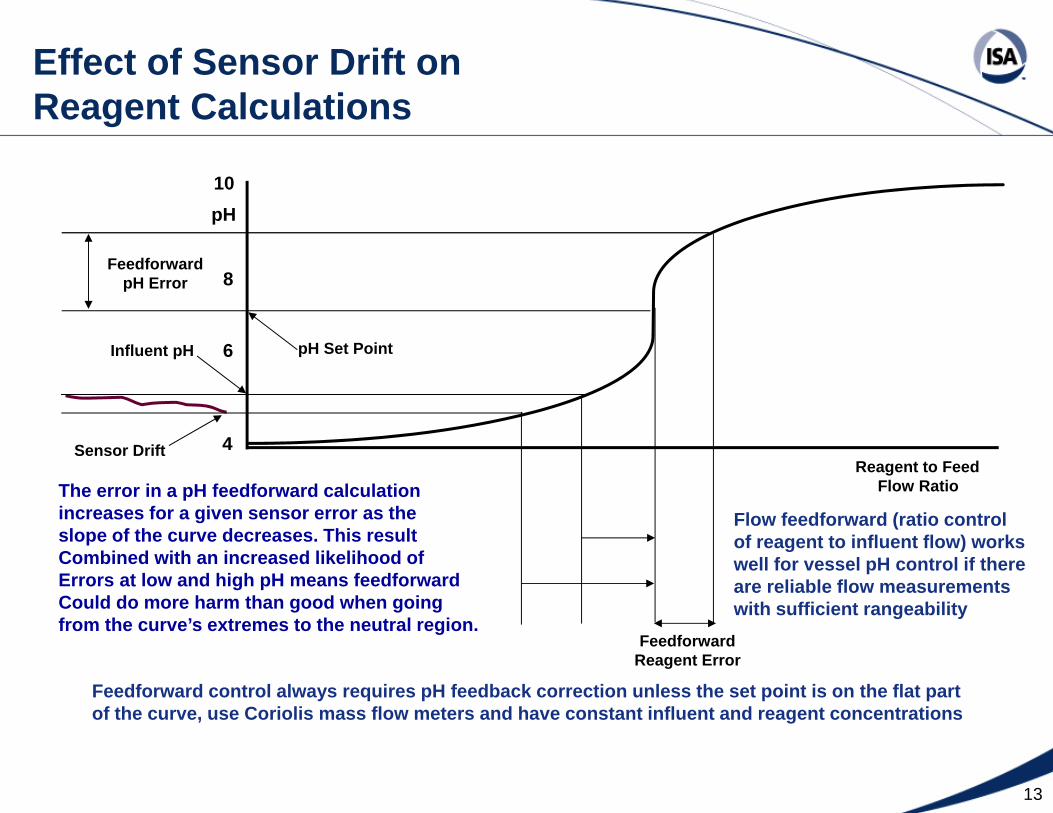
The error in a pH feedforward calculationincreases for a given sensor error as theslope of the curve decreases. This resultCombined with an increased likelihood ofErrors at low and high pH means feedforwardCould do more harm than good when goingfrom the curve’s extremes to the neutral region.
Flow feedforward (ratio controlof reagent to influent flow) workswell for vessel pH control if there are reliable flow measurements with sufficient rangeability
Feedforward control always requires pH feedback correction unless the set point is on the flat part of the curve, use Coriolis mass flow meters and have constant influent and reagent concentrations
14
Double Junction Combination pH Electrode
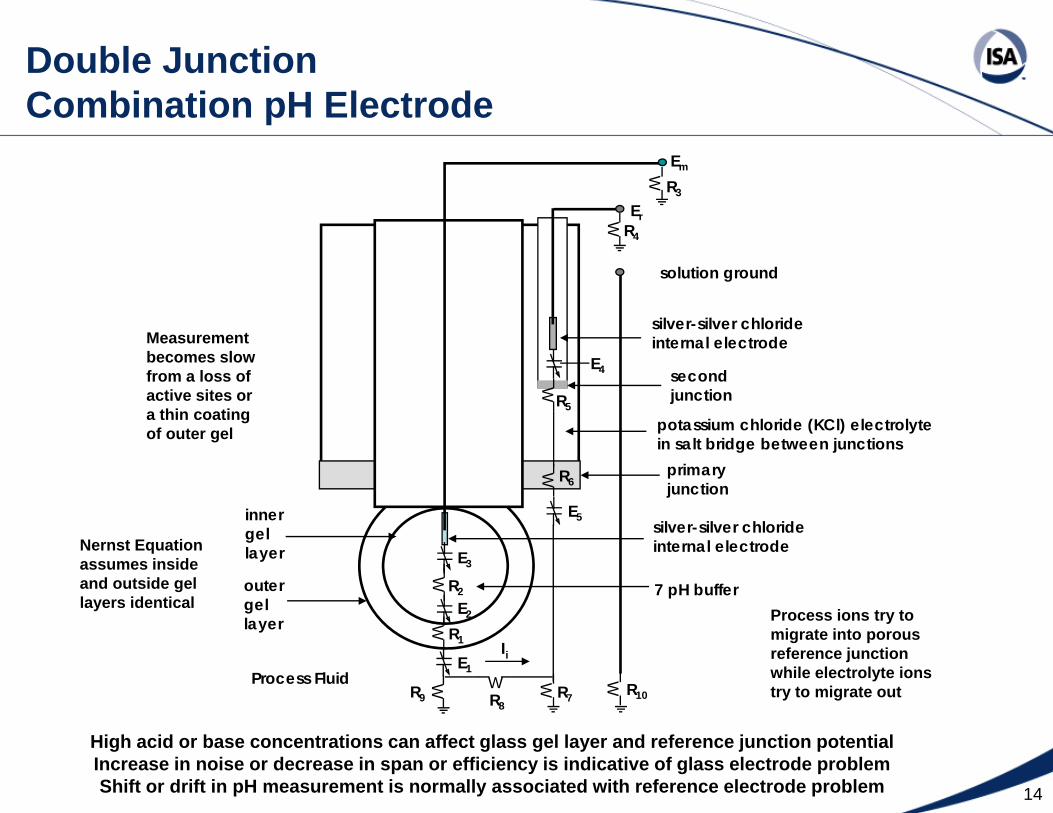
High acid or base concentrations can affect glass gel layer and reference junction potentialIncrease in noise or decrease in span or efficiency is indicative of glass electrode problemShift or drift in pH measurement is normally associated with reference electrode problem
W W
WW
W
W
W
Em
R10R9 R8R7
R6
R5
R4
R3
R2
R1
Er
E5
E4
E3
E2
E1
outer gellayer
inner gellayer
secondjunction
primary junction
solution ground
Process Fluid
silver-silver chlorideinternal electrode
silver-silver chlorideinternal electrode
potassium chloride (KCl) electrolyte in salt bridge between junctions
7 pH buffer
Ii
Process ions try to migrate into porous reference junctionwhile electrolyte ionstry to migrate out
Nernst Equationassumes insideand outside gellayers identical
Measurementbecomes slow from a loss ofactive sites ora thin coatingof outer gel
WW
W

15
High Today Low Tomorrow
AB A
B A
BpH
time
Most calibration adjustments chase the short term errors shownbelow that arise from concentration gradients from imperfectmixing, ion migration into reference junction, temperature shifts, different glass surface conditions, and fluid streaming potentials.With just two electrodes, there are more questions than answers.
16
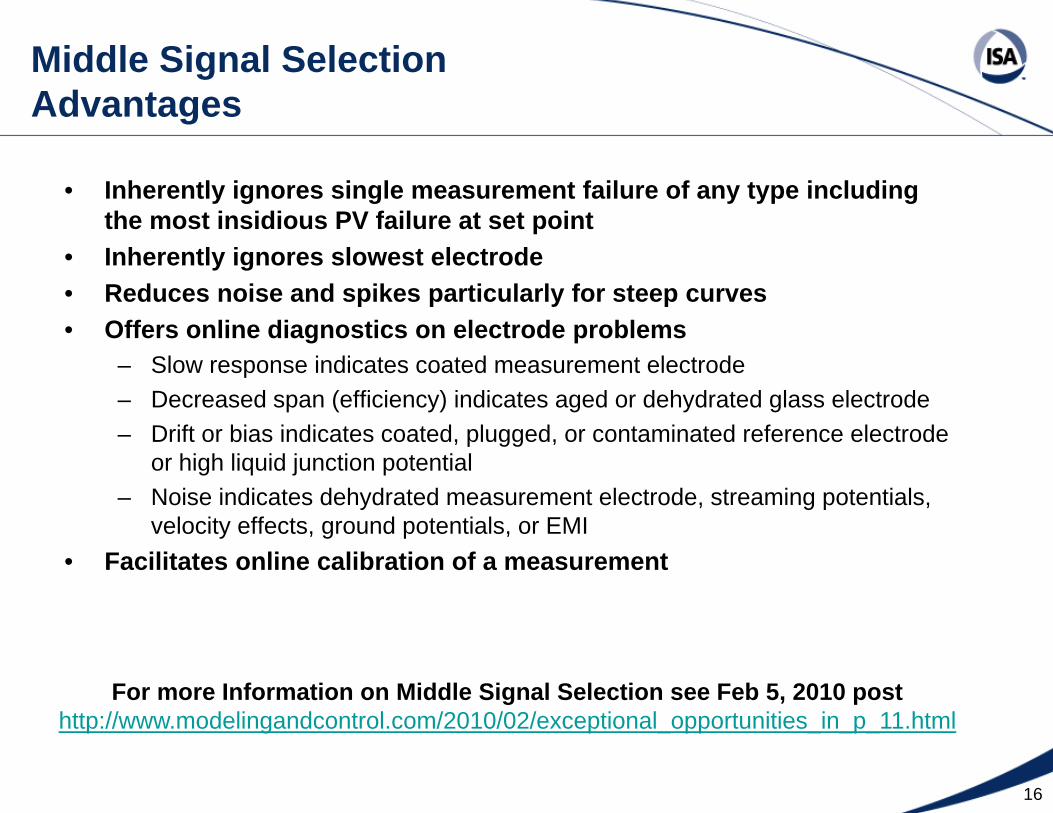
• Inherently ignores single measurement failure of any type including the most insidious PV failure at set point
• Inherently ignores slowest electrode• Reduces noise and spikes particularly for steep curves• Offers online diagnostics on electrode problems
– Slow response indicates coated measurement electrode – Decreased span (efficiency) indicates aged or dehydrated glass electrode– Drift or bias indicates coated, plugged, or contaminated reference electrode
or high liquid junction potential– Noise indicates dehydrated measurement electrode, streaming potentials,
velocity effects, ground potentials, or EMI• Facilitates online calibration of a measurement
For more Information on Middle Signal Selection see Feb 5, 2010 posthttp://www.modelingandcontrol.com/2010/02/exceptional_opportunities_in_p_11.html
Middle Signal SelectionAdvantages
17
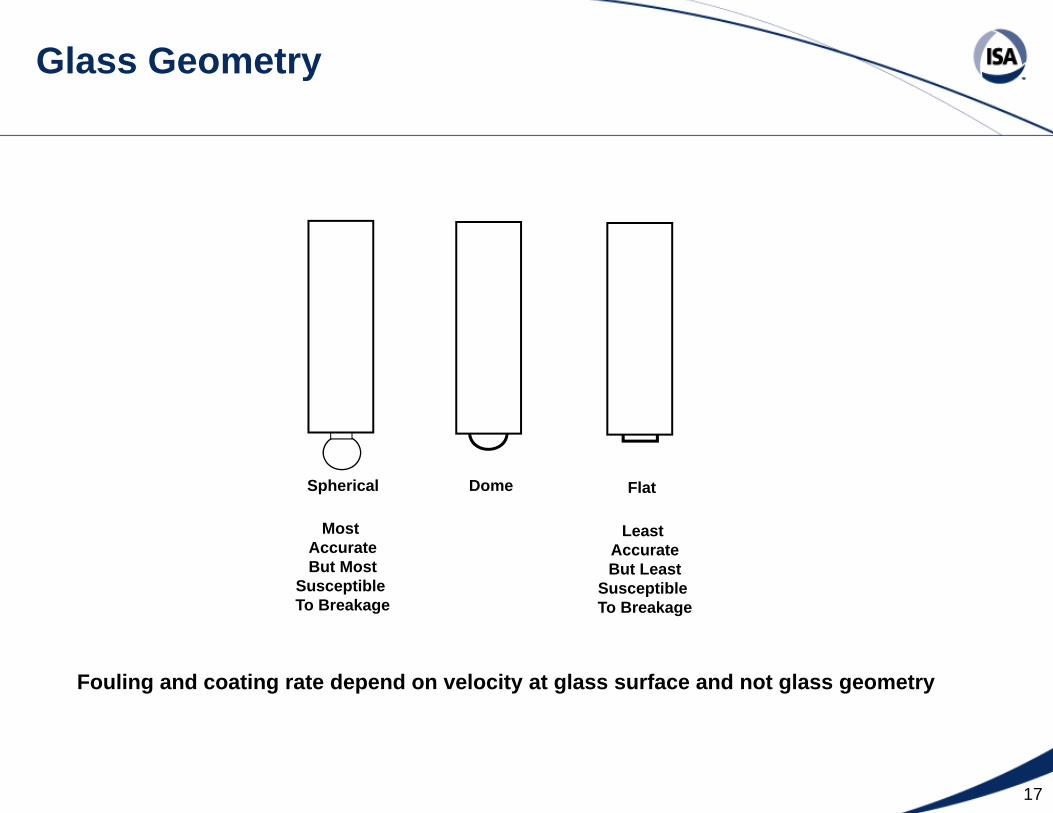
Glass Geometry
Spherical Dome Flat
Most AccurateBut Most
Susceptible To Breakage
Least AccurateBut Least
Susceptible To Breakage
Fouling and coating rate depend on velocity at glass surface and not glass geometry

18
Shroud Designs
Shroud should protect glass from breakage but not contribute to fouling or coating
19
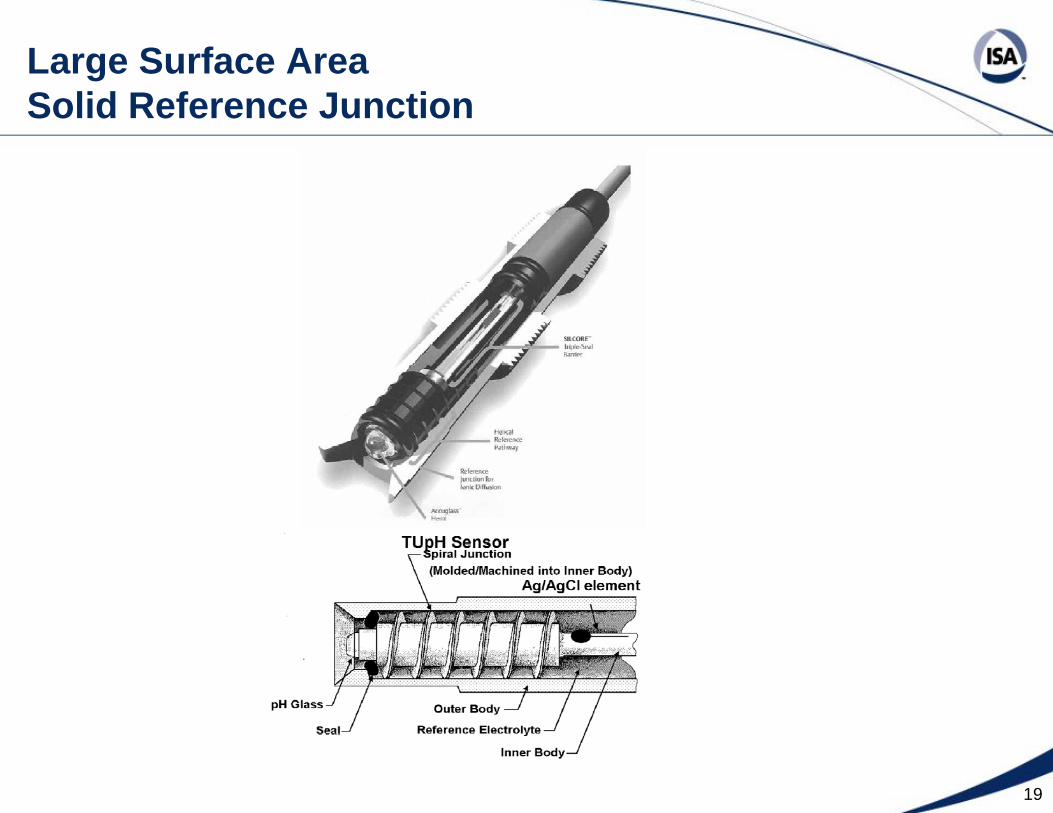
Large Surface Area Solid Reference Junction
20
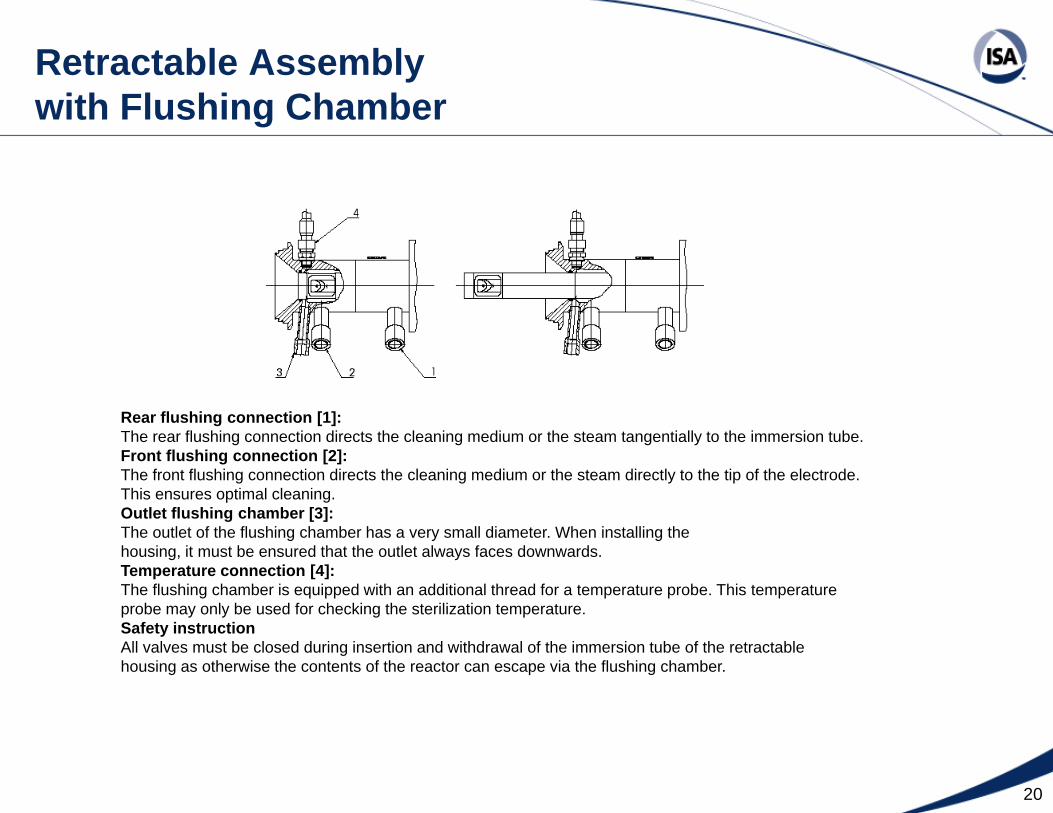
Retractable Assembly with Flushing Chamber
Rear flushing connection [1]:The rear flushing connection directs the cleaning medium or the steam tangentially to the immersion tube.Front flushing connection [2]:The front flushing connection directs the cleaning medium or the steam directly to the tip of the electrode.This ensures optimal cleaning.Outlet flushing chamber [3]:The outlet of the flushing chamber has a very small diameter. When installing thehousing, it must be ensured that the outlet always faces downwards.Temperature connection [4]:The flushing chamber is equipped with an additional thread for a temperature probe. This temperatureprobe may only be used for checking the sterilization temperature.Safety instructionAll valves must be closed during insertion and withdrawal of the immersion tube of the retractablehousing as otherwise the contents of the reactor can escape via the flushing chamber.

21
Automated Maintenance System
Smart pHTransmitter
AutomatedCleaningSystem
pH ControlSystem
AutomatedMaintenance
System
Request to Clean
Command to Clean
Time Responseand CalibrationTest Results
Diagnostics
22
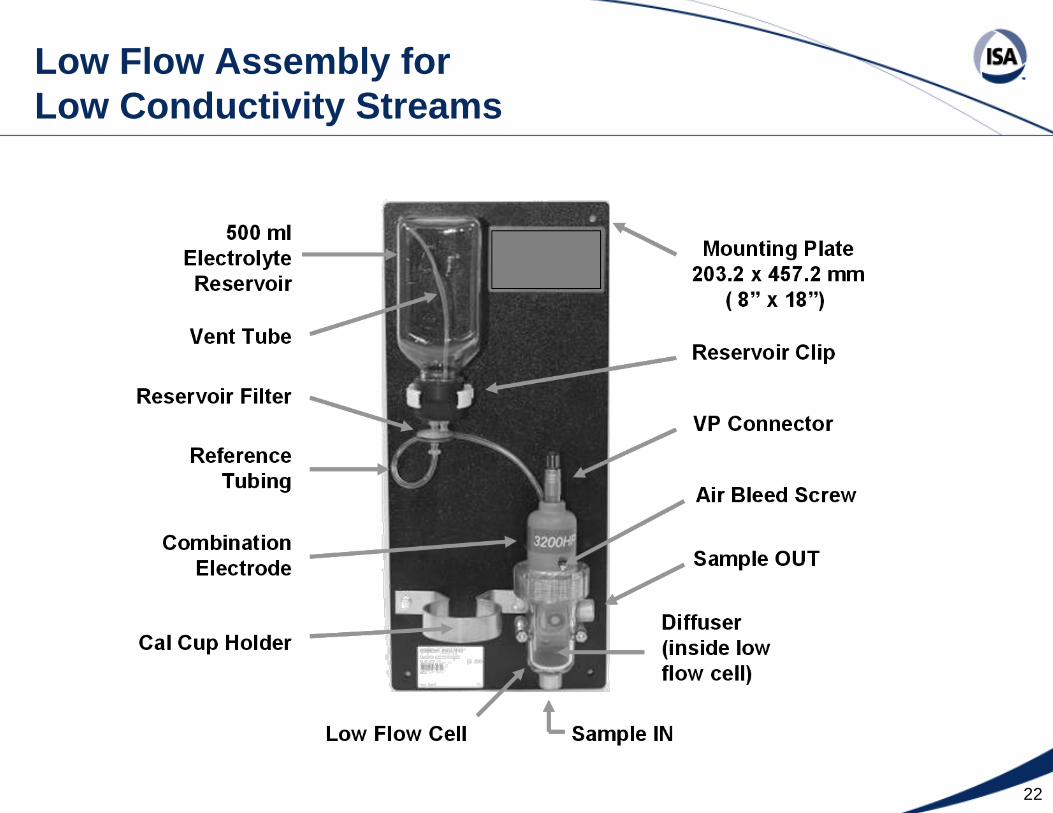
Low Flow Assembly for Low Conductivity Streams
23
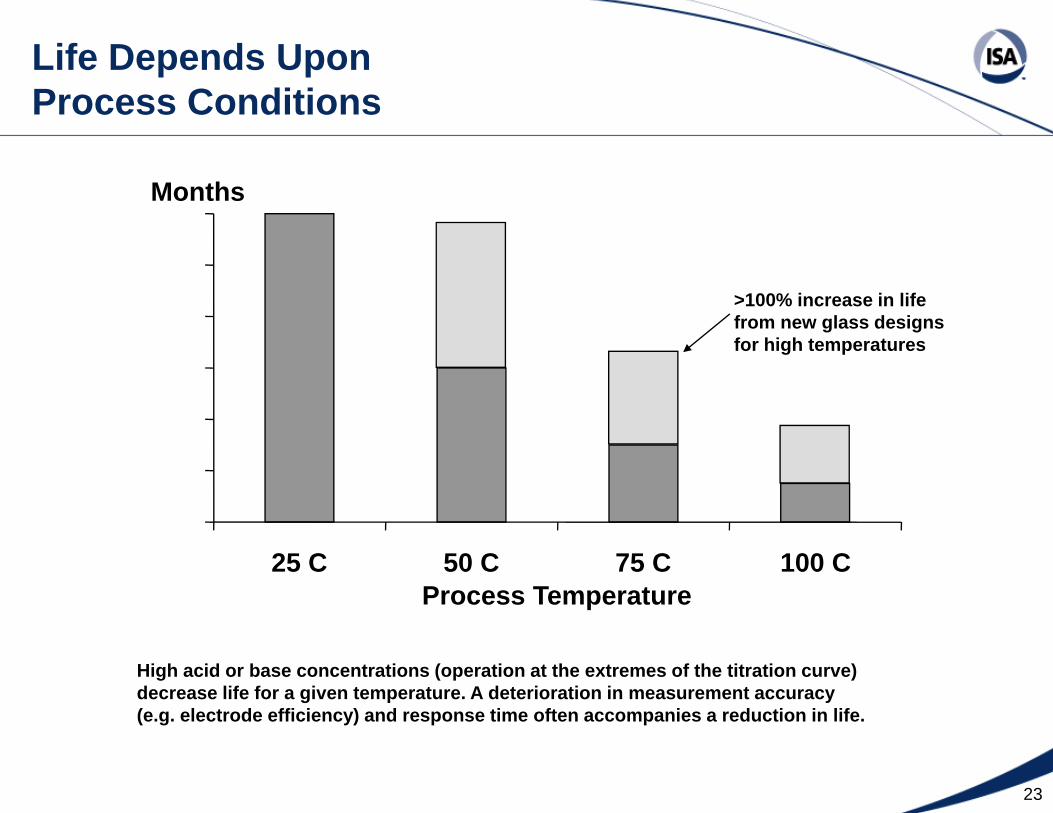
Life Depends Upon Process Conditions
25 C 50 C 75 C 100 CProcess Temperature
Months
>100% increase in life from new glass designsfor high temperatures
High acid or base concentrations (operation at the extremes of the titration curve) decrease life for a given temperature. A deterioration in measurement accuracy (e.g. electrode efficiency) and response time often accompanies a reduction in life.
24
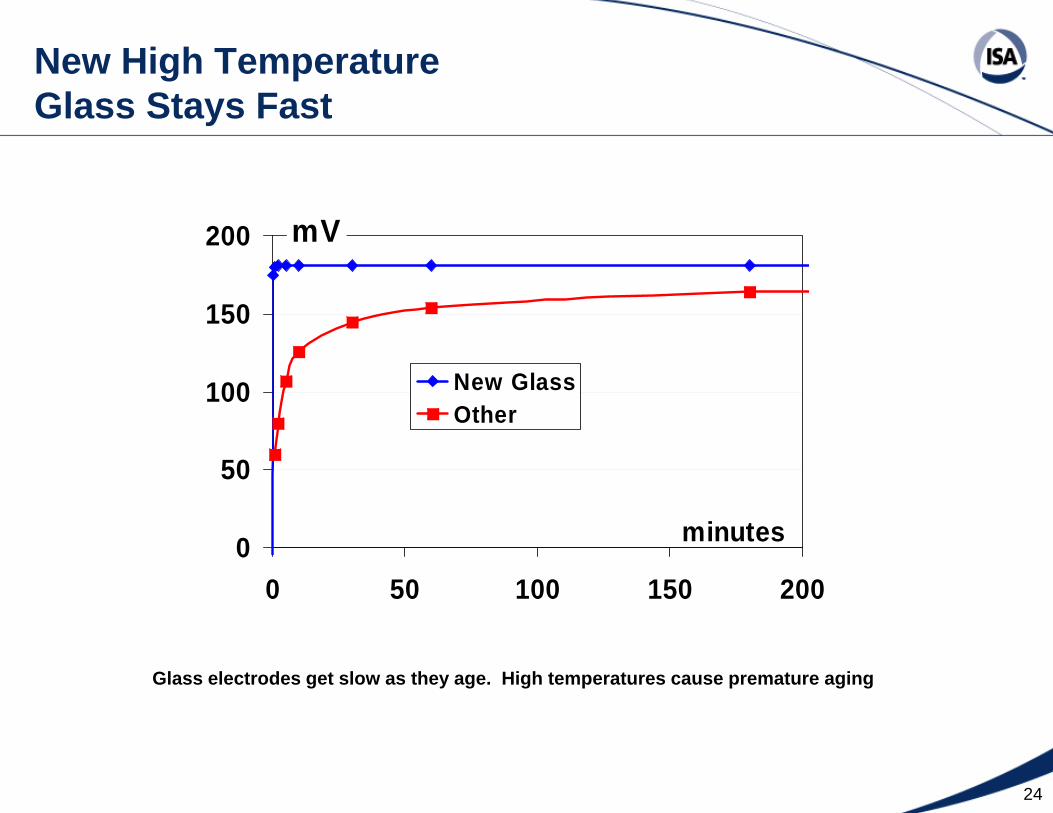
New High Temperature Glass Stays Fast
0
50
100
150
200
0 50 100 150 200
minutes
mV
New GlassOther
Glass electrodes get slow as they age. High temperatures cause premature aging
25
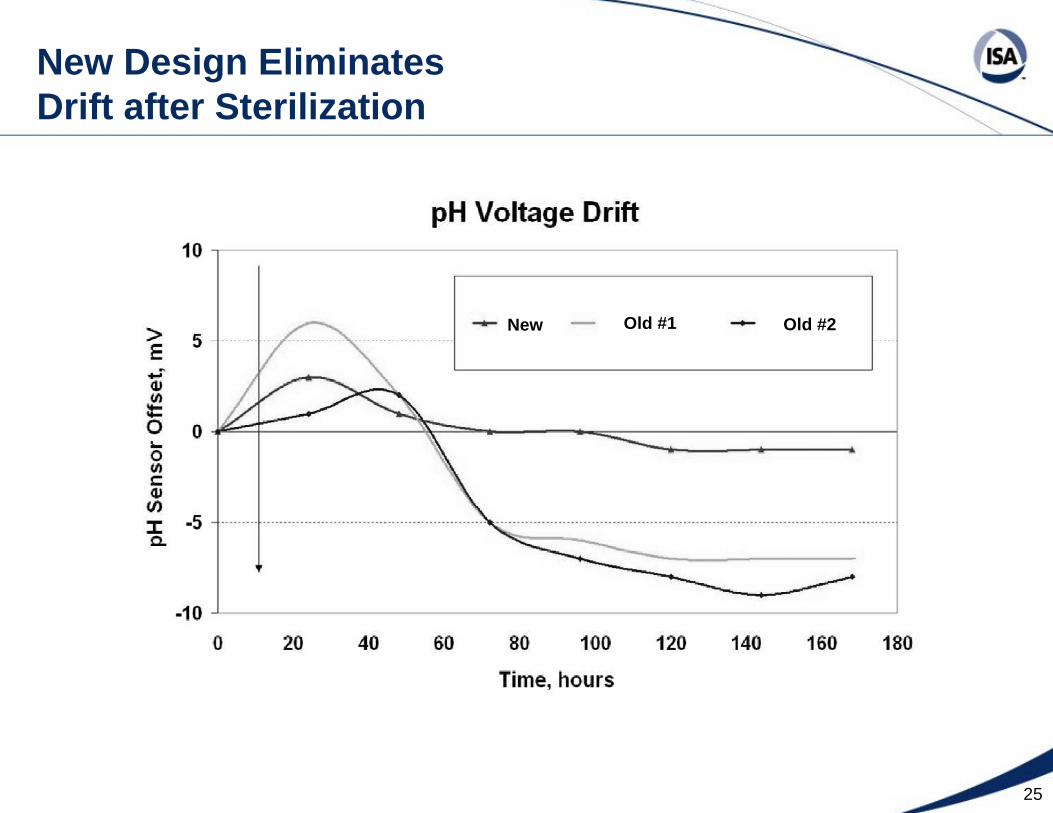
New Design Eliminates Drift after Sterilization
New Old #1 Old #2
26
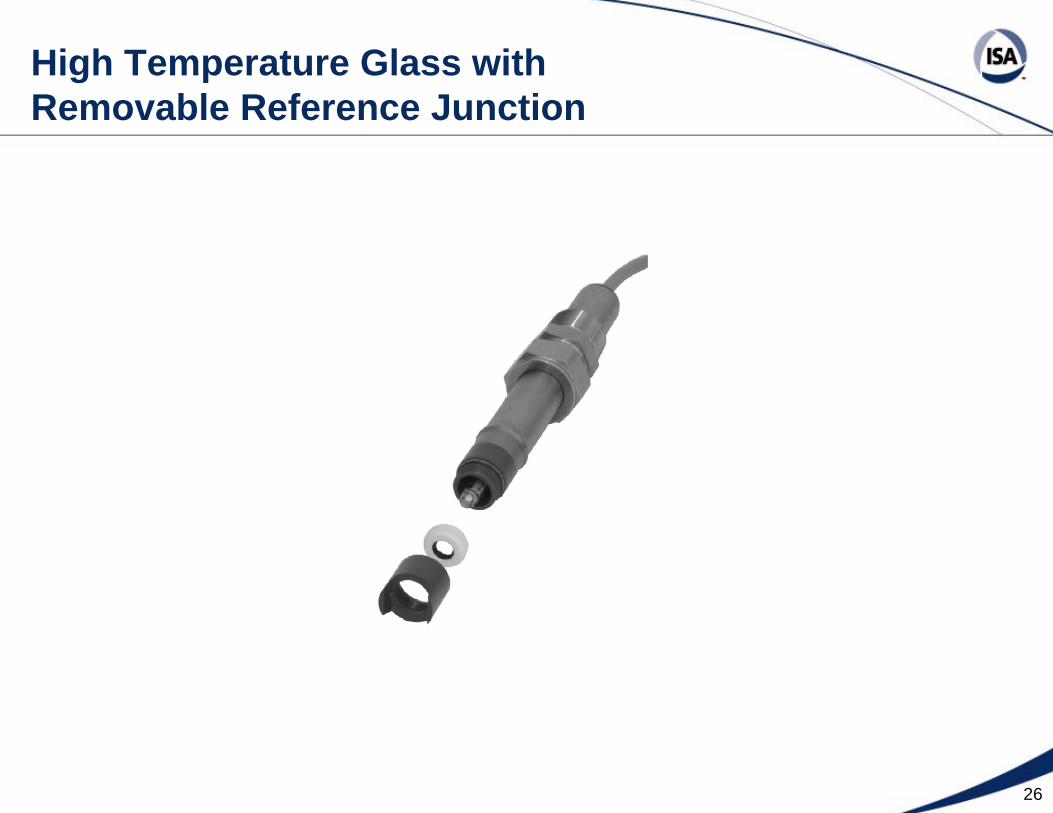
High Temperature Glass with Removable Reference Junction

27
Online Diagnostics for Cracked Glass
Ω Ω
Reference Electrode Glass
ElectrodeSolution Ground
3K 0-5 MΩ
CrackedGlass!
• Cracked Glass Fault– pH Glass electrode normally has high impedance of 50-150 Meg-ohm– Glass can be cracked at the tip or further back inside the sensor– Recommended setting of 10 Megohm will detect even small cracks
28
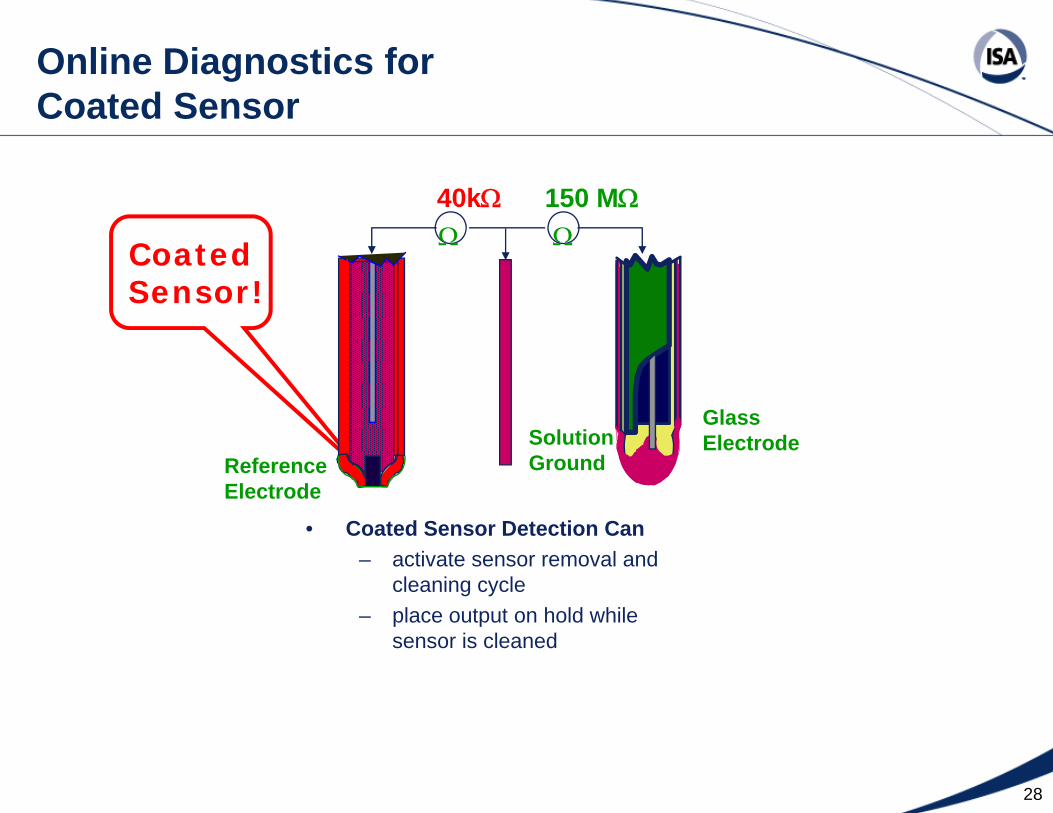
CoatedSensor!
Ω Ω
Reference Electrode
Glass ElectrodeSolution
Ground
40kΩ 150 MΩ
• Coated Sensor Detection Can– activate sensor removal and
cleaning cycle– place output on hold while
sensor is cleaned
Online Diagnostics for Coated Sensor
29
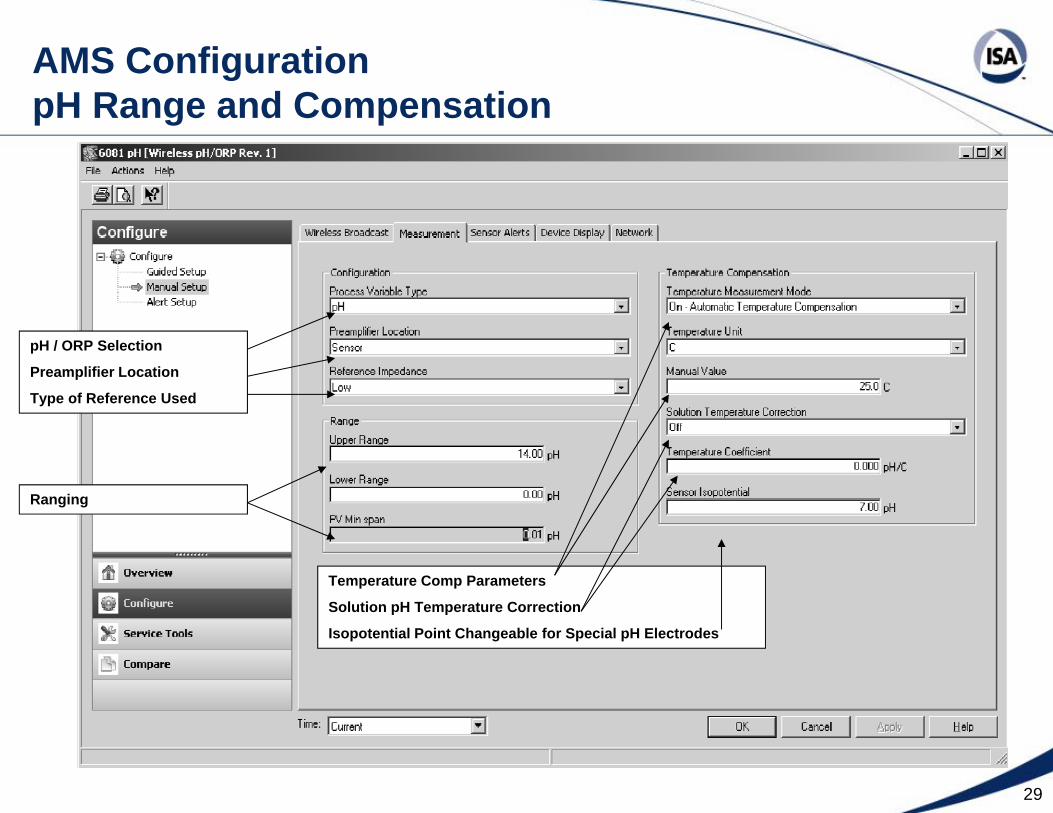
Temperature Comp Parameters
Solution pH Temperature Correction
Isopotential Point Changeable for Special pH Electrodes
pH / ORP Selection
Preamplifier Location
Type of Reference Used
Ranging
AMS ConfigurationpH Range and Compensation
30
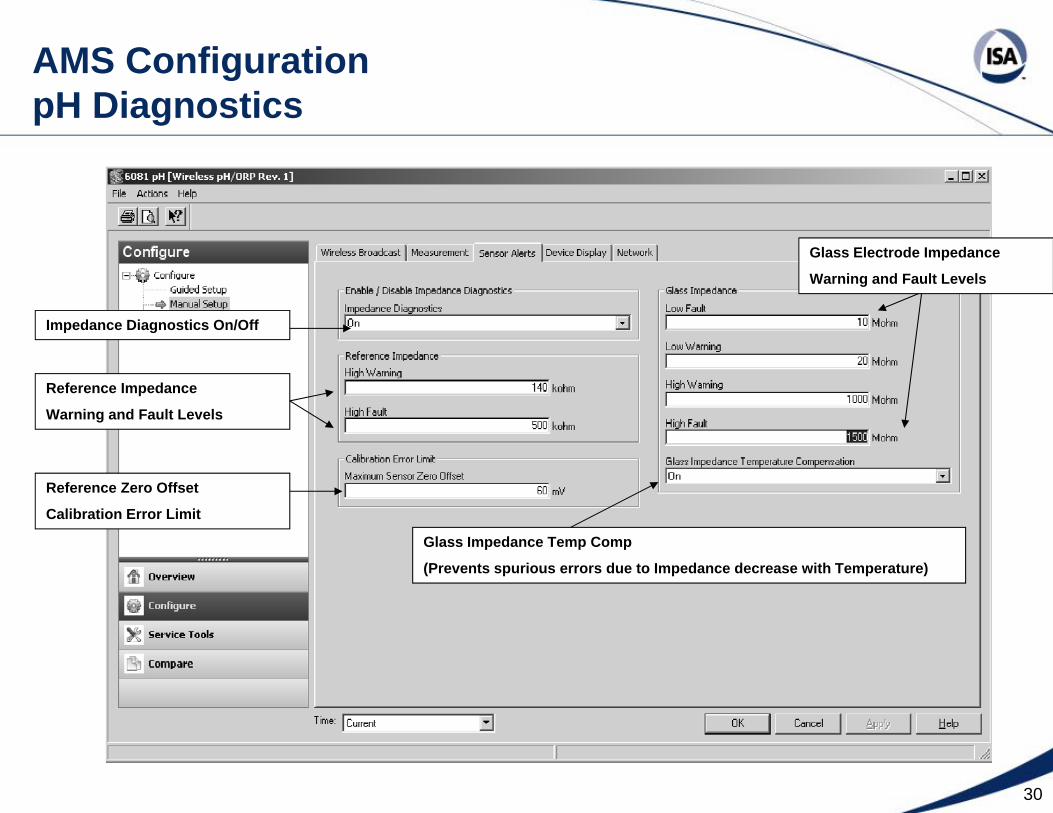
Impedance Diagnostics On/Off
Reference Impedance
Warning and Fault Levels
Reference Zero Offset
Calibration Error Limit
Glass Electrode Impedance
Warning and Fault Levels
Glass Impedance Temp Comp
(Prevents spurious errors due to Impedance decrease with Temperature)
AMS ConfigurationpH Diagnostics
31
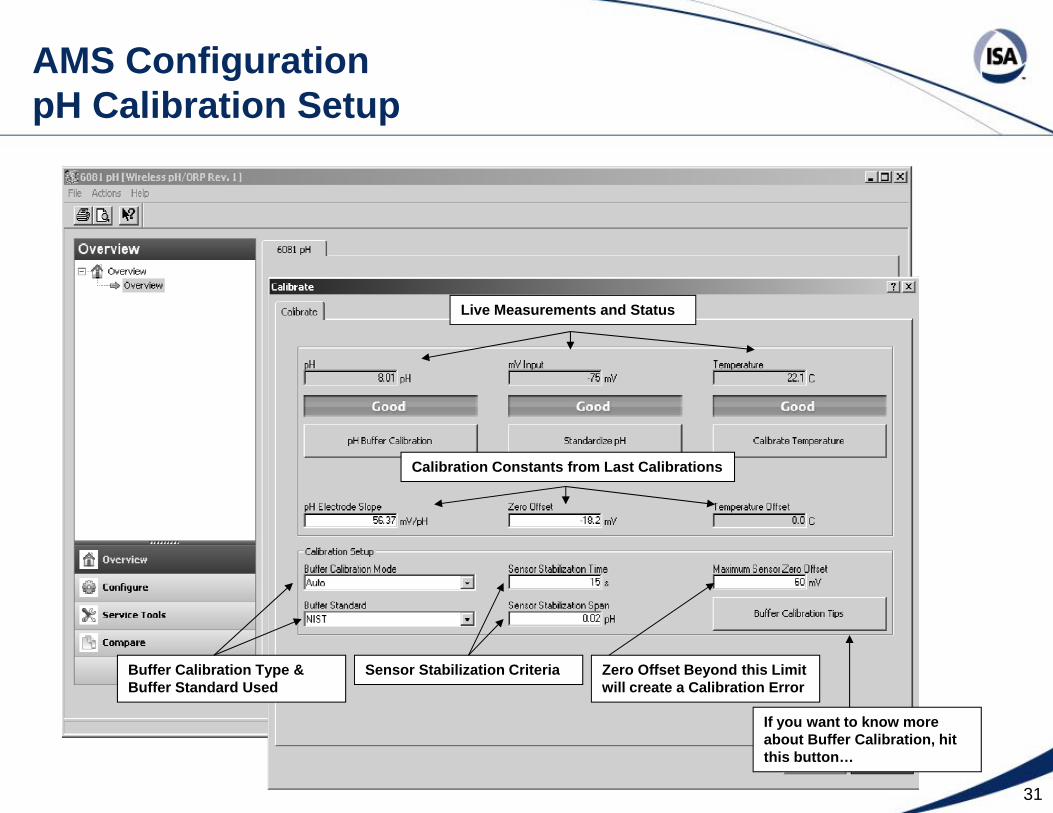
Live Measurements and Status
Calibration Constants from Last Calibrations
Buffer Calibration Type & Buffer Standard Used
Sensor Stabilization Criteria Zero Offset Beyond this Limit will create a Calibration Error
If you want to know more about Buffer Calibration, hit this button…
AMS ConfigurationpH Calibration Setup
32
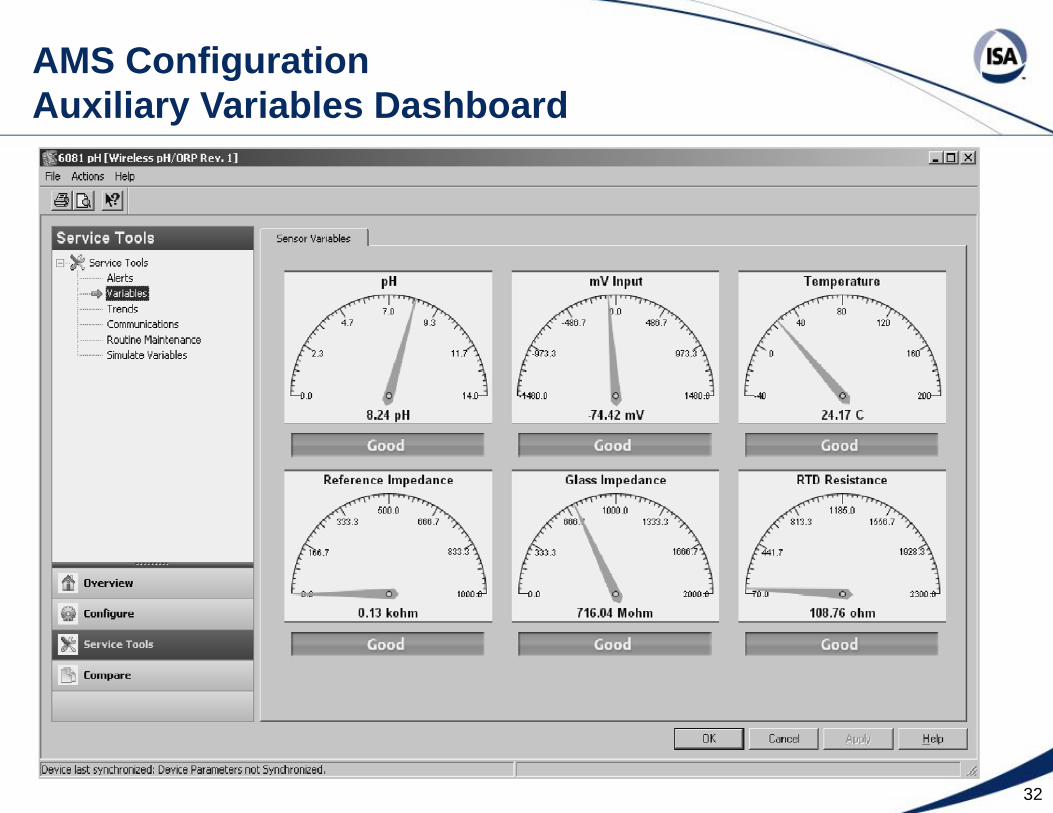
AMS ConfigurationAuxiliary Variables Dashboard
33
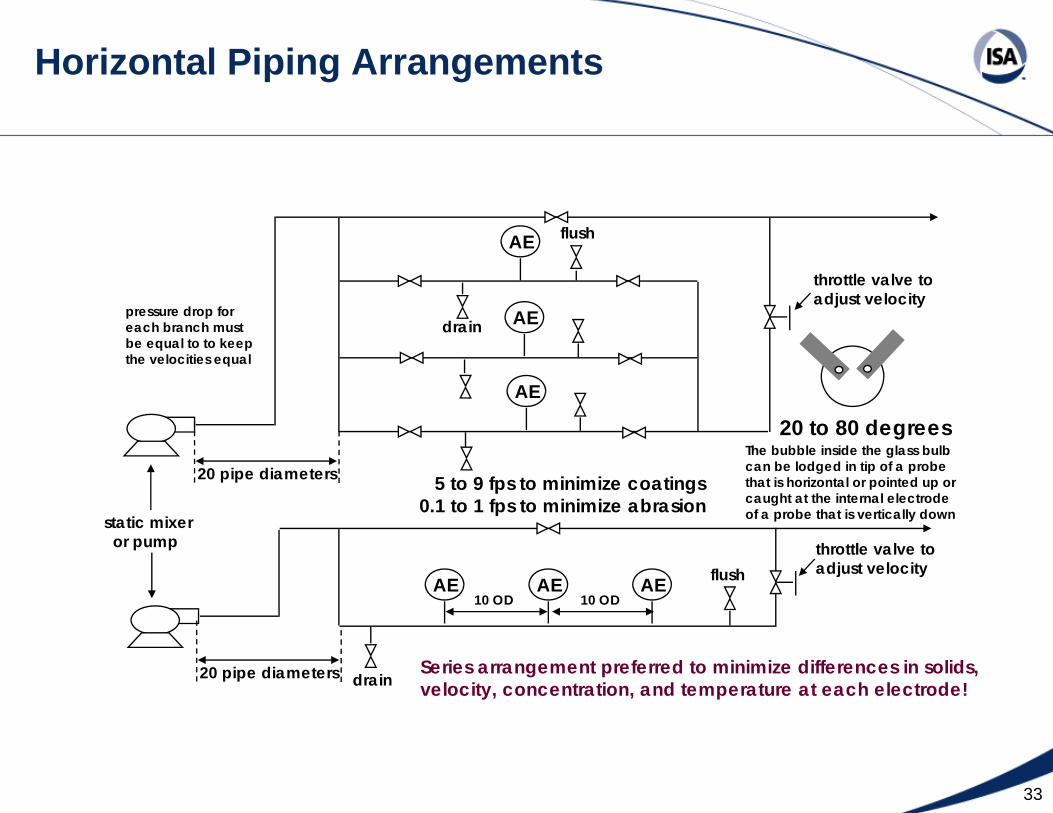
Horizontal Piping Arrangements
AE
AE
AE
AEAEAE
5 to 9 fps to minimize coatings0.1 to 1 fps to minimize abrasion
20 to 80 degreesThe bubble inside the glass bulbcan be lodged in tip of a probe that is horizontal or pointed up or caught at the internal electrodeof a probe that is vertically down
pressure drop foreach branch mustbe equal to to keep the velocities equal
Series arrangement preferred to minimize differences in solids, velocity, concentration, and temperature at each electrode!
10 OD10 OD
20 pipe diameters
20 pipe diameters
static mixer or pump
flush
drain
flush
drain
throttle valve toadjust velocity
throttle valve toadjust velocity
34
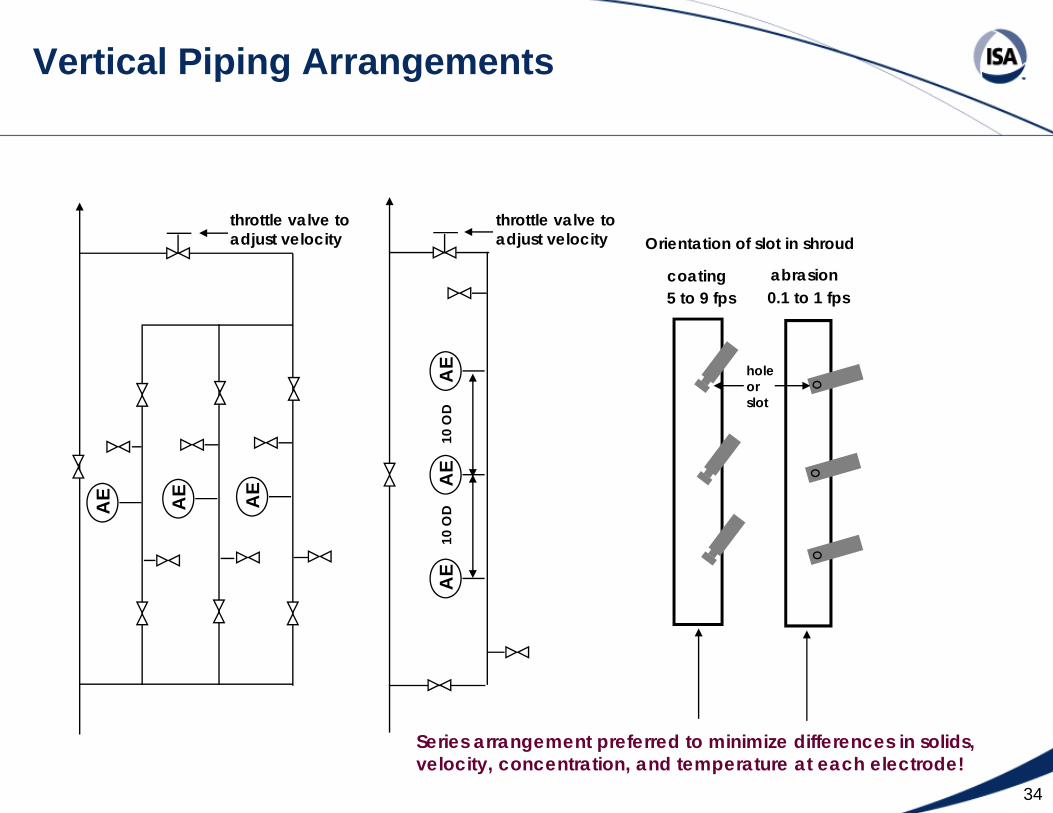
Vertical Piping ArrangementsA
E AE AE
AE
AE
AE
5 to 9 fpscoating abrasion
10 O
D10
OD
0.1 to 1 fps
holeorslot
Orientation of slot in shroudthrottle valve toadjust velocity
throttle valve toadjust velocity
Series arrangement preferred to minimize differences in solids, velocity, concentration, and temperature at each electrode!
35
• A spherical or hemi-spherical glass measurement and flowing junction reference offers maximum accuracy, but in practice maintenance prefers:– A refillable double junction reference to reduce the complexity of installation and
the need to adjust reference electrolyte flow rate – This electrode is often the best compromise between accuracy and maintainability.
– A solid reference to resist penetration and contamination by the process and eliminate the need to refill or replace reference particularly for high and nasty concentrations and pressure fluctuations – This electrode takes the longest time to equilibrate and is more prone to junction effects but could be right choice in applications where accuracy requirements are low and maintenance is high.
• Select best glass and reference electrolyte for process • Use smart digital transmitters with built-in diagnostics• Use middle signal selection of three pH measurements
– Inherent auto protection against a failure, drift, coating, loss in efficiency, and noise (see February 5, 2010 entry on http://www.modelingandcontrol.com/ )
• Allocate time for equilibration of the reference electrode• Use “in place” standardization based on a sample with the same temperature
and composition as the process. If this is not practical, the middle value of three measurements can be used as a reference. The fraction and frequency of the correction should be chosen to avoid chasing previous calibrations
• Insure a constant process fluid velocity at the highest practical value to help keep the electrodes clean and responsive
Options for Maximum Accuracy
36
Symptoms and Causes
• Slow measurement– Coated glass, aged glass, dehydrated glass, thick glass, high temperature, low pH, low velocity
• Noisy measurement– Dehydrated glass, pure water, low water, low temperature, poor mixing, high velocity, EMI
• pH decreases with temperature– pKa or pKw decrease with temperature (missing solution temperature compensation)– Horizontal shift to right of Isopotential point due to measurement electrode type or problem
• pH increases with temperature– Nernst MV decrease with temperature (missing electrode temperature compensation)– Horizontal shift to left of Isopotential point electrode type or problem
• pH increases with salt or solvent concentration– Decrease in activity of hydrogen ion from increase in ionic strength or decrease in water content
• Constant 7 pH measurement– Broken glass, broken wires, protective caps still on electrodes
• Decrease in measurement range (decrease in electrode efficiency)– Dehydrated glass or aged glass
• Daily drift in measurement (change in electrode offset)– Coated reference junction
• Hourly drift in measurement– Slow equilibration of reference electrode
• Off-scale pH measurement– Poisoned reference electrode or high solvent concentration
37
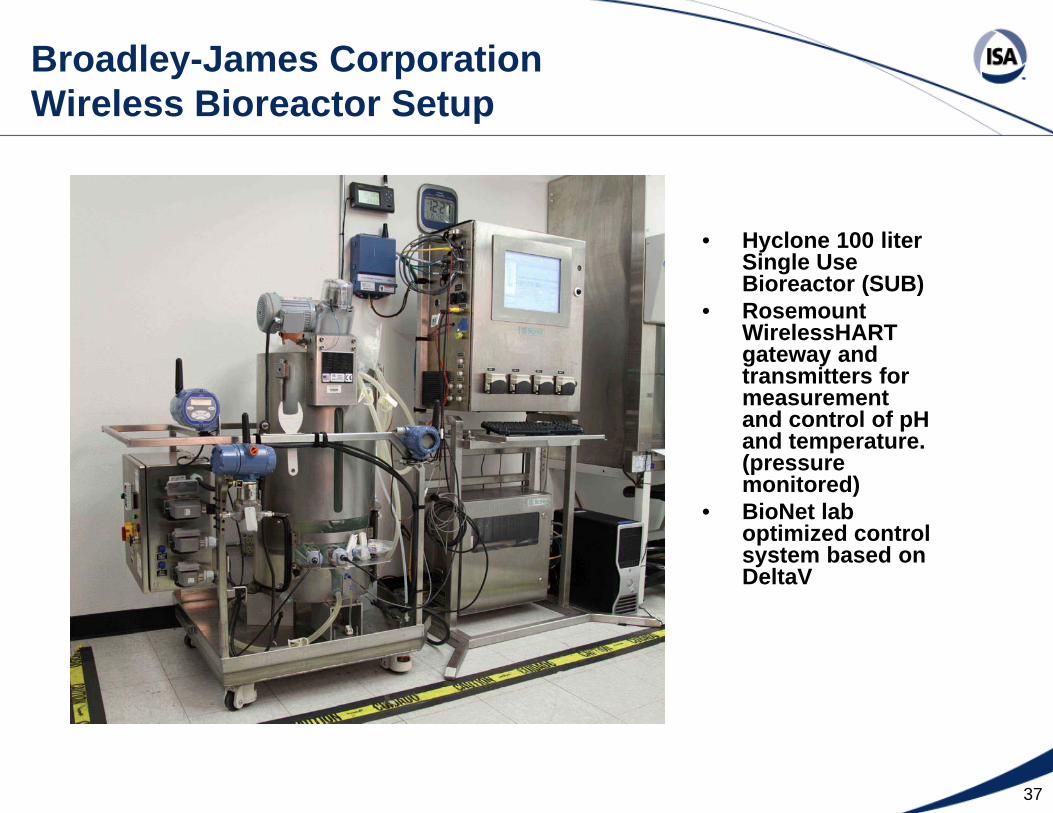
Broadley-James Corporation Wireless Bioreactor Setup
• Hyclone 100 liter Single Use Bioreactor (SUB)
• Rosemount WirelessHART gateway and transmitters for measurement and control of pH and temperature. (pressure monitored)
• BioNet lab optimized control system based on DeltaV

38
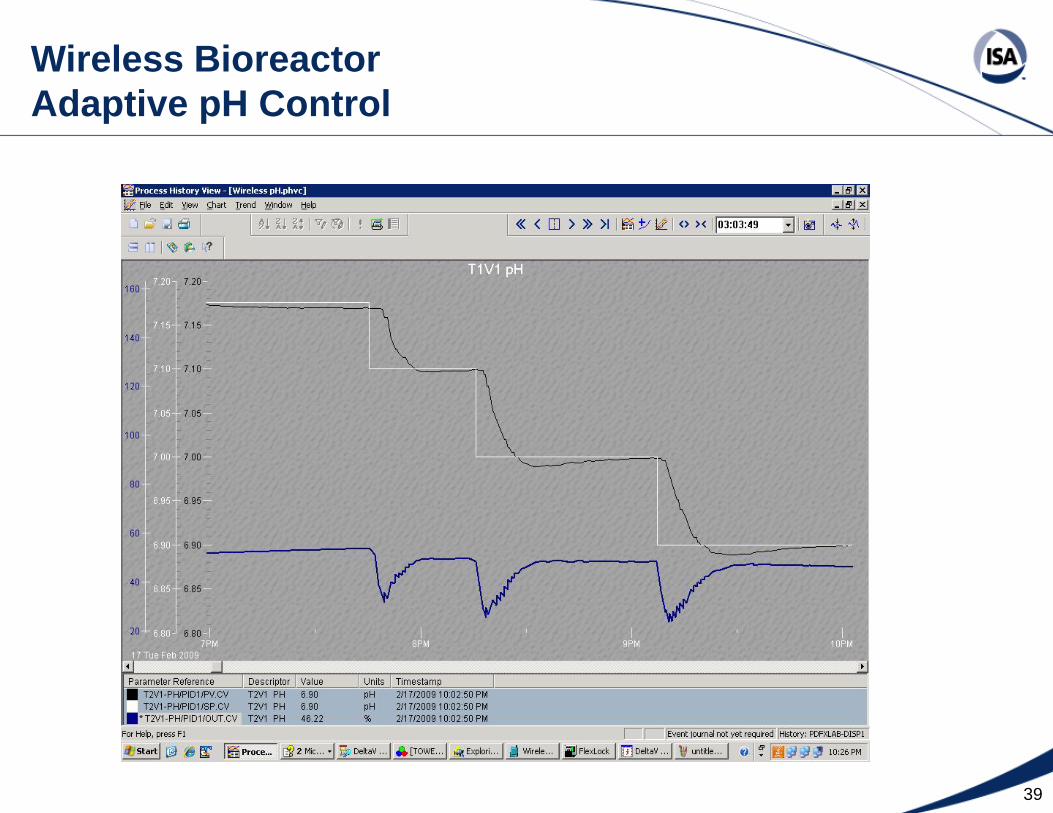
Wireless pH Transmitters Eliminate Ground Spikes
Wired pH ground noise spike
Temperature compensated wireless pH controlling at 6.9 pH set point
Incredibly tight pH control via 0.001 pH wireless resolution setting still reduced the number of communications by 60%
39
Wireless Bioreactor Adaptive pH Control
40
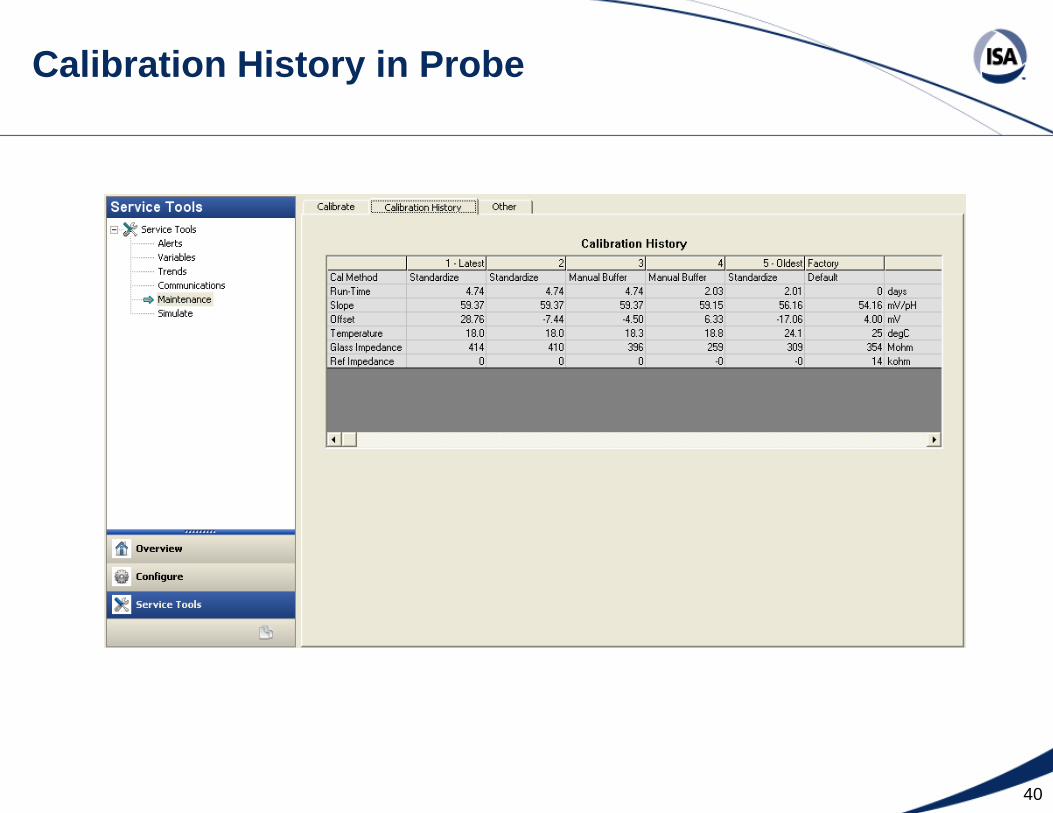
Calibration History in Probe
41
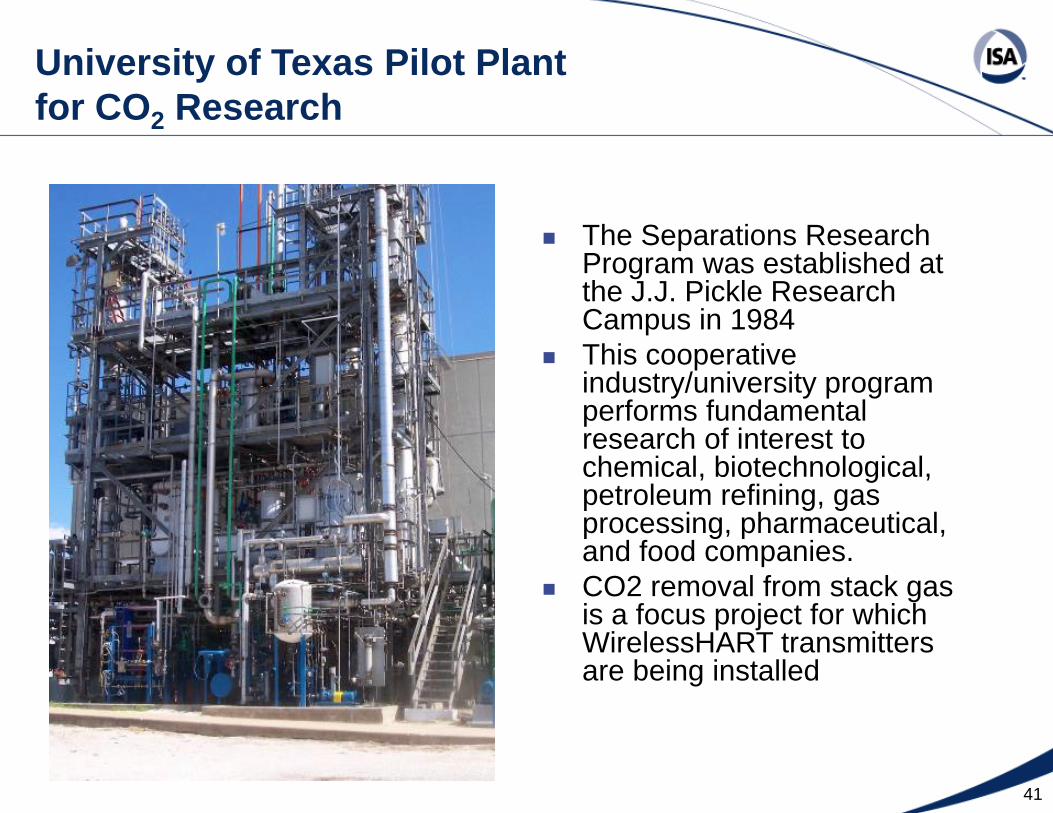
The Separations Research Program was established at the J.J. Pickle Research Campus in 1984This cooperative industry/university program performs fundamental research of interest to chemical, biotechnological, petroleum refining, gas processing, pharmaceutical, and food companies.CO2 removal from stack gas is a focus project for which WirelessHART transmitters are being installed
University of Texas Pilot Plant for CO2 Research

42
Wireless Conductivity and pH Lab Setup
Wireless pH measurements offer • Selecting the best sensor technology for a wide range of process conditions• Eliminating measurement noise• Predicting sensor demise• Developing process temperature compensation• Developing inferential measurements of process concentrations• Finding the best sensor location considering velocity, mixing, delay, & bubbles
43
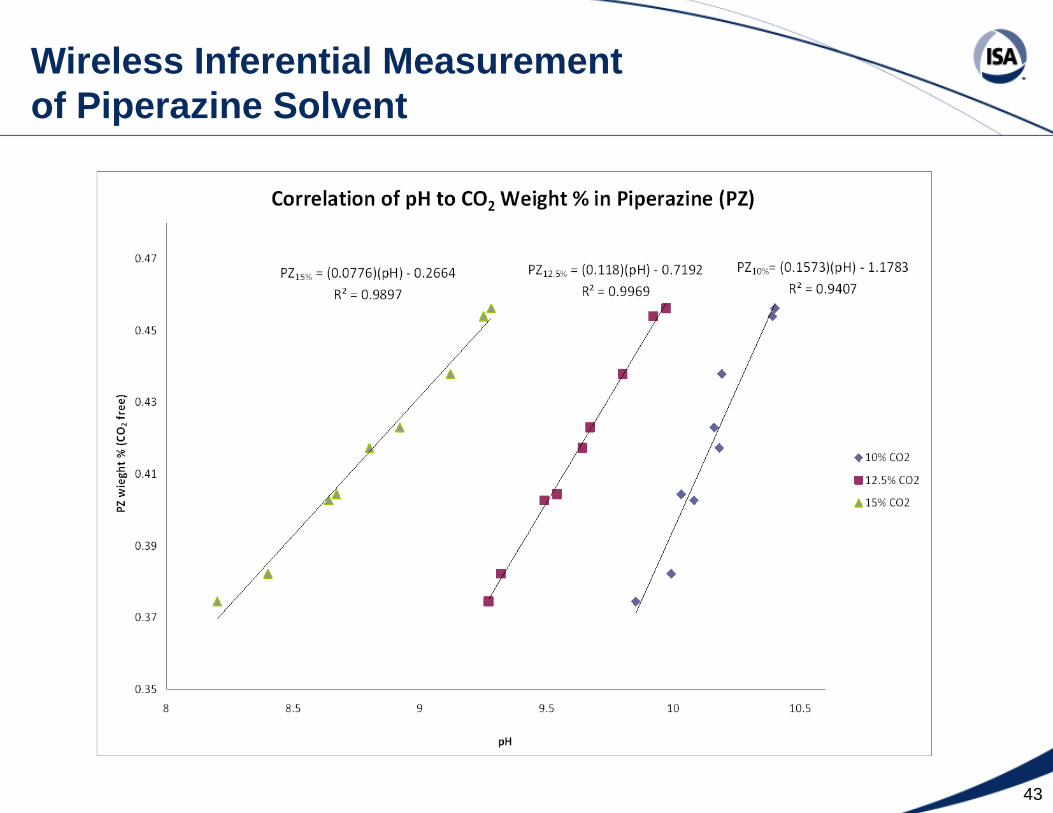
Wireless Inferential Measurement of Piperazine Solvent
44
• pH measures the activity of the hydrogen ion, which is the ion concentration multiplied by an activity coefficient. An increase in solvent concentration decreases the pH by a decrease in the activity coefficient and a decrease in the ion concentration from a decrease per the water dissociation constant.
• pH is also affected by CO2 weight percent since pH changes with the concentration of carbonic acid.
• Wireless conductivity offers an inferential measurement of CO2weight percent to include effect on pH.
• In the UT lab that supports the pilot plant, solvent concentration and loading were varied and the conductivity and pH were wirelessly communicated to the DCS in the control room
Wireless Inferential Measurements for CO2 Capture
45
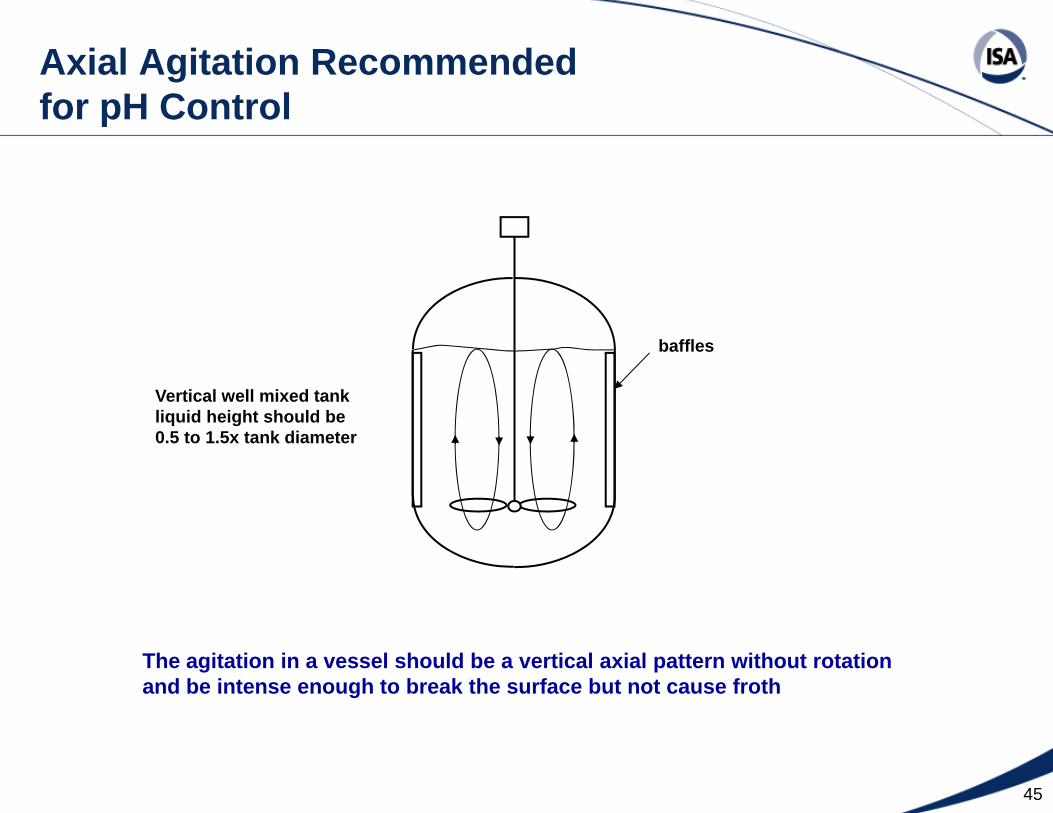
Axial Agitation Recommended for pH Control
The agitation in a vessel should be a vertical axial pattern without rotation and be intense enough to break the surface but not cause froth
baffles
Vertical well mixed tankliquid height should be0.5 to 1.5x tank diameter
46
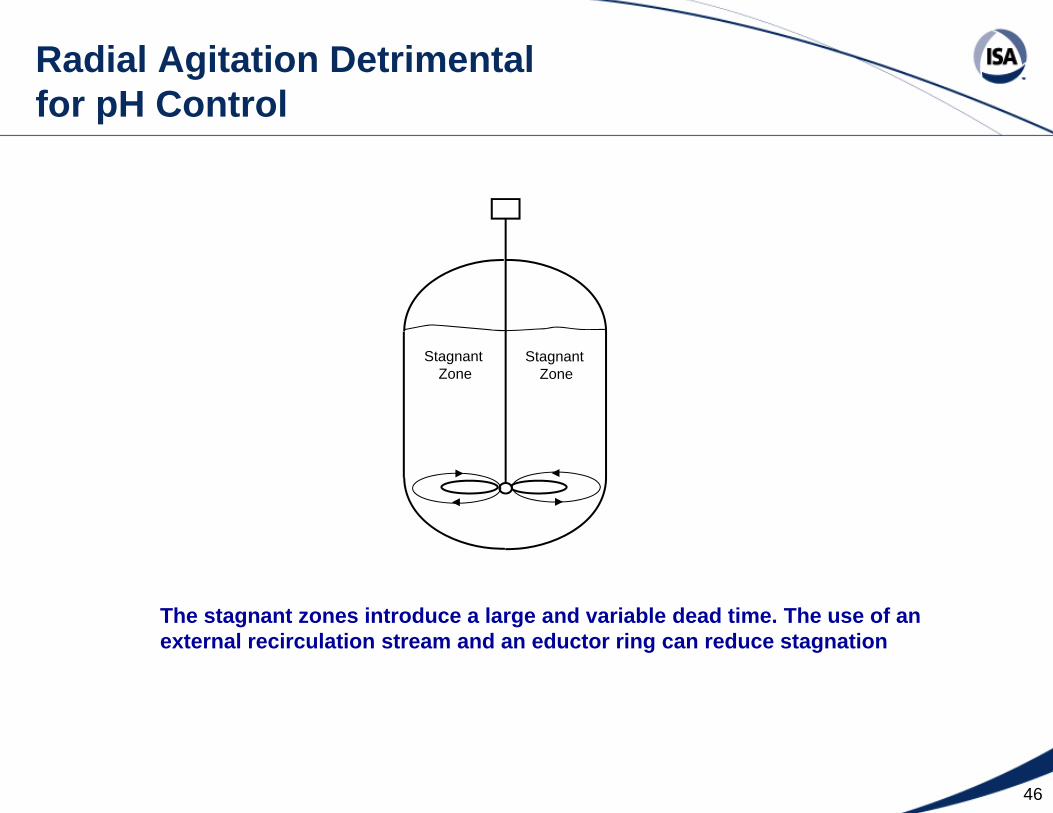
Radial Agitation Detrimental for pH Control
Stagnant Zone
Stagnant Zone
The stagnant zones introduce a large and variable dead time. The use of an external recirculation stream and an eductor ring can reduce stagnation
47
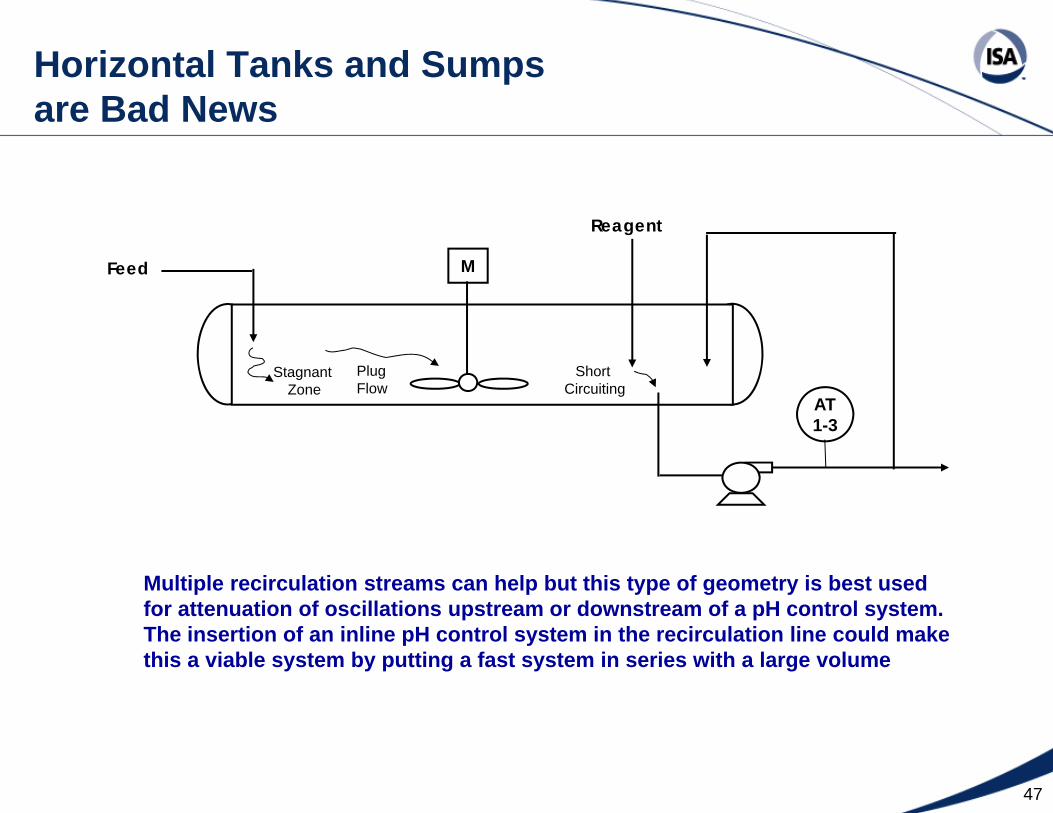
Horizontal Tanks and Sumps are Bad News
MFeed
Reagent
AT 1-3
Short Circuiting
Stagnant Zone
PlugFlow
Multiple recirculation streams can help but this type of geometry is best usedfor attenuation of oscillations upstream or downstream of a pH control system.The insertion of an inline pH control system in the recirculation line could makethis a viable system by putting a fast system in series with a large volume
48
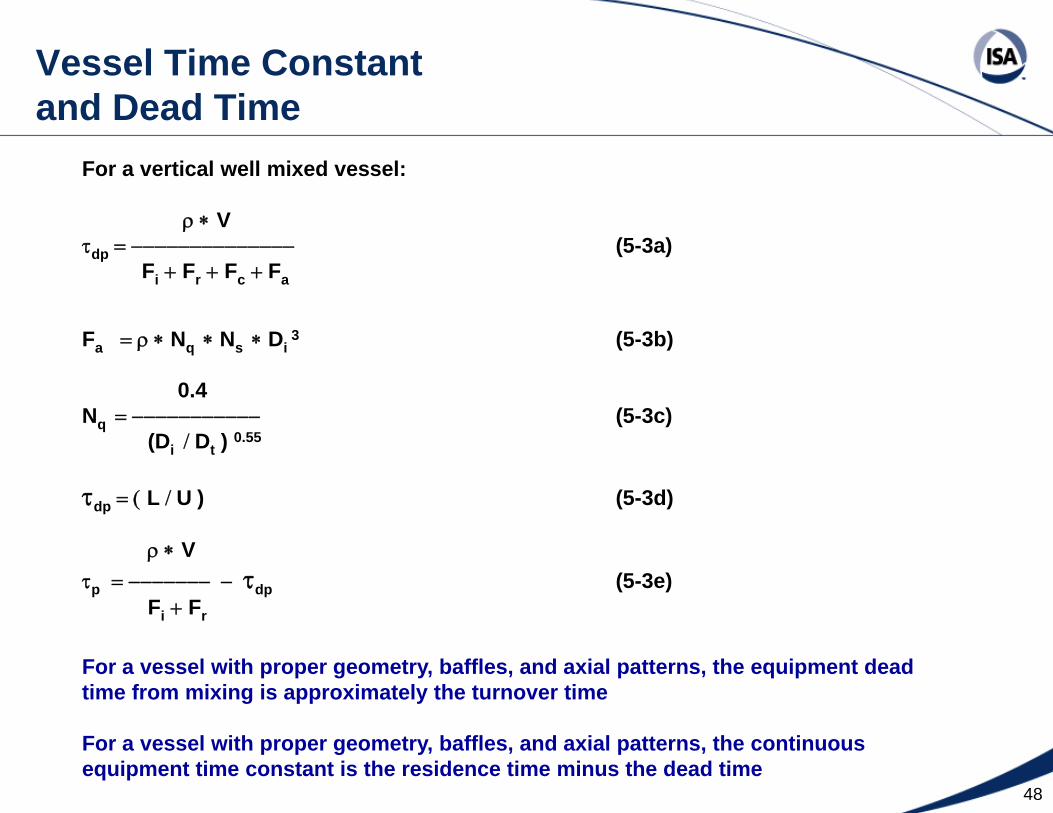
Vessel Time Constant and Dead Time
For a vertical well mixed vessel:
ρ ∗ Vτdp = −−−−−−−−−−−−−− (5-3a)
Fi + Fr + Fc + Fa
Fa = ρ ∗ Nq ∗ Ns ∗ Di 3 (5-3b)
0.4Nq = −−−−−−−−−−− (5-3c)
(Di / Dt ) 0.55
τdp = ( L / U ) (5-3d)
ρ ∗ Vτp = −−−−−−− − τdp (5-3e)
Fi + Fr
For a vessel with proper geometry, baffles, and axial patterns, the equipment dead time from mixing is approximately the turnover time
For a vessel with proper geometry, baffles, and axial patterns, the continuous equipment time constant is the residence time minus the dead time
49
Equipment Dynamics Nomenclature
Where:
Di = impeller diameter (meter)Dt = tank inside diameter (meter)Fi = influent mass flow (kg per minute)Fr = reagent mass flow (kg per minute)Fc = recirculation mass flow (kg per minute)Fa = agitation mass flow (kg per minute)L = distance between inlet and outlet nozzles (meter)Nq = agitator discharge coefficient (0.4 to 1.4)Ns = agitator speed (revolutions per minute)ρ = average fluid density (kg per cubic meter)τdp = process dead time from mixing (minutes)τp = process time constant from mixing (minutes)U = average bulk velocity (meters per minute) V = vessel liquid volume (cubic meters)
50
Reagent Injection Delay
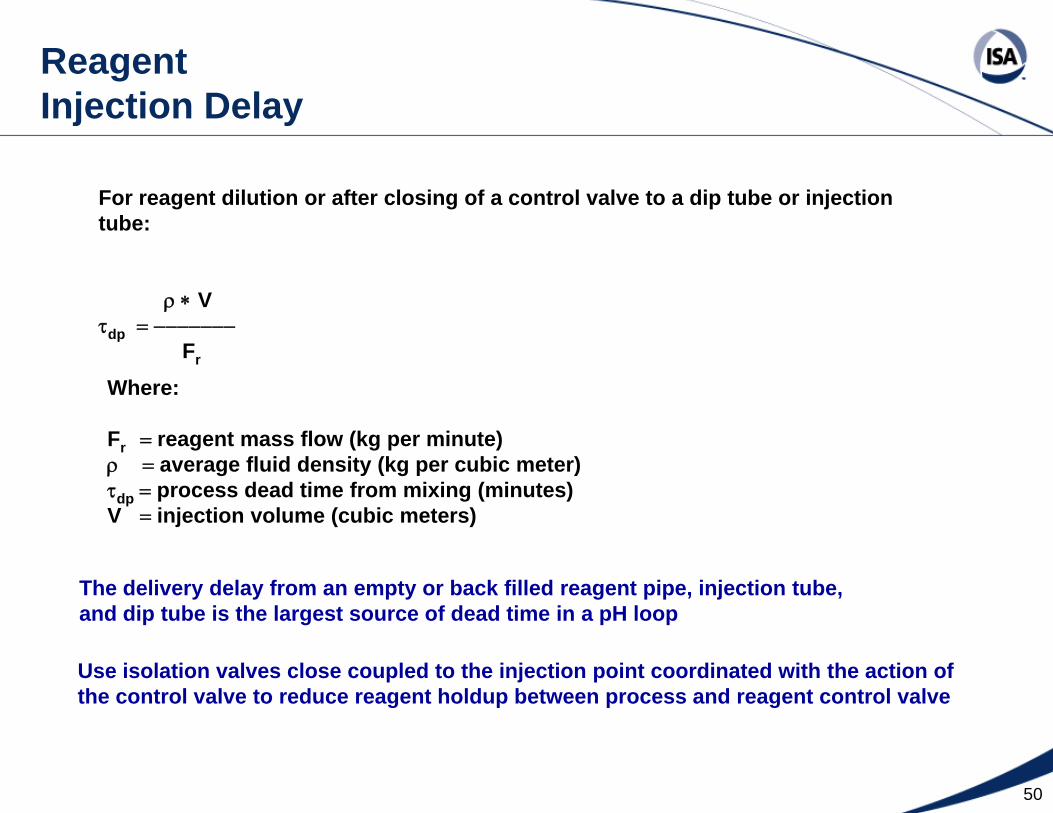
For reagent dilution or after closing of a control valve to a dip tube or injection tube:
ρ ∗ Vτdp = −−−−−−−
Fr
Where:
Fr = reagent mass flow (kg per minute)ρ = average fluid density (kg per cubic meter)τdp = process dead time from mixing (minutes)V = injection volume (cubic meters)
The delivery delay from an empty or back filled reagent pipe, injection tube, and dip tube is the largest source of dead time in a pH loop
Use isolation valves close coupled to the injection point coordinated with the action ofthe control valve to reduce reagent holdup between process and reagent control valve
51
Static Mixer - Good Radial but Poor Axial Mixing
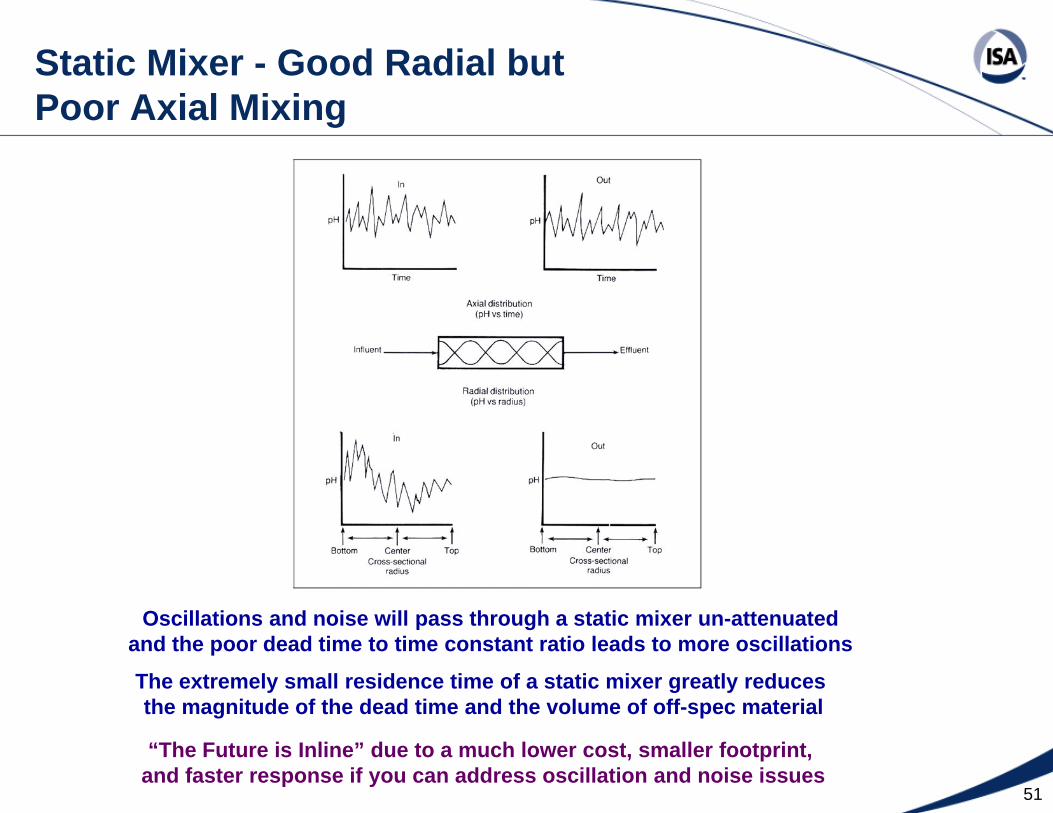
Oscillations and noise will pass through a static mixer un-attenuated and the poor dead time to time constant ratio leads to more oscillations
The extremely small residence time of a static mixer greatly reduces the magnitude of the dead time and the volume of off-spec material
“The Future is Inline” due to a much lower cost, smaller footprint, and faster response if you can address oscillation and noise issues
52
Attenuation of Oscillations by a Volume
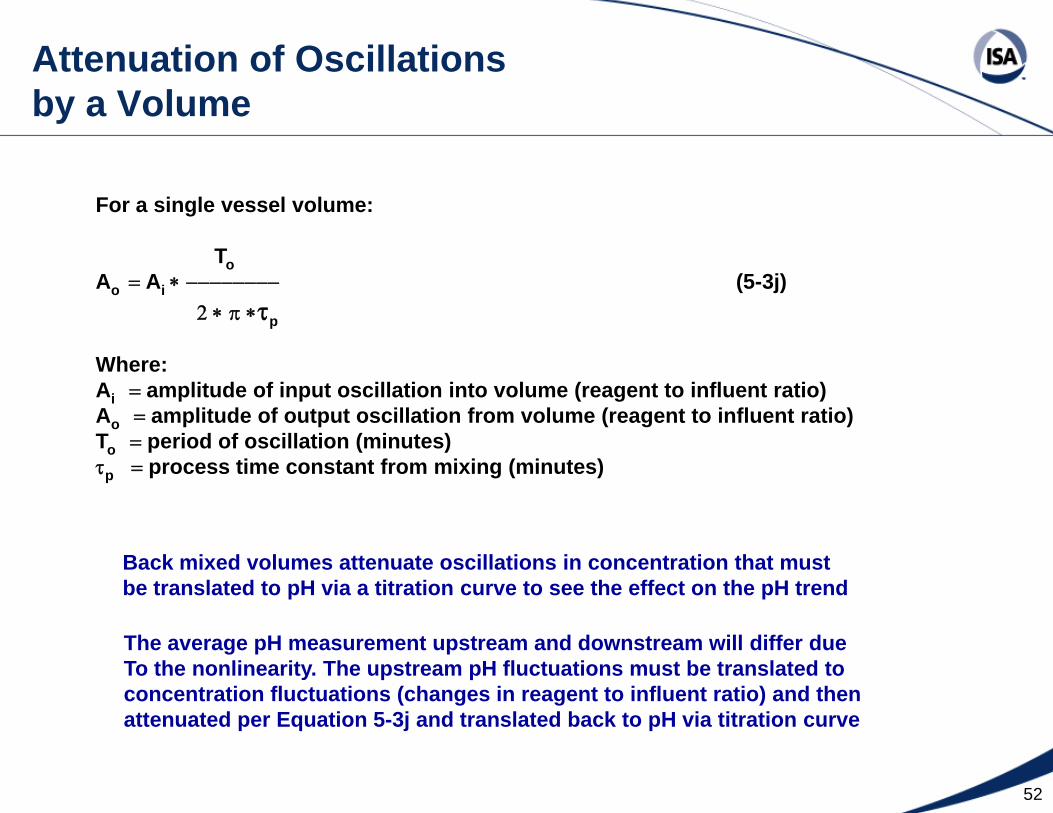
For a single vessel volume:
ToAo = Ai ∗ −−−−−−−− (5-3j)
2 ∗ π ∗τp
Where:Ai = amplitude of input oscillation into volume (reagent to influent ratio)Ao = amplitude of output oscillation from volume (reagent to influent ratio)To = period of oscillation (minutes)τp = process time constant from mixing (minutes)
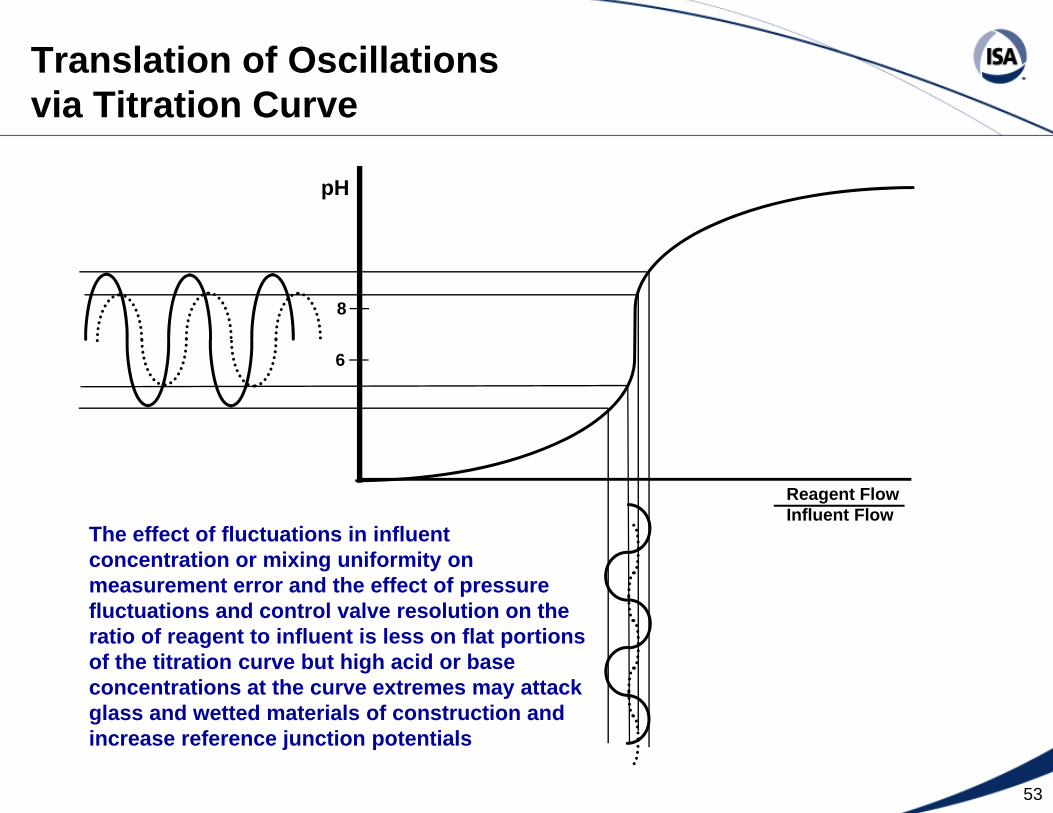
Back mixed volumes attenuate oscillations in concentration that must be translated to pH via a titration curve to see the effect on the pH trend
The average pH measurement upstream and downstream will differ dueTo the nonlinearity. The upstream pH fluctuations must be translated toconcentration fluctuations (changes in reagent to influent ratio) and then attenuated per Equation 5-3j and translated back to pH via titration curve
53
Translation of Oscillations via Titration Curve
pH
Reagent FlowInfluent Flow
6
8
The effect of fluctuations in influent concentration or mixing uniformity on measurement error and the effect of pressure fluctuations and control valve resolution on the ratio of reagent to influent is less on flat portions of the titration curve but high acid or base concentrations at the curve extremes may attack glass and wetted materials of construction and increase reference junction potentials
54
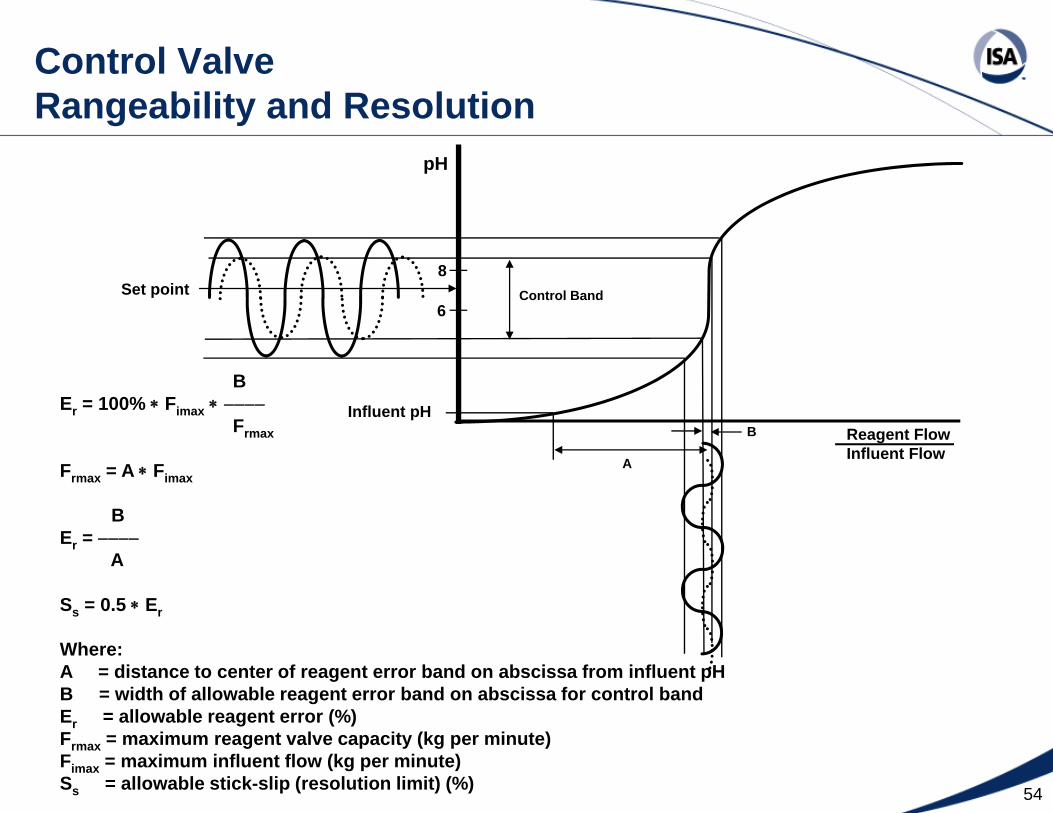
Control Valve Rangeability and Resolution
pH
Reagent FlowInfluent Flow
6
8
Influent pHB
A
Control BandSet point
BEr = 100% ∗ Fimax ∗ −−−−
Frmax
Frmax = A ∗ Fimax
BEr = −−−−
A
Ss = 0.5 ∗ Er
Where:A = distance to center of reagent error band on abscissa from influent pHB = width of allowable reagent error band on abscissa for control band Er = allowable reagent error (%)Frmax = maximum reagent valve capacity (kg per minute)Fimax = maximum influent flow (kg per minute)Ss = allowable stick-slip (resolution limit) (%)
55
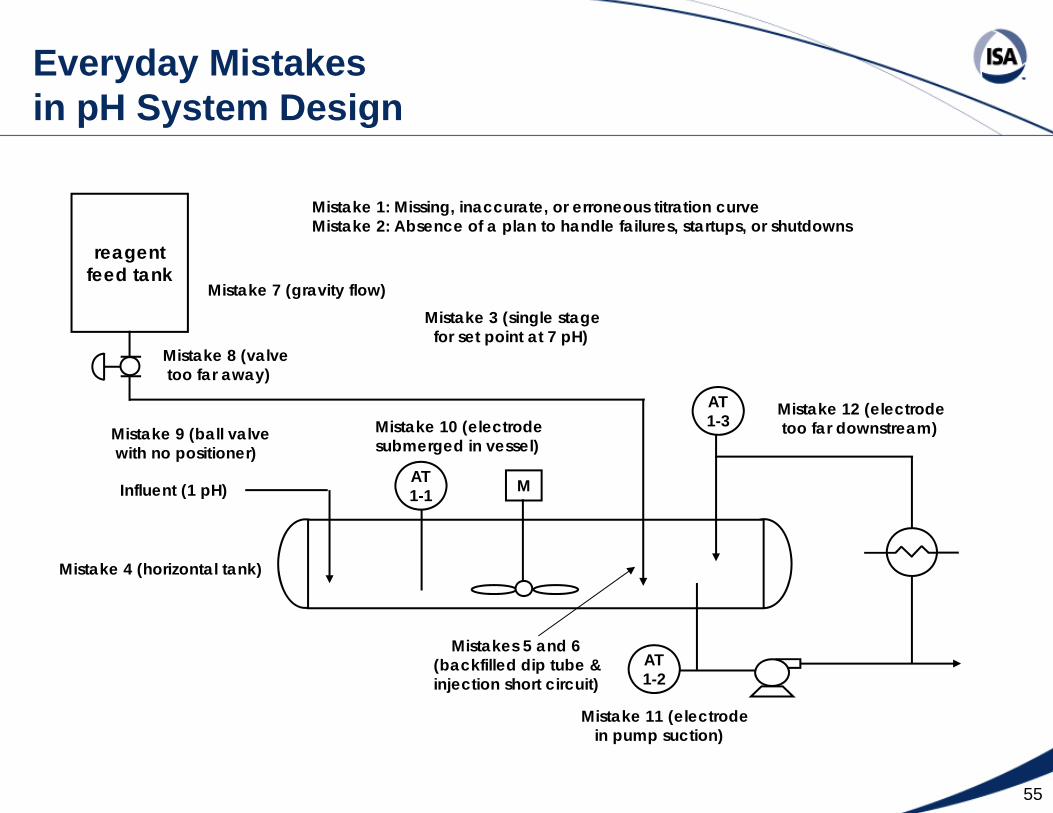
Everyday Mistakes in pH System Design
M
Mistake 7 (gravity flow)
AT 1-1
AT 1-3
AT 1-2
Mistake 4 (horizontal tank)
reagentfeed tank
Mistakes 5 and 6(backfilled dip tube &injection short circuit)
Mistake 11 (electrodein pump suction)
Mistake 8 (valvetoo far away)
Mistake 9 (ball valvewith no positioner)
Mistake 10 (electrodesubmerged in vessel)
Mistake 12 (electrodetoo far downstream)
Mistake 3 (single stage for set point at 7 pH)
Influent (1 pH)
Mistake 1: Missing, inaccurate, or erroneous titration curveMistake 2: Absence of a plan to handle failures, startups, or shutdowns

56
Inline and Tank Control System Performance
The Inline system has the fastest recovery time and lowest cost but due to thelack of back mixing, the signal will wildly fluctuate for set points on the steeppart of the titration curve. A signal filter (e.g. 12 sec) or reagent demand controlattenuate the oscillations but an offset from the set point is seen downstream
The tank responses shown above assumes a negligible reagent delivery delay and arethus faster than typical. In most systems the reagent injection delay is so large due to a dip tube, the period of oscillation is 10x slower than what is seen in an inline system
57
Methods to Reduce Capital and Operating Costs
• Use inline systems to replace vessels• Use online models to provide inferential measurements of influent
concentrations, 3rd voting pH measurement for tough applications, and online titration curves for reagent demand control and adaptive control
• Use high resolution valves and advanced process control to:– Reduce vessel size– Eliminate a stage of neutralization– Reduce reagent costs– Eliminate out-of-spec effluent
58
Feed
ReagentReagent
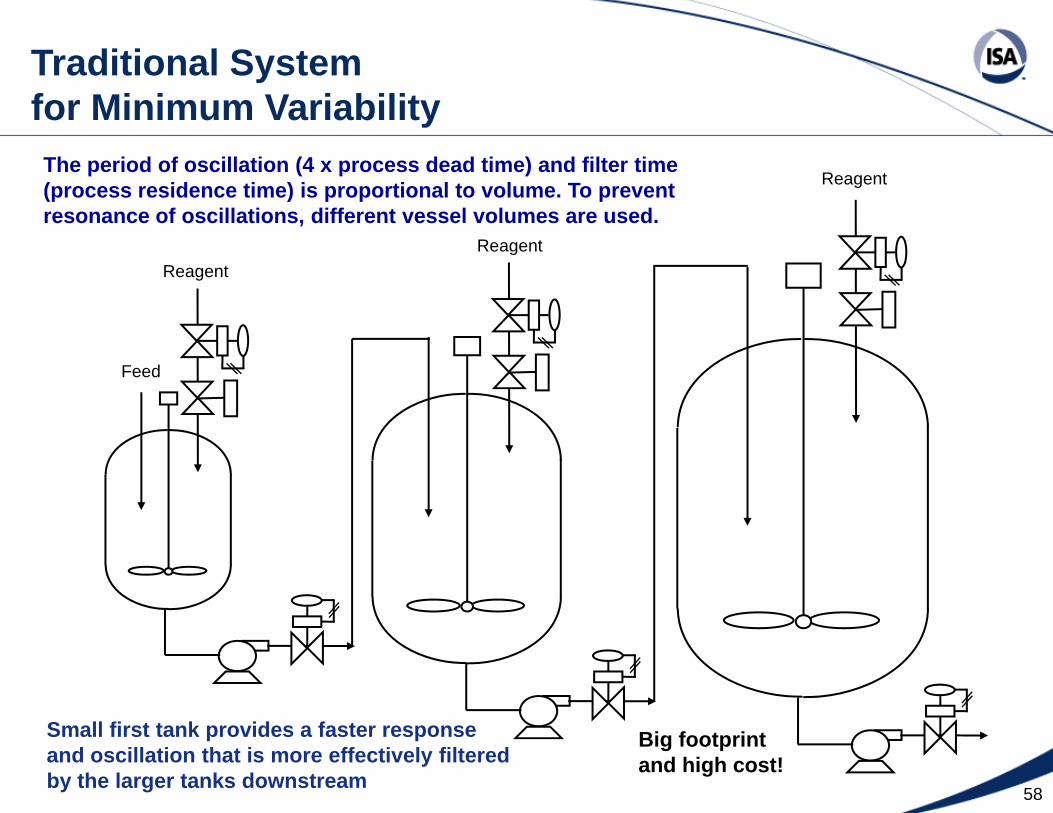
ReagentThe period of oscillation (4 x process dead time) and filter time(process residence time) is proportional to volume. To preventresonance of oscillations, different vessel volumes are used.
Small first tank provides a faster responseand oscillation that is more effectively filtered by the larger tanks downstream
Big footprintand high cost!
Traditional System for Minimum Variability
59
Reagent
Reagent
Feed
Reagent
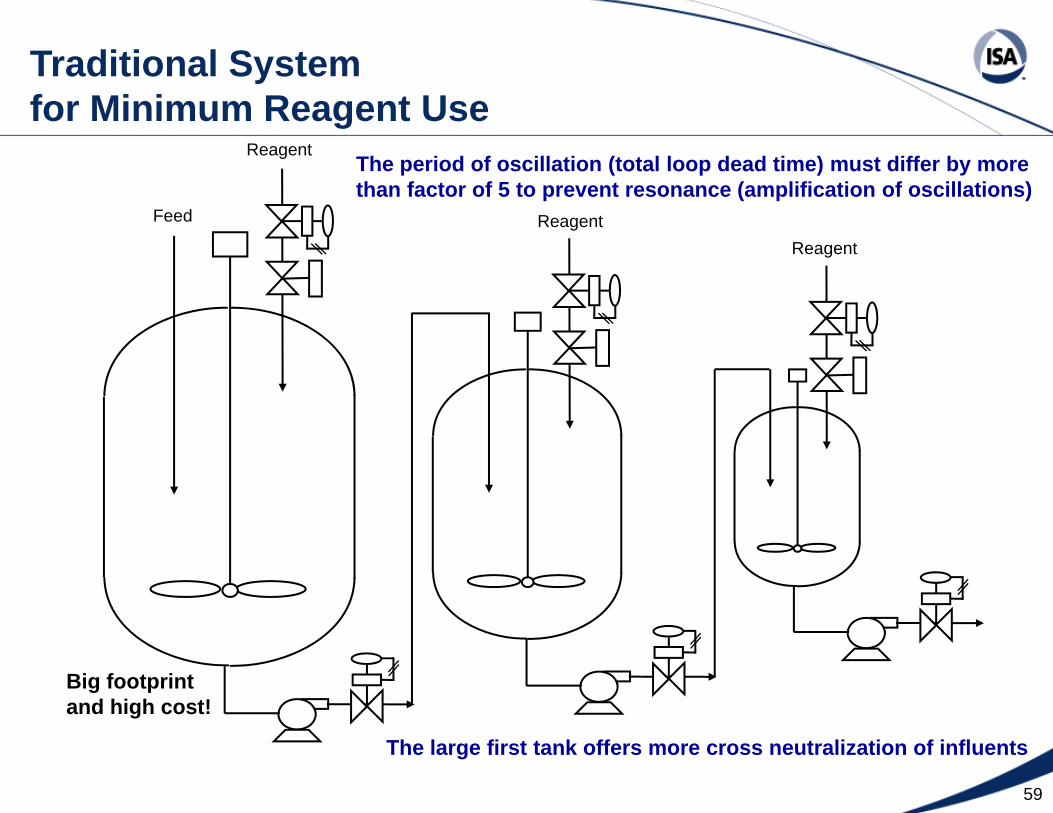
The period of oscillation (total loop dead time) must differ by morethan factor of 5 to prevent resonance (amplification of oscillations)
The large first tank offers more cross neutralization of influents
Big footprintand high cost!
Traditional System for Minimum Reagent Use
60
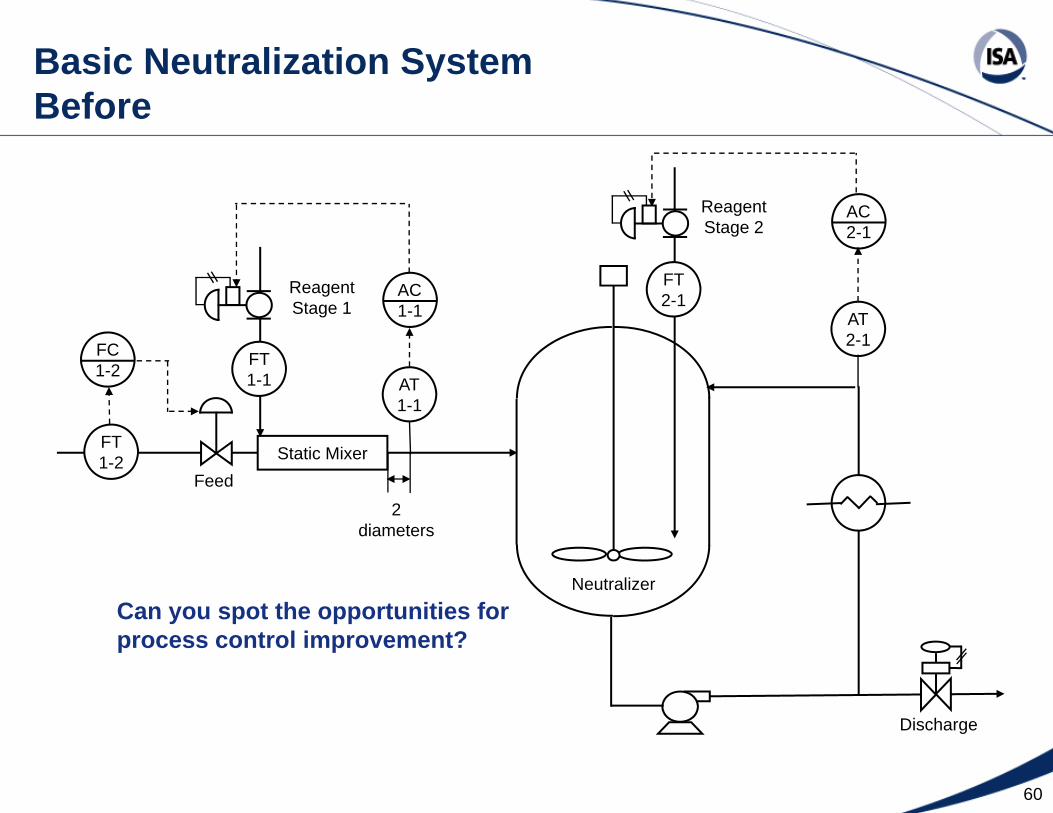
Basic Neutralization System Before
Static Mixer
AC 1-1
Neutralizer
Feed
Discharge
AT 1-1
FT 1-1
FT 2-1
AC 2-1
AT 2-1FC
1-2
FT 1-2
2diameters
ReagentStage 1
ReagentStage 2
Can you spot the opportunities forprocess control improvement?
61
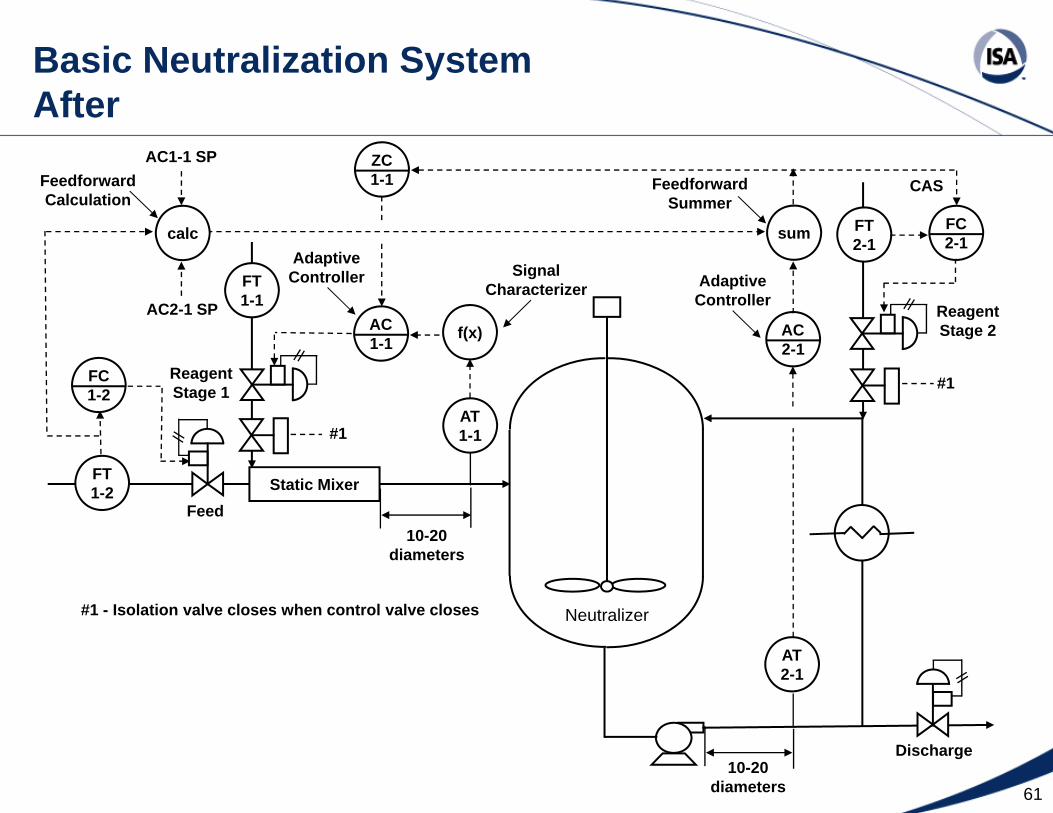
Basic Neutralization System After
10-20diameters
ZC 1-1 Feedforward
Summer
Static Mixer
AC 1-1
Neutralizer
Feed
Discharge
AT 1-1
FT 1-1
FT 2-1
AT 2-1
FC 1-2
FT 1-2
ReagentStage 1
ReagentStage 2
FC 2-1
AC 2-1
10-20diameters
f(x)
sum
CAS
SignalCharacterizer
#1
#1
#1 - Isolation valve closes when control valve closes
AdaptiveController
calc
AC2-1 SP
AC1-1 SPFeedforwardCalculation
AdaptiveController
62
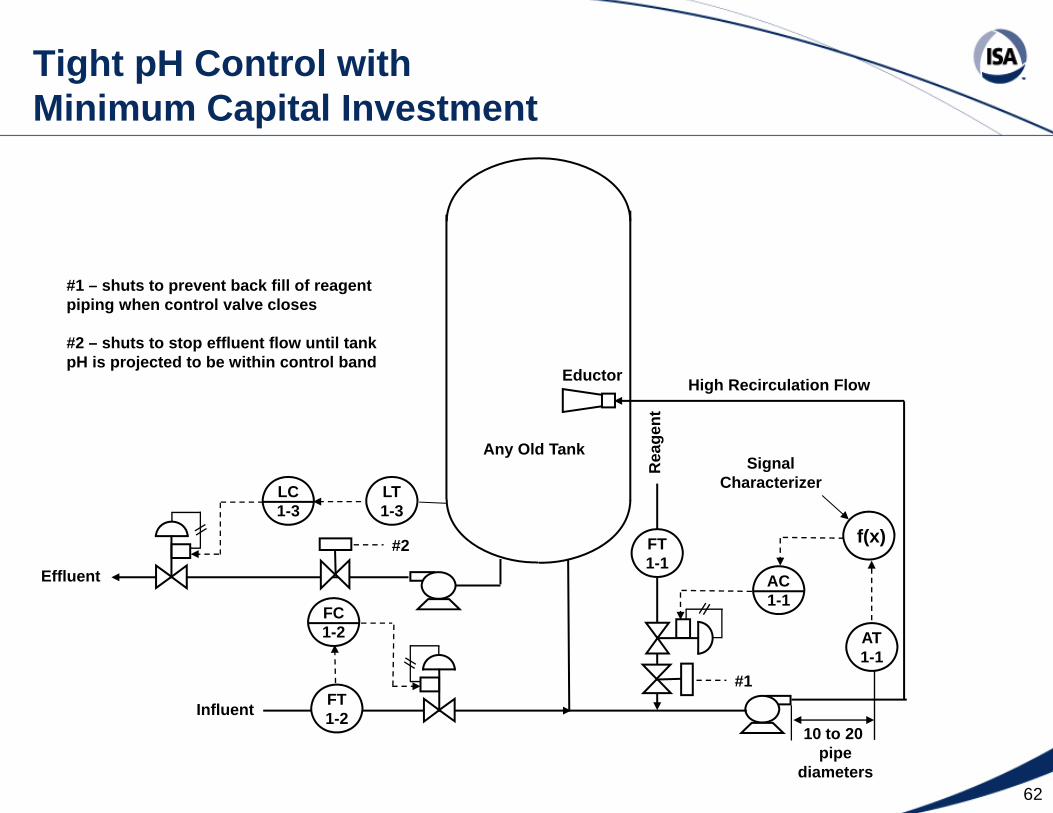
Tight pH Control with Minimum Capital Investment
Influent
FC 1-2
FT 1-2
Effluent AC 1-1
AT 1-1
FT 1-1
10 to 20 pipe
diameters
f(x)
#1R
eage
nt
High Recirculation Flow
Any Old TankSignal
Characterizer
#2
LT 1-3
LC 1-3
#1 – shuts to prevent back fill of reagent piping when control valve closes
#2 – shuts to stop effluent flow until tankpH is projected to be within control band
Eductor
63
Methods of Reducing Reagent Delivery Delays
• Locate reagent throttle valve at the injection point• Mount automatic on-off isolation valve at the injection point• Reduce diameter and length (volume) of injector or dip tube• Dilute the reagent upstream to increase reagent flow rate• Inject reagent into vessel side just past baffles• Inject reagent into recirculation line just before vessel entry• Inject reagent into feed line just before vessel entry• Reduce reagent control valve sticktion and deadband
The benefits of feedforward are realized only if the correction arrives at aboutthe same time as the disturbance at the point of the pH measurement. Since the disturbance is usually in a high flow influent stream, any reagent delivery delays severely diminish the effectiveness of feedforward besides feedback control because the disturbance hits the pH measurement before the correction.
64
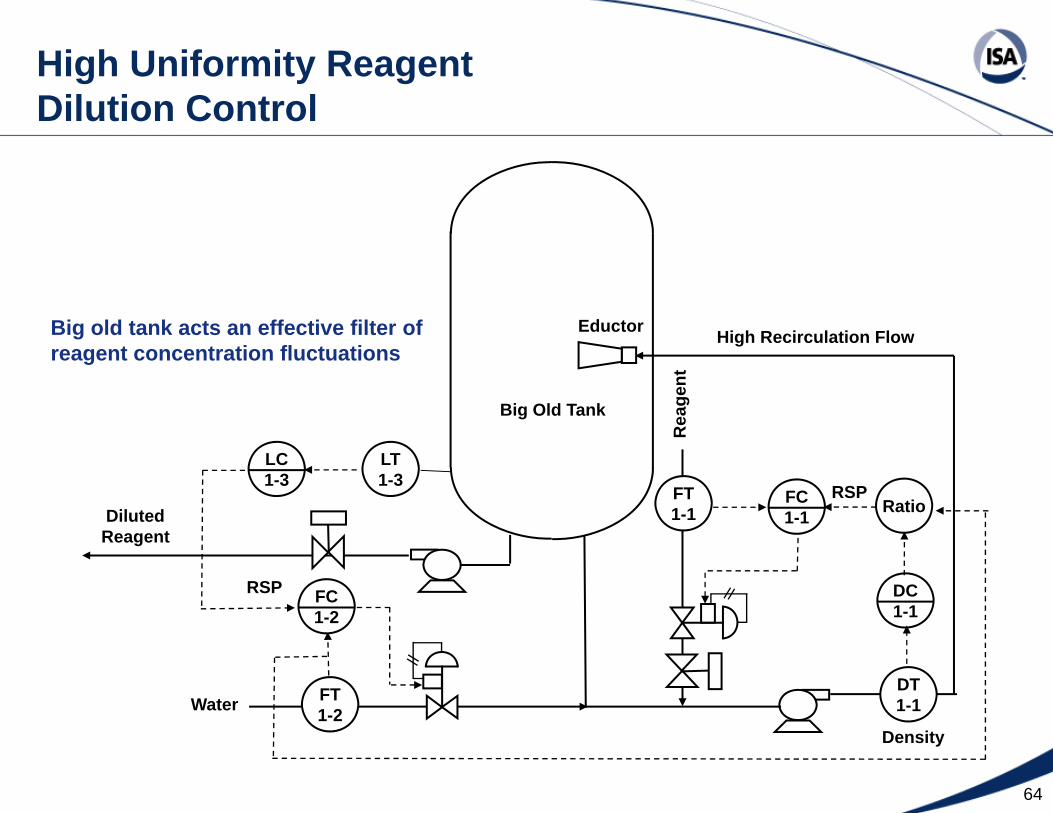
High Uniformity Reagent Dilution Control
Water
FC 1-2
FT 1-2
DilutedReagent
DC 1-1
DT 1-1
FT 1-1
Rea
gent
High Recirculation Flow
Big Old Tank
LT 1-3
LC 1-3
Eductor
FC 1-1 Ratio
Density
RSP
RSP
Big old tank acts an effective filter ofreagent concentration fluctuations

65
Cascade pH Control to Reduce Downstream Offset
M
AT 1-2
Static MixerFeed
AT 1-1
FT 1-1
FT 1-2
Reagent
10 to 20pipe
diameters
SumFC 1-1
Filter
Coriolis MassFlow Meter
f(x)
AC 1-1
AC 1-2
PV signalCharacterizer
RSP
f(x)
Flow Feedforward
SP signalcharacterizer
Trim of InlineSet Point
IntegralOnly
Controller
Linear ReagentDemand Controller
Any Old Tank
66
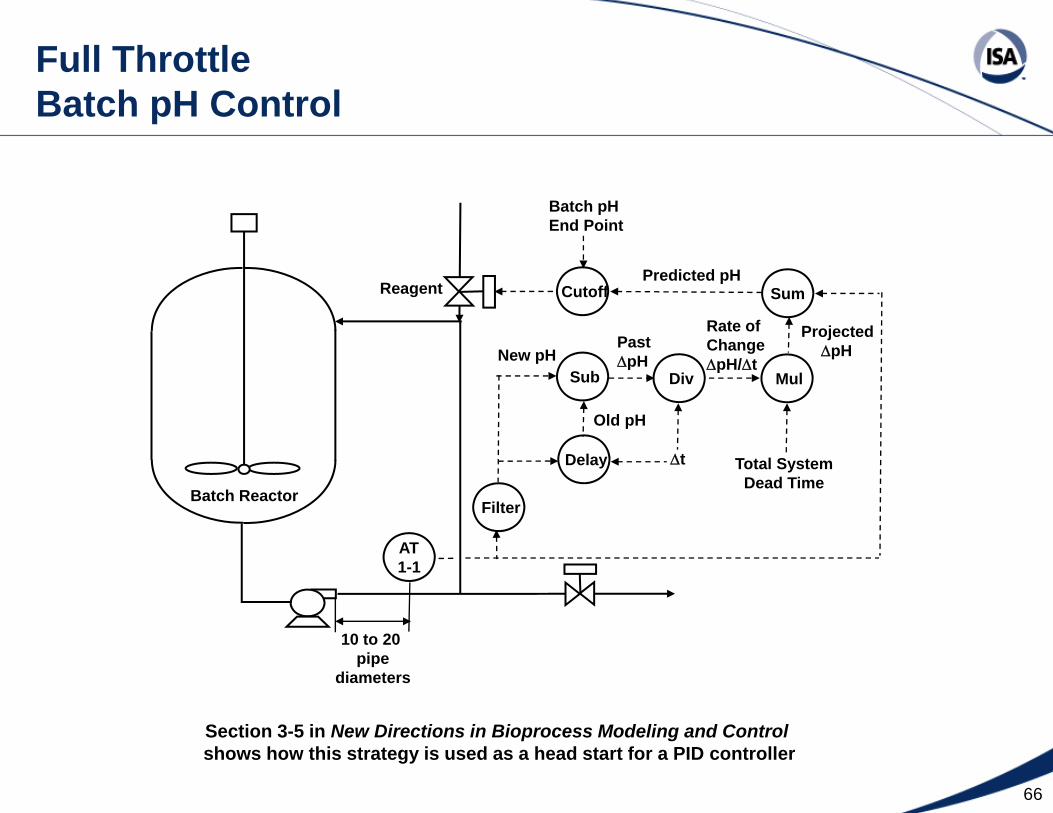
Full Throttle Batch pH Control
Batch Reactor
AT 1-1
10 to 20 pipe
diameters
Filter
Delay
Sub Div
Sum
Δt
Cutoff
PastΔpH
Rate ofChangeΔpH/Δt
Mul
Total SystemDead Time
ProjectedΔpHNew pH
Old pH
Batch pH End Point
Predicted pHReagent
Section 3-5 in New Directions in Bioprocess Modeling and Controlshows how this strategy is used as a head start for a PID controller
67
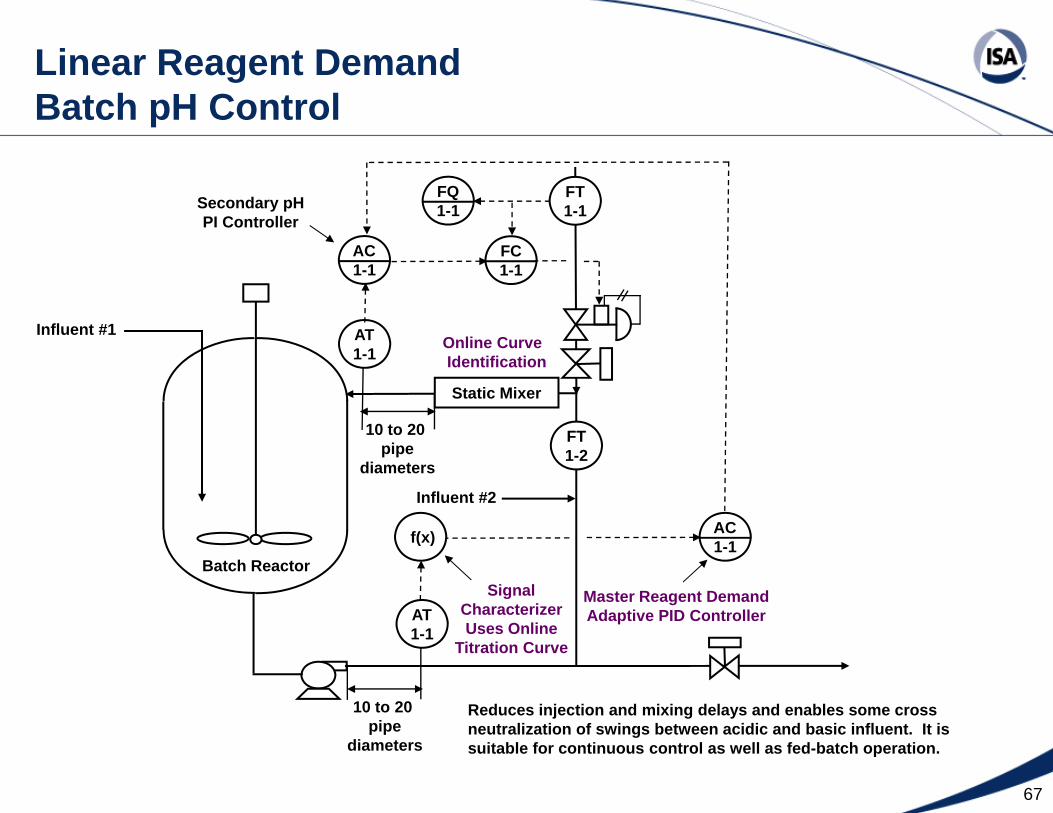
Linear Reagent Demand Batch pH Control
Batch Reactor
AC 1-1
AT 1-1
10 to 20 pipe
diameters
f(x)
Master Reagent DemandAdaptive PID Controller
Static Mixer
AC 1-1
AT 1-1
10 to 20 pipe
diameters
Secondary pHPI Controller
Signal CharacterizerUses Online
Titration Curve
FT 1-1
FC 1-1
FQ 1-1
FT 1-2
Online CurveIdentification
Influent #1
Reduces injection and mixing delays and enables some crossneutralization of swings between acidic and basic influent. It issuitable for continuous control as well as fed-batch operation.
Influent #2
68
Linear Reagent Demand Control(PV is X axis of Titration Curve)
• Signal characterizer converts PV and SP from pH to % Reagent Demand– PV is abscissa of the titration curve scaled 0 to 100% reagent demand– Piecewise segment fit normally used to go from ordinate to abscissa of curve– Fieldbus block offers 21 custom space X,Y pairs (X is pH and Y is % demand)– Closer spacing of X,Y pairs in control region provides most needed compensation– If neural network or polynomial fit used, beware of bumps and wild extrapolation
• Special configuration is needed to provide operations with interface to:– See loop PV in pH and signal to final element– Enter loop SP in pH– Change mode to manual and change manual output
• Set point on steep part of curve shows biggest improvements from: – Reduction in limit cycle amplitude seen from pH nonlinearity– Decrease in limit cycle frequency from final element resolution (e.g. stick-slip)– Decrease in crossing of split range point– Reduced reaction to measurement noise– Shorter startup time (loop sees real distance to set point and is not detuned)– Simplified tuning (process gain no longer depends upon titration curve slope)– Restored process time constant (slower pH excursion from disturbance)
69
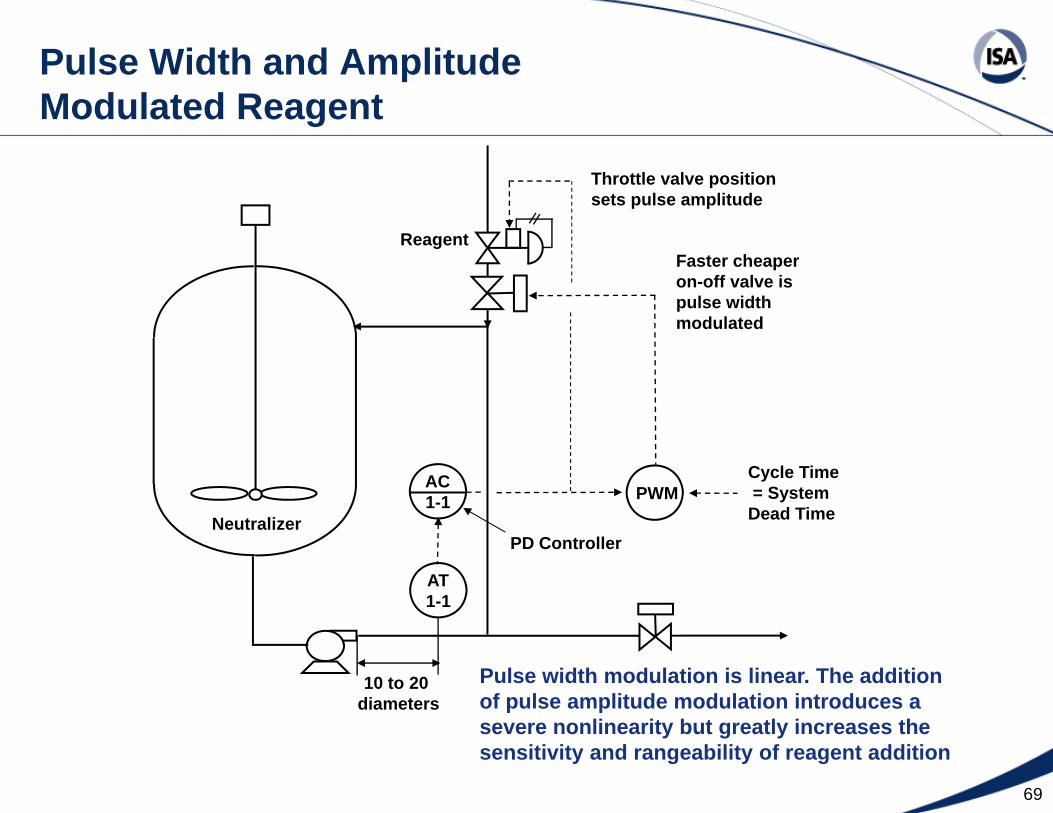
Pulse Width and Amplitude Modulated Reagent
Neutralizer
AC 1-1
Reagent
AT 1-1
10 to 20 diameters
PWM
Faster cheaperon-off valve ispulse width modulated
PD Controller
Cycle Time= SystemDead Time
Throttle valve positionsets pulse amplitude
Pulse width modulation is linear. The additionof pulse amplitude modulation introduces asevere nonlinearity but greatly increases thesensitivity and rangeability of reagent addition
70
• pH electrodes offer by far the greatest sensitivity and rangeability of any measurement. To make the most of this capability requires an incredible precision of mixing, reagent manipulation, and nonlinear control. pH measurement and control can be an extreme sport
• Solution pH changes despite a constant hydrogen ion concentration because of changes in water dissociation constant (pKw) with temperature, and activity coefficients with ionic strength and water content
• Solution pH changes despite a constant acid or base concentration because of changes in the acid or base dissociation constants (pKa) with temperature
• Titration curves have no straight lines A zoom in on any supposed line should reveal another curve if there are sufficient data points
• Slope of titration curve at the set point has the greatest effect on the tightness of pH control as seen in control valve resolution requirement. The next most important effect is the distance between the influent pH and the set point that determines the control valve rangeability requirement
• Titration curves are essential for every aspect of pH system design and analysis• First step in the design of a pH system is to generate a titration curve at the
process temperature with enough data points to cover the range of operation and show the curvature within the control band (absolute magnitude of the difference between the maximum and minimum allowable pH)
Key Insights
71
• The time that glass electrodes are left dry or exposed to high and low pH solutions must be minimized to maximize the life of the hydrated gel layer
• Most accuracy statements and tests are for short term exposure before changes in the glass gel layer or reference junction potential are significant
• The pH measurement error may look smaller on the flatter portion of a titration curve but the associated reagent delivery error is larger
• The cost of pH measurement maintenance can be reduced by a factor of ten by more realistic expectations and calibration policies
• The onset of a coating of the glass measurement electrode shows up as a large increase in its time constant and response time
• The onset of a non conductive coating of the reference electrode shows up as a large increase in its electrical resistance
• Non-aqueous and pure water streams require extra attention to shielding and process path length and velocity to minimize pH measurement noise
• Slow references may be more stable for short term fluctuations from imperfect mixing and short exposure times from automated retraction
• The fastest and most accurate reference has a flowing junction but it requires regulated pressurization to maintain a small positive electrolyte flow
• The best choice might not be the best technical match to the application but the electrode with the best support by maintenance and operations and vendor
• For pH < 1 or > 12 consider conductivity or Coriolis measurements
Key Insights
72
• For non abrasive solids, installation in a recirculation line with a velocity of 5 to 9 fps downstream of a strainer and pump may delay onset of coatings
• For abrasive solids and viscous fluids, a thick flat glass electrode can minimize coatings, stagnant areas, and glass breakage
• For high process temperatures, high ion concentrations, and severe fouling, consider automatic retractable assemblies to reduce process exposure
• When the fluid velocity is insufficient to sweep electrodes clean, use an integral jet washer or a cleaning cycle in a retractable assembly
• The control system should schedule automated maintenance based on the severity of the problem and production and process requirements
• pH measurements can fail anywhere on or off the pH scale but middle signal selection will inherently ride out a single electrode failure of any type
• Equipment and piping should have the connections for three probes but a plant should not go to the expense of installing three measurements until the life expectancy has been proven to be acceptable for the process conditions
• The more an electrode is manually handled, the more it will need to be removed• A series installation of multiple probes insures the electrodes will see the same
velocity and mixture that is important for consistent performance• Wireless pH measurements can be used to find optimum sensor technology
and sensor location and eliminate spikes from electrical noise
Key Insights

73
• Use properly sized sliding stem (globe) reagent valves with diaphragm actuators, tuned digital positioners, and properly tightened low friction packing
• The extremely small reagent valves used in pH control are prone to improper sizing, irregular flow characteristics, greater stick-slip, and plugging
• The extremely small reagent valves used in pH control may be operating in laminar flow where the flow is proportional to pressure drop or even worse in the transition region where the flow response is erratic
• To prevent plugging and a transition to laminar flow for pH control on a well mixed volume, use pulse width modulation
• Most statements in the literature as to valve rangeability are erroneous because they ignore the installed valve gain and stick-slip
• The reagent flow required for neutralization is usually so small that the installed valve characteristic is the inherent trim characteristic
• A small plug flow volume may have a smaller integrated error than a large back mixed volume because the dead time magnitude is smaller
• For large volumes, maximize back mixing and minimize plug flow to minimize the error from load upsets and the effects of the pH nonlinearity
• For a vessel with proper geometry, baffles, and axial patterns, the equipment dead time from mixing is approximately the turnover time
• The actual equipment dead time is often larger than the turnover time because of non ideal mixing patterns and fluid entry and exit locations
Key Insights
74
• A system considered to be well mixed may be poorly mixed for pH control • To be “well mixed” for pH control, the deviation in the reagent to influent flow
from non ideal mixing multiplied by the process gain must be well within the control band
• Back mixing (axial mixing) creates a beneficial process time constant and plug flow or radial mixing creates a detrimental process dead time for pH control
• The agitation in a vessel should be vertical axial pattern without rotation and be intense enough to break the surface but not cause froth
• The actual equipment dead time is often larger than the turnover time because of non ideal mixing patterns and fluid entry and exit locations
• Horizontal tanks are notorious for short circuiting, stagnation, and plug flow that cause excessive dead time and an erratic pH response
• The dead time from back filled reagent dip tubes or injection piping is huge• To provide isolation, use a separate on-off valve and avoid the specification of
tight shutoff and high performance valves for throttling reagent • Set points on the steep portion of a titration curve necessitate a reagent control
valve precision that goes well beyond the norm and offers the best test to determine a valve’s actual stick-slip in installed conditions
• Reagent valve stick-slip may determine the number of stages of neutralization required, which has a huge impact on a project’s capital cost
Key Insights
75
• For a vessel with proper geometry, baffles, and axial patterns, the continuous equipment time constant is the residence time minus the dead time
• For batch operations without acid-base reactions, there is no steady state and the concentration ramp is described by an integrator gain rather than a time constant
• Horizontal tanks are notorious for short circuiting, stagnation, and plug flow that cause excessive dead time and an erratic pH response
• Back mixed volumes attenuate oscillations in concentration that must be translated to pH via a titration curve to see the effect on the pH trend
• An un-agitated vessel with a pH control loop can be turned from a terrible loser into a big time winner by moving the loop upstream or downstream
• Use volumes upstream to reduce reagent use and smooth out disturbances and volumes downstream to reduce pH constraint violations
• Oscillations and noise will pass through a static mixer un-attenuated and the poor dead time to time constant ratio leads to more oscillations but the extremely small residence time of a static mixer greatly reduces the magnitude of the dead time and the volume of off-spec material. pH measurements or online estimators on a downstream volume can reveal that a static mixer loop is doing a great job
• pH control loops should not be installed on sumps, ponds, and lagoons but on a static mixer or vertical well mixed vessel upstream or downstream
Key Insights

76
• A split range gap adds dead time and a split range overlap increases the severity of a limit cycle from slip stick and increases reagent use
• Use a split range gap that is about twice the stick-slip or the potential error in the positioner calibration, whichever is largest
• Split ranging and signal reversing is better implemented in a Fieldbus function block than via a special calibration of an I/P or positioner
• Split ranging and signal reversing is better implemented in a Fieldbus function block than via a special calibration of an I/P or positioner
• Gaseous and solid reagents often have huge hidden costs from additional reagent consumption, emission, solids disposal, and maintenance costs
• The delivery delay from an empty or back filled reagent pipe, injection tube, and dip tube is the largest source of dead time in a pH loop
• The best method of reducing reagent delivery delay and mixing dead time is to inject the reagent into a high feed or recirculation flow
• While the shape of the titration curve doesn’t change much by dilution, dilution can dramatically decrease reagent delivery delays, improve reagent addition reproducibility by eliminating transitions to laminar flow, increase valve reliability by reducing plugging, and enhance mixing by increasing the reagent injection velocity and reducing the differences in viscosity and density between the reagent and the influent, which is a normally a dilute water stream
Key Insights

77
• More so than for any other loop, it is important to reduce dead time for pH control because it reduces the effect of the nonlinearity
• The effectiveness of feedforward control greatly depends upon the ability to eliminate reagent delivery delays
• If there is a reproducible influent flow measurement use flow feedforward, otherwise use a head start or full throttle logic for startup
• The reliability and error of a pH feedforward is unacceptable if the influent pH measurement is on the extremities of the titration curve
• Except for fast inline systems, use cascade control of pH to reagent flow to compensate for pressure upsets and enable flow feedforward
• Use adaptation of the charge balance model pH or online identification of the titration curve to compensate for a distortion of the curve
• Linear reagent demand can restore the time constant and capture the investment in well mixed vessels, provide a unity gain for the process variable, simply and improve controller tuning, suppress oscillations and noise on the steep part of the curve, and speed up startup and recovery from the flat part of the curve
Key Insights
78
Resource