pgl annual report 2010-11
TRANSCRIPT

8/2/2019 PGL Annual Report 2010-11
http://slidepdf.com/reader/full/pgl-annual-report-2010-11 1/76

8/2/2019 PGL Annual Report 2010-11
http://slidepdf.com/reader/full/pgl-annual-report-2010-11 2/76

8/2/2019 PGL Annual Report 2010-11
http://slidepdf.com/reader/full/pgl-annual-report-2010-11 3/76
contentscontent
To be amongst the
top three speciality glass
manufacturers in the world.
Chairman’s Letter 2
Management Discussion & Analysis 4
Corporate Governance 12
Notice 23
Directors’ Report 25
Auditors’ Report 33
Balance Sheet 3
Profit & Loss Account 3
Cash Flow Statement 3
Schedules 4
Notes to Accounts 4
Consolidated Financial Statements 5
Piramal Glass Limi

8/2/2019 PGL Annual Report 2010-11
http://slidepdf.com/reader/full/pgl-annual-report-2010-11 4/76
Dear Shareholders,
Warm greetings to you all!
FY-11 has been a year of robust performance for Piramal Glass.
Our Company continues to move forward on its vision of global leadership in special
glass packaging (flacconage). This year marked strides in growth of Piramal Glass. T
investments made by the Company in the last several years in terms of acquisition of a lo
making company in the USA and the substantial capital investment in expansion both
Sri Lanka and India have started bearing fruits.
The Company has been able to achieve this performance on the back of improved operatio
and better financial management including that of all its subsidiaries.
The Company’s consolidated revenue for the year grew by 10.4% to ` 12,184.6 million. T
Operating Profit before Interest Depreciation and Tax grew by 39% to ` 3,066.7 millio
The PBIDT to Sales was 25% as compared to 20% of sales of last year. The Net Profit fthe year was ` 1,033 million as compared to a PAT of ` 32 million last year.
Indian operations have seen a renewed focus on Cosmetics and Perfumery sector wi
now around 60% sales coming from C&P, with an emphasis on Premium segment. We ha
successfully executed multiple projects for marquee global brands from India this year. S
Lankan operations have seen a significant improvement in efficiency and capacity utilizati
on the back of an improved product mix to report an EBITDA of 36.3% (up from 31% la
year). The product mix improvement is also from the fact that in addition to catering
Domestic Market in Sri Lanka, we are now consolidating our presence in high value add
specialty beverage markets in India, South Africa and Australia.
We are happy to see a robust customer base develop in USA in the past 3-4 years, wisales increasing from USD 57 million during acquisition (in 2006) to USD 81 million th
year. We will continue to focus on the USA market for growth across all segments. US
will continue to act as a funnel for sourcing manufactured products from India. This ye
around 24% of USA sales were from products produced in India.
We have successfully repaid loans this year, based on strong cash profits and intern
accruals and have been able to reduce debt to equity from 3.5 to 2.6 this year. Lower geari
as well as a positive change in the mix of Rupee v/s Forex loans helped us keep our intere
rates in a similar range as in previous year in spite of a high interest rate environment th
we see today.
Cosmetics & Perfumery Division:
Our Cosmetics & Perfumery business grew by 25% from ` 4,820 million to ` 6,026 millio
We continue to win new customers as well as gain share of wallet from our customer ba
which includes international marquee brands globally. We are now a recognized name
a quality glass packaging vendor for the perfumery industry globally.
Chairman’s Letter
2 Piramal Glass Limited

8/2/2019 PGL Annual Report 2010-11
http://slidepdf.com/reader/full/pgl-annual-report-2010-11 5/76
With a view to further enhance C&P sales we have commenced a project for setting up a low cost mass furnace of 160 TPD. We have also recently converted 75 TPD amber furnace (for Pharmaceuticals) to 55 TPD flint furnace
for C&P this year to cater to the C&P market. With this the total capacity of C&P for PGL will be 600 TPD, making
it the second largest in the world in terms of capacity.
Pharmaceutical Division :
We continued to focus on high value added products in the pharmaceutical glass packaging market, in the
process rationalizing products and markets in favour of exports with a view to increase profitability. This
year we almost doubled our capacity for manufacturing high value added Borosilicate (USP Type I Glass) from
25 TPD to 45 TPD with an eye on the global markets.
Specialty Food and Beverages Division :
We focus on making high value Specialty Food and Beverages bottles from our operations in USA & Sri Lanka.
This segment had clocked a sale of ` 2,740 million as compared to a sale of ` 2,830 million in FY10, showing a
3% de-growth primary due to temporary drop in off-take by a leading brand in USA due to change in ownership.
Knowledge Action Care :
In line with our corporate values of “Knowledge, Action & Care”, we have been working on several initiatives
of Employee Engagement as well as a formal process of Manufacturing Excellence. The initiative of measuring
Employee Engagement with the help of the world renowned PCI Coffman continues this year with some of our
locations reporting global leadership high performance in Employee Engagement. It is a matter of great satisfaction
that the Company as a whole reported a 4.35 (on a scale of 5) rating which is 99th percentile in the global PCI
Coffman survey. We believe that the empowerment of our employees is one of our key factors of success and helps
realise our vision of global leadership.
On our Manufacturing Excellence journey, both our plants in India at Kosamba and Jambusar have beenindependently certified for Level 3 (as we go to print) in a 4 Level process of achieving global expertise. In Sri Lanka
too, we have embarked on the journey of Manufacturing Excellence and the Sri Lanka plants are now at Level 2.
I sincerely thank all our customers, employees, suppliers, bankers and shareholders for their confidence and support.
Warm regards,
Ajay G. Piramal
Chairman
Date : June 21, 2011
Piramal Glass Limi

8/2/2019 PGL Annual Report 2010-11
http://slidepdf.com/reader/full/pgl-annual-report-2010-11 6/76
Management Discussion & Analysis
Business Overview:
Piramal Glass Limited (PGL) is a manufacturer of glass containers for the Cosmetics & Perfumery, Pharmaceuticals and Sp
Food & Beverage industries. PGL manufactures a wide range of glass bottles and jars, in sizes ranging from 2 ml to 2.5 liters. P
manufacturing facilities in India, USA and Sri Lanka.
Market Overview:
Market Size
Cosmetics & Perfumery Global market size is estimated to be US$ 2.3 – US$ 2.5 billion
Pharmaceutical Global market size is estimated to be US$ 2.0 - US$ 2.3 billion
Specialty Food & Beverages is estimated to be US$ 1.3 - US$ 1.5 billion
Cosmetics & Perfumery Business:
The glass containers manufactured in Cosmetics & Perfumery are used to fill nail polish, perfumes, skin care creams, found
attars, etc. The main raw materials used are semi snow quartz, soda ash, lime stone powder.
This market is broadly classified into five segments depending on the end bottle price.
• Select
• MNC - MassClubbed as Premium Segment
• Low Mass
• Skin Care Clubbed as Mass Segment
• Nail Polish or Colour Cosmetics
PGL enjoys a global market share of 5.6% and is the only player from Asia with significant presence in the Premium segmen
Pharmaceuticals Business :
It caters to the requirements of Pharmaceutical industry in the product lines like molded vials, injectables and bottles. In
markets, PGL enjoys a leadership position with about 35% market share.
Specialty Food and Beverages Business:
The glass containers are used to fill boutique wine and high end liquor as well as small food bottles like jam jars.
Growth Drivers
Cosmetics & Perfumery (C&P)
The Cosmetics and Perfumery division of Piramal Glass caters to international marquee customers like LVMH, Yves Rocher, YSL
Unilever, Revlon, L’Oreal, Avon, P&G, Elizabeth Arden, Estee Lauder etc. apart from specialized localized manufacturers like D
LLC, Erkul Kozmetic, Compagnie De Diffussion, Niasi, Expak, Baralan International, Estico Ltd., Revolline Ltd. These custom
the glass bottles and jars for products like nail polish, make-up foundations, perfumes, skin care creams etc.
Traditionally the C&P glass bottles market was dominated by European players like SGD, Pochet, Gerresheimer, Heinz, Zi
Bormiolli Rocco and Bormiolli Luigi. Most of them are players with existence in these markets for more than a hundred yea
The industry is characterized by capital intensive equipments and although manufacturing is automated, forming of glass
and operations like sorting and decoration are skill and manual intensive.
PGL entered this space in 2000 with a foray into nail polish market and later low mass perfumes. Within a few years of foray
became a dominant player in the nail polish glass bottle market. Today PGL makes 1 out of every 2 nail polish bottles manufa
globally (PGL manufactured 1.72 billion pieces in FY11)
In 2007, after achieving leadership position in Nail Polish and Mass Perfume markets, under a long term strategy initiative, PGL e
the premium segment of C&P and today the segment is the prime focus of the company. In terms of capacity Piramal Glass h
of the largest installed capacity globally (345 TPD) and currently enjoys a market share of 5.6% worldwide (sales of ` 6026 m
MANAGEMENT DISCUSSION & ANALYSIS
4 Piramal Glass Limited

8/2/2019 PGL Annual Report 2010-11
http://slidepdf.com/reader/full/pgl-annual-report-2010-11 7/76
Investment in capacities, leveraging skills from our USA operations coupled with focus on world class business processes th
Manufacturing Excellence has helped the Company to attain this position
European glass manufacturers, due to recession in FY09 took a hit when the markets showed a negative growth of 20%. V
furnaces of European players were running at reduced utilization, and subsequently took a hit on profit margins. Piramal
on the other hand was relatively untouched primarily on account of low costs and diversified customer and geography mix
markets have since bounced back and almost all European players are at full capacity and some of them are expanding capa
The prime driving force for growth of PGL has been increased cost consciousness among western customers coupled with b
consumption of C&P in emerging economies due to growing young population, higher percentage of working women and incr
disposable income, resulting in a spurt in C&P sales in emerging economies particularly the BRIC countries (Brazil, Russia
and China).
These factors have resulted in more customers developing PGL, as a respectable glass manufacturer from Asia, as an alt
supplier. A successful execution of initial projects by PGL has helped the Company in winning a higher percentage of the bu
from existing customers.
Looking back we can say that we were newcomers when we started manufacturing nail polish in 2000. Since then we have
rapid strides to become the leading nail polish player. This growth story is being replicated in the perfumery space. In short,
poised to become a leading global supplier of C&P glass bottles in the world, and is already making rapid strides in that direc
PGL has been the fastest growing C&P glass company with a CAGR of 35% (FY05-FY11). In-order to cater to the growing d
and moving a step closer to the vision of “Top 3 flacconage manufacturers in the world” PGL is increasing the capacity in C&
current 345 TPD to 600 TPD.
This increase in capacity is both on account of a Greenfield project of 160 TPD in Jambusar and capacity up-gradation of ex
furnaces for Premium as well as converting 75 TPD from Pharma into C&P.
Pharmaceutical:
The Pharmaceutical glass container division manufactures amber bottles, amber and flint vials for liquid oral formulations, inje
etc. Products manufactured conform to US, Indian and European pharmacopeia in Type I, Type II and Type III formulations
is a leading supplier of glass containers to both multinational and Indian pharmaceutical companies like GlaxoSmithKline,
Cipla, Abbott, Alembic, Ranbaxy, E-Merck, Aventis, Dabur , Himalaya drugs, Dr. Reddy’s Laboratories etc.
In FY-11, this segment has seen competition in form of replacement with PET especially in the Oral formulations and ambe
bottles in the range of 60 ml to 100 ml. This has led to domestic market shrinking by almost 15% for the amber glass bottle
has focused on export markets and currently 37% of PGL Pharmaceutical division comprises of exports.
The high-end Borosilicate Glass (or Type-I Glass) market has been an attractive growth segment for PGL particularly for exp
USA as also”deemed exports” in India as more and more injectibles manufacturing facility in India receive US FDA approva
has increased its offering to this market by enhancing its capacity from 25 TPD to 45 TPD in the previous year.
Specialty Food & Beverages:
The Specialty Food & Beverages division provides bottles for wine, liquor and food which are often unique in design and deco
This business is very freight intensive and hence localized. Piramal Glass is catering to this segment from Sri Lanka and US
has consciously grown in exports from Sri Lanka, earlier mainly to India, and today to Far East and Australia. In Sri Lanka the s
has been to migrate to more and more premium customers. In USA, the process of winning new customers and contracts is rel
slow but permanent in nature. Since USA acquisition, we have gradually been able to increase our sales in this segment th
acquisition of new customers and retaining old ones. USA operations have edge over its European competitors due to lower f
PGL caters to global customers like Diageo, Pernod Recod, Cadbury Schwepps, UB Group, etc.
Strategy Summary
1. Continued focus on C&P segment and the growth in capacity and skill will help the company in growing both in Prem
MANAGEMENT DISCUSSION & ANA
Piramal Glass Limit

8/2/2019 PGL Annual Report 2010-11
http://slidepdf.com/reader/full/pgl-annual-report-2010-11 8/76
well as Mass segment. The growth will also be fuelled by continued efforts to transition some of the C&P production fr
USA facility to India
2. Improvement in product mix and geography mix for Pharmaceutical segment
3. Focus on Sri Lankan markets for better product mix and growth in Specialty Food & Beverages
Focus on C&P segment especially Premium within this segment has helped the company to expand the EBDITA margin fromto 25.2%.
Performance summary :
` in m
Particulars FY 2011 FY20
Sales and Profit:
Net Sales 12,184.6 11,039
EBIDTA 3,066.7 2,206
PBT (after exceptional items) 1,277.3 86
PAT (after prior period items) 1,033.5 32
Margins:
EBIDTA % 25.2% 20.0
PBT % (after exceptional items) 10.5% 0.8
PAT % (after prior period items) 8.5% 0.3
Growth:
Net Sales 10.4% 9.4
EBIDTA 39.0% 115.3
Net Profit 3,099.7% N
Results review summary:
Total sales for the year ended 31 Mar 2011 grew by 10.4% to ` 12,184.6 million compared to FY2010 Net sales of ` 11,039.2 m
Earning before Interest, Depreciation, Tax and Amortizations (EBIDTA) for the year was at ` 3,066.7 million, a growth of 39.0
FY2010 EBIDTA of ` 2,206.2 million.
Operating Margins grew to 25.2% in FY2011, compared with 20.0% for FY2010.
Net interest decreased by 31.3% to ` 720 million, as compared to ` 1,049 million in FY2010. The total consolidated debt as
March 2011 was ` 9,199.9 million, compared with ` 9,824.3 million for FY2010. Debt/Equity ratio was 2.6 in FY2011, comp
3.5 in FY2010.
Depreciation for the year ended was ` 1,069 million compared to ` 1,071 million in FY2010. Further, taxes were at ` 244 m
compared with ` 54 million in FY2010.
As a result, there was a Net Profit of ` 1,033.5 million, compared to ` 32.3 million in FY2010.
MANAGEMENT DISCUSSION & ANALYSIS
6 Piramal Glass Limited

8/2/2019 PGL Annual Report 2010-11
http://slidepdf.com/reader/full/pgl-annual-report-2010-11 9/76
Net sales analysis:
` in m
Consolidated Sales break-up % Salience FY 2011 FY 2010 % Growth
India Sales
Cosmetics & Perfumery 7.4% 901.0 710.1 26.9%
Pharmaceuticals 16.1% 1,956.5 1,857.1 5.4%
Specialty Food and Beverages 2.3% 278.8 309.8 (10.0%)
Sub-total – India 25.7% 3,136.3 2,877.0 9.0%
Global Sales
Cosmetics & Perfumery 42.1% 5,125.2 4,109.9 24.7%
Pharmaceuticals 12.0% 1,461.7 1,532.0 (4.6%)
Specialty Food and Beverages 20.2% 2,461.5 2,520.3 (2.3%)
Sub-total - Outside India 74.3% 9,048.4 8,162.2 10.9%
Consolidated Total Sales 100.0% 12,184.7 11,039.2 10.4%
Notes:
Global Sales are Total Consolidated sales outside India.
% Salience is percentage of sales in the category to net sales
Profitability analysis:
` in m
Consolidated Profits break up EBIDTA PAT
FY 2011 FY 2010 Growth % FY 2011 FY 2010 Growth
Piramal Glass India Ltd 2,109.2 1,544.5 37% 686 157.7 335
Piramal Glass USA Inc. 426.0 349.6 22% 118.6 (35.4)
Piramal Glass (UK) Ltd. 3.29 (6.7) — 3.29 (6.7)
Piramal Glass International Inc. 1.08 — — 0.9 (0.2)
Piramal Glass Ceylon PLC 538.9 374.3 44% 237.2 (27.5)
Piramal Glass Europe 1.59 — — 0.94 —
Sub Total 3,080.1 2,261.7 36% 1,046.9 87.9 1090
Consolidated* 3,066.7 2,206.1 39% 930.2 44.3 2000
Notes:
*Consolidated is after adjustment of Minority Interest and Inter-company transactions.
Manufacturing facilities review:
Piramal Glass continues to focus on its strategy of developing a strong front end in Western market while building a robust manufa
base in low cost countries.
PGL Group’s current manufacturing facilities across different regions are as follows:
Piramal Glass Limited (PGL):
PGL has production facilities at Jambusar and Kosamba in Gujarat, India. The Company has ISO 9001, ISO 14001 certificati
OHSAS (Occupational Health, Safety Analysis Series) i.e. ISO 18001 certification.
MANAGEMENT DISCUSSION & ANA
Piramal Glass Limit

8/2/2019 PGL Annual Report 2010-11
http://slidepdf.com/reader/full/pgl-annual-report-2010-11 10/76
Furnace location and number Installed Capacity TPD * Type of glass containers manufactured
Jambusar (2)
1 230 (being upgraded to 255 TPD) Soda Lime Amber – Pharmaceuticals
2 105Soda Lime Flint – Pharmaceuticals, Specialty Food
Beverages, Cosmetics & Perfumery
Kosamba (6):
1 45 (Was 25 TPD earlier) Borosilicate Amber & Flint – Pharmaceuticals
2 40 Soda Lime Flint–Pharmaceuticals/Cosmetics & Perfu
3 55 (Earlier Amber furnace for
Pharmaceuticals)
Soda Lime Flint - Cosmetics & Perfumery
4 35
Soda Lime Flint – Cosmetics & Perfumery, ski5 65
6 100
The project for construction of 160 TPD furnace for C&P at Jambusar has already commenced
* Ton Per Day
Piramal Glass USA Inc (PGI):
PGI has manufacturing facilities in USA. The installed capacity of the facility is as follows:
Furnace location and number Installed Capacity TPD* Type of glass containers manufactured
Two furnaces
1 100Soda Lime Flint – all segments
2 95
* in US Tonnes
Piramal Glass Ceylon PLC (PGCP):
PGCP manufactures bottles in flint, amber and other colors with sizes ranging from 50 ml. to 2,500 ml. It caters to liquor, fbeverage, and wine industry customers.
Furnace location and number Installed Capacity TPD Type of glass containers manufactured
Single furnace 250 Specialty Food & Beverages – Amber & Flint
Power & Energy:
Power and Energy costs increased by 11.2% to ` 1,884.4 million as compared to ` 1,693.9 million in FY10. The increase has b
India and Sri Lanka, because of hike in prices of Natural Gas / Furnace Oil and Electricity. PGL India constituted a major por
this increase, because APM gas which constitutes ~1/3rd of gas requirements was linked to market rates and the other major su
increased prices by 13% during FY11.
Piramal Glass managed to offset most of these price increase to large extent by better energy management as well as spot buying
MANAGEMENT DISCUSSION & ANALYSIS
8 Piramal Glass Limited

8/2/2019 PGL Annual Report 2010-11
http://slidepdf.com/reader/full/pgl-annual-report-2010-11 11/76
Manpower:
The PGL Group seeks to recruit and retain quality industry professionals and provide them with a high performance environ
During the financial year, total consolidated workforce of PGL was 3,257 which is a marginal increase of 16 over FY2010.
The workforce details are as follows:
Consolidated manpower break-up FY2011 FY2010 +/–
Piramal Glass Limited 2,324 2,342 (18)
Piramal Glass – USA, Inc. 520 515 5
Piramal Glass Europe SARL 1 — 1
Piramal Glass Ceylon PLC 412 384 28
Total 3,257 3,241 16
• Businessriskfactors:
• Replacementthreat:
Glass packaging for Pharmaceutical segment faces the risk of replacement by other packaging solutions such as plas
other forms of packaging.
• CapitalintensiveThe glass packaging needs significant capital expenditure in creating infrastructure and regular relining of Prod
furnaces.
• Energyintensive–IndustryisEnergyintensive
• Exposuretoexchangeratefluctuations:
With 75% of sales from global markets, any change in currency dynamics will have an impact on the margin.
Disclaimer:
Certain statements included above may be forward looking and would involve a number of risks, uncertainties and other facto
could cause actual results to differ materially from those suggested by the forward-looking statements.
MANAGEMENT DISCUSSION & ANA
Piramal Glass Limit

8/2/2019 PGL Annual Report 2010-11
http://slidepdf.com/reader/full/pgl-annual-report-2010-11 12/76
Annexure to MD&A: Financial Highlights (Consolidated)
Income Statement
` in m
Year ended
31 March 2011
Year ended
31 March 2010
% Grow
(De-grow
Total Income
Sales
– Gross 12,525.9 11,323.0 10.6
– Net 12,184.6 11,039.2 10.4
Other Income 215.4 220.6 (2.4%
Total 12,400.0 11,259.8 10.1
EBIDTA 3,066.7 2,206.2 39.0
EBIDTA as % to Total Income 24.7% 19.6%
Interest 720.4 1,049.1 (31.3%
Depreciation 1,069.0 1,070.6 (0.1%
Profit before Tax 1,277.3 86.5 1,376.6
% of Total Income 10.3% 0.8%
Provision for Taxation - Current 214.5 32.7
- Mat Credit Entitlement (205.4) (31.4)
- Deferred 234.7 52.9
- FBT 0.0 0.0
Profit After Tax 1,033.5 32.3 3,099.7
% of Total Income 8.3% 0.3%
Net Sales
During the year net sales increased by 10.4% to ` 12,184.6 million as compared to ` 11,039.2 million in FY 2010.
The detailed analysis of it is discussed earlier in the report.
Other Income
Other income was ` 215.4 million in FY2011 registering a negative growth of 2.4%.
Profit before Interest, Depreciation & Tax (EBIDTA) & Margin
EBIDTA grew by 39% to ` 3,066.7 million. EBIDTA as a % of total income improved from 19.6% in FY 2010 to 24.7% in FY
Interest
Net interest cost decreased by 31.3% to ` 720.4 million as compared to ` 1,049.1 million in FY 2010.
MANAGEMENT DISCUSSION & ANALYSIS
10 Piramal Glass Limited

8/2/2019 PGL Annual Report 2010-11
http://slidepdf.com/reader/full/pgl-annual-report-2010-11 13/76
Balance Sheet
` in m
As at 31 March, 2011
As at 31 March, 201
SOURCES OF FUNDS
Share Capital 804.3 804.3
Reserves & Surplus 2,215.6 1,594.5
Minority Interest 498.8 376.2
Loan Funds 9,199.9 9,824.3
Deferred Tax Liability (Net) 142.9 113.2
TOTAL 12,861.5 12,712.5
APPLICATION OF FUNDS
Fixed Assets 8,995.7 8,944.8
Investments 1.1 1.1
Net Working Capital 3,864.7 3,766.6
TOTAL 12,861.5 12,712.5
Key Ratios:
Particulars FY 2011 FY 2010
Debt Equity Ratio 2.6 : 1 3.5 : 1
Return on Capital Employed 15.6 8.3
Return on Net Worth (%) 32.8 1.8
Asset Turnover Ratio 1.4 1.2
Return on Capital Employed Calculation FY 2011 FY 2010
PBIT 1997.7 1135.6
Average Net Fixed Assets 8970.3 9327.2
Average Net Current Assets 3815.7 4300.6
Capital Employed 12785.9 13627.7
ROCE (%) 15.6 8.3
MANAGEMENT DISCUSSION & ANA
Piramal Glass Limit

8/2/2019 PGL Annual Report 2010-11
http://slidepdf.com/reader/full/pgl-annual-report-2010-11 14/76
Corporate Governance
Report for the financial year ended March 31, 2011 on the compliance by the Company with the Corporate Governance require
under Clause 49 of the Listing Agreement, is furnished below.
1. Company’s Philosophy on Corporate Governance
Corporate Governance is the combination of voluntary practices and compliance with laws and regulations leading to efcontrol and management of the organisation. Good Corporate Governance leads to long term shareholder value and enh
interest of other stake holders. It brings into focus the fiduciary and trusteeship role of the Board to align and direct the a
of the organisation towards creating wealth and shareholder value.
2. Board of Directors
The Company’s Board comprises of one (1) executive director, two (2) non-executive directors and five (5) independent di
as on March 31, 2011.
The constitution of the Board is given below:
Name of DirectorCategory1
[Designation]
Other Directorships2 Membership of otheBoard Committees3
as Member as Chairman as Member as Chair
Ajay G. Piramal NED - Promoter [Chairman] 1 6 — —
Vinita Bali ID 4 — 1 —
Vimal Bhandari(From March 9, 2011)
ID 8 — 4 2
Dharendra Chadha ID — — — —
Jiten Doshi ID 1 — — —
Bharat Kewalramani ID 1 — — —
Dr. Swati A. Piramal NED – Promoter Group 9 — 1 1
Vijay Shah ED (MD) 1 — — —
Note : During the financial year 2010-11, following have ceased to be directors of the Company:
- Mr. Shitin Desai (w.e.f. January 20, 2011) and
- Mr. Murari Rajan (w.e.f. March 31, 2011)
1 ED - Executive Director; MD – Managing Director; NED - Non-Executive Director; ID - Independent Director
2 This includes directorships in public limited companies and subsidiaries of public limited companies and excludes directorships in
limited companies, overseas companies and companies under section 25 of the Companies Act, 1956 and alternate directorships.
3 This relates to Committees referred to in Clause 49 of the Listing Agreement, viz. Audit Committee and Investors Grievance Com
However this excludes Remuneration Committee which is not considered for the purpose of computing maximum limits under Cla
3. Attendance of Directors at Board Meetings and Annual General Meeting
The Board of the Company met five (5) times during the financial year, on the following dates:
April 23, 2010 June 24, 2010 July 28, 2010
October 27, 2010 January 20, 2011
The Company placed before the Board the budgets, annual operating plans, performance of the business and various
information including those specified under Annexure 1A of the Listing Agreement, from time to time.
CORPORATE GOVERNANCE
12 Piramal Glass Limited

8/2/2019 PGL Annual Report 2010-11
http://slidepdf.com/reader/full/pgl-annual-report-2010-11 15/76
The attendance of Directors at the Board Meetings and the last Annual General Meeting held on June 24, 2010 was as un
Name of Director
Board Meetings
AGMHeld duringtheir tenure
Attended
Ajay G. Piramal 5 5
Vinita Bali 5 3
Vimal Bhandari(From March 9, 2011)
— N.A. N.A.
Dharendra Chadha 5 5
Shitin Desai(upto January 20, 2011)
4 4
Jiten Doshi 5 4 —
Bharat Kewalramani 5 4
Dr. Swati A. Piramal 5 1
Murari Rajan(Upto March 31, 2011)
5 5
Vijay Shah 5 5
4. Code of Conduct
The Company has formulated and implemented separate Codes of Conduct for Board Members and Senior Managemen
Company. Requisite annual affirmations of compliance with the respective Codes have been made by the Directors and
Management of the Company. A declaration signed to this effect by Mr. Vijay Shah, Managing Director, is appended at t
of this Report. The Codes of Conduct are posted on the Company’s website.
5. Audit Committee
During the financial year 2010-11, four Audit Committee Meetings were held on the following dates, including before final
of annual accounts and adoption of quarterly financial results by the Board:
April 23, 2010 July 28, 2010 October 27, 2010 January 20, 2011
The constitution of the Committee and the attendance of each member of the Committee is given below:
Name Designation Category Audit Committee MeetingHeld during their tenure Attended
Vimal Bhandari(From March 9, 2011)
Chairman Independent Director — —
Shitin Desai(Upto January 20, 2011)
Chairman Independent Director 3 3
Dharendra Chadha Member Independent Director 4 4
Jiten Doshi Member Independent Director 4 4
Mr. Vijay Shah was co-opted as a member of the Committee for the meeting held on January 20, 2011
The Company Secretary, Mrs. Nehal Doshi, is the secretary to the Committee.
The terms of reference of the Audit Committee include those specified under Clause 49 of the Listing Agreement as well as
section 292A of the Companies Act, 1956 such as:
1. To hold periodic discussions with the Statutory Auditors and Internal Auditors of the Company concerning the ac
of the Company, internal control systems, scope of audit and observations of the Auditors/ Internal Auditors;
2. To review the adequacy of and compliance with internal control systems;
3. To review the quarterly, half-yearly and annual financial statements of the Company (standalone and/or consolidated)
submission to the Board;
4. To investigate into any matter in relation to items specified in section 292A of the Companies Act, 1956 or as may be r
CORPORATE GOVERN
Piramal Glass Limit

8/2/2019 PGL Annual Report 2010-11
http://slidepdf.com/reader/full/pgl-annual-report-2010-11 16/76
to it by the Board and for this purpose to seek any relevant information contained in the records of the Company an
seek external professional advice, if necessary;
5. To make recommendations to the Board on any matter relating to the financial management of the Company, includ
Audit Report;
6. To review, investigate and make recommendations to the Board on any matter in relation to the items specified in sub-
(D) of clause 49(II) of the Listing Agreement and for this purpose to seek information from any employee and/or
outside legal or professional advice.6. Nomination & Remuneration Committee
The Nomination & Remuneration Committee reviews and makes recommendations on remuneration and perquisites for exe
Directors and proposes new appointments on the Board.
The members of the Committee are:
Name Designation Category
Vimal Bhandari(From April 28, 2011)
Chairman Independent Director
Shitin Desai(Upto January 20, 2011)
Chairman Independent Director
Vinita Bali Member Independent Director
Dharendra Chadha Member Independent Director
Ajay G. Piramal Member Non - Executive Direct
7. Remuneration of Directors
Details of remuneration to the Directors for the year ended March 31, 2011 are as follows:
Name of the Director Relationship with otherdirectors
Businessrelationship with
the Company
Sittingfees*
Salary &Perquisites
PerformanceLinked
Incentive
To
In Rupees
Ajay G. Piramal Husband of Dr. Swati A. Piramal Promoter 100,000 — — 10
Vinita Bali None None 140,000 — — 14Vimal Bhandari(From March 9, 2011)
None None — — —
Dharendra Chadha None None 180,000 — — 18
Shitin Desai(Upto January 20, 2011)
None None 140,000 — — 14
Jiten Doshi None None 160,000 — — 16
Bharat Kewalramani None None 80,000 — — 8
Dr. Swati A. Piramal Wife of Mr. Ajay G. Piramal Promoter Group 20,000 — — 2
Murari Rajan(Upto March 31, 2011)
None None 100,000 — — 10
Vijay Shah None Managing Director — 16,653,676 10,000,000 26,65*includes sitting fees paid for Committee Meetings
Notes:
1. The terms of reappointment of the Managing Director, Mr. Vijay Shah as approved by the shareholders, are contained
Agreement dated August 14, 2009 executed with him by the Company.
2. No loans and advances have been given to any Director of the Company.
3. As per prevailing policy, Stock Options are granted only to independent directors and non-promoter executive d
Accordingly, for the year ended 31st March 2011, 2,25,000 Stock Options were granted to Mr. Vijay Shah, Managing D
CORPORATE GOVERNANCE
14 Piramal Glass Limited

8/2/2019 PGL Annual Report 2010-11
http://slidepdf.com/reader/full/pgl-annual-report-2010-11 17/76
at an exercise price of Rs. 23.35 per Option. In addition to the exercise price, applicable TDS would also be payable
time of exercising the Stock Options.
Out of the Options so granted, depending on his performance, achievement of key result areas and other criter
Nomination and Remuneration Committee determines the actual number of stock options that would vest in his favou
of the total Options so vested, he would be eligible to exercise 55% immediately, 22.5% after 1 year and the balance
after 2 years. The exercise period is 5 years from the date of eligibility, failing which the Options would lapse.
It may be noted in this regard that since the PGL ESOP Scheme is implemented through the ESOP Trust and the
given by the ESOP Trust against exercise of stock options are those that have been acquired by the ESOP Trust fro
existing shareholder and no new shares are issued by the Company, there will not be any increase in the share cap
the Company, nor will there be any impact on the Earnings Per Share or other ratios relating to share capital, as a re
exercise of the Stock Options.
4. Shareholding of Non-Executive Directors (including shareholding as joint holder) is given below:
Name No. of shares held
Ajay G. Piramal 54,384
Dr. Swati A. Piramal 20,201
Dharendra Chadha 12,500
8. Investors Grievance Committee
During the financial year, four Investors Grievance Committee Meetings were held on the following dates:
April 9, 2010 July 28, 2010 October 11, 2010 January 20, 2011
Following are the members of this Committee. They attended all the four meetings.
Name Designation Category
Vinita Bali Chairperson Independent Director
Vijay Shah Member Managing Director
The Company Secretary is the Compliance Officer.
Investor Grievances
The following table shows the nature of complaints received from shareholders during 2010-11 and 2009-10.
Nature of Complaints 2010-11 2009-10
Dividend 2 1
Non-receipt of Shares — 1
Rights Issue 2 42
Others 1 8
Total 5 52
The complaints are generally responded to within 7 days from their lodgment with the Company.
The Company has designated the email id ‘[email protected]’ exclusively for the purpose of regi
complaints by investors electronically. This email id has been displayed on the Company’s website ‘www.piramalglass.c
9. General Body Meetings
The location and time of the Annual General Meetings held during the last 3 years are as follows:
CORPORATE GOVERN
Piramal Glass Limit

8/2/2019 PGL Annual Report 2010-11
http://slidepdf.com/reader/full/pgl-annual-report-2010-11 18/76
Annual General
Meeting (AGM)
Date Time Venue No. of Specia
Resolutions pas
10th AGM August 7, 2008 3.00 p.m. Walchand Hirachand Hall,Indian Merchants’ ChamberBuilding, IMC Marg,Churchgate, Mumbai 400 020
—
11th AGM August 13, 2009 3.00 p.m. 2
12th AGM June 24, 2010 11.00 a.m. 1
Postal Ballot
No resolution was passed by postal ballot during the financial year 2010-11.
At present, there is no proposal for passing any resolution through postal ballot.
10. Note on Directors re-appointment
Mr. Dharendra Chadha and Mr. Jiten Doshi are retiring by rotation at this Annual General Meeting (AGM) and are propos
re-appointment.
Brief details concerning these Directors are given below:
Mr. Dharendra Chadha
Mr. Dharendra Chadha is 53 years of age. He is a strategy consultant who specializes in the emergent domain of corporate
strategy. He is a Bachelor of Commerce and an MBA from Jamnalal Bajaj Institute of Management Studies, Mumbai an
appointed on the Board of our Company on January 29, 2008. Mr. Chadha spent many years in FMCG marketing before
the ad agency, J. Walter Thompson. He spent 10 years with that company in their strategic planning function working f
India, then Asia Pacific and finally serving as Global Director of Strategic Planning. He is the Managing Director of Mom
Strategy Consultants Pvt. Ltd. Mr. Dharendra Chadha is not a director in any public limited company or subsidiary of a
limited company in India.
Mr. Jiten Doshi
Mr. Jiten Doshi is 45 years of age. He is one of the founders of Enam Asset Management Company Pvt. Ltd. and is its Direc
Chief Investment Officer. He is a Bachelor of Commerce and was appointed on the Board of our Company on April 29, 2008.
over 20 years experience in the capital markets. He has advised several managements on shareholder value creation. His gu
in areas such as corporate governance, transparency, disclosure standards and effective shareholder communication has
several companies improve their interface with all stakeholders. Mr. Jiten Doshi is also a director in Dabur International L
11. Disclosures
• No transaction of material nature has been entered into by the Company with its Directors or Management and their rel
etc. that may have a potential conflict with the interests of the Company;
• The Register of Contracts/statement of related party transactions, are placed before the Board/Audit Committee regu
• Transactions with related parties are disclosed in Note No. 10 of Part B of Schedule 19 to the Accounts in the Annual R
• There has been no instance of non-compliance by the Company on any matter related to capital markets. Hence, the qu
of penalties or strictures being imposed by SEBI or the Stock Exchanges or any other statutory authority does not ar
• Listing fees for the financial year 2011-12 have been paid to the stock exchanges where the shares of the Company are
Compliance with Mandatory/ Non-mandatory Requirements• The Company has complied with all the applicable mandatory requirements of Clause 49 of the Listing Agreement;
• The Company has also adopted the non-mandatory requirements as specified in Annexure 1D to Clause 49 of the
Agreement regarding constitution of remuneration committee, unqualified financial statements and training of Board Me
CORPORATE GOVERNANCE
16 Piramal Glass Limited

8/2/2019 PGL Annual Report 2010-11
http://slidepdf.com/reader/full/pgl-annual-report-2010-11 19/76
12. Means of Communication
The annual, half-yearly and quarterly results are regularly posted by the Company on its website www.piramalglas
These are also submitted to the Stock Exchanges where the Company’s shares are listed and published in newspap
accordance with the Listing Agreement;
Management Discussion & Analysis forms part of this Annual Report.
13. General Information for Shareholders
a) Annual General Meeting
– Date and Time August 12, 2011 at 11.30 a.m.
– Venue Walchand Hirachand HallIndian Merchants’ Chamber BuildingIMC Marg, ChurchgateMumbai 400 020
b) Financial CalendarFinancial reporting for:
– Quarter ending June 30, 2011 by August 13, 2011
– Half year ending September 30, 2011 by November 14, 2011
– Quarter ending December 31, 2011 by February 14, 2012
– Year ending March 31, 2012 by May 30, 2012
– Annual General Meetingfor the year ending March 31, 2012 by September 29, 2012
c) Dates of Book Closure August 3, 2011 to August 12, 2011(Both days inclusive)
d) Dividend Payment date Within five days from the date of declaration of dividend
e) Registered Office Piramal TowerGanpatrao Kadam Marg
Lower Parel, Mumbai 400 013
f) Listing on Stock Exchanges Bombay Stock Exchange Limited(code: 532949);
National Stock Exchange of India Limited(code: PIRGLASS);
(Note: Shares of the Company have been deli form The Ahmedabad Stock Exchange Limitew.e.f. 30th November 2010)
g) Reuters Code PRML.BO
CORPORATE GOVERN
Piramal Glass Limit

8/2/2019 PGL Annual Report 2010-11
http://slidepdf.com/reader/full/pgl-annual-report-2010-11 20/76
h) Stock market data
Month
Bombay Stock Exchange National Stock Exchange
High(Rs.)
Low(Rs.)
AverageClosing
Price (Rs.)
Monthly Volume
High(Rs.)
Low(Rs.)
AverageClosing
Price (Rs.)
Mon Vol
Apr-10 109.00 89.10 94.83 1,747,165 109.35 89.00 94.66 1,7
May-10 110.40 88.00 95.99 2,110,367 111.25 85.60 95.63 1,74
Jun-10 98.90 88.05 92.59 698,340 98.90 86.10 92.73 7
Jul-10 130.50 93.70 104.35 5,551,530 130.50 93.00 104.35 5,74
Aug-10 138.35 118.45 126.49 2,034,807 137.80 120.00 126.65 1,9
Sep-10 138.35 120.65 128.11 18,864,547 138.40 120.50 128.10 2,1
Oct-10 142.00 125.00 133.04 1,893,955 141.95 124.65 133.01 2,5
Nov-10 141.00 106.00 127.13 938,737 141.25 105.15 126.41 1,1
Dec-10 120.60 92.50 107.91 514,529 119.75 92.25 107.48 54
Jan-11 116.60 89.10 106.81 514,779 117.00 89.00 106.23 8
Feb-11 105.40 79.15 92.23 230,258 105.35 80.20 92.18 3
Mar-11 114.40 90.05 98.34 2,249,395 115.00 90.60 98.49 1,1
i) Stock Performance vs BSE Sensex and NSE-50
Performance of the Company’s Equity Shares on Bombay Stock Exchange Limited and National Stock Exchange o
Limited relative to the BSE Sensitive Index (BSE Sensex) and S&P CNX Nifty (Nifty) respectively are graphically repre
in the charts below: Average monthly closing price of the Company’s shares on BSE as compared to BSE Sensex
160
150
140
130
120
110
100
90
S h a r e P r i c e / I n d i c e V a l u e
Stock Performance V/s BSE Sensex
PGL BSE Stock Price
BSE Sensex
A p r - 1 0
M a y - 1 0
J u n - 1 0
J u l - 1 0
A u g - 1 0
S e p - 1 0
O c t - 1 0
N o v - 1 0
D e c - 1 0
J a n - 1 1
F e b - 1 1
M a r - 1 1
Month
CORPORATE GOVERNANCE
18 Piramal Glass Limited

8/2/2019 PGL Annual Report 2010-11
http://slidepdf.com/reader/full/pgl-annual-report-2010-11 21/76
Average monthly closing price of the Company’s shares on NSE as compared to Nifty
Stock Performance V/s Nifty
160
150
140
130
120
110
100
90
A p r - 1 0
M a y - 1 0
J u n - 1 0
J u l - 1 0
A u g - 1 0
S e p - 1 0
O c t - 1 0
N o v - 1 0
D e c - 1 0
J a n - 1 1
F e b - 1 1
M a r - 1 1
S h a r e P r i c e / I n d i c e V a l u
e
PGL NSE Stock Price
NIFTY
Month
j) Share Transfer Agents
M/s Link Intime India Pvt. Limited (“Link Intime”) are the Share Transfer Agents of the Company. The contact de
Link Intime are given below:
Link Intime India Pvt. Ltd.
C-13 Pannalal Silk Mills Compound, 203, Davar House,
LBS Marg, Bhandup (West), Mumbai – 400078. 197/199, D. N. Road,
Tel.: (022) 25946970 Mumbai - 400 001.
Fax: (022) 25946969
e-Mail: [email protected]
i) Share Transfer System (in physical segment)
To expedite the share transfer process in the physical segment, authority has been delegated to the Share Transfer Com
which comprises:
Mr. Ajay G. Piramal – Chairman
Mr. Vijay Shah – Member
For administrative convenience and to facilitate speedy approvals, authority has also been delegated to the Share Tr
Agents and also to senior executives to approve share transfers upto specified limits. Share transfers / transmissions ap
by the Committee and/or the authorised executives are placed at the Board Meeting from time to time.
In case of shares held in physical form, all transfers are completed within 12 days from the date of receipt of com
documents. As at 31st March 2011 there were no Equity Shares pending for transfer. Also, there were no demat re
pending as on 31st March, 2011.
CORPORATE GOVERN
Piramal Glass Limit

8/2/2019 PGL Annual Report 2010-11
http://slidepdf.com/reader/full/pgl-annual-report-2010-11 22/76
l) Distribution of Equity Shareholding as on March 31, 2011
Slab of Shareholdings No. of Shareholders % No. of shares %
1 to 100 45,931 85.34 842,268 1.05
101 to 200 3,228 6.00 493,907 0.61
201 to 500 2,587 4.81 862,183 1.07
501 to 1000 934 1.74 716,157 0.89
1001 to 5000 844 1.57 1,914,146 2.38
5001 to 10000 126 0.23 937,961 1.17
10001 to 20000 87 0.16 1,207,056 1.50
20001 to 30000 35 0.07 831,486 1.03
30001 to 40000 8 0.01 278,658 0.35
40001 to 50000 14 0.03 620,402 0.77
50001 to 100000 8 0.01 662,345 0.82
Above 100000 22 0.04 71,068,167 88.36
Total 53,824 100.00 80,434,736 100.00
According to categories of Equity Shareholders as on March 31, 2011
Sr. No. Category of ShareholderNumber of
ShareholdersNo. of shares %
(A) Shareholding of Promoter and Promoter Group 16 58,462,835 72.6
(B) Public shareholding
1. Institutions
(a) Mutual Funds/ UTI 10 1,962,561 2.4
(b) Financial Institutions / Banks 25 864 0.0
(c) Insurance Companies — — —
(d) Foreign Institutional Investors 6 2,529,981 3.1
Sub-Total (B1) 41 4,493,406 5.5
2. Non-institutions
(a) Bodies Corporate 598 7,709,592 9.5
(b) Individuals
(i) holding nominal share capital up to Rs 1 lakh 52,401 5,236,711 6.5
(ii) holding nominal share capital in excess of Rs.1lakh.
128 4,335,147 5.3
(c) Other
1. Clearing Member 147 101,006 0.1
2. Trust 2 11,232 0.0
3. Non – Resident Indians – Repatriable 351 70,981 0.0
4. Non – Resident Indians – Non-Repatriable 140 13,826 0.0
Sub-Total (B2) 53,767 17,478,495 21.7
Total Public Shareholding (B1+B2) 53,808 21,971,901 27.3
GRAND TOTAL 53,824 80,434,736 100.0
m) Dematerialisation of shares
As on 31st March 2011, 78,656,145 equity shares (97.79% of the total number of shares) are in dematerialised f
compared to 78,604,080 equity shares (97.72% of the total number of shares) as on 31st March 2010.
CORPORATE GOVERNANCE
20 Piramal Glass Limited

8/2/2019 PGL Annual Report 2010-11
http://slidepdf.com/reader/full/pgl-annual-report-2010-11 23/76
n) Outstanding GDRs/ADRs/Warrants or any convertible instruments
There are no outstanding convertible warrants/instruments.
o) Plant Locations
India
– ONGC Rd., Tarsadi Village, Kosamba, (R.S.), Dist. Surat, Pin 394120.
– Gajera Road, Uchhad Village, Jambusar, Dist. Bharuch, Pin 392150.
Overseas
– Piramal Glass Ceylon PLC, Poruwadanda,Wagawatte, Horana, Sri Lanka.
– Flat River Glass, 1000 Taylor Avenue, Park Hills, Missouri, MO 63601, USA.
– PGI Decora/Coated, 918E, Malaga Road, Williamstown, NJ 08094, USA.
p) Investors Correspondence
Nehal C. Doshi
Company Secretary
Piramal Glass Limited
Piramal Tower Annexe
Ganpatrao Kadam Marg
Lower Parel, Mumbai - 400 013. IndiaTel:(91-22)30467836•Fax:(91-22)24902363
Email: [email protected]
CORPORATE GOVERN
Piramal Glass Limit

8/2/2019 PGL Annual Report 2010-11
http://slidepdf.com/reader/full/pgl-annual-report-2010-11 24/76
Certification under Clause 49 (I) (D) of the Listing Agreement
This is to confirm that all the Board Members and Senior Management personnel have affirmed compliance with the respective
of Conduct for Piramal Glass Limited for the financial year ended 31st March, 2011.
Vijay ShahManaging Director
Mumbai
April 28, 2011
Certificate on Corporate Governance
ToThe Members of
Piramal Glass Limited
We have examined the compliance of conditions of Corporate Governance by Piramal Glass Limited for the year ended 31st M
2011 as stipulated in clause 49 of the Listing Agreement of the Stock Exchanges.
The compliance of conditions of Corporate Governance is the responsibility of the management. Our examination was lim
procedures and implementation adopted by the Company for ensuring the compliance of the conditions of Corporate Gover
It is neither an audit nor an expression of opinion on the Financial Statement of the company.
In our opinion and to the best of our information and according to the explanations given to us, we certify that the Compa
complied with the conditions of Corporate Governance as stipulated in clause 49 of the Listing Agreement.
We further state that such compliance is neither an assurance as to the future viability of the company nor the efficiency or effecti
with which the Management has conducted the affairs of the company.
For N. L. Bhatia & Asso
Practicing Company Secr
N. L.
Place : Mumbai P
Date : June 21, 2011 C.P. N
CORPORATE GOVERNANCE
22 Piramal Glass Limited

8/2/2019 PGL Annual Report 2010-11
http://slidepdf.com/reader/full/pgl-annual-report-2010-11 25/76
NOTICE is hereby given that the 13th Annual General Meeting of the Members of Piramal Glass Limited will be held on Frid
12th day of August, 2011 at 11.30 a.m. at Walchand Hirachand Hall, Indian Merchants’ Chamber Building, IMC Marg, Churc
Mumbai 400 020, to transact the following business:
1. To receive, consider and adopt the audited Balance Sheet as at and the Profit and Loss Account for the financial year end
31st March, 2011 and the Reports of the Directors and Auditors thereon.
2. To declare dividend.
3. To appoint a Director in place of Mr. Jiten Doshi, who retires by rotation and is eligible for re-appointment.
4. To appoint a Director in place of Mr. Dharendra Chadha, who retires by rotation and is eligible for re-appointment.
5. To appoint Auditors to hold office from the conclusion of this Meeting until the conclusion of the next Annual General M
and to fix their remuneration.
NOTES:
1. A MEMBER ENTITLED TO ATTEND AND VOTE AT THE MEETING IS ENTITLED TO APPOINT A PROXY TO ATTEND
VOTE INSTEAD OF HIMSELF AND A PROXY NEED NOT BE A MEMBER.
2. The Register of Members and Share Transfer Books of the Company has been declared closed from Wednesday, August 3to Friday, August 12, 2011 (both days inclusive).
3. Dividend on equity shares when declared at the Meeting, will be paid within 5 days from the date of declaration of divid
4. Directors
Mr. Jiten Doshi and Mr. Dharendra Chadha are retiring by rotation at this Annual General Meeting and are eligible
appointment.
The information to be provided for these Directors under Clause 49 of the Listing Agreement is given in the Corporate Gove
Section of this Annual Report. Mr. Jiten Doshi and Mr. Dharendra Chadha are not related to any director of the Company
5. Facility of electronic credit of dividend directly to the respective bank accounts of our shareholders through National Ele
Clearing Service (NECS), is available. This facility is currently available all over India. The Mandate Form is separately encl
this Annual Report. This is in addition to the Bank Mandate Facility that already exists whereby bank account details are p
on the dividend warrants. Shareholders who would like to avail of the NECS Mandate Facility or the Bank Mandate Facility
done earlier) are requested to complete and submit the Mandate Form, so as to reach the Company’s Share Transfer Agen
by August 2, 2011. Kindly note that shareholders holding shares in dematerialised form would receive their dividend d
to the bank account nominated by them to their Depository Participant.
6. Those members who have so far not encashed their dividend warrants for the below mentioned financial years, may cl
approach the Company for the payment thereof as the same will be transferred to the Investor Education and Protectio
of the Central Government, pursuant to section 205C of the Companies Act, 1956 on the respective dates mentioned
Intimation in this regard is being sent to the concerned shareholders periodically. Kindly note that after such dates, the me
will lose their right to claim such dividend.
Financial Year ended Due date for transfer
31.03.2005 16.09.2012*
31.03.2006 08.10.2013*
31.03.2008 07.09.2015
31.03.2010 29.08.2017
* This refers to the due date for transfer of dividend declared by erstwhile Kojam Fininvest Limited which was merged w
N
Piramal Glass Limit

8/2/2019 PGL Annual Report 2010-11
http://slidepdf.com/reader/full/pgl-annual-report-2010-11 26/76
Company.
7. Section 109A of the Companies Act, 1956 provides for Nomination by the shareholders of the Company in the prescribed
No. 2B which is available on the website of the Company ‘www.piramalglass.com’. Shareholders are requested to avail this f
8. Members are requested to note that in case of transfers, deletion of name of deceased shareholder, transmission and transpof names in respect of shares held in physical form, submission of photocopy of PAN Card of the transferee(s), surholder(s), legal heir(s) and joint holder(s) respectively, along with necessary documents at the time of lodgment of requ
these transactions, is now mandatory.9. To support the “Green Initiative in Corporate Governance” taken by The Ministry of Corporate Affairs by allowing pa
compliances and stating that service of notices / documents including Annual Report can be effected by sending the same thelectronic mode to the registered e-mail addresses of the shareholders, notices/documents including the Annual Report abeing sent by electronic mode to the shareholders whose e-mail address have been registered with the Company. Membewould like to receive such notices / documents in electronic mode in lieu of physical copy and who have not registeree-mail addresses so far or who would like to update their e-mail addresses already registered, are requested to register/their e-mail addresses:
a. In respect of electronic shareholding – through their respective Depository Participants;
b. In respect of physical shareholding – by sending a request to the Company’s Share Transfer Agent, mentioning thereifolio number and e-mail address.
Registered Office: By Order of thePiramal Tower,Ganpatrao Kadam Marg, NehalLower Parel, Mumbai 400 013. Company Se
Dated : 21st June, 2011
NOTICE
24 Piramal Glass Limited

8/2/2019 PGL Annual Report 2010-11
http://slidepdf.com/reader/full/pgl-annual-report-2010-11 27/76
Directors’ Report
Dear Shareholders
We take pleasure in presenting the 13th Annual Report and the Audited Accounts of the Company for the year ended March 31
Financial Results (` in M
For the year ended31.03.11
For the year ended31.03.10
Growth%
Net Sales 7,428.96 6,521.68 13.91
Operating other Income 289.75 291.04 (0.44)
Total operating income 7,718.71 6,812.72 13.30
OPBIDTA 2,109.06 1,544.49 36.55
- Margin 27.32% 22.67%
Less :
Interest 448.29 610.26 (26.54)
Depreciation 740.07 723.79 2.25
Profit/ (Loss) Before Tax 920.70 210.44 337.51
Provisions for Taxation:
Current Tax 205.43 31.38
MAT Credit Entitlement (205.43) (31.38)
Deferred Tax 234.80 52.72
Fringe Benefit Tax — —
Profit/(Loss) After Tax 685.90 157.72 334.91
- Margin 8.89% 2.31%
Add: Profit brought forward from Previous Year 353.80 289.88
Profit Available for Appropriation 1,039.70 447.60
Appropriation
Proposed dividend on equity shares 281.52 80.43
Dividend tax thereon 45.67 13.36
Transfer to General Reserve 68.59 —
Balance retained in Profit & Loss Account 643.92 353.80
Earning Per Share (Basic/Diluted) ` 8.53 2.99
Equity Dividend
In view of the remarkable improvement in the Company’s performance, the Board has recommended a dividend at ` 3.50 per
share i.e. 35% (previous year ` 1/- per equity share i.e. 10%) per equity share on 8,04,34,736 equity shares of ̀ 10/- each for the finyear ended 31st March 2011. The dividend shall be paid after approval by the members at the forthcoming Annual General M
Total cash outflow on account of this dividend payment including dividend distribution tax thereon will be ` 327.19 Million. (Pr
Year ` 93.79 million)
The Board recommends the above dividend for declaration by the members.
DIRECTORS’ RE
Piramal Glass Limit

8/2/2019 PGL Annual Report 2010-11
http://slidepdf.com/reader/full/pgl-annual-report-2010-11 28/76
Operations Review
As part of the long term strategy of the Company, we continue to focus on Cosmetics & Perfumery (C&P) segment. During th
this segment grew by 25% from ` 4,820 Million to ` 6,026 Million. The growth is being driven by new customers, new pr
developed and sold globally.
In the Pharmaceutical segment, we maintained our leadership position in the domestic market. The quest for improving q
through business process improvement continues.
Subsidiary Companies
Our Company has seven subsidiaries viz. Piramal Glass Ceylon PLC, Piramal Glass International, Inc., USA, Piramal Glas
Limited, Piramal Glass Europe SARL, Piramal Glass - USA, Inc., and its two subsidiaries, Piramal Glass Flat River LLC and P
Glass Williamstown LLC, which are also consequently the subsidiaries of the Company.
Operations of these companies are discussed below.
Piramal Glass Ceylon PLC
During the year, Piramal Glass Ceylon stabilized its manufacturing operations and also increased its productivity apart from deve
the export market for the niche Specialty Food & Beverage (SF&B) segment.
The turnover of Piramal Glass Ceylon has grown by 18.3% from SLR 3,519 Million To SLR 4,163 Million
Piramal Glass International, Inc. (USA)This is a wholly owned subsidiary of the Company. The turnover of this subsidiary was USD 5.77 Million (previous year US
Million) and has enabled the Company to maintain and improve its market share in Premium segment in USA due to a focused app
Piramal Glass - USA, Inc.
Piramal Glass - USA Inc. the Company’s wholly owned subsidiary, has reported a net profit of USD 2.60 Million as compar
net loss of USD 0.75 Million in the previous year. This was enabled through improvement in sales, stringent cost cutting me
and by replacing high cost loans with low cost loans.
The sales of the Company grew from USD 73.87 Million in the previous year to USD 81.17 Million in FY2011, depicting a g
of 9.88%.
Piramal Glass Flat River, LLC
Piramal Glass Flat River, LLC, is a wholly owned subsidiary of Piramal Glass - USA, Inc. This Company earns its income by
its property to Piramal Glass – USA, Inc. It has reported an income of USD 0.26 Million in the year under review, which is th
as the previous year.
Piramal Glass Williamstown, LLC
Piramal Glass Williamstown, LLC, is also a wholly owned subsidiary of Piramal Glass - USA, Inc. This Company earns its i
by leasing its property to Piramal Glass – USA, Inc. It has reported an income of USD 0.18 Million in the year under review,
is the same as the previous year.
Piramal Glass (UK) Limited
Piramal Glass (UK) Limited, is a wholly owned subsidiary of the Company. Its turnover during the year was GBP 0.66 Mill
compared to GBP 0.35 million in the previous year, reflecting a growth of 90.03%.
Piramal Glass Europe SARL
Piramal Glass Europe SARL, a wholly owned subsidiary of the company, situated in France, commenced its business operati
April 2010. The company was formed with a view to provide better services to the customers in the European region and to e
the footprint of the company in the European market.
The turnover of this subsidiary was Euro 2.48 Million.
Exemption from publishing Subsidiary Accounts:
The Ministry of Corporate Affairs has vide its circular dated 8th February, 2011 issued directions under section 212(8) of the Com
DIRECTORS’ REPORT
26 Piramal Glass Limited

8/2/2019 PGL Annual Report 2010-11
http://slidepdf.com/reader/full/pgl-annual-report-2010-11 29/76
Act, 1956, granting general exemption to companies from attaching to their Balance Sheets, the Accounts and other docum
their subsidiaries, subject to fulfillment of specified conditions. In view of this general exemption and being in complianc
the conditions thereof, the Accounts and other documents of the Company’s subsidiaries are not attached to the Balance Sh
the Company. The Consolidated Financial Statements of the Company, which include the results of its subsidiaries, are inclu
this Annual Report. Further, a statement containing the relevant particulars prescribed under the terms of the general exempt
each of the Company’s subsidiaries is enclosed in this Annual Report. The Annual Accounts of the Company’s subsidiaries a
related detailed information can also be sought by any shareholder of the Company or its subsidiaries by making a written reqthe Company Secretary. The Annual Accounts of the Company’s subsidiaries are also available for inspection for any shareho
the Company’s and/or the concerned subsidiaries’ Registered Office. These documents are also available on the Company’s w
i.e. www.piramalglass.com.
Delisting of Equity Shares from the Ahmedabad Stock Exchange Limited
The equity shares of the Company have been delisted from the Ahmedabad Stock Exchange Limited with effect from 30th Nove
2010. This was in accordance with and pursuant to the approval of Board of Directors of the Company.
The Company’s shares continue to be listed on the Bombay Stock Exchange Limited and the National Stock Exchange of India L
Corporate Governance
Our Company has complied with the applicable provisions of Corporate Governance under clause 49 of the Listing Agreemen
the Stock Exchanges. A separate report on Corporate Governance compliance is included as a part of the Annual Report alon
the Certificate from Mr. N.L. Bhatia, Practicing Company Secretary.
Internal Control System
Our Company has a sound internal control system, which ensures that all assets are protected against loss from unauthoriz
and all transactions are recorded and reported correctly. The internal control systems are further supplemented by interna
carried out by an independent firm of Chartered Accountants and periodical review by management. The Audit Committee
Board addresses issues raised by both, the Internal Auditors and Statutory Auditors.
Conservation of Energy, Technology Absorption, Foreign Exchange Earnings and Outgo
Our Company has directed its efforts to reduce energy costs by focusing on energy savings through the best optimization of ope
on a day-to-day basis. The Company has used fuels in appropriate mix to attain maximum savings.
As required by the Companies (Disclosure of Particulars in the Report of the Board of Directors) Rules 1988, the relevant data pert
to conservation of energy, technology absorption and foreign exchange earnings and outgo is given in the prescribed format
Annexure to this Report.
Environment and Safety
Our Company’s commitment to environmental protection and safety is based on the continued ongoing processes implemente
manufacturing facilities. The Company’s plants at Kosamba and Jambusar are certified by BVQI for its Occupational Health
and Environment Management System, in conformity with the international standards under the Integrated Management Sy
Personnel
Our Company had staff strength of 3,257 employees as at 31st March, 2011 (Previous Year 3,241 employees).
Any shareholder interested in obtaining a copy of the statement of particulars of employees referred to in section 217(2A)
Companies Act 1956, may write to the Company Secretary at the registered office of the Company. The statement is also av
for inspection by the members on any working day (except Saturday) upto one day prior to the date of the meeting at the reg
office of the Company between 10.00 a.m. to 5.00 p.m.
Stock Options disclosures pursuant to the applicable requirements of the Securities and Exchange Board of India (Employee
Option Scheme and Employee Stock Purchase Scheme) Guidelines, 1999 are given in the Annexure to this Report.
Directors
Mr. Dharendra Chadha and Mr. Jiten Doshi retire by rotation at the ensuing Annual General Meeting and are eligible for re-appoin
which the Board recommends.
DIRECTORS’ RE
Piramal Glass Limit

8/2/2019 PGL Annual Report 2010-11
http://slidepdf.com/reader/full/pgl-annual-report-2010-11 30/76
Mr. Vimal Bhandari has been appointed as a Director on the Board of the Company w.e.f. March 9, 2011 in the casual vacancy c
by the resignation of Mr. Shitin Desai.
Mr. Shitin Desai and Mr. Murari Rajan have ceased to be Directors of the Company w.e.f. January 20, 2011 and March 31
respectively. Your Directors place on record their appreciation for the services rendered by them during their tenure on the
of the Company.
Directors Responsibility Statement As required under section 217 (2AA) of the Companies Act 1956, (“the Act”) we hereby state:
1. that in the preparation of annual accounts, the applicable accounting standards have been followed. There are no m
departures from these applicable accounting standards.
2. that the Directors have selected such accounting policies and applied them consistently and made judgments and estimat
are reasonable and prudent so as to give a true and fair view of the state of affairs of the Company as at 31st March, 2011
profit for the year ended on that date;
3. that the Directors have taken proper and sufficient care for the maintenance of adequate accounting records in accordance w
provisions of the Act for safeguarding the assets of the Company and for preventing and detecting fraud and other irregul
4. that the Directors have prepared the annual accounts on a going concern basis.
Group
As per the intimations from the Promoters, the names of the Promoters and the entities comprising ‘group’ as defined in the Mono
and Restrictive Trade Practices Act, 1969 (MRTP) are given for the purpose of SEBI (Substantial Acquisitions of Shares and Tak
Regulations, 1997 in the Annexure to this Report.
Auditors
M/s. Haribhakti & Co., Chartered Accountants, Vadodara retire as Auditors of the Company at the ensuing AGM and are eligi
re-appointment.
Acknowledgements
We take this opportunity to thank the employees for their dedicated service and co-operation in the functioning of the Comp
We also thank the Shareholders and Company’s Bankers for their continued support to the Company.
By Order of the
Ajay G. P
Mumbai Ch
Dated : June 21, 2011
DIRECTORS’ REPORT
28 Piramal Glass Limited

8/2/2019 PGL Annual Report 2010-11
http://slidepdf.com/reader/full/pgl-annual-report-2010-11 31/76
Annexure to Directors’ Report
I. Particulars under Companies (Disclosures of Particulars in the Report of Board of Directors) Rules, 1988 for thended 31st March 2011
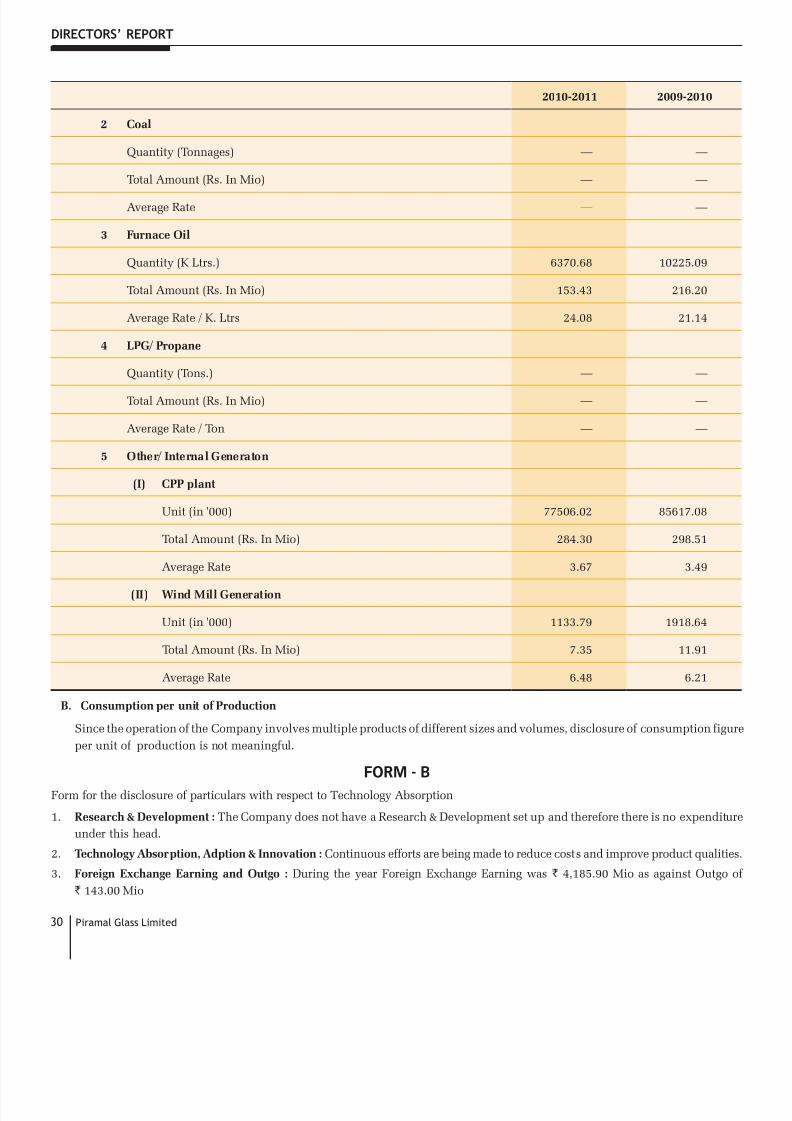
Conservation of Energy
During the year, the Company introduced the following measures to conserve energy:• Installation of VFD mechanism in furnace area and flow of current controlled through pressure transmitters for energy conser
• Modification in furnace boosters to reduce boosting energy to maintain the Furnace bottom temperature.
• In Mould Manufacturing by replacing Screw Compressor of high capacity with two low Capacity reciprocating Compres
Form - A
Form of disclosure of particulars with respect to Conservation Energy.
A POWER & FUEL CONSUMPTION 2010-2011 2009-201
1 Gas / Electricity
a) (I) Gas
Unit ('000 M3) 65576.63 73468.
Total Amount (Rs. In Mio) 803.66 686.
Rate / Unit (M3) 12.26 9.
(II) Electricity
Unit (in '000) 35927.32 23967.
Total Amount (Rs. In Mio) 238.91 173.
Rate / Unit (KWH) 6.65 7.
b) Own Generation
(I) Through Diesel Generator
Unit —
Total Amount (Rs. In Mio) —
Rate / Unit —
(II) Through Steam Turbine Generator
Unit —
Total Amount (Rs. In Mio) —
Rate / Unit —
DIRECTORS’ RE
Piramal Glass Limit
8/2/2019 PGL Annual Report 2010-11
http://slidepdf.com/reader/full/pgl-annual-report-2010-11 32/76
2010-2011 2009-201
2 Coal
Quantity (Tonnages) — —
Total Amount (Rs. In Mio) — —
Average Rate — —
3 Furnace Oil
Quantity (K Ltrs.) 6370.68 10225.09
Total Amount (Rs. In Mio) 153.43 216.20
Average Rate / K. Ltrs 24.08 21.14
4 LPG/ Propane
Quantity (Tons.) — —
Total Amount (Rs. In Mio) — —
Average Rate / Ton — —
5 Other/ Internal Generaton
(I) CPP plant
Unit (in '000) 77506.02 85617.08
Total Amount (Rs. In Mio) 284.30 298.51
Average Rate 3.67 3.49
(II) Wind Mill Generation
Unit (in '000) 1133.79 1918.64
Total Amount (Rs. In Mio) 7.35 11.91
Average Rate 6.48 6.21
B. Consumption per unit of Production
Since the operation of the Company involves multiple products of different sizes and volumes, disclosure of consumption
per unit of production is not meaningful.
FORM - BForm for the disclosure of particulars with respect to Technology Absorption
1. Research & Development : The Company does not have a Research & Development set up and therefore there is no expen
under this head.
2. Technology Absorption, Adption & Innovation : Continuous efforts are being made to reduce costs and improve product qu
3. Foreign Exchange Earning and Outgo : During the year Foreign Exchange Earning was ` 4,185.90 Mio as against Ou
` 143.00 Mio
DIRECTORS’ REPORT
30 Piramal Glass Limited

8/2/2019 PGL Annual Report 2010-11
http://slidepdf.com/reader/full/pgl-annual-report-2010-11 33/76
II. Group coming within the definition of ‘group’ as defined in Monopolies and Restrictive Trade Practices Act,1969 (
The persons and entities which constitute the Group coming within the definition of ‘group’ as defined in MRTP which exe
or is established to be in a position to exercise, control, directly or indirectly, over the Company, include the following:
Mr. Ajay G. Piramal
Dr. (Mrs.) Swati A. Piramal
Mr. Anand Piramal
Mrs. Lalita G. Piramal
Ms. Nandini Piramal
Ajay G. Piramal (HUF)
Gopikisan Piramal (HUF)
Adelwise Investments Pvt. Ltd.
Akshar Fincom Pvt. Ltd.
Alpex Holdings Pvt. Ltd.
Alpex Power Pvt. Ltd.
Assable Buildcon LLP
BMK Laboratories Pvt. Ltd
Cavaal Fininvest Pvt. Ltd.
Glass Engineers Pvt. Ltd.
Gliders Buildcon LLP
Gopikishan Piramal Pvt. Ltd.
INDIAREIT Fund Advisors Pvt. Ltd.
IndiaVenture Advisors Pvt. Ltd.
Nicholas Piramal Pharma Pvt. Ltd.
Oxygen Bio Research Pvt. Ltd.
Paramount Pharma Pvt. Ltd.
PDL Realty Pvt. Ltd.
PEL Fininvest Pvt. Ltd.
PEL Management Services Pvt. Ltd.
PEL InfraConstructions & Developers Pvt. Ltd.
PHL Capital Pvt. Ltd.
PHL Fininvest Private Ltd.
Piramal Architects & Engineers Pvt. Ltd.
Piramal Commercial Estates LLP
Piramal Developers Pvt. Ltd.
Piramal Enterprises Ltd.
Piramal Healthcare Ltd.
Piramal International Pvt. Ltd.
Piramal Life Sciences Ltd.
Piramal Management Services Pvt. Ltd.
Piramal Pharmaceutical Development Services Pvt. L
Piramal Projects and Constructions Pvt. Ltd.
Piramal Realty Pvt. Ltd.(formerly known as Alpex International Ltd.)
Piramal Residences Pvt. Ltd.
Piramal Systems & Technologies Pvt. Ltd.
Piramal Texturising Pvt. Ltd.
Piramal Water Pvt. Ltd.
PRL Developers Pvt. Ltd.
Propiedades Realties Pvt. Ltd.
The Ajay G. Piramal Foundation
The Sri Gopikrishna Trust
The Sri Govinda Trust
The Sri Hari Trust
The Sri Krishna Trust
The Swastik Safe Deposit & Investments Ltd.
Topzone Mercantile LLP
Vulcan Investments Pvt. Ltd.
The above disclosure has been made, inter-alia, for the purpose of Regulation 3(1)(e) of SEBI (Substantial Acquisitions of
and Takeovers) Regulations, 1997.
DIRECTORS’ RE
Piramal Glass Limit

8/2/2019 PGL Annual Report 2010-11
http://slidepdf.com/reader/full/pgl-annual-report-2010-11 34/76
III. DISCLOSURES REGARDING STOCK OPTIONS
Pursuant to the applicable requirements, if any, of the Securities and Exchange Board of India (Employee Stock Option Schem
Employee Stock Purchase Scheme) Guidelines, 1999 (“the SEBI Guidelines”), following disclosures are made in connectio
the ESOP Scheme of the Company, for Options granted to the Company’s Employees for the financial year ended March 31
Sr. No. Details Disclosures
(i) Options Granted during FY2011 5,01,914 Options
(ii) Pricing Formula The Option price is determined by the Trustees of the respective Truthe basis of the price not being higher than the higher of:
(a) market price on the date of grant; or
(b) average of the price prevailing for the share during the 3 (three) mimmediately preceding the date on which the Option is offered Employee; or
(c) The Company has not issued shares within three months prior option
Options granted during the financial year ended 31st March, 2011, wereexercise price of Rs. 23.35 per option which was approved by the Truof the ESOP Trust, taking into consideration several factors.
(iii) Options Vested during FY2011 5,18,350Relating to options granted for FY10
(iv) Options Exercised during FY2011 2,75,717Relating to options granted for FY10
(v) Total number of shares arising as aresult of exercise of options
Same as Options exercised, as each Option entitles the holder ther
1 equity share.
(vi) Options Lapsed None
(vii) Variation of terms of Options None
(viii) Total number of Options in force 2,42,633Relating to options granted for FY10
(ix) Employee-wise details of opt ionsgranted
– senior managerial personnel All Stock Options that have been granted by the Company as aforesaidbeen granted to senior managerial personnel.
– employees who receive a grant inany one year of option amountingto 5% or more of options grantedduring that year
The following employees have received a grant amounting to 5% or
of Options granted during FY11
a) Mr. Vijay Shah - Managing Director
b) Mr. Sanjay Tiwari – CEO and Executive Director of Piramal
Ceylon PLC
c) Mr. Niraj Tipre - CEO of Piramal Glass – USA Inc.
– identified employees who weregranted options during any oneyear equal to or exceeding 1%
of the issued capital (excludingouts tand ing war ran t s andconversions) of the Company atthe time of grant.
None
Since the PGL ESOP Scheme is implemented by the ESOP Trust and the shares issued by the ESOP Trust against exercise o
options are those that have been acquired by the ESOP Trust from existing shareholders and no new shares have been iss
the Company, there will not be any increase in the share capital of the Company, nor will there be any impact on the Ea
Per Share or other ratios relating to share capital as a result of such exercise of Stock Options.
DIRECTORS’ REPORT
32 Piramal Glass Limited

8/2/2019 PGL Annual Report 2010-11
http://slidepdf.com/reader/full/pgl-annual-report-2010-11 35/76
AUDITORS’ REPORTTO THE MEMBERS OF PIRAMAL GLASS LIMITED
1. We have audited the attached Balance Sheet of PIRAMAL GLASS LIMITED, (Formerly known as Gujarat Glass Limited.) (herereferred to as the ‘Company’) as at 31st March, 2011, the Profit and Loss Account and also the Cash Flow Statement for thended on that date annexed thereto which we have signed under reference to this report. These financial statements a
responsibility of the Company’s management. Our responsibility is to express an opinion on these financial statementson our audit.
2. We conducted our audit in accordance with auditing standards generally accepted in India. Those standards require that wand perform the audit to obtain reasonable assurance about whether the financial statements are free of material misstatAn audit includes examining, on a test basis, evidence supporting the amounts and disclosures in the financial statemenaudit also includes assessing the accounting principles used and significant estimates made by management, as well as evathe overall financial statements presentation. We believe that our audit provides reasonable basis for our opinion.
3. As required by the Companies (Auditors Report) Order, 2003 as amended by the companies (Auditor’s Report) (amendOrder 2004, (together the, “Order”) issued by the Central Government of India in terms of sub section (4A) of section the Companies Act, 1956 of India (the Act) and on the basis of such checks of the books and records of the Companyconsidered appropriate and according to the information and explanations given to us we enclose in the Annexure a staon the matters specified in paragraphs 4 and 5 of the said Order.
4. Further to our comments in the Annexure referred to in para 3 above, we report that:a) We have obtained all the information and explanations, which to the best of our knowledge and belief were necess
the purposes of our audit;
b) In our opinion, proper books of accounts as required by law have been kept by the Company, so far as appears froexamination of those books;
c) The Balance Sheet and Profit and Loss Account and the Cash Flow Statement dealt with by this report are in agreemethe books of account;
d) In our opinion, the Balance Sheet and the Profit and Loss Account and the Cash Flow Statement, dealt with by thiscomply with the Accounting Standards referred to in sub-section (3C) of Section 211 of the Companies, Act, 1956.
e) On the basis of the written representations received from the Directors of the Company as on 31st March, 2011, andon record by the Board of Directors of the Company, we report that none of the Directors is disqualified as on 31st 2011 from being appointed as a director in terms of clause (g) of sub section (1) of section 274 of the Companies Act
f) In our opinion, and to the best of our information and according to explanations given to us, the said accounts read towith the Significant Accounting Policies and Notes forming part thereof, give the information required by the ComAct, 1956 in the manner so required and give a true and fair view in conformity with the accounting principles geaccepted in India:
i) in the case of the Balance Sheet, of the state of affairs of the Company as at 31st March, 2011.
ii) in the case of Profit and Loss Account, of the profit of the Company for the year ended on that date and
iii) in the case of Cash Flow statement, of the cash flows of the Company for the year ended on that date.
HITESH J. P
M. No.
For HARIBHAKTI Chartered Accou
Mumbai, 28th April, 2011 Firm Reg. No. 11
STANDALONE FINANCIAL STATEM
Piramal Glass Limit
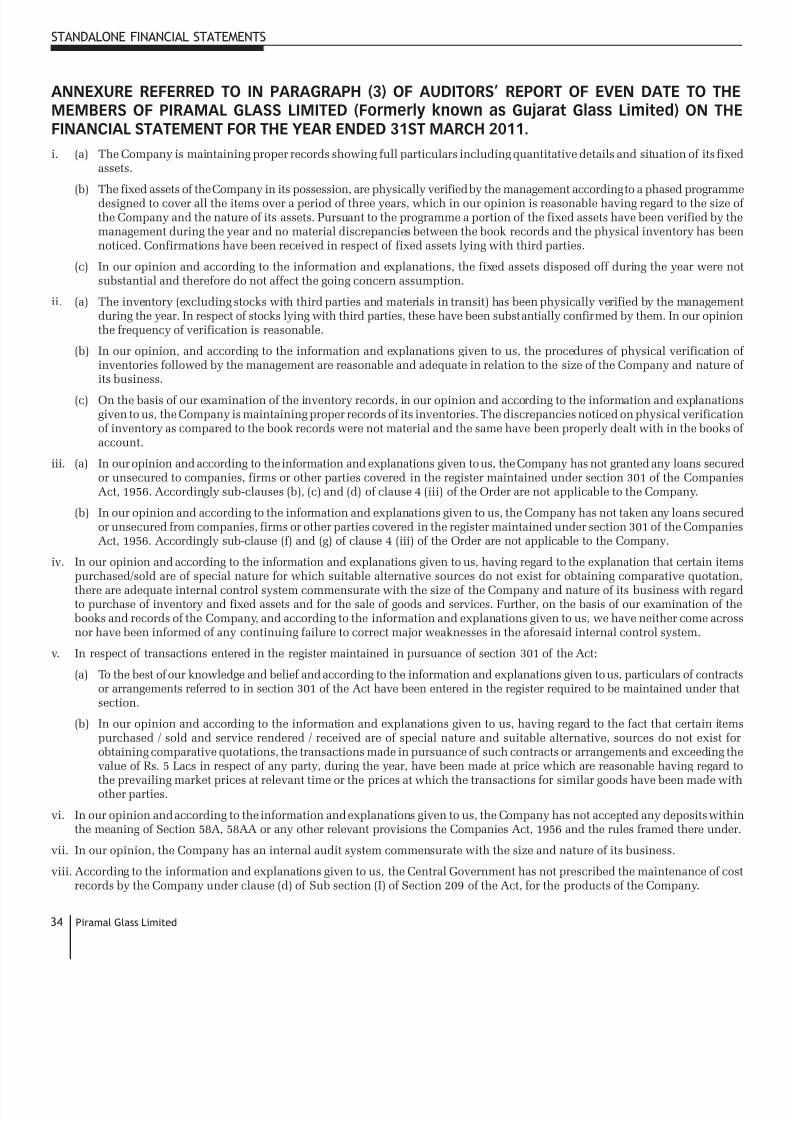
8/2/2019 PGL Annual Report 2010-11
http://slidepdf.com/reader/full/pgl-annual-report-2010-11 36/76
ANNEXURE REFERRED TO IN PARAGRAPH (3) OF AUDITORS’ REPORT OF EVEN DATE TOMEMBERS OF PIRAMAL GLASS LIMITED (Formerly known as Gujarat Glass Limited) ONFINANCIAL STATEMENT FOR THE YEAR ENDED 31ST MARCH 2011.
i. (a) The Company is maintaining proper records showing full particulars including quantitative details and situation of itassets.
(b) The fixed assets of the Company in its possession, are physically verified by the management according to a phased progdesigned to cover all the items over a period of three years, which in our opinion is reasonable having regard to thethe Company and the nature of its assets. Pursuant to the programme a portion of the fixed assets have been verifiedmanagement during the year and no material discrepancies between the book records and the physical inventory hanoticed. Confirmations have been received in respect of fixed assets lying with third parties.
(c) In our opinion and according to the information and explanations, the fixed assets disposed off during the year wsubstantial and therefore do not affect the going concern assumption.
ii. (a) The inventory (excluding stocks with third parties and materials in transit) has been physically verified by the managduring the year. In respect of stocks lying with third parties, these have been substantially confirmed by them. In our othe frequency of verification is reasonable.
(b) In our opinion, and according to the information and explanations given to us, the procedures of physical verificainventories followed by the management are reasonable and adequate in relation to the size of the Company and na
its business.(c) On the basis of our examination of the inventory records, in our opinion and according to the information and explan
given to us, the Company is maintaining proper records of its inventories. The discrepancies noticed on physical verifof inventory as compared to the book records were not material and the same have been properly dealt with in the baccount.
iii. (a) In our opinion and according to the information and explanations given to us, the Company has not granted any loans sor unsecured to companies, firms or other parties covered in the register maintained under section 301 of the ComAct, 1956. Accordingly sub-clauses (b), (c) and (d) of clause 4 (iii) of the Order are not applicable to the Company.
(b) In our opinion and according to the information and explanations given to us, the Company has not taken any loans sor unsecured from companies, firms or other parties covered in the register maintained under section 301 of the ComAct, 1956. Accordingly sub-clause (f) and (g) of clause 4 (iii) of the Order are not applicable to the Company.
iv. In our opinion and according to the information and explanations given to us, having regard to the explanation that certain
purchased/sold are of special nature for which suitable alternative sources do not exist for obtaining comparative quothere are adequate internal control system commensurate with the size of the Company and nature of its business withto purchase of inventory and fixed assets and for the sale of goods and services. Further, on the basis of our examinationbooks and records of the Company, and according to the information and explanations given to us, we have neither comenor have been informed of any continuing failure to correct major weaknesses in the aforesaid internal control system.
v. In respect of transactions entered in the register maintained in pursuance of section 301 of the Act:
(a) To the best of our knowledge and belief and according to the information and explanations given to us, particulars of coor arrangements referred to in section 301 of the Act have been entered in the register required to be maintained undsection.
(b) In our opinion and according to the information and explanations given to us, having regard to the fact that certainpurchased / sold and service rendered / received are of special nature and suitable alternative, sources do not exobtaining comparative quotations, the transactions made in pursuance of such contracts or arrangements and exceed
value of Rs. 5 Lacs in respect of any party, during the year, have been made at price which are reasonable having rethe prevailing market prices at relevant time or the prices at which the transactions for similar goods have been madother parties.
vi. In our opinion and according to the information and explanations given to us, the Company has not accepted any depositsthe meaning of Section 58A, 58AA or any other relevant provisions the Companies Act, 1956 and the rules framed there
vii. In our opinion, the Company has an internal audit system commensurate with the size and nature of its business.
viii. According to the information and explanations given to us, the Central Government has not prescribed the maintenancerecords by the Company under clause (d) of Sub section (I) of Section 209 of the Act, for the products of the Company.
STANDALONE FINANCIAL STATEMENTS
34 Piramal Glass Limited

8/2/2019 PGL Annual Report 2010-11
http://slidepdf.com/reader/full/pgl-annual-report-2010-11 37/76
ix. According to the information and explanations given to us and the records of the Company examined by us in respect of staand other dues:
(a) The Company is generally regular in depositing undisputed statutory dues, including Provident Fund, Investor Eduand Protection Fund, Employees State Insurance, Income Tax, Sales Tax, Wealth Tax, Service Tax, Custom Duty, ExcisCess and other statutory dues with the appropriate authorities in India. According to the information and explanationto us, there are no undisputed amount payable in respect of such statutory dues which have remained outstanding asMarch 2011 for a period more than six months from the date they became payable.
(b) Disputed Income Tax Liability of Rs.38.00 million, Sales Tax Liability of Rs.0.43 million and Excise duty of Rs 4.91 mhas not been deposited since the matters are pending with the relevant Appellate Authorities.
x. The Company does not have any accumulated losses as at the end of the financial year. The Company has not incurrelosses during the current financial year and in the immediately preceding financial year.
xi. According to the records of the Company examined by us and the information and explanations given by the managemeare of the opinion that, the Company has not defaulted in repayment of dues to financial institutions or banks as at the bsheet date.
xii. Based on our examination of documents and records and according to the information and explanations given to us, wethe opinion that the Company has not granted any loans and/or advances on the basis of security by way of pledge of sdebentures and other securities.
xiii. In our opinion, the Company is not a chit fund or a nidhi/mutual benefit fund/society. Therefore, the provisions of clause
of the Order are not applicable to the Company.xiv. In our opinion, the Company is not dealing in or trading in shares, securities, debentures and other investments. Accor
the provisions of clause 4(xiv) of the order are not applicable to the Company.
xv. The Company has given guarantees, for term loan and working capital facilities availed by its Subsidiary Company viz. PGlass USA Inc. According to the information and explanation given to us we are of the opinion that the terms and conthereof are not prima facia prejudicial to the interest of the Company.
xvi. According to the information and explanations given to us and to the best of the our knowledge and belief, term loans by the Company were, prima facie, applied by the Company during the year for the purpose for which the loans were obother than temporary deployment pending applications.
xvii.According to the information and explanations given to us and on the overall examination of the Balance Sheet of the Coand Cash Flow Statement we report that no funds raised on short term basis have been used for long term investmentCompany.
xviii. The Company has not made during the year any preferential allotment of shares to the parties and companies coveredregister maintained under section 301 of Companies Act, 1956.
xix. The Company has not issued any debentures during the year and hence the clause relating to the creation of security or for debentures is not applicable to the Company.
xx. The Company has not raised any money by public issue during the year.
xxi. During the course of our examination of books of account and records of the Company, carried out in accordance with the geaccepted auditing practices in India and according to information and explanation given to us, we have neither come acroinstance of material fraud on or by the Company, noticed or reported during the year, nor have been informed of such cathe management.
HITESH J. P
M. No.
For HARIBHAKTI Chartered Accou
Mumbai, 28th April, 2011 Firm Reg. No. 11
STANDALONE FINANCIAL STATEM
Piramal Glass Limit

8/2/2019 PGL Annual Report 2010-11
http://slidepdf.com/reader/full/pgl-annual-report-2010-11 38/76
Balance Sheet as at March 31, 2011
ScheduleNo.
As at March 31, 2011
` in MillionsMarch 31
` in Mi
I. SOURCES OF FUNDS
1. Shareholders’ Fundsa. Share Capital
Equity Share Capital 1 804.35 804.35
b. Reserves and Surplus 2 3,568.13 4,372.48 3,209.47 4,0
2. Loan Funds
a. Secured Loans 3 3,730.87 4,461.41
b. Unsecured Loans 4 2,042.52 5,773.39 1,244.20 5,7
3. Deferred Tax Liability (Net)
Deferred Tax Liability 526.85 567.70
Less : Deferred Tax Assets (391.69) 135.16 (461.91) 1
(Refer note no 13 of part-B, of schedule 19)
T O TA L 10,281.03 9,8
II. APPLICATION OF FUNDS
1. Fixed Assets
a. Gross Block 5 11,294.91 10,645.42
b. Less: Depreciation (5,162.95) (4,426.54)
c. Net Block 6,131.96 6,218.88
d. Capital Work in Progress 394.50 6,526.46 140.18 6,3
2. Investments 6 592.63 5
3. Current Assets, Loans and Advances
a. Inventories 7 1,168.48 1,035.69
b. Sundry Debtors 8 2,581.43 2,323.38
c. Cash and Bank Balances 9 14.07 17.18
d. Loans and Advances 10 1,299.90 728.25
5,063.88 4,104.50
Less: Current Liabilities and Provisions
a. Current Liabilities 11 1,017.99 845.84
b. Provisions 12 883.95 382.00
1,901.94 1,227.84
Net Current Assets 3,161.94 2,8
T O TA L 10,281.03 9,8
NOTES TO ACCOUNTS 19
Schedules referred to above and notes attached thereto form an integral part of Balance Sheet
This is the Balance sheet referred to in our report of even date.
Hitesh J. Desai Ajay G. Piramal ChairmanPartnerM. No. 37569 Vijay Shah Managing Director For Haribhakti & Co., Sandeep Arora Chief Financial OfficerChartered AccountantsFirm Reg. No. 118013W Nehal Doshi Company Secretary
Mumbai, April 28, 2011
STANDALONE FINANCIAL STATEMENTS
36 Piramal Glass Limited

8/2/2019 PGL Annual Report 2010-11
http://slidepdf.com/reader/full/pgl-annual-report-2010-11 39/76
Profit & Loss Account for the Year Ended March 31, 2011
Schedule
No.
Year ended
March 31, 2011
` in Millions
Year e
March 31,
` in Mil
INCOME
Turnover (Gross) 7,770.26 6,8
Excise Duty 265.27 2
Sales Tax 76.03
Turnover (Net) 7,428.96 6,5
Other Income 13 289.75 2
7,718.71 6,8
EXPENDITURE
Materials 14 1,814.22 1,6
Staff Cost 15 808.24 6
Other Expenses 16 3,016.57 2,9
(Increase)/Decrease in WIP/Finished Goods 17 (29.33)5,609.70 5,2
PROFIT BEFORE INTEREST, DEPRECIATION AND TAX 2,109.01 1,5
Interest 18 448.29 6
Depreciation 740.07 7
PROFIT BEFORE TAX 920.65 2
Provision for Taxation – Current 205.43
– Mat Credit Entitlement (205.43) (3
– Deferred 234.80
PROFIT/(LOSS) FOR THE YEAR 685.85 1
Balance brought forward from earlier year 353.83 2NET PROFIT AVAILABLE FOR APPROPRIATION 1,039.68 4
Proposed Dividend 281.52
Corporate Dividend Tax 45.66
Transfer to General Reserve 68.59
Balance carried to Balance Sheet 643.91 3
1,039.68 4
Earning Per Share (Basic / Diluted) ` 8.53
Earning Per Share Before Extraordinary Items (Net of Taxes) ` 8.53
NOTES TO ACCOUNTS 19
Schedules referred to above and notes attached thereto form an integral part of Profit & Loss Account.
This is the Profit & Loss Account referred to in our report of even date.
Hitesh J. Desai Ajay G. Piramal ChairmanPartnerM. No. 37569 Vijay Shah Managing Director For Haribhakti & Co., Sandeep Arora Chief Financial OfficerChartered AccountantsFirm Reg. No. 118013W Nehal Doshi Company Secretary
Mumbai, April 28, 2011
STANDALONE FINANCIAL STATEM
Piramal Glass Limit

8/2/2019 PGL Annual Report 2010-11
http://slidepdf.com/reader/full/pgl-annual-report-2010-11 40/76
Cash Flow Statement for the Year Ended March 31, 2011
Year ended
March 31, 2011
` in Millions
Year e
March 31,
` in Mil
A. CASH FLOW FROM OPERATING ACTIVITIES
Net Profit Before Tax 920.65 2
Adjustments for :
Add/ (Less) :
(Profit)/ Loss on Sale of Fixed Assets 1.75
Depreciation 740.07 6
Interest Paid 448.29 6
Dividend Income —
Technical Fees (83.86) (7
Operating Profit Before Working Capital Changes 2,026.90 1,3
Adjustments for Changes in Working Capital :
(Increase)/ Decrease in Inventories (132.78) (3
(Increase)/ Decrease in Sundry Debtors (258.04)
(Increase)/ Decrease in Loans & Advances (643.83) 7
Increase/ (Decrease) in Trade Payables & Other Liabilities 170.70
Increase/ (Decrease) in Other Provisions 268.55
Cash Generated From Operations 1,431.50 2,2
Direct Tax Paid Less refund received (133.24)
Net Cash from Operating Activities – A 1,298.26 2,2
B. CASH FLOW FROM INVESTING ACTIVITIES
Purchase of Fixed Assets/ WIP (910.86) (16
Sale of Fixed Assets 1.65
Dividend Received 0.00
Investment in shares in Subsidiary Company (3.13)
Technical fees received 83.86
Net Cash from Investing Activities – B (828.48) (10
STANDALONE FINANCIAL STATEMENTS
38 Piramal Glass Limited

8/2/2019 PGL Annual Report 2010-11
http://slidepdf.com/reader/full/pgl-annual-report-2010-11 41/76
Year ended
March 31, 2011
` in Millions
Year e
March 31,
` in Mil
C. CASH FLOW FROM FINANCING ACTIVITIES
Increase/(Decrease) in Share Capital — 6
Increase/(Decrease) in Share Premium — 1,2
(Repayment)/ Proceeds From Borrowings 67.76 (3,40
Dividend & tax thereon (92.36)
Interest Paid (448.29) (60
Net cash from Financing Activities – C (472.89) (2,15
Net Increase in Cash & Cash Equivalents (A+B+C) (3.11)
Cash & Cash Equivalents as at 01-04-2010 (Opening Balance) 17.18
Cash & Cash Equivalents as at 31-03-2011 (Closing Balance) 14.07
Notes :
1. The above cash flow has been prepared under the Indirect Method as setout in the Accounting Standard - 3 on Cash
Statements issued by the Institute of Chartered Accountants of India.
2. The previous year figures have been regrouped wherever necessary in order to confirm to this years presentation.
3. Figures in brackets reflect cash outflows.
This is the Cash Flow statement referred to in our report of even date.
Hitesh J. Desai Ajay G. Piramal ChairmanPartnerM. No. 37569 Vijay Shah Managing Director For Haribhakti & Co., Sandeep Arora Chief Financial OfficerChartered AccountantsFirm Reg. No. 118013W Nehal Doshi Company Secretary
Mumbai, April 28, 2011
STANDALONE FINANCIAL STATEM
Piramal Glass Limit

8/2/2019 PGL Annual Report 2010-11
http://slidepdf.com/reader/full/pgl-annual-report-2010-11 42/76
Schedules forming part of the Balance Sheet as at March 31, 2011
As at March 31, 2011
` in MillionsMarch 31
` in Mi
1. SHARE CAPITAL AUTHORISED
82000000 Equity Shares of ` 10/- each 820.00 8
(Previous year 82000000 Equity Shares of ` 10/- each)
820.00 8
ISSUED
80923500 Equity Shares of ` 10/- each 809.24 8
(Previous year 80923500 Equity Shares of ` 10/- each)
809.24 8
SUBSCRIBED AND PAID UP
80434736 Equity Shares of ` 10/- eachOf the total paid up capital 62451736 Equity shares of face value of ` 10each were allotted on 19th September 2009 as fully paid equity shares,pursuant to the Rights Issue of Equity Shares by the company.
804.35 8
804.35 8
2. RESERVES AND SURPLUS
Share Premium Account
As per last Balance Sheet 2,307.01 1,075.26
Add : Amount received on rights issue — 1,249.03
Less : Right Issue Expenses — 2,307.01 17.28 2,3
Capital Redemption Reserve
As per last Balance Sheet 490.00 4
General Reserve
As per last Balance Sheet 58.63 58.63
Transfer from P&L appropriation 68.59 127.21 —
Profit and Loss Account
As per annexed Profit and Loss Account 643.91 3
3,568.13 3,2
STANDALONE FINANCIAL STATEMENTS
40 Piramal Glass Limited

8/2/2019 PGL Annual Report 2010-11
http://slidepdf.com/reader/full/pgl-annual-report-2010-11 43/76
As at March 31, 2011
` in MillionsMarch 31
` in Mi
3. SECURED LOANS *
Cash Credit from Banks (Refer Note 1) 334.82 2
Term Loan
Rupee Term loan from Banks (Refer Note 2) 780.00 1,8
Foreign Currency Term Loan (Refer Note 2) — 2
Buyers Credit (Refer Note 3) 116.05 1
Rupee Short Term loan from Banks (Refer Note 4) 2,500.00 2,0
3,730.87 4,4
Notes :
1. Cash Credit facilities including packing credit in foreign currency are secured by Hypothecation of current assets nastocks, bills receivables and book debts and all other movables, both present and future, of the Company.
2. The Rupee Term Loan and foreign currency Term Loans are secured by mortgage and pari passu charge of immovable propof the Company, both present and future. They are further secured by hypothecation of all movables and movable machmachinery spares and accessories, both present and future, subject to prior charge created/ to be created in favour of bfor securing the borrowing for cash credit from Banks facilities and the charge on specific assets referred to sr. no. 3 bel
3. Loans under Buyers Credit are secured by an exclusive charge on the assets and equipments procured under the facility
4. The Rupee Short Term Loans are secured by mortgage and second charge of immovable properties of the Companypresent and future. They are further secured by second charge on all movables and movable machinery, machinery spareaccessories both present and future.
* Repayable within a year ` 2,914.81 millions, previous year ` 2,661.41 millions.
As at March 31, 2011
` in MillionsMarch 31
` in Mi
4. UNSECURED LOANS *
Long Term Loan from banks. 668.75 3
Packing Credit and/or Short Term Loans from Banks 1,116.50 5
Sales Tax Deferment loan(Repayable in five equal installments commencing from F.Y. 2011-12)
257.27 2
2,042.52 1,2
Note:* Repayable within a year ` 1,734.13 millions, previous year ` 818.66 millions
STANDALONE FINANCIAL STATEM
Piramal Glass Limit

8/2/2019 PGL Annual Report 2010-11
http://slidepdf.com/reader/full/pgl-annual-report-2010-11 44/76
5. FIXED ASSETS (AT COST)
(Refer note no. 2, Part A, Schedule 19) ` in
Description GROSS BLOCK DEPRECIATION NET BLOC
As on01.04.2010
Additions Deductions As on31.03.2011
As on01.04.2010
Additions Deductions As on31.03.2011
As on31.03.2011
A01.0
Intangible Assets
Software 86.75 6.25 — 93.00 42.45 22.56 — 65.01 27.99 Tangible Assets
Freehold Land 64.64 — — 64.64 — — — — 64.64
Buildings 1,203.59 162.49 — 1,366.08 287.10 41.78 — 328.88 1,037.20
Plant & Machinery 9,082.03 539.61 68.10 9,553.54 3,974.01 662.18 1.57 4,634.62 4,918.92 5
Furniture & Fixtures 195.82 5.77 1.91 199.68 118.38 11.95 0.96 129.37 70.31
Vehicles 12.59 7.10 1.72 17.97 4.60 1.6 1.13 5.07 12.90
Total 10,645.42 721.22 71.73 11,294.91 4,426.54 740.07 3.66 5,162.95 6,131.96 6
Previous Year 10,432.58 281.86 69.03 10,645.42 3,729.98 723.79 27.23 4,426.54
Capital Work in Progress 394.50
TOTAL 6,526.46 6
Notes :1) Gross Block is net of CENVAT credit availed on relevant assets2) Plant & Machinery includes moulds worth ` 409.15 million, reclassified, during the year as part of Plant & Machinery, as against an in
item in previous financial year.(refer note No.4 Part B of Schedule 193) Borrowing cost capitalized ` NIL (Previous year ` NIL millions) during the year.
As at March 31, 2011
` in MillionsMarch 31
` in Mi
6. INTESTMENTS
(Long Term, Non Trade)
A. Shares in Subsidiary Companies – Quoted
(i) 536331880 Ordinary Shares, of SLR 1 each of Piramal Glass Ceylon PLC, SriLanka. (previous year 536331880 Ordinary Shares of SLR 1 each)
Market Value ` 2,440.85 millions (previous year ` 466.07 millions)
348.09 3
B. Shares in Subsidiary Companies – Un-Quoted
(i) 25000 Ordinary Shares of USD 1 each of Piramal Glass International Inc., USA 1.21
(ii) 50000 Ordinary Shares of USD 10 each of Piramal Glass USA Inc., 227.61 2
(iii) 150000 Ordinary Shares of GBP 1 each of Piramal Glass (UK) Ltd. 11.59
(iv) 50000 ordinary Shares of Euro 1 each of Piramal Glass Europe SARL 3.13
C. Shares in Other Companies – Un-Quoted
100,000 Ordinary Shares of Rs. 10 each of Enviro Infrastructure Co. Ltd. 1.00
592.63 5
7. INVENTORIES(As certified by the Management)
Raw and Packing Materials 167.45 1Stores & Spares 303.67 3
Work-in- Progress 13.02
Finished Goods (* #) 873.18 7
1,357.32 1,1
Provision for Inventory (188.84) (12
# Includes trading inventory of ` 3.43 million (Previous year ` 2.27 million) 1,168.48 1,0
STANDALONE FINANCIAL STATEMENTS
42 Piramal Glass Limited

8/2/2019 PGL Annual Report 2010-11
http://slidepdf.com/reader/full/pgl-annual-report-2010-11 45/76
As at March 31, 2011
` in MillionsMarch 31
` in Mi
8. SUNDRY DEBTORS
i. Over six months
Unsecured - Considered good 509.97 578.57
- Considered doubtful 64.60 58.50
574.57 637.07
64.60 509.97 58.50 5
ii. Others
Unsecured - Considered good 2,071.46 1,7
2,581.43 2,3
9. CASH AND BANK BALANCES
i. Cash and cheques on hand 0.79
ii. Balance with Scheduled Banks
– Current Account 8.26
–
Others 5.0214.07
10. LOANS AND ADVANCES(Unsecured and Considered Good, unless otherwise stated)
Advances recoverable in cash or in kind or for value to be received
– From Suppliers 214.69
– From Others
– Considered Good 731.58 451.79
– Considered Doubtful 35.00 35.00
766.58 486.79
– Less : Provisions (35.00) 731.58 (35.00) 4
Advance Income Tax & TDS 184.56
Prepaid expenses 13.39
Balance with Excise Authorities 84.96 1
Other Deposits 70.72
1,299.90 7
11. CURRENT LIABILITIES
Sundry Creditors for Capital Goods, Materials and Expenses 880.20 7
Interest accrued but not due 32.97
Other liabilities 104.82
1,017.99 8
12. PROVISIONS
Provision for Employees retirement benefits 41.35
Provision for Other Liabilities 309.99 2
Proposed Dividend 281.52
Provision for Tax on Dividend 45.66
Provision for Tax 205.43
883.95 3
STANDALONE FINANCIAL STATEM
Piramal Glass Limit

8/2/2019 PGL Annual Report 2010-11
http://slidepdf.com/reader/full/pgl-annual-report-2010-11 46/76
Schedules annexed to and forming part of the Profit and Loss Accountfor the Year Ended March 31, 2011
Year ended
March 31, 2011
` in Millions
Year e
March 31,
` in Mil
13. OTHER INCOME
Technical Fees 83.86
Mould Recovery 36.74
Claims & Refunds 1.23
Scrap Sales 40.17
Income from Windmill 7.35
Export Incentive 84.06
Miscellaneous Income 34.00
Sales Tax Remission 0.57
Dividend Income (Gross) —Interest on Deposits 1.77
289.75 2
14. MATERIALS
Raw Materials
Opening stock 88.49 95.46
Add: Purchases 1,201.07 1,020.67
1,289.56 1,116.13
Less: Closing stock 153.54 88.49
Raw Materials Consumed 1,136.02 1,0
Packing Materials Consumed 631.58 4
Cost of Trading Goods Sold 46.62
1,814.22 1,6
15. STAFF COST *
Salaries, Wages and Bonus 754.21 6
Contribution to Provident and Other funds 29.27
Staff Welfare 24.76
808.24 6
*Includes managerial remuneration of ` 22.65 Millions(P.Y. ` 17.61 Millions
paid/payable to the Managing Director.(Refer note No. 6 of Part B of Schedule
19 on Notes to Accounts)
STANDALONE FINANCIAL STATEMENTS
44 Piramal Glass Limited

8/2/2019 PGL Annual Report 2010-11
http://slidepdf.com/reader/full/pgl-annual-report-2010-11 47/76
Year ended
March 31, 2011
` in Millions
Year e
March 31,
` in Mil
16. OTHER EXPENSES
Power & Fuel 1,216.03 1,0
Stores, Spares, Lubricants and Moulds consumed 227.04 2
Decoration Expenses 296.40 2
Repairs to:
Building 4.26
Plant & Machinery 16.21
Others 29.37
Foreign technical fees 25.48
Freight outward & forwarding charges 706.39 5
Travelling Expenses
(Directors Travelling ` 4.11 Million, PY ` 4.06 Million)
35.40
Marketing Survey Fees 23.82
Commission on Sales 43.23
Rent, Rates & Taxes 31.02
Wind farm rent & maintenance 1.58
Bank Charges 23.26
Insurance 11.20
Communication expenses 15.24
Donation 0.22
Legal & Professional Fees 33.74
Audit Fees 0.95
Sitting fees 0.92
Loss on Sale of Assets 1.81
Excise Expense 17.90Exchange (Gain) / Loss (47.05) 3
Miscellaneous Expenses 302.15 2
3,016.57 2,9
17. (INCREASE)/DECREASE IN FINISHED
GOODS AND WORK-IN-PROGRESS
Opening Stock
Finished Goods 651.80 6
Work-in-Progress 12.79
664.59 6
Closing Stock
Finished Goods 680.90 6Work-in-Progress 13.02
693.92 6
(Increase)/Decrease in WIP/Finished Goods (29.33)
18. INTEREST
Interest term loans 354.39 5
Interest Others 93.90
448.29 6
STANDALONE FINANCIAL STATEM
Piramal Glass Limit

8/2/2019 PGL Annual Report 2010-11
http://slidepdf.com/reader/full/pgl-annual-report-2010-11 48/76
19. NOTES TO THE ACCOUNTSAccounting Policies and Notes on Accounts
PART – A SIGNIFICANT ACCOUNTING POLICIES
1 ACCOUNTING ASSUMPTIONThe financial statements are drawn up in accordance with the historical cost convention on accrual basis and comply waccounting standards referred to in Sec 211 (3C) of the Companies Act, 1956.
2 FIXED ASSETSAll fixed assets are stated at cost of acquisition less accumulated depreciation and impairment loss, if any. Cost compripurchase price, material cost and any attributable/incidental cost incurred by the Company for bringing the asset to its wcondition for its intended use. In the case of fixed assets acquired for new projects / expansions, interest cost on borrowiother related expenses up to the date of commercial production incurred towards acquiring fixed assets are capitalized.
3. IMPAIRMENTa. The Company assesses at each balance sheet date whether there is any indication that an asset may be impaired. If an
indication exists, the Company estimates the recoverable amount of the asset. If such recoverable amount of the athe recoverable amount of the cash-generating unit to which the asset belongs is less than its carrying amount, the caamount is reduced to its recoverable amount. The reduction is treated as an impairment loss and is recognized in the& Loss account.
b. A previously recognized impairment loss is increased or reversed depending on changes in circumstances. Hothe carrying value after reversal is not increased beyond the carrying value that would have prevailed by charging
depreciation if there was no impairment.
4. DEPRECIATIONDepreciation on all fixed assets except moulds, is provided on straight-line method at the rate specified in Schedule XIVCompanies Act, 1956. Depreciation on additions / deletions is provided on pro-rata basis to the months of additions / del
Moulds with predetermined useful life, are depreciated on the actual usage of the mould impression used for production the reporting period. Deprecation on mould provided in the books is not less than deprecation if provided at the rates spin the schedule XIV of the Companies Act, 1956.
5 INVESTMENTSInvestments are classified as long-term investments and are stated at cost. Diminution in value, if any, which is of a temnature, is not provided.
6 VALUATION OF INVENTORIESRaw materials, Stores & spares, and Packing Materials are valued at weighted average cost. Work in progress and figoods are valued at lower of cost or net realizable value. Cost of working in progress and finished goods is determined bymaterials, labour cost and other appropriate allocable overheads. Excise Duty on goods manufactured by the company aremaining in inventory is included as part of valuation of finished goods.
7 REVENUE RECOGNITIONSales are recognized, on invoicing and actual dispatch to customers and are recorded inclusive of Excise Duty and SalTechnical Services and Other Fees, Interest incomes are accounted on accrual basis. Dividends and Insurance Claimaccounted on receipt basis.
8 EXCISE DUTYThe Excise Duty in respect of Closing Inventory of Finished Goods is included as part of the Inventory. The amount of CECredit, in respect of Material consumed for Sales is deducted from Cost of Material Consumed.
9 FOREIGN CURRENCY TRANSACTIONThe transactions in foreign currency are accounted at exchange rate prevailing on the date of transaction. Monetary
denominated in foreign currency outstanding at the year-end are translated at the year-end exchange rate and the unreexchange gain or loss is recognized in the profit and loss account.
10 RETIREMENT BENEFITSThe Company’s contributions in respect of Provident Fund are charged against revenue every year. Present Liability forpayment of Gratuity and unavailed leave benefits to the employees at the end of the year is provided on the basis of acvaluation and is charged to revenue.
STANDALONE FINANCIAL STATEMENTS
46 Piramal Glass Limited

8/2/2019 PGL Annual Report 2010-11
http://slidepdf.com/reader/full/pgl-annual-report-2010-11 49/76
11 BORROWING COSTSBorrowing costs are recognized as an expense in the period in which they are incurred, except to the extent where borrowinthat are directly attributable to the acquisition, construction, or production of an asset till put for its intended use is capias part of the cost of that asset.
12 A. CURRENT TAXProvisions for Current Income tax liability is made on estimated Taxable Income under Income Tax Act, 1961 after conspermissible tax exemptions, deductions and disallowances. This liability is calculated at the applicable tax rate or Min
Alternate Tax rate under section 115JB of The Income Tax Act, 1961 as the case may be.
B. DEFERRED TAXDeferred Tax liability ascertained as on 31st March ‘02 resulting from timing differences between book profits and tax is accounted for under the liability method, at the tax rate specified under section 115JB of the Income Tax Act, 1961extent that the timing differences are expected to crystallize. Deferred tax liability on timing difference arising substo 31st March, 2002 is accounted at regular rate as enacted in the Income Tax Act, 1961.
13 PROVISION AND CONTINGENT LIABILITIESThe Company recognizes a provision when there is a present obligation as a result of a past event that probably requioutflow of resources and a reliable estimate can be made of the amount of the obligation. A disclosure for a contingent liabmade when there is a possible obligation or a present obligation that may, but probably will not, requires an outflow of resoWhere there is a possible obligation or a present obligation that the likelihood of outflow of resources is remote, no proor disclosure is made.
14. PROPOSED DIVIDENDDividend proposed by the Board of Directors is provided in the books of account, pending approval of the Annual General M
PART – B NOTES FORMING PART OF ACCOUNTS:
1. Contingent Liability in respect of :
As at March 31, 2011
(` in Million)March 31,
(` in Mi
a) Estimated amount of contracts remaining to be executed on Capital account 644.86 188.
b) Disputed Liability
–
Central Excise authorities 4.91 7. – Sales Tax Authorities 0.43 2.
– Income Tax 38.00
c) Counter Guarantees issued to Banks & others* 1,301.54 1,157.
* The counter guarantees issued to banks includes a Counter Guarantee givenfor Working Capital Loan of US $ 25 millions granted to the wholly ownedsubsidiary in USA viz. Piramal Glass USA, Inc
d) The Company has provided Corporate Guarantees and/or has given pari passu chargeon the entire fixed assets (movable & immoveable) both present & future (exceptassets having exclusive charge) of the Company situated at Jambusar & Kosamba, forTerm Loans aggregating to US $ 60 million granted to the wholly owned subsidiaryin USA viz. Piramal Glass USA, Inc.
1,118.91 1,787.
2. Pursuant to the Company’s Right Issue Offer during F.Y 2009-10, for 62949500 Equity Shares of ` 10/- each for ` 30(Including a Share Premium of ` 20/- each), allotment of 488764 equity shares have been kept in abeyance, of which 4equity shares pertain to Overseas Corporate Bodies which are subject to requisite approval of Reserve Bank of India anequity shares are those for which documentation for establishing title thereto are pending.
STANDALONE FINANCIAL STATEM
Piramal Glass Limit

8/2/2019 PGL Annual Report 2010-11
http://slidepdf.com/reader/full/pgl-annual-report-2010-11 50/76
3. The aggregate amount of Investments, Loans and other outstanding balances with Subsidiaries of the Company is as foll
As at March 31, 2011
(` in Million)
AMarch 31,
(` in Mil
Investment in Equity Shares
– Piramal Glass Ceylon PLC 348.09 34 – Piramal Glass International Inc. 1.21
– Piramal Glass USA Inc. 227.61 22
– Piramal Glass (UK) Ltd. 11.59 1
– Piramal Glass Europe SARL. 3.13
Amount recoverable (Subsidiaries)
– Piramal Glass Ceylon PLC
– Debtors 11.77
– Technical Fees & Others 135.09 14
– Piramal Glass International Inc.
– Debtors 179.47 9
– Piramal Glass USA Inc.
– Debtors 224.52 23
– Other for Expenses 30.26 2
– Loan & Interest(maximum amount outstanding ` 470.31 millions, PY ` 953.07 millions)
479.78 22
– Piramal Glass (UK) Ltd.
– Debtors 36.71 3
– Loan(maximum amount outstanding ` 51.67 millions, PY ` 51.67 millions)
51.02 4
– Piramal Glass Europe SARL
– Debtors 149.03
– Other for Expenses 6.06
4. In view of the proposed International Financial Reporting Standard, the Company has changed its policy for accounMoulds. Consequent to the change, moulds used for production of finished goods are reclassified and recognized as fixeand depreciation has been provided on the basis of actual usage of each mould. Hitherto, and including up to quarter September 30, 2010, such moulds were considered as inventory and charged off on the basis of actual usage of each mouvalue of Inventory of mould amounting to ` 4,091.60 Lacs as on 1st April 2010 has been added to the Gross block of Fixedand considered as the opening gross block of moulds. For better presentation mould inventory, even for F.Y 2009-10 havreclassified as Fixed Assets.
Consequent to the above changes, mould consumption amount of `
863.55 Lacs (`
844.12 Lacs for corresponding previouhas been regrouped from other Expenditures to Depreciation / Amortization. The Change in accounting policy of mouldnot have any impact on the profit of the Company for the current year or any earlier previous year.
5. Debtors, Loans and advances includes ` 1,316.78 millions (previous year ` 859.54 millions) are due from companies,Directors of the company are interested as Director.
STANDALONE FINANCIAL STATEMENTS
48 Piramal Glass Limited

8/2/2019 PGL Annual Report 2010-11
http://slidepdf.com/reader/full/pgl-annual-report-2010-11 51/76
6. Managerial Remuneration:Staff cost includes Managerial Remuneration paid/payable to Managing Director, details whereof is as under:
Year EndedMarch 31, 2011
(` in Million)
Year EndMarch 31, 20
(` in Milli
Managerial Remuneration
A. To Managing Directora. Salary 20.97 16
b. Contribution to PF & Pension Fund 1.65 1
c. Commission —
d. Monetary Value of Perquisites under the Income Tax Act 0.03 0
Total remuneration Paid / Payable 22.65 17
B. Computation of Net Profit u/s 198/349 of the Companies Act, 1956
Profit Before Tax and Exceptional Items 920.69 210
Less: Bad-debt written off 6.88
Profit on Sale of assets — 12
913.81 197Less: Brought forward Loss from previous year (453.14) (687.
460.67 (489.
Add: Loss on Sale of Assets 1.81 18
Provision for Doubtful Debts 7.50
Remuneration 22.65 17
Net Profit u/s 198 / 349 of the Companies Act, 1956 492.64 (453.
Maximum permissible managerial remuneration as per Section 349 of the Companies Act
24.63 4
The Central Government vide its letter dated 28/10/2010 & 11/03/2010 has approved payment of remuneration to Ma
Director for the FY 2010-11.
7. Miscellaneous Expense include Auditors Remuneration in respect of: (` in M
Particulars 2010-2011 2009-201
a. Tax Audit 0.25 0.2
b. Certification* 0.02 0.0
c. Out of Pocket Expenses 0.31 0.1
0.58 0.3
8. a. In view of all the set off of accumulated losses/unabsorbed depreciation of ` 1,076.46 millions available to the Comthere is no tax liability on the Company except under section 115JB of the Income Tax Act, 1961 which has been profor.
b. Income tax assessment has been completed upto financial year 06-07 relevant to AY 07-08. Appeal is pending before ApAuthorities for several additions and/or disallowances made in various earlier years. The management does not expeadditional liability, and adjustment entries, if any, will be passed on finalization of assessments
9. The Company’s operations relate only to container glass packaging in the domestic as well as export market and accorprimary segment reporting disclosures for business segments, as envisaged in Accounting Standard 17 on ‘Segment Rep(AS 17) issued by The Institute of Chartered Accountants of India, is not applicable.
The Company’s operations relating to secondary segment reporting has been confined to sales in India and exports outside
Fixed assets used in the company’s business and liabilities contracted in respect of its manufacturing facilities are not identin line with the following reportable segments as the fixed assets and liabilities contracted are used interchangeably bethe segments. Accordingly, only figures for debtors have been given.
STANDALONE FINANCIAL STATEM
Piramal Glass Limit

8/2/2019 PGL Annual Report 2010-11
http://slidepdf.com/reader/full/pgl-annual-report-2010-11 52/76
Secondary segment reporting: (` in M
Particulars Year Ended 31.03.11 Year Ended 31.03.10
Domestic Export Total Domestic Export
Revenue by Geographical Segment
Gross Sales (Net of returns) 2,688.91 5,081.34 7,770.25 2,787.82 4,017.70 6,8
Current Assets, Loans & AdvancesSundry Debtors (Net of Provisions) 662.72 1,918.71 2,581.43 746.74 1,576.64 2,3
10. As required by Accounting Standard – AS 18 “Related Parties Disclosure” issued by The Institute of Chartered AccountIndia are as follows:
A. List of Related Parties with whom transactions have taken place during the year:a. Subsidiary Company
– Piramal Glass Ceylon Plc., Sri Lanka (erstwhile Ceylon Glass Plc.) – Piramal Glass International Inc., USA (erstwhile GG USA Inc.) – Piramal Glass UK Ltd., UK (erstwhile Piramal Glass (UK) Ltd.) – Piramal Glass USA Inc., USA (erstwhile Gujarat Glass International Inc.) – Piramal Glass Flat River LLC., USA (erstwhile GGI Flat River LLC., USA) – Piramal Glass Williamstown LLC., USA (erstwhile GGI Williamstown LLC., USA) – Piramal Glass Europe SARL, Europe
b. Associated Companies – Piramal Healthcare Ltd. (erstwhile Nicholas Piramal India Ltd.) – Piramal Enterprises Ltd. – PHL Pharma Inc. (erstwhile NPIL Pharma Inc.) – Piramal Realty Pvt Ltd. (erstwhile Alpex International Ltd.)
c. Key Management Personnel – Mr. Ajay Piramal Chairman – Dr. Swati Piramal Director – Mr. Vijay Shah Managing Director
– Mr. Sandeep Arora Chief Financial Officer
B. Summary of the transactions with related parties is as follows: (` in M
Particulars Subsidiaries Associates Key Management Personnel
Total
Yearended
31-03-11
Yearended
31-03-10
Yearended
31-03-11
Yearended
31-03-10
Yearended
31-03-11
Yearended
31-03-10
Yearended
31-03-11 31
Purchase of goods / service/assets — — 9.63 15.33 — — 9.63
Sale of goods 1,106.42 628.38 106.95 220.24 — — 1,213.27
Reimbursement of exp. Recd. 30.10 44.13 0.29 1.52 — — 30.39
Reimbursement of exp. Paid 1.40 2.00 8.53 8.48 — — 9.93
Technical Fees & Other Exp. Recd 83.86 71.81 — — — — 83.86
Dividend received — — — — — — —
Marketing Fees Paid 23.82 21.10 — — — — 23.82
Loan 503.18 408.82 — — — — 503.18
Remuneration — — — — 28.94 22.64 28.94Corporate Service Charges — — 5.00 41.69 — — 5.00
System Service charges — — — — — — —
Outstanding payable 10.89 15.72 — 0.08 — — 10.97
Outstanding receivable 1,303.94 814.24 15.42 45.29 — 1319.36
Note : The above information has been determined to the extent such parties have been identified on the basis of information provthe Company and approved by the Board of Directors of the Company, which has been relied upon by the Auditors.
11. The company’s leasing arrangement (Operating) is only in respect of vehicles & office equipments. The aggregate lease payable on these leasing arrangements are charged as lease rentals under “other expenses” in schedule – 16.
STANDALONE FINANCIAL STATEMENTS
50 Piramal Glass Limited

8/2/2019 PGL Annual Report 2010-11
http://slidepdf.com/reader/full/pgl-annual-report-2010-11 53/76
These leasing arrangements are for a period not exceeding five years and are in most cases renewable by mutual consmutually agreeable terms.The future lease rent payable in respect of vehicle on lease is:(i) not later than 1 year – ` 2.52 millions (Previous year ` 1.79 millions), and(ii) later than 1 year but less than 5 years - ` 4.46 millions (Previous year ` 1.01 millions).
The future lease rent payable in respect of office building on lease is:(i) not later than 1 year – ` 2.89 millions (Previous year 2.68), and
(ii) later than 1 year but less than 5 years - `16.59 millions (Previous year 12.39).(iii) later than 5 years – `1.71 millions (Previous year 8.80).
The future lease rent payable in respect of office Equipment on lease is:(i) not later than 1 year – ` 1.31 millions (Previous year NIL), and(ii) later than 1 year but less than 5 years - ` 3.26 millions (Previous year NIL).(iii) later than 5 years – Rs NIL millions (Previous year NIL).
12. As required by Accounting Standard 20 issued by the Institute of Chartered Accountants of India, the Earning Per Shareis calculated by dividing the profit attributable to the equity share holders by the average number of equity shares outstduring the year and is ascertained as follows:
Profit available to equity shareholders
ParticularsYear ended
March 31, 2011Year
March 31, 2
Profit\Loss available to equity shareholders ` in Millions 685.85
Weighted average no. of equity share for Basic EPS Nos. 80434736 527
Nominal value of equity shares ` 10
Earning Per Share (Basic/Diluted) ` 8.53
(*) The EPS for the year ended 31st March 2010 have been calculated on the basis of weighted Average No of shares derived as per AccStandard 20 to reflect the effect of Rights Issue.The diluted EPS has been calculated without considering the shares in abeyance. (Refer note 2 above)
13. During the Financial Year 2001-02 provision for deferred tax as required by Accounting Standard – 22 issued by the Inof Chartered Accountants of India (ICAI) was determined and provided in accounts by considering the “enacted rate” ofthe MAT rate u/s 115JB of the Income-tax Act, 1961, which was the applicable rate to the company for that year. Subsequin December 2002, ICAI issued an Accounting Standard Interpretation clarifying that the tax effect to be recognizedAccounting Standard – 22 should be measured using regular tax rate and not MAT rate. Subsequently the liability ha
provided at regular tax rate as enacted in the Income Tax Act, 1961.(` in M
As of March 31, 2010
For the year2010-2011 March 31,
Deferred Tax LiabilityExcess of net block over WDV as per the provisions of the IncomeTax Act 1961
567.70 (40.85) 5
Total 567.70 (40.85) 5
Deferred Tax Assets
Unabsorbed Depreciation 304.17 (304.17)
Provision for gratuity & leave encashment 7.45 4.71
Provision for Doubtful Debts 19.88 1.58Disallowance u/s 43B 2.84 0.21
Provision for non-moving inventory 25.15 37.58
MAT Credit u/s 115JB 86.42 205.42 2
Exchange Loss on fixed assets 13.89 (14.48)
Deduction U/S 35 DD 2.11 (1.07)
Total 461.91 (70.22) 3
Net Deferred Tax Liability 105.79 29.37 1
STANDALONE FINANCIAL STATEM
Piramal Glass Limit

8/2/2019 PGL Annual Report 2010-11
http://slidepdf.com/reader/full/pgl-annual-report-2010-11 54/76
14. The Actuarial Valuation of Liability arising on account of retirement benefits has been carried out by experts in accordancparameters suggested under Revised Accounting Standard 15. The necessary disclosures as regards liability arising on AValuation, Fair value of assets and Assumptions made by the experts while determining the liability are given here under
` in M
As at 31st March 2011
As atMarch
(i) Present value of the funded defined benefit obligation at the end of the period (78.73) 6
Fair value of plan assets 79.04 7
Net Liability / (Assets) (0.31) (
(ii) The amounts recognized in salary, wages and employee benefits in the Profit andLoss account as follows in respect of gratuity:
Current service cost 6.36
Interest Cost 5.42
Expected return on plan assets (5.74) (
Net Actuarial (gain) / loss recognised during the period 3.01 (
Net Cost — (
Net charge to Profit and Loss account 9.05 (
(iii) Actual return on plan assets
Expected return on plan assets 5.74
Actuarial gain / (loss) on plan assets (0.44)
Actual return on plan assets 5.30
(iv) Reconciliation of present value of the obligation and the fair value of the plan assets:
Opening defined benefit obligation as on 1st April, 2010 67.86 6
Current service cost 6.36
Benefit paid in the normal course (3.48)
Interest cost 5.43
Actuarial (gain) / loss 2.56 (
Closing defined benefit obligation as on 31st March, 2011 78.73 6
(v) Change in fair value of the plan assetsOpening fair value of the plan assets 71.75 6
Benefit paid in the normal course (3.48)
Expected return on plan assets 5.74
Actuarial (gain) / loss (0.44)
Contributions by the employer 5.48
Closing fair value of the plan assets 79.05 7
(vi) Experience Adjustments
Defined benefit obligation 78.73 6
Plan assets 78.73 6
Surplus / (Deficit) 0.00
Experience adjustment on plan liabilities (3.76) (Experience adjustment on plan assets (0.45)
(vii) Investment details of plan assets
Government of India Securities 0%
Corporate Bonds 0%
Insurer Managed Fund 100% 1
Total 100% 1
STANDALONE FINANCIAL STATEMENTS
52 Piramal Glass Limited

8/2/2019 PGL Annual Report 2010-11
http://slidepdf.com/reader/full/pgl-annual-report-2010-11 55/76
(viii) There are no amounts included in the fair value of plan assets for:
i) Company’s own financial instrument
ii) Property occupied by or other assets used by the Company
The overall expected rate of return on assets is determined based on the market
prices prevailing on that date, applicable to the period over which the obligationis to be settled.
(ix) Principal actuarial assumptions at the Balance Sheet date (31st March, 2011)
Discount rate 8.00% 8
Estimated rate of return on plan assets 8.00% 8
The estimates of future salary increases are considered taking into account inflation,seniority, promotion and other relevant factors.
5.00% 5
Attrition Rate 2.00% 2
Mortality Table LIC (1994-96) Ulti
15. A) Total amount due to Small Scale Industrial Undertakings is ` 15.28 millions. The names of the Small Scale IndUndertakings to whom the company owes a sum exceeding Rs 1 Lakh and which is outstanding for more than 30* da
(`
in MName of Creditor / supplier As at 31st
March 2011 As at
March
Sheetal Engg Works 1.13
Solar Enterprise 0.96
Dattashish Enterprise 0.27
G S Minerals 0.48
J.B. Mineral Grinding 0.52
Ashish Engineering 1.07
Foremost Minerals 0.41
S B M Enterprises 1.19
Anmol Cast Industries 5.58Intercer Engineering 0.00
Universal Engineering Works 0.31
Ganesh Engineering Co. 0.46
Tashkent Oil Co. Pvt. Ltd. 0.00
Wearresist Technologies Pvt Ltd. 0.00
Kaeser Compressors India Pvt. Ltd. 0.00
Hindustan Minerals Product 0.80
Intellicon Pvt. Ltd. 0.29
Hitech Engineers 1.81
TOTAL 15.28 1
* As per the terms of contract, the credit period is generally up to 60 days.Note: The above information regarding small scale industrial undertakings have been determined to the extent such has been identified on the basis of information available with the company. This has been relied upon by the Audit
B) Under the Micro, Small and Medium Enterprise Development Act, 2006, which came into effect on October 2, 2006, disclosures are required to be made relating to Micro, Medium and Small Enterprises. The Company is in the procompiling relevant information from its suppliers about their coverage under the Act. Since the relevant informationreadily available, no disclosures have been made in account.
Rs. in M
As at 31st March 2011
As atMarch
STANDALONE FINANCIAL STATEM
Piramal Glass Limit

8/2/2019 PGL Annual Report 2010-11
http://slidepdf.com/reader/full/pgl-annual-report-2010-11 56/76
16. There are no amounts due and outstanding to be credited to Investor Education and Protection Fund.
17. Consumption of Raw Materials:
Name of the Raw Material Year ended March 31, 2011 Year ended March 31, 201
Quantity(in tons)
Amt.(` in Million)
Quantity(in tons)
A(` in Mil
Quartz & Sand 119,079.35 224.64 118,551.36 18
Soda Ash 32529.60 431.16 32485.06 42
Cullet (Broken Glass) 30622.78 122.45 23889.83 10
Others 47485.93 357.78 51160.34 31
Total 1,136.03 1,02
18. Details of Turnover, stocks etc., for the year ended 31st March 2011 (figures in brackets pertains to previous year) excexcise duty & sales tax.
` in M
ProductsOpening Stock Turnover Closing Stock
Quantity Value in ` Quantity Value in ` Quantity Value
Glass Containers 4,676.84 710.07 36,502.20 7,467.60 4,846.91 82
(5,433.54) (755.58) 35,088.19 6,479.19 4,676.84 71
Notes:
i. Stocks are net of breakages.
ii. Installed Capacity of Manufacturing of Glass Containers of the Company is 247675 MT (PY 246375 MT) and theproduction of Glass Containers is 3667.22 Million Pcs (PY 344.19 Million Pcs).
iii. Installed capacity is as certified by the Director of the Company and accepted by the Auditors as this is a technical
iv. Under the Liberalized Industrial Policy of the Government, vide notification No. S-O-477 (E) dated 25th July 19Company’s products are exempted from licensing provisions under the Industries (Development Regulation) Act, 19
STANDALONE FINANCIAL STATEMENTS
54 Piramal Glass Limited

8/2/2019 PGL Annual Report 2010-11
http://slidepdf.com/reader/full/pgl-annual-report-2010-11 57/76
19.(` in M
Year endedMarch 31, 2011
Year enMarch 31,
a. Value of imports on CIF Basis
1. Raw Materials 297.48 46
2. Capital Goods & Spares 407.05 11
b. Expenditure in Foreign Currency (On mercantile basis)
– Subscription / Books & Periodicals 0.01
– Foreign Travelling 7.56
– Technical Fees & Consultancy Fees 24.91 3
– Exports Promotional Expenses 44.85 3
– Marketing Survey Fees for USA 23.82 2
– Decoration, Resorting, Repacking & Warehousing Expenses 23.01 2
– Legal & Professional Exp. 1.24
– Bank Charges 4.52
– Export Claims 10.89
– Other Office Expenses 2.19
c. Earnings in Foreign Exchange
– Export of goods calculated on FOB basis 4102.04 3,25
– Technical Fees 83.86 7
– Dividend received from Ceylon Glass Co. Ltd —
d. Break up of Imported & Indigenous Raw Materials Consumed:
Year ended
March 31, 2011
% Year ended
March 31, 2010
1. Raw Materials Imported 216.44 19.05 402.31 3
2. Indigenous 919.58 80.95 625.33 6
Total 1136.02 100.00 1027.64 10
20. Figures of Previous year have been regrouped wherever necessary for comparative purposes.
STANDALONE FINANCIAL STATEM
Piramal Glass Limit

8/2/2019 PGL Annual Report 2010-11
http://slidepdf.com/reader/full/pgl-annual-report-2010-11 58/76
Balance Sheet Abstract And Company’s General Business Profile
I. Registration Details
Registration No. Balance Sheet Date State Code
Date Month Year
II. Capital raised during the year (Amount in Rs. Thousands)
Public Issue Rights Issue
Bonus Issue Private Placement
III. Position of Mobilisation and Deployment of Funds (Amount in Rs. Thousands)
Total Liabilities Total Assets
Sources of Funds
Paid up Capital & Share Suspense Reserves & Surplus
7 565Secured Loans Unsecured Loans
76 5Application of Funds
Net Fixed Assets Investments
6565 56
Net Current Assets Miscellaneous Expenditure
65 Accumulated Losses
IV. Performance of Company (Amount in Rs. Thousands)
Turnover Total Expenditure
777 67+ – Profit / Loss Before Tax + – Profit / Loss After Tax
6 657
Earnings per Share in Rs. Dividend Rate %
.5 5.V. Generic Names of Three Principal Products / Services of the Company (as per monetary terms)
Item Code No. 7
Product Description
Schedules referred to above and notes attached thereto form an integral part of Balance Sheet.
Signature to Schedule 1 to 19
Hitesh J. Desai Ajay G. Piramal ChairmanPartnerM. No. 37569 Vijay Shah Managing Director For Haribhakti & Co., Sandeep Arora Chief Financial OfficerChartered AccountantsFirm Reg. No. 118013W Nehal Doshi Company Secretary
Mumbai, April 28, 2011
STANDALONE FINANCIAL STATEMENTS
56 Piramal Glass Limited

8/2/2019 PGL Annual Report 2010-11
http://slidepdf.com/reader/full/pgl-annual-report-2010-11 59/76
S t a t e m e n t p u r s u a n t t o g e n e r a l e x e m p t i o n g r a n t e d b y t h e M i n i s t r y o f C o r p o r a t e A f f a i r s u / s 2 1 2 ( 8 ) o f t h e
C o m p a n i e s A c t , 1 9
5 6
N a m e o f t h e S u b s i d i a r y
C o m p a n y
P i r a m a l G l a s s
C e y l o n P l c
P i r a m
a l G l a s s
I n t e r
n a t i o n a l
I n c
P i r a m a l G l a s s
U S A I n c .
P i r a m a l
G l a s s
F l a t R i v e r
L L C
P i r a m a l G l a s s
W i l l i a m s t o w n
L L C
P i r a m a l G l a s s
( U K ) L t d .
P i r a m a l G l a s s
E u r o p e S A R L
F i n a n c i a l Y e a r / P e r i o d e n d e d o n
3 1 . 0 3 . 2 0 1 1
( ̀ i n M i l l i o n )
3 1
. 0 3 . 2 0 1 1
( ̀ i n
M i l l i o n )
3 1 . 0 3 . 2 0 1 1
( ̀ i n M i l l i o n )
3 1 . 0 3 . 2 0 1 1
( ̀ i n M i l l i o n )
3 1 . 0 3 . 2 0 1 1
( ̀ i n M i l l i o n )
3 1 . 0 3 . 2 0 1 1
( ̀ i n M i l l i o
n )
3 1 . 0 3 . 2 0 1 1
( ̀ i n M i l l i o n )
1
C a p i t a l
3 9 7 . 8 6
1 . 0 8
2 2 6 . 0 0
1 5 6 . 3 8
1 0 3 . 0 3
1 1 . 6 0
3 . 1 3
2
R e s e r v e s
7 4 7 . 5 3
5 . 9 9
( 1 , 5 3 8 . 4 3 )
1 8 . 2 6
1 0 . 3 4
( 5 5 . 9
1 )
1 . 0 3
3
T o t a l A s s e t s
2 , 7 2 5 . 5 9
1 8 6 . 8 2
1 , 9 7 8 . 5 5
1 7 4 . 6 4
1 1 3 . 3 7
3 8 . 2 9
1 7 4 . 7 3
4
T o t a l L i a b i l i t i e s
1 , 5 8 0 . 2 0
1 7 9 . 7 4
3 , 2 9 0 . 9 8
—
—
8 2 . 5 9
1 7 0 . 5 7
5
D e t a i l s o f I n v e s t m e n t
D F C C B a n k D e p o s i t
0 . 1 1
—
—
—
—
—
—
6
T u r n o v e r ( N e t )
1 , 7 1 4 . 0 0
2 3 . 8 5
3 , 7 0 0 . 8 4
—
—
4 4 . 9 0
4 4 . 9 0
7
P r o f i t b e f o r e t a x a t i o
n
2 4 2 . 6 0
1 . 0 8
1 1 1 . 5 5
3 . 3 9
1 . 7 5
3 . 2 9
1 . 5 9
8
P r o v i s i o n f o r t a x a t i o
n
5 . 4 0
0 . 2 1
2 . 7 0
—
—
—
0 . 6 6
9
P r o f i t a f t e r t a x a t i o n
2 3 7 . 2 0
0 . 8 7
1 0 8 . 8 5
3 . 3 9
1 . 7 5
3 . 2 9
0 . 9 4
1 0
P r o p o s e d D i v i d e n d
—
—
—
—
—
—
—
1 1
E x c h a n g e R a t e u s e d
0 . 4 1
4 5 . 5 5
4 4 . 6 0
4 4 . 6 0
4 4 . 6 0
7 0 . 6 5
6 0 . 2 3
1 2
L o c a l C u r r e n c y
S L R
U S $
U S $
U S $
U S $
G B P
E u r o
STANDALONE FINANCIAL STATEM
Piramal Glass Limit

8/2/2019 PGL Annual Report 2010-11
http://slidepdf.com/reader/full/pgl-annual-report-2010-11 60/76
CONSOLIDATED FINANCIAL STATEMENTS
Auditors’ Report
To,
The Board of Directors,
Piramal Glass Ltd.
Mumbai.
1.0 We have audited (refer para 3.0) the attached ‘Consolidated Balance Sheet’ of the Piramal Glass Limited (the Company), foknown as Gujarat Glass Limited and its Subsidiaries (the Group) as at 31st March 2011, the accompanying ‘Consolidated& Loss Account’ for the period ended on that date annexed thereto, and also the ‘Consolidated Cash Flow Statement’ period ended on that date, which we have signed under reference to this report. These consolidated financial statements responsibility of Piramal Glass Limited’s management and have been prepared by the management on the basis of the sefinancial statements and other financial information regarding components. Our responsibility is to express an opinion ofinancial statements based on our audit.
2.0 We conducted our audit in accordance with generally accepted auditing standards in India. Those standards require tplan and perform the audit to obtain reasonable assurance about whether the financial statements are prepared, in all mrespects, in accordance with an identified financial reporting framework and are free of material misstatements. Anincludes examining, on test basis, evidence supporting the amounts and disclosures in the financial statements. An audincludes assessing the accounting principles used and significant estimates made by management, as well as evaluatioverall financial statement presentation. We believe that our audit provides a reasonable basis for our opinion.
3.0 We did not audit the financial statements of the Subsidiaries; viz., Piramal Glass Ceylon Plc, Sri Lanka, (formerly knoCeylon Glass Company Limited), Piramal Glass International Inc., USA (formerly known as GG USA INC.), Piramal GlasInc. (formerly known as Gujarat Glass International INC.) Piramal Glass Flat River LLC, (formerly known as GGI Flat Riveand Piramal Glass Williamstown LLC. (formerly known as GGI Williamstown LLC.) and Piramal Glass Europe SARL; financial statements reflect the Group share of total assets of Rs. 5,241.96 millions as at March 31, 2011 and Group share revenues of Rs. 5,631.33 millions for the period ended on that date as considered in the consolidated financial statemen
These financial statements and other information of the subsidiaries have been audited up to 31st March 2011, by other auwhose reports have been furnished to us and our opinion, insofar as it relates to the amounts included in respect of the Subsidis based solely on the report of the other auditors.
4.0 We report that the Consolidated financial statements have been prepared by the Company in accordance with the require
of Accounting Standard (AS) 21 ‘Consolidated Financial Statements’ issued by the Institute of Chartered Accountants of
5.0 Based on our audit and on consideration of the reports of other auditors on separate financial statements and on the other fin
information of the components, in our opinion and to the best of the information and explanations given to us, the at
consolidated financial statements together with the notes thereon, annexed thereto give a true and fair view in conformi
the accounting principles generally accepted in India:
(a) in the case of the ‘Consolidated Balance Sheet’, of the consolidated state of affairs of Piramal Glass Ltd. and its Subsi
as at March 31, 2011;
(b) in the case of the ‘Consolidated Profit & Loss A/c’, of the consolidated results of operations of Piramal Glass Ltd.
Subsidiaries for the year ended on that date; and
(c) in the case of the ‘Consolidated Cash flow Statement’, of the consolidated cash flows of Piramal Glass Ltd. and its Subsi
for the year ended on that date.
HITESH J. DESAI
Partner
M.No. 37569
Date: 28th April 2011 HARIBHAKTI & CO.,
Place: MUMBAI Chartered Accountants
Firm Reg. No. 118013W
58 Piramal Glass Limited

8/2/2019 PGL Annual Report 2010-11
http://slidepdf.com/reader/full/pgl-annual-report-2010-11 61/76
CONSOLIDATED FINANCIAL STATEM
BALANCE SHEET AS AT MARCH 31, 2011Schedule
No. As at
March 31, 2011` in Millions
March 31` in Mi
I. SOURCES OF FUNDS
1. Shareholders’ Funds
a. Share Capital 804.35 804.35b. Reserves and Surplus 2 2,215.57 3,019.92 1,594.52 2,3
2. Minority Interest
a. Capital 173.27 173.27
b. Reserves 325.55 498.82 202.93 3
3. Loan Funds
a. Secured Loans 3 6,947.21 8,266.23
b. Unsecured Loans 4 2,252.64 9,199.85 1,558.10 9,8
4. Deferred Tax Liability (Net)
Deferred Tax Liability 534.63 575.11
Less : Deferred Tax Assets (391.69) 142.94 (461.91) 1
(Refer note no. 10 of part-B, of schedule 19)
T O TA L 12,861.53 12,7
II. APPLICATION OF FUNDS
1. Fixed Assets
a. Gross Block 5 15,173.59 14,300.03
b. Less: Depreciation (6,579.51) (5,495.97)
c. Net Block 8,594.08 8,804.06
d. Capital Work in Progress 401.60 8,995.68 140.78 8,9
2. Investments 6 1.12
3. Current Assets, Loans and Advances
a. Inventories 7 2,504.41 2,158.95
b. Sundry Debtors 8 2,779.33 2,635.24
c. Cash and Bank Balances 9 132.60 70.96
d. Loans and Advances 10 932.59 624.67
6,348.93 5,489.82
Less: Current Liabilities and Provisions
a. Current Liabilities 11 1,326.37 1,070.43
b. Provisions 12 1,157.83 652.75
2,484.20 1,723.18
Net Current Assets 3,864.73 3,7
T O TA L 12,861.53 12,7
NOTES TO ACCOUNTS 19
Schedules referred to above and notes attached thereto form an integral part of Balance Sheet
This is the Balance sheet referred to in our report of even date.
Hitesh J. Desai Ajay G. Piramal ChairmanPartnerM. No. 37569 Vijay Shah Managing Director For Haribhakti & Co., Sandeep Arora Chief Financial OfficerChartered AccountantsFirm Reg. No. 118013W Nehal Doshi Company Secretary
Mumbai, April 28, 2011
Piramal Glass Limit

8/2/2019 PGL Annual Report 2010-11
http://slidepdf.com/reader/full/pgl-annual-report-2010-11 62/76
CONSOLIDATED FINANCIAL STATEMENTS
Profit & Loss Account for the Year Ended March 31, 2011Schedule
No.Year ended
March 31, 2011 ` in Millions
Year eMarch 31,
` in Mil
INCOME
Turnover (Gross) 12,525.94 11,3
Excise Duty 265.27 2
Sales Tax 76.03Turnover (Net) 12,184.64 11,0
Other Income 13 215.38 2
12,400.02 11,2
EXPENDITURE
Materials 14 2,646.50 2,2
Staff Cost 15 2,368.60 2,1
Other Expenses 16 4,507.55 4,3
(Increase)/Decrease in WIP/Finished Goods 17 (189.36) 3
9,333.29 9,0
PROFIT BEFORE INTEREST, DEPRECIATION AND TAX 3,066.73 2,2
Interest 18 720.37 1,0
Depreciation 1,069.03 10PROFIT BEFORE TAX 1,277.33
Provision for Taxation – Current 214.50
– Mat Credit Entitlement (205.43) (3
– Deferred 234.74
PROFIT FOR THE YEAR 1,033.52
Prior Period Expenses / (Income) —
PROFIT FOR THE YEAR AFTER PRIOR PERIOD ITEMS 1,033.52
MINORITY INTEREST (103.29) (1
PROFIT AFTER MINORITY INTEREST 930.23
Balance brought forward from earlier year (1,506.15) (1,45
Prior Period Adjustments (net of Minority’s Share) —
Less: Final Dividend Paid (Minority Share) —
NET PROFIT AVAILABLE FOR APPROPRIATION (575.92) (1,41
Transfer to General Reserve 68.59
Proposed Dividend 281.52
Tax on Proposed Dividend 45.67
Balance carried to Balance Sheet (971.70) (1,50
(575.92) (1,41
Earning Per Share (Basic / Diluted) ` 11.56
Earning Per Share Before Extraordinary Items (Net of Taxes) ` 11.56
NOTES TO ACCOUNTS 19
Schedules referred to above and notes attached thereto form an integral part of Profit & Loss Account.This is the Profit & Loss Account referred to in our report of even date.
Hitesh J. Desai Ajay G. Piramal ChairmanPartnerM. No. 37569 Vijay Shah Managing Director For Haribhakti & Co., Sandeep Arora Chief Financial OfficerChartered AccountantsFirm Reg. No. 118013W Nehal Doshi Company Secretary
Mumbai, April 28, 2011
60 Piramal Glass Limited

8/2/2019 PGL Annual Report 2010-11
http://slidepdf.com/reader/full/pgl-annual-report-2010-11 63/76
CONSOLIDATED FINANCIAL STATEM
Consolidated Cash Flow Statement for the Year Ended March 31, 2011
Year ended
March 31, 2011
` in Millions
Year e
March 31,
` in Mil
A. CASH FLOW FROM OPERATING ACTIVITIES
Net Profit Before Tax 1,277.33
Adjustments for :
Add/ (Less) :
(Profit)/ Loss on Sale of Fixed Assets (0.59)
Depreciation 1,069.03 9
Dividend from Investment in unquoted Shares (0.04)
Interest Paid 720.37 1,0
Operating Profit Before Working Capital Changes 3,066.10 2,0
Adjustments for Changes in Working Capital:
(Increase)/ Decrease in Inventories 37.65 3
(Increase)/ Decrease in Sundry Debtors (143.93)
(Increase)/ Decrease in Loans & Advances (171.22) 2
Increase/ (Decrease) in Trade Payables & Other Liabilities 255.79
Increase/ (Decrease) in Other Provisions 287.20 (3
Cash Generated from Operations 3,331.59 2,6
Direct Taxed Paid Less refund received (136.70) (3
Net Cash from Operating Activities - A 3,194.89 2,5
B. CASH FLOW FROM INVESTING ACTIVITIES
Purchase of Fixed Assets/ WIP (1,507.85) (24
Sale of Fixed Assets 5.46
Net Cash from Investing Activities - B (1,502.39) (20
Piramal Glass Limit

8/2/2019 PGL Annual Report 2010-11
http://slidepdf.com/reader/full/pgl-annual-report-2010-11 64/76
CONSOLIDATED FINANCIAL STATEMENTS
Year ended
March 31, 2011
` in Millions
Year e
March 31,
` in Mil
C. CASH FLOW FROM FINANCING ACTIVITIES
(Repayment)/ Proceeds from Borrowings (624.48) (3,14
Proceeds from Rights Issue — 6
Share Premium Received — 1,2
Equity Dividend and tax there on (92.42)
Interest Paid (703.46) (1,0
Net Cash From Financing Activities - C (1,420.36) (2,35
Net Increase / (Decrease) in Cash & Cash equivalents (A+B+C) 272.13
Increase/(Decrease) in Cash Flow on account of Exchange Fluctuation (210.49) (6
Cash & Cash Equivalents as at 01.04.2010 (Opening Balance) 70.96 1
Cash & Cash Equivalents as at 31.03.2011 (Closing Balance) 132.60
Notes :
1. The above cash flow has been prepared under the Indirect Method as set out in the Accounting Standard - 3 on Cash
Statements issued by the Institute of Chartered Accountants of India.
2. The previous year figures have been regrouped wherever necessary in order to confirm to this years presentation.
3. Figures in brackets reflect cash outflows.
This is the Cash Flow statement referred to in our report of even date.
Hitesh J. Desai Ajay G. Piramal Chairman
PartnerM. No. 37569 Vijay Shah Managing Director For Haribhakti & Co., Sandeep Arora Chief Financial OfficerChartered AccountantsFirm Reg. No. 118013W Nehal Doshi Company Secretary
Mumbai, April 28, 2011
62 Piramal Glass Limited

8/2/2019 PGL Annual Report 2010-11
http://slidepdf.com/reader/full/pgl-annual-report-2010-11 65/76
CONSOLIDATED FINANCIAL STATEM
Schedules forming part of the Balance Sheet as at March 31, 2011 As at
March 31, 2011 ` in Millions
March 31 ` in Mi
1. SHARE CAPITAL
AUTHORISED
82000000 Equity Shares of ` 10/- each 820.00 8(Previous year 82000000 Equity Shares of ` 10/- each)
The Authorised Share Capital of the Company was enhanced and reclassified into82000000 Equity Shares of ` 10/- each as amended by a Special Resolution passed bythe Shareholders through a Postal Ballot on 9th March, 2010.
820.00 8
ISSUED
80923500 Equity Shares of ` 10/- each 809.24 8
(Previous year 80923500 Equity Shares of ` 10/- each)
809.24 8
SUBSCRIBED AND PAID UP
80434736 Equity Shares of ` 10/- each
Of the total paid up capital 62451736 Equity shares of face value of ` 10 each were allottedon 19th September 2010 as fully paid equity shares, pursuant to the Rights Issue of EquityShares by the company. (Refer note No. 3 of part B of Schedule 19 on Notes to Accounts)
804.35 8
804.35 8
2. RESERVES AND SURPLUS
Share Premium Account
As per last Balance Sheet 2,307.01 1,0
Add: Amount Received on Rights Issue — 1,2
Less: Rights Issue Expenses — (
2,307.01 2,3
Capital Redemption Reserve
As per last Balance Sheet 490.00 4
General Reserve
As per last Balance Sheet 58.63
Additions during the year 68.59
127.22
Profit and Loss Account
As per annexed Profit and Loss Account (971.70) (1,50
Exchange Reserve
As per last Balance Sheet 37.85 (14
Add: Addition during the year 35.48 2
Less : Minority Interest 25.0048.33
Capital Reserve
As per last Balance Sheet 60.33
Revaluation Reserve
(Refer Note 1 of Part A of Schedule 19) 154.38 1
2,215.57 1,5
Piramal Glass Limit

8/2/2019 PGL Annual Report 2010-11
http://slidepdf.com/reader/full/pgl-annual-report-2010-11 66/76
CONSOLIDATED FINANCIAL STATEMENTS
As at March 31, 2011
` in MillionsMarch 31
` in Mi
3. SECURED LOANS *
Cash Credit (Refer Note 1) 445.45 3
Term Loan
Rupee Term loan from Financial Institutions (Refer Note 2) 1,895.00 2,7
Foreign Currency loan from Banks (Refer Note 2) 1,990.72 3,0
Buyers Credit (Refer Note 3) 116.05 1
Rupee Short Term loan from Banks (Refer Note 4) 2500.00 20
6,947.22 8,2
Notes :
1. Cash Credit facilities are secured by Hypothecation of stocks and/or pledge of current assets namely, stocks, bills receivabbook debts and all other movables, both present and future, of the Company. Further, the Cash Credit facilities obtained subsidiary viz. Piramal Glass- USA Inc., USA, is secured by counter guarantee of Piramal Glass Limited and a pari passcharge on entire fixed assets of Piramal Glass Limited.
2. The loans obtained by parent company, viz. Piramal Glass Ltd and its subsidiary viz. Piramal Glass -USA Inc., USA are Sby mortgage and first charge of immovable properties of the Company, both present and future. They are further secuhypothecation of all movables and movable machinery, machinery spares and accessories, both present and future, subprior charge created/ to be created in favour of banks for securing the borrowing for working capital facilities. The terobtained by the subsidiary viz. Piramal Glass - USA Inc., is further secured by an exclusive first charge on stock and receof the same subsidiary.
The loans obtained by subsidiary company, viz. Piramal Glass Ceylon Inc. are secured by mortgage and first charge of the proof the company at Rathmalana and Horana location.
3. Loans under Buyers Credit are secured by an exclusive charge on the assets and equipments procured under the facility
4. The Rupee Short Term Loans are secured by mortgage and second charge of immovable properties of the Company, both pand future. They are further secured by second charge on all movables and movable machinery, machinery spares and acceboth present and future.
* Repayable within a year ` 5,578.38 million (Previous year ` 4,653.43 million)
As at March 31, 2011
` in MillionsMarch 31
` in Mi
4. UNSECURED LOANS *
Packing Credit and/or Short Term Loans from Banks 1,326.62 9
Long Term Loan 668.75 3
Sales Tax Deferment loan (Refer Note 1) 257.27 2
Finance Leases —
2,252.64 1,5
Note:1. The Sales Tax Deferment loan is repayable in five equal installments commencing from F. Y. 2011-12.* Repayable within a year ` 1,944.25 millions, previous year ` 1,136.11 millions
64 Piramal Glass Limited

8/2/2019 PGL Annual Report 2010-11
http://slidepdf.com/reader/full/pgl-annual-report-2010-11 67/76
CONSOLIDATED FINANCIAL STATEM
5. FIXED ASSETS
` in
Description GROSS BLOCK DEPRECIATION NET BLOC
As on01.04.2010
Additions Sale / Adjustment
As on31.03.2011
As on01.04.2010
AdditionsYear
Sale / Adjustment
As on31.03.2011
As on31.03.2011
A01.0
Intangible Assets
Software 86.75 6.25 — 93.00 42.45 22.56 — 65.01 27.99 Tangible Assets
Freehold Land 419.43 — 15.69 435.12 — — — — 435.12
Leasehold Land 12.52 — 0.64 13.16 2.90 0.45 0.15 3.50 9.66
Buildings 1,980.86 168.15 25.55 2,174.55 361.46 64.11 2.00 427.57 1,746.98 1
Plant & Machinery 11,446.57 638.33 2.93 12,087.84 4,853.52 947.45 16.64 5,817.61 6,270.23 6
Furniture & Fixtures 299.41 11.73 (0.22) 310.92 195.26 30.93 (1.24) 224.95 85.97
Office Equipments 8.29 - (0.03) 8.26 8.29 0.01 (0.04) 8.26 —
Vehicles 46.20 8.09 (3.55) 50.74 32.10 3.52 (3.01) 32.61 18.13
Total 14,300.03 832.55 41.01 15,173.59 5,495.98 1,069.03 14.50 6,579.51 8,594.08 8
Previous Year 14,501.88 416.93 (616.38) 14,300.03 4,569.62 1,070.60 (144.25) 5,495.97 8,804.05 8
Capital Work in Progress 401.60
TOTAL 8,995.68 8
Notes :1. Gross Block is net of CENVAT credit availed on relevant assets.
2. Additions to Plant & Machinery includes NIL million (Previous year `NIL million) on account of borrowing cost as per AccoStandard 16 – Borrowing Costs
3. Aggregate amount of revaluation of Land & Building, Plant & Machinery, Electric power installation etc owned by PiramaCeylon Plc., amounts to ` 300.16 million ( Previous Year ` 300.16 million)
4. Additions and/or sales/Adjustment include foreign exchange fluctuations.
As at March 31, 2011
`
in Millions
March 31
`
in Mi6. INVESMENTS
(Long Term, Non Trade)
Investment in Shares – Quoted
15108 shares (P.Y. 15108 Shares) of DFCC BankMarket Value ` 1.29 Million (PY ` 0.53 Million)
0.12
Investment in Shares – Un-Quoted
100000 of Rs. 10 each of Enviro Infrastructure Co. Ltd 1.00
1.12
7. INVENTORIES(As certified by the Management)
Raw Material and Packing Material 398.54 3
Work-in- Progress 17.76
Finished Goods 1893.38 1,5
Stores, Spares & Moulds 408.02 3
Provision for Inventory (213.29) (15
2,504.41 2,1
Piramal Glass Limit

8/2/2019 PGL Annual Report 2010-11
http://slidepdf.com/reader/full/pgl-annual-report-2010-11 68/76
CONSOLIDATED FINANCIAL STATEMENTS
As at March 31, 2011
` in MillionsMarch 31
` in Mi
8. SUNDRY DEBTORS
i. Over six months
Unsecured - Considered good 627.66 536.78
- Considered doubtful 64.60 57.79
692.26 5
ii. Others
Unsecured - Considered good 2,161.24 2,113.83
Unsecured - Considered doubtful — —
2,161.24 2,1
Less: Provision for Bad Debts (74.17) (
2,779.33 2,6
9. CASH AND BANK BALANCES
i. Cash and cheques on hand 0.79
ii. Balance with Scheduled Banks
– Current Account 126.79
– Rights Issue Refund Account 0.08
– Others 4.94
132.60
10. LOANS AND ADVANCES(Unsecured and Considered Good)
Advances recoverable in cash or in kind or for value to be received 467.27 3
– Advance Tax (Net of Provisions) 194.34
– Prepaid Expenses 37.32
– Balance with Excise Authorities 84.96 1
– Other Advances 148.70 1
932.59 6
11. CURRENT LIABILITIES
Sundry Creditors for Capital Goods, Materials and Expenses 1,029.09 8
Interest accrued but not due 49.18
Other liabilities 1.62
Equity dividend payable 246.49 1
1326.38 1,0
12. PROVISIONSProvision for Employees retirement benefits 117.96 1
Provision for Other Liabilities 505.69 4
Proposed Dividend 281.52
Provision for Tax on Dividend 45.67
Provision for Tax 206.99
1,157.83 6
66 Piramal Glass Limited

8/2/2019 PGL Annual Report 2010-11
http://slidepdf.com/reader/full/pgl-annual-report-2010-11 69/76
CONSOLIDATED FINANCIAL STATEM
Schedules annexed to and forming part of the Profit and Loss Account for the Year Ended March 31,Year ended
March 31, 2011 ` in Millions
Year eMarch 31,
` in Mil13. OTHER INCOME
Income from Windmill 7.35Claims & Refunds 1.23Scrap Sales 40.17
Export Incentive 84.06Miscellaneous Income 38.43Mould Recovery 37.65Sales Tax Remission 0.57Profit on Sale of Assets 2.34Dividend (Gross) —
Interest on Deposit 3.55
215.35 214. MATERIALS
Raw MaterialsOpening stock 285.46 2Add: Purchases 2,009.55 1,6
2,295.01 1,9
Less: Closing stock 384.63 2Raw Materials Consumed 1,910.38 1,6Packing Materials Consumed 689.49 5
Purchase of Trading Goods Sold 46.63 12,646.50 2,2
15. STAFF COSTSalaries, Wages and Bonus 1,957.56 17Contribution to Provident and Other funds 373.69 3Staff Welfare 37.35
2,368.60 2,116. OTHER EXPENSESPower & Fuel 1884.37 16Stores, Spares, Lubricants and Moulds consumed 544.50 4
Repairs to:- Building 18.16- Plant & Machinery 108.32 1- Others 41.43
Rent, Rates & Taxes 83.90 1Wind farm rent & maintenance 1.58Bank Charges 28.48Insurance 34.73Communication 24.41Donation 0.67Travelling Expenses 72.26(Directors Travelling Rs.4.11 Million, PY Rs 4.06 Million)Foreign Technical Fees 25.75
Legal & Professional Fees 58.52Audit Fees 4.66Freight Outward 859.30 6Commission on Sales 43.23Sitting fees 0.92Loss on Sale of Assets 1.81Decoration 296.40 2Exchange Fluctuation Loss / (Gain) (70.61) 3Miscellaneous 444.76 3
4,507.55 4,3
Piramal Glass Limit

8/2/2019 PGL Annual Report 2010-11
http://slidepdf.com/reader/full/pgl-annual-report-2010-11 70/76
CONSOLIDATED FINANCIAL STATEMENTS
Year endedMarch 31, 2011
` in Millions
Year eMarch 31
` in Mi
17. INCREASE/(DECREASE) IN FINISHEDGOODS AND WORK-IN-PROGRESS
Opening Stock 1541.44 1,8
Closing Stock 1,628.91 1,5
(Increase)/Decrease in WIP/Finished Goods (87.47) 3
18. INTEREST
Interest on Loans from Banks 567.70 8
Interest to Others 152.67 1
720.37 1,0
19. NOTES TO CONSOLIDATED ACCOUNTS
PART – A SIGNIFICANT ACCOUNTING POLICIES:
Basis of Accounting:The financial statements are prepared under the historical cost convention and comply with the applicable Accounting Sta
in the country of incorporation except for:
1. the revaluation of certain property, plant & machinery of Piramal Glass Ceylon Plc, and
2. assets and liabilities acquired by Piramal Glass- USA, Inc accounted at its estimated fair value.
Principles of Consolidation:1. The Consolidated Financial Statements comprises the financial statements of Piramal Glass Ltd. (the Company) and its Subsi
(collectively known as the ‘Group’). The consolidated financial statements have been prepared on the following basis with Accounting Standard - 21 Consolidated Financial Statements issued by ICAI.
a. The financial statement have been combined on a line by line basis by adding together book values of like items ofliabilities, income and expenses after fully eliminating intra-group balances and transactions and unrealized profitresulting from intra group transactions related to transfer of assets/liabilities.
b. The difference between the costs of investment in the subsidiaries, over the net assets at the time of acquisition ofin the subsidiaries is recognized in the financial statements as Goodwill or Capital Reserve as the case may be.
c. Minority Interest’s share of net profit of consolidated subsidiaries for the year is identified and adjusted against the iof the group in order to arrive at the net income attributable to the shareholders of the Company.
d. Minority Interest’s share of net assets of consolidated subsidiaries is identified and presented in consolidated balancseparate from liabilities and the equity of the Company’s shareholders.
2. While preparing Consolidated Financial Statements, the foreign exchange adjustments have been carried out on followinas per Accounting Standard 11 – Accounting for effects of changes in Foreign Exchange Rates.
a. The summarized revenue and expense transaction at the year-end reflected in profit and loss account of the subsidiaries, which are stated in the currency of their domicile, are translated into Indian Rupees at an average of AMonthly Exchange Rate.
b. All monetary and non-monetary items reflected in the balance sheet of the foreign subsidiaries which are stated
currency of their domicile, are translated into Indian Rupees at the year-end closing exchange rate except for fixedand share capital in case of integral foreign subsidiaries, which are converted at the exchange rate prevailing on acqutransaction date.
c. The resultant translation exchange gain/loss in case of Non-integral foreign operations is disclosed as Foreign ExTranslation Reserve in Reserves & Surplus schedule to the accounts. In case of integral foreign operations as the tranexchange gain / loss is recognized in the Consolidated Profit & loss account.
Other Significant Accounting Policies1. These are set out under “Significant Accounting Policies” as given in the unconsolidated financial statements of Pirama
Limited and its subsidiaries.
68 Piramal Glass Limited

8/2/2019 PGL Annual Report 2010-11
http://slidepdf.com/reader/full/pgl-annual-report-2010-11 71/76
CONSOLIDATED FINANCIAL STATEM
PART – B NOTES FORMING PART OF ACCOUNTS:
1. The subsidiary companies considered in the consolidated financial statements are:
Name of Company Country of Incorporation
% of Voting Poheld as at 31
March’2011
Piramal Glass Ceylon PLC (Formerly known as Ceylon Glass Company Ltd) Sri Lanka 56.45 %
Piramal Glass International Inc. (Formerly known as GG USA Inc.) USA 100.00%
Piramal Glass USA, Inc. (Formerly known as Gujarat Glass International Inc.) USA 100.00%
Piramal Glass Flat river LLC. (Wholly owned Subsidiary of PG USA)(Formerly known as GGL Flat River LLC.)
USA 100.00%
Piramal Glass Williamstown LLC. (Wholly owned Subsidiary of PG USA)(Formerly known as GGL Williamstown LLC)
USA 100.00%
Piramal Glass (UK) Ltd. UK 100.00%
Piramal Glass Europe SARL. France 100.00%
2. Contingent Liability in respect of:
As at March 31, 2011(` in Million)
As at March 31,(` in Million
a) Estimated amount of contracts remaining to be executed on Capital account 644.86 188.15
b) Disputed Liability
– Central Excise authorities 4.91 7.06
– Sales Tax Authorities 0.43 2.19
– Income Tax Authorities 38.00 —
3. Pursuant to the Company’s Right Issue Offer of 62949500 Equity Shares of Rs.10/- each for Rs.30/- each (Including aPremium of Rs.20/- each), allotment of 488764 equity shares have been kept in abeyance, of which 481922 equity shares pto Overseas Corporate Bodies which are subject to requisite approval of Reserve Bank of India and 6842 equity shares arfor which documentation for establishing title thereto are pending.
4. Debtors, Loans and advances includes:
Rs. 1,316.78 Mio (previous year Rs. 859.54 Mio) are due from companies, where Directors of the Company are interested as D
5. The operations of the Company and its Subsidiaries viz Piramal Glass Ceylon PLC and Piramal Glass USA INC., relates business of manufacturing of containers glass packaging. The other subsidiaries of the Company, viz., Piramal Glass InternINC. and Piramal Glass (UK) ltd, is in the business of marketing of container glass. Accordingly primary segment repdisclosures for business segments, as envisaged in Accounting Standard 17 on ‘Segment Reporting’ (AS 17) issued by thInstitute of Chartered Accountants of India, is not applicable.
The operations relating to secondary segment reporting has been confined to within India operations & outside India oper
Secondary segment reporting: (Rs. in M
Details Within India Outside India Inter – Segment Elimination
Total
March2011
March2010
March2011
March2010
March2011
March2010
March2011
Ma20
Revenues 7,718.71 6,812.71 5,631.33 5,036.17 (950.01) (589.05) 12,400.03 11,2
Carrying amount of Segment Assets
12,182.97 11,375.99 5,130.63 4,749.28 (2,730.19) (1,464.03) 14,583.41 14,6
Additions to Fixed andIntangible Assets
721.22 138.99 111.33 97.46 — — 832.55 2
6. In view of the proposed International Financial Reporting Standard, the Company has changed its policy for accounMoulds. Consequent to the change, moulds used for production of finished goods are reclassified and recognized as fixeand depreciation has been provided on the basis of actual usage of each mould. Hitherto, and including up to quarter September 30, 2010, such moulds were considered as inventory and charged off on the basis of actual usage of each mou
Piramal Glass Limit

8/2/2019 PGL Annual Report 2010-11
http://slidepdf.com/reader/full/pgl-annual-report-2010-11 72/76
CONSOLIDATED FINANCIAL STATEMENTS
Consequent to the above changes, an amount of ̀ 1,408/- Lacs (` 1,596/- Lacs for corresponding previous year) has been regfrom other Expenditures to Depreciation / Amortization.
The Change in accounting policy of moulds does not have any impact on the profit of the Company for the current quaany earlier previous year.
7. As required by Accounting Standard – AS 18 “Related Parties Disclosure” issued by The Institute of Chartered AccountIndia are as follows:
A. List of Related Parties with whom transactions have taken place during the period:
Year ended 31.03.11 Year ended 31.03.10
a) Subsidiary Companies a) Subsidiary Companies
– Piramal Glass Ceylon Plc. – Piramal Glass Ceylon Plc.
– Piramal Glass International Inc.., USA – Piramal Glass International Inc.., USA
– Piramal Glass (UK) Ltd. – Piramal Glass (UK) Ltd.
– Piramal Glass – USA, Inc. – Piramal Glass – USA, Inc.
– Piramal Glass Flat River LLC. – Piramal Glass Flat River LLC.
– Piramal Glass Williamstown LLC – Piramal Glass Williamstown LLC
– Piramal Glass Europe SARL
b) Associated Companies b) Associated Companies
– Piramal Healthcare Ltd. – Piramal Healthcare Ltd.
– Piramal Enterprises Ltd. – Piramal Enterprises Ltd.
– Piramal Pharma Inc. – PHL Pharma Inc.
– Piramal Realty Private Limited – Piramal Realty Private Limited
c) Key Management Personnel c) Key Management Personnel
– Mr. Ajay Piramal – Mr. Ajay Piramal
– Dr. (Mrs.) Swati Piramal – Dr. (Mrs.) Swati Piramal
– Mr. Vijay Shah – Mr. Vijay Shah
– Mr. Sandeep Arora – Mr. Sandeep Arora
– Mr. Niraj Tipre – Mr. Niraj Tipre
– Mr. Sanjay Tiwari – Mr. Sanjay Tiwari
B. Summary of the transactions with related parties is as follows:
(` in M
Particulars
AssociatesKey Management
PersonnelTotal
Yearended
31-03-11
Yearended
31-03-10
Yearended
31-03-11
Yearended
31-03-10
Yearended
31-03-11
Yeend
31-0
Purchase of goods / service / assets 9.63 15.33 — — 9.63 15
Sale of goods 106.95 220.24 — — 106.95 220
Reimbursement of exp. Recd. 0.29 1.52 — — 0.29 1
Reimbursement of exp. Paid 8.53 8.48 — — 8.53 8
Remuneration — — 28.94 22.64 28.94 22
Corporate Service Charges 5.00 41.69 — — 5.00 41
Outstanding payable — 0.08 — — — 0
Outstanding receivable 15.42 45.29 — — 15.42 45
Note: The above information has been determined to the extent such parties have been identified on the basis of information pby the Company and approved by the Board of Directors of the Company.
70 Piramal Glass Limited

8/2/2019 PGL Annual Report 2010-11
http://slidepdf.com/reader/full/pgl-annual-report-2010-11 73/76
CONSOLIDATED FINANCIAL STATEM
8. a. In respect of operating leasing arrangement for office premises and motor vehicles, the aggregate lease rentals payathese leasing arrangements are charged as rent under “other expenses” in schedule-16.
These leasing arrangements are for a period not exceeding five years and are in most cases renewable by mutual consmutually agreeable terms. The minimum lease rentals outstanding in respect of these assets are as follows:
(` in M
As at 31st March 2011
As at 31st March 2
Total minimum lease payments 54.65 73.25
Lease rentals payable within 1 year 29.62 34.33
Lease rentals payable between 1-5 years 25.03 38.92
b. In respect of plant and machinery and land taken on finance lease, the same have been accounted at fair market valproper depreciation for the year under review has been provided. The minimum lease rentals outstanding in resthese assets are as follows:
(` in M
As at 31st March 2011
As at 31st March 2
Total minimum lease payments 21.19 24.33
Lease rentals payable within 1 year 2.89 3.14
Lease rentals payable between 1-5 years 16.59 12.39
Lease rentals payable later than 5 years 1.71 8.80
9. As required by Accounting Standard 20 issued by the Institute of Chartered Accountants of India, the reporting in resEarning Per Share (EPS) is as follows:
Profit available to equity shareholders (` in M
Particulars Year endedMarch 31, 2011
Year endeMarch 31, 2
Profit\Loss available to equity shareholders Rs. in Millions 930.23 44.
Weighted average no. of equity share for Basic EPS Nos. 80434736 527164
Nominal value of equity shares Rs. 10
Earning Per Share (Basic/Diluted) Rs. 11.56 0.
Note: The EPS for the year ended 31st March 2010 have been calculated on the basis of weighted Average No of shares derived as per Acc
Standard 20 to reflect the effect of Rights Issue. The diluted EPS has been calculated without considering the shares in abeyancenote 3 above)
10. The deferred tax assets & liabilities comprise of tax effect of following timing differences: (` in M
Particulars As of 31st March 10
As of 31st March
Deferred Tax Liability
Depreciation 575.11 534.63
Total 575.11 534.63
Deferred Tax Assets
Unabsorbed Depreciation 304.17 —
Provision for gratuity & leave encashment 7.45 12.16
Provision for Doubtful Debts 19.88 21.46
Disallowance u/s 43B 2.84 3.05
Provision for non-moving inventory 25.15 62.73
MAT Credit u/s 115JB 86.42 291.84
Exchange Loss on fixed assets 13.89 (0.59)
Deduction U/S 35 DD 2.11 1.04
Total 461.91 391.69
Net Deferred Tax Liability 113.20 142.94
Piramal Glass Limit

8/2/2019 PGL Annual Report 2010-11
http://slidepdf.com/reader/full/pgl-annual-report-2010-11 74/76
CONSOLIDATED FINANCIAL STATEMENTS
11. Depreciation on fixed assets:
In case of the subsidiaries of the Company, it was not practicable to use uniform accounting policies for depreciation of
Company Method of Depreciation Accounting Policy Used
Piramal Glass Ceylon Plc. Straight Line Method
Building — 2.5%
Plant & Machinery — 5% - 15%
Office Equipments — 10%Computer Systems — 25%
Motor Vehicles — 15%
Leasehold assets are written off over the remaperiod of the lease.
Piramal Glass - USA, Inc. Straight Line Method
Building — 3.34%
Plant & Machinery — 16.67% - 33.33%
Motor Vehicles — 50%
Piramal Glass Flat River Inc. Straight Line Method
Building — 3.34%
Plant & Machinery — 16.67% - 33.33%
Motor Vehicles — 50%
Piramal Glass Williamstown LLC. Straight Line Method
Building — 3.34%
Plant & Machinery — 16.67% - 33.33%
Motor Vehicles — 50%
Piramal Glass International Inc. Straight Line Method
Office Equipments — 3 years
Furniture — 5 years
Leasehold improvements — 62 Months
Trade Show Booths — 3 - 5 years
Piramal Glass (UK) Limited. Straight Line MethodComputer Systems — 33.33%
Furniture & Fixtures — 10%
The impact of depreciation due to difference in accounting policy is not material and hence the same is ignored.
12. Figures for the previous year have been regrouped and rearranged wherever necessary so as to make them comparable wcurrent year figures.
For and on behalf of the Board
Hitesh J. Desai Ajay G. Piramal ChairmanPartnerM. No. 37569 Vijay Shah Managing Director For Haribhakti & Co., Sandeep Arora Chief Financial OfficerChartered Accountants
Firm Reg. No. 118013W Nehal Doshi Company Secretary
Mumbai, April 28, 2011
72 Piramal Glass Limited

8/2/2019 PGL Annual Report 2010-11
http://slidepdf.com/reader/full/pgl-annual-report-2010-11 75/76

8/2/2019 PGL Annual Report 2010-11
http://slidepdf.com/reader/full/pgl-annual-report-2010-11 76/76