pge epic project - pg&e, pacific gas and electric
TRANSCRIPT

EPIC 2.04: DG Monitoring and Voltage Tracking Final Report
Pacific Gas and Electric Company
EPIC Final Report
Program Electric Program Investment Charge (EPIC)
Project Name
EPIC 2.04 – Distributed Generation Monitoring and Voltage Tracking
Project Reference Name
Distributed Generation (DG) Monitoring
Department Electric Asset Management - Emerging Grid Technologies
Project Sponsor Ferhaan Jawed Business Lead Tom Martin
Contact [email protected]
Date April 30, 2017

EPIC 2.04: DG Monitoring and Voltage Tracking Final Report
i
Table of Contents Executive Summary ...................................................................................... 1 1
Introduction.................................................................................................. 5 2
2.1 Regulatory Background................................................................................................. 5
Project Summary .......................................................................................... 6 3
3.1 Issue Addressed ............................................................................................................. 6
3.2 Project Objective ........................................................................................................... 6
3.3 Project Scope ................................................................................................................. 7
3.4 Project Approach, Deliverables, Milestones and Tasks ................................................ 7
Work Stream A: Data Management .............................................................. 9 4
4.1 Data Sources ................................................................................................................. 9 4.1.1 Incomplete Data ............................................................................................................. 9
4.2 Hardware and Software .............................................................................................. 10
Work Stream B: Analytics ........................................................................... 11 5
5.1 Overview: DG Voltage Monitoring and Tracking Analytics ........................................ 11 5.1.1 Fuzzy Logic Background ............................................................................................... 11 5.1.2 Fuzzy Logic Methodology ............................................................................................. 11
5.2 Analytic Model Development Steps ............................................................................ 13 5.2.1 Identification of Potential Decision Factors or Parameters ......................................... 13 5.2.2 Establish Fuzzy Membership Functions and Rules....................................................... 14 5.2.3 Fuzzy Model Implementation Approach...................................................................... 15 5.2.4 Fuzzy Logic Analytics Simulation .................................................................................. 17 5.2.5 Fuzzy Logic Analytics Implementation Output ............................................................ 19
Work Stream C – Visualization .................................................................... 21 6
6.1 User stories.................................................................................................................. 21
6.2 DG Voltage Monitoring and Tracking Displays ........................................................... 23
6.3 User Evaluation ........................................................................................................... 29
Project Overall Results ................................................................................ 32 7
7.1 Technical Results, Findings and Recommendations ................................................... 32 7.1.1 Validation of Analytic Model ....................................................................................... 32 7.1.2 Key Rules for DG Voltage Violation Analysis ................................................................ 32 7.1.3 Large PV Connected to Secondary Circuit.................................................................... 33 7.1.4 Regulator Tap Response Rate ...................................................................................... 33 7.1.5 Primary vs. Secondary System Violations .................................................................... 33 7.1.6 Fuzzy Model Solution and Performance ...................................................................... 33
7.2 Special or Unique Technology Implementation Issues ................................................ 34 7.2.1 Subject Matter Experts ................................................................................................ 34 7.2.2 Data Availability Limitations ........................................................................................ 34

EPIC 2.04: DG Monitoring and Voltage Tracking Final Report
ii
7.2.3 Hardware and Software ............................................................................................... 34
7.3 Data Access ................................................................................................................. 35
7.4 Value Proposition: Primary and Secondary Guiding Principles ................................... 35
7.5 Technology Transfer Plan ............................................................................................ 36 7.5.1 PG&E Technology Transfer Plan .................................................................................. 36 7.5.2 Adaptability to Other Utilities and the Industry .......................................................... 37
Metrics ....................................................................................................... 38 8
Conclusion .................................................................................................. 39 9
Appendix A: Fuzzy Logic Rules for DG Voltage Monitoring and Tracking ..... 40 10
10.1 Grid-Related Rules ....................................................................................................... 40 10.1.1 Primary System Rules ................................................................................................... 40 10.1.2 Secondary System Rules .............................................................................................. 42
10.2 PV Related Rules ......................................................................................................... 44 10.2.1 Primary System Rules ................................................................................................... 44 10.2.2 Secondary System Rules .............................................................................................. 46
10.3 Topology-Related Rules .............................................................................................. 47 10.3.1 Primary System Rules ................................................................................................... 47 10.3.2 Secondary System Rules, and Environmental-Related Rules ...................................... 48
10.4 Additional Rules .......................................................................................................... 49
Appendix B: Summary of Fuzzy Model Inputs With Descriptions ................ 54 11
11.1 Grid Related Inputs ..................................................................................................... 54
11.2 PV Related Inputs ........................................................................................................ 54
11.3 Topology Related Inputs ............................................................................................. 54
11.4 Environment Related Inputs ........................................................................................ 54
11.5 Summary List of Fuzzy Logic Rules .............................................................................. 55
List of Tables Table 1: Key Project Demonstration Objectives ........................................................................................... 2 Figure 1: Relationships of Work Streams ...................................................................................................... 8 Table 2: PG&E Data Sources ......................................................................................................................... 9 Table 3: Time Dependent (Dynamic) Fuzzy Model Inputs .......................................................................... 13 Table 4: Time Independent (Static) Fuzzy Model Inputs ............................................................................ 13 Figure 2: Membership Function for PV Generation .................................................................................... 14 Figure 3: Membership Function for Solar Radiation ................................................................................... 14 Figure 4: Two Submodule Fuzzy Model ...................................................................................................... 16 Figure 5: Fuzzy Submodule1 – Inputs in Hierarchical Order ....................................................................... 17 Figure 6: Fuzzy Submodule 2 – Inputs in Hierarchical Order ...................................................................... 17 Table 5: Fuzzy Inputs and Output for Selected Service Points and Intervals .............................................. 20 Table 6: User Stories ................................................................................................................................... 21 Figure 7: DG Voltage Impacts Display Example 1 (service point detail) ..................................................... 23

EPIC 2.04: DG Monitoring and Voltage Tracking Final Report
iii
Figure 8: DG Voltage Impacts Display Example 2 (service point detail) ..................................................... 24 Figure 9: DG Voltage Impacts Display Example 3 (calculated likelihood rules) .......................................... 25 Figure 10: DG Voltage Impacts Display Example 4 (point in time charts) .................................................. 26 Figure 11: DG Voltage Impacts Display Example 5 (trending over time) .................................................... 27 Figure 12: DG Voltage Impacts Display Example 6 (predicted VV on map display) .................................... 28 Table 7: Analytic Model Validation ............................................................................................................. 32 Table 8: Hardware and Software Results and Learnings ............................................................................ 35 Table 9: EPIC Primary and Secondary Guiding Principles ........................................................................... 36 Table 10: EPIC Metrics for DG Voltage Monitoring and Tracking ............................................................... 38
List of Figures Figure 1: Relationships of Work Streams ...................................................................................................... 8 Figure 2: Membership Function for PV Generation .................................................................................... 14 Figure 3: Membership Function for Solar Radiation ................................................................................... 14 Figure 4: Two Submodule Fuzzy Model ...................................................................................................... 16 Figure 5: Fuzzy Submodule1 – Inputs in Hierarchical Order ....................................................................... 17 Figure 6: Fuzzy Submodule 2 – Inputs in Hierarchical Order ...................................................................... 17 Figure 7: DG Voltage Impacts Display Example 1 (service point detail) ..................................................... 23 Figure 8: DG Voltage Impacts Display Example 2 (service point detail) ..................................................... 24 Figure 9: DG Voltage Impacts Display Example 3 (calculated likelihood rules) .......................................... 25 Figure 10: DG Voltage Impacts Display Example 4 (point in time charts) .................................................. 26 Figure 11: DG Voltage Impacts Display Example 5 (trending over time) .................................................... 27 Figure 12: DG Voltage Impacts Display Example 6 (predicted VV on map display) .................................... 28

EPIC 2.04: DG Monitoring and Voltage Tracking Final Report
iv
List of Acronyms
CPUC California Public Utilities Commission CVR Conservation Voltage Reduction DG Distributed Generation EPIC Electric Program Investment Charge ESFT Electronic Secure File Transfer GHG Greenhouse Gas (emissions) IEEE Institute of Electrical and Electronics Engineers PI Process Intelligence PV Photovoltaic SCADA Substation Control and Data Acquisition SP Service Point TD&D Technology Development and Deployment VV Voltage Violation VVO Volt/Var Optimization

EPIC 2.04: DG Monitoring and Voltage Tracking Final Report
1
Executive Summary 1
The electrical grid has historically been closed to independent generators: a few large power plants
provided supply, and customers provided demand. This is beginning to shift as adoption of distributed
renewable energy has begun to gain traction. As of the time of this report, PG&E has approximately
300,000 distributed generation (DG) interconnections across its 70,000 square mile service territory. The
current rate of new solar generation interconnections is approximately 4,000-6,000 installations per
month. This increasing level of DG connected to the distribution system represents a challenge to
maintain distribution grid standards for voltage, harmonics, and overall reliability. New photovoltaic (PV)
that generates power behind the meter and flows back into the distribution feeder creates the potential
for issues such as voltage spikes and dips. Reverse power flow, caused by high amounts of rooftop solar,
can cause potential safety or reliability impacts for PG&E’s customers. While the PG&E network has a
strong history with safely supporting solar installations, and current voltage impact of DG has only
resulted in localized issues, the risk of voltage violations increases as more residential solar installations
are completed. Similar challenges will present themselves in other utilities’ territories as solar
installation penetration continues to grow nationwide.
The EPIC 2.04 - DG Monitoring and Voltage Tracking technology demonstration project was created to
address an information gap that will gain importance as PV adoption continues: is a voltage violation the
result of DG, or more traditional causes? This information could prove valuable for a variety of utility
actors, including:
Power Quality Engineers troubleshooting customer issues (and proactively identifying issues
before customers raise them).
Distribution Operations Engineers working to understand voltage issues for switch planning.
Dispatchers determining whether to send a truck crew to diagnose a violation.
Asset Planners trying to identify where grid operations issues may arise due to DG.
The starting point for this project was to capitalize on the data available from PG&E’s automated
metering infrastructure and supervisory control and data acquisition (SCADA) system. This project
utilized the data to create a technological solution for identifying and characterizing voltage problems
on the electric distribution system. The objective was to produce a prototype analytic tool that would
answer two questions:

EPIC 2.04: DG Monitoring and Voltage Tracking Final Report
2
Table 1: Key Project Demonstration Objectives Topic Area Key Question Relevant to
Voltage problems that may be caused by DG
How likely is it that a particular voltage problem was caused by DG, given system and circuit loading conditions, and several other contributing factors, at the time the incident occurred?
Troubleshooting existing customer problems and determining whether to send field personnel to investigate
DG that may cause future voltage problems
How likely is it that a particular DG output may cause future voltage variations, or undesired variations at the customer end, given system and circuit loading conditions and other contributing factors?
Understanding where future violations may occur for Asset Planning
Increased DG adoption presents new planning and operating issues that have previously been addressed
using historic analytics and tools that are becoming outdated due to increase in both grid complexity
and available data. This project aimed to create new tools that combined engineers’ subject matter
expertise, newly available data from the SmartMeter™ infrastructure, and cutting edge analytics
techniques.
The methodology applied by this project was based on a “fuzzy logic” model that captured the
knowledge and analytic abilities of voltage event subject matter experts (SMEs) both internal to PG&E
and in the industry. Fuzzy logic is a branch of analytics theory that can be useful for complex systems
and was first advanced by Dr. Lotfi Zadeh of the University of California at Berkeley in the 1960s. The
fuzzy logic methodology quantified all the possible factors for the PG&E electric system, to the extent
possible with the data available. The factors are set out as “rules” against which the data can be
evaluated. The model determines that DG is the source of the voltage violation if DG-related rules are
the most-likely ones for a given violation.
The methodology was validated through simulation: voltage test cases were run through the rules,
which produced which grouping (“high likelihood,” “medium likelihood,” “low likelihood,” or “very low
likelihood”) for each violation identified. Due to the complexity of the interrelationship of DG and the
electric distribution system there were a large number of rules developed to address the core questions.
The project analytics utilized 26 rules, and another 11 were recommended for future use when the
corresponding data becomes available (See Section 3.2 and Appendix B).
The delivery aspect of the project brought together the data, the fuzzy logic rules and the requirements
of power quality, asset management planning, grid planning, and distribution operations engineering
personnel into a single DG Voltage Monitoring and Voltage Tracking Tool. Their requirements were
captured as User Stories that specified how the analytics were to be displayed (for example, “I need to
see a high level view of where I am having issues”). The Tool in this example allowed the user to select
parameters for the result (e.g., geographic location or asset number) and obtain a map showing the
PG&E grid on a geographic overlay with all voltage events within the parameters identified.

EPIC 2.04: DG Monitoring and Voltage Tracking Final Report
3
Key learnings and insights from the project were:
1. The analytic tool was successful in calculating the likelihood that a voltage problem may be
caused by DG. Out of a sample size of 200 violations, 168 of the violations were correctly
identified as either high or low likelihood that they were caused by DG. The remaining 32 were
identified as requiring further analysis. The status quo is that all 200 violations would have
required further analysis, but in this field demonstration the tool reduced by 84% the set of
violations to manually investigate.
2. It was observed that the rules related to DG in a secondary system, solar radiation, DG customer
loading and duration of voltage violation had the most impact on determining the likelihood DG
was the cause of a voltage violation.
3. The tool also analyzed DG that may cause future voltage problems. The rules with the most
impact for this problem were PV generation, solar radiation and PV penetration of the
secondary circuits. In particular, the tool proved to be valuable in predicting the impact of
specific additional DG load where the aggregated DG capacity at the service transformer was
greater than 50 kW, but its capacity was too small to require an interconnection study (less than
25 kW).
4. Capturing and converting the knowledge and experience of subject matter experts was essential
input for the tool to produce intelligent findings. This made the project highly reliant upon the
depth of knowledge and experience of the personnel involved and the breadth of literature
research conducted. Knowledge transfer to other electric distribution systems would require
integration of any system-specific variables and consideration of the depth of the data available.
5. Voltage violations in the downstream of a service transformer without PV unit were unlikely to
be caused by the over-generation of neighboring PV units connected to a different service
transformer.
6. To build the production version of this tool cost-effectively, additional data and analytics
platform development is needed to bring the approach to scale for regular operational use. The
project created the algorithms and demonstrated the user experience needed for an eventual
system deployment. However, making the system operational cost-effectively would require a
more robust data platform solution, which is not yet in place at PG&E.
7. Review with user groups validated that the tool would be useful in their work. The Distribution
Operations Engineers felt the predictive model would be useful, while the other groups were
primarily interested in historical analysis. None of the groups felt it was a priority to have true
real-time data – for most use cases, 48 hour old data provided the information necessary for
users. Also, for historical information, the preference was to be able to go back in time one year
so that comparisons could be made based on seasons and dates.

EPIC 2.04: DG Monitoring and Voltage Tracking Final Report
4
Overall, PG&E learned that the tool could be useful in determining the best solutions to voltage
problems, such as where to install smart inverters. The DG Monitoring and Voltage Tracking project
successfully demonstrated that SmartMeter™ data and analytical modeling can be used to estimate the
likelihood that a voltage violation was or will be caused by DG. However, additional data analytics
platform investment is needed before PG&E will be able to take the approach to scale. When those
larger platform developments are ready, reviews with key user groups confirmed the value proposition
of delivering this new information about the state of the grid and potentially improving decision-making
for operations engineers and planners.

EPIC 2.04: DG Monitoring and Voltage Tracking Final Report
5
Introduction 2
This report documents the key achievements and learnings from PG&E’s EPIC Project 2.04 - DG
Monitoring and Voltage Tracking, and identifies future applications of the algorithmic process it
demonstrated.
2.1 Regulatory Background
The California Public Utilities Commission (CPUC) passed two decisions that established the basis for this
technology demonstration program. The CPUC initially issued D. 11-12-035, Decision Establishing Interim
Research, Development and Demonstrations and Renewables Program Funding Level,1 which established
the Electric Program Investment Charge (EPIC) on December 15, 2011. Subsequently, on May 24, 2012,
the CPUC issued D.12-05-037, Phase 2 Decision Establishing Purposes and Governance for Electric
Program Investment Charge and Establishing Funding Collections for 2013-2020,2 which authorized
funding in the areas of applied research and development, Technology Demonstration and Deployment
(TD&D), and market facilitation. In this later decision, CPUC defined TD&D as “the installation and
operation of pre-commercial technologies or strategies at a scale sufficiently large and in conditions
sufficiently reflective of anticipated actual operating environments to enable appraisal of the
operational and performance characteristics and the financial risks associated with a given technology.”3
The decision also required the EPIC Program Administrators to submit Triennial Investment Plans to
cover three-year funding cycles for 2012-2014, 2015-2017, and 2018-2020. On May 1, 2014, in
A.14-05-003, PG&E filed its second triennial Electric Program Investment Charge (EPIC) Application at
the CPUC, requesting up to $55.258 million that could be used for 30 PG&E-led Technology
Demonstration and Deployment Projects. On April 9, 2015, in D.15-04-020, the CPUC approved PG&E’s
EPIC plan, including up to $51.402 million of approved budget for this program category.
Pursuant to PG&E’s approved EPIC Triennial Plan, PG&E initiated, planned and implemented the
following project: 2.04 - DG Monitoring and Voltage Tracking. Through the annual reporting process,
PG&E kept CPUC staff and stakeholders informed on the progress of the project. This is PG&E’s final
report on the project.
1 http://docs.cpuc.ca.gov/PublishedDocs/WORD_PDF/FINAL_DECISION/156050.PDF.
2 http://docs.cpuc.ca.gov/PublishedDocs/WORD_PDF/FINAL_DECISION/167664.PDF.
3 Decision 12-05-037, p. 37.
EPIC 2.04: DG Monitoring and Voltage Tracking Final Report
6
Project Summary 3
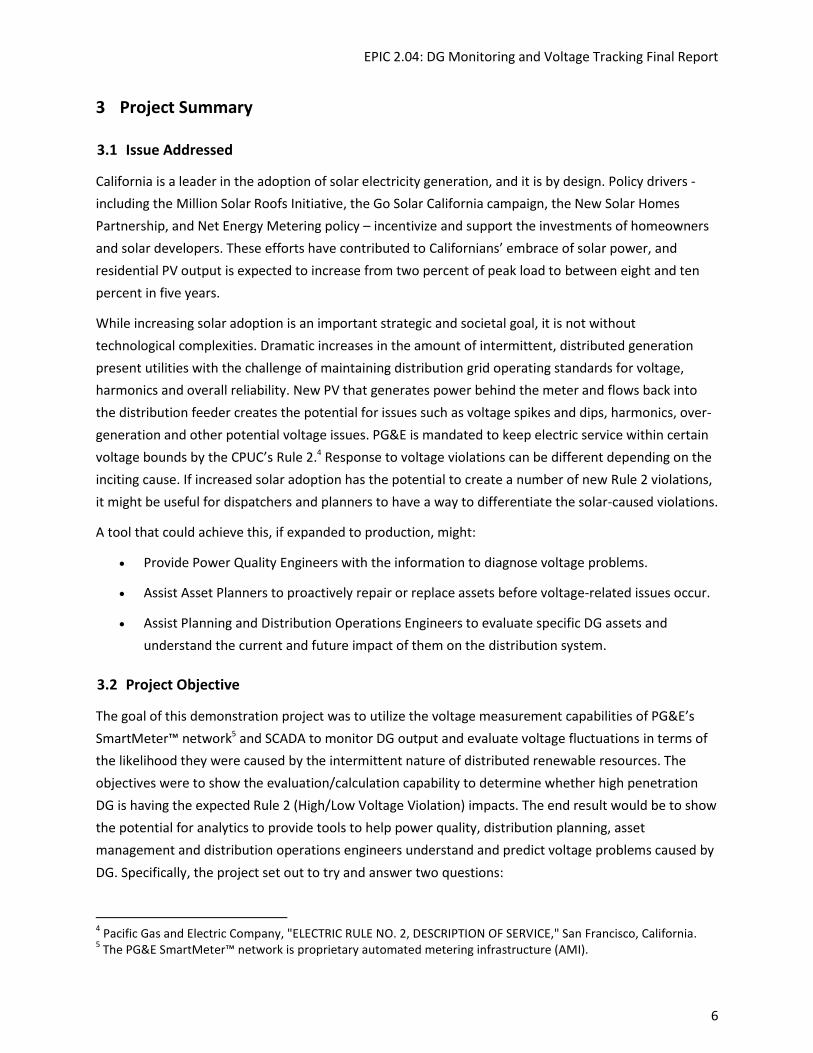
3.1 Issue Addressed
California is a leader in the adoption of solar electricity generation, and it is by design. Policy drivers -
including the Million Solar Roofs Initiative, the Go Solar California campaign, the New Solar Homes
Partnership, and Net Energy Metering policy – incentivize and support the investments of homeowners
and solar developers. These efforts have contributed to Californians’ embrace of solar power, and
residential PV output is expected to increase from two percent of peak load to between eight and ten
percent in five years.
While increasing solar adoption is an important strategic and societal goal, it is not without
technological complexities. Dramatic increases in the amount of intermittent, distributed generation
present utilities with the challenge of maintaining distribution grid operating standards for voltage,
harmonics and overall reliability. New PV that generates power behind the meter and flows back into
the distribution feeder creates the potential for issues such as voltage spikes and dips, harmonics, over-
generation and other potential voltage issues. PG&E is mandated to keep electric service within certain
voltage bounds by the CPUC’s Rule 2.4 Response to voltage violations can be different depending on the
inciting cause. If increased solar adoption has the potential to create a number of new Rule 2 violations,
it might be useful for dispatchers and planners to have a way to differentiate the solar-caused violations.
A tool that could achieve this, if expanded to production, might:
Provide Power Quality Engineers with the information to diagnose voltage problems.
Assist Asset Planners to proactively repair or replace assets before voltage-related issues occur.
Assist Planning and Distribution Operations Engineers to evaluate specific DG assets and
understand the current and future impact of them on the distribution system.
3.2 Project Objective
The goal of this demonstration project was to utilize the voltage measurement capabilities of PG&E’s
SmartMeter™ network5 and SCADA to monitor DG output and evaluate voltage fluctuations in terms of
the likelihood they were caused by the intermittent nature of distributed renewable resources. The
objectives were to show the evaluation/calculation capability to determine whether high penetration
DG is having the expected Rule 2 (High/Low Voltage Violation) impacts. The end result would be to show
the potential for analytics to provide tools to help power quality, distribution planning, asset
management and distribution operations engineers understand and predict voltage problems caused by
DG. Specifically, the project set out to try and answer two questions:
4 Pacific Gas and Electric Company, "ELECTRIC RULE NO. 2, DESCRIPTION OF SERVICE," San Francisco, California.
5 The PG&E SmartMeter™ network is proprietary automated metering infrastructure (AMI).

EPIC 2.04: DG Monitoring and Voltage Tracking Final Report
7
1. Voltage problems that may be caused by DG: How likely is it that a particular voltage problem
was caused by DG, given system and circuit loading conditions, and several other contributing
factors, at the time the incident occurred?
2. DG that may cause voltage problems: How likely is it that a particular DG output may cause
voltage variations, or undesired variations at the customer end, given system and circuit loading
conditions and other contributing factors?
3.3 Project Scope
This project was to develop a prototype voltage monitoring and tracking model that would analyze the
likelihood that voltage disruptions are caused by (or may in the future be caused by) DG in the PG&E
system. This project applied estimated PV generation and other analytical models to assess how DG
contributes to voltage issues experienced on the PG&E distribution system. The software developed was
a stand-alone prototype product, not intended to be integrated into the PG&E systems at this time. The
development leveraged all available data as well as subject matter experts’ (SME) domain knowledge to
provide an information tool for PV Voltage Monitoring and Tracking.
3.4 Project Approach, Deliverables, Milestones and Tasks
This project was organized in three concurrent work streams, each of which is presented in further
detail in this report:
1. Work Stream A: Data Management
This work stream included data source review, data structure design, software architecture
design, data interface design, hosting design, data management development, data loading
testing and validation, software integration, testing and deployment.
2. Work Stream B: Analytics
This work stream included SME interviews, literature research, rule and model design, analytical
algorithm development, simulation testing and optimization.
3. Work Stream C: Visualization and Stakeholder Review
This work stream included the visualization requirements specifications, delivery mechanism
design, revisions as required, presentation layer development, and enhancements. The end
result was a working prototype that was used to review the value of information to
stakeholders.
Refer to Figure 1 to see the relationships of the three work streams.

EPIC 2.04: DG Monitoring and Voltage Tracking Final Report
8
Figure 1: Relationships of Work Streams
Major milestones in the course of the project were:
1. Design completion for the analytical model and the visualization prototype.
2. Validation of the analytical model and delivery of a working prototype.
3. Completion of stakeholder review meetings and compilation of findings and recommendations.
Data Management Analysis

EPIC 2.04: DG Monitoring and Voltage Tracking Final Report
9
Work Stream A: Data Management 4
Early on in project scoping, the project team determined that the level of data needed would require a
larger data and analytics platform investment to cost-effectively construct a solution that would be able
to efficiently update over time. Prior to a PG&E implementation of this platform, the project team
focused on creating the necessary analytics using historical data files, which may then be adapted to a
more robust data platform when one is available.
In this work stream, the team loaded and reviewed the raw data sources within PG&E. They also created
the data structure design and data management requirements. The architecture design and hosting
requirements were also completed. Finally, testing and optimization were done prior to integrating the
algorithms into the visualization platform.
4.1 Data Sources
The following is a table of PG&E data sources used in the analytical model. Historical data was collected
for a period of one year.
Table 2: PG&E Data Sources PG&E Data Source Data Acquired
SmartMeter™ Interval Data
Fifteen minute or hourly interval data was extracted from Teradata, Inc.1 data warehouse.
The data used by the analytic model included meter identification, service point identification, time (of poll), volume readings (per channel), measurement types (per channel e.g., kVAR, kWh, kV), and a reading flag (e.g., actual or estimated)
Meter and Account Events
SmartMeter™ interval data was used to identify changes to customer accounts
SmartMeter™ Voltage Measurements
Voltage data was extracted from the data warehouse
Customer Billing Monthly usage data used for billing was acquired from the customer billing system for those accounts with analog meters
PV Output Forecast / Estimation, and PV Installation Information
Provided by PG&E Meteorology
SCADA Measurements SCADA time series voltage data from EDPI was used for breakers, reclosers, and regulators
Distribution System Impedance Models
The CYMDIST™1 models were used to run power flows of the feeders
Circuit Topology and Asset Information
A flat file of GIS information was extracted from EDGIS
ILIS: Abnormal States Historical Records
De-normalized data (to maintain the data history) was extracted from the Integrated Logging Information System (ILIS). It included all outages (planned/unplanned, sustained/ momentary), as well as switching steps. Abnormal states were inferred from switching steps data
4.1.1 Incomplete Data
Pre-processing of data provided by PG&E showed that interval, Process Intelligence (PI) and voltage
data are missing for some service points or it is partially available (missing for several intervals).
Also, the first recorded PI data was not coincident with the other data sets. As a result, the related

EPIC 2.04: DG Monitoring and Voltage Tracking Final Report
10
input was not available for the fuzzy model. This issue was mitigated for the cases where missing
data does not have high impact, e.g., feeder loading, and where the quantity was not significant the
fuzzy model was revised to ignore the input when data was not available and calculate the likelihood
based on the available inputs.
If the data was estimated to have a high potential impact on algorithm results, but was not available
for several intervals, estimations were made for the data when applicable. For example, in order to
calculate secondary PV penetration, secondary peak load data was required. When this data was not
available due to missing customer loading data, secondary transformer rating was used as an
alternative for peak load.
4.2 Hardware and Software
The acquired data was transferred to PG&E’s ESFT6 server where it was held for transfer over secured
networks to the remote server hosted off site to conduct this technology demonstration. PG&E accesses
the application web site using a secure HTTP connection. The connection to the site is encrypted and
authenticated using a strong protocol (TLS 1.2), a strong key exchange (ECDHE_RSA with P-256), and a
strong cipher (AES_128_GCM).
Implementation of the architecture relied on Open Source Software (OSS), specifically: R, designed for
statistical computing and graphics; and Octave, which is high level interactive software designed to
perform complex numerical computations.7 R was used to import data to the model and to provide the
data structure for visualization of findings. Octave processed the data through the rules into the fuzzy
logic sets to produce the results. The results were displayed on Google Maps™.
6 ESFT (Electronic Secure File Transfer) is a secure file transfer system used by PG&E to share data with external
servers. 7 L. Markowsky and B. Segee, “The Octave Fuzzy Logic Toolkit,” in Open-Source Software for Scientific Computation (OSSC), 2011 International Workshop on, 2011.[8]

EPIC 2.04: DG Monitoring and Voltage Tracking Final Report
11
Key Definitions
Crisp value: a value that is a member of a
set or not, e.g., true or false.
Fuzzy Set: fuzzy sets are made up of values
that are only partially in the set.
Fuzzy linguistic variable: a variable stated in
terms of words rather than numbers,
i.e., near or far rather than 10 feet or
500 feet.
Membership function: a value assigned to
each member of a set to reflect the extent
of its membership within the set, usually
ranging from 0 (not a member of the set)
to 1 (a member of the set).
Fuzzy inference: the process that maps,
based on a set of rules, fuzzy sets to
outputs to create crisp values.
Defuzzification: the process of producing a
quantifiable result in crisp logic, given fuzzy
sets and corresponding membership
degrees.
Fuzzy rule: a fuzzy rule is written as If this
situation Then that conclusion.
Work Stream B: Analytics 5
This work stream included the collection of SME knowledge and expertise and the conversion of that
information into quantifiable values to add to the analytic model. Those values were then used in
conjunction with the PG&E data. This section of the report provides a description of the analytical model
developed using fuzzy logic methodology. It describes the analytic decision factors identified by the
SMEs in determining and analyzing DG voltage violations, or potential voltage violations; the conversion
of those decision factors to values described as “rules;” and an overview of the simulations used to
verify results.
5.1 Overview: DG Voltage Monitoring and Tracking Analytics
5.1.1 Fuzzy Logic Background
In the early 1960s, L.A. Zadeh introduced fuzzy sets8 to
model uncertainties in engineering systems with the
emphasis on the uncertainties that commonly arise in the
human thought processes. The main components of a fuzzy
model are membership functions and rules. Experience and
preference are converted to membership functions and
relationships are expressed as rules through IF-THEN
statements. Such rules can be developed through expert
knowledge or as the result of a previous fuzzy logic process.
Fuzzy logic incorporates theory, knowledge, or a heuristic
approach into decision-making tools and controllers. Fuzzy
logic typically is used in cases where a detailed system
model is not available or a system is difficult to model and
precise control is not required. The linguistic control rules
enable a controller design without developing the system
model. The main challenge is in defining adequate rules
that describe system behavior.
5.1.2 Fuzzy Logic Methodology
This section provides a brief description of the fuzzy logic
methodology and related terminology used to develop the
analytical model central to the DG Voltage Monitoring and
Tracking tool.
8 L. A. Zadeh, "Fuzzy Sets," in Information and Control, 1965.[2]

EPIC 2.04: DG Monitoring and Voltage Tracking Final Report
12
Simplistically, fuzzy logic converts a set of input values, referred to as “crisp values,” into a fuzzy set
using fuzzy linguistic variables, fuzzy linguistic terms, and membership functions. This conversion is
called fuzzification. For this project, fuzzification took the crisp values (the data listed in Section 2)
from PG&E databases. That data was then converted into a fuzzy set of variables or rules—as
defined by the SMEs for analysis of DG voltage monitoring and tracking. The crisp (raw) data
becomes fuzzy when merged with the set of the SME defined variables An example of a linguistic
value is describing PV Penetration on the Primary Feeder as “small” rather than as a numeric value.
(These values are described in more detail in Section 5.2.1 Identification of Potential Decision Factors
or Parameters.)
The membership function is a measure, typically between 0 and 1, of how close each variable is to
the set (rule) with which it is associated. Within the algorithm, those values, derived from SMEs and
research, are used as inputs in estimating the likelihood any voltage violation (recorded or potential)
was DG related. For example, one of the variables in the analytical model is feeder length: short,
medium or long. Long feeders have a low membership value (i.e., zero) up to 10 miles, and
maximum membership value (i.e., one) beyond 20 miles. Inversely, the short feeder has a high
membership level (i.e., one) up to 10 miles in length. This rule, in other words, indicates that DG
located on feeders up to 10 miles or more than 20 miles long have the greatest likelihood of being
the source of a voltage violation.
Fuzzy inference then is made based on a set of rules, resulting in a fuzzy output that is mapped to a
crisp output using a membership function. In other words, the analytical model takes the raw data,
merges it with the converted SME knowledge and expertise, and then relates both to the value set
defined by the membership function to produce a value. For this project, the value is the likelihood9
that one or more voltage violations are the result of DG or the likelihood added DG load has the
potential to cause voltage violations. This last step is the defuzzification process which translates the
analytical output back into a standard category descriptor.
A simple analogy for how fuzzy logic works is to think about how a doctor might go through the
process of diagnosing a patient. Imagine a patient at the doctor whose blood pressure reading is
considered too high. The doctor knows that there might be several factors (age, weight, genetics,
medications, time of day), but she does not put those numbers into a regression. Instead, she
mentally groups those variables and draws out the likely key drivers in order to make her best
judgement about the root causes of the problem.
9 The term likelihood in this report is used to reflect a low/medium/high rating based on the membership function
results. It is not meant to imply statistical significance.

EPIC 2.04: DG Monitoring and Voltage Tracking Final Report
13
5.2 Analytic Model Development Steps
5.2.1 Identification of Potential Decision Factors or Parameters
The first step in the fuzzy model development was identification of inputs and outputs, e.g., what
data was required to enable the model to deliver clear information as to the impact of DG on
voltage. Interviews were held with utility SMEs both internal and external to PG&E. Literature
review was next sourced to find key parameters.
The project team created rules based on SME feedback and research in the literature, and then
categorized the inputs into four areas: grid, PV, topology and environmental conditions.
PV can affect the electric system on both the primary and secondary circuits. The four input
categories were further categorized as primary and secondary related input variables. In order to
reduce the complexity of the fuzzy model in the implementation phase, inputs were further
identified as Time Dependent (dynamic) and Time Independent (static) variables. Then, the fuzzy
model was implemented in two stages based on time dependency categories. The key identified
input variables are shown in the two tables below.
Table 3: Time Dependent (Dynamic) Fuzzy Model Inputs
Category Primary Distribution - Variables Secondary Distribution - Variables
Grid-Related 1) Feeder Loading: percent of peak load 2) LTCs, line regulators and capacitors
1) Service Transformer: percent of nameplate capacity 2) Level of voltage violation at customer location: percent of VV from nominal voltage 3) Duration of voltage violation 4) Number of customers affected at secondary circuit
PV-Related Actual PV generation: kWh
Environment-Related
1) Date and time: daylight hours 2) Average solar radiation in the feeder
1) Date and time: daylight hours 2) Average solar radiation in the feeder
Table 4: Time Independent (Static) Fuzzy Model Inputs Category Primary Variables Secondary Variables
Grid-Related LTCs, line regulators and capacitors: voltage regulation capability: aggregated PV capacity in the feeder or feeder peak load
Customer voltage at system peak load condition with low or no PV
PV-Related 1) PV farm rated size (if any): farm name plate 2) PV farm location on the feeder (if any): distance to voltage regulating device
PV penetration of the secondary circuit
Topology-Related
1) Feeder conductor type (average impedance/mile: conductor type 2) Feeder length

EPIC 2.04: DG Monitoring and Voltage Tracking Final Report
14
5.2.2 Establish Fuzzy Membership Functions and Rules
The next component in development of this fuzzy model was to form general membership functions
for the fuzzy inputs and then determine parameters. Membership function parameters were based
on SME experience, SmartMeter™ data review, OSIsoft PI,10 PV output estimates, and the topology
of feeders selected for the demonstration project.
The total number of inputs are too numerous to show here (See Appendix B for a full list of inputs).
A sample output of selected membership functions for PV generation and solar radiation are shown
in Figure 2 and Figure 3 below.
Figure 2: Membership Function for PV Generation
Figure 3: Membership Function for Solar Radiation
At this point in the analytics development, the fuzzy inputs have been identified, then categorized
into four areas, and finally further categorized as primary and secondary circuits. The inputs were
then identified by their time dependency (static or dynamic) to enable two-stage implementation of
the model. Membership function parameters for each input were identified.
10
PI refers to historical data that has been systematically collected for analysis; feeder loading and voltage historical data in this case.
De
gre
e o
f M
em
be
rsh
ip
Solar Radiation (Wh/m2)
PV Generation (kWh) Corresponding Fuzzy Input Value <4 Small
8-Apr Medium
>8 Large
Solar Radiation (Wh/m2) Corresponding Fuzzy Input Value <400 Low
400-800 Medium
>800 High
De
gre
e o
f M
emb
ersh
ip
PV Generation (kW)

EPIC 2.04: DG Monitoring and Voltage Tracking Final Report
15
Next, fuzzy rules were developed. Min-Max11 scaling was used for the rule interface method. The
Centroid Method was used for defuzzification.12 Min/max and Centroid are both common methods
used in Fuzzy models. Min/Max is used when combining rules (Max for “Or” and Min for “and”).
Examples of alternatives to Centroid include: Left Most Maximum, Right Most Maximum, and
Middle of Maximum. The project team chose Centroid after looking for aggregation impact of
all inputs.
A total of 37 rules were developed to perform the analytics for this tool. These rules are organized
into four categories: grid (primary and secondary) related, PV related, topology related and
environmental conditions related. Each rule number is preceded by an alpha reference to identify
the circuit type, primary (P) or secondary (S) or environmental conditions related (E). A list of the
rules used in this project is included in Appendix C. A complete description of all of the rules
developed as part of the analytics is included in Appendix B. Eleven of these rules, presented as
“Additional Rules” in Appendix B, were not used in this demonstration project, as the data was not
available at that time. The following are two examples of the rules developed:
P8: If the PV penetration of the secondary circuit is Small/Medium/High, then the likelihood
of PV-caused voltage problem is Low/Medium/High.
S8: If PV generation is small/medium/large then the likelihood of PV-caused voltage problem
is low/medium/high.
Appropriate weights were applied to rules based on the importance of the rule. Rules also were
combined with “and” to include more specific criteria in some cases. Because not all data inputs
were available for every asset, the rules and weighting of rules is different for different assets.
5.2.3 Fuzzy Model Implementation Approach
Fuzzy logic analytics can be very complex with a large number of inputs. For example, a fuzzy model
with 12 inputs and 2 membership functions for each input would result in 212= 4096 fuzzy if-then
rules. This problem can be alleviated by choosing appropriate membership functions and designing a
collection of fuzzy if-then rules. In addition, depending on the problem, other techniques can be
used to reduce the complexity of fuzzy model. To reduce the complexity of fuzzy model in this
project, the Time Dependency attribute of inputs was used to split the fuzzy model into two
sub-models.
In the proposed two sub-model fuzzy logic model, Time Independent (static) variables and rules
were processed at the sub-model 1. The fuzzy output result from the first sub- model was added to
the second stage as an aggregation of Time Independent variables, in addition to Time Dependent
(dynamic) variables. The main advantages of the two sub-model designs are:
11
Data is scaled to a fixed range, typically 0 to 1. Often referred to as “normalization” of data. 12
This method returns the center of area under the curve.

EPIC 2.04: DG Monitoring and Voltage Tracking Final Report
16
Reduction of number of inputs and complexity, where the total inputs with available data
were split into 14 Time Dependent and 13 Time Independent variables.
The rules with Time Independent variables were processed offline, while the rules with Time
Dependent variables were processed when the data was updated. This reduced the online
calculation time.
Debugging and tuning the membership functions were facilitated. The first stage results
were confirmed and reviewed before the second stage was implemented.
The overall scheme of the two submodules fuzzy logic engine is shown in Figure 4 below.
Figure 4: Two Submodule Fuzzy Model
Rule 1
Rule 2
Rule 3
Time Independent Inputs
- Distance from s/s - Line impedance - Feeder
configuration - Capacity - % Penetration - Voltage
regulation device - Smart inverter
- More …
Fuzzy Logic
Submodule 1
Results
Rule 1
Rule 2
Rule 3
Time Dependent Inputs
- Date and time - Actual PV generation - Feeder loading - Coincidence of PV
peak and feeder loading peak
- Voltage at load side of LTC or line regulator
- More …
Fuzzy Logic
Submodule
2
Results

EPIC 2.04: DG Monitoring and Voltage Tracking Final Report
17
Rules were processed in a hierarchical order within each fuzzy logic submodule, as depicted in
Figure 5 and Figure 6 below, to further reduce the complexity of process.
Figure 5: Fuzzy Submodule1 – Inputs in Hierarchical Order
Figure 6: Fuzzy Submodule 2 – Inputs in Hierarchical Order
5.2.4 Fuzzy Logic Analytics Simulation
The DG Voltage Monitoring and Tracking tool was tested and verified by historical data as well as
power flow simulation. The purpose of the simulation step was to validate the efficacy of the fuzzy
logic rules, and therefore the results produced by the analytic model. The simulation step used
scenarios designed to test the fuzzy logic rules, distribution system modeling software
Layer 2
• Output of Layer 1
• E2. Solar Radiation
• E3. Clear sky Index
• S8. Actual PV
Generation
Layer 3
• Output of Layer 2
• P3. Coincidence of PV peak and feeder loading peak
• P5. Voltage at the Load Side of LTC or Line Regulator
• S1. Service Transformer Loading
• S2. Customer Loading
• P2. Feeder Loading
• P1. CVR/VVO
• S4. Level of Voltage Violation
• S5. Duration of Voltage Violation
• S6. Number of customers affected
Layer 1
• E1. Date
and Time

EPIC 2.04: DG Monitoring and Voltage Tracking Final Report
18
(e.g., CYMDIST™),13 PV load modeling used by PG&E, and historical data records. The simulation
methodology consisted of three parts:
1. Identify specific historical voltage violations where DG was the cause of the voltage
violations.
2. Specifically determine if concentrated DG output in one area could cause primary voltage
violations in hypothetical scenarios.
3. Validate the ability of the tool to predict future voltage violations given estimated PV
generation level.
A single feeder, from the 38 PG&E feeders included in this project, was chosen for simulation. It was
selected because it had complete loading data in CYMDIST™. It also had sufficient records of voltage
violations that may have been DG related. The simulation attempted to recreate the operational
conditions that led to the voltage violations using measurement data from operations (SCADA and
SmartMeter™) and the CYMDIST™ feeder model.
The CYMDIST™ feeder model file contained only primary grid model information with DG output
aggregated at the service transformers. There was insufficient information on secondary conductor
impedance, conductor length and service point (SP) coordinates where SmartMeter™
measurements were taken. Using the fuzzy logic algorithm helped overcome this limitation by
incorporating the available measurement and primary feeder topology data to estimate the DG
impact on voltage violations.
The first part of the simulation validated that historical voltage violations were related to DG, and
confirmed the fuzzy model rule that DG size could affect the secondary current flow, which may
cause voltage violation depending on secondary conductor impedance.
The simulation validation also disclosed exceptions and discounted large DG as not contributing to
voltage violations, assuming interconnection studies and connection to the primary were required
for the large DG the simulation. As a result, the membership level of large DG (rated more than
25 kW) was adjusted in the analytical model.
The hypothetical scenarios (to determine if concentrated DG load in one area could cause voltage
violations on the primary) used a section of the feeder that had many DG units installed. All existing
DG units were increased to 50 kW and additional DG units with 50 kW capacity also were simulated
in the feeder section. In all cases, the reverse power flow in the primary grid from the secondary did
not cause voltage violation in the primary grid. The scenarios did confirm that DG size could affect
the secondary current flow, which could cause a voltage violation.
13
CYMDIST™ is distribution system analysis software used by PG&E for planning purposes, including DG locations and DG capacity records.

EPIC 2.04: DG Monitoring and Voltage Tracking Final Report
19
The predictive capabilities were validated by creating a scenario in which all regulator voltage taps
were set to nominal voltage and secondary voltages at the service points estimated. For the
violation predictions, all regulator voltage taps were set to the nominal voltage to get the primary
voltages and currents with predicted PV output and historical loads. The typical range of secondary
conductor impedance was from 0.05 Ohm to 0.2 Ohm, so that the secondary voltages at the service
point could be estimated. The simulation verified the fuzzy logic rules and returned a valid range of
possible outcomes for the likelihood specific DG would impact voltage levels.
5.2.5 Fuzzy Logic Analytics Implementation Output
The fuzzy logic analytical model was incorporated into the DG Voltage Monitoring and Tracking tool,
which included 38 selected PG&E feeders. Selected fuzzy inputs with high impact, Time Dependent
and Independent variables, and the likelihood of DG-caused voltage violations (VV) for selected
service points and time intervals are shown in Table 5. Overall, service points in feeders with higher
penetration of PV and longer length have a higher time independent index. Secondary PV
penetration, voltage regulation capability and distance from regulators are the next inputs
impacting the time independent index. For Time Variable inputs, average solar radiation in the
feeder is a key input because it is an indication of weather condition. Next, actual PV generation in
the secondary circuit where customer located is important. High PV generation in the secondary
circuit may cause reverse power flow. Also, low feeder loading with high PV generation in the feeder
may cause reverse power flow. VV duration is also a decision factor since long consecutive VVs are
less likely to be caused by PV. Finally, since overvoltage VV is caused by reverse power flow, it does
not affect a large number of customers.
First, Time Independent inputs were applied to sub-model 1 (Figure 5: Fuzzy Submodule1 – Inputs in
Hierarchical Order). The output, Time Independent Index was calculated in (%) and imported to the
second sub-model. Next, the fuzzy model was implemented for sub-model 2 (Figure 6: Fuzzy
Submodule 2 – Inputs in Hierarchical Order).
The output from sub-model 2 was the likelihood of DG-caused VV. Time Independent inputs shown
in the table include DG penetration for primary feeder and secondry circuits, voltage regulation
capability of feeders, estimated feeder length and distribution transformer distance from the
upstream voltage regulator.
The table below shows some sample information for specific points in time for specific meters. Each
of the values for the variables are put into an equation that weighs their importance and calculates
an estimated likelihood that a violation was or will be caused by DG. The numbers in the table
demonstrate the relative value of different inputs for each case compared to other cases. For
example, one can see that the rule “Number of PVs in the Secondary with VV” was more important
for the case in Row 3 than for the cases in the other rows.

EPIC 2.04: DG Monitoring and Voltage Tracking Final Report
20
Table 5: Fuzzy Inputs and Output for Selected Service Points and Intervals
Time Dependent Variables Time Independent Variables Output D
ate
& T
ime
Serv
ice
Po
int
ID
Tran
sfo
rme
r ID
Vo
ltag
e
VV
Du
rati
on
(h
r)
# o
f SP
s in
th
e
Seco
nd
ary
wit
h V
V
Tota
l PV
Ge
ne
rati
on
in t
he
Se
con
dar
y
(kW
) A
vera
ge S
ola
r
Rad
iati
on
in t
he
Fee
de
r (W
h/m
2)
Fee
de
r Lo
adin
g (%
)
Pri
mar
y P
en
etr
atio
n
(%)
Seco
nd
ary
Pe
ne
trat
ion
(%
)
LTC
s, li
ne
re
gula
tors
and
cap
acit
ors
Esti
mat
ed
Fe
ed
er
Len
gth
(m
ile)
Dis
trib
uti
on
Tra
ns.
Dis
t. F
rom
th
e
Up
stre
am V
olt
age
Re
gula
tor
(Oh
m)
Tim
e In
de
pe
nd
en
t
Inp
uts
Ind
ex
(%)
Like
liho
od
of
PV
-
Cau
sed
VV
(%
)
06/29/2016 at 1500
SP1 T1 127 1 3 3.55 918.52 55.55 28.4 15.28 1 9.19 1.8 55.48 39.35
06/29/2016 at 0300
SP2 T1 127.2 1 3 3.55 918.52 55.55 28.4 15.28 1 9.19 1.8 55.48 39.35
12/11/2015 at 1100
SP4 T2 128 11 6 2.38 334.76 12.83 28.4 8.84 1 9.19 0.3 50.9 22.85
02/21/2016 at 1200
SP5 T3 126.2 1 1 25 562.24 3.04 28.4 60.57 1 9.19 0.4 69.27 75.9
11/06/2015 at 1300
SP6 T4 126 1 1 0 581.43 17.07 7.7 0 0 2.9 2.5 25.8 19.92
04/29/2016 at 1100
SP7 T5 126.5 1 4 1.79 760.87 40.75 37.5 16.65 1 31.9 5.3 64.5 30.19
01/15/2016 at 1200
SP8 T6 126.9 4 1 0 344.43 NA 37.5 0 1 31.9 0.6 53.9 9.03

EPIC 2.04: DG Monitoring and Voltage Tracking Final Report
21
Work Stream C – Visualization 6
The platform was displayed via a Google Chrome™ browser using Google Maps™ as the base mapping
system.
6.1 User stories
User stories were created to define the deliverables for the DG Voltage Monitoring and Tracking tool.
Table 6 below includes details on the user stories and the resulting inputs to the visualization prototype.
Table 6: User Stories A user wants to... So that they can... Functionality Added
1. See a high level view of voltage issues
Pinpoint where there are problems, and understand related issues
Map displays one substation and all VVs within that substation were displayed. Also, bar charts showed VV counts per feeder
2. See voltage violations by geographic location
Investigate specific problems and reduce time to resolution
Map display
3. Search asset by asset number
When a customer calls with an issue, see VVs on that asset at a specific time, and whether it is caused by PV. Also valueable to look at trends for that asset over time (enables better dispatch decision-making)
Entered number in asset selection box
4. See voltage issues at a feeder level Review the relationship of PV to voltage violations to understand cause
User can select one or more feeders and display all associated service points. Also, bar charts for counts per feeder
5. Drill down to transformer or asset level to look deeper at voltage violations
Troubleshoot / understand if PV-related
Various ways to display VV details for substations, feeders, or SP asset data
6. See voltage deviations Better understand how PV may be impacting voltage for specific assets
Voltage trending chart
7. Filter information by geographic division
Look for issues in a specific area Menu selection (top left of page)
8. See voltage violations at a single point in time, over time
See violations at a single point in time to review related issues at that same point in time. Want to view violations over time to understand history of violations and relationship to PV
Map, bar charts, and table showed VV at a single point in time. Voltage trending chart showed VV over time
9. Drill down to specific locations to see information about a particular area
Understand how PV may be impacting violations for specific assets
User can zoom in and out on the map
10. See severity of voltage violations as a percentage of nominal (e.g., 105%) or absolute voltage (e.g., 126 V).
See both voltage representations Details for VV show both values

EPIC 2.04: DG Monitoring and Voltage Tracking Final Report
22
A user wants to... So that they can... Functionality Added
11. Drill down to a specific problem Accelerate identification and initiation of repairs
Various ways to display VV details for substations, feeders, or SP asset data
12. Immediately see transformers that are having problems
Better troubleshoot voltage violations
Transformers are displayed on the map with nearby violations
13. See number of meters in violation and see number of violation counts
Both are important, but # of meters in violation is more important than # of violations to investigate issues
Bar charts display both violation counts and meter counts
14. See meters in violation at a particular time
Understand customer complaints at a specific time, or investigate VV at a specific time
Map display
15. See meters in violation caused by PV Determine best approach to solving the issue
Map display
16. See that PV generation data is labeled as “estimated”
Ensure that the end-users expectations are set when basing decisions on information displayed
Display Estimated PV Generation in trend chart
17. See voltage violations at the feeder level for a particular point in time, aggregated by feeder.
Understand violations at the feeder level
Bar charts
18. Find out whether PV is on for a location at a certain time
Helps understand if PV is a factor Estimated PV output trending chart
19. Identify whether issues are caused by a primary issue
Understand primary issues Not applicable to this project
20. Jump to time and location to drill-into a specific known event as indicated by a customer
Reduce resolution time and costs Map display
21. View PV output, over time, for all customers on a transformer, coincident to voltage on a particular meter (show transformer PV output under voltage time series)
Find out whether the customer or another customer on a transformer is causing their own problem
Trending chart
22. View substation bank loading over time coincident with voltage over time (show bank loading time series under voltage time series)
Better compare substation bank loading with voltage
Trending chart
23. View customer load over time coincident with voltage of time (show customer loading time series under voltage time series)
Better compare customer load with voltage
Trending charts
24. Don’t need to see delta V for meter Reduce information displayed Not shown
25. Want to see trend of violations over time for groups of meters
Drill-down from the top level to specific issues
Trending charts allow multiple meters to be displayed
EPIC 2.04: DG Monitoring and Voltage Tracking Final Report
23
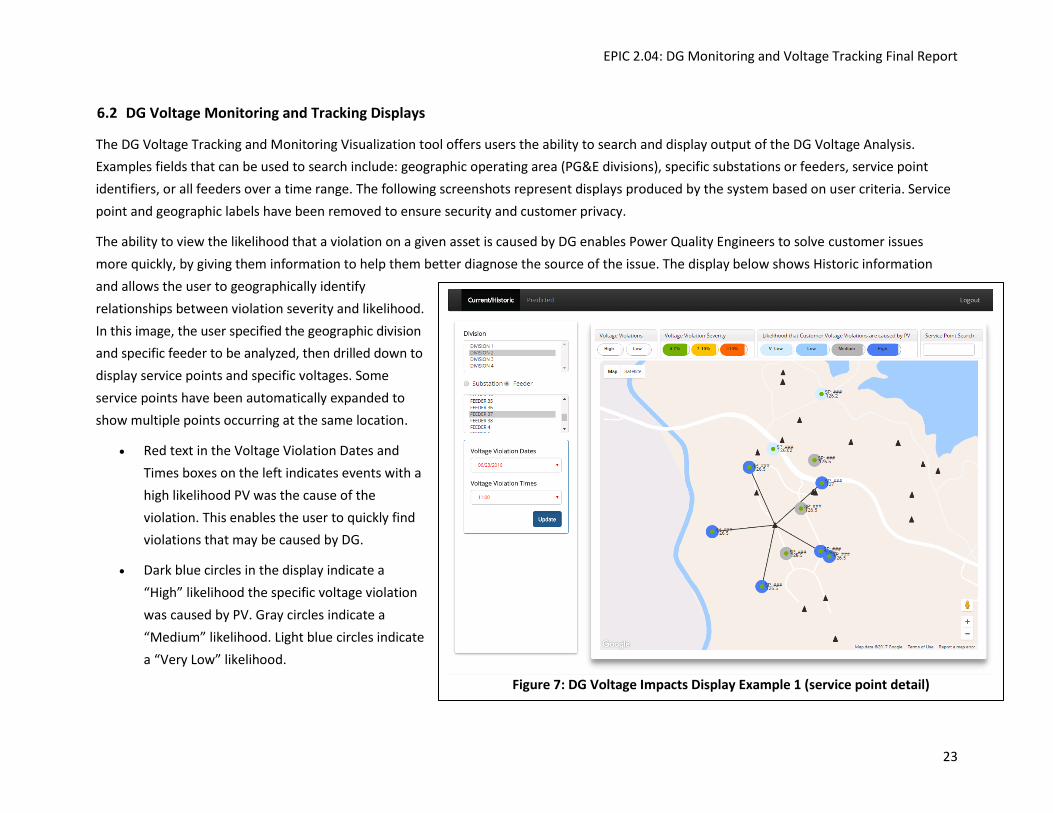
Figure 7: DG Voltage Impacts Display Example 1 (service point detail)
6.2 DG Voltage Monitoring and Tracking Displays
The DG Voltage Tracking and Monitoring Visualization tool offers users the ability to search and display output of the DG Voltage Analysis.
Examples fields that can be used to search include: geographic operating area (PG&E divisions), specific substations or feeders, service point
identifiers, or all feeders over a time range. The following screenshots represent displays produced by the system based on user criteria. Service
point and geographic labels have been removed to ensure security and customer privacy.
The ability to view the likelihood that a violation on a given asset is caused by DG enables Power Quality Engineers to solve customer issues
more quickly, by giving them information to help them better diagnose the source of the issue. The display below shows Historic information
and allows the user to geographically identify
relationships between violation severity and likelihood.
In this image, the user specified the geographic division
and specific feeder to be analyzed, then drilled down to
display service points and specific voltages. Some
service points have been automatically expanded to
show multiple points occurring at the same location.
Red text in the Voltage Violation Dates and
Times boxes on the left indicates events with a
high likelihood PV was the cause of the
violation. This enables the user to quickly find
violations that may be caused by DG.
Dark blue circles in the display indicate a
“High” likelihood the specific voltage violation
was caused by PV. Gray circles indicate a
“Medium” likelihood. Light blue circles indicate
a “Very Low” likelihood.

EPIC 2.04: DG Monitoring and Voltage Tracking Final Report
24
The color of the centers of the circles indicates the voltage violation severity.
The map view also lets the user view related issues at the same point in time to better understand what is causing the problem.
A grid operator may care specifically about the voltage violation at a certain service point (a home or business). Understanding PV capacity and
estimated PV output at a given time gives the user more detailed information in understanding the likelihood a violation is caused by PV.
Without leaving the display from Figure 7, she may right-click on a service point to view details related to that service point as shown in Figure 8
below. The top three rules that support the likelihood estimation are provided so that the user can better understand the related details for the
estimation, and make a more informed decision on how to take action.
Figure 8: DG Voltage Impacts Display Example 2 (service point detail)

EPIC 2.04: DG Monitoring and Voltage Tracking Final Report
25
The user has the option to review the relative impact of the fuzzy logic rules used to determine the likelihood of DG related voltage violations as
shown in Figure 9 below. This gives the user valuable insight into which rules provide the greatest contribution to likelihood as well as the
relative contribution between individual rules and groups of rules. If the user is not sure about the likelihood prediction and wants to drill down
further to understand the details related to the particular asset, this information can provide further knowledge to make decisions on the course
of action to solve the violation.
. Figure 9: DG Voltage Impacts Display Example 3 (calculated likelihood rules)

EPIC 2.04: DG Monitoring and Voltage Tracking Final Report
26
Determining whether a violation is recurrent or intermittent aids in the diagnostic process and reduces the time to mitigation. If this is a new
violation, there is a greater chance it comes from a traditional source of voltage problems, like a loose wire. If the same violation occurs every
day around noon, there is a greater chance it is due to PV generation. The user can display Point in Time charts and tables for the selected feeder
or substation, date and time. The voltage per feeder bar chart in Figure 10 below shows the counts of violations by severity (5%-7%, 7%-10%, or
>10%) and likelihood (very low, low, medium or high). This helps the user troubleshoot violations by understanding if there are multiple related
violations at the feeder level.
The table below lists the top
five likelihoods where DG was
the source of voltage
violations. This enables the
user to quickly focus on the
top assets where there is a
highest likelihood that DG is
causing violations. The user
was able to display the voltage
violations over one week
trending chart by clicking on
the bar chart (shown in lower
right).
Figure 10: DG Voltage Impacts Display Example 4 (point in time charts)
EPIC 2.04: DG Monitoring and Voltage Tracking Final Report
27
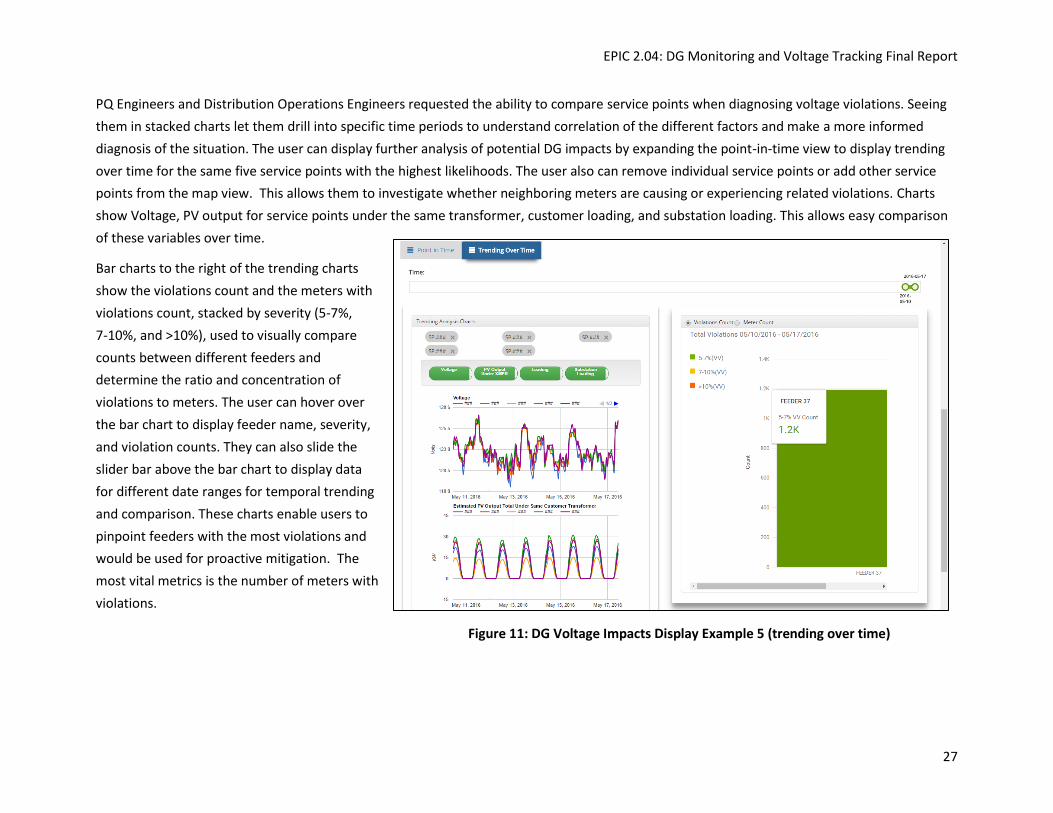
PQ Engineers and Distribution Operations Engineers requested the ability to compare service points when diagnosing voltage violations. Seeing
them in stacked charts let them drill into specific time periods to understand correlation of the different factors and make a more informed
diagnosis of the situation. The user can display further analysis of potential DG impacts by expanding the point-in-time view to display trending
over time for the same five service points with the highest likelihoods. The user also can remove individual service points or add other service
points from the map view. This allows them to investigate whether neighboring meters are causing or experiencing related violations. Charts
show Voltage, PV output for service points under the same transformer, customer loading, and substation loading. This allows easy comparison
of these variables over time.
Bar charts to the right of the trending charts
show the violations count and the meters with
violations count, stacked by severity (5-7%,
7-10%, and >10%), used to visually compare
counts between different feeders and
determine the ratio and concentration of
violations to meters. The user can hover over
the bar chart to display feeder name, severity,
and violation counts. They can also slide the
slider bar above the bar chart to display data
for different date ranges for temporal trending
and comparison. These charts enable users to
pinpoint feeders with the most violations and
would be used for proactive mitigation. The
most vital metrics is the number of meters with
violations.
Figure 11: DG Voltage Impacts Display Example 5 (trending over time)

EPIC 2.04: DG Monitoring and Voltage Tracking Final Report
28
Operations Engineers are interested in understanding potential future voltage violations to help them create more informed switch plans. In the
future, Asset Planners may also use predicted voltage violations caused by DG to help recommend and/or approve DG siting.
The Predicted tab in the display below shows the likelihood voltage violations may be caused by PV for future dates and times for a selected
geographic area, substation or feeder. The user can click on Likelihood buttons to toggle display of likelihoods, or search by service point
identification number. The user can click on a service point to see details about that SP in predictive display, just as in the current/historic
display. The user can also see point in time and trending over time charts, similar to those in the current/historic display.
Figure 12: DG Voltage Impacts Display Example 6 (predicted VV on map display)

EPIC 2.04: DG Monitoring and Voltage Tracking Final Report
29
6.3 User Evaluation
Reviews of the DG Monitoring and Voltage Tracking prototype tool were held with representatives of
the following user groups: Power Quality, Asset Management Planning, Grid Planning, and Distribution
Operations Engineering and Emerging Technologies. All of the users were positive about the tool and
there was general agreement that this functionality—especially the heat map and the trending charts—
would be valuable for evaluating existing problems. As PG&E evaluates next steps for moving these pilot
results into a production product, and as other utilities look to build off the knowledge sharing coming
from this technology demonstration, there are several areas for improvement identified by the various
users.
The following summarizes specific feedback by user type.
Power Quality (PQ) Engineers
Potential Use: troubleshoot customer issues and proactively find potential issues not initiated by
a customer complaint.
Valued Functionality: ability to search by meter number or transformer number.
Preferred Timeframe: lower priority on the predictive component, except maybe for follow-up
activity. For most investigations, 36 hour old data is acceptable, as well as one year of historical
data for comparison.
Recommendations for Further Development:
o Recommended a slider be added to the map view “to see if the violation changes
at 8:00pm when there is no sun.” If so, this would support the causal relationship with PV.
o A summary of what is causing the violation, indicating whether it is a secondary or primary
problem, and the extent of the problem.
o An additional chart that would include trending for all the meters on the same transformer.
If all the meters on a transformer have violations, it would be valuable to easily navigate to
the next transformer.
o Ability to right-click on a transformer in map view and select “Add All” to populate the
trending chart with all meters on the specific transformer.
o Indicator or icon that shows which meters have DG installed.
o Direction of current: when investigating whether DG is a cause of a voltage violation “a key
ingredient in the equation is current.”

EPIC 2.04: DG Monitoring and Voltage Tracking Final Report
30
Electric Asset Management Area Planning and Tools
Potential Use: Help predict during planning where voltage violations will likely occur due to DG.
This is not yet immediately urgent, because when customers install DG, this group must address
any issues that occur. For large interconnections, PG&E performs interconnection studies to
identify any potential issues that may arise.
Preferred Timeframe: real-time data as close to real time as possible, and six months of
historical data for comparison.
Recommendations for Further Development: Smart Inverter data should be used in a production
model to better understand issues on the secondary network.
Grid Planning
Potential Use: help “decide whether to focus on inverter setting vs. line side mitigations.”
Currently this group is using CYME-brand power engineering models for long term forecasting
and placing new generators.
Valued Functionality: map view, and ability to see magnitude and duration of the violation.
Preferred Timeframe: little interest in predictive; asset planning uses historical seasonal
information and time of day to understand violation patterns, and prioritize them based on
number of violations on a substation.
o Historical data should go back six months, does not need to be fresh (could be a month old)
as long as one can go back to view conditions under a similar season/time of day.
o However, it was noted that higher level distribution managements tools (like a future
DERMS system, might benefit from predictive functionalities.
Recommendations for Further Development: overlay of circuit topology, identify meters with
reverse flow, and aggregated loading from all customers under a single transformer.
o For trending charts, a desire was expressed for a toggle that synchronized charts, and a
radio button to show average trend lines for meters with PV and without.
Distribution Operations Engineering (DOE)
Potential Use: help to understand voltage issues on the primary, and for dispatchers in deciding
whether to roll a truck in response to a voltage violation.
Preferred Timeframe: 36 hours old, with one year of data for comparison, would be sufficient.
Recommendations for Further Development: would need to be integrated with their existing
tools, like the Distribution Management System, to be most effective.

EPIC 2.04: DG Monitoring and Voltage Tracking Final Report
31
Emerging Technologies (ET)
The ET representatives had backgrounds in Power Quality (PQ) and Volt Var Optimization (VVO), so their
recommendations reflect that perspective.
Potential Use: help determine the best locations to install smart inverters for grid services.
Value Functionalities: displaying the relevant rules and weights to understand the reasoning
behind the likelihood calculation.
Recommendations for Further Development:
o Include ability to view the information associated with all the meters associated with a
specific transformer, also adding a confidence level to the likelihood estimation.
o Explore the potential to integrate this with a future DERMS system.
o Add time independent as a line item in the time dependent rule list (so it totals 100%)
o In the likelihood bar chart, add a toggle to select very low, low, medium, or high.
o Ability to print a tabular representation of the bar charts (e.g., print out a list of Service
Point IDs with high likelihood of violation caused by DG).
o Table number and level of violations over time for each meter.

EPIC 2.04: DG Monitoring and Voltage Tracking Final Report
32
Project Overall Results 7
The goal of this demonstration project was to demonstrate that an analytical model could be developed
using SmartMeter™ and SCADA data to evaluate the likelihood that a voltage violation is or will be
caused by DG. Testing of the model accuracy proved that the tool could potentially reduce the number
of manual investigations needed by PQ and Distribution Operations Engineers by as much as 84%.
The expectation was that a visualization tool would be developed to demonstrate the analytical results
with stakeholders and validate the usefulness of the information. Reviews with stakeholders did confirm
the expected potential benefits.
7.1 Technical Results, Findings and Recommendations
7.1.1 Validation of Analytic Model
The analytical model successfully demonstrated the technological capture and integration of
distribution system data (especially SmartMeter™ and SCADA) with the knowledge and analytic
judgement of human expertise. The model proved successful when tested against simulated voltage
violations in CYME. Out of 200 violation cases, 6 were identified correctly as having a high likelihood
they were caused by DG, and the remaining 11 require future analysis for determination:
Table 7: Analytic Model Validation
Analytical Model Prediction # in Each Fuzzy Logic Prediction
Category
# Violations in CYME Modeling for Those
Cases Tested Action
High Likelihood VV Caused by DG 6 6 Upgrade capacity
No Determination 32 11 Further analysis by Engineering
Low/Very Low Likelihood VV Caused by DG
162 0 Send a trouble man
Out of the sample size of 200 violations, 168 of the violations were correctly identified as either high
or low likelihood that they were caused by DG. The status quo is that all 200 violations would have
required further analysis, but in this field demonstration the tool reduced by 84% the set of
violations to manually investigate.
7.1.2 Key Rules for DG Voltage Violation Analysis
For historical violations, it was found that the rules related to PV generation in a secondary, solar
radiation, PV customer loading and duration of voltage violation had the most impact.
For predicting future violations, the likelihood results were limited to PV forecast and topology data
since the main purpose of this portion was to raise alerts for possible voltage problems. The rules
with the most impact for this problem were the PV generation, solar radiation and PV penetration of
the secondary circuits.

EPIC 2.04: DG Monitoring and Voltage Tracking Final Report
33
7.1.3 Large PV Connected to Secondary Circuit
In reviewing historical data, the project team learned that there are very large capacity PV generator
systems connected to secondary circuits without any voltage violations. Prior to that, the
conventional wisdom was that large DG generation has a very high impact on voltage violations.
Further investigation revealed that in most cases large DGs are connected directly to the service
transformer and that is the main reason they do not experience voltage violations. Also,
supplementary interconnection studies may be required for large DGs, depending on the size and
location of connection to the secondary system. Since connection status data was not available for
this project, to avoid false results for large DGs, DG generation systems with capacity above 25 kW
rated size were normalized to 25 kW. With the normalized DG output, the impact of large DGs is not
totally ignored, but reduced to have smaller impact in the analytical model.
7.1.4 Regulator Tap Response Rate
The simulation results showed that the primary grid voltages were mainly affected by the regulator
tap change instead of the concentrated DG units. If the entire feeder had a very high level of DG
penetration, the speed at which the regulator tap reacted to the change of DG output could cause
momentary voltage violations during a period of one or two minutes. However, this simulation could
not be verified without more granular voltage measurement data.
7.1.5 Primary vs. Secondary System Violations
The simulation confirmed that PV-caused voltage violations mainly occurred in the secondary
system. Over-generation from a feeder section could cause reverse power flow in the upstream
primary grid, but the extra PV power flow in the primary grid would not then flow into the
neighboring service transformer and its secondary system. In other words, voltage violations
downstream of a service transformer without a PV unit were unlikely to be caused by the over-
generation of neighboring PV units connected to another service transformer.
CYME simulation was based on Power Flow of the selected feeder. The focus of the simulation was
the over-voltage violations caused by reverse power flow. Since the current flowing back to primary
is small compared to the current at the secondary side, and the low impedance at the primary side,
the voltage rise at the primary side is not significant.
7.1.6 Fuzzy Model Solution and Performance
Due to the large number of fuzzy inputs, it was found impractical to apply all combinations of rules.
Although the approach described in Fuzzy Model Implementation Approach, reduced the complexity
of problem significantly, several rounds of debugging were required to obtain reasonable results.
The debugging process included fine tuning the weights of rules and also combining rules with an
“and” operator if applicable. As an example, even though PV generation was very large in a
EPIC 2.04: DG Monitoring and Voltage Tracking Final Report
34
secondary circuit with voltage violation, if the voltage violation lasted for 15 hours or more it is less
likely that violation could be caused by PV since solar radiation would not be available in the PG&E
service territory beyond a 15-hour time period because the sun is not up that long.
7.2 Special or Unique Technology Implementation Issues
7.2.1 Subject Matter Experts
Development of the analytics for the DG Voltage Monitoring and Tracking tool was reliant upon the
expertise and knowledge of the subject matter experts, and the information captured from an in-
depth search of related literature. Capturing this knowledge and converting it to values that could
be combined with the other raw data to produce intelligent findings was a key component of the
fuzzy analytical modeling in this project. The model was tested and optimized by comparing results
to simulated real results using CYME modeling. Other utilities pursuing this technology should
ensure they are leveraging their internal SMEs throughout the analytics development.
7.2.2 Data Availability Limitations
As described in Section 4, the algorithm developed used a variety of input variables which were
loaded using historical data files. For a production implementation, live data feeds and interfaces to
PG&E systems for both inputs to the model and outputs of the results would be required.
Additionally, some of the decision rules developed after meeting with SMEs required data that was
not available at the time of this project. As a result, the decision factors that did have supporting
data were used as inputs to the fuzzy model and the others are listed for use in future phases of this
project when a larger data and analytics platform is available.
Likely next steps for utilities looking to improve on these pilot results:
Pursue a data analytics platform which would allow cost-effective integration of live data
feeds from and to internal systems.
Explore the potential to expand CYMDIST to include secondary circuit models (this would
likely improve model accuracy).
Provide additional data, such as smart inverter data, required to implement additional rules
identified in Appendix B (this would also improve model accuracy).
7.2.3 Hardware and Software
The relationship between voltage problems in a feeder and DG presence is highly complex, and so
vast amounts of data were required to perform timely and predictive analytics. More than 30 rules
were created to enable processing of this data into useful information. This surfaced a number of
hardware and software requirements for hosting such a system successfully.

EPIC 2.04: DG Monitoring and Voltage Tracking Final Report
35
Table 8: Hardware and Software Results and Learnings Category Findings Actionable Learnings
Geospatial Platform
Google Maps™ was not designed to function at the scale and granularity of data required by this tool. The Google Maps™ application, for example, could not display all of the voltage violations within a geographic division without significant performance degradation. That was 2,000 points in one example.
Next stage development of the DG Voltage Monitoring and Tracking tool should include a base mapping system capable of displaying more than 2,000 points without performance degradation.
Software Architecture
The large volume of data took a considerable amount of time to process and load onto the hosting server. There will be additional challenges integrating this tool with PG&E databases.
For future processing and loading, consider other options for parallel processing and loading to make the data transfer more efficient, including development of a more robust data and analytics platform before scaling this solution.
End User Equipment
The processing speed of users’ computing equipment is important for tool performance, and performance improved greatly when using newer, faster computers. The analytics were designed to parse the data in order to speed processing time, but speed will always be constrained by data refresh rates, users’ computer processing capacity, and the speed of the local communications network. Low-resolution monitors and laptop screens had an impact on user experience and required GUI reformatting. While this project addressed the specific issues identified, it is possible this may be identified as an issue requiring modification in other installations.
An inventory and assessment of computer terminals and displays that ultimately will be used to access the visualizations should be performed in the early stages of the technology implementation to ensure they meet the minimum recommended resolution and reduce the potential for rework.
7.3 Data Access
Upon request, PG&E will provide access to data collected that is consistent with the CPUC’s data access
requirements for EPIC data and results.
7.4 Value Proposition: Primary and Secondary Guiding Principles
This project advances several EPIC primary and secondary principles by creating a tool that will provide
information on the implications of DG on the distribution system. This information, in turn, enables
improved decision making by utility employees. A further benefit is that it also aids PG&E in supporting
expanded adoption of DG while minimizing impact on power quality, and leads to lower Greenhouse
Gas (GHG) emissions.
Table 9 summarizes the specific primary and secondary EPIC Guiding Principles advanced by this
technology demonstration project.
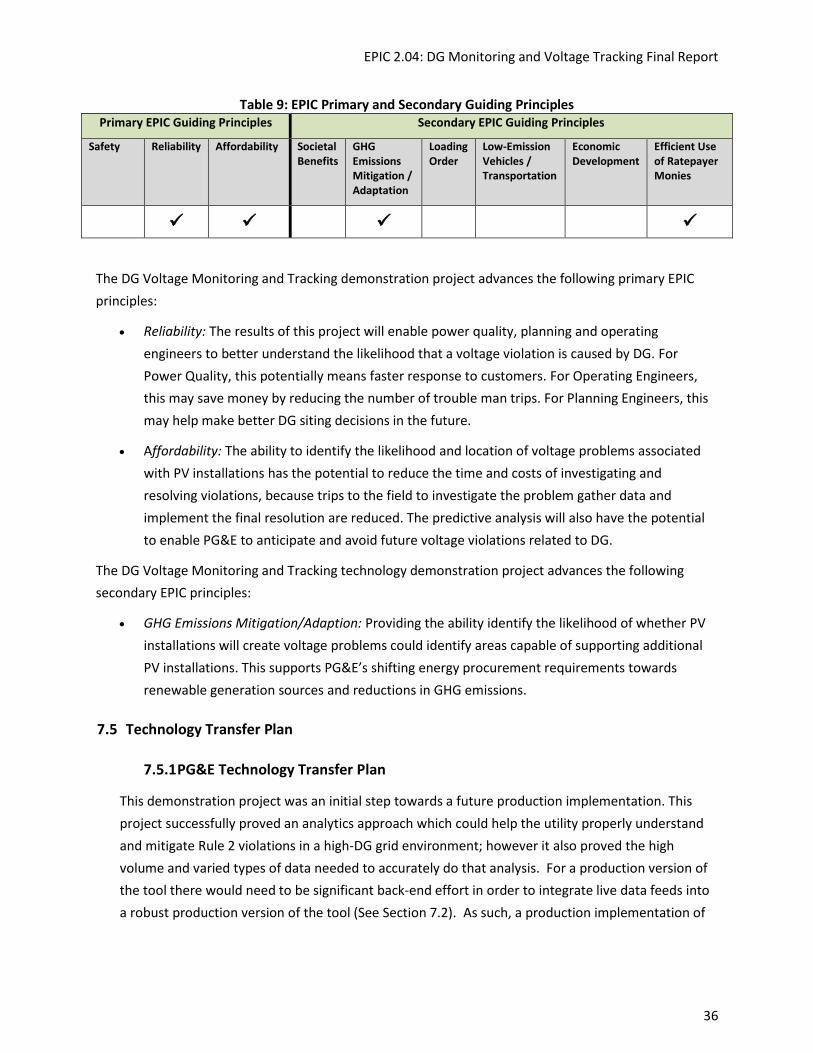
EPIC 2.04: DG Monitoring and Voltage Tracking Final Report
36
Table 9: EPIC Primary and Secondary Guiding Principles Primary EPIC Guiding Principles Secondary EPIC Guiding Principles
Safety Reliability Affordability Societal Benefits
GHG Emissions Mitigation / Adaptation
Loading Order
Low-Emission Vehicles / Transportation
Economic Development
Efficient Use of Ratepayer Monies
The DG Voltage Monitoring and Tracking demonstration project advances the following primary EPIC
principles:
Reliability: The results of this project will enable power quality, planning and operating
engineers to better understand the likelihood that a voltage violation is caused by DG. For
Power Quality, this potentially means faster response to customers. For Operating Engineers,
this may save money by reducing the number of trouble man trips. For Planning Engineers, this
may help make better DG siting decisions in the future.
Affordability: The ability to identify the likelihood and location of voltage problems associated
with PV installations has the potential to reduce the time and costs of investigating and
resolving violations, because trips to the field to investigate the problem gather data and
implement the final resolution are reduced. The predictive analysis will also have the potential
to enable PG&E to anticipate and avoid future voltage violations related to DG.
The DG Voltage Monitoring and Tracking technology demonstration project advances the following
secondary EPIC principles:
GHG Emissions Mitigation/Adaption: Providing the ability identify the likelihood of whether PV
installations will create voltage problems could identify areas capable of supporting additional
PV installations. This supports PG&E’s shifting energy procurement requirements towards
renewable generation sources and reductions in GHG emissions.
7.5 Technology Transfer Plan
7.5.1 PG&E Technology Transfer Plan
This demonstration project was an initial step towards a future production implementation. This
project successfully proved an analytics approach which could help the utility properly understand
and mitigate Rule 2 violations in a high-DG grid environment; however it also proved the high
volume and varied types of data needed to accurately do that analysis. For a production version of
the tool there would need to be significant back-end effort in order to integrate live data feeds into
a robust production version of the tool (See Section 7.2). As such, a production implementation of

EPIC 2.04: DG Monitoring and Voltage Tracking Final Report
37
this algorithmic model would be most cost-effective via a wider grid data analytics platform. PG&E
will consider the integration of this functionality while exploring the potential for such a platform.
To help spread the lessons learned from the project, the DG Voltage Monitoring and Tracking Tool
was demonstrated at Distributech 2017 in San Diego. In addition, the Institute of Electrical and
Electronics Engineers (IEEE) will be publishing a paper on the analytical model and results, which will
be presented at the next IEEE conference in 2017.
7.5.2 Adaptability to Other Utilities and the Industry
A DG Voltage Monitoring and Tracking tool may be useful to electric utilities seeking methods to
avoid reliability impacts from the proliferation of DG. Any utility pursuing this technology application
must have service point SmartMeter™ devices throughout its network and comprehensive
databases as inputs to the analytics. As described above, it is also vital that a utility has established a
comprehensive data storage and analytics platform, to allow data access at the speed, quality, and
consistency necessary for such analysis.
The application of fuzzy logic to this complex problem offers a potential model to address other
complex technology applications where insufficient data does not allow statistical analysis. This
expert-knowledge-based approach could apply not only to electric distribution utilities, but
potentially other network based utility services (e.g., water, sewer, phone) faced with similarly
complex problems and data gaps.
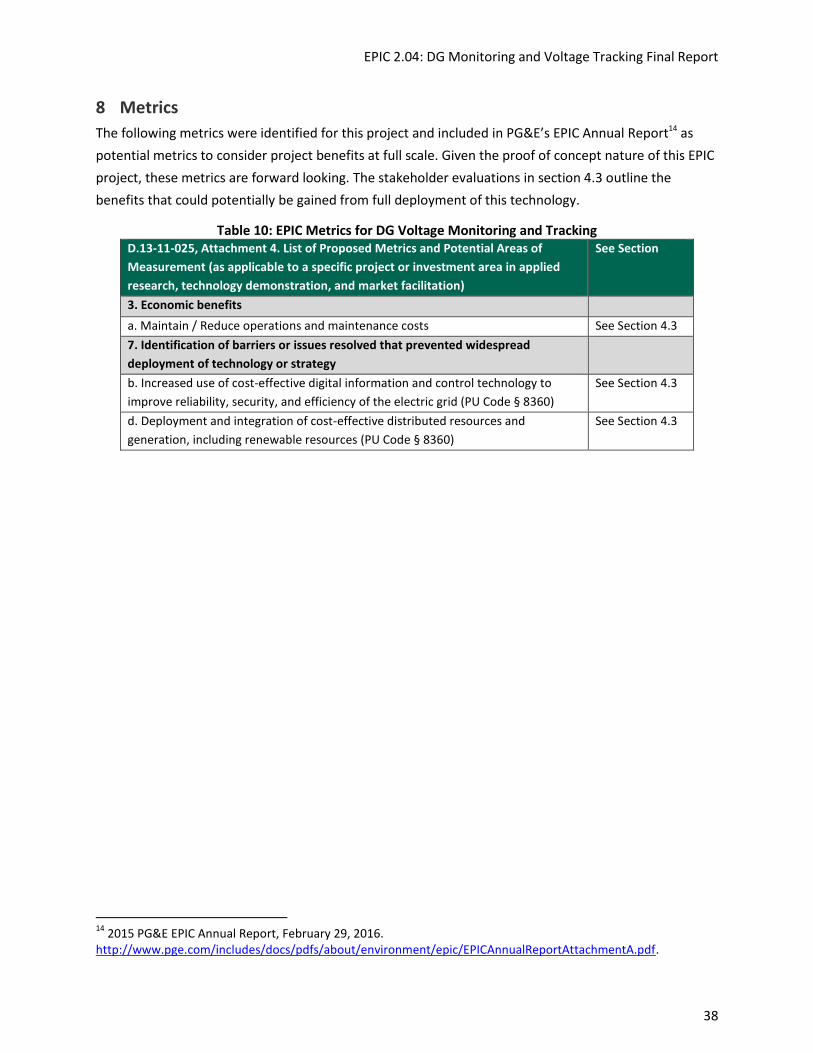
EPIC 2.04: DG Monitoring and Voltage Tracking Final Report
38
Metrics 8
The following metrics were identified for this project and included in PG&E’s EPIC Annual Report14 as
potential metrics to consider project benefits at full scale. Given the proof of concept nature of this EPIC
project, these metrics are forward looking. The stakeholder evaluations in section 4.3 outline the
benefits that could potentially be gained from full deployment of this technology.
Table 10: EPIC Metrics for DG Voltage Monitoring and Tracking D.13-11-025, Attachment 4. List of Proposed Metrics and Potential Areas of
Measurement (as applicable to a specific project or investment area in applied
research, technology demonstration, and market facilitation)
See Section
3. Economic benefits
a. Maintain / Reduce operations and maintenance costs See Section 4.3
7. Identification of barriers or issues resolved that prevented widespread
deployment of technology or strategy
b. Increased use of cost-effective digital information and control technology to
improve reliability, security, and efficiency of the electric grid (PU Code § 8360)
See Section 4.3
d. Deployment and integration of cost-effective distributed resources and
generation, including renewable resources (PU Code § 8360)
See Section 4.3
14
2015 PG&E EPIC Annual Report, February 29, 2016. http://www.pge.com/includes/docs/pdfs/about/environment/epic/EPICAnnualReportAttachmentA.pdf.

EPIC 2.04: DG Monitoring and Voltage Tracking Final Report
39
Conclusion 9
This project was precipitated by the exponentially increasing complexity of the grid. It is an example of
how new data sources (such as SmartMeter™ data) can be combined with analytical modeling to
provide information that is superior to previous manual methods. This information may support faster
and more effective decision-making.
The primary outcome of the technology demonstration was a set of analytical rules which can determine
whether solar installations and voltage issues are related. The fuzzy logic-based analytical model was
used to incorporate SME knowledge and available raw data. The fuzzy model was then tested and verified
by historical data as well as power flow simulation. The results are encouraging, indicating that the model
is highly accurate when predicting that a violation is very high or low chance of being caused by DG. For
those cases in between, further engineering analysis is required. In the sample size of 200, the model
demonstrated that manual analysis potentially could be reduced by 84%.
This demonstration project was the first step towards production implementation. Prior to production
implementation, the tool would need to go through further usability tests and development on data
integration, visualization and/or integration with existing tools, and fuzzy rule enhancement. Data
challenges are significant (e.g., processing volume and missing intervals) and these will need to be
addressed in the development of a production version, such as through a utility enterprise analytics
platform. Any data analytics platforms on which such a system is pursued should ensure that a
processing-intensive system can be supported.
This project represents the successful exploration of leveraging cutting-edge analytics and newly-
available data to provide actionable intelligence to grid operators and planners. While DG adoption is
still in an early enough phase that it is not frequently disrupting grid operation, the lessons learned by
this technology demonstration will only become more valuable as the rate of adoption increases. As a
result of this technology demonstration, PG&E has developed analytical rules which could be
incorporated into a grid data analytics platform and used to reduce the manual inspection effort of
Power Quality engineers responding to voltage violations driven by the increase of solar penetration.
As outlined in the report, this technology demonstration was executed using a flat file data extract for
the sake of focusing on the analytics development. Moving forward, there would need to be significant
back-end effort in order to integrate live data feeds into a robust production version of the tool, which
will be most efficient through a future potential enterprise analytics platform.

EPIC 2.04: DG Monitoring and Voltage Tracking Final Report
40
Appendix A: Fuzzy Logic Rules for DG Voltage Monitoring and Tracking 10
10.1 Grid-Related Rules
10.1.1 Primary System Rules
P1. CVR/VVO (on/off)
When Conservation Voltage Reduction (CVR)/VVO is on, the voltage is at low levels on the feeder
and the likelihood of overvoltage caused by PV will be low. While CVR/VVO can occasionally raise
the voltage during peak load periods to keep customers within voltage limits, it is important to
account for all potential variables even if they have low impact. If CVR/VVO is on, then the likelihood
of PV-caused voltage problem is low.
P2. Feeder loading (off-peak, partial peak, peak)
Feeder loading as a percentage of feeder peak load.
If feeder loading is at off-peak, then the likelihood of high voltage violation caused by PV
is high.
If feeder loading is at partial peak, then the likelihood of high voltage violation caused by PV
is medium.
If feeder loading is at peak, then the likelihood of high voltage violation caused by PV
is low.15
Feeder Loading (%) Corresponding Fuzzy Input Value
<30% Off-peak
30-70% Partial peak
>70% Peak
P3. Coincidence of PV peak and feeder loading peak (off peak, partial peak, peak)
If PV peak is coincident with the feeder loading off-peak, then the likelihood of high voltage
violation caused by PV is high.
If PV peak is coincident with the feeder loading partial-peak, then the likelihood of high
voltage violation caused by PV is medium.
15
This rule is based on the assumption that PV generation is low during peak load periods. It is not applicable to situations where a customer exporting during peak load periods, especially if the customer is close to a station or line regulator.

EPIC 2.04: DG Monitoring and Voltage Tracking Final Report
41
If PV peak is coincident with the feeder loading peak, then the likelihood of high voltage
violation caused by PV is low.16
If PV peak is coincident with the feeder loading off-peak, then the likelihood of low voltage
violation caused by PV dropping off is low.
If PV peak is coincident with the feeder loading partial-peak, then the likelihood of low
voltage violation caused by PV dropping off is medium.
If PV peak is coincident with the feeder loading peak, then the likelihood of low voltage
violation caused by PV dropping off is high.
P4. Are there any LTCs at the substation or line regulators on the feeder? (Yes/No)
LTCs at the substation and line regulators on the feeder can adjust the voltage on the feeder and
reduce the likelihood of voltage problems on the feeder. It should be noted that most PG&E feeders
have LTC regulation at the substation.
If there are LTCs at the substation or line regulators on the feeder, then the likelihood of voltage
violation, on the primary feeder, caused by PV is low.
P5. Voltage at the load side of LTC or line regulator (low, close to upper limit)
Assuming voltage on the load side of the LTC or upstream line regulator is already close to the upper
limit; the reverse flow on the secondary circuit will further increase the voltage and will result in
overvoltage. However, since high PV penetration will reduce the load on the feeder, it is less likely to
have high voltage at regulator load side. Also, high PV penetration is typically coincidence with
partial system peak, resulting in lower loading on the feeder.
If the voltage at the load side of LTC or line regulator is close to the upper limit, then the
likelihood of voltage violation caused by PV is high.
If the voltage at the load side of LTC or line regulator is low, then the likelihood of voltage
violation caused by PV is low.
Voltage (pu) Corresponding Fuzzy Input Value
<1.03 Low
≥1.03 Close to upper limit
16
During this time, the likelihood of reverse power flow and resulting high voltage violation is low
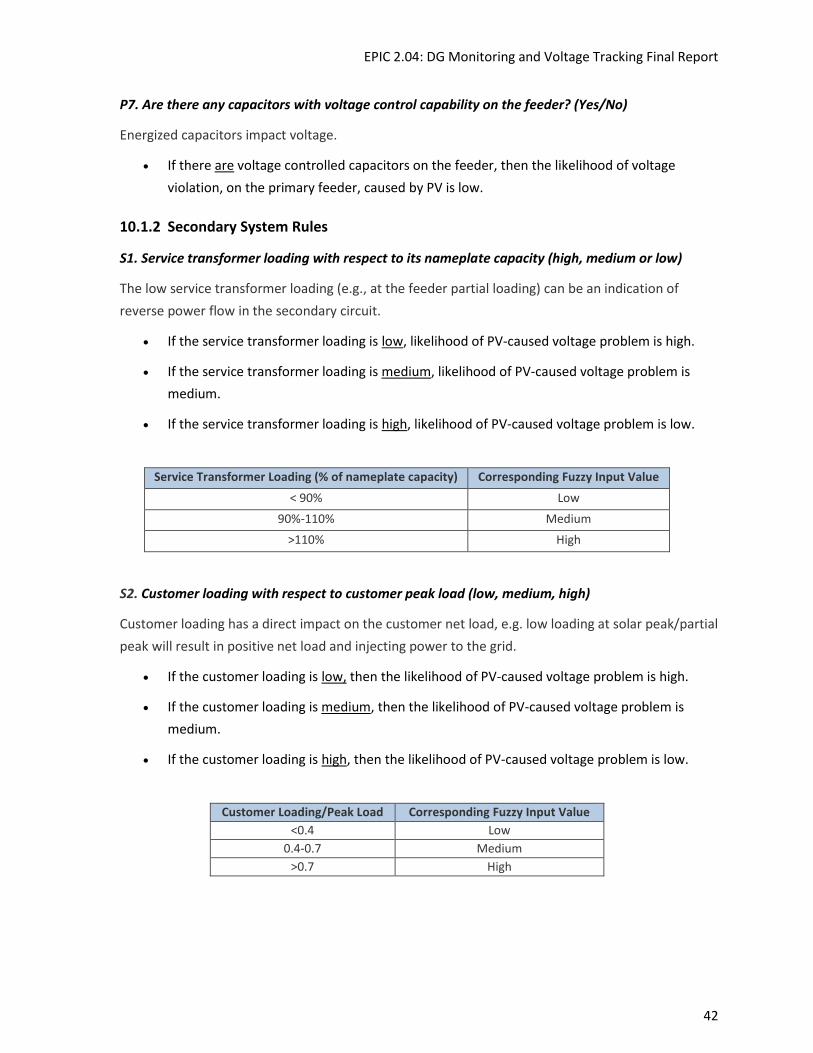
EPIC 2.04: DG Monitoring and Voltage Tracking Final Report
42
P7. Are there any capacitors with voltage control capability on the feeder? (Yes/No)
Energized capacitors impact voltage.
If there are voltage controlled capacitors on the feeder, then the likelihood of voltage
violation, on the primary feeder, caused by PV is low.
10.1.2 Secondary System Rules
S1. Service transformer loading with respect to its nameplate capacity (high, medium or low)
The low service transformer loading (e.g., at the feeder partial loading) can be an indication of
reverse power flow in the secondary circuit.
If the service transformer loading is low, likelihood of PV-caused voltage problem is high.
If the service transformer loading is medium, likelihood of PV-caused voltage problem is
medium.
If the service transformer loading is high, likelihood of PV-caused voltage problem is low.
Service Transformer Loading (% of nameplate capacity) Corresponding Fuzzy Input Value
< 90% Low
90%-110% Medium
>110% High
S2. Customer loading with respect to customer peak load (low, medium, high)
Customer loading has a direct impact on the customer net load, e.g. low loading at solar peak/partial
peak will result in positive net load and injecting power to the grid.
If the customer loading is low, then the likelihood of PV-caused voltage problem is high.
If the customer loading is medium, then the likelihood of PV-caused voltage problem is
medium.
If the customer loading is high, then the likelihood of PV-caused voltage problem is low.
Customer Loading/Peak Load Corresponding Fuzzy Input Value
<0.4 Low
0.4-0.7 Medium
>0.7 High

EPIC 2.04: DG Monitoring and Voltage Tracking Final Report
43
S3. Customer voltage at system peak load condition with low/no PV (very low, low, high)
Customer voltage at system peak load and low/no PV can be used as an index of the customer
voltage sensitivity to load changes. Customers with low voltages at system peak load and low/no PV
may experience high voltage in presences of high PV and low load condition. This has been verified
by published simulation results on secondary circuits [6].
If the customer voltage at system peak is very low, then the likelihood of PV-caused voltage
problem is very high.
If the customer voltage at system peak is low, then the likelihood of PV-caused voltage
problem is very medium.
If the customer voltage at system peak is high, then the likelihood of PV-caused voltage
problem is very low.
Customer Voltage at System Peak &
low/no PV
Corresponding Fuzzy
Input Value
<0.95 p.u (<114 V) Very Low
0.95-1 p.u (114 -120 V) Low
>1 p.u (>120 V) High
S4. Level of voltage violation (low, high)
Overvoltage caused by PV is typically resulted from power flow in the reverse direction. Assuming,
there are voltage regulators at the substation and on the feeder, the overvoltage is not very large.
If the level of voltage violation is low, likelihood of voltage violation caused by PV is high.
If the level of voltage violation is high, likelihood of voltage violation caused by PV is low.
Voltage Corresponding Fuzzy Input Value
1.05-1.066 p.u (126-128 V) Low
>1.066 p.u (>128V) High
S5. Duration of voltage violation (short, medium or long)
This is an indication of how long the voltage violation lasted.
If the duration of voltage violation is short, then the likelihood of voltage violation caused by
PV is high.
If the duration of voltage violation is medium, then the likelihood of voltage violation caused
by PV is medium.

EPIC 2.04: DG Monitoring and Voltage Tracking Final Report
44
If the duration of voltage violation is long, then the likelihood of voltage violation caused by
PV is low.
Hours Corresponding Fuzzy Input Value
0-3 Short
3-5 Medium
>5 Long
S6. Number of customers affected at secondary circuit (small, large)
This input is related to customers at the secondary circuit with over voltage violation (voltage above
1.05 p.u.). Assuming voltage at the service transformer is not violated, customers located upstream
with respect to PVs clustered close together or customers located far from service transformer are
more likely to experience overvoltage.
If the number of customers with overvoltage is small, then the likelihood of voltage violation
caused by PV is high.
If the number of customers with overvoltage is large, then the likelihood of voltage violation
caused by PV is low.
Number of Customers Affected Corresponding Fuzzy Input Value
<10 Small
>10 Large
10.2 PV Related Rules
10.2.1 Primary System Rules
P8. PV penetration of the primary feeder (small, medium or large)
This is the level of PV penetration as a percentage of feeder peak load.
If the existing amount of PV installation in the primary feeder is small, then the likelihood of
PV-caused voltage problem is low.
If the existing amount of PV installation in the primary feeder is medium, then the likelihood
of PV-caused voltage problem is medium.
If the existing amount of PV installation in the primary feeder is large, then the likelihood of
PV-caused voltage problem is high.

EPIC 2.04: DG Monitoring and Voltage Tracking Final Report
45
Aggregated PV Capacity/Peak Load (%) Corresponding Fuzzy Input Value
<10% Small
10%-25% Medium
>25 Large
P9. PV penetration of the primary feeder at off-peak load (small, medium, large)
This is the level of PV penetration as a percentage of off-peak load. If PV aggregated capacity is
larger than feeder off-peak load, then it is more likely to have reverse power flow on the feeder at
high PV hours that typically occurs at system partial peak load.
If (Aggregated PV capacity of the feeder)/ (Feeder off-peak load) is small, then the likelihood
of PV-caused voltage problem is low.
If (Aggregated PV capacity of the feeder)/ (Feeder off-peak load) is medium, then the
likelihood of PV-caused voltage problem is medium.
If (Aggregated PV capacity of the feeder)/ (Feeder off-peak load) is large, then the likelihood
of PV-caused voltage problem is high.
Aggregated PV Capacity of the Feeder/Feeder Off-Peak Load
Corresponding Fuzzy Input Value
<0.7 Small
0.7-1 Medium
>1 Large
P10. Are there any PV farms (e.g., PV systems connected directly to the primary) on the primary
feeder serving cudstomers? (Yes/No)
PV farms could result in voltage violations, depending upon their size and location on the feeder.
If there are PV farms on the feeder, likelihood of PV-caused voltage problems is high
If there are no PV farms on the feeder, likelihood of PV-caused voltage problems is low
P11. PV farm rated size (small, large)
The size of the PV farm could result in voltage violations.
If the PV farm is small then the likelihood of PV-caused voltage problems is low.
If the PV farm is large then the likelihood of PV-caused voltage problems is high.
Rated size (kW) Corresponding Fuzzy Input Value
<500 Small
>500 Large

EPIC 2.04: DG Monitoring and Voltage Tracking Final Report
46
P12. PV farm location on the feeder (close to the substation, middle, end of the feeder)
The location of a PV farm could result in voltage violations. If the PV farm is close to the substation
then the likelihood of PV-caused voltage problems is low.
If the PV farm is in the middle of the feeder, then the likelihood of PV-caused voltage
problems is medium.
If the PV farm is far at the end of the feeder, then the likelihood of PV-caused voltage
problems is high
10.2.2 Secondary System Rules
S7. Rated size (small, medium or large)
If the PV rating size is small, then the likelihood of PV-caused voltage problem is low.
If the PV rating size is medium, then the likelihood of PV-caused voltage problem is medium.
If the PV rating size is large, then the likelihood of PV-caused voltage problem is high.
Rated size (kW) Corresponding Fuzzy Input Value
<5 Small
5-10 Medium
>10 Large
S8. PV Generation (small, medium or large)
If the PV generation is small, then the likelihood of PV-caused voltage problem is low.
If the PV generation is medium, then the likelihood of PV-caused voltage problem is
medium.
If the PV generation is large, then the likelihood of PV-caused voltage problem is high.
PV Generation (kWh) Corresponding Fuzzy Input Value
<4 Small
4-8 Medium
>8 Large
S9. PV penetration of the secondary (small, medium, large)
If the PV penetration of the secondary circuit is small, then the likelihood of PV-caused
voltage problem is low.

EPIC 2.04: DG Monitoring and Voltage Tracking Final Report
47
If the PV penetration of the secondary circuit is medium, then the likelihood of PV-caused
voltage problem is medium.
If the PV penetration of the secondary circuit is large, then the likelihood of PV-caused
voltage problem is high.
Aggregated PV Capacity on Sec./Peak Sec. Load ( %) Corresponding Fuzzy Input Value
<10% Small
10%-25% Medium
>25 Large
10.3 Topology-Related Rules
10.3.1 Primary System Rules
P13. Service transformer distance from the upstream voltage regulator (close to voltage
regulation device, or far from the voltage regulation device)
If PV penetration of the feeder is high, resulting in reverse power flow, then the voltage will be
higher at the end of feeder. However, this can be mitigated by voltage regulators.17
If the service transformer is located close to voltage regulation device, then the likelihood of
PV-caused voltage problem is low.
If the service transformer is located far from the voltage regulation device, then the
likelihood of PV-caused voltage problem is high.
Proximity to Source Side Regulating Device Corresponding Fuzzy Input
Value
Up to half the distance between the source side regulating device and
the next regulating device or end of line
Close to voltage regulation
device
Over half the distance between the source side regulating device and
the next regulating device or end of line
Far from the voltage
regulation device
P14. Primary feeder conductor type, i.e., impedance/mile (small, medium, large)
Primary feeder conductor type has direct impact on voltage rise/drop along the feeder. The voltage
rise impact will appear in feeders with high PV penetration during the off-peak or partial peak hours.
If the impedance/mile of primary feeder is small, then the likelihood of PV-caused voltage
problem is low.
17
As identified previously, customers near the load side of regulators may be subject to voltage violations unrelated to PV installations.

EPIC 2.04: DG Monitoring and Voltage Tracking Final Report
48
If the impedance/mile of primary feeder is medium, then the likelihood of PV-caused
voltage problem is medium.
If the impedance/mile of primary feeder is large, then the likelihood of PV-caused voltage
problem is high.18
P15. Primary feeder length (short, medium, long)
If the primary feeder is short, then the likelihood of PV-caused voltage problem is low.
If the primary feeder is medium, then the likelihood of PV-caused voltage problem is
medium.
If the primary feeder is long, then the likelihood of PV-caused voltage problem is high.
Primary Length (Mi.) Corresponding Fuzzy Input Value
<5 Short
5 to 15 Medium
>15 Long
10.3.2 Secondary System Rules, and Environmental-Related Rules
E1. Date and time of day (off-peak, partial-peak or peak)
General input regarding time and season of radiation. To be used in conjunction with irradiance
data.
If time is PV off-peak, then the likelihood of PV-caused voltage problem is zero.
If time is PV partial-peak, then the likelihood of PV-caused voltage problem is low.
If time is PV peak, then the likelihood of PV-caused voltage problem is high.
Season Time Corresponding Fuzzy Input Value
Summer 7pm-9am (of the next day) Off-Peak
Summer 9am-10:30am or 4pm-7pm Partial-Peak
Summer 10:30am-4pm Peak
Winter 4pm-9am (of the next day) Off-Peak
Winter 9am-10:30am or 3pm-4pm Partial-Peak
Winter 10:30am-3pm Peak
18
Fuzzy input values will be developed from CYME data.

EPIC 2.04: DG Monitoring and Voltage Tracking Final Report
49
E2. Solar Radiation (low, medium, high)
If irradiance is low, then the likelihood of PV-caused voltage problem is zero.
If irradiance is medium, then the likelihood of PV-caused voltage problem is low.
If irradiance is high, then the likelihood of PV-caused voltage problem is high.
Solar Radiation (Wh/m2) Corresponding Fuzzy Input Value
<400 Low
400-800 Medium
>800 High
E3. Clear Sky Index (cloudy, mostly cloudy, partly cloudy, clear)
If Index is cloudy, then the likelihood of PV-caused voltage problem is zero.
If Index is mostly cloudy, then the likelihood of PV-caused voltage problem is low.
If Index is partly cloudy, then the likelihood of PV-caused voltage problem is zero.
If Index is clear, then the likelihood of PV-caused voltage problem is low.
Clear Sky Index Corresponding Fuzzy Input Value
0.00 to 0.30 Cloudy
0.31 to 0.50 Mostly cloudy
0.51 to 0.80 Partly cloudy
0.81 to 1.00 Clear
10.4 Additional Rules
In this section is listed additional rules that will be enabled when the associated data become available.
P6. Are LTCs and line regulators set for bidirectional flow (Yes/No)
If regulators are set properly to address reverse power, voltage will be adjusted for flow in
both directions.
If LTCs and/or line regulators are not set properly to address reverse power, then the
likelihood of voltage violation, caused by PV is high.
S10. PV location on the secondary circuit (close to the service transformer, middle, end of circuit)
PV located far from service transformer is more likely to cause reverse power flow and also has
more impact on overvoltage caused by reserve power flow.

EPIC 2.04: DG Monitoring and Voltage Tracking Final Report
50
If PV is located close to the service transformer, then the likelihood of PV-caused voltage
problem is low.
If PV is located in the middle of secondary circuit, then the likelihood of PV-caused voltage
problem is medium.
If PV is located at the end of secondary circuit, then the likelihood of PV-caused voltage
problem is high.
S11. PV distribution in the secondary circuit (close to the service transformer, middle, end
of circuit)
The impact of location of PVs clustered close together is similar to S10, where the aggregated size of
PVs can further increase the voltage.
If PVs are clustered close to the service transformer, then the likelihood of PV-caused
voltage problem is low.
If PVs are clustered in the middle of secondary circuit, then the likelihood of PV-caused
voltage problem is medium.
If PVs are clustered at the end of secondary circuit, then the likelihood of PV-caused voltage
problem is high.
S12. Manufacturer
This would capture experience with various manufacturers.
If PV’s manufacturer is X, then the likelihood of PV-caused voltage problem is low.
If PV’s manufacturer is Y, then the likelihood of PV-caused voltage problem is high.
S13. Smart Inverter
Smart inverter behavior can alleviate voltage rise at the service entrance to within acceptable levels.
However, the voltage controllability offered by a smart inverter depends upon the factors such as
source impedance and the inverter size [7]. This rule considers that smart inverters have some
voltage regulation capability. It could be revised to reflect settings if and when that information is
available.
If the percentage of PVs with activated smart inverter is small, then the likelihood of voltage
violation caused by PV is high.

EPIC 2.04: DG Monitoring and Voltage Tracking Final Report
51
If the percentage of PVs with activated smart inverter is large, then the likelihood of voltage
violation caused by PV is low.
S16. Customer location on the secondary circuit, i.e., distance to the service transformer (short,
medium, or long)
Customer location on the secondary circuit with reverse power flow is a decision factor to identify
existing voltage problems caused by PV. The farther the customer is located from service
transformer, depending on PV distribution in the secondary circuit; the likelihood that a voltage
problem is caused by PV is higher.
If the distance from the meter to the service transformer is short, then the likelihood of
PV-caused voltage problem is low.
If the distance from the meter to the service transformer is medium, then the likelihood of
PV-caused voltage problem is medium.
If the distance from the meter to the service transformer is long, then the likelihood of
PV-caused voltage problem is high.
Distance From Meter to Service Transformer Corresponding Fuzzy
Input Value
Served directly from transformer with service Short
Served one span of secondary away from transformer Medium
Served two or more spans of secondary away from the transformer Long
S17. Secondary circuit conductor type, i.e. impedance/mile (small, medium, large)
Secondary circuit impedance changes the voltage rise in the secondary circuit in the case of reverse
power flow.
If the impedance/mile of secondary circuit is small, then the likelihood of PV-caused voltage
problem is low.
If the impedance/mile of secondary circuit is medium, then the likelihood of PV-caused
voltage problem is medium.
If the impedance/mile of secondary circuit is large, then the likelihood of PV-caused voltage
problem is high.19
19
Fuzzy input values will be developed when secondary impedance data becomes available.

EPIC 2.04: DG Monitoring and Voltage Tracking Final Report
52
S18. Secondary circuit length (short, medium, long)
The longer the secondary circuit, the circuit impendence is larger. If large PV is located at the end of
circuit, it is likely to observe overvoltage in the circuit e.g. in rural secondary circuits
If the secondary circuit is short, then the likelihood of PV-caused voltage problem is low.
If the secondary circuit is medium, then the likelihood of PV-caused voltage problem is
medium.
If the secondary circuit is long, then the likelihood of PV-caused voltage problem is high.
Distance Service Transformer to End of Secondary Corresponding Fuzzy Input
Value
No secondary services from distribution transformer only Short
One span of secondary Medium
Two or more spans of secondary Long
S19. Service transformer short circuit resistance (small, medium, large)
Service transformer short circuit resistance further increases the voltage in the case of reverse
power flow in the secondary circuit.
If the service transformer short circuit resistance is small, then the likelihood of PV-caused
voltage problem is low.
If the service transformer short circuit resistance is medium, then the likelihood of PV-
caused voltage problem is medium.
If the service transformer short circuit resistance is large, then the likelihood of PV-caused
voltage problem is high.20
Percentage of PVs With Smart Inverter ( %) Corresponding Fuzzy
Input Value
<50% Small
>50 Large
S14. Smart inverter size
Smart inverter size is a measure of capability of smart inverter to adjust voltage. The larger sized
inverter is able to better influence the terminal voltage via power factor control[6].
20
Fuzzy input values to be developed when service transformer short circuit resistance data becomes available.

EPIC 2.04: DG Monitoring and Voltage Tracking Final Report
53
If the smart inverter is small, then the likelihood of voltage violation caused by PV is high.
If the smart inverter is large, then the likelihood of voltage violation caused by PV is low.21
S15. Smart inverter source impedance
Smart inverter source impedance is an indication of stiffness of the network. For smaller values of
the source impedance, the network can be considered “stiff.” The variation in the power factor does
not influence the inverter bus voltage significantly under the nominal impedance. That is, the smart
inverter power factor control would not be effective in lowering the voltage rise produced by the
peaking PV. On the other hand, for larger values of the source impedance, the variation in power
factor produces greater variation in the bus voltage. Inverter power factor control would be more
effective with the higher source impedances [7].
If the smart inverter source impedance is small, then the likelihood of voltage violation
caused by PV is high.
If the smart inverter source impedance is large, then the likelihood of voltage violation
caused by PV is low.
21
Fuzzy input values will be developed when smart inverter data becomes available.

EPIC 2.04: DG Monitoring and Voltage Tracking Final Report
54
Appendix B: Summary of Fuzzy Model Inputs With Descriptions 11
11.1 Grid Related Inputs
Input Variable Distribution
System Description of Input
Time Dependency
Feeder loading Primary Percentage of feeder peak load Dependent
Service transformer Secondary Loading as a percentage of loading Dependent
Customer voltage at system peak load condition with low or no PV
Secondary Customer voltage at time of system peak with low or no PV generation
Independent
Level of voltage violation at customer location
Secondary % of voltage violation from nominal voltage Dependent
Duration of voltage violation Secondary The consecutive periods with voltage violation Dependent
Number of customers affected at secondary circuit
Secondary The number of customers on the secondary system with voltage violation
Dependent
LTCs, line regulators and capacitors
Primary Voltage regulation capability of feeder Independent
11.2 PV Related Inputs
Input Variable Distribution
System Description of Input
Time Dependency
PV penetration of the primary feeder
Primary (Aggregated PV capacity in the feeder) or (Feeder peak load)
Independent
PV farm rated size (if any) Primary Name plate of PV farm Independent
PV farm location on the feeder (if any)
Primary PV arm distance to voltage regulating source Independent
PV penetration of the secondary circuit
Secondary (Aggregated PV capacity in the secondary circuit) or (Distribution transformer rating)
Independent
Actual PV generation Secondary Actual kWh PV generation Dependent
11.3 Topology Related Inputs
Input Variable Distribution
System Description of Input Time Dependency
Service transformer distance from the upstream voltage regulator
Primary Location of distribution transformer with respect to source side voltage regulating device
Independent
Feeder conductor type (average impedance/mile
Primary Feeder conductor type and feeder length
Independent
Feeder length Primary Length of feeder Independent
11.4 Environment Related Inputs
Input Variable Distribution
System Description of Input Time Dependency
Date and time Primary & Secondary
Daylight hours are of interest Dependent
Average solar radiation in the feeder
Primary & Secondary
Indicates potential PV generation on the feeder
Dependent

EPIC 2.04: DG Monitoring and Voltage Tracking Final Report
55
11.5 Summary List of Fuzzy Logic Rules
22
Gaps in the number sequence are the result of rules deferred for future use: data not available to apply the rule in this technology demonstration project.
Rule Title Category
P1 CVR/VVO (on/off) Grid, Primary
P2 Feeder Loading (off-peak, partial peak, peak Grid, Primary
P3 Coincidence of PV peak and feeder loading peak (off-peak, partial peak, peak) Grid, Primary
P4 Are there any LTCs at the substation or line regulators on the feeder? (yes/no) Grid, Primary
P5 Voltage at the load side of LTC or line regulator (low, close to upper limit) Grid Primary
P722
Are there any capacitors with voltage control capability on the feeder? (yes/no)
Grid, Primary
S1 Service transformer loading with respect to its nameplate capacity (high, medium, low)
Grid, Secondary
S2 Customer loading with respect to customer peak (low, medium, high) Grid, Secondary
S3 Customer voltage at system peak load condition with low/no PV (very low, low, high)
Grid, Secondary
S4 Level of voltage violation (low, high) Grid, Secondary
S5 Duration of voltage violation (short, medium, long) Grid, Secondary
S6 Number of customers affected at secondary circuit (small, large) Grid, Secondary
P8 PV penetration of the primary feeder (small, medium, large) PV, Primary
P9 PV penetration of the primary feeder at off-peak load (small, medium, large) PV, Primary
P10 Are there any PV farms (e.g., PV systems connected directly to the primary) on the primary feeder serving customers? (yes/no)
PV, Primary
P11 PV farm rated size (small, large) PV, Primary
P12 PV farm location on the feeder (close to the substation, middle, end of the feeder)
PV, Primary
S7 PV rated size (small, medium, large) PV, Secondary
S8 PV generation (small, medium, large) PV, Secondary
S9 PV penetration of the secondary (small, medium, large PV, Secondary
P13 Service transformer distance from the upstream voltage regulator (close to voltage regulation device or far from the voltage regulation device)
Topology, Primary
P14 Primary feeder conductor type, i.e., impedance/mile (small, medium/large) Topology, Primary
P15 Primary feeder length (short, medium, long) Topology, Primary
E1 Date and time of day (off-peak, partial-peak, peak) Topology, Secondary Environmental Conditions
E2 Solar radiation (low, medium, high) Topology, Secondary Environmental Conditions
E3 Clear sky index (cloudy, mostly cloudy, partly cloudy, clear) Topology, Secondary Environmental Conditions

EPIC 2.04: DG Monitoring and Voltage Tracking Final Report
56
References
[1] Pacific Gas and Electric Company, “ELECTRIC RULE NO. 2, DESCRIPTION OF SERVICE,” San Francisco, California.
[2] L. A. Zadeh, “Fuzzy Sets,” in Information and Control, 1965. [3] K. Tomsovic and G. Lambert-Torres, “Fuzzy Systems Applications to Power Systems,” in IEEE Power
Engineering Society Tutorial: Fuzzy Logic and Evolutionary Programming Techniques in Power Systems, Seattle, 2000.
[4] L. Markowsky and B. Segee, “The Octave Fuzzy Logic Toolkit,” in Open-Source Software for Scientific Computation (OSSC), 2011 International Workshop on, 2011.
[5] L. A. Zadeh, Fuzzy Sets, Fuzzy Logic, and Fuzzy Systems: Selected Papers by Lotfi A Zadeh, World Scientific, 1996.
[6] R. Tonkoski, D. Turcotte, EL-Fouly and T. H. M., “Impact of High PV Penetration on Voltage Profiles in Residential Neighborhoods,” IEEE Transactions on Sustainable Energy, pp. Vol. 3, No. 3, 2012.
[7] J. Mead, V. Done and J. Garnet, “Advanced Control Technologies For Distribution Grid Voltage And Stability With Electric Vehicles And Distributed Generation,” Pacific Gas and Electric Company, Energy Research and Development Division, March 2015.
[8] Pepco Holding DER Webinar, “Maintaining Reliability & Integrating New Technology,” Pepco Holding, 2016.
[9] D. Aldrich, “Distributed Generation Voltage Control Issues and Solutions,” Beckwith Electric. [10] Electric Power Research (EPRI), “Alternatives to the 15% Rule, California Solar Initiative,” RD&D
Report, 2015. [11] E. Stewart, J. MacPherson and S. Vasilic, “Analysis of High-Penetration Levels of Photovoltaics into
the Distribution Grid on Oahu, Hawaii,” NREL Report, 2013. [12] O. Castillo and P. Melin, Type-2 Fuzzy Logic: Theory and Applications, Springer Berlin
Heidelberg, 2008.