p/g coast guard cutter duty cycle and …ada1o1 5 67 ve t lf cg-d-26-80 coast guard cutter duty...
TRANSCRIPT

AD-AlG1 567 SOUTHWEST RESEARCH INST SAN ANTONIO TI p/G 21/5COAST GUARD CUTTER DUTY CYCLE AND PROPELLER/DIESEL ENGINE EFFIC-ETC(U)
N MAY 81 Q A BAKER, J 0 STORMENT DOT-TSC-920
UNCLASSIFIED USCG-D-26-G80NhhiEEEmmEEmhEEEEIIIIIIIIIIE.IIIIumhIIIIIIulEEEIhlElllllEIhI-EE-IIIII

ADA1O1 5 67 VE tLF CG-D-26-80
COAST GUARDCUTTER DUTYCYCLE ANDPROPELLER/DIESELENGINE EFFICIENCYSTUDY T--
3tiL 2 0 1981 J
REPRINT.AY 1981
-4
U.S. DEPARTMENT OF TRANSPORTATION C Z
RESEARCH AND SPECIAL PROGRAMS ADMINISTRATION r "TRANSPORTATION SYSTEMS CENTER . CAMBRIDGE MA 02142
PREPARED FOR UNITED STATES COAST GUARDOFFICE OF RESEARCH AND DEVELOPMENT eWASHINGTON DC 20593

NOTICE
This document is disseminated under the sponsorshipof the Department of Transportation in the interestof information exchange. The United States Govern-ment assumes no liability for its contents or usethereof.
NOTICE
The United States Government does not endorse pro-ducts or manufacturers. Trade or manufacturers'names appear herein solely because they are con-sidered essential to the object of this report.
K _Technical keport Documentation Page
1. Report N ,/7 -, 2. Go.ein.e, Access. on No. 3 Recipient s Caoalog No
CG-D-26-8Q.;lZ B- 4~- Q.L. 1-5"44. Title and Sibhttle 5. Repot [)t* Reprin t
AST .UARD UTTER .JTY CYCLE AND -ROPELLER/ JJMay 1981ESELNGINZ EFFI NCYX'-TUDY. - 6. Performing Orga...on Code
t o EA8. Petfom,ng Organzation Report No
7. Authar',l) DOT-TSC-USCG- 80-8
/6 Q.A.,Baker, J. O /Storment 11-4132-003/0049. Performing Organilotion Name and Address 10. Work U, t No (TRAS)
Southwest Research Institute* r(n07/R1014622 Culebra Road t If? - .C.,a, , Ga2tNo
San Antonio TX 78284 J DtT-TSC-92J.i ) t /1 13. Type of Report and Perod c.ered
12. Sponsoring Agency Name and Address q inal Reop "
U.S. Department of Transportation Sep. 1975- Aug. 198k,U.S. Coast Guard --Office of Research and Development 14. Sponsoring Agency Code
Washington DC 20593 G-DMT- 315. SupplementaryNotes U.S. Department of Transportation*Under contract to: Research and Special Programs Administration
Transportation Systems Center (DTS-332)Cambridge MA 02142
16. A' ,s ,ct
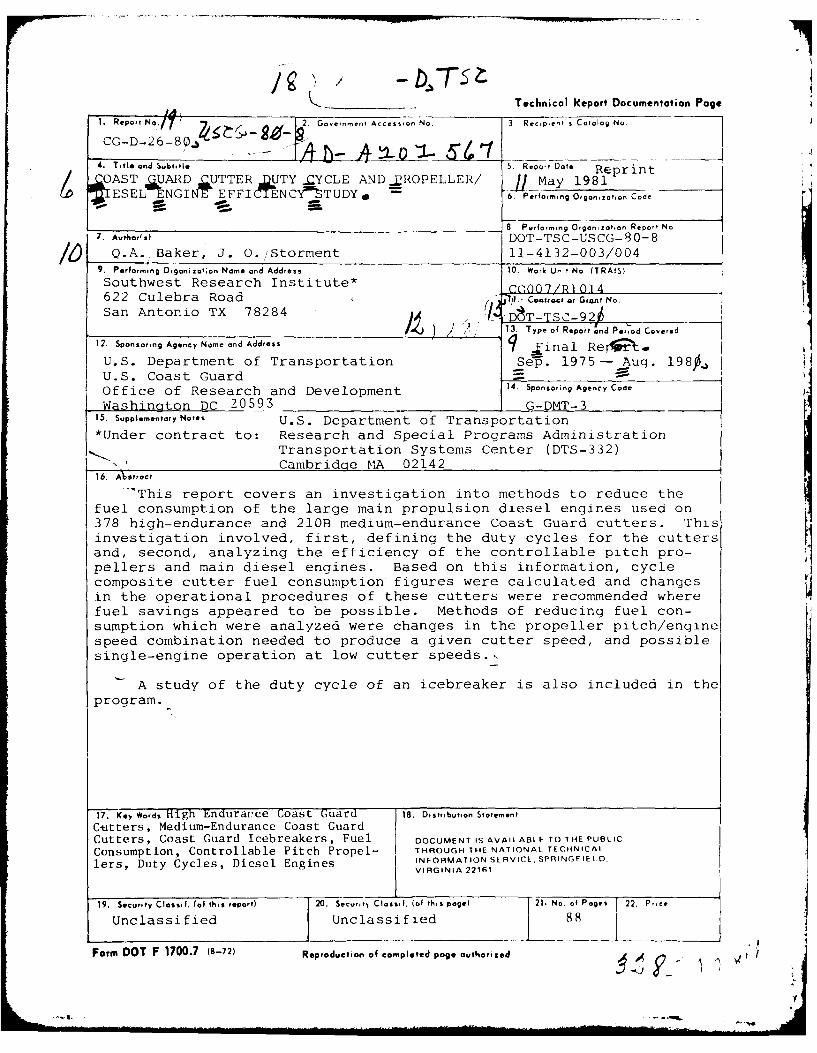
.This report covers an investigation into methods to reduce thefuel consumption of the large main propulsion diesel engines used on378 high-endurance and 210B medium-endurance Coast Guard cutters. Thisinvestigation involved, first, defining the duty cycles for the cuttersand, second, analyzing the efficiency of the controllable pitch pro-pellers and main diesel engines. Based on this information, cyclecomposite cutter fuel consumption figures were calculated and changesin the operational procedures of these cutters were recommended wherefuel savings appeared to be possible. Methods of reducing fuel con-sumption which were analyzed were changes in the propeller pitch/enginespeed combination needed to produce a given cutter speed, and possiblesingle-engine operation at low cutter speeds.,
A study of the duty cycle of an icebreaker is also included in theprogram.
17. Key Words High Enduracce Coast Guard 18. Distribution Statement
Cttters, Medium-Endurance Coast GuardCutters, Coast Guard Icebreakers, Fuel DOCUMENT IS AVAILABLE TO THE PUBLIC
Consumption, Controllable Pitch Propel- THROUGH THE NATIONAL TECHNICAL
lers, Duty Cycles, Diesel Engines INFORMATION SERVICE. SPRINGF IELO,
VIRGINIA 22161
19. Security Classif. (of thrs report) 20. Securit) Classif. (of this page) 21. No. of Pages 22. Prce
Unclassified Unclassified 88
Form DOT F 1700.7 (8-72) Reproduction of completed page authorized
0A I I%,

PREFACE
This work was performed for the U.S. Coast Guard Office of Research and Develop-
ment through the Transportation Systems Center of the U.S. Department
of Transporta-
tion. The Technical Monitor for the Coast Guard was Fred Weidner, and Robert
Walter
represented TSC.
The cooperation of the Commanding Officers and crews of the Coast Guard Cutters
CHASE, GALLATIN, HAMILTON, VALIANT, DURABLE, DECISIVE, and WESTWIND
in this program is
Ickowldged•
ACC " r
iii

ici
Bill..il iil ..; I, .,'+11 $1 6 2
ac*
s -I ; i
*fal
* liv
" J.I", I= .- " i -i | a. :1 =1 , -- .- .
Vi J 00I|=l l I it I *I l a -t- O U :
0
i gg (3 0 I 0 leI 1 i I 1 II03 6 o isI . ., ,
" ~~~iiii i !+- " i as
* -ii |ills zI
I!I~ 5111
* I I v

TABLE OF CONTENTS
Section 1'age
1. 1 NTRC'DICT ION....................................................................1-1
1.1 Background................................................................ 1-11.2 Objectives................................................................ 1-11.3 Approach..................................................................i-1
2. CONCLUSIONS.................................................................... 2-1
2.1 Duty Cycle Data.......................................................... 2-12.2 Fuel Consumption Analysis for Medium- and High-Endurance Cutters. 2-1
3. RECOMMENDATIONS................................................................ 3-i
4. DUTY CYCLE DATA ACQUISITION.................................................. 4-i
4.1 Propulsion Systems and Operating Modes.................................4-i
4.1.1 High- and Medium-Endurance Cutters (WHEC's and WMEC's) .... 4-14.1.2 WIND Class Icebreakers (WAGB)...................................4-4
4.2 Duty Cycle Recording Equipment..........................................4-4
4.2.1 Medium-Endurance Cutter Instrumentation........................4-44.2.2 High-Endurance Cutter Instrumentation......................... 4-54.2.3 Icebreaker Instrumentation.......................................4-5
4.3 Data Redajction........................................................... 4-5
5. PROPELLER PITCH/. FFICIENCY ANALYSIS..........................................5-1
6 DISCUSSION OF RESULTS..........................................................6-i
6.1 Medium-Endurance Cutter (WMEC) Duty Cycle Data....................... 6-i6.2 High-Endurance Cutter (WHEC) Duty Cycle Data......................... 6-56.3 WIND Clas-, Icebreaker (WAGB) Duty Cycle Data......................... 6-106.4 Medium-Endurance Cutter Propeller Pitch/Engine Performance
Analysis...................................................................6-106.5 High-Endurance Cutter Propeller Pitch/Engine Performance
Analysis...................................................................6-16
F.5.1 Normal (Two-Propeller) Operation...............................6-166.5.2 Single Engine Operation..........................................6-17
APPENDIX A - W11FC PROPELLER DIAGRAM CORRECTIONS.....................................A-1
APPENDIX B - FUEL CONSUMPTION CALCULATIONS FOR WHEC AND WMEC......................B-i
APPENDIX C - WHEC SINGLE PROPELLER OPERATION FUEL CONSUMPTION DATA............... C-1
APPENDIX D - REPORT OF NEW TECHNOLOGY................................................ D-1

LIST OF ILLUSTRATIONS
Figure J,
4-1 210B WMEC Throttle Schedule ............................................
4-2 378-Foot WIIEC Throttle Schedule........................................... -
6-1 WMEC Propeller Diagram with Fuel Consumption ............................... (-
6-2 Effect of Pitch Ratio on Fuel Consumption -- USCG 210B1 WMEC ............... h-
6-3 Effect of Pitch Ratio on Fuel Consumption -- USCG 210B WMEC (Concl'A).. 6-14
6-4 WHEC Fuel Volume Flow Rate, Escher-Wyss Propeller ...................... 6-18
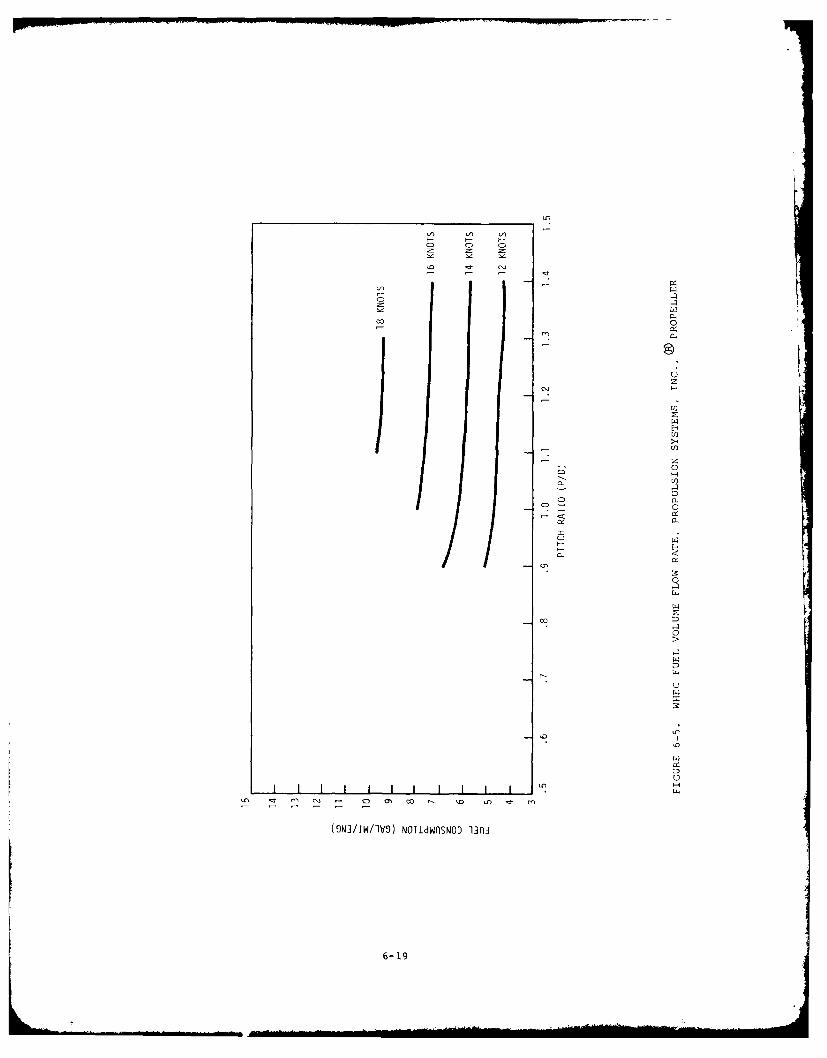
6-5 WHEC Fuel Volume Flow Rate, Propulsion Systems, Inc., Propeller ..... 6-19
6-6 WHEC Propeller Diagram with Fuel Consumption, Escher-Wyss Propeller .... 6-20
6-7 WHEC Propeller Diagram with Fuel Consumption, Propulsion Systems, Inc.,Propeller .............................................................. 6-21
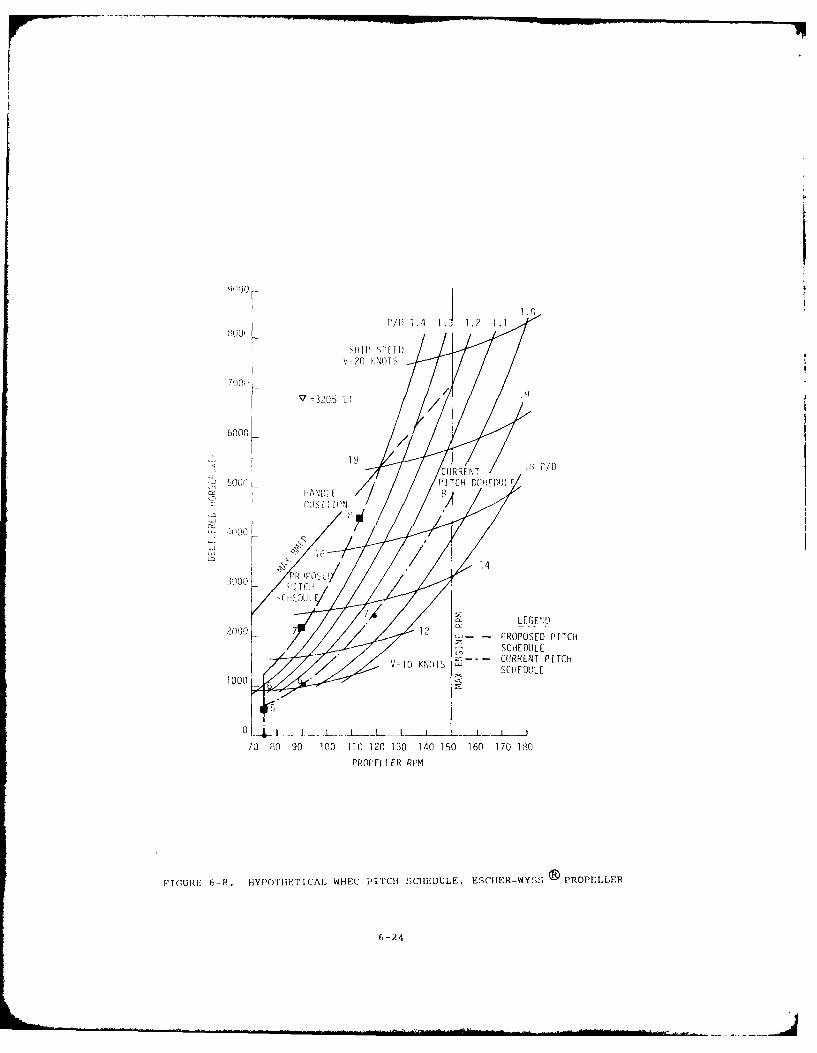
6-8 Hypothetical WHEC Pitch Schedule, Escher-Wyss Propeller ................... 6-24
6-9 Hypothetical WHEC Pitch Schedule, Propulsion Systems, Inc., Propeller.. 6-25
6-10 WHEC Single Engine Operation, Escher-Wyss Trail Shaft ..................... 6-26
6-11 WHEC Single Engine Operation, Propulsion Systems, Inc., Trail Shaft .... 6-27
6-12 WHEC Single Engine Operation, Escher-Wyss Locked Shaft .................... 6-22
6-13 WHEC Single Engine Operation, Propulsion Systems, Inc., Locked Shaft... 6-29
6-14 WHEC Fuel Volume Flow Rate -- Single Engine Operation, Escher-Wyss Propellers Trail Shaft ............................................ 6-30
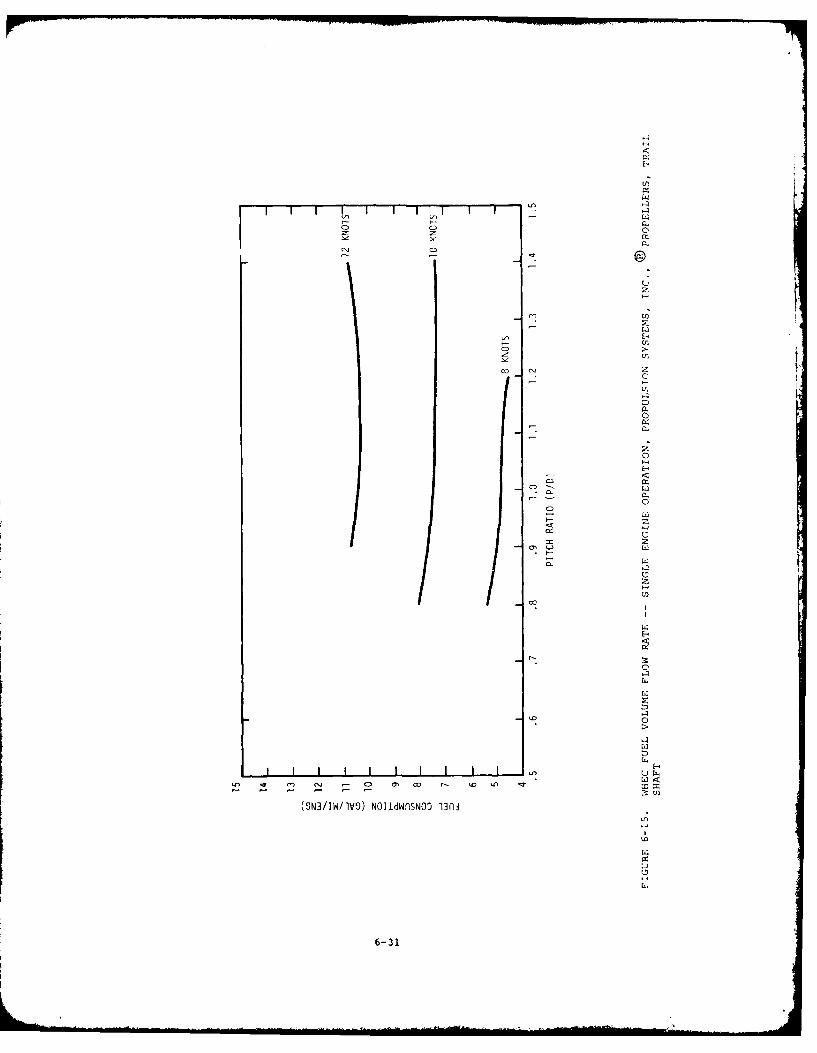
6-15 WHEC Fuel Volume Flow Rate -- Single Engine Operation, PropulsionSystems, Inc., Propellers Trail Shaft .............. ................. 6-31
6-16 WHEC Fuel Volume Flow Rate -- Single Engine Operatiu.-, Escher-Wyss Propellers Locked Shaft ........................................... 6-32
6-17 WHEC Fuel Volume Flow Rate -- Single Engint. Operation, PropulsionSystems, Inc., Propellers, Locked Shaft .................................... 6-33
A-1 USCG 378-Foot HEC Escher-Wyss Propellers ................................... A-1
A-2 USCG 378-Foot HEC Propulsion Systems, Inc., Propellers ................... A-2
A-3a EHP vs. Speed USCC 378-Foot HEC ....................................... A-6
A-3b USCG 378-Foot HEC Escher-Wyss Propellers Trail Shaft ..................... A-10
A-4 USCG 378-Foot HEC Propulsion Systems, Inc., Propellers Trail Shaft .... A-1
A-5 USCG 378-Foot HEC Escher-Wyss Propellers Locked Shaft .................... A-12
A-6 USCG 378-Foot HEC Propulsion Systems, Inc., Propellers Locked Shaft... A-13
Vi

LIST OF TABLES
Table
4-1 TYPICAL HIGH-ENDURANCE CUTTER OPERATING MODES .......................... 4-1
4-2 PARAMETER VALUES FOR ICEBREAKER OPERATING WAGB WESTWIND ................... 4-4
6-1 DUTY CYCLE MODES AND TIMES -- WMEC VALIANT ............................. 6-2
6-2 DUTY CYCLE MODES AND TIMES -- WMEC DECISIVE ............................ 6-2
6-3 DUTY CYCLE MODES AND TIMES -- WMEC DURABLE ............................. 6-3
6-4 PRINCIPAL THROTTLE POSITION USE -- WMEC ................................ 6-3
6-5 AVERAGE TIME-BASED MODAL WEIGHTING FACTORS -- WMEC ..................... 6-4
6-6 LOG BOOK DUTY CYCLE DATA -- WHEC CHASE ................................. 6-6
6-7 LOG BOOK DUTY CYCLE DATA -- WHEC GALLATIN .............................. 6-7
6-8a SUMMARY OF LOG BOOK DUTY CYCLE DATA FOR WHEC -- FIVE CUTTER-MONTHSOF OPERATION ........................................................... 6-8
6-8b OVERALL AVERAGE PER MONTH .............................................. 6-8
6-9a DUTY CYCLE MODES AND TIMES -- WHEC CHASE TAKEN FROM DUTY CYCLERECORDER SYSTEM ........................................................ 6-9
6-9b DUTY CYCLE MODES AND TIMES -- WHEC HAMILTON TAKEN FROM DUTY CYCLERECORDER SYSTEM ........................................................ 6-9
6-10 WHEC TIME-BASED MODAL WEIGHTING FACTORS ................................ 6-10
6-11 DUTY CYCLE MODES AND TIMES -- WAGS WESTWIND ............................ 6-12
6-12a CYCLE COMPOSITE FUEL CONSUMPTION -- 210B WMEC ......................... 6-15
6-12b OPTIMIZED CYCLE COMPOSITE FUEL CONSUMPTION -- 210B WMEC ................... 6-15
6-13 WHEC PERFORMANCE DATA TAKEN FROM SHIP INSTRUMENTATION ................. .. 6-16
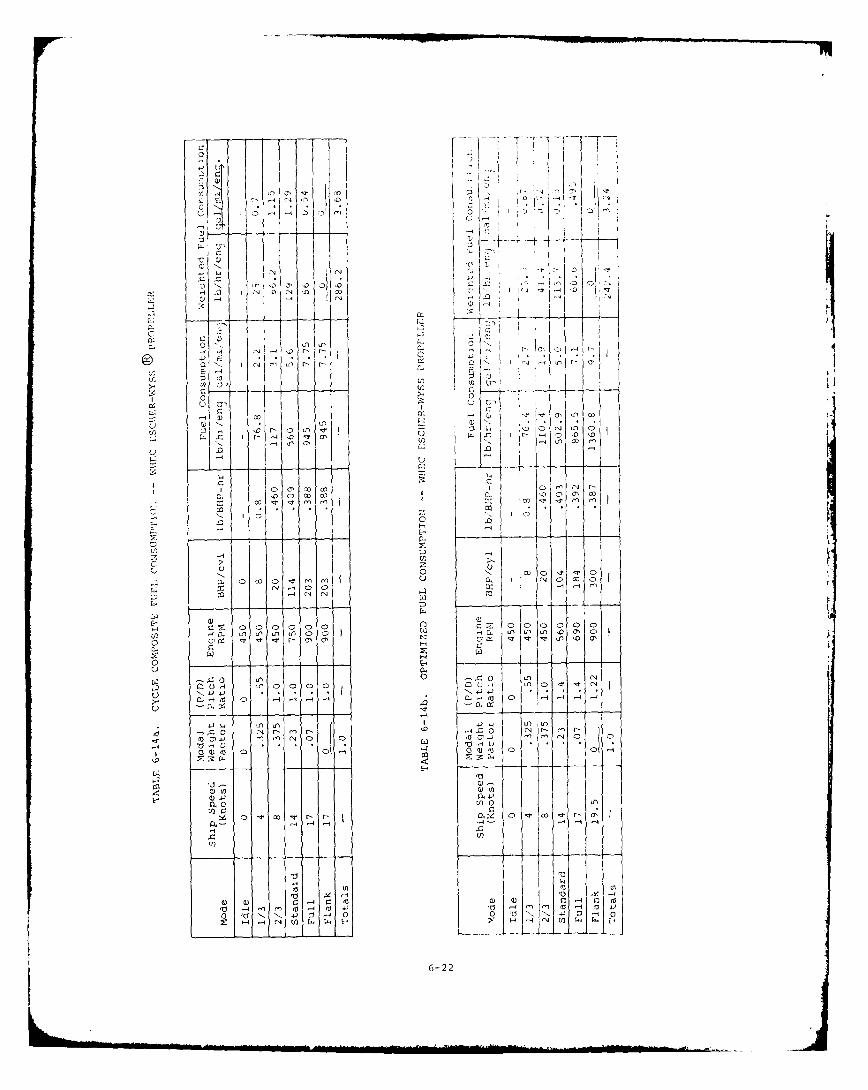
6-14a CYCLE COMPOSITE FUEL CONSUMPTION -- WHEC ESCHER-WYSS®PROPELLER ......... 6-22
6-14b OPTIMIZED FUEL CONSUMPTION -- WHEC ESCHER-WYSS PROPELLER .................. 6-22
6-15a CYCLE COMPOSITE FUEL CONSUMPTION -- WHEC PROPULSION SYSTEMS INC.0PROPELLER .............................................................. 6-23
6-15b OPTIMIZED FUEL CONSUMPTION -- WHEC PROPULSION SYSTEMS INC. PROPELLER... 6-23
6-16 378-FOOT SINGLE PROPELLER OPERATION .................................... 6-35
vii/viii

1. INTRODUCTION
1.1 BACKGROUND
An investigation of methods to reduce fuel consumption dnd improvo i.1e:ss
large in-service diesel engines used in locomotives and several classes of Coast CIuarucutters was begun by Southwest Research Institute in November 1974, under ContractDOT-TSC-920. This report encompasses the portion of that program which dealt wittl thL<optimization of fuel consumption for several classes of the larger Coast Guard cuttcrs.These classes include the 378-ft. High-Endurance cutters (378 WHEC), the 210-ft. Bseries Medium-Endurance cutters (210B WMEC), and Icebreakers (WAGB).
The fuel consumption of the main diesel engines of these cutters is of primuimportance to the Coast Guard since they use a major portion of the diesel fuel con-sumed by the entire Coast Guard cutter fleet. A DOT report1 placed this fuel con-sumption at 2.9 x 10⁷ gallons, of which approximately 37%, or 1.8 x 10⁷ gallons, wasconsumed by the diesel engines of the cutter classes of interest. However, thisfigure represents the fuel consumed by the main and auxiliary diesel power plants car-ried on board some of these cutters. The exact portion of usage by the main dieselsalone is unknown, but a reasonable estimate would be that at least two-thirds of thefuel consumed could be attributed to the main diesel engines. There are slightly overI00 such engines in Coast Guard ships.
2
Programmed variations in the operational characteristics of the medium- and high-endurance cutters (WMEC's and WHEC's) are possible since they are equipped withvariable-pitch propellers directly driven by the main diesel engines through a fixed-ratio speed reduction system. [Icebreakers (WAGB) have fixed-pitch propellers.] rhisvariable pitch feature allows for an infinite number of pitch/engine speed settingswhich will produce a given ship speed. However, the ships operate only at selectedsettings which are defined by a programmed pitch schedule. Optimization of the pitchschedule could produce acceptable cutter performance with minimum fuel consumption.
1.2 OBJECTIVES
The objectives of the tasks in this program were:
a. Define duty cycles for the high-endurance (378 WHEC) and medium-endurance(210B WMEC) cutters, and icebreakers (WAGB). That is, define the character-istic distribution of operating time among the various engine speed/pitchmodes for each class of ship.
b. Obtain a set of time-based modal weighting factors which define thecharacteristic utilization for normal operation of the main diesel enginesin these cutters.
c. Determine the overall effect of engine mode and propeller pitch changeson fuel consumption and cutter performance through analysis of propellerpitch/efficiency data for medium-endurance and high-endurance cutters.
1.3 APPROACH
Data needed to define the duty cycles for the three classes of Coast Guard cutterscovered in this report were obtained by instrumenting one or more cutters of each classand, where possible, through analysis of ships' log books. Further information oncutter operating practices and systems war furnished by ships' personnel and by theNaval Engineering Maintenance Branch of the Coast Guard.
IWillis, Lt., B., "WHEC 378 Fuel Consumption Study", U.S. Coast Guard Report Prelared
2 by G-OP Energy Branch, March 11, 1980.
Janes Fighting Ships, 1972-1973.
1-1

Analysis of propeller pitch/efficiency for the medium-endurance and high-endurance cutters required the use of design data for the controllable pitch propellersand for the cutters themselves. This information was obtained through the Coast G uardand from the technical literature. The performance maps for the main diesel engineswere developed in Phase I of this program from information furnished b, engine manu-facturers, as well as from a search of published technical literature.
The result of the study was an estimate of cutter fuel consumption through acorrelation between propeller and engine performance at the various operating modes.These estimates were then weighted according to the duty cycle information (modalweighting factors) to produce cycle composite fuel consumption figures. With knowledgeof propeller and engine performance, recommendations were made on operational changeswhich could reduce fuel consumption.
It should be pointed out that the Icebreakers were not included in the propellerpitch/efficiency study since they employed fixed pitch propellers and, as such, didnot have the latitude for variable propeller performance as with the WHEC and WMEC.Consequently, the sole objective in working with the Icebreakers was to define theirduty cycle.
4
3Storment, J. 0., R. J. Mathis, and C. D. Wood, A Study of Fuel Economy and EmissionReduction Methods for Marine and Locomotive Diesel Encines, Report No. DOT-TSC-OST-75-41 or CG-D-124-75, Department of Transportation/U.S. Coast Guard, September 1975.
1-2

2. CONCLUSIONS
2.1 DUTY CYCLE DATA
a. Each ship, in both WHEC and WMEC classes, characteristically operated in aspecificz set of throttle positions which correspond to conditions of enginespeed and load (or propeller pitch), and the percentage time spent in eachthrottle position was fairly constant from month to month.
b. The percentage time spent in each operating node and the total accumu-lated time for the two main propulsion engines were very nearly equal forthe WHEC's.
c. The distribution of percentage operating time among the throttle positionsfor the two engines on the WMEC's varied du to either frequent single-engine operation or the desire to balance power output between the twoengines.
d. Because of frequent two-engine operation (one per propeller) and the desireto balance shaft speed for the pair of fixed-pitch propellers, the distribu-tion of percentage operating time varied among the modes for the engines onthe icebreaker WESTWIND, the only WAGB included in this study.
2.2 FUEL CONSUMPTION ANALYSIS FOR MEDIUM- AND HIGH-ENDURANCE CUTTERS
a. Fuel consumption decreased for both classes of ships as propeller pitch ratiowas increased for a constant ship speed throughout the operating range whenoperating normally with both propellers driven.
b. The most substantial projected fuel savings resulted from a decrease inpropeller pitch at constant engine speed, decreasing shaft horsepower andcutter speed for both WMEC and WHEC.
c. No significant reduction in fuel consumption appeared possible for the WMECwhen operating normally by increasing pitch ratio at constant ship speed sincethe cutter is currently operating at or near a condition of minimum fuelusage.
d. Of the two propellers utilized on the WHEC's, the Escher-Wyss was found tobe significantly more efficient, resulting in a decrease in fuel consumptionof approximately 14% on a cycle composite basis over the Propulsion Systems,Inc. (PSI) design when operating on the current pitch schedule.
e. Fuel consumption savings are theoretically possible in the 2/3 and Fulloperating modes on the WHEC without sacrificing cutter speed if the ditchcan be increased beyond the present limit of 1.0 to 1.4. The limitation hereis the engine torque available to turn the prop at higher pitch settings.
f. Single-engine operation of the WHEC did not reduce fuel consumption at shipspeeds of 10 knots or more. Single-engine operation is believed to be mostbeneficial below this speed; however, propeller and cutter performance datawere not available to allow a firm conclusion on this point.
g. When operating with a single propeller, the free propeller should be rotatingat the maximum pitch setting. A locked propeller results in a large increasein drag and, therefore, higher fuel consumption.
2-1/2-2

3, RECOMMENDATIONS
a. Obtain engine and cutter performance data for the WMEC's and WHEC's throughcutter testing. The data should be extensive enough to reconstruct thepropeller diagrams. Provisions should be made to measure engine fuel con-sumption, power output (possibly using a torsion meter), engine speed,propeller pitch, and ship speed for points throughout the operating range.As part of these tests, determine the maximum pitch which can be obtainedthroughout the diesel engine speed range and the resulting cutter speeds.
b. Compare the performance data to the present propeller diagrams to verify theiraccuracy. If necessary, correct the propeller diagrams to reflect true cutteroperating characteristics. Ascertain that postulated mode changes are pos-sible in practice and that they conserve fuel.
c. Expand the slow ship speed (less than 10 knots) portion of the WHEC propellerdiagrams for single-engine and normal two-engine operation, calculate fuelrates for slow-speed operation, and determine if and when single-engineoperation has merit. Verify the single-engine operation propeller diagramsthrough WHEC testing.
d. Perform an analysis of single-engine operation for medium-endurance cutters.Again, this type of operation is most advantageous in the ship speed rangebelow 10 knots, and the analysis should concentrate on this region. Thiswould require generation of a single-engine operation propeller diagram forthis cutter class.
e. The Coast Guard should perform an in-house cost/benefit analysis to determinethe advantages of replacing the WHEC Propulsion Systems, Inc. (PSI) propellerswith the more efficient Escher-Wyss design. Because of the accuracy of thedata on hand, performance data as obtained in recommendation 1 for bothpropeller designs should be the basis for the analysis.
3-1/3-2
4, DUTY CYCLE DATA ACQUISITION
4.1 PROPULSION SYSTEMS AND OPERATING MODES
4.1.1 -i nd Medium-Endurdnce Cutters (WHEC's and WMEC's)
The propulsion systems on the high- and medium-endurance cutters employ a direct-drive concept in whicl the main propulsion units are coupled directly to variablepitch propellers through a constant-ratio gear reduction system. The main machineryon the WHPC s is a coo'bined diesel engine/gas turbine (CODOG) arrangement in whichoperation is possible on either gas turbines or diesel engines. The first five WMEC's(2ICA class) were built with a combined diesel engine/gas turbine (CODAG) arrangementwhere ,ss turbines and,'or diesel engines could be used. The remainder of the WMECfleet (>S class) employed only diesel engines for propulsion, again utilizing thedirect drive systen.
4 ,5,6
!'he diesel enoines in both cutter classes operate only in a distinct set of modeswhich are defined by engine speed and propeller pitch. Mode selection from the pre-prora::Q:ed pitch schedule is accomplished by the position of a control handle, one fore~ch enine. I'he arrangement is such that, as the handle is moved from the lowest tothe hi-hest setting, propeller pitch is increased from zero to maximum at a constantencine idle speed, at which point speed is increased until it reaches its maximum valuewhile pitch is held at the maximum value. Typical throttle schedules for these enginesare plotted in Figures 4-1 and 4-2.
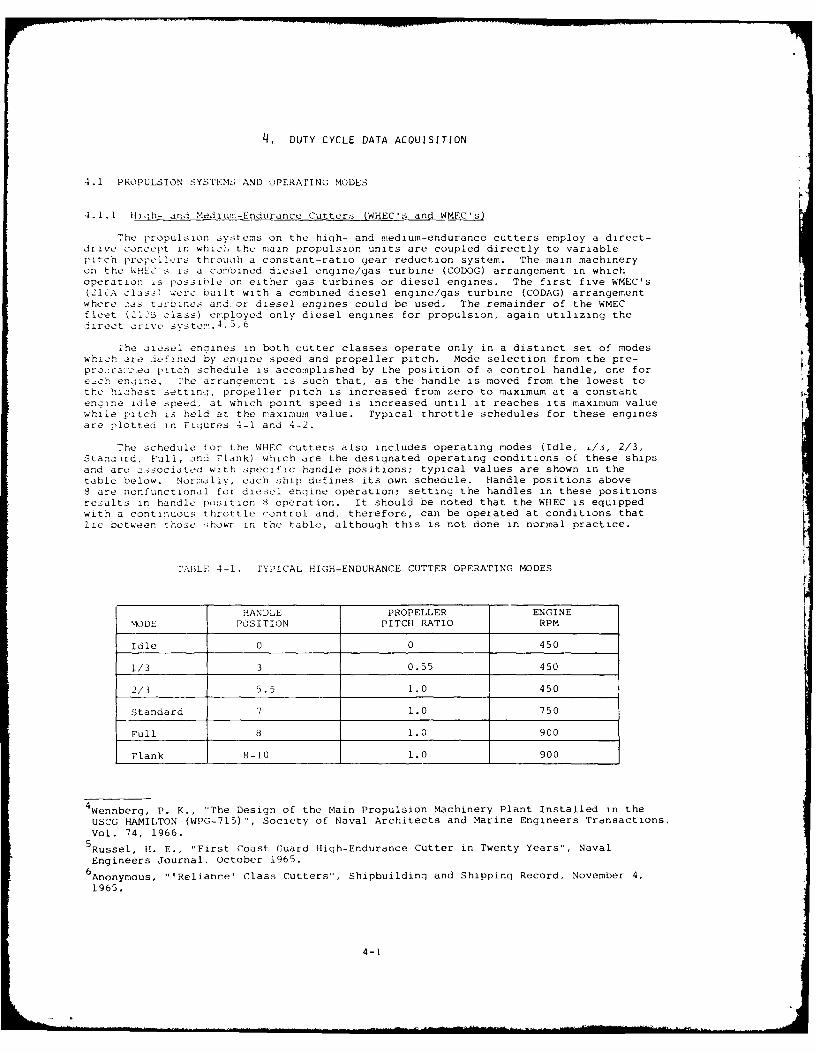
The schedule for the WHEC cutters also includes operating modes (Idle, /3, 2/3,Standard, Full, and Flank) which are the designated operating conditions of these shipsand are c sociatea with specific handle positions; typical values are shown in thetable below. Normally, each ship defines its own schedule. Handle positions aboveS are nonfunctional for diesel engine operation; setting the handles in these positionsresults in handle position 8 operation. It should be noted that the WHEC is equippedwith a contLnuous throttle control and, therefore, can be operated at conditions thatlie between thosc shuY in the table, although this is not done in normal practice.
TABLE 4-1. TYPICAL HIGH-ENDURANCE CUTTER OPERATING MODES
HANDLE PROPELLER ENGINE"AODE POSITION PITCH RATIO RPM
Idle 0 0 450
1/3 3 0.55 450
2/3 5.5 1.0 450 1
Standard 7 1.0 750
Full 8 1.0 900
Flank 8-10 1.0 900
4Wennberg, P. K., "The Design of the Main Propulsion Machinery Plant Installed in theUSCG HAMILTON (WPG-715)", Society of Naval Architects and Marine Engineers Transactions,Vol. 74, 1966.
5 Russel, H. E., "First Coast Guard High-Endurance Cutter in Twenty Years", NavalEngineers Journal, October 1965.
6Anonymous, "'Reliance' Class Cutters", Shipbuilding and Shipping Record, November 4,1965.
4-I

1.2
1 .1
1.0 100
0.9 -900
0.8 800o
0 0.7 700
-0.6 600
0.5 500
0.4 400
0.3 300
0.2 200
0.110
0
HANDLE POSITION
FIGURE 4-1. 270B WMEC THROTTLE SCHEDULE
4-2

.9 --- 900
.8 -- 800
. 7 - 700
D6 - 600
.5 __500
4 400
3 - 300
- 200
- 100
00 1 2 3 4 5 6 7
HANDLE POSITION
WHEC PITCH SCHEDULE(USED ON ALL WHEC'S)
FIGURE 4-2. 378-FOOT WHEC THROTTLE SCHEDULE
4-3
.......
- . . . _ _ _
The main diesel engines of the WMEC and WHEC are equipped with governors that
maintain the designated engine speed (or shaft speed) for a particular throttle posi-
tion as long as the load does not surpass the maximum engine capacity at that speed.Literature sources (4) (6) state that, if the load demand exceeds this maximum figure,the control system automatically reduces propeller pitch until the load demand equalsthe power available at that engine speed. Consequently, a constant-speed/variable-loadsystem is employed which produces the nominal power output that is required to achievethe desired propeller speed under average cutter operating conditions (wave height,wind velocity, draft, etc.). Changes in these conditions will increase or decreasethe enline power output demand relative to this nominal value, and the engine controlmechanism will respond accordingly to maintain constant speed. However, informationfrom the Coast Guard 7 contradicts these sources; presently, propeller pitch does notchange unless the control handle is moved. The engines are not protected from over-load: consequently, englne speed decreases if overload occurs.
4.1.2 WIND Class Icebreakers (WAGB)
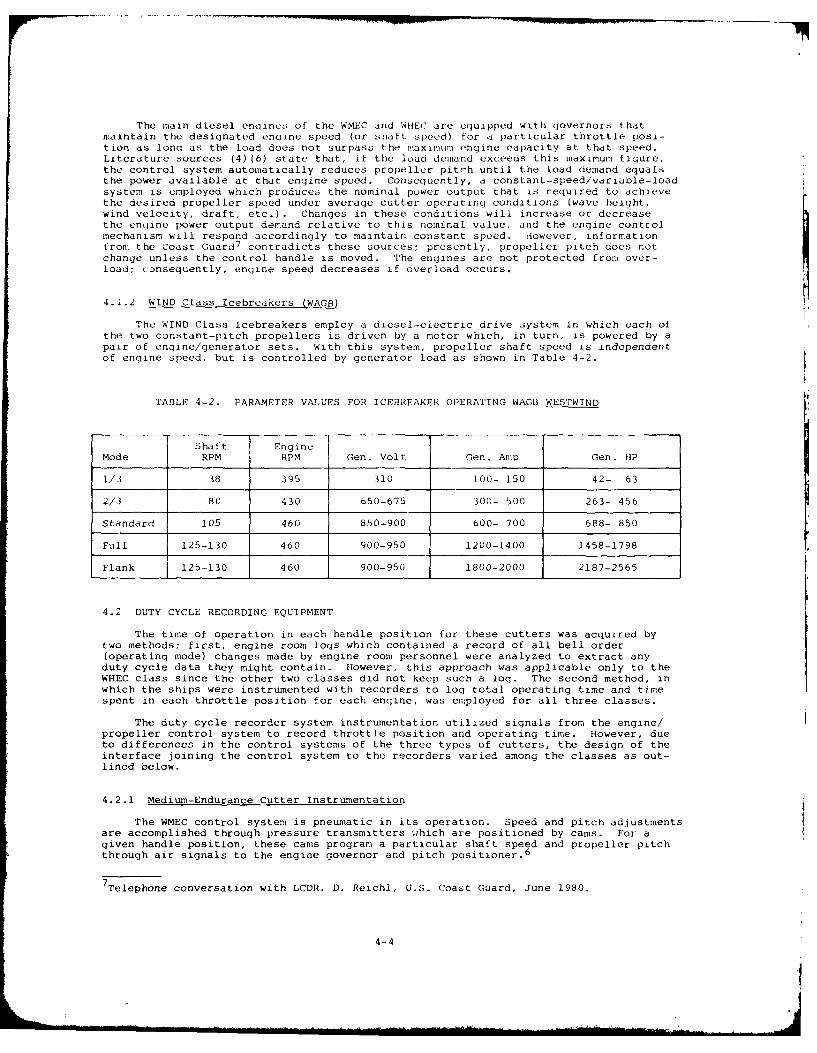
The WIND Class Icebreakers employ a diesel-electric drive system in which each ofthe two constant-pitch propellers is driven by a motor which, in turn, is powered by apair of engine/generator sets. With this system, propeller shaft speed is independentof engine speed, but is controlled by generator load as shown in Table 4-2.
TABLE 4-2. PARAMETER VALUES FOR ICEBREAKER OPERATING WAGB WESTWIND
Shaft EngineMode RPM RPM Gen. Volt Gen. Amp Gen. HP
1/3 38 395 310 100- 150 42- 63
2/3 8C 430 650-675 300- 500 263- 456
Standard 105 460 850-900 600- 700 688- 850
Full 125-130 460 900-950 1200-1400 1458-1798
Flank 125-130 460 900-950 1800-2000 2187-2565
4.2 DUTY CYCLE RECORDING EQUIPMENT
The time of operation in each handle position for these cutters was acquired bytwo methods; first, engine room logs which contained a record of all bell order(operating mode) changes made by engine room personnel were analyzed to extract anyduty cycle data they might contain. However, this approach was applicable only to theWHEC class since the other two classes did not keep such a log. The second method, inwhich the ships were instrumented with recorders to log total operating time and timespent in each throttle position for each engine, was employed for all three classes.
The duty cycle recorder system instrumentation utilized signals from the engine/propeller control system to record throttle position and operating time. However, dueto differences in the control systems of the three types of cutters, the design of theinterface joining the control system to the recorders varied among the classes as out-lined below.
4.2.1 Medium-Endurance Cutter Instrumentation
The WMEC control system is pneumatic in its operation. Speed and pitch adjustmentsare accomplished through pressure transmitters which are positioned by cams. For agiven handle position, these cams program a particular shaft speed and propeller pitchthrough air signals to the engine governor and pitch positioner.
6
7Telephone conversation with LCDR. D. Reichl, U.S. Coast Guard, June 1980.
4-4

The duty cycle recorder system used on these cutters employed a mechanical switch-ing device which was fabricated to fit the engine control camshafts located under thepilot house control console. The switch program was arranged such that the numbered(0 through 8) handle positions activated the recorder channel with the same number,while the "one-half" or in-between positions activated both adjacent channels. Astrip chart recorder capable of recording 20 channels of "on/off" events on heatsensitive paper was mounted in the Combat Information Center (CIC) room directly belowthe control console. Also, two digital run-time meters were installed in the engineroom control station to log total individual engine running time.
The interface was connected to the pilot house (bridge) controls. These controlsdid not function when ship control was transferred to the engine room7 as a result,the recording system failed to log this time. The total operating time from the runtime meters was compared to the sum of the individual modal times from the strip chartsto determine the amount of time actually spent under engine room control.
Additionally, total operating time was needed for the calculations of idling timesince the pilot house throttles were left in the "idle" position when (a) engines wereindeed idling, (b) engines were under engine room control, (c) engines were secured.Consequently, the charts indicated a large amount of time for the idle position whichdid not actually involve engine idle operation. The method used to calculate idle timewas as follows:
(engine room meter running time) minus (sum of chart recorder timesfor "non-idle" conditions) minus (estimate of time spent underengine room control) equals (engine idling time).
Duty cycle data was collected from recorders installed on the medium-endurancecutters DECISIVE, VALIANT, and DURABLE (WMEC's 629, 621, and 628).
4.2.2 High-Endurance Cutter Instrumentation
Propeller pitch and engine speed of the WHEC's are regulated by an electroniccontrol system which operates in the same fashion as the pneumatic system described forthe WMEC's. Monitoring handle position directly as an indicator of operating mode wasimpractical in this case. Rather, engine speed was recorded using the voltage outputof the shaft tachometer to activate the corresponding channel of a strip chart recorder(one channel per engine) through a voltage comparator. As with the WMEC's, run-timemeters logged total individual engine operating time. Idling time was calculated asthe difference between total operating time shown on the run-time meters and the sumof "non-idle" operating conditions recorded on the strip chart. Two WHEC's, theHAMILTON and CHASE (nos. 715 and 718), were instrumented in this manner. Additionally,duty cycle data was extracted from the engine room logs of the cutters CHASE andGALLATIN (WHEC 721).
4.2.3 Icebreaker Instrumentation
As previously mentioned, the WIND Class Icebreakers employ a diesel-electric drivesystem as opposed to a diesel/gas turbine arrangement. Since propeller speed is in-dependent of engine speed for this system, it was necessary to record the generatoroutput as well as the engine speed to determine an operating mode. Consequently, fourstrip chart recorders, one for each engine/generator set, monitored engine speed andgenerator voltage and amperage. As with the WHEC's, the voltage output of the tach-ometers was used to determine engine speed. In this case, the strip chart recordersran continuously so that total operating time and idle time could be extracted directlyfrom the charts. This system was installed on the WESTWIND (WAGB 281).
4.3 DATA REDUCTION
Reduction of the duty cycle data taken from the high- and medium-endurance cuttersamounted to summing, for each channel, the time that information was recorded by thatchannel. Total time indicated by a channel corresponded to total operating time ina particular mode. Using the information from the run-time meters installed on eachengine, idling time was computed as indicated earlier.
4-5

Information from the icebreaker's recordinq system was analyzed in a simlldrfashion: however, a correlation was necessary between engine speed and generatoramperage and voltage to establish an operatinq mode. Some of the data from the chaitfell between two modes, and it was necessary to establish tolerance bands around therecorded parameters. Thus, the grouping of data was determined by a "go-no go" decisionas to whether the operating mode was, for example, Standard or Full. A discussion ofthese variations and their grouping is included in a later section of this repott.
Time-based modal factors were computed for each of the cutters indicating thepercentage time spent in each operating mode. This was performed on a chart-to-chartbasis (approximately one month running time per chart), as well as on a cumulativebasis to provide an assessment of month-to-month changes for each cutter.
4-
4-6

5, PROPELLER PITCH/EFFICIENCY ANALYSIS
information was obtained on propeller, cutter, and engine performance of the:v~doux:- and hi(Th-endurance cutters for the purpose of evaluating the effect of modechanges on fuel consumption and cutter performance. This included propeller diagrams,which relate shaft horsepower to propeller shaft speed throughout the design pitch andspeed range, and engine performance maps for the main propulsion units. Since direct-irive populsion systems were employed, each point on the propeller diagram uniquelydetermined the engine load and speed conditions. Fuel consumption was co:.putedthroughout the range of data available on propeller and engine perforcance. A1so,a cycle composite fuel consumption (the average fuel usage rate based orn a Ditchschedule and weighted by the time-based modal factors) was developed.
Two discrepancies arose when working with the high-endurance cutter. twas found that two different propellers were in use, earlier cutters (WHEC's 7115 tnKoah718) were equipped with propellers manufactured by Propulsion Systems, Inc., whe tr.eremaining cutters (WHEC 719 - WHEC 726) used an Escher-Wyss design. Consequently, itwas necessary to obtain the propeller diagrams for both makes and then perfor:- teanalysis for each case. Second, these ships were reported to be approximately 1,Xover the design weight, which resulted in increased ship draft and increased hullresistance. It was thus necessary to correct propeller diagrams for both configura-tions to account for the added horsepower necessary to propel the ship at a given speed.The correction was provided by Professors William Vorus and M. G. Parsons of theUniversity of Michigan; a detailed report is included in Appendix A.
Recommendations for changes in the pitch program of the WMEC's and WHEC's forimproved fuel consumption were based on data from the propeller diagrams and enginefuel consumption maps; these data were analyzed by two methods. First, alterationsin the engine speed/propeller pitch combinations were restricted to produce the samevessel speed in each mode as the existing schedule; second, changes were made withoutthis restriction.
Additionally, single-engine operation of the high-endurance cutters was considered.The principle behind this type of operation is as follows: At slow ship speeds, themain diesel engines are forced to operate at slow speed-low load conditions, resultingin high brake specific fuel consumption (BSFC). Transferring propulsion to a singleengine would shift the operating point to a higher speed-load condition at the sameship speed, thus reducing BSFC but increasing the total fuel consumption of that engine.Single-engine operation would then be advantageous if total fuel consumption was lessthan the total for two-engine operation.
Single-engine operation has, in fact, been used by WHEC's, although not specifical-ly for a reduction in fuel consumption and primarily at the discretion of the command-ing officer. The usual procedure was to allow the unused propeller to freewheel atfull-ahead pitch, disengaging it after it had been in operation. The propeller con-tinued to rotate, but it was reported that, if the ship slowed to the point where thefree propeller stopped, it would not start to rotate once the ship got underway again.WHEC's were reputed to achieve 10.5 knots on one screw at an engine speed of 660 RPM,but at unknown pitch.
The propeller diagrams for both Escher-Wyss and PSI designs were modified forsingle-engine operation with considerations for a trailing (rotating) and a lockedpropeller shaft (Appendix A). Fuel consumption data were analyzed throughout thepermissible operating range to determine if, and when, single engine operation wasfeasible.
5-1/5-2
6, DISCUSSION OF RESULTS
6.1 MEDIUM-ENDURANCE CUTTER (NMFC) DUTY CYCLE DATA
The data from the duty cycle recorder systems for the medium-endurance cuttersVALIANT, DURABLE, and DECISIVE are presented in Tables 6-1 through 6-3. While analyz-ing the charts from the recorders, it was observed that all of the WMEC's showed onlyminor redistribution of the percentage time spent in each operating position frommonth to month, though there were monthly variations in total running time.
In general, both engines of a ship operated primarily in the same range of throttlepositions, but the individual modal percentages varied somewhat between the two en-gines of each vessel; this situation could have been due to either an imbalance inengine power output or because of the fact that the WMEC's frequently operated on oneengine. The DURABLE and the DECISIVE, respectively, logged 23% more time on the portengine; the times for the VALIANT differed by only 4%. Additionally, the most com-monly used throttle positions varied among the ships. For example, the DECISIVEoperated principally in positions 3 to 4 1/2, while the DURABLE employed positions 6to 6 1/2 most frequently (Tables 6-2 and 6-3). The primary throttle positions employedby the cutters and the time spent in that range are summarized in Table 6-4.
A set of time-based modal factors was generated for the WMEC's by summing theoperating time for both engines in a particular operating mode and computing thepercentage of total operating time that this represented. These results are summarizedin Table 6-5. The modal weighting factors indicate that the vast majority of thecombined operating time (78%) was spent in handle positions 3 to 6 1/2 and half ofthe remainder was spent at Idle. Handle positions 8 and 1 to 1 1/2 were, for allpractical purposes, unused.
6-1
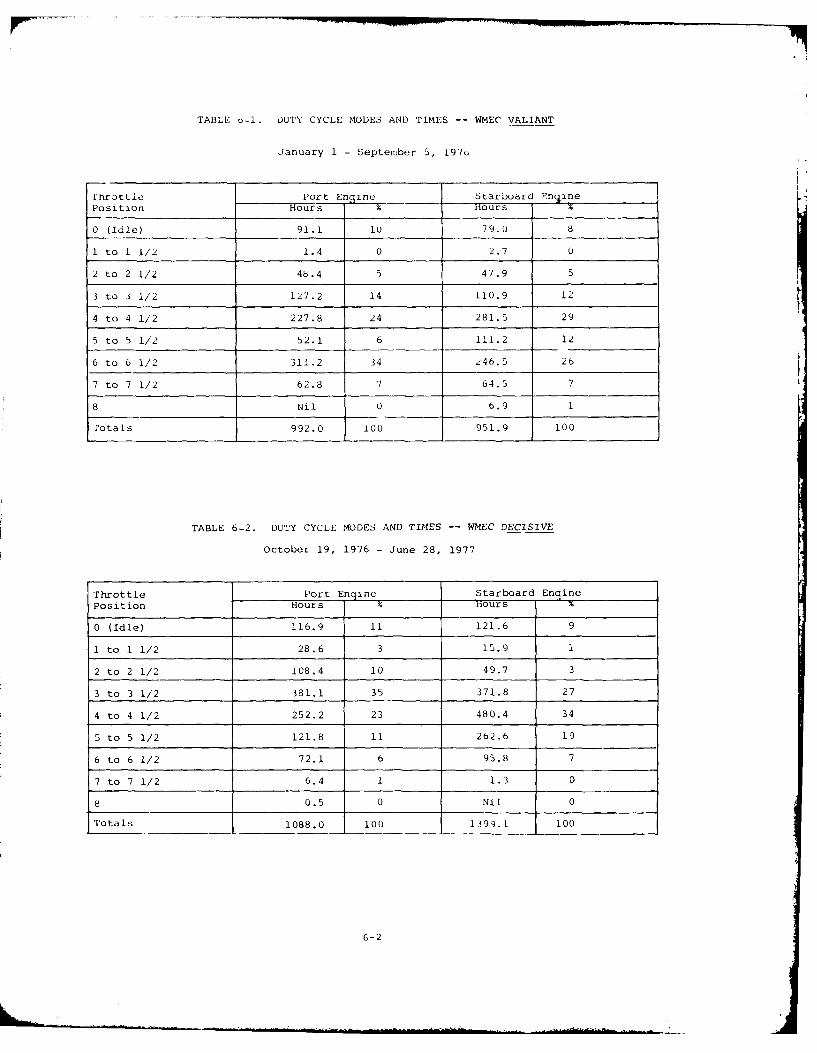
TABLE u-1. DUTY CYCLE MODES AND TIMES -- WMEC VALIANT
January 1 - September 5, 1976
Throttle Port Engine Starboard FnPine
Position Hours % uours x
0 (Idle) 91.1 10 79.0 8
1 to 1 1/2 1.4 0 2.7 0
2 to 2 1/2 48.4 5 47.9 5
3 to 3 1/2 127.2 14 110.9 12
4 to 4 1/2 227.8 24 281.5 29
5 to 5 1/2 52.1 6 111.2 12
6 to 6 1/2 311.2 34 246.5 26
7 to 7 1/2 62.8 7 64.5 7
8 Nil 0 6.9 1
rotals 992.0 100 951.9 100
TABLE 6-2. DUTY CYCLE MODES AND TIMES -- WMEC DECISIVE
October 19, 1976 - June 28, 1977
Throttle Port En 3ne Starboard EnqinePosition Hours % Hours x
0 (Idle) 116.9 11 121.6 9
I to 1 1/2 28.6 3 15.9 1
2 to 2 1/2 108.4 10 49.7 3
3 to 3 1/2 381.1 35 371.8 27
4 to 4 1/2 252.2 23 480.4 34
5 to 5 1/2 121.8 11 262.6 19
6 to 6 1/2 72.1 6 9S.8 7
7 to 7 1/2 6.4 1 1.3 0
8 0.5 0 Nil 0
Totals 1088.0 100 1399.1 100
6-2

TABLE 6-3. DUTY CYCLE MODES AND TIMES -- WMEC DURABLE
April 11 - September 1, 1976
7hrottle Port Engine Starboard Engine
VoSitlOiu Hours % Hours
0 (Idle) 122.7 16 93.6 15
1 to 1 1/2 2.4 0 6.0 1
2 to 2 1/2 22.6 3 24.6 4
3 to 3 1/2 50.0 6 38.0 6
4 to 4 1/2 57.8 7 45.3 7
5 to 5 1/2 85.3 11 104.3 16
6 to 6 1/2 258.9 32 328.8 51
7 to 7 1/2 191.2 25 1.0 01
8 Nil 0 Nil 0
Totals 790.9 100 641.6 100
TABLE 6-4. PRINCIPAL THROTTLE POSITION USE -- WMEC
Average Monthly % TIME
ShiD Operating Time Throttle Position Port Starboard
(Port-Starboard)
VALIANT (115-120) hr/mo 3 to 6 1/2 78% 79%
DURABLE (160-130) hr/mo 4 to 6 1/2 50% 74%
DECISIVE (135-175) hr/mo 3 to 5 1/2 69% 80%
6-3

(a H 0 H 0 C H ( ' N 0 ''04--- .j 40,C 0 0) ID0 0 0 z '
-- 4 In
L44 cc~ 0)0 0 -4 0N 0' O ( '
c, -0 (N "4 a - 24 -4
L4 ID IT 00 If CO ' CO '
L4
z zr
cQ C
<
CO 4-4 C') ~ 0 '4 A4 4) ' O '
411~~If 0- C ' ( ')-0 (- ~ ~ I 041' )
( -1 (N (N 0 0' 4) 0) 0H '
'4: 'n" I
6-

6.2 HIGH-ENDURANCE CUTTER (WHEC) DUTY CYCLE DATA
The WHEC duty cycle data obtained from the on-board recording system were sup-plemented by information extracted from engine room logs, which contained a record ofbell orders (mode changes) received from the bridge. These records were, however,found to be incomplete or at least ambiguous concerning important details. The find-ings are summarized below:
a. The bell order record was kept when the engines were on engine room control,but not when pilot house control was used.
b. Recorded bell orders by themselves were insufficient to allow the amount ofengine idle time to be determined. However, discrepancies were partiallyresolved by inspection of the watch officer's log entries for comments con-cerning the times that an engine was secured (stopped) and restarted.
c. There were instances when the engines were on engine room control, but thereoccurred a rapid series of bell orders from the bridge. The analysis of sucha situation adds greatly to the total analytical time, yet adds little usefulinformation since the operating time involved is usually short compared tothe total engine operating time. Therefore, these situations were skippedover without significantly degrading the data.
The actual duty cycle data which were extracted from the engine room logs of theWHEC's CHASE and GALLATIN are shown in Tables 6-6 and 6-7. In general, the distributionof time between engine room control and pilot house control, and among the variousengine modes, was relatively constant even though total monthly operating time variedgreatly. The majority (80-85%) of the operating time was spread over 1/3, 2/3, andStandard modes, with the Standard condition receiving the higher use. Idle time wasusually less than 10% of the total, while the combined operating time at Flank andFull was usually less than 10%. A summary of the combined log book data is presentedin Table 6-8, which confirms the general remarks given here. During the 10-monthperiod studied, each engine operated an average of 261 hours per month, which cor-responds to about eleven (Ii) days per month, a time utilization factor of approximate-ly 36%. Based on maximum engine power output of 3600 brake horsepower at full speed,and using the average percentages for the combined data, a power utilization factorof 46.0% was calculated for the WHEC main diesel engines. A cycle composite brakespecific fuel consumption (BSFC) of 0.397 pounds per brake horsepower-hour was computedbased on the engine manufacturer's published BSFC values for each operating mode.
The duty cycle recording system results for the WHEC's CHASE and HAMILTON areshown in Table 6-9. Data from the CHASE followed essentially the same monthly patternas did the log book data, but a slight deviation from log book data was noted as engineoperation was primarily at 1/3 and 2/3, while Standard condition occupied most of theremaining portion. Operation at Full was slight, and little or no time was recordedat Idle and Flank speeds. Average monthly operation was almost 300 hours per engine.Total accumulated hours for the two engines were within two percent, and the percentagetime spent in each mode by each engine was very nearly equal.
In contrast to the CHASE, the HAMILTON accumulated a significant amount of Flankoperating mode (42% to 45%). It is possible that this type of operation may have beenpeculiar to a specific mission and, as such, is not indicative of normal operatingconditioks. Other patterns are similar to the CHASE in that percentage time in eachmode for ach engine and total accumulated time for the two engines was almost equal.However, total recorded operating time for the six-month data acquisition period wasless than 300 hours; this very low utilization is due to the fact that the HAMILTONwas in port for several months for maintenance. After the ship returned to duty,problems arose with the instrumentation so that little usable data was returned toSwRI for analysis.
The time-based modal factors for the high-endurance cutters were computed frominformation taken from the duty cycle recorders on-board the CHASE. This was deemedto be the most extensive and most accurate data available. The resulting factors areshown in Table 6-10 and reflect the trends described previously for the CHASE.
6-5

ABLE u-b. LOG BOOK DUrY CYCLE DATA - WItEC CIIAS?
Port Engi e Starboard EnginePeriod Covered Hours lours.
AUGUST 195
Total Operatin g T4m 403.7 1 ] 3).7!Engine Room Control 27.56 2b5.5
Pilot House Control ,5.2 31 125.2
Engine Mode
Idle 20.- 7 j1 3 69.5 2 3,.02 3 27.3 1 -t. 4 1oStandard 133.1 40 125.0 47Fu1 8.4 3 8.4 3Flank Nil_-_ 0 Nil 0
Totals 278.5 1uu 265.5 100
OCTOBER 1975
Total Operating Time 183.5 100 187.o 100Engine Room Control 156.0 85 160.1 85Pilot House Control 27.5 15 .9.5 15
Engine Mode
Idle 17.5 ii 16.6 101/3 30.1 20 33.0 212/3 29.6 19 30.8 19Standard 78.5 50 79.4 50Full 0. 3 0 0. 3 0Flank Nil 0 N l 0
Totals 156.0 100 160.1 100
NOVEMBER 1975
Total Operating Time 194.8 100 195.1 100Engine Room Control 164.1 84 164.4 84Pilot House Control 30.7 16 30.7 it
Engine Mode
Idle 17.2 10 15.0 91/3 13.3 8 lU. 102/3 12.6 8 11.0 6Standard 116.9 71 118.0 72Full 1.0 1 1.0 1Flank 2.6 2 2.6 2
Totals ibS.1 100 L u4.4 1i0
(-6

TABLE 6-7. LOG BOOK DUTY CYCLE DATA - WHEC GALLATIN
Period Covered Port En ine Starboard EngineHours Hours %
SEPTEMBER 1975
Total Operating Time 186.0 100 215.6 100Engine Room Control 171.6 92 201.2 93Pilot House Control 14.4 8 14.4 8
Engine Mode
Idle 16.8 10 14.1 71/3 34.0 20 36.8 182/3 32.2 19 55.4 28Standard 68.4 40 74.8 37Full 15.5 9 15.4 8Flank 4.7 2 4.7 2
Totals 171.6 100 201.2 100
OCTOBER 1975
Total Operating Time 301.5 100 351.7 100Engine Room Control 287.0 95 337.2 96Pilot House Control 14.5 5 14.5 4
Engine Mode
Idle 13.1 4 16.4 51/3 36.2 13 17.6 5
3 79.5 28 70.4 21
Standard 135.1 47 209.8 62Full 19.7 7 19.6 6Flank 3.4 1 3.4 1
Totals 287.0 100 337.2 100
6-7

TABLE 6-8a. SUMMARY OF LOG BOOK DUTY CYCLE ATA FQ. WlLC -- FIVE CUTTF'.-:IiF CFOPERATION
Port EnQine Avcra;& Starboard Enqine AveraaQ
Hours Hours
Total Operating Time 253.9 100 -68.1 100
Engine Room Control 211.4 83 225.1 84Pilot House Control 42.5 17 12.5 16
Engine Mode
Idle 17.0 8 17.61/3 40.7 20 36.8 162/3 36.2 17 38.8 17
Standard 106.4 50 121.4 54Full 9.0 4 9.0 4Flank 2.1 1 2.1 1
Totals 211.4 100 225.7 100
TABLE 6-8b. OVERALL AVERAGE PER MONTH
Total Operation for10 EnQine-MonthsHours %
Total Operating Time 261.0 100Engine Room Control 218.5 84Pilot House Control 42.5 16
Engine Mode
Idle 17.3 81/3 38.7 182/3 37.5 17Standard 113.9 43Full 9.0 4Flank 2.1 1
Totals 218.5 100
6-8

TABLE o-9a. DUTY CYCLE MODES AND TIMES -- WHEC CHASE TAKEN FROM DUTY CYCLE RECORDERSYSTEM
March 15 - August 20, 1976
Enqine Port Engine Starboard EnaineMode Hours % Hours
Idle 0.1 0 0.3 0
1/3 497.6 33 462.9 32
2/3 550.8 37 555.0 38
Standard 334.3 23 334.6 23
Full 105.9 7 104.9 7
Flank Nil 0 Nil 0
rotats 1488.7 100 1457.7 100
TABLE 6-9b. DUTY CYCLE MODES AND TIMES -- WHEC HAMILTON TAKEN FROM DUTY CYCLERECORDER SYSTEM
October 19, 1976 - April 15, 1977
Engine Port Enoine Starboard EngineMode Hours Hours
Idle 2.4 1 0.8 0
1/3 34.3 12 20.1 8
2/3 54.2 19 49.0 19
Standard 41.3 15 45.5 17
Full 29.8 11 30.2 11
Flank 120.0 42 117.4 45
Totals282.0 100 263.0 100
6-9

'['ATqi> Is-lcl. alit':C !'IME- t.S !.%L W! I ',II IN' ,A 'TOb,.
of Total
Idle t
1/3 2.5
2/3 $.
Standard 23
Fu I I
Flank
Total I0
6. 1 WIND CLASS ICEBREAKER (WACB) DUTY CYCLE DATA
Duty cycle data from the Icebreaker WESTWIND are shown in Table 6-11. No datawere available for engine 2A due to a recorder problem, which was compounded when the2A generator failed. It should be pointed out at this time that the WESTWIND wasdamaged and underwent drydock repairs during the icebreaking season; this precludedobtaining data during such operation. The project was terminated before the nexticebreaking season, so that the data given here represents operation in open-waterconditions during a North Sea cruise.
From Table 6-11, it can be seen that operatinU time and percentages varied some-what among the modes for the three engines, these variations are believed to occurfor three reasons. First, some of the data from the recorder charts fell between twomodes. As a result, the data grouping was determined by establishing arbitrary toler-ance bands around the recorded parameters, which introduced a degree of uncertainty inthe analysis. The second factor causing time variations among the modes was the de-sire to keep the two propeller shafts rotating at the same designated speed and theen _nes producing equal power for each shaft. Adjustment of individual engine operat-ing modes was required to obtain this balanced condition with the diesel-electricpropulsion system, therefore, engines on the same shaft can be compared, but not en-glines on opposite shafts.
7 Third, in an effort to reduce fuel consumption, the ice-
breaker regularly operated on just two of the four engine/generator sets, using oneset per propeller. This increased the load on each engine and caused them to operateat a lower BSFC. Total operatinq time was balanced by alternating the two enginesused in this manner.
The data indicated that a slqnificant amount of time was spent in the Full andFlank modes. This was probably due to the fact that the icebreaker was on an extendedcruise in the North Atlantic and wa: not engaged in any icebreaking activity. The 2/3mode received only minor use, and the remainder of the operating time was evenly dis-tributed among idle, 1/3, and Standard. Since the data do not include icebreakinqactivities and represent a relatively siort operating period for a single cutter,these observations cannot be used to leneralize icebreaker operation.
6.4 MEDIU UM-ENDURANCE CUTTER PROPELLER PITCH/'FN(INE PERFORMANCE ANALYSIS
Fuel consumption of the WMEC'.s (in terms Of pounds p't hour per engine and gallonsper nautical mile per engine) and the percentaq e increase in each quantity from theminimum value for a given ship speed were calculited for point: throughout the cutterspeed and propeller pitch ranges. Basic data and results of these computations arepresented in Appendix B. These engine fuel coniiumption filure:, have been mapped ontothe propeller diagram in Filure 6-1 as a function of cutter speed and propeller pitch.
6-10

26
24 1.2 PITCH RATIO24 (P1011.13FUEL
2UEL CONSUMPTION 1.13
22 (LB/HR/ENG) 750_i
~1.120 18
18
16 1.0
SHPELE SPE
00.
ILI
12
m2 12
10 35.0.8
0.7
610.6
41
2 uj w
0 V-9
120 140 160 180 200 220 240 260 280 300
PROPELLER RPM
FIGURE 6-1. WMEC PROPELLER DIAGRAM WITH FUEL CONSUMPTION
6-11

TABLE u-11. DUTY CYCLE MODES AIND IIMl; -- WB WES YWIND
March IS
Engine Fn in ___ EnQine 2A I EnErni - n 2bMode Hours % Hours Z Hours Hours %
Idle 59.3 10 69.,9 11 7t.-,
1/3 19.3 4 71.7 13 63.0 10213 32.3 5 35.3 623._' 4
Standard 50.2 9 89.1 16 101. 1
Full 237.9 40 132.2 23 1 1.
Flank 190.2 32 176.7 31 1
Totals 589.2 100 571.9 100. 1 10O
Several trends in the WMEC data are evident. First, a small increase in ship
speed required a large increase in fuel consumption, regardless of the pitch ratio.
Second, for any given ship speed, as the pitch ratio increased, fuel consumption _e-
creased until it reached a minimum value at the two or three highest pitch ratios.
Finally, fuel consumption became much more sensitive to changes in pitch as ship speed
was reduced. Even though data were not available for low ship speeds, it was assumedthat these trends extended into this region.
Referring to the propeller diagram (Figure 6-i) and to FiGures 6-2 and t-3, fuli
consumption savings are possible for the WMEC without sacrificing ship .;eed. Move-
ment of the operating point within the envelope bounded above by a const nt fuel rate
and below by a constant ship speed line, and which intersects at the original operat-
ing point, would produce a reduction in fuel usage as well as a possible increuse in
cutter speed. For example, the operating point Figure 6-1 defined by
285 SRPM
15 Knots
0.85 Pitch Ratio
350 lb/hr/enq Fuel Consumption
could be shifted to the left along the constant ship speed line of 15 knots to a hioher
pitch ratio of 1.3, thus reducing fuel consumption by approximately 50 1b/hr/ena. How-
ever, the most dramatic decrease in fuel consumption results from shifting an operatn;
point vertically down the propeller diagram by holding engine speed constant and re-
ducing the propeller pitch. Unfortunately, this also results in a significant penalty
in ship speed.
A cycle composite fuel consumption value was calculated for the medium-endurance
cutters based upon the parameters given above and the WMEC time-based modal factors:
it is presented in Table 6.12a. Also, a second optimized cycle composite fuel con-
sLmption (Table 6.12b) was computed according to the following assumptions. First.
operatina mode changes are made at constant ship speed. Second, for all ship speeds,
an increase in pitch reduces fuel consumption throughout the operatinI range. Last,
the maximun design pitch, as shown on the propeller diagram, can be obtained during
diesel engine operation in the region where maximum engine torgue or brake mean ef-
fective pressure (BMEP) is not exceeded. Mode changes were limited to the constant
ship speed condition since it was believed that, when a specific mode was called for,
a certain cutter speed was actually desired. Further, it is already known that tuel
consumption savings are possible by operating at slower :;peed conditions.
6-12

V,
C)
C) C) C
C.:
000
C Z
0
(%/H/1 0os 1n
6-1-

CD CD
zfz
C)-
C4(4
6-14)

O0
"0 C
4.) N
0H 01HO I
O 0
(2 ) N V2 Nn
4:I w- 10i 10 10 1 0 )~( ri '0 'D 4D (-0 '0 M) a ) '0 N
0N OH '0 m ' 0 1 HC N W H ' ) W ) 0 1
C (2
0N 0 mn V -,T N 0 N Im H H N (W
V)) In 'o V V M
C 0
C-4 . m n '00' OH a4 04. m m ' )0 (x Nn H v In N) co N-I(TU
H w0 w n -0N 0
-4 S4 0----------9
u). .-I - m m mz 4 i a, N4-i ' 4r0 <D. ~ 1 q (N (N
q U- . . .Cu0 (H H H;C ; - 0
ua) 0' '0L M I
O4 0. mn a)'0 m
C .A (N . -a) H HOr-W -P 0_1 0 4 rN 4 -) a) H D - m 4
O~~E a)H C
O >'-- ------ -----
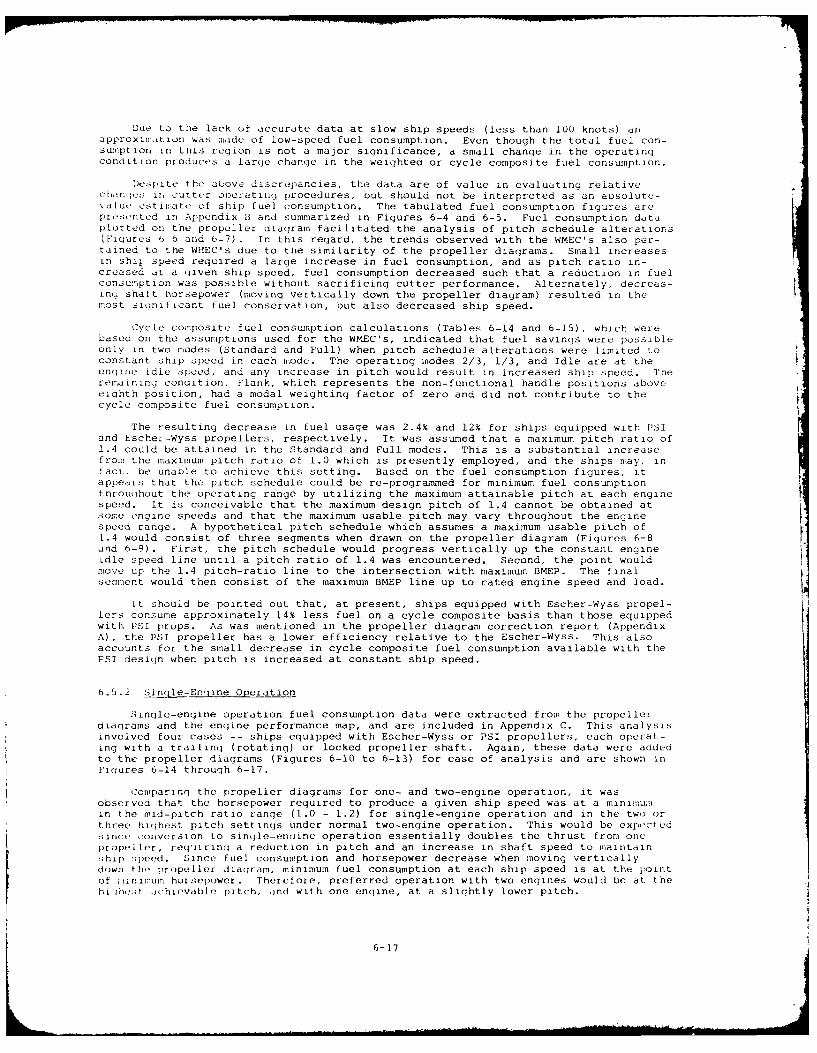
The final assumption in the set may not b ttutot L,( ul"t tachieve maximum pitch with k?, esel engine oUrP' . t 1. e,, the Wm'I4p2' I ita maximum pitch ratio of I.1 , well below the. !:3 :.. : lf -.,1 f . V I of L . nh,!maximum design pitch specification was the value at shi1- o phys cai stop wu ioce i.the amount of blade rotation; it was not meant to be an a; ratinc; point ar.o i- not nindicator of the maximum pitch that the engines can handle. Also, these iror'eller,; WeLdesigned for the 210A's gas turbine operation. 7 V;e diese[ en ]n,; may not be a :i tosupply the power necessary to turn the propeller s at highr c tch and reduced r0t.tionlspeed. Referring to the propeller diagram, a- pitch ircre,,sec.: t _:orstant .,hip :peothere is actually a slight reduction in the reguir-cd n-haf f rsel...Sc, cut a lar cdecrease in shaft speed. Consequently, the enjine:; aLe fojceau to produce nearly tosame power output at a considerably reduced en, ine syrced. Lctr:minatlon ot tnu _ct,-lmaximum usable pitch would require cutter testing throuqhout the cutter's spcdTherefore, the actual and the optimum cycle copoitrc luel consuimption fijures r< :e~ur,textremes, and any improvement in fuel consumption is expQcted to lie betw en thc v,,1uesgiven.
The resulting decrease in fuel consumption through optiimizatior ot the pitchschedule amounted to only one percent for the WMEC's, as shown in Tuble 6.12b. Aspreviously observed, at the two or three highest pitch sottings fuel consumption wasat an essentially constant minimum value. Since operation was either in or very nearto this region, only slight benefits were gained solely by increasing pitch andmaintaining ship speed. Larger decreases in the cycle composite fuel consumption werepossible, but only at the sacrifice of cutter speed (moving an operating point vortical-ly down the propeller diagram). A more practical solution woule De to adopt slowership speed operating practices than to alter the pitch schedule.
6.5 HIGH-ENDURANCE CUTTER PROPELLER PITCH/ENGINE PERFORMANCE ANALYSIS
6.5.1 Normal (Two-Propeller) Operation
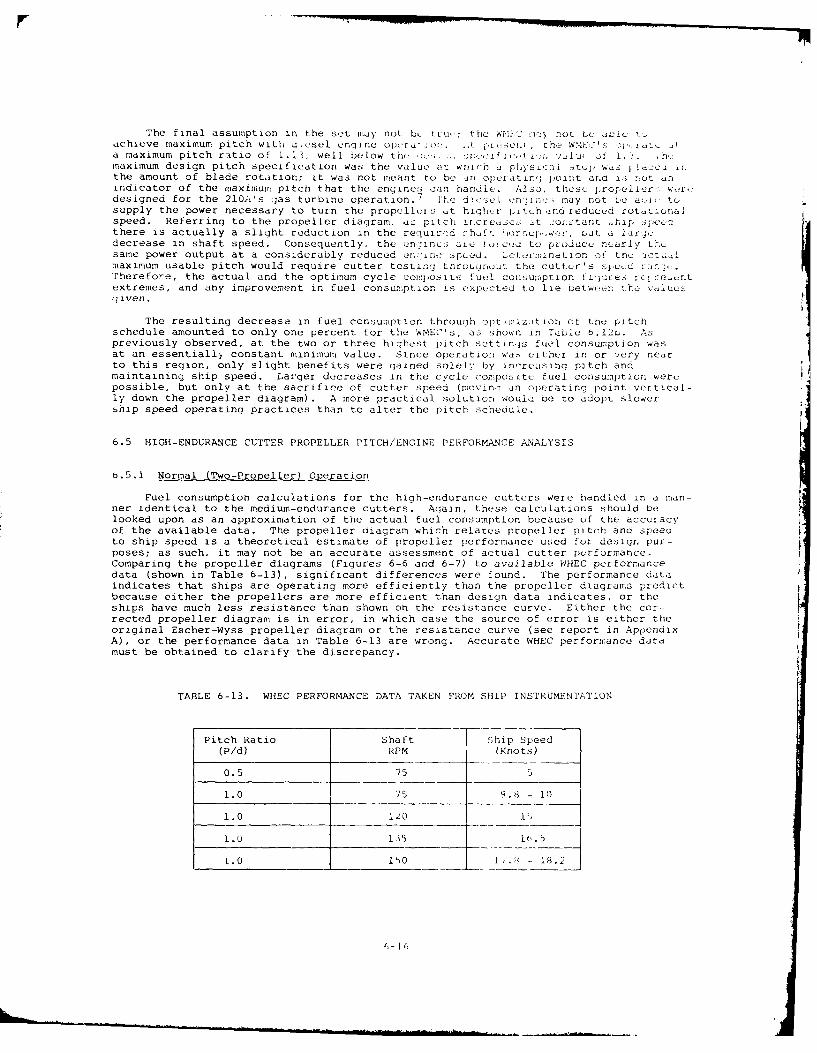
Fuel consumption calculations for the high-endurance cutters were handled in a man-ner identical to the medium-endurance cutters. Again, these calculations should belooked upon as an approximation of the actual fuel consumption because of the accuracyof the available data. The propeller diagram which relates propeller pitch and speedto ship speed is a theoretical estimate of propeller performance used for design pur-poses; as such, it may not be an accurate assessment of actual cutter performance.Comparing the propeller diagrams (Figures 6-6 and 6-7) to available WHEC performancedata (shown in Table 6-13), significant differences were found. The performance dataindicates that ships are operating more efficiently than the propeller diagrams predictbecause either the propellers are more efficient than design data indicates, or theships have much less resistance than shown on the resistance curve. Either the cor-rected propeller diagram is in error, in which case the source of error is either theoriginal Escher-Wyss propeller diagram or the resistance curve (see report in AppendixA), or the performance data in Table 6-13 are wrong. Accurate WHEC performance datamust be obtained to clarify the discrepancy.
TABLE 6-13. WHEC PERFORMANCE DATA TAKEN FROM SHIP INSTRUMENTATION
Pitch Ratio Shaft Ship Speed(P/d) RPM (Knots)
0.5 75 5
1.0 75 9.8 - 10
1.0 120 1 1
1.0 1135 In. 5
1.0 150 17.5 - 18.2
- . .-.. 6
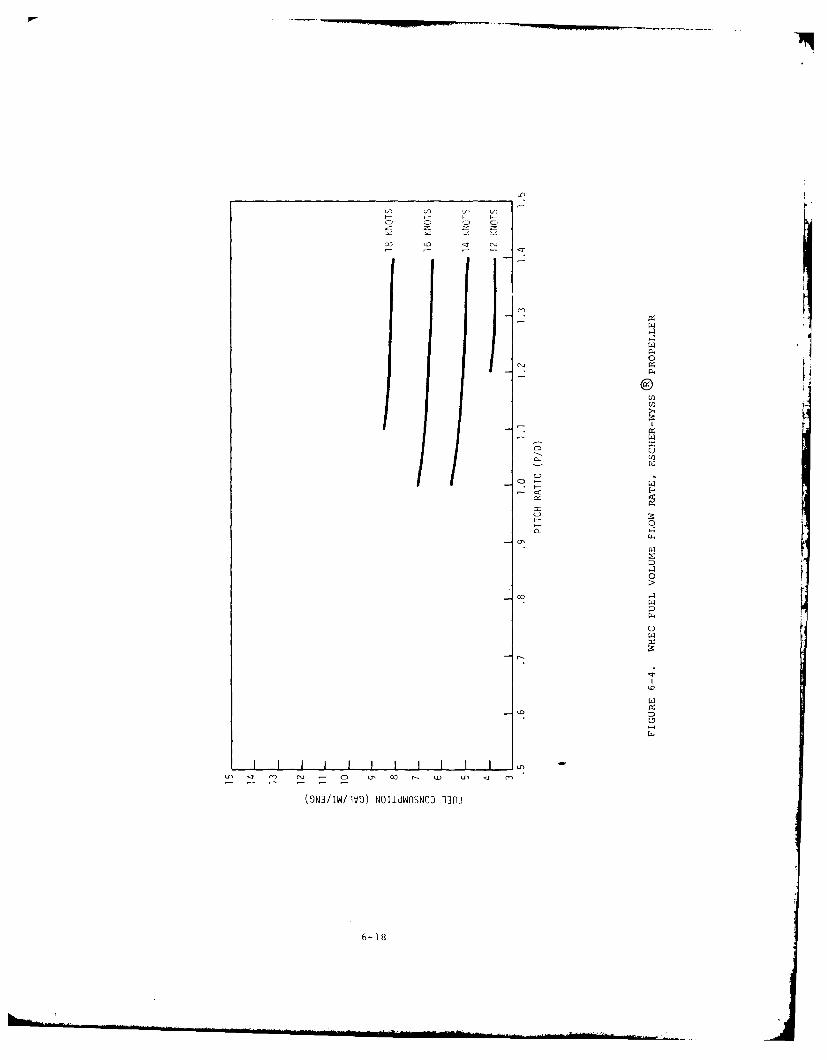
Due to the lack of accurate data at slow ship speeds (less than 100 knots) anapproxm, tion was made of low-speed fuel consumption. Even though the total fuel con-suiption in this region is not a major significance, a small change in the operatingcondition produces a lar(e change in the weighted or cycle composite fuel consumption.
Despite the above discrepancies, the data are of value in evaluating relativechian;es ir cutter ot)Orating Procedures, but should not be interpreted as an absolute-vdlue, estirmate of ship fuel consumption. The tabulated fuel consumption figures arepresented in Appendix H and summarized in Figures 6-4 and 6-5. Fuel consumption dataplotted on the propeller diagram facilitated the analysis of pitch schedule alterations(Figures (3-6 and 6-7). In this regard, the trends observed with the WMEC's also per-tained to the WHEC's due to the similarity of the propeller diagrams. Small increasesin ship speed required a large increase in fuel consumption, and as pitch ratio in-creased at a liven ship speed, fuel consumption decreased such that a reduction in fuelconsumption was possible without sacrificing cutter performance. Alternately, decreas-inc shaft horsepower (moving vertically down the propeller diagram) resulted in themost sitnificant fuel conservation, but also decreased ship speed.
Cycle composite fuel consumption calculations (Tables 6-14 and 6-15), which werebased on the assumptions used for the WMEC's, indicated that fuel savings were possibleonly in two modes (Standard and Full) when pitch schedule alterations were limited toconstant. ship speed in each mode. The operating modes 2/3, 1/3, and Idle are at theengine idle speed, and any increase in pitch would result in increased ship speed. Theremaining condition, Flank, which represents the non-functional handle positions aboveeighth position, had a modal weighting factor of zero and did not contribute to thecycle composite fuel consumption.
The resulting decrease in fuel usage was 2.4% and 12% for ships equipped with PSIand EscheL-Wyss propellers, respectively. It was assumed that a maximum pitch ratio of1.4 could be attained in the Standard and Full modes. This is a substantial increasefrom the maximum pitch ratio of 1.0 which is presently employed, and the ships may, infact, be unable to achieve this setting. Based on the fuel consumption figures, itappears that the pitch schedule could be re-programmed for minimum fuel consumptionthroughout the operating range by utilizing the maximum attainable pitch at each enginespeed. It is conceivable that the maximum design pitch of 1.4 cannot be obtained atsome engine speeds and that the maximum usable pitch may vary throughout the enginespeed range. A hypothetical pitch schedule which assumes a maximum usable pitch of1.4 would consist of three segments when drawn on the propeller diagram (Figures 6-8and 6-9). First, the pitch schedule would progress vertically up the constant engineidle speed line until a pitch ratio of 1.4 was encountered. Second, the point wouldmove up the 1.4 pitch-ratio line to the intersection with maximum BMEP. The finalsegment would then consist of the maximum BMEP line up to rated engine speed and load.
It should be pointed out that, at present, ships equipped with Escher-Wyss propel-lers consume approximately 14% less fuel on a cycle composite basis than those equippedwith PSI props. As was mentioned in the propeller diagram correction report (AppendixA), the PSI propeller has a lower efficiency relative to the Escher-Wyss. This alsoaccounts for the small decrease in cycle composite fuel consumption available with thePSI design when pitch is increased at constant ship speed.
6.5.2 Sinqle-Enoine Operation
Single-engine operation fuel consumption data were extracted from the propellerdiagrams and the engine performance map, and are included in Appendix C. This analysisinvolved four cases -- ships equipped with Escher-Wyss or PSI propellers, each operat-ing with a trailing (rotating) or locked propeller shaft. Again, these data were addedto the propeller diagrams (Figures 6-10 to 6-13) for ease of analysis and are shown inFigures 6-14 through 6-17.
Comparing the propeller diagrams for one- and two-engine operation, it wasobserved that the horsepower required to produce a given ship speed was at a minimumin the mid-pitch ratio range (1.0 - 1.2) for single-engine operation and in the two orthree highest pitch settings under normal two-engine operation. This would be expectedsince conversion to single-encine operation essentially doubles the thrust from onepropeller, req-iring a reduction in pitch and an increase in shaft speed to maintainship speed. Since fuel consumption and horsepower decrease when moving verticallydown tho propeller diagram, minimum fuel consumption at each ship speed is at the pointof piinlaum horsepower. Therefore, preferred operation with two engines would be at thehirlhest ,,hievable pitch, and with one engine, at a slightly lower pitch.
6-17
p..-
(f) ~I) 2: 2: I1H- H- I
~ 9 ~ I2: I
2: 'H0 I
H
U0~
H-
2:
H-
.1o:2
2:
I-)
- 2: ~ U) U) ~ 0)
(~N]I1wI1v~) NCILdWflSNU~ 11BJ
6-18
cDD
z
0
C- 0
1
2 a c
(ON3IW/I9) N~ldwSNODl~n
6-10

P/'D 1.4 1 S38000 W0K(T
7000
20117
S6000 FUEL CONSUMPTION~
5000
S4000Bo
S3000
2000 400
070 80 90 100 110 120 130 140 150 160 170 180
PROPELLER RPM
FIGURE 6-6. WHEC PROPELLER DIAGRAM WITH FUEL CONSUMPTION, ESCHER-IAYSSD ®PROPELLFR
0-200

PID-I.01 .9
00 [l0 CAiNl~tM[OTION / //
50 C
V=10 KNOTS
100
70 H0 90 100 110 120 130 140 150 160 170 180
PROPELLER RPM
0tO'R -7. WHEC PROPELLFEDTAGRAM WITH FUEL CONSUMPTION, IPROPUI.SION SYSTEMS,TNC. PROPFLLER
6-21
iL D
I0. Z I
K-r,
0 00C rO
CLLC 0 X) Dx, N'- 0 '0 x- - 1 2-
A D' Hn ,n c, (
'I 0 .
0 C1 r 1o : 41 1) 04
0 aj () U
0 ID 0 2Q
UU 0
.0
0 ' 4
0014a -00 -4 COt:1
~ CC '0 0 0 6-22*

oc
u) c) IH a t
E o 'N 073)~
-~t t
oa a)" __ _l
a)) coIT-
'T H N mD ca
Er 'o o
0
0 (D-- -D
00 a4 0)a )IC 'u c) c c 4H H 0-a
0) .1 .-4 -1 cC' 14ECk. - C14 0~~0
u~~ H H i 00
-
0 04
to H
4-) ;:7 4j H0o zo c.------------ - 0
-6-23
SOOD
6000
00 ~L I I ~ J L L
2 00 0 0 1 1010 13 12010 10 7 0PRRPEOSED RPM~
FICURE ~ ~ ~ ~ ~ V1 K-NHP'liPCLWHCPTH O TSD E SCURENTS PCH LE
6-HDUL

SHIP SPEED9000 V=0 KNOTS
8000 ~ PITCH RATIO0.800P/D 1. 1.3 1 .2 1.1 1.0
7000
6000 ROP SED .8=P/D
PIC
3: 000
24000
1000
0 80 90 10E1G2010 14E50 1D 17 D8
PROPELLEROPRPM
FIGURE 6-9. HYPOTHETICALNOTSEC PITCH SCHEDULEP PLSO SYTMIC ®R ELFT
6 SHIPSPEED 6-REN

loo rv-3205 !T
(I B/HR/FNG)
'800
3000
0 8 00 10010102010 5 6 7 8
PROPELLER RPM
FIURE h-10. Wn:C ,;INGLE ENGINE OPERATION, ESCH-ER-WYSS TRAIL SHJAFT
6-26

8000
7000V= 3205 LT
1100
C) 5000a- FUEL CONSUMPTIONn (LB/HR/ENG) 950
uj 400080
uj
3000
2000 -400
70 80 90 100 HiO 1'10 1,30 140 150 160 170 180
PROPELLER RPM
FIGURE 6-11. WHEC SINGLE ENGINE OPERATION, PROPULSION SYSTEMS, TNC.TRAIL SHAFT
6-27

9000
IROO0
7000
P/D= 1 .4 1 .3
CY 5000CD95
COSUMPT IONS4000 (LB/HR/ENGS800
C12
3000
2000 400
282
10
70 80 90 100 110 120 130 140 150 160 170 1150
PROPELLER RPM
FIGURE 6-12. WHEC SINGLE ENGINE OPERATION, ESCHER-WYSS®ELOCKED SHAFT
6-28

9000
8000
1.2P/D=1.4 1.3 1 2 1 1 1 0 .
7000 V 14 KNOTS
o~6000
1100FUEL CONSUMPTION(LB/HR/ENG) /
5000 950 .8
~040000
3000
282 O
282 3008 KNOTS
1000
070 80 90 100 110 120 130 140 150 160 170 180
PROPELLER RPM
FIGURE 6-13. WHEC SINGLE ENGINE OPERATION, PROPULSION SYSTEMS, INC.,® LOCKED SHAFT
6-29

cln
z
0.
6-30
oo
- I-
030
03 :4
6-31

F- F-
LJQ
0r
0
0-0
CO
0.:D
6-32

V)I
U3
6-3
AC.16A

Table 6-16 contains the optimum fuel consumption figures for various one- dnd two-engine configurations. in all cases, total fuel consumption for single-engine operationwas greater than for two-englne operation at the same ship speed. However, datu werenot available for ship speeds below 10 knots. It is in this range that slow enginespeed/low load conditions while operating on two engines could be transferred to ighArspeed/hiqhcr load combinations for a single engine, thus reducing brake specific iad(consumption and, possibly, reducing total fuel consumption. The data for this r qioncould be obtained by expanding the low ship speed portion of the propeller diagr' : aridthe low speed/low load region of the engine performance map. This however, woula re-quire extensive additional analysis that was beyond the scope of this program.
The single-engine propeller diagrams verify Coast Guard observations that WHEC'scan attain a speed of 10.5 knots at an engine speed of 660 RPM (109 propeller shaft l',M):standard practice is to use two engines above 10.5 knots. 7 The preferred type ofoperation would be with the free shaft rotating at maximum pitch since a locked shaftresults in a large increase in drag and fuel consumption. (Therefore, provisions shouldbe made to start the free propeller rotating in the event that it should stop.) Thepropeller diagrams and fuel consumption figures also reflect previous observationsthat the Escher-Wyss is the more efficient of the two propellers presently employedon the WHEC's.
6-34

.-.-.0 -1 - 7
oo 00 I
IL Nr T~''l --n -cc viN-
o~ o
(o .CccLI -.-
o ..
I .0.-L. a.
, 0.
In r- eI. 'DIC
(0 0 u NL
tnz ", I0r nc0- - i -0- 0 r-I
z -4 ) H Z In O'C (0'IT Jr 'o0) CNC r- 0*r'4o o C) .0l (' - Q f(~)'4 " 0)- 10 IT1(N LnTP
E C I -U P- r ~ I I 4 ~
U))
44 -4 0'0 0 C)0C( IP DN CC C)0 z
o. 1.1o ~ ~ a 0)PP 1 -
4C)0. -4 -4-4-41 4- -4 I-4II
44 (a0. ____ __ W_ (a __ ____ _____ 10I)
C) C:(T C t C04
-44-4-w-44( -44-44a w Q L4-4-4 (D
_1 __ 1 )-, 1 )a 4 % )C 4 a ___ -1I U)(; 4 ) 4- 4 1-- 4 4 - Uu m u a
&4 4 - w0 -4 L4 0 L4 ) 0 - w )0 1-4 W0 4C(1 )0).(1 Q)0001)P 3 a)Q 00. 00.Q0) 0. Q) C)
CL0 Ia.C 0C4 04C 0C QLI a.ao 0 110 0 ' 0 0 0 0 '0 0
-- 4 $ 4-4 414 14LW-wCW W-U-C W.-Q UI4CL4 a C4 04 44 0)4, " 4 . , -4Cl Q, C)C)-.4 C a a C0) 0--4) 0 0 0.H C0 0l-C0 44C0 0
I-C 4 4 N N 1-.4L. -4- 9 .4 C ,.l-4-i W W -Nr.-W-41.
o a 1o1i 041 0 11 00'' C 0L M a'91 4J J4 E( 4.4 5 1
> . 0C)) C ) C) C:0J0 ) 0C ) ) C: waE- E I) -4 - 4 v E -4 -4 a) E-1 -4 Q) E-4-
,'~ S 4'' ) w-4 uI0. U) H c r,3 U) 0C) Ca)4.1 c w -4 r Q)-I- 4-P : . a) 410C-4- 404 . 0
w______WQ. , ,0,, 4C I WC__ - 1__ 0 _ _ _ _
6- 35/'6- 36

APPENDIX A
WHEC PROPELLER DIAGRAM CORRECTIONS

PROPELLER DIAGRAMS FOR THE US COAST GUARD
378-FOOT HIGH-ENDURANCE CUTTER
for
Southwest Research InstituteSan Antonio TX
by
W. S. Vorus
M. G. Parsons
Department of Naval Architecture and Marine EngineeringThe University of Michigan
Ann Arbor MI
December 1978
A-2

The propeller diagrams requested by your purchase orrer t:o. 120337 are theattched FIgures I and 2.
Figure 1 is for the ships equipped with the Escher-Wyss propellers, and Figure 2is for the ships equipped with the Propulsion Systems, Inc. propellers, as indicatedthereon. The fiouroes reflect a ship full load displacement of 3025 LT, which is some10% in excess of the displacement for which the two propellers were reportedly designea.The tiqures give delivered horsepower for diesel operation versu, propeller RPM forvalues of propeller pitch ratio and ship speed. The delivered power, being the powerat the propeller, should be around 97% of the power output at the reduction gear (SHP).
The procedure followed in constructing Figures 1 and 2 consisted of 3 parts:
1) Correction of the original EHP curve to allow for the overweight conditionof the vessels.
2) Construction of the diagram for the Escher Wyss propeller,..
3) Construction of the diagram for the PSI propellers.
Each of these parts is described in the following.
EHP CURVE
The original EHP test (TMB file 9021, dated June 1963) was conductea at an equi-valent ship displacement of 2716 tons, corresponding to a draft of 13.5 ft with zerotrim.
The actual full load condition of the ships is reported to correspond to a dis-placement of 3025 tons with a draft at the center of flotation of 14.4 ft. Thecurves of form for the ships then imply a 6.3% increase in wetted-Furface over theoriginal design condition of 2716 tons.
Using the ITTC-1957 friction line with ACf = .0004, the viscous component of theresistance was increased over the speed range in proportion to the increase in wetted-surface; the residuary resistance component was left unchanged.
The resulting EHP curve is included herein on Figure 3a. Figure 3a shows both theoriginal and the corrected trial condition EHP curves; the original EHP is increasedon the order of 3% by the vessel overweight.
ESCHER WYSS PROPELLER DIAGRAM
The EW diagram, Figure 1, represents, in essence, a correction and expansion ofthe low speed (diesel) region of the existing diagram (USCG Dwg. 719WPG-4400-118).The following steps were taken:
1) The existing diagram was very simply used to back-out the open-watercharacteristics (Kt, K. versus J) of the EW propeller in the speed rangeof interest.
2) The corrected EHP curve was used along with the Kt - J curve from 1) todetermine the new RPM/speed relationship.
3) The delivered power was calculated for the equilibrium RPM determined in 2)using the Kq - J curve from 1).
PSI PROPELLER DIAGRAM
For this propeller the only available information considered to be reliable wasthe open-water curves at the design pitch ratio of 1.25 (PSI drawing no. 16055-B). Apropeller diagram similar to that of the EW propeller was available, but obviously er-roneous. The available PSI diagrams imply a substantially higher propeller open-waterefficiency at the design pitch ratio than PSI actually achieved. The open-water curveat the design P/D (dwg. no. 16055-B) shows an efficiency at the design condition ofabout 64%. This is quite low for propellers of these general characteristics; the
A-3

80000
7000
7 3205 LT
6000
18 . /
5000
0
C
200
3000
70 80 90 100 110 120 130 140 150 160 170 180
PROPELLER RPM
FIGURE A-1. USCG 378-FOOT HEC ESCHER-WYSS PROPELLERS
A- 4

8 0 0
20/ K N O T S
P/D 1.4 1.3 1.2 1.1 1.0 .9
7000-
V=3205 LT
6000-
5000-
0
70 80 90 1001010101065 6 7 8
PR0LE P
4000'E -2 1S438FO E POUSO YTM, N. POELR
C4-

60-DISPLACEMENT CORRECTION
(TRIAL CONDITIONS)
5000-
0/
0
3000 /302 L
E-.=325Lu w/
S2000/
=2716 LT
1000 /
0 I I I0 2 4 6 B 10 12 14 16 18 20
SHIP SPEED (KNOTS)
FIGURE A-3a. EHP VS. SPEED USCG 378-FOOT HEC
A- 6

equivalent NSMB B4 series propeller has an open-watet eiticiency of 74X. A con3ectureis that the diagrams might have been prepared wLth preliminary data based on a typical-ly higher propeller efficiency and never corrected. The SHP curve from TMB file 9021,for example, implies a propeller efficLncy in excess of 70%.
At any rate, the existing PSI diagram was deemed useless for the objectives ofthis work. The following steps were teken to produce Figure 2:
1) The Kt - J curve for the PSI propeller at the design P/D matches almost exactlythat constructed, as described above, for the EW propeller at the same P/D.This would not be inexpected since the design RPM-speed-pitch characteristicsof the 2 propellers are virtually identical. The Kt - J curves for the PSIpropeller were therefore assumed to be the same as the Kt - J curves for theEW propeller at all pitch ratios of interest.
2) The efficiency difference between the PSI and EW propellers was known at thedesign P/D only (the maximum efficiency of the EW propeller at P/D = 1.25 wascalculated to be 73% from the Kt, Kq, J curves constructed as described above).This maximum efficiency difference, percentage-wise, was assumed to be thesame at all P/D. This established one point on the family of Kq - J curvesfor the PSI propeller. The values of J at Kq = 0 was then assumed to be thesame for both propellers at corresponding pitch ratios. The two points thenestablished the essentially linear Kq - J characteristics for the PSIpropeller in the speed range of interest.
3) With the open-water characteristics of the PSI propeller in hand, theadditional steps followed in constructing Figure 2 were identically thesame as steps 2) and 3) for the EW propeller and Figure 1 as described above.Actually, with the same Kt - J curves the speed/RPM relationships from step 2)of the EW procedure apply for the PSI propeller; only step 3) of the EWprocedure had actually to be executed to complete the data needed for theconstruction of Figure 2.
With regard to the accuracy of this work, it is expected that Figure I is as ac-curate as its input, and Figure 2 is within 2% of the accuracy of its input.
There appears to be no good reason to question the accuracy of the input dataused, with one reservation: this involves the last paragraph on page 3 of the SWRProgress Report No. 9 to the USCG. This paragraph states the observation that theships equipped with the Escher Wyss propeller turn slow; pitch must be reduced toP/D - 1.1 to attain the design RMP at full power. To the contrary, Figure 1 showsthat the EW propeller should achieve the design full power RPM at near the design P/D.It is the PSI propeller that this work would predict to turn slow at the design P/D.Figure 2, in fact, implies a pitch ratio of very near 1.1 at the full power and RPM.This is, of course, due to the low efficiency of the PSI propeller relative to that ofthe EW propeller, whose efficiency is not unusually high.
Again, a conjecture is that the statement on page 3 of the progress report has theEW and PSI propellers confused. Confirmation of this conjecture should remove all re-servations regarding the reliability of Figures 1 and 2.
Author's Note: The conjecture in the final paragraph was found to betrue, verifying the contents of this report.
A-7

PROPELLER DIAGRAMS FOR THE US COAST GUARD
378-FOOT HIGH ENDURANCE CUTTER; LOCKED AND
TRAIL SHAFT CONDITIONS
for
Southwest Research InstituteSan Antonio TX
by
W. S. Vorus
M. G. Parsons
Department of Naval Architecture and Marine EngineeringThe University of Michigan
Ann Arbor MI
September 1979
A-8

The work requested by your purchase order no. 14t811 has been completed and isreported herein. This work is supplementary to that previously reported in reference1. In reference I propeller diagrams were developed for the U.S. Coast Guard 378-footHigh Endurance Cutters for diesel operation. As two different propellers are installedon different ships within the class, two propeller diagrams were delivered with re-ference 1: one for ships equipped with Escher Wyss propellers, and one for the shipsequipped with Propulsion Systems, Inc. propellers.
The subject purchase order subsequently requested that additional propeller dia-grams be developed for the same ships operating with one of the two main enginessecured. However, two modes of operation on one engine are apparently possible forthe subject ships: i) a locked shaft mode where the inoperable propeller is restrainedfrom rotating by a shaft locking device, and 2) a trail shaft rode where the inoperablesystem is allowed to rotate in response to hydrodynamic torque developed by the trail-ing propeller. In order to cover the two single engine operating modes on all ships,it was therefore necessary to develop four new propeller diagrams; these diagrams areFigures 3 through 6 of this report. Figures 3 and 5 are the trail and locked shaftdiagrams for the Escher Wyss propellers and Figures 4 and 6 are the correspondingdiagrams for the PSI propellers.
The effect of the trailing or locked propeller is to increase the apparent re-sistance of the hull as seen by the driving propeller. Therefore, in constructingFigures 3 through 6, the EPH data of reference 1 was first augmented by appropriateamounts to allow for the locked or trailing propeller. The propeller open-water curvesdeveloped in connection with reference 1 were then used as described therein, alongwith the augmented EHP data, to construct the new Figures 3 through 6.
The resistance augmentation of the inoperable propeller at any speed was taken asthe negative propeller thrust developed at that speed. The CP propeller data presentedin reference 2 was used for this purpose. In the locked shaft cases the thrust wastaken as the zero RPM value corresponding to the ship speed of interest. For the trailshaft estimates an iteration was first performed in order to determine the RPM of thetrailing propeller as a function of ship speed. This equilibrium RPM was estimatedby balancing the propeller hydrodynamic torque against the friction torque developedin the rotating propulsion system. The system friction torque was taken as 14% of thesteady ahead torque at any RPM on the basis of data contained in reference 3. The CPpropeller data from reference 2, with a correction for efficiency differences, was usedto estimate the propeller hydrodynamic torque. On determining the equilibrium RPM inthe trailing condition at a selected speed, the negative thrust required was then ex-tracted directly from reference 2.
The accuracy of the Figures 3b through 6 data is considered to be consistent
with that presented on Figures 1, 2 and 3a of reference 1.
REFERENCES
1. "Propeller Diagrams for the US Coast Guard 378-Foot High Endurance Cutter," byW.S. Vorus and M.G. Parsons, dated December 1978.
2. Strom-Tejsen, J., and Porter, R.R., "Prediction of Controllable-Pitch PropellerPerformance in Off-Design Conditions," Third Ship Control Symposium, Bath, UK, 1972.
3. "Marine Diesel Power Plant Performance Practices," SNAME T&R Bulletin #3-27, 1973.
A-9
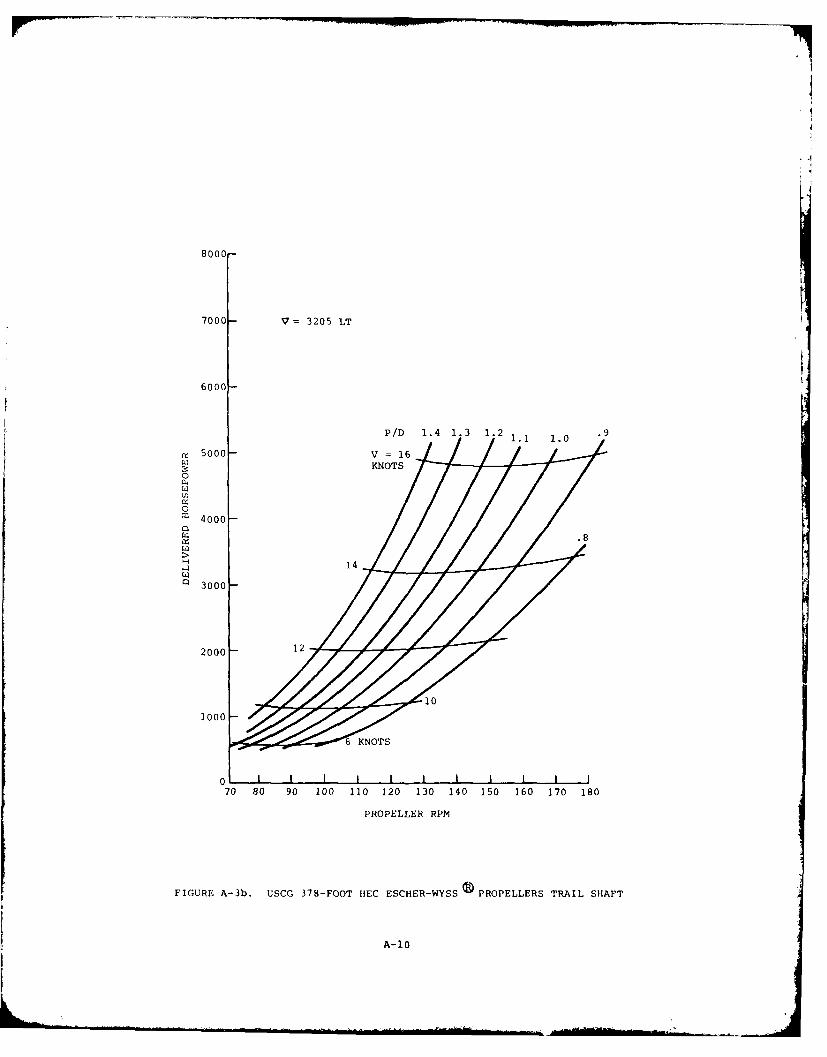
8000-
7000- V 3205 LT
6000-
C4 5000-v=1
S4000
2000 -1
1000
70 80 90 100 110 120 130 140 150 160 170 180
PROPELLER RPM
FIGURE A-3b. USCG 378-FOOT HEC ESCHER-WYSS 0PROPELLERS TRAIL SHAFT
A- 10

8000
7000- V =3205 LT
6000-PD141312 11 .0 9
5000-
3:0
0
O 3000-
2000-
70 80 90 100 110 120 130 140 150 160 170 180
PROPELLER RPM
FIGURE A-4. USCG 378-FOOT HEC PROPULSION SYSTEMS, INC., ®PROPELLERS TRAIL SHAFT
A-11

8000-
7000-
P/D 1.4 1.3 1.2 1.1 1.0 .9
.. 1
5000-
4000-1
3000-
2000-
1000-
01 I I I I70 80 90 100 110 120 130 140 150 160 170 180
PROPELLER RPM
FIGURE A-5. USCG 378-FOOT HEC ESCHER-WYSS 0PROPELLERS LOCKED SHAFT
A-12

8000
7000V=1410 .
6000
S5000-.
0 1
(4
O3000
2000
70 80 90 100 110 120 130 140 150 160 170 180
PROPELLER RPM
FIGURE A-6. USCG 378-FOOT HEC PROPULSION SYSTEMS, INC., ®PROPELLERS LOCKED SHAFT
A-13/A-14

APPENDIX B
FUEL CONSUMPTION CALCULATIONS FOR WHEC AND WMEC
B-1

378-1.'OoT WIiEC MAIN DIESEL FNGINE FUEL CONSUMPTION DATA, PSI PROPELLER,NORMAL 2 1ROPELLER OPERATION
!hip Speed, Fuel Counmotion % Incr. fronmKnots SHP SRPM ERPM BHP/Cyl. BSFC Lbm/hr/eno. gal/mi/eng. Lowest value
P.R.= 1.410 - - - - - - - -12 1775 80.5 486 74.0 .412 367 4.3 014 2850 93.5 564 118.8 .399 569 5.7 016 4275 107 646 178 .395 844 7.3 018 6200 121.5 733 258 - - - -
20 8550 136 821 356 - -
P.R.% 1.3
10 1050 72 434 44 >.420 >.222 >3.1 012 1800 86 519 75 .414 373 4.3 014 2900 101 609 121 .399 579 5.8 1.716 4350 114.5 691 181 .392 851 7.4 1.418 6275 129.5 781 261 .386 1209 9.4 020 8700 145.5 878 363 - - - -
F(
P.R.- 1.210 1075 77.5 468 45 >.420 >227 >3.212 1850 92.5 558 77 .415 383 4.5 4.714 2950 107.5 649 123 .400 590 5.9 3.416 4425 123 742 184 .389 859 7.5 2.718 6375 139.5 842 266 .381 1216 9.4 020 8875 155.5 938 370 - - - -
P.R.- 1.110 1100 82.5 498 46 >.420 >232 >3.212 1900 99.5 600 79 .416 394 4.6 7.014 3000 115 694 125 .401 602 6.0 5.316 4525 131 790 189 .389 882 7.7 5.518 6525 148.5 896 271 .380 1236 9.6 2 120 - - - - - - -
P.R.- 1.010 150 89 537 48 '.420 > 242 > 3.412 j950 107 646 81 .418 406 4.7 9.314 3100 124 748 129 .403 624 6.2 8.816 4700 142 857 196 .388 913 7.9 8.218 6775 160.5 968 282 - - - -
20 - - - - - -
P.R.- 0.910 1200 97.5 588 50 >.420 >252 >3.512 2075 117 706 86 >.420 433 5.0 16.314 3300 136 821 138 .404 669 6.7 17.516 4950 155.5 938 206 - - - -
18 7150 175 1056 298 - -
20 - - - - - -
P.R.- 0.8 1350 109 658 56 >.420 >282 >3.912 2300 130 784 96 >.420 >484 >5.614 3675 151.5 914 153 -- -
16 5525 173.5 1047 230 - -
18 - - -- -
20 . - - - - I - -
Note: > indicates values which were approximated.
B-2

WilEC UNSTANT FUE, CONSUMPTION DATA - MAIN DIESEL ENGINE
Fuel Cons. BSFC Shaft Hp.lb/hr/eng. lb/Bhp-hr Bhp/Cyl. ERPM SRPM (2 shafts)
282 .420 56 400 66 1344282 .420 56 440 73 1344
300 .420 59.5 480 79.5 1429300 .420 59.5 375 62.1 1429
400 .42 79.4 650 108 1906400 .41 81.3 440 73 1951400 .41 81.3 530 88 1951
500 .42 99.2 770 128 2381500 .41 101.6 405 67 2439500 .41 101.6 685 114 2439
650 .41 137.1 435 72 3171650 .41 137.1 865 143 3171650 .40 135.4 500 83 3250650 .40 135.4 740 123 3250650 .399 135.8 585 97 3259650 .399 135.8 640 106 3259
800 .399 167.1 895 148 4010800 .399 167.1 590 98 4010800 .400 167 543 88 4000800 .395 168.8 650 108 4051800 .395 168.8 860 143 4051
950 .399 198.4 620 103 4762950 .395 200.4 660 109 4810950 .390 203 710 118 4872950 .387 204.6 770 128 4910950 .387 204.6 875 145 4910
1100 .390 235 735 122 56411100 .387 237 760 126 56851100 .385 238 800 133 5714
B-3

MAIN DIESEL ENGINE FUEL CONSUMPTION DATA--WMEC 210B
Fuel Cons. bsfc Enginelb/hr/eng. lb/Bhp-hr. BHP/cyJ. ERPM SRPM Shaft Hp
150 .40 23.4 650 195 375
350 .40 54.7 975 293 875.365 59.9 455 137 959.365 59.9 815 245 959
550 .365 94.2 515 155 1507.355 96.8 605 182 1549.355 96.8 985 296 1549.350 98.2 825 243 1571
750 .355 132.0 655 197 2113.350 133.9 712 214 2143.348 134.7 755 227 2155.345 135.9 880 264 2174
950 .348 170.6 820 245 2730.345 172.1 885 266 2754.340 174.6 945 284 2794
1150 .335 214.6 1030 309 3433
B-4
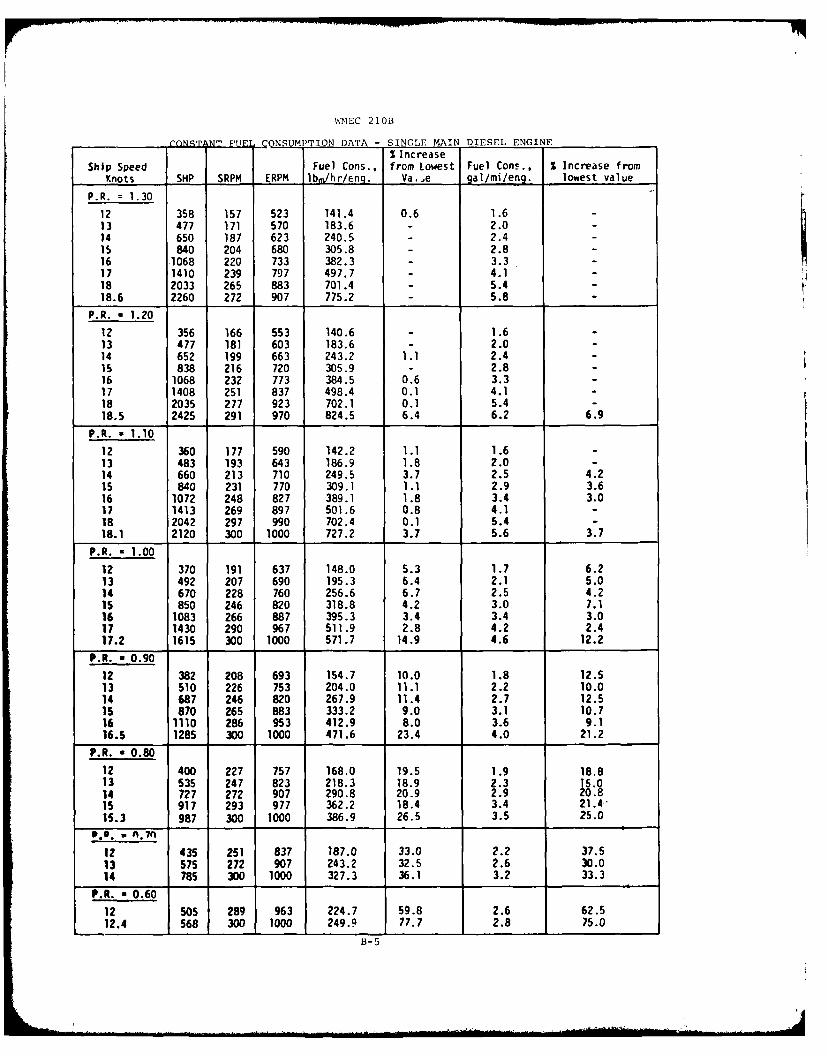
WMEC 210B
rC~qTNT ONSUMI'TION DATA - SINGLE MAIN DIESEL ENGINE
% IncreaseShip Speed Fuel Cons., from Lowest Fuel Cons., % Increase from
Knots SHP SRPM ERPM Ibm/hr/eng. Va- e gal/mi/eng. lowest value
P.R. = 1.30
12 358 157 523 141.4 0.6 1.613 477 171 570 183.6 - 2.014 650 187 623 240.5 - 2.415 840 204 680 305.8 - 2.8 -16 1068 220 733 382.3 - 3.317 1410 239 797 497.7 - 4.1 -18 2033 265 883 701.4 - 5.4 -18.6 2260 272 907 775.2 - 5.8 -
P.R. - 1.20
12 356 166 553 140.6 - 1.613 477 181 603 183.6 - 2.014 652 199 663 243.2 1.1 2.415 838 216 720 305.9 - 2.816 1068 232 773 384.5 0.6 3.317 1408 251 837 498.4 0.1 4.118 2035 277 923 702.1 0.1 5.418.5 2425 291 970 824.5 6.4 6.2 6.9
P.R. - 1.10
12 360 177 590 142.2 1.1 1.613 483 193 643 186.9 1.8 2.014 660 213 710 249.5 3.7 2.5 4.215 840 231 770 309.1 1.1 2.9 3.616 1072 248 827 389.1 1.8 3.4 3.017 1413 269 897 501.6 0.8 4.118 2042 297 990 702.4 0.1 5.418.1 2120 300 1000 727.2 3.7 5.6 3.7
P.R. - 1.00
12 370 191 637 148.0 5.3 1.7 6.213 492 207 690 195.3 6.4 2.1 5.014 670 228 760 256.6 6.7 2.5 4.215 850 246 820 318.8 4.2 3.0 7.116 1083 266 887 395.3 3.4 3.4 3.017 1430 290 967 511.9 2.8 4.2 2.417.2 1615 300 1000 571.7 14.9 4.6 12.2
P.R. - 0.90
12 382 208 693 154.7 10.0 1.8 12.513 510 226 753 204.0 11.1 2.2 10.014 687 246 820 267.9 11.4 2.7 12.515 870 265 883 333.2 9.0 3.1 10.716 1110 286 953 412.9 8.0 3.6 9.116.5 1285 300 1000 471.6 23.4 4.0 21.2
P.R. - 0.80
12 400 227 757 168.0 19.5 1.9 18.813 535 247 823 218.3 18.9 2.3 014 727 272 907 290.8 20.9 2.9 08815 917 293 977 362.2 18.4 3.4 21A415.3 987 300 1000 386.9 26.5 3.5 25.0
9.9 a .7fl
12 435 251 837 187.0 33.0 2.2 37.513 575 272 907 243.2 32.5 2.6 30.014 785 300 1000 327.3 36.1 3.2 33.3
P.R. - 0.60
12 505 289 963 224.7 59.8 2.6 62.512.4 568 300 1000 249.9 77.7 2.8 75.0
B-5

378-FOOT W}IEC MAIN DIESEL ENGINE FUEL CONSUMPTION DATA
Ship Speed, SHP Engine BSFC Fuel Consumption % Incr. frcmKnots 2 Shafts) SRPM ERPM BHP/cyl lb/Bhp-hr lb/hr/eng gal/'ni/eng Lowest V:!uQ
P.R.- 1.4010 - - - - - - - -12 1550 80.5 486 64.6 .418 324 3.8 014 2460 94 567 102.5 .403 496 4.9 016 3700 107 646 154 .396 732 6.4 018 5375 121.5 733 224 .389 1046 8.1 020 7475 135.5 818 312 - - - -
P.R.- 1.310 875 72 424 36.5 >.420 >184 >2.6 012 1575 86.5 521 65.5 .420 331 3.8 014 2500 100.5 606 104.2 .405 506 5.0 2.016 3775 114.5 691 157 .394 742 6.5 1.618 5475 129.5 781 228 .386 1056 8.2 1.220 7600 145 875 317 - - - -
P.R.- 1.210 900 77.5 468 38 >.420 >192 >72.7 +12 1600 92.5 558 67 .420 338 3.9 2.614 2550 107.5 649 106 .406 516 5.1 4.116 3850 123 742 160 .393 755 6.6 3.118 5575 139 839 232 .384 1069 8.3 2.420 7725 155.5 938 322 - - - -
P.R.= 1.110 950 82.5 498 40 >.420 > 202 > 2.8 +12 1650 99.5 600 69 >.423 > 350 > 4.1 7.914 2625 115.5 697 109 .408 547 5.4 10.216 3950 131.5 793 165 .393 778 6.8 6.218 5725 148.5 896 239 383 1098 8.5 4.920 7950 166.5 1004 331 - - - -
P.R.= 1.010 975 89.5 540 41 >420 >206 > 2.912 1725 107 646 72 >420 >363 > 4.2 >10.514 2725 124 748 114 .409 560 5.6 14.316 4100 142 857 171 .394 808 7.0 9.418 5925 160.5 968 247 - - - -
20 8275 180.5 1089 345 - - -
P.R.- 0.910 1050 98 591 44 >.420 >221.8 >3.1 +12 1825 117.5 709 76 >.420 >384 >4.5 >18.414 2900 136 821 121 .412 598.8 >6.0 >2216 4450 155 935 185 - - - -
18 6275 175 - -
20 - - - - - - -
P.R.- 0.810 1150 109 658 48 >.420 >242 >3.4 +12 2000 130 784 83 >.420 >419 >4.9 >2914 3225 152 917 134 - - -
16 4800 173 1044 200 - - -
18 - - - -20 - - - - - - I -
Note: > indicates values which were approximated.
B-6

1
APPENDIX C
WHEC SINGLE PROPELLER OPERATION FUEL CONSUMPTION DATA
c-1
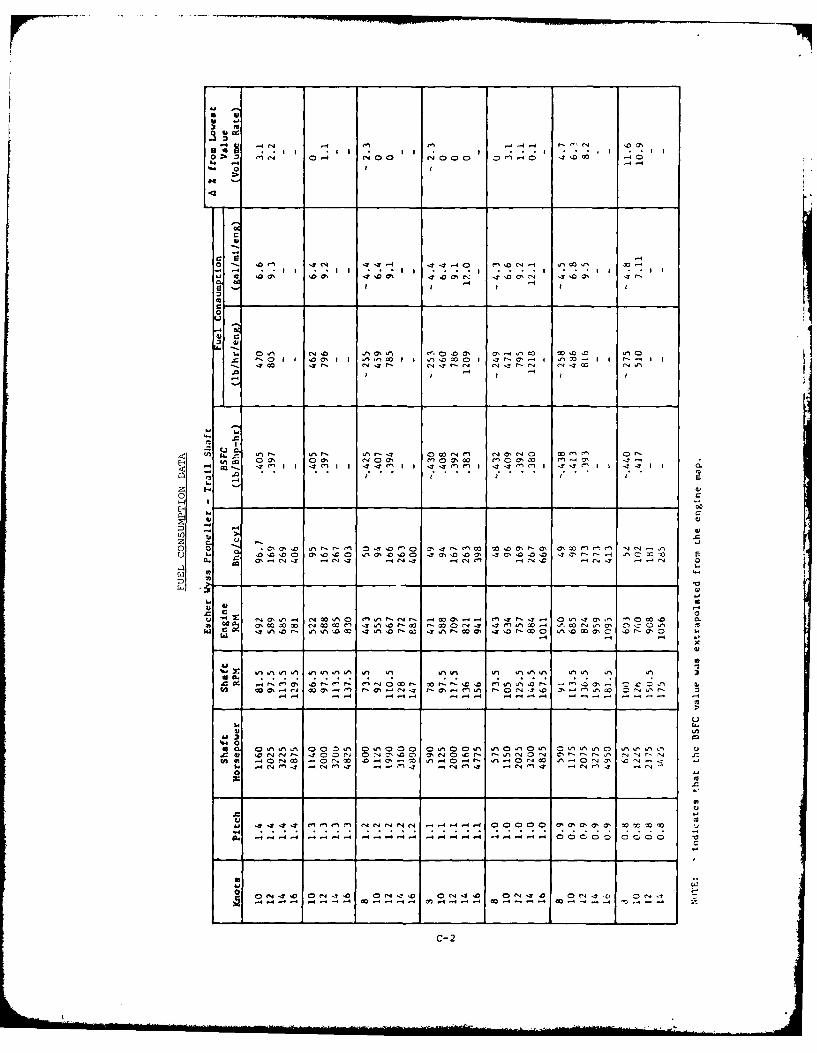
'I~~c In II
S0
QC:Go
- 0. 1 1I . 11 V * 00' o1 I 'T M
00 '
-4 cor -- 40 0
2
0- c N 0 0' 0 0'0 W4 0 D ON a,"C70OM - 4
C6 I- Es- 2 -" T - -ogo
I s a *.2 a: . 'n m C) O.'00" 00 'o 0 -0 0'D~E Ens 0a
U)L)
In 7 4 -
10 C 00oC . c' D TC
co- --- c0- - -4 -4 co-
C-2

0 r4 10* 0-0 0-Om
b. 14 -44('
0
4J
-- 4
420
x. 42-44r-
U1 am O-I w- b
02 r
00
..) -o 47 b.4 O -O 41 D 1 c c,
(9 0 4DuCo v I mn C l I N I 0C
F .~( u* A aI~ fn .rn un m .. c n m A lo A(A O
" -4 N M '. ' N InQ'~(~( v%'d .vl 4 C4f Ce4&In e
£ ~ ~ ~ ~ ~ c 422 "40 0 - C A N ( - ' Il 0 lo lo coo 4 10 ('c o ~ ( '-~ '.'r a' ' N( 0 (4 11
C-3I

0 > 0 0-4 00 00 -
0
C,00 0-co a,0 .11 a, .11 **II 01 I 0%
-4 C -T r4 C" -D 'm 'T ' -3, ' o 0
II I I
fn C)- wC s- I M . C
0
CC-

4.54
0 6
at
0
(34 Q) 0
A - In In5 0 co .1 0 10 00 '- CO 7 0f C" 'D 0. IC. )-4 c ) 5-0 W.S c. VIO, o0 '.70 7 ' D 0 rI
00
00
-: C 4N' C;C. a0' Oo.I. a', Uto 0% c4 0 0 00' 0en oc cc - 0 D c 4InO
F- ~ ~ -- 4 1 ~ S I I 4 14 I4 4"' I4 14*'.
11 CLL M61 n C
o0 L4,4 4In0 ,4 e VIn4 ? 0 4 c 1 1 "3
4 .- 4 P- 44 0 0 C 0
(0 * uz ~ ~ c ao o- - c.f"I. -~9~ -..0( -N0( 0 ( ( cc (N74. c04
Loow

APPENDIX D
REPORT OF NEW TECHNOLOGY
O-1/D-2

New operational techniques for improving the fuel consumption of the Coast Guard
large cutters consisting of reprogramming pitch schedules to optimize fuel-consumption
characteristics are discussed, and illustrated, On pages 6-16 to 6-35/6-36. These
techniques offer fuel-economy improvements from 3 to 5 percent.
180 copies
D-3/D-4
