petroplus at a glance - iis windows...
TRANSCRIPT

4 | Petroplus Holdings AG | Company Overview
Petroplus at a Glance
Key Facts Major Units Crude and Products Highlights
BRC Refinery
> Acquired in May 2006> Located in Antwerp,
Belgium on a 105-hectare site
> 110,000 bpd total throughput capacity
Atmospheric Distillation Vacuum Distillation Visbre aker Catalytic ReformerProduct HydrotreatersIsomerization (TIP) Sulphur Recovery Liquefied Petroleum Gas (“LPG”)
> Processes predomi-nantly medium sour crude oil and other low-cost feedstocks, primar-ily high-sulfur straight run fuel oils
> Distributes prod- ucts primarily in the Antwerp-Rotterdam- Amsterdam (“ARA”) region
> Significant production cost benefits are realized as a result of processing low-cost crude oils and discounted feedstocks
> As part of the North Sea System, BRC provides additional midstream processing and con-version capability
Coryton Refinery
North Sea Refining System
> Acquired in May 2007> Located in southeast-
ern UK approximately 30 miles east of London on a 589- hectare site
> 172,000 bpd total nameplate crude capacity and additional throughput capacity of up to 70,000 bpd of other feedstocks
Atmospheric DistillationVacuum DistillationFluid Catalytic CrackerCatalytic ReformerNaphtha PretreatersAlkylationProduct HydrotreatersIsomerizationSulphur RecoveryPropane De-asphalterBitumen Production
> Processes a blend of light sweet crude oils, and sour crude oils. Additionally, the refinery processes a significant volume of other low-cost feedstocks, primar-ily high-sulfur straight run fuel oils
> Distributes products primarily in southern UK
> Opportunities exist for both sweet vs. sour as well as light vs. heavy crude optimization
> Maximizes the produc-tion of higher value middle distillates while decreasing the produc-tion of lower value fuel oils
Teesside Refinery
> Acquired in 2000> Located in Teesside,
United Kingdom on a 40-hectare site
> 117,000 bpd total throughput capacity
Atmospheric Distillation Product Hydrotreater Sulphur Recovery
> Processes light sweet crude oil supplied via di-rect pipeline connection to the North Sea Ekofisk crude oil fields
> Large supplier of diesel fuel to the UK market
> Produces middle distillates which are predominately sold into a niche inland market that provides for real-ized product premiums relative to products imported from outside the region
> All Inland diesel is supplied as blended biodiesel

Petroplus Holdings AG | Company Overview | 5
Key Facts Major Units Crude and Products Highlights
Inland Refining System
Cressier Refinery
> Acquired in 2000> Located in Cressier near
Neuchâtel, Switzerland on a 74-hectare site
> 68,000 bpd total throughput capacity
Atmospheric DistillationVacuum DistillationThermal CrackerVisbreakerCatalytic ReformerProduct HydrotreatersIsomerization (TIP)Sulphur Recovery
> Processes a mix of light sweet crude oils, and light sour crude oils, supplied via pipe-line from Fos- sur-Mer in the Medi terranean
> Distributes products primarily in the local Swiss market
> Located in the niche inland market of Switzerland
> Significant product premiums realized based upon the Rhine Freight Premium for products imported from the ARA region
Ingolstadt Refinery
> Acquired in March 2007> Located in Ingolstadt,
Germany on a 128- hectare site
> 110,000 bpd total throughput capacity
Atmospheric DistillationVacuum DistillationFluid Catalytic CrackerCatalytic ReformerBitumen PlantPower GenerationProduct HydrotreatersIsomerizationSulphur RecoveryHydrogen Plant
> Processes mainly crude oil from the Caspian Sea region, supplied via pipeline from Trieste
> Distributes products primarily in the local Bavarian market
> Located in a niche inland market that pro-vides for realized prod-uct premiums relative to products imported from outside the region
Petit Couronne Refinery
> Acquired in March 2008> Located in Petit
Couronne near Rouen, France approximately 130 km Northwest of Paris on a 225-hectare site
> 154,000 bpd total throughput capacity
Atmospheric Distillation Vacuum Distillation Fluid Catalytic Cracker Catalytic Reformer Visbreaker Product Hydrotreaters Sulfur RecoveryLubes PlantBitumen PlantPower Generation
> Processes a blend of crude oils, predomi-nantly medium sour and heavy sweet crude oil varieties
> Distributes products primarily in the local markets, including Paris
> Favorably located in the regional market surrounding Paris
> Flexibility to run as a lubes and a traditional fuels refinery
Reichstett Refinery
> Acquired in March 2008> Located in Reichstett,
France near Strasbourg in the Alsace region close to the River Rhine (“Rhine”) and to the German border on a 650-hectare site
> 85,000 bpd total throughput capacity
Atmospheric DistillationVacuum Distillation Fluid Catalytic CrackerCatalytic ReformerProduct Hydrotreaters Sulfur Recovery
> Processes a blend of crude oils, including heavy and light sweet, and light and medium sour crude oil varieties, supplied via pipeline from Fos- sur-Mer in the Medi terranean
> Distributes products pri-marily in local markets, including Strasbourg
> Located in an inland market that provides for higher realized product premiums relative to products imported from outside the region

6 | Petroplus Holdings AG | Company Overview
Our History
Petroplus International B.V. (“PPI”), Netherlands was founded
in 1993. In 1998, the Company was listed on the Amsterdam
Stock Exchange.
March / April 2005 PPI is acquired and taken private by the
newly formed RIVR Acquisition B.V. (“RIVR”) and is subse-
quently delisted from Euronext Amsterdam.
February 2006 Argus Atlantic Energy Ltd. (“Argus”) is incor-
porated in Bermuda.
May 2006 We recruited a new management team, including
Thomas D. O’Malley as our Chairman and Chief Executive Officer.
We acquired European Petroleum Holdings N.V. (“EPH”), the
holding company of the BRC Refinery in Antwerp, Belgium,
and related supply and distribution assets from Sovereign
Holding Limited (Bermuda).
August 2006 We sold Petroplus Tankstorage, a tank storage
business; Frisol/Bunkering, a wholesale bunkering and trading
business; Oxyde Chemical, a chemicals and plastics trading
and distribution business; negotiated to sell 4Gas, a liquefied
natural gas import terminal and marketing business; and other
non-core assets.
Argus and RIVR merged and the combined entity is relocated
to Switzerland and renamed Petroplus Holdings AG.
November 2006 On November 30, 2006, the shares of
Petroplus Holdings AG traded on the SIX Swiss Exchange for
the first time.
March 2007 We acquired the Ingolstadt Refinery and select-
ed wholesale assets from ExxonMobil Central Europe Holding
(“Exxon”).
April 2007 We issued 7.6 million new shares through a Rights
Offering and subsequent International Offering. We also issued
US dollar (“USD”) 1.2 billion in high yield corporate bonds.
May 2007 We acquired the Coryton Refinery from BP PLC
(“BP”).
March 2008 Robert J. Lavinia was appointed Chief Executive
Officer (“CEO”) of the Company.
March 2008 We entered into a partnership (“PBF”) with The
Blackstone Group and First Reserve, to evaluate acquisitions
of crude oil refineries in the United States of America, its pos-
sessions and Eastern Canada.
March 2008 We issued USD 500.0 million in guaranteed, con-
vertible bonds (“CB”) due in 2013.
March 2008 We acquired the Petit Couronne and Reichstett
refineries from Société des Pétroles Shell SAS (“Shell”).
Petroplus Holdings AG, together with its subsidiaries (“Petro-
plus”, the “Company”, “we”, “our”, or “us”) is the largest inde-
pendent refiner and wholesaler of petroleum products in Eu-
rope. We are focused on refining and currently own and op-
erate seven refineries across Europe. The North Sea System
includes the Coryton Refinery in Coryton, United Kingdom, the
Belgium Refining Corporation (“BRC”) Refinery in Antwerp, Bel-
gium and the Teesside Refinery in Teesside, United Kingdom.
The Inland Market System includes the Petit Couronne Refinery
in Petit Couronne, France, the Ingolstadt Refinery in Ingolstadt,
Germany, the Reichstett Refinery in Reichstett, France and the
Cressier Refinery in Cressier, Switzerland. The seven refiner-
ies have a combined throughput capacity of approximately
864,000 barrels per day (“bpd”). We also own and operate a bi-
tumen and middle distillate processing facility in Antwerp, Bel-
gium. We sell our refined petroleum products on an unbranded
basis to distributors and end customers, primarily in the Unit-
ed Kingdom, Germany, France, Switzerland and the Benelux
countries as well, as on the global spot market.
Our supply and distribution group, which is centrally based
in Zug, Switzerland, is responsible for all physical supply
and commercial optimization activities for our refineries. The
group’s primary goal is to optimize both the supply of crude
oil and feedstocks for each refinery and the off-take of each
refinery’s petroleum products. This group is also responsible
for managing our commodity price exposure. We source our
crude oil on a global basis through a combination of spot mar-
ket purchases and short-term purchase contracts. We believe
purchasing based on spot market pricing provides us flexibility
in obtaining crude oil at lower prices and on a more accurate
“as needed” basis. Since all of our refineries, except Teesside,
have access, either directly or through pipeline connections
to deepwater terminals, we have the flexibility to purchase our
crude oil from a number of different countries. Our Teesside
Refinery is connected by a two-kilometer-long pipeline to the
end terminal of the Ekofisk crude oil pipeline. This provides
us with a cost advantage as it allows the refinery to receive
Ekofisk crude oil with minimal transportation costs.
Highly refined petroleum products, known as light products,
including diesel fuel, gasoline, jet fuel and home heating oil
amongst others, accounted for approximately 82% of our total
product volume for the year ended December 31, 2008.
The Petroplus Company

Petroplus Holdings AG | Company Overview | 7
Petroplus: “Pure Play” Multi-Site Refiner
North Sea Refining System Inland Refining System
1) Full capacity of crude reduces capacity of other feedstock throughput by 20,000 bpd and vice versa.
BRCCapacity: 110,000 bpd
Commissioned: 1968
Acquired: 2006
2
TeessideCapacity: 117,000 bpd
Commissioned: 1966
Acquired: 2000
3
CorytonCapacity: 172,000 bpd 1)
Other Input: 70,000 bpd 1)
Commissioned: 1953
Acquired: 2007
1 Petit CouronneCapacity: 154,000 bpd
Commissioned: 1929
Acquired: 2008
4
ReichstettCapacity: 85,000 bpd
Commissioned: 1963
Acquired: 2008
6
CressierCapacity: 68,000 bpd
Commissioned: 1966
Acquired: 2000
7
IngolstadtCapacity 110,000 bpd
Commissioned: 1963
Acquired: 2007
5
2
3
1
5
4
7
6

8 | Petroplus Holdings AG | Company Overview
Oil Refining Operations
We currently own and operate seven refineries across Europe:
the North Sea System includes the Coryton Refinery, the BRC
Refinery and the Teesside Refinery. The Inland Market System
includes the Petit Couronne Refinery, the Ingolstadt Refinery,
the Reichstett Refinery and the Cressier Refinery. The aggre-
gate crude oil and other feedstock throughput capacity at our
seven refineries is approximately 864,000 bpd. The following
table provides a summary of crude capacity, throughput and
production data for our refineries for the year ended Decem-
ber 31, 2008:
North Sea Refining System Inland Refining System
Total Coryton BRC Teesside Petit Couronne 2) Ingolstadt Reichstett 2) Cressier
Throughput Capacity (in bpd) 864,000 220,000 110,000 117,000 154,000 110,000 85,000 68,000
Crude Unit Throughput
Light sweet 49% 70% 11% 99% 32% 16% 57% 60%
Medium sweet 3% - - - - 16% 2% 2%
Heavy sweet 0% - 2% - - - - -
Light sour 14% 4% 3% - - 57% 4% 31%
Medium sour 17% 1% 39% - 61% 1% 28% 2%
Heavy sour 4% 0% 23% - - 5% 2% -
Total Crude Unit Throughput 87% 75% 78% 99% 93% 95% 93% 95%
Other feedstock throughput 13% 25% 22% 1% 7% 5% 7% 5%
Total Throughput 100% 100% 100% 100% 100% 100% 100% 100%
Production (in % of total throughput)
Light Products
Gasoline 24% 39% 12% - 17% 30% 23% 26%
Diesels and gasoils 1) 40% 30% 63% 34% 34% 45% 48% 41%
Jet fuel 6% 11% - 5% 11% 3% 1% 8%
Petrochemicals 2% 2% - - 7% 2% - 1%
Naphtha 5% - - 25% 5% 6% 9% 1%
LPG 5% 1% 6% - 7% 9% 7% 6%
Total Light Products 82% 83% 81% 64% 81% 95% 88% 83%
Low sulfur straight run 4% - - 34% - - - -
Fuel oil / Bitumen 12% 14% 17% - 15% 4% 10% 13%
Solid by-products / fuel con-
sumed in process / fuel loss
4% 5% 4% 2% 5% 5% 3% 4%
Total Production 102% 102% 102% 100% 101% 104% 101% 100%
1) Includes vacuum gasoil ("VGO") produced at the BRC Refinery.2) The information included above for the French refineries represents the nine months of operations since the March 31, 2008 acquisition.

Petroplus Holdings AG | Company Overview | 9
The Coryton Refinery
We acquired the Coryton Refinery and related supply and
distribution assets from BP, on May 31, 2007. The purchase
price was USD 1.6 billion, net including net working capital and
fees. The Coryton Refinery was commissioned in 1953 and
has a crude oil throughput capacity of 172,000 bpd and up
to an additional 70,000 bpd of other feedstocks. Full capacity
of crude reduces capacity of other feedstock throughput by
20,000 bpd and vice versa. The refinery is a fully integrated
catalytic cracking/alkylation refinery with substantial distillate
hydro desulphurization capacity.
Refinery Overview
The refinery is located in southeastern United Kingdom (“UK”)
on a 589-hectare site located about 30 miles east of London on
the Thames estuary. Opportunities exist for both sweet versus
sour optimization as well as light versus heavy crude optimiza-
tion. The refinery is further able to maximize the production of
higher value middle distillates while decreasing the production
of lower value fuel oils. The refinery’s low-sulfur products meet
the European Union (“EU”) 2009 mandatory maximum sulfur
limit of 10 parts per million (“ppm”) for gasoline and diesel.
Main Process Units
The following table sets forth the main process units of the
Coryton Refinery, their current capacities, start-up years and
years of their most recent major modification:
North Sea Refining System
Main Process Units Units Current Capacity 1) Start-Up Year Modification
Atmospheric Distillation 1 172,000 1963 -
Vacuum Distillation 2 39,000 1969 2006
62,000 1982 -
Diesel Hydrotreater 1 53,000 1969 2003
Continuous Catalytic Reformer 1 38,000 1989 -
Isomerization Penex 1 20,000 1993 -
Isomerization C4 1 32,000 1982 -
Propane Deasphalter 1 6,000 1969 -
Fluid Catalytic Cracking Unit 1 63,000 1982 2005
FCC Gasoline Hydrotreater (SHU / SHDS) 1 28,000 2003 -
HF Alkylation 1 20,000 1982 1993
Sulfur Recovery Unit (tons per stream day) 2 100 1982 2005
Bitumen (tons per stream day) 1 3,000 1969 -
1) Barrels per day, except as indicated.
10 | Petroplus Holdings AG | Company Overview
Feedstocks and Supply Arrangements
Crude is supplied from the North Sea, Mediterranean, Baltic
Sea as well as North Africa. Coryton’s crude unit allows for the
processing of blends of crudes and has twin feed trains with the
ability to segregate the atmospheric residues from these two
crude feeds (by means of a split base within the single crude
tower shell).
Product Off-take
The Coryton Refinery has four operational jetties for the supply
by sea of all crude and feedstocks and has one of the largest
bulk loading terminals in Europe. It supplies the majority of its
fuel products to major customers in the southeast of the UK by
a combination of road truck deliveries (from the adjacent bulk
terminal) and oil product pipelines. The refinery also ships oth-
er products by sea (fuel oil and propylene) to European mar-
kets and bitumen by road and rail. The refinery is connected
to the United Kingdom Oil Pipeline (“UKOP”), a multi-product
pipeline operated on behalf of its shareholders by British Pipe-
lines Agency (“BPA”) that runs from the Thames up to the Mid-
lands region. This pipeline feeds terminals at Buncefield (North
London), Northampton and Kingsbury (Birmingham) as well as
being a key supply route for aviation fuel into Heathrow Airport.
Coryton is also connected to Government Pipelines and Stor-
age System (“GPSS”), a government-owned pipeline system
operated by Oil & Pipelines Agency (“OPA”) that is dedicated
to jet fuel. This pipeline has traditionally supplied fuel to service
Air BP customers and third party demand at Stansted Airport
and the military airbases of East Anglia.
Product off-take agreements entered into with BP as part of
the Coryton Refinery purchase agreement accounted for ap-
proximately 80% of the refinery’s gasoline production, 90%-
100% of jet fuel production and 90%-100% of ULSD and gasoil
production in 2008. The initial term of the agreement lasts until
2012; the percentage of products purchased by BP will de-
crease yearly.
Energy and Other Utilities
The Coryton Refinery has an electrical demand between 45
and 50 megawatts. There is one gas turbine generator that
produces approximately 25 megawatts of electricity. In addi-
tion, there are four steam turbine generators that are able to
produce approximately 10 megawatts of electrical power in
total. The refinery buys approximately 10–15 megawatts via
the utility grid. The refinery’s steam requirements are met by
a combination of three steam boilers plus additional steam
generation from certain process units. All hydrogen needs are
supplied by onsite production at the continuous catalytic re-
former.
Tankage Capacity
Tankage at the refinery is approximately 9.5 million barrels;
with 3.9 million barrels dedicated to crude and other feedstock
storage and approximately 4.0 million barrels to intermediate
and finished products. In addition, Coryton has tankage at its
bulk terminal with a capacity of 1.6 million barrels.

Petroplus Holdings AG | Company Overview | 11
The BRC Refinery
We acquired EPH, the holding company for the BRC Refin-
ery and related supply and distribution assets, from Sovereign
Holding Limited (Bermuda) on May 31, 2006. The purchase
price was USD 511.2 million, net including net working capi-
tal and fees. The BRC Refinery was commissioned in 1968
and has a crude oil throughput capacity of 110,000 bpd. The
refinery is an atmospheric/vacuum distillation refinery with vis-
breaking capability.
Refinery Overview
The BRC Refinery is located north of the Port of Antwerp at
the center of the Antwerp-Rotterdam-Amsterdam (“ARA”) re-
gion on a 105-hectare site. The refinery’s location provides
it with several competitive advantages, including access to
feedstocks that can be purchased on a spot basis at prices at
or below prevailing market benchmark prices and the ability to
transport feedstocks and products by sea, including to North
America. The refinery’s location also gives it close proximity to
intermediate and finished product markets in a densely popu-
lated region with a heavy industrial presence as well as to a
number of other refineries in the Antwerp area.
One of the key strengths of the BRC Refinery is its extensive
hydro-desulfurization capacity that enables the refinery to pro-
cess a predominantly sour crude slate to produce low-sulfur,
light products, including gasoline, naphtha, ultra low sulfur
diesel (“ULSD”), heating oil and VGO. The refinery’s low-sulfur
products meet the EU 2009 mandatory maximum sulfur limit
of 10 ppm for gasoline and diesel. The low-sulfur and low-
aromatic qualities of the refinery’s gasoline components make
them highly marketable in both the Northwest European and
U.S. markets.
Since acquiring the BRC Refinery, we have continued to im-
plement the refinery’s ongoing improvement plan. The former
owner of the BRC Refinery invested USD 124.9 million from
2000 through 2005 improving the refinery, including a product
tank farm refurbishment program, instrumentation moderniza-
tion and construction of an isomerization unit, which became
operational in June 2005. The tank farm refurbishment pro-
gram is one of the conditions agreed with the Belgian authori-
ties in 2001 in connection with the renewal of the refinery’s
operating permit, which will be up for renewal in 2021.
During a scheduled maintenance shutdown in 2007, the vac-
uum distillation unit improvement project was completed. The
project improved the yield of VGO and heating oil by 3,100
bpd. During 2008, we completed the re-instrumentation of the
Visbreaker unit and also completed the new waste water treat-
ment facility.

12 | Petroplus Holdings AG | Company Overview
Feedstocks and Supply Arrangements
The BRC Refinery processes predominantly higher sulfur
crude oils and high-sulfur straight-run fuels and supplements
these feedstocks with a variety of other feed and blendstocks
purchased on the spot market to optimize its gross refining
margins. The BRC Refinery’s feedstocks are shipped primarily
from Baltic Sea ports.
Product Off-take
BRC’s products are sold to a variety of customers, including
oil majors, petrochemical companies, and wholesalers. The
BRC Refinery uses two jetties for loading products. An 18-
bay truck-loading rack is used for product deliveries over the
road.
The bulk of the BRC Refinery’s products are sold on a F.O.B.
basis, with about 70% of the total products being loaded on
barges to take advantage of the higher prices generated from
local sales in the ARA inland market. Some of the refinery’s
products are sold on a discharge delivered basis, for example,
into the United States.
The BRC Refinery’s finished gasoline and gasoline blend com-
ponents are primarily sold in barge lots. The high quality and
low-sulfur content of the refinery’s gasoline components al-
lows premium grades of gasoline to be blended at the refin-
ery. Since 2005, the refinery has been selling lots of gasoline
and reformulated gasoline blendstock for oxygenate blending
(“RBOB”) to North America.
Main Process Units
The following table sets forth the main process units of the
BRC Refinery, current capacities, start-up years and timing of
most recent major upgrade modification:
A large proportion of the refinery’s middle distillates is heating
oil, with the majority of this product selling in the local ARA
market. Heating oil is either sold locally or exported depending
on the best economic outlet.
In addition to being a major supplier of VGO within northwest
Europe, the BRC Refinery exports cargo lots of VGO to East
or Gulf Coast refineries in the United States to be used as fluid
catalytic cracking (“FCC”) or hydrocracker feedstock.
The majority of BRC’s heavy residual fuels are sold to supply
marine bunkering companies in the Antwerp harbor, one of the
busiest ports in Europe.
Energy and Other Utilities
The BRC Refinery’s average power demand is between 12.5
and 15 megawatts. Electricity is supplied to the BRC refinery
under a contract with Electrabel, a major provider of electricity
in Antwerp. Steam for the refinery is produced by two onsite
boilers. The refinery purchases hydrogen from Air Liquide to
supplement its on-site production.
Tankage Capacity
The BRC Refinery has crude storage capacity of 1.8 million
barrels and product/intermediate storage capacity of 3.8 mil-
lion barrels.
Main Process Units Units Current Capacity 1) Start-Up Year Modification
Atmospheric Distillation 1 110,000 1968 2000
Vacuum Distillation 1 59,000 1973 2007
Naphtha Hydrotreater 1 26,500 1968 -
Catalytic Reformer 1 10,200 1968 1999
Isomerization (TIP) 1 4,300 2005 -
Distillate Hydrotreater 1 35,500 1975 1993
Visbreaker 1 24,200 1986 2000
Sulfur Recovery Unit (tons per stream day) 1 108 1980 -
LPG Recovery Unit 1 4,400 1968 -
1) Barrels per day, except as indicated.

Petroplus Holdings AG | Company Overview | 13
The Teesside Refinery
The Teesside Refinery is a producer of ULSD for the UK com-
mercial diesel market. A key strength of the refinery is its abil-
ity to produce low-sulfur diesel that meets the EU 2009 man-
datory maximum 10 ppm sulfur limit for road fuels. Through
agreements with biodiesel producers, Teesside is currently
one of the suppliers of biodiesel blend, branded as Bioplus,
a 95%–5% blend of mineral oil diesel with Fatty Acid Methyl
Ester “FAME”, derived from renewable sources such as rape-
seed, soya or used cooking oil.
Since acquiring the Teesside Refinery, we have completed a
number of upgrades and operational improvements at the re-
finery. In 2007, we commissioned a dedicated A1 Jet Kerosene
storage and truck-loading system capable of exporting up to
110 kilotons per year.
We acquired the Teesside Refinery in December 2000. The
refinery was commissioned by Phillips Imperial Petroleum Ltd.
in 1966 and has a total throughput capacity of 117,000 bpd.
The refinery is an atmospheric distillation refinery with distillate
hydrotreating capability.
Refinery Overview
The Teesside Refinery is located on a 40-hectare site on the
northeastern coast of England. Its direct pipeline access to
the Ekofisk offshore oilfields and its Ekofisk crude-processing
capabilities give the refinery an inherent transportation cost
advantage over other similar European refineries. In addition,
Teesside’s coastal location provides it with the ability to export
products by vessel.

14 | Petroplus Holdings AG | Company Overview
Main Process Units
The following table sets forth the main process units of the
Teesside refinery, their current capacities, start-up years and
years of their most recent major modification:
Feedstocks and Supply Arrangements
Teesside has historically processed light, sweet North Sea Ekofisk
crude oil. The refinery receives most of its feedstock via a two-
kilometer-long pipeline, which is owned and operated by us, from
the nearby Seal Sands terminal, which is directly linked to the
Ekofisk field by a ConocoPhillips pipeline. In addition to Ekofisk
crude oil, the refinery also processes a small amount of additional
feedstock blended with the crude oil. We currently source North
Sea feedstocks for the Teesside refinery on a spot basis.
Product Off-take
We sell the Teesside Refinery’s fuels directly to end users,
petrochemical manufacturers, wholesalers and branded and
unbranded resellers.
The Teesside Refinery has a truck-loading rack and railcar-
loading facilities for loading of products for delivery to custom-
ers. The refinery also uses an off-site jetty owned by us and
operated by Saudi Basic Industries Corporation (“SABIC”) with
ship-loading facilities of 15,000 barrels per hour and can handle
vessels up to 80,000 tons. Petroplus or SABIC each have the
option to terminate this arrangement with 12 months notice.
Teesside has well established outlets to deliver its products to
customers. The refinery’s middle distillates are sold predomi-
nantly in the North East United Kingdom, with delivery by truck
and train. Heavy and light distillates, including naphtha, are
sold in more distant industrial regions of the United Kingdom
as well as abroad for industrial use, with delivery in each case
by ship. The Teesside Refinery’s straight-run fuel oil is sold
both on an F.O.B. basis and delivered to the United States.
The quality of Ekofisk straight-run fuels, with their lower sulfur
content, consistent properties, and lower levels of other im-
purities, results in a significant premium over other low-sulfur
straight-run fuels available in northwest Europe.
Energy and Other Utilities
The Teesside Refinery requires less power to operate than
more complex refineries. The refinery’s average power de-
mand is approximately 7 megawatts. The Teesside Refinery
has arrangements with the adjacent SABIC petrochemicals
facility for the provision of key utilities to the refinery. These
utilities include hydrogen and nitrogen via pipeline, power from
the local utilities grid and waste treatment in SABIC’s waste-
water treatment plant. SABIC or Petroplus may terminate the
agreement covering these services with 12 months notice.
Tankage Capacity
The aggregate storage capacity for the Teesside Refinery’s
crude is 2.5 million barrels. Crude can be stored in the under-
ground salt caverns at the adjacent SABIC petrochemicals fa-
cility, which has a total capacity of 1.6 million barrels, or in the
refinery’s on-site crude oil tanks, which have a total capacity
of 910,000 barrels.
The Teesside Refinery’s total product storage capacity is 1.9
million barrels. The refinery’s on-site product storage tanks
have a capacity of 1.7 million barrels. In addition, product stor-
age tanks with a capacity of 210,000 barrels are located at the
refinery’s truck- and rail-loading facilities.
Main Process Units Units Current Capacity 1) Start-Up Year Modification
Atmospheric Distillation 1 117,000 1966 1996
Gasoil Hydrotreating 1 32,000 1992 2004
Sulfur Recovery (tons per stream day) 1 4 1997 -
1) Barrels per day, except as indicated.

Petroplus Holdings AG | Company Overview | 15
The Petit Couronne Refinery
Inland Refining System
We acquired the Petit Couronne Refinery from Shell on March
31, 2008. The combined preliminary purchase price for both
the Petit Couronne and Reichstett refineries was USD 831.5
million, net including net working capital and fees. The Pe-
tit Couronne Refinery was commissioned in 1929 and has a
crude oil throughput capacity of 154,000 bpd. The refinery is
an atmospheric/vacuum distillation refinery with visbreaking,
thermal and FCC capabilities, including bitumen and lube oil
manufacturing.
Refinery Overview
The Petit Couronne Refinery is situated on a 225-hectare site
located near Rouen, about 130 kilometers northwest of Paris
on the River Seine. Two of the refinery’s key benefits are its fa-
vorable location to the regional market surrounding Paris and
its flexibility to run as a lubes and a traditional fuels refinery.
Starting in the mid-fifties, a program to increase the capacity
of the refinery was launched. This program included the con-
struction of a cat cracker in 1955, a new crude distillation unit
(“CDU”) in 1958 and the start-up of the base oil manufacturing
activities with the construction of a furfural extraction unit, the
same year.
From 1971 to 1979, the production capacity of the site was
further developed with the addition of the base oil manufactur-
ing plant and the construction of a new CDU, hydrodesulphu-
rization (“HDS”) unit and a platformer, all of which are still in
operation.
Further investments were made in the 1990s to meet more
stringent environmental regulations: the most significant were
the construction of a new sulfur recovery unit (“SRU”) in 1993,
followed by a second SRU in 2005. The refinery’s low-sulfur
products meet the EU 2009 mandatory maximum sulfur limit
of 10 ppm for gasoline and diesel.
Main Process Units
The following table sets forth the main process units of the
Petit Couronne refinery their current capacities, start-up years
and years of their most recent major modification:

16 | Petroplus Holdings AG | Company Overview
Feedstocks and Supply Arrangements
The Petit Couronne Refinery can process a range of sour and
sweet crude oils. Crude is supplied from a variety of sources
including the Mediterranean, Baltic Sea, Africa, as well as the
North Sea. Crude oil is primarily delivered to the refinery ini-
tially through the crude storage terminal in Le Havre and sub-
sequently through a 70-kilometer refinery-owned pipeline.
Product Off-take
Petit Couronne is connected to the Société des Transports
Pétroliers par pipeline (“TRAPIL”) with an ownership interest of
5.5%, through which the majority of the refinery’s lighter prod-
ucts, such as clean transportation fuels, are transported. The
pipeline is connected to several product storage terminals that
supply the greater Paris area.
Petit Couronne supplies the majority of its fuel products to ma-
jor customers in the northwest of France, including the Paris
region, by a combination of pipeline, rail, barge, and truck de-
liveries (from the refinery’s adjacent bulk terminal). The refinery
also ships other products, base oils and bitumen by road and
sea.
In connection with the acquisition of the Petit Couronne Refi-
nery, we entered into a processing agreement with Shell for ap -
proximately half of the Petit Couronne Refinery’s total crude oil
throughput. This processing agreement expired on December
31, 2008. Additionally, Petroplus and Shell have entered into
off-take agreements, at market prices, for approximately 95-
100% of the refinerys’ aviation fuels, lube oils, bitumen pro-
ducts and gasoline intermediate production. These are three
to five year contracts, reducing each year until expiration.
Energy and Other Utilities
The Petit Couronne Refinery’s average electricity demand is
approximately 45 megawatts. The refinery is able to meet up
to 75% of its electricity requirements with its three steam tur-
bine generators. The refinery buys about 22 megawatts from
the utility grid. The refinery’s high pressure steam requirements
are met by a combination of four steam boilers and an FCC
carbon monoxide boiler. Hydrogen is produced at the onsite
hydrogen plant supplementing the production of the catalytic
reformer unit which meets the hydrogen requirements of the
refinery.
Tankage Capacity
Storage capacity at the refinery is approximately 12.3 million
barrels, with 4.7 million barrels dedicated to crude and other
feedstocks and approximately 7.6 million barrels to intermedi-
ate and finished products. Additionally, we rent crude tanks at
the Le Havre crude terminal with storage capacity of approxi-
mately 2.9 million barrels.
Main Process Units Units Current Capacity 1) Start-Up Year Modification
Atmospheric Distillation 1 154,000 1974 -
Vacuum Distillation 2 129,000 1958-1974 -
Fluid Catalytic Cracking 1 24,000 1955 1994
Catalytic Reformer 1 29,000 1974 -
GO Desulphurization 1 40,000 1974 -
Naphtha Hydrotreater 1 54,000 1974 -
Hydrogen Manufacturing Plant (tons / day) 1 30 1971 2000
Visbreaker 1 12,000 1934 -
Sulfur Recovery (tons / day) 2 285 1993-2005 -
Lubes Hydrotreaters 2 11,000 1972-1977 -
Dewaxing 2 9,000 1972-1977 -
Hydrofinisher 1 3,000 1974 -
Furfurol extraction 2 4,600 1959 -
Propane Deasphalting 1 6,200 1972 -
Blown Bitumen Unit (tons / day) 1 450 1962 -
1) Barrels per day, except as indicated.

Petroplus Holdings AG | Company Overview | 17
The Ingolstadt Refinery
We acquired the Ingolstadt Refinery and related assets on
March 31, 2007 from Exxon. The purchase price was USD
694.8 million, net including the value of net working capital and
fees. The Ingolstadt Refinery was commissioned in 1963 and
has a throughput capacity of 110,000 barrels per day. The re-
finery is an atmospheric/vacuum distillation refinery with two
crude oil trains and an FCC conversion unit.
Refinery Overview
The Ingolstadt Refinery is located on a site covering approxi-
mately 128-hectares in Ingolstadt, Germany, approximately 80
kilometers north of Munich. Exxon commissioned the Ingol-
stadt refinery in 1963 as a hydro-skimming refinery to provide
motor fuels for the growing industrial base of southern Germa-
ny. In 1969 an FCC unit was added and the refinery became a
“cat-cracking” refinery.
According to information provided by Exxon, approximately
USD 111 million was spent from 2000 to 2005 on improving the
Ingolstadt Refinery. From 2000 to 2003, the refinery was modi-
fied by installing a hydrogen plant, a cracked naphtha splitter
and other improvements to, among other things, reduce fuel
sulfur content to meet German product standards for gasoline
and diesel, which were implemented in advance of the 2009
deadline for the European Auto Oil II standards.
Main Process Units
The following table sets forth the main process units of the
Ingolstadt Refinery, their current capacities, start-up years and
years of their most recent major modification:
Main Process Units Units Current Capacity 1) Start-Up Year Modification
Atmospheric / Vacuum Distillation 2 110,000 1963 -
Diesel Hydrotreater 2 28,700 1977 2007
Heating Oil Hydrotreater 1 19,600 1991 -
Catalytic Reformer 1 19,600 1963 -
Isomerization 1 7,550 1991 -
Fluid Catalytic Cracking Unit 1 29,000 1969 2005
Sulfur Recovery Unit (tons per stream day) 1 70 1963 1983
Hydrogen Plant (tons per stream day) 1 27 2003 -
Naphtha Hydrotreater 1 37,700 1963 -
Kerosene Hydrotreater 1 20,400 1963 -
1) Barrels per day, except as indicated.

18 | Petroplus Holdings AG | Company Overview
Feedstocks and Supply Arrangements
The Ingolstadt Refinery can process a range of sweet crude
oils. On average the refinery processes approximately 80%
crude from the Caspian Sea region. The refinery also pro-
cesses medium as well as some heavy crude oils to produce
bitumen, generally during the road-paving season in Germany
and Austria.
All crude is delivered to the Ingolstadt Refinery directly from
the port city of Trieste, Italy, via a 465-kilometer portion of the
Trans-Alpine (“TAL”) pipeline system.
Product Off-take
The Ingolstadt Refinery’s product slate is focused primarily
on the production of higher value middle distillates, includ-
ing ULSD, gasoil and jet fuel, and, to a lesser extent, various
grades of gasoline.
Of the Ingolstadt Refinery’s total production, most is currently
sold in Germany and Austria. With its location in a high-de-
mand local market, the Ingolstadt refinery is able to achieve
product premiums to ARA reference prices for gasoline, jet
fuel and distillates.
Approximately one half of the refinery’s total production is de-
livered to customers by rail; the other half by truck. The re-
finery’s railcar-loading facilities have a capacity of 27.8 million
barrels per year. The refinery’s truck-loading facilities comprise
17 loading racks with the capacity to load up to 10.5 million
barrels of gasoline per year, 11.3 million barrels of distillates
per year, 2.3 million barrels of LPG per year and 4.4 million
barrels of bitumen and heavy fuel oil per year. In addition, a
fuel oil pipeline allows the refinery to supply fuel oil to a nearby
power station.
In connection with the acquisition of Ingolstadt, we entered into
a five-year off-take agreement with ESSO Deutschland GmbH
(“Esso”) in Bavaria for substantial amounts of gasoline, ULSD
and jet fuel. This agreement accounted for approximately 30%
of the Ingolstadt refinery’s gasoline production, 10% of its
ULSD production and 30% of its jet fuel production in 2008.
The off-take agreement terminates on December 31, 2011.
The Ingolstadt Refinery’s production of heating oil is sold on the
spot market via branded and unbranded resellers. Petroplus
Bayern, which we acquired in connection with the acquisition,
operates as a branded reseller.
The Ingolstadt Refinery’s production of LPG’s and heavy fuel
oil is mainly sold directly to end consumers in and around Ba-
varia. The remainder is sold to resellers or exported to Eastern
Europe or the ARA region. The majority of Bitumen production
is sold on a wholesale basis.
Energy and Other Utilities
The Ingolstadt Refinery’s average power demand is approxi-
mately 25 megawatts. The Ingolstadt Refinery is able to gen-
erate most of its electricity requirements as well as all of its
steam requirements from refinery fuel gas. The refinery has two
turbines with a maximum gross electrical output of 7.5 mega-
watts and one let-down turbine with an output of 11 mega-
watts. In addition, the refinery purchases energy to meet its re-
maining electricity needs and can import up to 15 megawatts
of electricity from a local electric provider. The refinery also has
a FCC unit carbon monoxide boiler and two fired boilers for
steam production. Hydrogen is produced at the onsite hydro-
gen plant; this production supplements other onsite sources
and meets all of the refineries hydrogen requirements.
Tankage Capacity
The Ingolstadt Refinery has crude storage capacity of approxi-
mately 1.0 million barrels and product storage capacity of ap-
proximately 5.9 million barrels.

Petroplus Holdings AG | Company Overview | 19
We acquired the Reichstett Refinery on March 31, 2008 from
Shell. The combined preliminary purchase price for both the
Petit Couronne and Reichstett refineries was USD 831.5 mil-
lion, net including net working capital and fees. The Reichstett
Refinery was originally commissioned in 1963 and has a crude
oil throughput capacity of 85,000 barrels per day. The refinery
is an atmospheric/vacuum distillation refinery with visbreaking,
thermal and FCC capability.
Refinery Overview
The Reichstett Refinery is located on a 650-hectare site in Al-
sace, France, near the city of Strasbourg, about 5 kilometers
from the River Rhine. The refinery started operation as a semi-
complex, hydro-skimming refinery and was upgraded in 1983
when an FCC unit was built, together with new utilities (Gas
turbine and second steam boiler). In 1996, the gasoil desul-
phurization unit was upgraded to produce 50 ppm, and then
eventually 10 ppm automotive diesel. The refinery’s low-sulfur
products meet the EU 2009 mandatory maximum sulfur limit
of 10 ppm for gasoline and diesel.
The Reichstett Refinery
The Reichstett Refinery is located in an inland market, sup-
ported by economically attractive crude supply from the
Mediterranean area via the Société du Pipeline Sud Européen
(“SPSE”) and a logistical premium for products such as ULSD
and heating oil given its location.

20 | Petroplus Holdings AG | Company Overview
Main Process Units
The following table sets forth the main process units of the
Reichstett Refinery their current capacities, start-up years and
years of their most recent major modification:
Feedstocks and Supply Arrangements
Crude is mostly supplied from the Mediterranean, Africa,
Baltic Sea, Latin America, Middle East and North Sea. Crude
oil is delivered to the Fos-sur-Mer terminal on the Mediter-
ranean coast of France and shipped via the SPSE pipeline
to the refinery. This is the same terminal and pipeline that
services the Cressier Refinery.
Product Off-take
Products are distributed primarily in the region surrounding
the refinery via truck and rail. The refinery also has prod-
uct pipelines and connections to the Rhine for distribution
by barge. The refinery has a truck-loading station equipped
with 27 truck-loading racks. The refinery is connected by
pipeline to a third party LPG filling plant (built on a piece of
land owned by Petroplus and rented to the LPG plant owner)
where both LPG streams (commercial butane and commer-
cial propane) are either bottled or loaded in road or rail tank
cars. The refinery is connected by three dedicated eight
kilometers long pipelines to a river terminal on the Rhine:
one gasoline pipeline, one middle distillate pipeline and
one heavy fuel pipeline. The Rhine terminal installations are
owned by Petroplus and have two jetties capable of loading/
unloading up to four barges at the same time.
In connection with the acquisition of the Reichstett Refinery we
entered into off-take agreements with Shell, at market prices,
for approximately 95%-100% of aviation fuels, bitumen and
gasoline intermediates produced at the Reichstett Refinery.
These are four to five year contracts, reducing each year until
expiration.
Energy and Other Utilities
The average power demand of the refinery is approximately
17 megawatts. About 40% of this demand is generated by the
refinery by a gas turbine (burning fuel gas) unit. The remaining
60% is supplied through a long term contract with the Atel
group expiring in 2010.
Tankage Capacity
Storage capacity at the refinery is approximately 8 million bar-
rels, with 1.5 million barrels dedicated to crude and other feed-
stock storage and approximately 6.5 million barrels to inter-
mediate and finished products.
Main Process Units Units Current Capacity 1) Start-Up Year Modification
Atmospheric Distillation 1 85,000 1963 -
Vacuum Distillation 1 38,000 1983 -
Naphtha Hydrotreater 1 27,000 1963 -
GO Desulphurization 1 23,000 1963 1996
Catalytic Reformer 1 17,000 1963 -
Catalytic Cracker 1 16,000 1983 -
Visbreaker 1 12,000 1963 -
Thermal GO Unit 1 9,000 1963 -
Claus Unit (tons / day ) 2 140 1963 1994
Merox 1 3,000 2004 -
1) Barrels per day, except as indicated.

Petroplus Holdings AG | Company Overview | 21
Another strength of the Cressier Refinery is the ability of its
thermal cracker and visbreaking units to upgrade heavy VGOs
and heavy fuel oil to higher value clean products, such as
ULSD and home heating oil. The refinery’s production of gaso-
line and diesel meets the EU 2009 and Swiss mandatory 10
ppm sulfur limits, and home heating oil meets the 1000 ppm
sulfur standards. Through the startup at the end of 2004 of an
on-site hydrogen facility operated by Air Products Chemicals,
Inc. (“Air Products”) the refinery meets the specification re-
quirements under the European Commission’s Oil II Program.
The Cressier Refinery
We acquired the Cressier Refinery and related assets from
Shell Switzerland in May 2000. The Cressier Refinery was
commissioned by Shell in 1966 and has a crude oil throughput
capacity of 68,000 bpd. The Cressier Refinery is an integrat-
ed atmospheric-vacuum distillation, visbreaking and thermal
cracking refinery.
Refinery Overview
The Cressier Refinery is located on a 74-hectare site in the
canton of Neuchâtel in the western part of Switzerland and
is one of only two refineries in Switzerland. During 2008, the
Cressier refinery’s production accounted for approximately
25% (by volume) of all refined product sales in Switzerland. Of
Switzerland’s total demand for refined products, approximate-
ly 60% was imported in 2008, principally by rail and by barge
on the Rhine and by pipeline. During times of very high or very
low water levels, or high demand for refined products along
the Rhine, transportation costs can increase significantly. As
a consequence of these transportation costs and its niche
Inland location, the Cressier refinery benefits from a built-in
margin premium relative to Rotterdam and German refineries
competing to supply the Swiss market.

22 | Petroplus Holdings AG | Company Overview
Main Process Units
The following table sets forth the main process units of the
Cressier refinery, their current capacities, start-up years and
years of their most recent major modification:
Feedstocks and Supply Arrangements
The Cressier Refinery is able to process sweet crude oil and
a smaller amount of sour crude oils. We currently source the
Cressier refinery’s crude oils through spot market purchases
and, to a lesser extent, short-term purchase contracts.
Crude for the Cressier Refinery is shipped to Fos-sur-Mer
in southern France and transported first by the SPSE pipe-
line to the Gennes depot in France, and then by the Société
Française du Pipeline du Jura (“SFPLJ”) and Oléoduc du Jura
Neuchâtelois S.A. (“OJNSA”) pipelines to the Cressier Refin-
ery. We own 100% of the equity of the SFPLJ pipeline (from
our connection with the SPSE pipeline to the French-Swiss
border) and 80% of the equity of the OJNSA pipeline (from the
Swiss-French border to the Cressier Refinery). Our right to use
the SPSE pipeline is governed by a 25-year throughput agree-
ment with SPSE.
Product Off-take
We typically sell the majority of the Cressier Refinery’s annual
production to oil majors, resellers, industrial customers and
retail petrol stations. The majority of the refinery’s gasoline is
sold pursuant to term contracts, with a duration of one year,
with the remainder being sold on a spot market basis.
The Company has a truck-loading rack and railcar facilities for
loading of products to customers. The refinery also has three
product depots, located in: Birsfelden, which supplies the
northern Swiss region, including Basel; a 32% ownership in-
terest in a Geneva depot that supplies the southwestern Swiss
region; Niederhasli, which supplies the northern Swiss region
around Zurich; and Rothenburg, which supplies the central
Swiss region around Lucerne. The Birsfelden depot also has
barge-loading facilities for shipments to and from the ARA re-
gion with storage capacity of 630,000 barrels.
Cressier’s gasoline and middle distillates are sold in Switzer-
land.
Energy and Other Utilities
The refinery’s average power demand is approximately 14 me-
gawatts. The Cressier Refinery’s electricity requirements are
supplied under a contract with Groupe E, a major provider of
electricity in western Switzerland. Hydrogen is supplied to the
Cressier Refinery under a 15-year contract, expiring 2019, with
Air Products.
Tankage Capacity
Cressier’s aggregate crude storage capacity is 2.1 million bar-
rels. The refinery’s on-site crude storage tanks have a capac-
ity of 480,000 barrels. The Gennes depot has a capacity of
630,000 barrels. In addition, the refinery has been allocated
945,000 barrels of storage capacity at the SPSE terminal in
Fos-sur-Mer. The Cressier Refinery’s on-site product storage
tanks have a combined capacity of 2.7 million barrels.
Main Process Units Units Current Capacity 1) Start-Up Year Modification
Atmospheric Distillation 1 68,000 1966 2007
Vacuum Distillation 1 37,000 1966 2007
Thermal Cracker 1 12,100 1966 2005
Visbreaker 1 10,800 1966 2005
Catalytic Reformer 1 16,400 1966 1986
Naphtha Hydrotreating 1 27,700 1966 2005
Kerosene Hydrotreating 1 9,400 1966 2001
Gasoil Hydrotreating 1 29,800 1993 -
Isomerization 1 7,500 1976 1996
Sulfur Recovery (tons per stream day) 1 25 1966 1988
LPG Unit 1 4,400 1966 1984
1) Barrels per day, except as indicated.
Petroplus Holdings AG | Company Overview | 23
The Antwerp Processing Facility
The Antwerp Processing Facility was acquired from the Dae-
woo Group in 1997. The Antwerp Bitumen Processing Facility
was acquired from AB Nynas Petroleum in 2003. The Antwerp
Processing Facility is a hydro-treating processing facility of low
complexity. Its major units include two atmospheric distillation
units, one vacuum distillation unit, diesel hydrotreatment facili-
ties and a sulfur-recovery unit.
One of the Antwerp Processing Facility’s hydro-desulfurization
units desulfurizes heavy gasoil to produce heating oil. The fa-
cility can provide up to approximately 27,200 barrels of heat-
ing oil per day. Since the closure of its reformer, the Antwerp
facility receives the hydrogen needed for desulphurization
from Air Liquide pursuant to a supply contract. The facility
also processes heavy crude oil, primarily Venezuelan crude
oil, into bitumen. The total facility processes on average 9.6
million barrels of crude oil and feedstock into 2.8 million barrels
of bitumen and 6.5 million barrels of middle distillates (VGO,
heating oil) per year.
The Antwerp Processing Facility has 5.7 million barrels of tank
storage capacity. Approximately 50% of this capacity is leased
to third parties.
Product Off-take
We typically sell the majority of Antwerp’s annual production
of diesel and heating oil to oil majors, whereas all bitumen pro-
duction is sold under a long-term supply agreement ending
in 2013.
Other
24 | Petroplus Holdings AG | Operating and Financial Review
Operating and Financial Review
Management Discussion and Analysis of the Financial Condition and the Results of Operations
Overview
We are the largest independent refiner and wholesaler of pe-
troleum products in Northwest Europe. We are focused on re-
fining and currently own and operate seven refineries across
Northwest Europe. The North Sea System includes the Cory-
ton Refinery in Coryton, United Kingdom, the BRC Refinery
in Antwerp, Belgium and the Teesside Refinery in Teesside,
United Kingdom. The Inland Refining System includes the Petit
Couronne Refinery in Petit Couronne, France, the Ingolstadt
Refinery in Ingolstadt, Germany, the Reichstett Refinery in Reich-
stett, France and the Cressier Refinery in Cressier, Switzerland.
The seven refineries have a combined throughput capacity of
approximately 864,000 bpd. We also own and operate a bitu-
men and heating oil processing facility in Antwerp, Belgium.
We sell our refined petroleum products to distributors and end
customers, primarily in the United Kingdom, France, Germa-
ny, Switzerland and the Benelux countries, as well as on the
global spot market.
Factors Affecting Comparability
Acquisition of the Petit Couronne and Reichstett refineriesOn March 31, 2008, we completed the purchase of the Pe-
tit Couronne and Reichstett refineries located in France. The
preliminary purchase price, including fees, inventory and oth-
er adjustments, totaled approximately USD 831.5 million, net;
and was financed with proceeds from the issuance of convert-
ible bonds, drawings under our working capital facilities and
cash on hand. The Petit Couronne and Reichstett refineries
and other related assets and liabilities are included in the Con-
solidated Balance Sheet as of December 31, 2008, based on
a preliminary purchase price allocation performed upon the
closing of the transaction. The Consolidated Income and Cash
Flow Statements include nine months of operations of the
Petit Couronne and Reichstett refineries for the year ended
December 31, 2008.
Acquisition of the Coryton RefineryOn May 31, 2007, we completed the purchase of the Coryton
Refinery located on the Thames Estuary in the United King-
dom. The purchase price, including fees, inventory and oth-
er adjustments, totaled USD 1.6 billion, net; and was financed
with proceeds from our issuance of senior notes, cash on hand
and drawings under our working capital facilities. The Cory-
ton Refinery and other related assets are included in the Con-
densed Consolidated Balance Sheet based on the final asset
valuation, which was completed during the second quarter of
2008. The preliminary purchase price allocation was adjusted
as necessary.
Acquisition of the Ingolstadt RefineryOn March 31, 2007, we completed the purchase of the Ingol-
stadt Refinery located in Ingolstadt, Germany, together with
selected wholesale operations. The purchase price, including
fees, inventory and other adjustments, totaled USD 694.8 mil-
lion, net; and was financed with cash on hand and drawings
under our working capital facilities. The Ingolstadt Refinery and
other related assets are included in the Condensed Consoli-
dated Balance Sheet based on the final asset valuation, which
was completed during the first quarter of 2008. The preliminary
purchase price allocation was adjusted as necessary.
Issuance of Senior Secured Convertible BondsOn March 26, 2008, Petroplus Finance Limited, a subsidiary of
the Company, issued USD 500.0 million in guaranteed CB due
in 2013. The debt is guaranteed by the Company as well as by
certain of its subsidiaries. The bonds are interest-bearing at the
rate of 3.375%, with the interest payable semi-annually in ar-
rears on March 26 and September 26 of each year the debt is
outstanding. Payments commenced on September 26, 2008.
Factors Affecting Operating Results
OverviewOur earnings and cash flows from operations are primarily af-
fected by the relationship between refined product prices and
the prices for crude oil and other feedstocks. The cost to ac-
quire crude oil and other feedstocks and the price of refined
petroleum products ultimately sold depend on numerous fac-
tors beyond our control, including the supply of, and demand
for, crude oil, gasoline, diesel and other refined petroleum prod-
ucts, which, in turn, depend on, among other factors, changes
in global and regional economies, weather conditions, global
and regional political affairs, production levels, the availability of
imports, the marketing of competitive fuels, pipeline capacity,
prevailing exchange rates and the extent of government regu-
lation. Our revenue and operating income fluctuate significant-
ly with movements in industry refined petroleum product pric-
es; our materials cost fluctuate significantly with movements in

Petroplus Holdings AG | Operating and Financial Review | 25
crude oil prices; and our other operating expenses fluctuate
with movements in the price of energy to meet the power needs
of our refineries. In addition, the effect of changes in crude oil
prices on our operating results is influenced by how the prices
of refined products adjust to reflect such changes.
Crude oil and other feedstock costs and the prices of refined
petroleum products have historically been subject to wide
fluctuation. Expansion and upgrading of existing facilities and
installation of additional refinery distillation or conversion
capacity, price volatility, international political and economic
developments and other factors beyond our control are likely
to continue to play an important role in refining industry eco-
nomics. These factors can impact, among other things, the
level of inventories in the market, resulting in price volatility
and a reduction or increase in product margins. Moreover, the
industry typically experiences seasonal fluctuations in demand
for refined petroleum products, such as for gasoline and die-
sel, during the summer driving season and for home heating
oil during the winter.
Benchmark Refining MarginsIn assessing our operating performance, we compare the re-
fining margins (revenue less materials cost) of each of our re-
fineries against a specific benchmark industry refining margin
based on a crack spread. Benchmark refining margins take
into account both crude and refined petroleum product pric-
es. When these prices are combined in a formula they provide
a single value – a gross margin per barrel – that, when multi-
plied by a throughput number, provides an approximation of
the gross margin generated by refining activities.
As the performance of our refineries does not closely follow
any of the currently published industry benchmark refining
margins, we have created benchmark refinery margins, based
upon publicly available pricing information, for each of our
refineries that more closely reflects each of our refinery’s ac-
tual performance. The benchmark refining margins for the
seven refineries we operated during the year 2008 are set forth
in the following table:
North Sea Refining System
Coryton Refinery 5/2/2/1 five Dated Brent/two gasoline/
two ULSD/one 3.5% fuel oil
BRC Refinery 6/1/2/2/1 six Dated Brent/one gasoline/
two gasoil/two VGO/
one 3.5% fuel oil
Teesside Refinery 5/1/2/2 five Dated Brent/one naphtha/
two ULSD/two straight-run
fuel oil
Inland Refining System
Petit Couronne and Reich-
stett refineries 4/1/2/1
four Dated Brent/one gasoline/
two ULSD/one 3.5% fuel oil
Ingolstadt Refinery
10/1/3/5/1
ten Dated Brent/one naphtha/
three gasoline/five ULSD/one
3.5% fuel oil
Cressier Refinery 7/2/4/1 seven Dated Brent/two gasoline/
four gasoil/one 1% fuel oil
Each of the benchmark refining margins for our refineries as
shown on page 31 are expressed in USD per barrel and serve
as proxies for the per barrel margin that a Dated Brent crude
oil refinery situated in northwest Europe would earn assum-
ing it sold the benchmark production for the relevant refinery
margin.
While the benchmark refinery margins presented in the table
above are representative of the results of our refineries, each
refinery’s realized gross margin on a per barrel basis will dif-
fer from the benchmark due to a variety of factors affecting
the performance of the relevant refinery to its corresponding
benchmark. These factors include the refinery’s actual type of
crude oil throughput, product yield differentials and any other
factors not reflected in the benchmark refining margins, such as
transportation costs, storage costs, credit fees, fuel consumed
during production and any product premiums or discounts, as
well as inventory fluctuations, timing of crude oil and other feed-
stock purchases, a rising or declining crude and product pric-
ing environment and commodity price management activities.

26 | Petroplus Holdings AG | Operating and Financial Review
The following table sets forth historical benchmark crude and
refined petroleum product pricing information used in calculat-
ing each of our refineries’ refining margins:
Commodity Price ManagementThe nature of our business requires us to maintain a substan-
tial investment in petroleum inventories. Since petroleum feed-
stocks and products are global commodities, we have no con-
trol over the changing market value of these inventories. To
supply our refineries with crude oil on a timely basis, we enter
into purchase contracts that fix the price of crude oil from one
to several weeks in advance of receiving and processing that
crude oil. In addition, it is common as part of our marketing ac-
tivities to enter into fixed price contracts for sales of our refined
petroleum products in advance of producing and delivering the
products. Prior to delivery of the crude oil and sale of the relat-
ed refined petroleum products, the market value of the crude
oil and products may change as prices rise and fall related to
the fixed purchase and sale commitments.
On average, since the March 31 acquisition of our French re-
fineries, we have held approximately 25 million barrels of crude
and product inventory on hand. The 25 million barrels repre-
sents the level of inventory we will hold on average in order to
maintain our daily refinery operations and sales requirements.
This level fluctuates on a daily basis, depending on timing of
crude purchases and product sales, operations and optimiza-
tion of crude and product pricing. We are exposed to the fluc-
tuation in crude and product pricing on the inventory we hold.
Currently, we primarily use a commodity price management
program to manage the fluctuation associated with commodity
pricing on inventory levels above a defined amount. Under this
program we enter into commodity Intercontinental Exchange
(“ICE”) futures contracts and counterparty swaps to lock in the
price of certain commodities.
Most derivative transactions are not designated as effective
hedges, any gains or losses arising from changes in the fair
value of these instruments are recorded in our Income State-
ment under the line item materials cost. Our derivative con-
tracts are classified as derivative instruments and are recorded
on our balance sheet at fair market value. The Company cur-
rently does not enter into derivative financial instruments for
speculative transactions and does not hedge the refining mar-
gin. This strategy is continually reviewed and adapted for cur-
rent economic and market conditions.
As noted above, our refineries’ results will differ from the ref-
erence benchmarks due to our hedging or commodity price
management activities.
Foreign Currency Fluctuation ManagementAs of January 1, 2008, we are a USD functional currency Com-
pany. Upon translation to the USD, our foreign currency expo-
sure was reduced in that the majority of our financing activities
and costs of sales are incurred in USD. We are still exposed to
the fluctuation in the USD versus the Swiss Franc (“CHF”), Euro
(“EUR”) and the British Pound (“GBP”) as our local marketing
sales, while driven by the USD, are invoiced in local currencies,
and a portion of our local capital expenditures, operating and
personnel costs are incurred in local currencies. We are also
exposed to foreign currency risk because certain of our assets
and liabilities are denominated in currencies other than USD.
To manage both our balance sheet and local marketing sales
transaction risk associated with our foreign currency exposure,
we enter into both swaps and forward derivative contracts.
As we have not currently designated our derivative financial
instruments as effective hedges, any gains or losses arriving
from changes in the fair value of these instruments are recorded
in our Income Statement. Additionally, the Company is exposed
to foreign currency movements on non-USD operating and
personnel costs, we currently do not hedge these costs.
Reference Benchmark Crude and Product Prices 1)
December 31,
(in USD per barrel) 2008 2007
Crude Oil
Dated Brent 97.69 72.71
Products Differential to Dated Brent 1)
Naphtha (8.13) 3.19
95 RON gasoline 2.24 10.91
ULSD 29.81 17.59
Gasoil 2) 24.93 12.65
VGO (3.21) (2.20)
Straight Run Fuel Oil (9.47) (8.40)
1% Fuel Oil (15.17) (18.85)
3.5% Fuel Oil (24.81) (19.01)
Source: Bloomberg1) Average of daily prices for trading days during the relevant period.2) Based on the quoted price for heating oil.

Petroplus Holdings AG | Operating and Financial Review | 27
Other FactorsOur operating cost structure is also important to our profitabil-
ity. Major operating costs include costs relating to employees
and contract labor, energy, maintenance and environmental
compliance. The predominant variable cost is energy, in partic-
ular, the price of electricity, natural gas and chemicals. Operat-
ing costs will vary with movements in foreign currency.
Our operating results are also affected by safety, reliability and
the environmental performance of our refinery operations. Un-
planned downtime of our refinery assets generally results in
lost margin opportunity and increased maintenance expense.
The financial impact of planned downtime, such as major turn-
around maintenance, is managed through a planning process
that considers such things as the margin environment, the
availability of resources to perform the needed maintenance
and feedstock logistics.
The following section includes refinery specific information re-
lated to crude differentials, ancillary costs, and local premiums
and discounts. For actual charge and yields including fuel con-
sumed by refinery see the “Results of operations” section.
North Sea Refining System
Coryton Refinery
The benchmark refining margin for the Coryton Refinery is cal-
culated by assuming that five barrels of the benchmark Dated
Brent crude oil are converted into two barrels of 95 research
octane number (“RON”) gasoline, two barrels of ULSD and one
barrel of 3.5% fuel oil. We calculate this refining margin using
the market value of 95 RON gasoline, ULSD and 3.5% fuel oil,
in each case on an F.O.B. basis, against the market value of
Dated Brent crude oil and refer to the benchmark as the 5/2/2/1
benchmark refining margin.
The Coryton Refinery’s realized gross margin on a per barrel
basis has historically differed from the 5/2/2/1 benchmark re-
fining margin due to the following factors:
The Coryton Refinery processes primarily sweet crude oil –
from the North Sea region, which has historically constituted
approximately 65% of total throughput, and heavy sour crude
oils, which have historically constituted approximately 5% of
total throughput. The remaining throughput consists of other
feed and blendstocks, typically straight-run fuel oil. These
other throughputs have historically priced at a discount to
Dated Brent.
Ancillary crude costs, primarily transportation costs, have –
historically averaged approximately USD 1.35 per barrel of
throughput.
BRC Refinery
The benchmark refining margin for the BRC Refinery is calcu-
lated by assuming that six barrels of benchmark Dated Brent
crude oil are converted into one barrel of 95 RON gasoline, two
barrels of gasoil, two barrels of VGO and one barrel of 3.5% fuel
oil. We calculate this benchmark refining margin using the mar-
ket value of VGO on a C.I.F. basis and 95 RON gasoline, heat-
ing oil (as a proxy for gasoil) and 3.5% fuel oil, in each case on
a F.O.B. basis, against the market value of Dated Brent crude
oil and refer to this benchmark as the 6/1/2/2/1 benchmark re-
fining margin.
The BRC Refinery’s realized gross margin on a per barrel basis
has historically differed from the 6/1/2/2/1 benchmark refining
margin due to the following factors:
The BRC Refinery has processed primarily Urals crude oil, –
which has historically constituted approximately 60% of to-
tal throughput, and heavy sour crude oils, which have his-
torically constituted approximately 20% of total throughput.
These feedstocks historically have priced at a discount to
Dated Brent. The remaining throughput consists of a mixture
of other crude oils and feedstocks.
Ancillary crude costs, primarily transportation costs, have –
historically averaged approximately USD 0.35 per barrel of
throughput.
The BRC Refinery also achieves a slight location premium for –
its products, primarily due to the low cost of transportation
for the products it distributes in the ARA region.
Teesside Refinery
The benchmark refining margin for the Teesside Refinery is
calculated by assuming that five barrels of benchmark Dated
Brent crude oil are converted into one barrel of naphtha, two
barrels of ULSD and two barrels of straight-run fuel oil. We cal-
culate this refining margin using the market value of naphtha
on a C.I.F. basis, ULSD on an F.O.B. basis and straight-run fuel
oil on an F.O.B. basis against the market value of Dated Brent
crude oil and refer to this benchmark as the 5/1/2/2 bench-
mark refining margin.
The Teesside Refinery’s realized gross margin on a per barrel
basis has historically differed from the 5/1/2/2 benchmark re-
fining margin due to the following factors:
The Teesside Refinery has historically processed a slate of –
almost entirely Ekofisk crude oil, which has historically priced
higher than the Dated Brent crude oil used in calculating the
5/1/2/2 benchmark refining margin.
The Teesside Refinery is connected by a two-kilometer-long –
pipeline to the end terminal of the Ekofisk pipeline. This en-

28 | Petroplus Holdings AG | Operating and Financial Review
ables the refinery to achieve a transportation discount as
a result of lower crude transportation costs relative to the
5/1/2/2 benchmark refining margin. Ancillary crude costs,
have historically averaged approximately USD 0.05 per bar-
rel of throughput.
The Teesside Refinery generates a pricing benefit on some of –
its products, primarily its straight-run fuel oil.
Inland Refining System
Petit Couronne Refinery
The benchmark refining margin for the Petit Couronne Refinery
is calculated by assuming that four barrels of benchmark Dated
Brent crude oil are converted into one barrel of 95 RON Gas-
oline, two barrels of ULSD and one barrel of 3.5% fuel oil. We
calculate this refining margin using the market value of 95 RON
gasoline, ULSD and 3.5% fuel oil, in each case on an F.O.B. ba-
sis, against the market value of Dated Brent crude oil and refer
to the benchmark as the 4/1/2/1 benchmark refining margin.
The Petit Couronne Refinery’s realized gross margin on a per
barrel basis differs from the 4/1/2/1 benchmark refining margin
due to the following factors:
The Petit Couronne Refinery processed approximately 60% –
medium sour crude like Urals, which prices at a discount to
Dated Brent, and sweet crude oil, which has constituted ap-
proximately 30% of total throughput.
Ancillary crude costs, primarily transportation costs, have –
averaged approximately USD 1.35 per barrel of throughput.
Ingolstadt Refinery
The benchmark refining margin for the Ingolstadt Refinery is
calculated by assuming that ten barrels of the benchmark Dat-
ed Brent crude oil are converted into one barrel of naphtha,
three barrels of 95 RON gasoline, five barrels of ULSD and one
barrel of 3.5% fuel oil. We calculate this refining margin using
the market value of naphtha on a C.I.F. basis and 95 RON gas-
oline, ULSD and 3.5% fuel oil, in each case on an F.O.B. basis,
against the market value of Dated Brent crude oil and refer to
the benchmark as the 10/1/3/5/1 benchmark refining margin.
The Ingolstadt Refinery’s realized gross margin on a per barrel
basis has historically differed from the 10/1/3/5/1 benchmark
refining margin due to the following factors:
The Ingolstadt Refinery has historically run a mixture of crude –
oils in its throughput slate, including CPC and Azeri Light,
which tend to price at a premium to Dated Brent. The re-
finery also processes a heavy blend to produce Bitumen.
In addition, the refinery blends bio components typically in
gasoline and diesel, which have fluctuated in parallel with
gasoline and diesel pricing, which historically have increased
the overall crude differential premium to Dated Brent.
Given its inland location, the Ingolstadt Refinery incurs higher –
crude transportation costs, which also results in a differential
to the 10/1/3/5/1 benchmark refining margin. Ancillary crude
costs, primarily transportation costs, have historically aver-
aged USD 1.40 per barrel of throughput.
The Ingolstadt Refinery is located in an inland market, en- –
abling the refinery to achieve a regional premium for its re-
fined products compared to the cost of importing products
from outside the region.
Reichstett Refinery
The benchmark refining margin for the Reichstett Refinery is
calculated by assuming that four barrels of benchmark Dated
Brent crude oil are converted into one barrel of 95 RON Gas-
oline, two barrels of ULSD and one barrel of 3.5% fuel oil. We
calculate this refining margin using the market value of 95 RON
gasoline, ULSD and 3.5% fuel oil, in each case on an F.O.B. ba-
sis, against the market value of Dated Brent crude oil and refer
to the benchmark as the 4/1/2/1 benchmark refining margin.
The Reichstett Refinery’s realized gross margin on a per barrel
basis has differs from the 4/1/2/1 benchmark refining margin
due to the following factors:
The Reichstett Refinery processed a mixture of 60% sweet –
crude oils, such as Mellitah, which tend to price higher than
the benchmark Dated Brent crude and 35% light or medium
sour crude oils, such as Urals which price at a discount to
Dated Brent.
Given its inland location, the Reichstett Refinery incurs higher –
crude transportation costs, which also results in a differen-
tial to the benchmark refining margin. Ancillary crude costs,
primarily transportation costs, averaged approximately USD
1.70 per barrel of throughput.
The Reichstett Refinery is located in an inland market, en- –
abling the refinery to achieve a regional premium for its re-
fined products compared to the cost of importing products
from outside the region.
Cressier Refinery
The benchmark refinery margin for the Cressier Refinery is cal-
culated by assuming that seven barrels of Dated Brent crude oil
are converted into two barrels of 95 RON gasoline, four barrels
of gasoil and one barrel of 1% fuel oil. We calculate this refin-
ery margin using the market value of 95 RON gasoline, heat-
ing oil (as a proxy for gasoil) and 1% fuel oil, in each case on
an F.O.B. basis, against the market value of Dated Brent crude
oil and refer to this benchmark as the 7/2/4/1 benchmark re-
fining margin.

Petroplus Holdings AG | Operating and Financial Review | 29
The Cressier Refinery’s realized gross margin on a per barrel
basis has historically differed from the 7/2/4/1 benchmark re-
fining margin due to the following factors:
The Cressier Refinery has historically run a mixture of crude –
oils, including CPC and Mellitah. In the aggregate, these
crude oils tend to price higher than the benchmark Dated
Brent crude oil.
Given its inland location, the Cressier Refinery incurs higher –
crude transportation costs, which also results in a differen-
tial to the benchmark refining margin. Ancillary crude costs,
primarily transportation costs, have historically averaged ap-
proximately USD 2.10 per barrel of throughput.
The Cressier Refinery is located in an inland market, enabling –
the refinery to achieve a regional premium for its refined
products compared to the cost of importing products from
outside the region. The principal driver of this regional pre-
mium is the freight costs on the Rhine River from Rotterdam
into Switzerland.
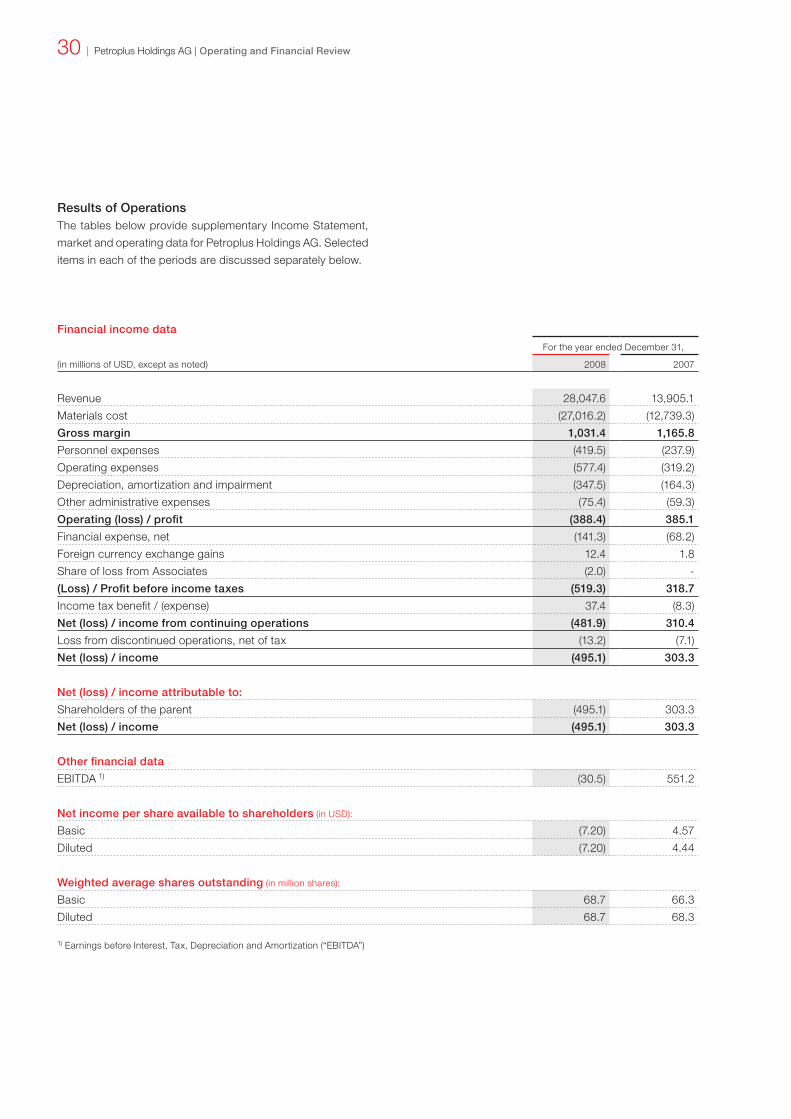
30 | Petroplus Holdings AG | Operating and Financial Review
Results of OperationsThe tables below provide supplementary Income Statement,
market and operating data for Petroplus Holdings AG. Selected
items in each of the periods are discussed separately below.
Financial income data
For the year ended December 31,
(in millions of USD, except as noted) 2008 2007
Revenue 28,047.6 13,905.1
Materials cost (27,016.2) (12,739.3)
Gross margin 1,031.4 1,165.8
Personnel expenses (419.5) (237.9)
Operating expenses (577.4) (319.2)
Depreciation, amortization and impairment (347.5) (164.3)
Other administrative expenses (75.4) (59.3)
Operating (loss) / profit (388.4) 385.1
Financial expense, net (141.3) (68.2)
Foreign currency exchange gains 12.4 1.8
Share of loss from Associates (2.0) -
(Loss) / Profit before income taxes (519.3) 318.7
Income tax benefit / (expense) 37.4 (8.3)
Net (loss) / income from continuing operations (481.9) 310.4
Loss from discontinued operations, net of tax (13.2) (7.1)
Net (loss) / income (495.1) 303.3
Net (loss) / income attributable to:
Shareholders of the parent (495.1) 303.3
Net (loss) / income (495.1) 303.3
Other financial data
EBITDA 1) (30.5) 551.2
Net income per share available to shareholders (in USD):
Basic (7.20) 4.57
Diluted (7.20) 4.44
Weighted average shares outstanding (in million shares):
Basic 68.7 66.3
Diluted 68.7 68.3
1) Earnings before Interest, Tax, Depreciation and Amortization (“EBITDA”)

Petroplus Holdings AG | Operating and Financial Review | 31
Market indicators
For the year ended December 31,
(in USD per barrel) 2008 2007
Dated Brent 97.69 72.71
Benchmark refining margins
North Sea Refining System 3)
5/2/2/1 Coryton 4) 7.86 7.26
6/1/2/2/1 BRC 3.48 2.13
5/1/2/2 Teesside 6.51 4.31
Inland Refining System 3)
4/1/2/1 Petit Couronne 4) 10.36 **
10/1/3/5/1 Ingolstadt 4) 12.28 11.00
4/1/2/1 Reichstett 4) 10.36 **
7/2/4/1 Cressier 12.72 7.65
For the year ended December 31,
(in thousands of bpd, except as noted) 2008 2007
Selected Volumetric and Per Barrel Data 1)
Total crude throughput:
North Sea Refining System 3)
Coryton 4) 130.8 66.7
BRC 71.6 63.0
Teesside 73.1 91.0
Inland Refining System 3)
Petit Couronne 4) 86.1 **
Ingolstadt 4) 99.2 63.5
Reichstett 4) 48.1 **
Cressier 51.5 52.8
Total crude throughput 560.4 337.0
Total other throughput:
North Sea Refining System 3)
Coryton 4) 42.8 30.1
BRC 20.6 14.5
Teesside 0.5 0.1
Inland Refining System 3)
Petit Couronne 4) 6.5 **
Ingolstadt 4) 5.7 1.7
Reichstett 4) 3.7 **
Cressier 2.8 1.4
Total other throughput 82.6 47.8
Total throughput 643.0 384.8
Total throughput (millions of barrels) 235.3 140.5
Gross margin (USD per barrel of total throughput) 1) 2)
North Sea Refining System 3) 4) 3.35 7.50
Inland Refining System 3) 4) 4.88 7.52
Operating expenses (USD per barrel of total throughput) 1) 2)
North Sea Refining System 3) 4) 3.58 3.04
Inland Refining System 3) 4) 3.30 3.05

32 | Petroplus Holdings AG | Operating and Financial Review
For the year ended December 31, 2008
North Sea Refining System Inland Refining System
(in thousands of bpd, except as noted) Coryton 4) BRC Teesside Petit Couronne 4) Ingolstadt 4) Reichstett 4) Cressier Total
Throughput
Crude Unit Throughput
Light sweet 121.5 70% 10.5 11% 73.1 99% 29.4 32% 16.7 16% 29.4 57% 32.7 60% 313.3 49%
Medium sweet - - - - - - - - 16.3 16% 1.0 2% 1.2 2% 18.5 3%
Heavy sweet - - 1.5 2% - - - - - - - - - - 1.5 0%
Light sour 7.2 4% 3.1 3% - - - - 59.9 57% 2.0 4% 16.5 31% 88.7 14%
Medium sour 1.9 1% 35.7 39% - - 56.7 61% 0.6 1% 14.4 28% 1.1 2% 110.4 17%
Heavy sour 0.2 0% 20.8 23% - - - - 5.7 5% 1.3 2% - - 28.0 4%
Total Crude Unit Throughput 130.8 75% 71.6 78% 73.1 99% 86.1 93% 99.2 95% 48.1 93% 51.5 95% 560.4 87%
Other Throughput 42.8 25% 20.6 22% 0.5 1% 6.5 7% 5.7 5% 3.7 7% 2.8 5% 82.6 13%
Total Throughput 173.6 100% 92.2 100% 73.6 100% 92.6 100% 104.9 100% 51.8 100% 54.3 100% 643.0 100%
Production
Light Products
Gasoline 68.2 39% 11.1 12% - - 15.9 17% 31.1 30% 12.1 23% 14.0 26% 152.4 24%
Diesels and gasoils 52.4 30% 57.6 63% 25.1 34% 31.4 34% 47.8 45% 24.9 48% 22.4 41% 261.6 40%
Jet fuel 18.0 11% - - 3.7 5% 9.7 11% 2.8 3% 0.3 1% 4.1 8% 38.6 6%
Petrochemicals 2.8 2% - - - - 6.2 7% 1.9 2% - - 0.6 1% 11.5 2%
Naphtha - - - - 18.6 25% 5.0 5% 6.3 6% 4.7 9% 0.3 1% 34.9 5%
LPG 2.2 1% 5.7 6% - - 6.8 7% 9.7 9% 3.4 7% 3.5 6% 31.3 5%
Total Light Products 143.6 83% 74.4 81% 47.4 64% 75.0 81% 99.6 95% 45.4 88% 44.9 83% 530.3 82%
Low sulfur straight run - - - - 25.0 34% - - - - - - - - 25.0 4%
Fuel oil 25.0 14% 16.0 17% - - 13.7 15% 4.7 4% 5.5 10% 7.2 13% 72.1 12%
Solid by-products / fuel consumed in process / fuel loss 5) 8.6 5% 3.2 4% 1.1 2% 5.1 5% 5.1 5% 1.5 3% 2.1 4% 26.7 4%
Total Production 177.2 102% 93.6 102% 73.5 100% 93.8 101% 109.4 104% 52.4 101% 54.2 100% 654.1 102%
Footnotes for the tables on pages 31-35 ** Not relevant.1) The Company manages its refinery business, including feedstock acquisition and product marketing, on an integrated basis; however, for analytical
purposes the business results shown here have been allocated to our two refinery systems. As a result, the refining systems realized gross margins presented here do not reflect the results that would be reported if separately accounted for in accordance with International Financial Reporting Stan-dards (“IFRS”). The Company believes that this information by refinery system is helpful in understanding our overall operating results.
2) Excludes refining margin hedging activities that are not expected to occur in the future.3) The North Sea Refining System consists of the Coryton Refinery, the BRC Refinery and the Teesside Refinery. The Inland Refining System consists of
the Petit Couronne Refinery, the Ingolstadt Refinery, the Reichstett Refinery and the Cressier Refinery. The Antwerp Processing Facility is excluded from gross margin and operating expense per barrel analysis.
4) We acquired the Ingolstadt Refinery on March 31, 2007, the Coryton Refinery on May 31, 2007 and the Petit Couronne and Reichstett refineries on March 31, 2008. The Information reflects the applicable periods subsequent to each acquisition.
5) The fuel consumed in process is a percentage of the total crude, feedstock, and gasoline and diesel blending additives used by each refinery.

Petroplus Holdings AG | Operating and Financial Review | 33
For the year ended December 31, 2008
North Sea Refining System Inland Refining System
(in thousands of bpd, except as noted) Coryton 4) BRC Teesside Petit Couronne 4) Ingolstadt 4) Reichstett 4) Cressier Total
Throughput
Crude Unit Throughput
Light sweet 121.5 70% 10.5 11% 73.1 99% 29.4 32% 16.7 16% 29.4 57% 32.7 60% 313.3 49%
Medium sweet - - - - - - - - 16.3 16% 1.0 2% 1.2 2% 18.5 3%
Heavy sweet - - 1.5 2% - - - - - - - - - - 1.5 0%
Light sour 7.2 4% 3.1 3% - - - - 59.9 57% 2.0 4% 16.5 31% 88.7 14%
Medium sour 1.9 1% 35.7 39% - - 56.7 61% 0.6 1% 14.4 28% 1.1 2% 110.4 17%
Heavy sour 0.2 0% 20.8 23% - - - - 5.7 5% 1.3 2% - - 28.0 4%
Total Crude Unit Throughput 130.8 75% 71.6 78% 73.1 99% 86.1 93% 99.2 95% 48.1 93% 51.5 95% 560.4 87%
Other Throughput 42.8 25% 20.6 22% 0.5 1% 6.5 7% 5.7 5% 3.7 7% 2.8 5% 82.6 13%
Total Throughput 173.6 100% 92.2 100% 73.6 100% 92.6 100% 104.9 100% 51.8 100% 54.3 100% 643.0 100%
Production
Light Products
Gasoline 68.2 39% 11.1 12% - - 15.9 17% 31.1 30% 12.1 23% 14.0 26% 152.4 24%
Diesels and gasoils 52.4 30% 57.6 63% 25.1 34% 31.4 34% 47.8 45% 24.9 48% 22.4 41% 261.6 40%
Jet fuel 18.0 11% - - 3.7 5% 9.7 11% 2.8 3% 0.3 1% 4.1 8% 38.6 6%
Petrochemicals 2.8 2% - - - - 6.2 7% 1.9 2% - - 0.6 1% 11.5 2%
Naphtha - - - - 18.6 25% 5.0 5% 6.3 6% 4.7 9% 0.3 1% 34.9 5%
LPG 2.2 1% 5.7 6% - - 6.8 7% 9.7 9% 3.4 7% 3.5 6% 31.3 5%
Total Light Products 143.6 83% 74.4 81% 47.4 64% 75.0 81% 99.6 95% 45.4 88% 44.9 83% 530.3 82%
Low sulfur straight run - - - - 25.0 34% - - - - - - - - 25.0 4%
Fuel oil 25.0 14% 16.0 17% - - 13.7 15% 4.7 4% 5.5 10% 7.2 13% 72.1 12%
Solid by-products / fuel consumed in process / fuel loss 5) 8.6 5% 3.2 4% 1.1 2% 5.1 5% 5.1 5% 1.5 3% 2.1 4% 26.7 4%
Total Production 177.2 102% 93.6 102% 73.5 100% 93.8 101% 109.4 104% 52.4 101% 54.2 100% 654.1 102%

34 | Petroplus Holdings AG | Operating and Financial Review
For the year ended December 31, 2007
North Sea Refining System Inland Refining System
(in thousands of bpd, except as noted) Coryton 4) BRC Teesside Ingolstadt 4) Cressier Total
Throughput
Crude Unit Throughput
Light sweet 63.0 65% 3.1 4% 91.0 100% 1.7 3% 29.1 53% 187.9 49%
Medium sweet - - - - - - 14.1 21% 3.9 7% 18.0 5%
Light sour - - - - - - 40.7 62% 16.1 30% 56.8 15%
Medium sour 3.2 3% 45.5 59% - - 1.7 3% 3.7 7% 54.1 14%
Heavy sour 0.5 1% 14.4 18% - - 5.3 8% - - 20.2 5%
Total Crude Unit Throughput 66.7 69% 63.0 81% 91.0 100% 63.5 97% 52.8 97% 337.0 88%
Other Throughput 30.1 31% 14.5 19% 0.1 0% 1.7 3% 1.4 3% 47.8 12%
Total Throughput 96.8 100% 77.5 100% 91.1 100% 65.2 100% 54.2 100% 384.8 100%
Production
Light Products
Gasoline 40.7 42% 8.0 10% - - 18.2 28% 13.6 25% 80.5 21%
Diesels and gasoils 27.5 28% 49.1 64% 30.7 33% 28.1 43% 23.8 44% 159.2 42%
Jet fuel 9.3 10% - - 4.2 5% 2.2 3% 3.9 7% 19.6 5%
Petrochemicals 1.8 2% - - - - 1.2 2% 0.7 1% 3.7 1%
Naphtha - - 0.3 0% 23.5 26% 4.7 7% - - 28.5 7%
LPG 1.3 1% 4.6 6% - - 6.5 10% 3.0 6% 15.4 4%
Total Light Products 80.6 83% 62.0 80% 58.4 64% 60.9 93% 45.0 83% 306.9 80%
Low sulfur straight run - - - - 31.7 35% - - - - 31.7 8%
Fuel oil 14.4 15% 12.8 16% - - 3.7 6% 7.5 14% 38.4 10%
Solid by-products / fuel consumed in process / fuel loss 5) 4.3 5% 2.9 4% 1.2 1% 3.3 5% 2.3 4% 14.0 4%
Total Production 99.3 103% 77.7 100% 91.3 100% 67.9 104% 54.8 101% 391.0 102%

Petroplus Holdings AG | Operating and Financial Review | 35
For the year ended December 31, 2007
North Sea Refining System Inland Refining System
(in thousands of bpd, except as noted) Coryton 4) BRC Teesside Ingolstadt 4) Cressier Total
Throughput
Crude Unit Throughput
Light sweet 63.0 65% 3.1 4% 91.0 100% 1.7 3% 29.1 53% 187.9 49%
Medium sweet - - - - - - 14.1 21% 3.9 7% 18.0 5%
Light sour - - - - - - 40.7 62% 16.1 30% 56.8 15%
Medium sour 3.2 3% 45.5 59% - - 1.7 3% 3.7 7% 54.1 14%
Heavy sour 0.5 1% 14.4 18% - - 5.3 8% - - 20.2 5%
Total Crude Unit Throughput 66.7 69% 63.0 81% 91.0 100% 63.5 97% 52.8 97% 337.0 88%
Other Throughput 30.1 31% 14.5 19% 0.1 0% 1.7 3% 1.4 3% 47.8 12%
Total Throughput 96.8 100% 77.5 100% 91.1 100% 65.2 100% 54.2 100% 384.8 100%
Production
Light Products
Gasoline 40.7 42% 8.0 10% - - 18.2 28% 13.6 25% 80.5 21%
Diesels and gasoils 27.5 28% 49.1 64% 30.7 33% 28.1 43% 23.8 44% 159.2 42%
Jet fuel 9.3 10% - - 4.2 5% 2.2 3% 3.9 7% 19.6 5%
Petrochemicals 1.8 2% - - - - 1.2 2% 0.7 1% 3.7 1%
Naphtha - - 0.3 0% 23.5 26% 4.7 7% - - 28.5 7%
LPG 1.3 1% 4.6 6% - - 6.5 10% 3.0 6% 15.4 4%
Total Light Products 80.6 83% 62.0 80% 58.4 64% 60.9 93% 45.0 83% 306.9 80%
Low sulfur straight run - - - - 31.7 35% - - - - 31.7 8%
Fuel oil 14.4 15% 12.8 16% - - 3.7 6% 7.5 14% 38.4 10%
Solid by-products / fuel consumed in process / fuel loss 5) 4.3 5% 2.9 4% 1.2 1% 3.3 5% 2.3 4% 14.0 4%
Total Production 99.3 103% 77.7 100% 91.3 100% 67.9 104% 54.8 101% 391.0 102%

36 | Petroplus Holdings AG | Operating and Financial Review
2008 Compared to 2007
Overview
Our operating loss was USD 388.4 million for the year ended
December 31, 2008 as compared to an operating profit of
USD 385.1 million for the same period in 2007. Losses from
continuing operations for the year ended December 31, 2008
was USD 481.9 million as compared to an operating profit of
USD 310.4 million for the same period in 2007. The net loss
attributable to shareholders was USD 495.1 million (USD 7.20
per share) for the year ended December 31, 2008 as com-
pared to net income of USD 303.3 million (USD 4.57 per share)
in the same period in 2007.
The results of operations for the year ended December 31,
2008 include operations of the Petit Couronne and Reichstett
refineries for nine months whereas the results for the prior peri-
od include operations of the Ingolstadt Refinery for nine months
and the Coryton Refinery for seven months. The results from
discontinued operations include a loss of USD 13.2 million
for the year ended December 31, 2008 versus a loss of USD
7.1 million in the same period in 2007.
Revenue
Our revenue increased by USD 14,142.5 million, or 101.7%, to
USD 28,047.6 million for the year ended December 31, 2008
from USD 13,905.1 million for the year ended December 31,
2007. The increase in revenue was attributable to the acqui-
sition of the Petit Couronne and Reichstett refineries in the
first quarter of 2008 and the acquisition of the Ingolstadt and
Coryton refineries in the first and second quarters of 2007,
respectively. Additionally, refined petroleum product prices
were higher during 2008 in comparison to the same period
in 2007.
Gross Margin
Our gross margin decreased by USD 134.4 million, or 11.5%,
to USD 1,031.4 million for the year ended December 31, 2008
from USD 1,165.8 million for the year ended December 31,
2007. The decreased gross margin for the year ended Decem-
ber 31, 2008 was principally driven by a steep decline in crude
oil pricing and the associated effect on inventory value, in the
second half of 2008. The decline was offset by higher refin-
ing margin cracks in 2008 versus 2007 and increased gross
margin realized from the acquisition of the French refineries on
March 31, 2008 and the Ingolstadt and Coryton refineries on
March 31, 2007 and May 31, 2007, respectively.
Our 5/2/2/1/ benchmark refining margin for Coryton Refinery
averaged USD 7.86 per barrel for the year ended December
31, 2008 and USD 7.26 per barrel for the seven months ended
December 31, 2007. Our 6/1/2/2/1 benchmark refining margin
for the BRC Refinery increased 63% for the year ended De-
cember 31, 2008 as compared to the same period in 2007.
The increase is primarily due to the strength of the heating oil
crack. Our 5/1/2/2 benchmark refining margin for the Tees-
side Refinery was 51% higher for the year ended December 31,
2008 as compared to the same period in 2007. This increase
was primarily attributable to a higher ULSD premium to Dated
Brent, slightly offset by a decrease in the price of naphtha,
which priced at a discount to Dated Brent in 2008 versus a
premium to Dated Brent in 2007. Our 10/1/3/5/1 benchmark
refining margin for the Ingolstadt Refinery averaged USD 12.28
per barrel for the year ended December 31, 2008 and USD
11.00 per barrel for the nine months ended December 31,
2007. The increase was primarily due to the strength of the
heating oil crack. Our 7/2/4/1 benchmark refining margin for
the Cressier Refinery increased 66% for the year ended De-
cember 31, 2008 as compared to the same period in 2007.
This is primarily due to a higher heating oil premium to Dated
Brent partially offset by a decrease in the gasoline crack. Our
4/1/2/1 benchmark refining margin for the Petit Couronne and
Reichstett refineries averaged USD 10.36 for the nine months
ended December 31, 2008.
Dated Brent having spiked to approximately USD 145 per
barrel in the middle of 2008, ended the third quarter approxi-
mately where the year started at about USD 95 per barrel,
then declined nearly USD 55 per barrel in the fourth quarter to
end the year at approximately USD 40 per barrel. This steep
decline, especially in the fourth quarter, had a negative impact
on our margins due to the lag effect from the time crude is
purchased to when the finished product is sold. During 2007,
crude began the year at approximately USD 55 per barrel and
steadily increased to USD 70 per barrel by the middle of the
year. Toward the end of the second quarter and through the
second half of the year, Dated Brent increased by nearly USD
25 per barrel to close the year near USD 95 per barrel.
Our realized margin at each of our refineries was impacted by
the types of crude oil we processed during 2008 and 2007.
Across our refining system, we processed approximately 12%
Urals crude oil, for which the average discount during 2008 to
Dated Brent was approximately USD 2.94 per barrel, down 5%
from the 2007 discount to Dated Brent of USD 3.09 per barrel.
We process Urals crude oil primarily at the BRC, Reichstett
and Petit Couronne refineries. We processed approximately

Petroplus Holdings AG | Operating and Financial Review | 37
12% CPC crude during 2008, which did not significantly
change as a differential to Dated Brent; however, due in part
to the volatility of Dated Brent, the differential fluctuated on a
quarterly basis by an average of more than 100%. We process
CPC crude predominantly at the Ingolstadt and Cressier refin-
eries. Ekofisk crude oil, which is processed mainly at the Tees-
side Refinery, increased in 2008 as compared with 2007, as a
differential to Dated Brent by USD 0.82 per barrel on average.
Forties crude oil, which made up 8% of our total throughput
in 2008 and is processed primarily at the Coryton and BRC
refineries, averaged approximately USD 0.40 per barrel under
Dated Brent during 2008 versus approximately USD 0.19 per
barrel over Dated Brent in 2007. We also process other feed-
and blendstocks at most of our refineries. At the BRC Refinery,
high sulfur straight run fuel oil made up 17% of total refinery
throughput and priced at a USD 22 per barrel discount to
Dated Brent in 2008 versus a discount of USD 15 per barrel in
2007. At many of our refineries, we blend biofuel components
primarily into biodiesel, which priced in 2008 at an average of
approximately USD 72 per barrel over Dated Brent versus ap-
proximately USD 51 per barrel over Dated Brent in 2007.
There is a lag between the time we purchase crude oil to the
time we process and sell finished refined product. Timing of
purchases depends on a number of factors: the refinery’s
planned throughput, unit disruptions which may cause usage
of lighter and sweeter crude oil and availability of crude oil.
Unplanned downtime has a more significant impact due to the
disruption to the refinery’s normal operating throughput, which
results in a longer time lag between purchases and processing
of crude oil. In addition, during unplanned downtime the timing
of crude purchases is disrupted; this may cause a significant
impact on realized gross margin.
We typically sell our products close to posted market prices;
however in 2008, local market demand and transportation
costs increased the premiums we normally would expect in
any given year, particularly in our Inland Refining System. The
Cressier Refinery earns premiums to market prices, in part
based on the freight rates on the Rhine, which is the means
of transport for Swiss customers purchasing refined product
from the ARA region. In 2008, the Rhine freight average was
approximately CHF 40 per ton as compared to CHF 20 per ton
in 2007. In Germany, many of our refined products are based
on an Oil Market Report (“OMR”) price. The OMR price in 2008
for middle distillates was approximately USD 10.32 per barrel
higher than the market price for the ARA region as compared
to USD 2.75 per barrel in 2007.
Fuel consumed in the production process has a negative im-
pact on our realization to the benchmark refining margin, fluc-
tuating with the absolute crude price. In 2008 and 2007, we
consumed about 10.0 and 5.0 million barrels, respectively, in
the production process. The average price of Dated Brent was
USD 97.69 per barrel in 2008 versus USD 72.71 per barrel in
2007. The increase in both the barrels of fuel consumed and
the absolute price of crude oil over the prior year had a direct
impact on our cost of fuel consumed in production included in
the refining margin in 2008.
We primarily use a commodity price management program to
manage a small portion of the exposure to fluctuations in com-
modity pricing. Under this program we enter into commodity
ICE futures contracts and counterparty swaps to lock in the
price of certain commodities. Any gains or losses arising from
changes in the fair value of these instruments are recorded in
our Income Statement, under the line item “Materials Cost”.
Materials cost included a derivative loss of USD 91.0 million in
2008 and a loss of USD 84.4 million in 2007. Also included in
materials cost for 2007 is a loss of USD 4.0 million related to
refining margin hedging activities discontinued during 2007.
Refinery Operations
North Sea Refining System
Coryton. For the year ended December 31, 2008, the Coryton
Refinery’s total throughput averaged approximately 173,600
bpd. For the seven months ending December 31, 2007, the
total throughput averaged approximately 165,000 bpd. Total
throughput in 2008 was impacted by start-up and inspection
delays in January 2008 associated with the fire in October
2007. Throughput was further impacted in July 2008, as the
refinery experienced a power disruption and all refinery units
were safely shut down. In the fourth quarter of 2008, the refin-
ery maintained reduced throughput due to a trip in the gas tur-
bine generator and coke buildup in the naphtha pretreaters.
BRC. For the year ended December 31, 2008, the BRC Re-
finery’s total throughput averaged approximately 92,200 bpd.
For the same period ending December 31, 2007, the total
throughput averaged approximately 77,500 bpd. Throughput
was impacted in the second and third quarters as a result of
a planned turnaround and unplanned maintenance due to a
fire in the visbreaker unit on June 9, 2008. Once back on-line,
the refinery ran at maximum utilization for the remainder of the
third and fourth quarters. For most of the second quarter and
part of the third quarter of 2007, the refinery was impacted by

38 | Petroplus Holdings AG | Operating and Financial Review
the largest scheduled maintenance shutdown in its history to
undertake improvements in reliability, safety and environmen-
tal areas.
Teesside. For the year ended December 31, 2008, the Teessi-
de Refinery’s total throughput averaged approximately 73,600
bpd. For the same period in 2007, the Teesside Refinery’s total
throughput averaged approximately 91,100 bpd. Throughput
was reduced in the first and fourth quarters of 2008 for eco-
nomic reasons. The second and third quarters were impacted
by a scheduled maintenance turnaround, which started at the
end of the second quarter of 2008 and was completed in July
2008. The throughput in 2007 reflected reduced throughput in
the third quarter for economic reasons.
Inland Refining System
Petit Couronne. The Petit Couronne Refinery was acquired on
March 31, 2008. The Petit Couronne Refinery’s total through-
put for the nine months ended December 31, 2008 averaged
approximately 123,200 bpd. Throughput is in-line with expec-
tations.
Ingolstadt. For the year ended December 31, 2008, the Ingol-
stadt Refinery’s total throughput averaged approximately
104,900 bpd. For the nine months ending December 31, 2007,
the total throughput averaged approximately 86,600 bpd.
Throughput in 2008 was in line with expectations. Total
throughput in 2007 reflects the impact of coke build-up in the
crude furnace, which caused reduced rates during the year
until the planned maintenance shutdown in the fourth quarter
of 2007, which lasted 25 days.
Reichstett. The Reichstett Refinery was acquired on March 31,
2008. The Reichstett Refinery’s total throughput for the nine
months ended December 31, 2008 averaged approximately
68,900 bpd. Throughput was in-line with expectations.
Cressier. For the year ended December 31, 2008, the Cressier
Refinery’s total throughput averaged approximately 54,300
bpd. For the same period in 2007, the Cressier Refinery’s total
throughput averaged approximately 54,200 bpd. Throughput
in 2008 was impacted by planned maintenance in the first two
weeks of December, followed by a strike at Fos-sur-Mer which
delayed the start-up for the remainder of December. Through-
put in 2007 was impacted by a 41-day planned maintenance
shutdown in the second quarter.
Other
Antwerp Processing Facility. Our Antwerp Processing Facility’s
operating loss before depreciation for the year ended Decem-
ber 31, 2008 was USD 39.2 million as compared to a profit of
USD 18.0 million in 2007. Antwerp typically buys heavier gas-
oil to produce heating oil and ULSD through its hydrotreater.
Losses were incurred during the third and fourth quarters of
2008 as a result of the rapid decline in crude oil pricing.
Personnel Expenses
Our personnel expenses increased by USD 181.6 million to
USD 419.5 million for the year ended December 31, 2008 from
USD 237.9 million for the same period in 2007. This increase in
personnel expenses was principally due to the acquisition of
the French refineries on March 31, 2008, the Ingolstadt Refin-
ery on March 31, 2007, the Coryton Refinery on May 31, 2007
and an increase in employees at the corporate office in Zug,
all which in turn resulted in an increase in salaries and related
expenses. As the Company’s functional currency is USD, per-
sonnel costs were further impacted by a decline in the value
of the USD, as personnel costs are paid in the local currencies
EUR, GBP and CHF.
Operating Expenses
Our operating expenses increased by USD 258.2 million to
USD 577.4 million for the year ended December 31, 2008 from
USD 319.2 million for the same period in 2007. The increase
was primarily attributable to the French, Coryton and Ingol-
stadt acquisitions in addition to rising prices for natural gas
and other energy costs. As a significant portion of variable
costs such as chemicals and energy are paid in local cur-
rency, costs were also impacted by the decline in the value
of USD in 2008. These increases were partially offset by the
release of USD 21.5 million in environmental provisions. It was
determined during the first quarter that the cost of remediation
would be lower than originally expected.
Depreciation, Amortization and Impairment
Our depreciation and amortization expenses increased by
USD 183.2 million, to USD 347.5 million for the year ended
December 31, 2008 from USD 164.3 million for the same pe-
riod in 2007. The increase is mainly attributable to the French,
Coryton and Ingolstadt acquisitions; in addition to a USD 87.5
million non-cash impairment charge in the fourth quarter, to
reduce the book value of the Antwerp Processing Facility.

Petroplus Holdings AG | Operating and Financial Review | 39
Other Administrative Expenses
Our other administrative expenses increased by USD 16.1
million to USD 75.4 million for the year ended December 31,
2008 from USD 59.3 million for the same period in 2007. This
increase was principally due to increased insurance and costs
associated with the transition of the French, Coryton and In-
golstadt acquisitions.
Financial Expense, Net
Our net financial expense increased by USD 73.1 million to
USD 141.3 million for the year ended December 31, 2008 from
USD 68.2 million in the same period for 2007. The increase in
net financial expense in 2008 was mainly attributable to the is-
suance of the convertible bond of USD 500.0 million on March
26, 2008 and the interest expense associated with our USD
1.2 billion senior notes, issued on May 1, 2007. The non-cash
expense attributable to the accretion of the convertible bond
and the amortization of capitalized financing costs amounted
to USD 14.6 million for the year ended December 31, 2008.
Foreign Currency Exchange Gains
Our foreign currency exchange results represented a gain of
USD 12.4 million for the year ended December 31, 2008 as
compared to a gain of USD 1.8 million in the same period for
2007. The gain represents the revaluation of certain non-USD
denominated monetary items against the GBP, EUR and CHF.
The gain in 2007 is primarily related to the recognition of equity
translation reserves in accordance with IAS 21 The Effects of
Changes in Foreign Exchange Rates due to the partial liquida-
tion of a foreign entity.
Income Tax Benefit / (Expense)
Our income tax expense decreased by USD 45.7 million for the
year ended December 2008 as compared to the year ended
December 2007. Our effective tax rate was a 7.2% tax benefit
in 2008 and a 2.6% tax provision in 2007, respectively. The tax
benefit was driven by the pre-tax losses incurred in 2008 as-
sociated with the steep decline in crude oil pricing.

40 | Petroplus Holdings AG | Operating and Financial Review
Cash Flows from Operating Activities
Net cash flows provided by operating activities were USD
747.2 million for the year ended December 31, 2008 as com-
pared to USD 484.8 million in the same period for 2007. The
positive cash flow position was primarily driven by decreased
working capital burden as a result of declining crude pricing in
2008. Overall, our inventory value declined by about USD 1.4
billion resulting in a significant reduction in our working capi-
tal burden. Additionally, trade and other receivables declined
by more than USD 300 million. These inflows were offset by
a decline in trade and other payables of approximately USD
900 million in 2008 as compared to 2007. Crude and product
inventory on hand at December 31, 2008 was approximately
12.0 million barrels, each, as compared to 10.4 million and 12.1
million barrels, respectively, at December 31, 2007.
Cash Flows from Investing Activities
Net cash flows used in investing activities were USD 1,119.3
million for the year ended December 31, 2008 as compared
to USD 2,500.4 million in the same period for 2007. On March
31, 2008 the Company completed the acquisition of the Pe-
tit Couronne and Reichstett refineries, which resulted in a net
cash outflow of USD 831.5 million. The remaining cash used in
investing activities resulted primarily from routine turnaround
and capital expenditure activities. Cash used in investing ac-
tivities in 2007 were primarily attributable to the acquisition of
the Ingolstadt and the Coryton refineries, which resulted in a
net cash outflow of USD 688.8 million and USD 1,600.4 mil-
lion, respectively.
Cash Flows from Continuing Financing Activities
Net cash flows provided by financing activities were USD 525.3
million for the year ended December 31, 2008 as compared
to USD 1,930.1 million in the same period for 2007. In March
2008, the Company received net proceeds of USD 491.6 mil-
lion from the issuance of CB. Proceeds were principally used
to fund the acquisition of the French refineries. In July 2008,
the Company made a nominal value repayment to sharehold-
ers amounting to USD 67.4 million. In April 2007, the Company
issued USD 1.2 billion in senior notes and completed a rights
offering which resulted in net proceeds of USD 606.5 million.
Net Cash Flows from Operations
Net cash flows provided by discontinued operations were USD
nil for the year ended December 31, 2008 as compared to
USD 50.4 million for the same period in 2007. The cash flows
from discontinued operations in 2007 were related to the re-
ceipt of proceeds in February 2007, associated with the sale
of Dragon LNG Holdings Ltd., Dragon LNG Ltd. and Milford
Energy Limited.
Liquidity and Capital Resources
Cash FlowsThe following table summarizes the cash flow activity for the periods indicated:
For the year ended December 31,
(in millions of USD) 2008 2007
Cash provided by operating activities 747.2 484.8
Cash (used in) investing activities (1,119.3) (2,500.4)
Cash provided by financing activities 525.3 1,930.1
Net increase / (decrease) in cash and short-term deposits 153.2 (85.5)
Net cash flows from discontinued operations - 50.4
Net foreign exchange differences (5.9) 6.0
Cash and short-term deposits at beginning of period 62.5 91.6
Cash and short-term deposits at end of period 209.8 62.5

Petroplus Holdings AG | Operating and Financial Review | 41
Capital SpendingWe classify our capital expenditures, excluding acquisition ex-
penditures, into five major categories:
Permit-related capital expenditures include capital expendi-
tures for improvements and upgrades to our production facili-
ties required by local authorities as a condition of the granting
or renewal of the operating permits for our facilities. These in-
clude process safety improvements and installation of equip-
ment to reduce emissions to the environment.
Sustaining capital expenditures include regular, non-permit re-
lated capital expenditures we incur to maintain our production
facilities and keep them in good running order.
Turnaround capital expenditures include capital expenditures
incurred in connection with planned shut downs to make nec-
essary repairs, perform preventative maintenance, replace
catalysts and implement capital improvements. Addition-
ally, we incur expenditures that are directly related to capital
improvements to equipment implemented during the turn-
arounds. We perform major scheduled turnarounds on each of
our refineries generally every four years, with an intermediate,
minor turnaround generally two years following each major
scheduled maintenance turnaround.
Project-related capital expenditures include capital expendi-
tures for improvements or upgrades to our production facilities
that have been identified to provide significant gross margin
returns. These projects are expected to either add capacity or
increase product yields in higher value petroleum products.
Information technology capital expenditures include costs as-
sociated with software integration and system upgrades.
Our total capital expenditures, excluding acquisition expendi-
tures, are summarized in the following table by major category
for the year indicated:
Summary of Indebtedness
OverviewThe following table sets forth our financial indebtedness and
cash balances as of the dates indicated:
Information about our 2009 planned capital expenditures is
discussed in “Outlook”.
Below is a summary of our credit facilities and other financ-
ing arrangements, including a description of our plans with
respect to such facilities or arrangements.
Convertible BondOn March 26, 2008, Petroplus Finance Ltd, a subsidiary of the
Company, issued USD 500.0 million in guaranteed, convertible
bonds due in 2013. The proceeds were used to fund a portion
of the acquisition of the French refineries. The CB is guaranteed
by the Company as well as by certain of its subsidiaries. The
specified conversion price of the bonds into common shares
of the Company is CHF 85.18. The bonds are “hybrid instru-
ments”, which requires that an “equity portion” of the CB, and
the financing costs related thereto, must be accounted for in the
equity section of the balance sheet. The equity portion, net of
allocated financing costs, amounted to USD 51.6 million. The
CB is interest-bearing at the rate of 3.375%, with the interest
payable semi-annually in arrears on March 26 and September
26 of each year the bonds are outstanding, commencing on
September 26, 2008. The financing costs related to the issu-
ance of the CB have been capitalized in the aggregate amount
of USD 8.4 million and are amortized over the expected life of
the bond.
Senior NotesOn May 1, 2007, Petroplus Finance Limited, a subsidiary of the
Company, issued USD 600 million, 6.75% senior notes due
2014 and USD 600 million, 7% senior notes due 2017 (together
the “Notes”). The proceeds were used primarily to fund the
acquisition of the Coryton Refinery. The Notes are presented
on the Balance Sheet as non-current interest bearing loans
and borrowings reduced by capitalized financing costs. The
capitalized financing costs of approximately USD 18.1 million
are depreciated over 7 and 10 years.
December 31,
(in millions of USD) 2008 2007
Term Loan Facilities 1,632.8 1,183.4
Working Capital Facilities 249.1 149.7
Total financial debt 1,881.9 1,333.1
Cash and short-term
deposits
209.8 62.5
Net financial debt 1,672.1 1,270.6
December 31,
(in millions of USD) 2008 2007
Permit-related 53.7 41.9
Sustaining 163.2 63.5
Turnaround 75.1 59.7
Projects 9.1 13.3
Information technology 20.4 21.7
Total capital expenditures 321.5 200.1

42 | Petroplus Holdings AG | Operating and Financial Review
The main financial covenant under both the CB and the Notes
is an EBITDA to gross interest coverage ratio, which is required
to exceed 2.0 to 1.0. This covenant is not a maintenance cov-
enant, therefore when the ratio is not met, the Company is
not in breach but only limited in incurring certain debt outside
of the ordinary course of business and in making certain re-
stricted payments.
Working Capital FacilitiesInventory Revolving Credit Facility
Certain of our subsidiaries are party to a USD 1.2 billion com-
mitted multi-currency secured revolving credit facility agree-
ment (the “RCF”) dated December 23, 2005 (as amended on
February 3, 2009). The amended facility includes an option
to increase the facility amount up to USD 2.0 billion on a pre-
approved but uncommitted basis in connection primarily with
increased working capital needs as a result of future acquisi-
tions. Moreover, the Company can obtain additional availability
on an uncommitted basis under this facility. As of December
31, 2008, the Company had additional uncommitted lines un-
der the RCF of USD 2.3 billion, bringing the total size of the
RCF to USD 3.5 billion.
The RCF is available, subject to a working capital borrowing
base, in the form of revolving loan advances, bank overdraft
advances and certain payment instruments, including docu-
mentary letters of credit, standby letters of credit, letters of
indemnity and bank guarantees. For the committed portion
of the facility, cash borrowings may not be more than 60% of
the total amount of the RCF. This restriction does not apply to
the uncommitted portion of the facility. Bank overdrafts are
limited to USD 100 million. In 2008, revolving loans and bank
overdrafts under the RCF generated interest at an aggregate
rate of a margin of 1.0% and cost of funds and any mandatory
costs. This margin could be increased by 25 or 50 basis points
if the ratio of total term borrowings to consolidated tangible
net worth is more than 1 or 1.5, respectively. Commissions
on payment instruments vary depending upon the instrument
type. The borrowings under the RCF are jointly and severally
guaranteed by certain of our subsidiaries and such borrow-
ings are secured by certain assets of the borrowers and of the
guarantors, the form of such security includes certain pledges
of bank accounts, inventory, trade receivables, insurance and
other assets. The RCF terminates on December 21, 2009.
The RCF contains covenants that restrict certain of our activi-
ties, including restrictions on creating or permitting to subsist
certain security, engaging in certain mergers, sales or other
disposal of certain assets, giving certain guarantees, making
certain loans, incurring certain additional indebtedness, en-
gaging in different businesses and amending or waiving cer-
tain material agreements.
The RCF Agreement also contains certain financial covenants,
including covenants requiring us to maintain:
a minimum consolidated tangible net worth of USD 1.0 bil- –
lion; and
a minimum ratio of EBITDA to net interest expense of 2.5 –
to 1.0. On February 3, 2009, we received a waiver for the
EBITDA to net interest expense ratio covenant for the fourth
quarter of 2008 and also amended the covenant definition
to an adjusted EBITDA, which excludes most of the impacts
from oil pricing volatility. The new definition is valid for the
remaining life of the facility.
Compliance with these covenants, including the calculation of
EBITDA, is determined in the manner specified in the docu-
mentation governing the amended RCF.
As of December 31, 2008 the cash borrowings outstanding on
this facility were USD 230.0 million.
Other Working Capital Facilities
Some of our subsidiaries have smaller working capital facilities
available.
LiquidityOur ability to pay interest and principal on our indebtedness
and to satisfy our other debt obligations will depend upon our
future operating performance and the availability of new and
refinancing indebtedness, which can be affected by prevailing
economic conditions and financial, business and other fac-
tors, some of which are beyond our control.
We believe that our cash flows from operations, borrowings
under our existing credit facilities and other capital resources
will be sufficient to satisfy the anticipated cash requirements
associated with our existing operations during the next twelve
months. Our ability to generate sufficient cash from our oper-
ating activities depends on our future performance and global
oil market pricing, which are subject to general economic,
political, financial, competitive and other factors beyond our
control. The Company could, during periods of economic
downturn, access the capital markets and/or other available fi-
nancial resources to strengthen the balance sheet. In addition,
our future capital expenditures and other cash requirements
could be higher than we currently expect as a result of various
factors, including any acquisitions that we may complete.

Petroplus Holdings AG | Operating and Financial Review | 43
Contractual Obligations
The following table summarizes our material contractual obli-
gations and commitments as of December 31, 2008:
Payment due by Period
(in millions of USD) Total < 1 year 1 - 5 years > 5 Years
Loans and borrowings 1,881.9 249.1 448.1 1,184.7
Finance lease obligations 30.3 2.7 9.9 17.7
Operating lease obligations 100.3 17.5 45.2 37.6
Sales obligations 1) 130.0 130.0 - -
Purchase obligations 1) 32.2 32.2 - -
Total 2,174.7 431.5 503.2 1,240.0
1) Represents contractual obligations for future product sales and capital expenditure purchase obligations. These obligations were calculated using information current as of December 31, 2008 and as such the actual commitment amount may vary. Variables such as product price and volume requirements can cause the minimum obligations to change.

44 | Petroplus Holdings AG | Operating and Financial Review
Outlook
The discussion below contains forward-looking statements that
reflect our current judgment regarding conditions we expect to
exist and the course of action we expect to take in the future. Even
though we believe our expectations regarding future events are
based on reasonable assumptions, forward-looking statements
are not guarantees of future performance. Our assumptions rely
on our operational analysis and expectations for the operating
performance of our assets based on their historical operating
performance, management expectations as described below
and historical costs associated with the operations of those as-
sets. Factors beyond our control could cause our actual results
to vary materially from our expectations, which are discussed in
the “Forward-Looking Statement” and elsewhere in this docu-
ment. The prospective financial information below is our current
judgment and should not be relied upon as being necessarily in-
dicative of future results, and the reader is cautioned not to place
undue reliance on this prospective financial information.
MarketWe expect the market outlook for 2009 to be challenging for
the European refining industry due to volatility in crude pricing
and continued economic instability combined with capacity
additions primarily in the Asia Pacific region. While we expect
refining margins to fluctuate, we believe that we are adequately
positioned in the industry to perform and fund our operations
under current and expected market conditions. Dependent
upon the severity and duration of an economic downturn, we
may access the capital markets and/or other financial resourc-
es to strengthen the balance sheet.
Refinery OperationsOverview
As discussed under “Factors Affecting Operating Results”, it is
common practice in our industry to look to benchmark mar-
ket indicators, such as our derived 5/2/2/1 benchmark refining
margin for the Coryton Refinery, 6/1/2/2/1 benchmark refining
margin for the BRC Refinery, 5/1/2/2 benchmark refining margin
for the Teesside Refinery, 7/2/4/1 benchmark refining margin
for the Cressier Refinery, 10/1/3/5/1 benchmark refining margin
for the Ingolstadt Refinery, 4/1/2/1 benchmark refining margin
for the Petit Couronne and Reichstett refineries, as proxies for
refining margins. As indicators of the refinery’s actual refining
margins, each refinery’s benchmark must be adjusted for the
following: the refinery’s actual crude oil slate, which does not
correspond to the 100% Dated Brent crude oil slate we have
used in our derived benchmark refining margins; for variances
from the benchmark product slate to the refinery’s actual, or
anticipated, product slate; and for any other factors not antici-
pated in the benchmark refining margin. These other factors
include crude oil and product grade differentials, a rising or
declining crude and products market pricing environment, tim-
ing of crude oil and feedstock purchases, fuel consumed dur-
ing production, commodity price management, ancillary crude
and product costs, such as transportation costs, storage costs
and credit fees, and inventory fluctuations.
The throughput estimates set forth below assume that our re-
finery operations will experience no operating disruptions or
economic run cuts in 2009 other than scheduled maintenance
shutdowns as described below.
North Sea Refining System
Coryton Refinery
We expect the Coryton Refinery’s total throughput during the
first quarter of 2009 to be approximately 170,000 to 180,000
bpd. We expect the Coryton Refinery’s total throughput during
2009 will be approximately 175,000 to 185,000 bpd; this re-
flects the turnaround planned for the fourth quarter of 2009.
BRC Refinery
We expect the BRC Refinery’s total throughput during the first
quarter of 2009 to be approximately 85,000 to 95,000 bpd.
We expect the BRC Refinery’s total throughput during 2009
will be approximately 95,000 to 105,000 bpd.
Teesside Refinery
We expect the Teesside Refinery’s total throughput during the
first quarter of 2009 to be approximately 40,000 to 50,000
bpd. Teesside full year throughput will be dependent upon the
economic environment.
Inland Refining System
Petit Couronne Refinery
We expect the Petit Couronne Refinery’s total throughput
during the first quarter of 2009 to be approximately 105,000
to 115,000 bpd. We expect the Petit Couronne Refinery’s to-
tal throughput during 2009 will be approximately 120,000 to
130,000 bpd.
Ingolstadt Refinery
We expect the Ingolstadt Refinery’s total throughput during
the first quarter of 2009 to be approximately 75,000 to 85,000
bpd. The reduced throughput reflects the maintenance ac-
tivity planned for the first quarter. We expect the Ingolstadt
Refinery’s total throughput during 2009 will be approximately
95,000 to 105,000 bpd.

Petroplus Holdings AG | Operating and Financial Review | 45
Reichstett Refinery
We expect the Reichstett Refinery’s total throughput during
the first quarter of 2009 to be approximately 60,000 to 65,000
bpd. We expect the Reichstett Refinery’s total throughput dur-
ing 2009 will be approximately 65,000 to 75,000 bpd.
Cressier Refinery
We expect the Cressier Refinery’s total throughput during the
first quarter of 2009 will be approximately 50,000 to 60,000
bpd. We expect the Cressier Refinery’s total throughput during
2009 will be approximately 45,000 to 55,000 bpd; this reflects
the turnaround planned for the fourth quarter of 2009.
Other RevenuesWe engage in other activities that generate revenue, primarily
centered on storage requirements for strategic petroleum re-
serves throughout Europe. We estimate that we will generate
approximately USD 65 million in additional revenue in 2009
from these activities.
Refining and Marketing Operating ExpensesAssuming the crude oil throughput levels set forth above, we
expect our annual refining and marketing operating expenses,
defined as refining personnel, operating and other administra-
tive expenses that pertain to the processing of crude oil and
feed/blendstock into refined products, to be approximately
USD 855 million for 2009. Natural gas is the largest com-
ponent of our variable operating expenses. Other significant
components of operating expenses are our employee costs,
ongoing repair and maintenance, catalysts and chemicals.
Various factors beyond our control, such as unplanned down-
time and changes in the value of the USD against the EUR,
GBP and CHF can cause actual results to differ from our ex-
pectations. The 2009 outlook is based on the following ex-
change rate assumptions:
We used a 2 year look-back as the basis for the exchange
rates used in our 2009 outlook. These rates do not include the
benefit or trend we are currently seeing with the strengthen-
ing of the USD, particularly against the GBP and the EUR. If
the dollar continues to strengthen (or decline), we could see
a significant impact to operating expenditures. Including the
favorable exchange rate benefit through January 31, 2009, we
would expect refining and marketing operating expenses of
USD 200 million in the first quarter and USD 735 million for
the year. Please refer to the Investor Relations section of our
website for further examples on sensitivity analysis performed
using exchange rates through January 31, 2009.
Other Administrative and Non-Refinery Personnel ExpensesWe expect our other expenses comprised of non-refining and
marketing personnel and other administrative expenses, ex-
cluding incentive compensation, to be approximately USD 130
million for 2009. Our incentive compensation expense will be
based solely on our achievement of an adjusted earnings per
share result. Our stock compensation is expected to be ap-
proximately 5 million for 2009. As a significant portion of per-
sonnel and other administrative expenses are incurred in local
currency, actual results will be impacted by changes in the
value of the USD versus local currencies.
Depreciation and AmortizationWe expect depreciation and amortization expenses to be ap-
proximately USD 285 million for 2009. Our depreciation ex-
penses will vary in future periods based on completion and
placing into service of our capital expenditure activity and
decreased/increased capital expenditures as a result of fa-
vorable/unfavorable exchange rate benefits. We generally de-
preciate our capital activities, including those related to ac-
quisitions, over a useful life of 20 years and our turnaround
costs over a useful life between two and five years. We may
be required to record impairment expenses from time to time
in the future based on decreases in the fair value of our assets
relative to their carrying costs.
Interest ExpenseWe expect that our net interest for borrowings under the work-
ing capital facilities will have a blended rate of the published
LIBOR rate plus approximately 2.00%. As our financial position
changes, this blended rate may increase or decrease depend-
ing on certain financial performance indicators used to set the
interest rates under certain of our debt facilities. Additionally,
we expect to incur net interest expense associated with our
USD 1.2 billion in notes, of which USD 600 million is in a 7-year
Forex Rates Applied for 2009 Outlook
2009
EUR / USD 1.41
GBP / USD 1.97
CHF / USD 0.87

46 | Petroplus Holdings AG | Operating and Financial Review
tranche with a fixed interest rate of 6.75% and USD 600 mil-
lion is in a 10-year tranche with a fixed interest rate of 7.00%.
In addition, the net interest expense associated with our USD
500 million CB bears 3.375% interest and will be due in 2013.
The terms and conditions include an investor put option on
March 28, 2011 for principal plus accrued interest. Addition-
ally, we will incur non-cash accretion expense in relation to the
CB. We expect non-cash interest to be approximately USD 11
million for 2009.
Income TaxesWe expect our effective income tax rate for 2009 to be around
10% of our net income before income taxes excluding any
nonrecurring events. Our effective income tax rate will vary as
realized refining margins fluctuate. For example, if realized re-
fining margins are decreased, our effective tax rate increases.
Our effective income tax rate will also vary in connection with
any acquisitions and disposals.
Capital ExpendituresWe plan to fund our internal investments from cash on hand
and internally generated cash flows.
We expect capital expenditures to be approximately USD 365
million for 2009. This does not include the benefit or trend we
are currently seeing with the strengthening of the USD, par-
ticularly against the GBP and the EUR. If the dollar continues
to strengthen or maintains its current level, we could see a sig-
nificant benefit to capital expenditures. Including the favorable
exchange rate benefit through January 31, 2009, we would
expect capital expenditures of USD 60 million in the first quar-
ter and USD 300 million for the year. Our capital expenditure
plan includes costs for the Coryton turnaround in 2009 and
compliance with EU requirements related to renewable energy
and the use of biofuels.
The following table summarizes the major planned turnarounds
by refinery for 2009:
The following table summarizes our budgeted capital expen-
ditures, for the year ending December 31, 2009, by major cat-
egory:
Planned Capital Expenditures
(in millions of USD) 2009 Forex sensitivity
Permit-related 85.8 76.0
Sustaining 133.9 110.0
Turnaround 140.7 111.0
Information technology 4.6 3.0
Total capital expenditures 365.0 300.0
Planned Major Turnaround Schedule
2009
Duration To occur
Coryton 45 - 55 days Q4 2009
Cressier 25 - 30 days Q4 2009

Petroplus Holdings AG | Operating and Financial Review | 47
Discretionary Capital Expenditure Plan
Management believes that due to lead time, economics and
industry-wide delays, long term capital projects will not return
shareholder value in an appropriate time frame. As a result,
we have evaluated each of our assets for those projects that
can be implemented in the short term. For example, in 2007,
at the BRC Refinery, we spent approximately USD 25 million
to improve cut points which moved about 3,000 bpd of lower
value fuel oil into higher value VGO and heating oil. At the In-
golstadt Refinery in 2008, we spent USD 4.5 million on a diesel
maximization project which resulted in more diesel production
versus fuel oil. Our capital plan in 2009 only includes sustain-
ing maintenance, permit-related and turnaround costs.
Quantitative and Qualitative Disclosure About Market Risk
GeneralThe risks inherent in our business include the potential loss
from adverse changes in commodity prices and certain oper-
ating costs, as well as exchange rates, interest rates, counter-
party and operational risks.
Foreign Currency Exchange Rate RiskThe Company is exposed to foreign currency risk as a portion
of our revenues, personnel and operating cost are incurred in
EUR, CHF and GBP and translated into USD which is our func-
tional currency. Thus a decline in the value of the USD against
these currencies will have a negative effect on our liabilities
and expenses and a positive effect on our revenue and assets.
Conversely, an increase in the value of the USD against the
EUR, CHF and GBP will have the opposite effect.
Commodity Price RiskOur earnings, cash flow and liquidity can be significantly af-
fected by a variety of factors beyond our control, including the
supply of crude oil and other feedstocks and the demand for
diesel, gasoline and other petroleum refined products. The
supply of and demand for these commodities depends upon,
among other factors, changes in global and regional econo-
mies, seasonal buying patterns, weather conditions, logistics,
regional and global political affairs, planned and unplanned
downtime in refineries, pipelines and production facilities, the
amount of new refining capacity, the marketing of competitive
fuels and the extent of government regulation. Our revenues
fluctuate significantly with movements in the price of refined
petroleum products; our cost of sales fluctuate significantly
with movements in crude oil and other feedstock prices. Our
operating expenses fluctuate with movements in the price of
natural gas and electricity.
Credit RiskCredit risk arises from the potential failure of a counterparty
to meet its contractual obligations resulting in financial loss to
the Company. We are exposed to counterparty risk primarily
in connection with commercial transactions. The Company’s
maximum exposure to credit risk is represented by the carry-
ing amount of the receivables that are presented in the bal-
ance sheet, including derivatives with positive market values.
Liquidity RiskOur ability to pay interest and principal on our indebtedness
and to satisfy our other debt obligations will depend upon our
future operating performance and the availability of new and
refinancing indebtedness, which will be affected by prevailing
economic conditions and financial, business and other fac-
tors, some of which are beyond our control.
Our ability to generate sufficient cash from our operating
activities depends on our future performance and global oil
market pricing, which is subject to general economic, political,
financial, competitive and other factors beyond our control. In
addition, our future capital expenditures and other cash re-
quirements could be higher than we currently expect as a re-
sult of various factors, including any acquisitions that we may
complete
Interest Rate RiskAs of December 31, 2008, we have USD 253.4 million in bor-
rowings under our working capital facilities. As we borrow on
our working capital facilities, we are subject to interest rate
risk, as all of these borrowings bear floating rates of interest.
Risks Relating to Our Business and Our Industry
The Company is subject to various risks relating to changing
economic, political, legal, social, competitive, industry, busi-
ness and financial conditions. The main risks to the Compa-
ny’s objectives are described below.

48 | Petroplus Holdings AG | Operating and Financial Review
Refining margins significantly impact our profitabil-ity and cash flow. Crude oil prices, refined petroleum product prices, refining margins and our results of operations have fluctuated significantly in the past.
As an oil refiner, our results are primarily affected by the dif-
ferential between refined petroleum product prices and the
prices of crude oil used for refining. This price differential, once
direct costs are subtracted, constitutes our refining margin.
This means we will not generate operating profit or positive
cash flow from our refining operations unless we are able to
buy crude oil and sell refined petroleum products at margins
sufficient to cover the fixed and variable costs of our refineries.
Although the strong demand for crude oil and refined petro-
leum products during recent years has contributed to high re-
fining margins, it is possible that refining margins will decrease
in the future due to factors beyond our control. A decrease in
refining margins could have a material adverse effect on our
business, results of operations and financial condition.
Historically, refining margins have fluctuated substantially.
Refining margins are influenced principally by supply and de-
mand for crude oil and refined petroleum products, which in
turn determine their market prices. Other factors, in no par-
ticular order, that may have an impact on prices and refining
margins include:
changes in global economic conditions, including exchange –
rate fluctuations;
changes in global and regional demand for refined petroleum –
products;
market conditions in countries in which we refine or sell our –
refined petroleum products and the level of operations of
other refineries in Europe;
aggregate refining capacity in the global refining industry to –
convert crude oil into refined petroleum products, including
those we refine;
changes in the cost or availability of transportation for crude –
oil, feedstocks and refined petroleum products;
availability of price arbitrage for refined petroleum products –
between different geographical markets;
political developments and instability in petroleum producing –
regions such as the Middle East, Russia, Africa and South
America;
the ability of the Organization of Petroleum Exporting Coun- –
tries and other petroleum producing nations to set and main-
tain oil price and production controls;
seasonal demand fluctuations; –
expected and actual weather conditions; –
to the extent unhedged, changes in prices from the time –
crude feedstocks are purchased and refined petroleum
products are sold;
the extent of government regulation, in particular as it re- –
lates to environmental policy, fuel specifications and energy
taxes;
the ability of suppliers, transporters and purchasers to per- –
form on a timely basis, or at all, under their agreements (in-
cluding risks associated with physical delivery);
price, availability and acceptance of alternative fuels; and –
terrorism or the threat of terrorism that may affect supply, –
transportation or demand for crude oil and refined petroleum
products.
Disruption of our ability to obtain crude oil and other feedstocks could reduce our margins and results of operations.
We require crude oil and other feedstocks to produce refined
petroleum products. We purchase our crude oil primarily on
the spot markets from, among others, oil majors, crude oil
marketing companies and independent producers. Crude oil
supply contracts are generally short-term contracts. Further, a
significant portion of our crude oil is supplied from the North
Sea, Africa, the Middle East, Russia and Kazakhstan and we
are subject to the political, geographic and economic risks
attendant to doing business with suppliers located in those
regions, such as labor strikes, regional hostilities and unilateral
announcements by any of the countries within these regions
that some or all oil exports for a specified period of time will be
halted. In the event that one or more of our supply contracts is
terminated, we may not be able to find alternative sources of
supply. Moreover, unlike certain of our competitors that have
their own oil exploration and production operations, we are
dependent on third parties for continued access to crude oil
and other raw materials and supplies at appropriate prices.
If we are unable to obtain adequate crude oil volumes or are
only able to obtain such volumes at unfavorable prices, our
margins and our other results of operations could be materially
adversely affected. Further, we may be subject to governmen-
tal restrictions on our purchases of certain crude oil because
of economic sanctions against the government of the country
that is the source of the crude oil, which may result in higher
costs or the lack of availability of crude oil.

Petroplus Holdings AG | Operating and Financial Review | 49
We are dependent on certain third party suppliers for the provision of services that are necessary for our re-fineries’ operations. If third parties are unable to per-form under our contracts with them or cancel these contracts, we may be unable to operate our refineries or deliver refined products to customers.
Each of our refineries is partially or wholly dependent on re-
ceiving a steady and adequate supply of utilities such as elec-
tricity, natural gas and water provided by local companies. Any
disruptions in these utilities, such as a power grid failure, could
force us to shut down the affected refinery and have a material
adverse effect on our results of operations, financial condition
and cash flows.
Our Coryton Refinery, transports its refined products via the
UKOP which is operated by BPA. In addition, the refinery cur-
rently transports jet fuel via GPSS, a government-owned pipe-
line system dedicated to jet fuel that is operated by the OPA.
If we are unable to transport refined petroleum products from
the Coryton Refinery through the UKOP or GPSS, we will have
to implement transportation alternatives.
Our Ingolstadt Refinery relies solely on the 465-kilometer-
long portion of the TAL pipeline system for the delivery of its
crude from the port city of Trieste, Italy. In connection with the
acquisition, we entered into a five-year contractual arrange-
ment with TAL for transportation via the TAL pipeline system.
If we are unable to transport crude oil to the Ingolstadt refinery
through this arrangement, we will need to utilize transporta-
tion alternatives. The cost of these alternatives would likely be
significantly higher than pipeline transportation costs over the
TAL pipeline system and could have a material adverse effect
on our business, results of operations and financial condition.
Our Cressier Refinery receives all of its crude oil feedstock
from Fos-sur-Mer through the SPSE, SFPLJ and OJNSA spurs.
When we acquired the Cressier refinery in 2000, we entered
into a contract with the SPSE pipeline company to transport oil
from Fos-sur-Mer to our pipeline connection point in France.
This contract is terminable by SPSE in certain circumstances
on 24-months’ notice. We do not have throughput arrange-
ments for the SFPLJ and OJNSA pipeline spurs from the SPSE
pipeline to the Cressier facility as they are 100% and 80%
owned by us, respectively. If we are unable to transport crude
oil to our Cressier Refinery through our existing pipeline ar-
rangements, we will have to implement transportation alterna-
tives. The cost of these alternatives would likely be significantly
higher than our current pipeline transportation costs.
Our Reichstett Refinery is also dependent on the SPSE pipe-
line. When we acquired the refinery in 2008, we entered into a
25 year contract with the SPSE pipeline company, terminable
by SPSE in certain circumstances on 24-months notice. If we
are unable to transport crude oil to the Reichstett Refinery
through this arrangement, we will need to utilize transporta-
tion alternatives. The cost of these alternatives would likely
be significantly higher than our current pipeline transportation
costs.
Our Teesside Refinery is dependent on the adjacent SABIC
petrochemicals facility for the supply of key utilities, includ-
ing hydrogen and nitrogen, power from the local utilities grid
and effluent treatment in the SABIC wastewater treatment
plant; the provision for a portion of the refinery’s crude stor-
age capacity; and for the use of the SABIC jetty for loading
refined products for delivery to customers. Most of the agree-
ments covering these services are terminable by SABIC with
12-months’ notice. If SABIC were to terminate these agree-
ments, or if SABIC were to cease operations at Teesside, our
Teesside refinery may have to shut down until it is able to find
alternative local suppliers willing to provide these services.
There may be no other local suppliers that are able to provide
these services. Even if local suppliers were available, there can
be no assurance that such suppliers would be able to supply
the Teesside refinery with the quantity and quality of the ser-
vices that it requires or that the refinery would not be required
to shut down while the necessary infrastructure for providing
these services was constructed. In addition, the terms of the
alternative supply arrangements may contain prices that are
unfavorable to us.
Our Petit Couronne Refinery is dependent upon the Compag-
nie Industrielle Maritime (“CIM”) terminal located in Le Havre.
Upon acquisition of the refinery in 2008, we took over the po-
sition of Shell within Union Francais Des Industries Petroliers
(“UFIP”) in relation to the agreement with CIM. The contract is
renewable every 3 years with the current agreement expiring
in December 2009. If the current contract is not renewed, we
will have to utilize storage alternatives. The cost of these alter-
natives could be significantly higher than our current crude oil
storage agreement.
Our Petit Couronne Refinery is dependent on the use of an
underground storage facility “Caverns” located at the refinery
for the storage of liquid petroleum gas. Prior to the sale of the
refinery to the Company, Shell‘s concession from the French
government to operate the Caverns had expired and Shell filed
an application for a new concession. Pending the decision on
50 | Petroplus Holdings AG | Operating and Financial Review
the application, Shell is authorized to continue to operate the
Caverns. Shell has also applied to transfer the concession,
once granted, to the Company. The Company has a contract
with Shell to operate the Caverns for Shell and has contractual
rights to use the Caverns. If the French government were not
to grant a new concession to Shell and the Company were not
able to use the Caverns, the Company would be negatively im-
pacted. The Company has an agreement with Shell to mitigate
any impact by providing alternatives handling of the liquid pe-
troleum gas; however, there is no assurance that the mitigation
will be completely effective.
If any of our service arrangements with TAL, SABIC, the SPSE
pipeline, the CIM terminal or our service arrangements with
BP in relation to the UKOP or the GPSS are terminated, this
could have a material adverse effect on our business, results
of operations, financial condition, and cash flows. Moreover, to
the extent our customers require us to deliver our products by
specified delivery dates and we fail to do so because we are
not able to make alternative service arrangements, we may
incur penalties. Such delays could also damage our reputation
with customers.
Our business is subject to significant environmental regulations and environmental risks.
Like those of other European oil refiners, our operations are
subject to numerous European Union (“EU”), national, regional
and local environmental laws and regulations, including legis-
lation that implements international conventions or protocols.
In particular, these laws and regulations restrict the types,
quantities and concentration of various substances that can
be released into the environment in connection with produc-
tion activities and impose administrative sanctions and crimi-
nal and civil liabilities for pollution. These laws and regulations
also restrict emissions and discharges to water resulting from
the operation of refineries and other facilities that we own and
operate, as well as establishing standards for the composition
of gasoline, diesel fuel and other petroleum products. In addi-
tion, our operations are subject to laws and regulations relat-
ing to the generation, handling, transportation, sale, storage,
disposal and treatment of materials that may be considered to
be contaminants when released into the environment.
Environmental laws and regulations that affect our opera-
tions, processes and margins have become and are becom-
ing increasingly stringent. If we violate or fail to comply with
these laws and regulations, we could be fined or become
liable for remediation costs or subject to other sanctions. In
addition, the regulatory authorities could suspend our op-
erations or refuse to renew the permits and authorizations
we require to operate. They could also mandate upgrades
or changes to our processes that could have a significant
impact on cost.
We need a variety of permits to conduct our operations. We
must comply with our permits and renew those permits to
operate our facilities. In addition, failure to comply with our
permits could subject us to civil penalties, criminal sanctions
and closures of our facilities. Following our recent successful
renegotiations of our environmental permits at the Teesside
and Coryton refineries, we are required to carry out various
improvements and upgrades and to conduct a number of
studies.
Sites at which we operate have a long history of industrial ac-
tivities and may be, or have been in the past, engaged in ac-
tivities involving the use of materials and processes that can
give rise to potential liabilities requiring remediation. Potential
liabilities can also arise in relation to land previously owned by
companies or refineries that we have acquired but where such
land was sold prior to our acquisition of those companies or
refineries. With respect to our acquisitions, we cannot assure
you that our due diligence investigations identified or accurate-
ly quantified all material environmental matters and contingen-
cies relating to acquired facilities. In addition, environmental
indemnities given to us by sellers typically contain thresholds
and other limitations as to the aggregate amount of the sell-
ers’ obligations. Consequently, we may be required to expend
considerable amounts to remediate pre-existing environmen-
tal contamination or conditions at sites we have acquired.
We have identified soil and groundwater contamination at our
sites and are undertaking measures to address the identified
contamination, in consultation with regulatory authorities where
necessary. For example, we have budgeted expenditures at
three of our existing refineries and our Antwerp Processing
Facility relating to known contamination, and we may need to
make additional expenditures, which could be significant, to
comply with environmental laws and regulations. In response
to an investigation by the Belgian authorities, we submitted a
ten-year remediation report to the national regulators for the
Antwerp Processing Facility and the proposed measures were
accepted by the regulators. We are in the process of updating
the plan and if material changes are necessary the plan will be
resubmitted to the Belgian authorities. The Belgian authorities
have not yet responded to our orienting plan in respect of the
other site at the Antwerp processing facility, and we cannot

Petroplus Holdings AG | Operating and Financial Review | 51
assure you that this plan will be accepted in its current form
or at all. The expected cost for the remediation required at the
Antwerp facilities is approximately USD 5.5 million. Similarly,
we will need to make expenditures, which could be significant,
to address soil and groundwater contamination at the BRC
Refinery, for which we recorded a provision of USD 7.0 million
as of December 31, 2008. We have provided the authorities
with an initial orienting report regarding the contamination but
have not yet received a response to the report.
The risk of significant environmental remedial liability is inherent
to our business. No assurance can be given that such liability
will not arise in the future as a result of the application of pres-
ent or future laws and regulations to existing contamination,
whether presently detected or otherwise, or misinterpretation
of data regarding such contamination, or future contamination
of any of our sites or otherwise arising out of our activities and
operations.
We are subject to the regulations of the EU in regards to car-
bon dioxide emission. In 2008 and in prior years, the Com-
pany has operated within the allowable limits of carbon dioxide
emissions.
In addition to liability for remediation costs and regulatory
non-compliance, we may be liable under common law, e.g.
negligence and/or nuisance, for the environmental impact of
our operations on third parties. We could also be subject to li-
abilities to third parties that include, without limitation, liabilities
for crude oil or refined petroleum product spills, discharges of
hazardous materials into the soil, air and water and other envi-
ronmental liabilities. Compensation to third parties, as well as
other liabilities mentioned, may involve significant costs. Any
such payments could reduce or eliminate the funds available
for financing our normal operations and planned development
or result in the loss of our properties. We cannot assure you
that discharges of hazardous materials will not occur in the
future or that third parties will not assert claims against us for
damages allegedly arising out of any past or future contami-
nation.
Stricter environmental, health and safety laws and enforce-
ment policies could result in substantial costs and liabilities
for us, and could result in our handling, manufacture, use, re-
use or disposal of substances or pollutants being subjected to
more rigorous scrutiny by relevant regulatory authorities than
is currently the case. Compliance with these laws could result
in significant capital expenditures as well as other costs and
liabilities, thereby harming our business. For example, the new
system in the EU for registration, evaluation and authorization
of chemicals (known as REACH) is expected to be among the
most significant environmental issues affecting our operations
in the future. We will be impacted by REACH, both as a high-
volume manufacturer of petroleum substances as well as in
our role as a downstream user of other substances. Another
example of the need to comply with more demanding regula-
tion concerns the current process which is underway to re-
quire stricter emission level values for emissions in the envi-
ronment at our Ingolstadt Refinery, BRC Refinery and French
refineries.
In addition, we cannot assure you that we will be able to meet
future refined product standards that may be introduced by
the EU or other relevant jurisdictions or that we will have suf-
ficient funds to make the necessary capital expenditures to
produce products that comply with future specifications and
regulations.
We must comply with health and safety regulations at our facilities, failure to do so could result in signifi-cant liability and / or fines and penalties.
Our activities are subject to a wide range of EU, national, pro-
vincial and local occupational health and safety laws and regu-
lations in each jurisdiction in which we operate. These health
and safety laws are constantly changing. Failure to comply with
these health and safety laws could lead to criminal violations,
civil fines and changes in the way we operate our facilities
which could increase the costs of operating our business.
A significant interruption or casualty loss at any of our refineries could reduce our production, particularly if not fully covered by our insurance.
Our operations could be subject to significant interruption if
any of our refineries or our processing facility were to expe-
rience a major accident, be damaged by severe weather or
other natural disaster or otherwise be forced to shut down or
curtail production due to unforeseen events, such as acts of
nature, power outages, fires and acts of terrorism. Any such
shut-down would reduce the production from that refinery. For
example, a fire forced the BRC Refinery to shut down the Vis-
breaker and related units for about two months during 2008.
There is also risk of mechanical failure and equipment shut-
downs both in general and following unforeseen events. Fur-
ther, in such situations, undamaged refinery processing units
may be dependent on or interact with damaged sections of
our refineries and, accordingly, are also subject to being shut

52 | Petroplus Holdings AG | Operating and Financial Review
down. In the event any of our refineries are forced to shut down
for a significant period of time, or if any of the above events
were not fully covered by our insurance, this would have a ma-
terial adverse effect on our results of operations and financial
condition.
We may be exposed to economic disruptions in the various countries in which we operate and in which our suppliers and customers are located. These disruptions could adversely affect our operations, tax treatment under foreign laws and our financial results.
Although we operate primarily in the United Kingdom, Ger-
many, France, Belgium, and Switzerland our operations ex-
tend beyond these countries. We export refined petroleum
products to certain other areas, including the Netherlands and
North America. Additionally, we purchase the crude oil that we
refine predominantly from the North Sea, Africa, the Middle
East, Russia and Kazakhstan. Accordingly, we are subject to
legal, economic and market risks associated with operating
internationally, purchasing crude oil and supplies from other
countries and selling refined petroleum products to them.
These risks include:
interruption of crude oil supply; –
devaluations and fluctuations in currency exchange rates; –
imposition or increase of withholding and other taxes on re- –
mittances by foreign subsidiaries;
imposition of trade restrictions or embargoes against certain –
states, preventing us from buying crude oil and other feed-
stock from, or selling products to these states;
imposition or increase of investment and other restrictions by –
foreign governments;
failure to comply with a wide variety of foreign laws; and –
unexpected changes in regulatory environments and gov- –
ernment policies.
Our international operations also expose us to different social,
political and business risks in each jurisdiction. For example:
compliance with union and collective bargaining agreements –
in a number of locations;
implementation of local solutions to manage credit risks of –
local customers;
fluctuations in currency exchange rates; and –
impacts arising from political, social and labor instability that –
could disrupt or increase the cost of our operations.
We cannot assure you that we will develop and implement sys-
tems and policies that enable us to operate profitably, or at all,
in all of the locations where we do business.
As our Company operates in multiple jurisdictions, we may be subjected to changes in tax law and/or practice, which potentially represent a risk to our tax planning for the Company.
We are subject to taxation in multiple jurisdictions and are
faced with increasingly complex tax laws. The tax laws in these
jurisdictions may change or be subject to differing interpreta-
tions, possibly with retroactive effect, including the imposition
of substantially higher tax or interest payments, which could
have a material adverse effect on our liquidity and results of
operations. Any changes in law or regulations, or a failure to
comply with any such laws or regulations, may adversely af-
fect our performance. In addition, taxing authorities could re-
view and question our tax returns leading to additional taxes
and penalties that could be material.
A substantial portion of our workforce is unionized, and we may face labor disruptions that would inter-fere with our refinery operations.
Our operations may be affected by labor disruptions involving
our employees and employees of third-parties. Over half of
our refinery employees are represented by trade unions under
collective bargaining agreements, which are generally renego-
tiated every two years. While our relationships with the trade
unions representing our employees in Germany, France, Bel-
gium and the United Kingdom are normal, negotiations with
these unions have, at times, been difficult. The Cressier Refin-
ery in Switzerland was affected by a third-party work stoppage
at Fos-sur-Mer in December 2008, which delayed the refinery
restart after a planned maintenance activity for approximately
two additional weeks. We may be affected by strikes, lockouts
or other significant work stoppages in the future, any of which
could adversely affect our business, financial condition or re-
sults of operations.
Critical Accounting Judgments and Estimates
For discussion on our critical accounting judgments and es-
timates, see “Summary of Significant Judgments and Esti-
mates” in Note 2 to the Consolidated Financial Statements in
this Annual Report.

Petroplus Holdings AG | Operating and Financial Review | 53
(This page has been left blank intentionally.)