petroleum pricing in indiabookstore.teri.res.in/docs/books/petroleum pricing in india.pdf ·...
TRANSCRIPT
Petroleum pricing in Indiabalancing efficiency and equity
The Energy and Resources Institute
Neha Misra
Ruchika Chawla
Leena Srivastava
R K Pachauri

Petroleum pricing in India:balancing efficiency and equity
Neha Misra, Ruchika Chawla, Leena Srivastava,and R K Pachauri
The Energy and Resources Institute

© The Energy and Resources Institute, 2005
ISBN 81–7993–081–5
TERI invites your comments/suggestions on this document.Please send your responses to <[email protected]> or<[email protected]>.
All rights reserved. No part of this publication may be reproduced in any form orby any means without prior permission of The Energy and Resources Institute.
Published byTERI PressThe Energy and Resources InstituteDarbari Seth Block Tel. 2468 2100 or 2468 2111IHC Complex Fax 2468 2144 or 2468 2145Lodhi Road India +91 • Delhi (0) 11New Delhi – 110 003 E-mail [email protected] Web www.teriin.org
Contents
Foreword v
Acknowledgements vii
Recommendations 1
Background 3
India’s oil import dependency 3
Growth of the sector 4
The present status of pricing 7
Oil prices: burden-sharing potential 11
Revenue earnings by the government 11
Revenue earnings by the refiners 14
Impact of international price changes 16
Maintaining neutrality in central and state government
revenues 19
Impact on consumers: households 22
The cost of adulteration 27
Substituting LPG for all traditional fuels used for cooking 30
Implications of phasing out kerosene production 32
Smart cards for delivery of energy subsidies 33
Summary and conclusions 34

Foreword
Petroleum product pricing in India has gone through various stagesof evolution, particularly in relation to responsibilities exercised bydifferent levels of government and the oil industry. When the first oilprice shock took place in 1973/74 the Government of India passedon to consumers, almost fully, the sudden increase in global crudeoil prices. The result was expectedly adverse, with inflation reachingrecord levels and creating considerable hardships for fixed incomeclasses of the population. Over a period of time the APM (adminis-tered pricing mechanism) was established, which essentially allowedthe oil companies a return on investment by adjusting productprices to reflect global market realities.
In the mid ’90s the Government set up a high level group consist-ing of representatives from industry, both public and private sector;researchers and academics; as well as government officials to go intothe restructuring of the oil industry. One of the major recommenda-tions of this group was to do away with the APM, apart from severalother changes that were recommended. To provide operationaldirection to the recommendation on APM, an expert committeethen developed a plan, which required the APM to be dismantled in2002 and to be replaced by a system that would allow oil marketcompanies to set petroleum product prices in keeping with specificguidelines and principles.
While the Government accepted this recommendation they werenot brought into force in 2002 as expected. Consequently, ananomalous process has been observed over the last three yearswherein the APM is supposedly done away with but the proposedinstitutional arrangement that was to take its place has not beenestablished. Consequently, several further distortions have creptinto petroleum product pricing, which are leading to several nega-tive externalities and unfavourable impacts on the economy, as wellas on the welfare of society. The time for change is now, and theneed for correcting existing distortions urgent.
This publication has gone into depth on the subject of petroleumproduct pricing and has come up with several recommendations,which it is hoped the authorities would reflect on and accept fully.

The analysis presented highlights past distortions and irrationali-ties, and then provides some refreshing innovations, which wouldensure economic efficiency and also help to meet the needs of thepoor.
It is believed that this publication and its recommendation canherald a process of rationalization of petroleum product pricing andcorrection of institutional weaknesses that the country can ill affordin the future.
R K PachauriDirector–General

Acknowledgements
This research has been made possible due to the research grantprovided by the FCO (Foreign and Commonwealth Office) of theUK for work on developing an energy security policy for India.The research team would like to acknowledge the useful commentsreceived from Mr R K Batra, Ms Preety Bhandari,and Mr P K Aggarwal of TERI.*
* The research team has tried its best to create the price build-up of petroleumproducts sold in India. However, the calculations are subject to an error marginof +5%.
1Petroleum pricing in India: balancing efficiency and equity
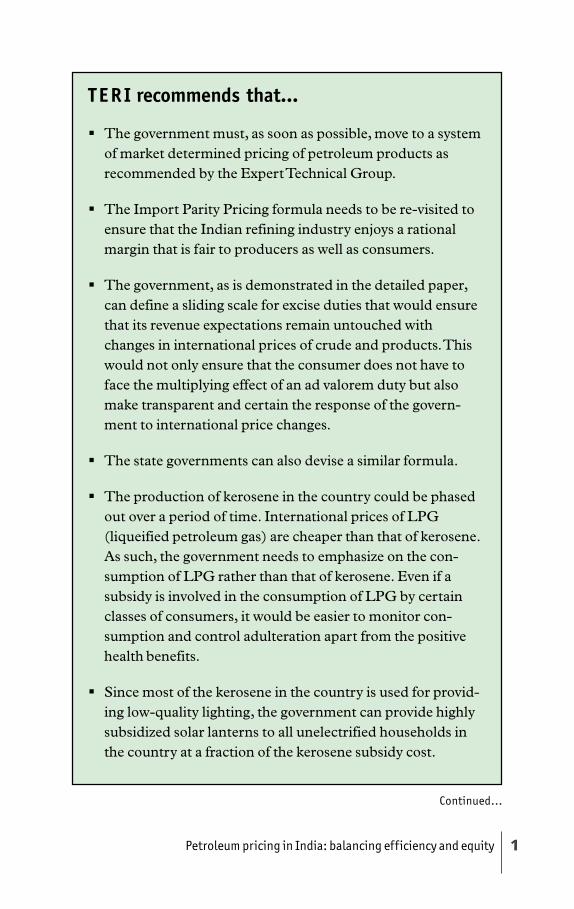
T E R I recommends that…
The government must, as soon as possible, move to a systemof market determined pricing of petroleum products asrecommended by the Expert Technical Group.
The Import Parity Pricing formula needs to be re-visited toensure that the Indian refining industry enjoys a rationalmargin that is fair to producers as well as consumers.
The government, as is demonstrated in the detailed paper,can define a sliding scale for excise duties that would ensurethat its revenue expectations remain untouched withchanges in international prices of crude and products. Thiswould not only ensure that the consumer does not have toface the multiplying effect of an ad valorem duty but alsomake transparent and certain the response of the govern-ment to international price changes.
The state governments can also devise a similar formula.
The production of kerosene in the country could be phasedout over a period of time. International prices of LPG(liqueified petroleum gas) are cheaper than that of kerosene.As such, the government needs to emphasize on the con-sumption of LPG rather than that of kerosene. Even if asubsidy is involved in the consumption of LPG by certainclasses of consumers, it would be easier to monitor con-sumption and control adulteration apart from the positivehealth benefits.
Since most of the kerosene in the country is used for provid-ing low-quality lighting, the government can provide highlysubsidized solar lanterns to all unelectrified households inthe country at a fraction of the kerosene subsidy cost.
Continued...

Petroleum pricing in India: balancing efficiency and equity2
All subsidies on LPG should be provided to the consumer asa direct subsidy instead of a subsidy on the LPGcylinder. LPG debit cards floated jointly by financial institu-tions and oil companies can be issued to targeted consumersidentified by the government. The government may definedifferent debit limits to different categories of consumers if itso wishes. Administratively it would be easier to have just twoclasses of LPG consumers: subsidized and unsubsidized.
A detailed study is required to understand the truckingindustry and the impact of bringing taxation of diesel on parwith other petroleum products.
3Petroleum pricing in India: balancing efficiency and equity
Background
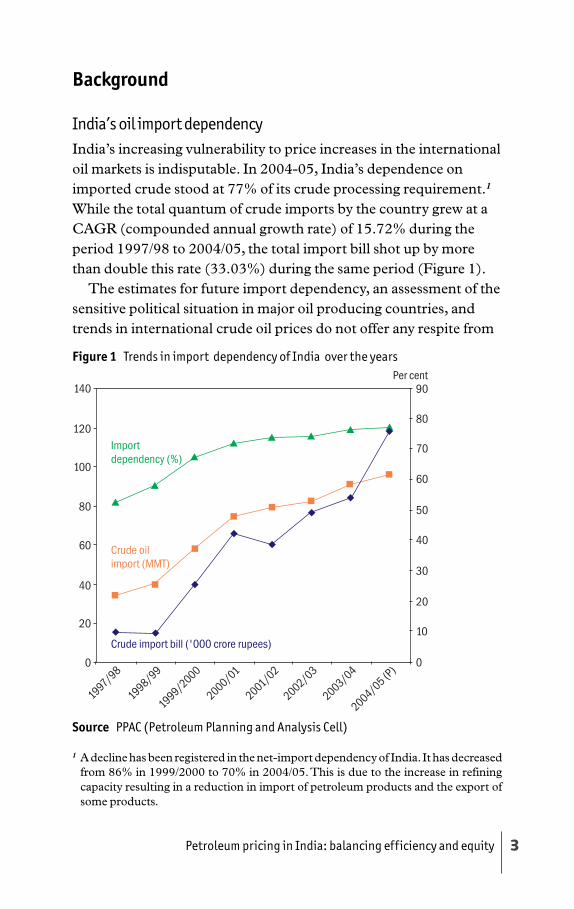
India’s oil import dependencyIndia’s increasing vulnerability to price increases in the internationaloil markets is indisputable. In 2004-05, India’s dependence onimported crude stood at 77% of its crude processing requirement.1
While the total quantum of crude imports by the country grew at aCAGR (compounded annual growth rate) of 15.72% during theperiod 1997/98 to 2004/05, the total import bill shot up by morethan double this rate (33.03%) during the same period (Figure 1).
The estimates for future import dependency, an assessment of thesensitive political situation in major oil producing countries, andtrends in international crude oil prices do not offer any respite from
Figure 1 Trends in import dependency of India over the years
1 A decline has been registered in the net-import dependency of India. It has decreasedfrom 86% in 1999/2000 to 70% in 2004/05. This is due to the increase in refiningcapacity resulting in a reduction in import of petroleum products and the export ofsome products.
Source PPAC (Petroleum Planning and Analysis Cell)

Petroleum pricing in India: balancing efficiency and equity4
this steep increase in the crude import bill. According to the WorldEnergy Outlook India’s crude import dependency is projected to riseto 94% in 2030, ceteris paribus.2 TERI estimates using theMARKAL model also corroborate these estimates.
In the last several months there has been growing concern,leading to a sustained public debate, about how to tackle the impli-cations of high crude prices for the economy. While, the question ofwhether oil prices will continue to rise, or indeed fall, over the nextfew years is debatable, what is clear is that India needs to exploreopportunities for using oil as efficiently as possible and to put inplace a pricing system that meets the multiple objectives of
providing an adequate incentive to oil companies for furtherinvestments in the sector;providing resources for the government while minimizing the oilsubsidy burden;minimizing the impact on consumers as oil prices remain highand continue to rise further; andpromoting efficient consumption choices. This paper makes an attempt to address these objectives by
critically examining the pattern of petroleum consumption in thecountry, various facets of the current petroleum-pricing regime, andits implications for various stakeholders in the sector.
Growth of the sector
Trends in consumption and production: the big picture
Consumption of petroleum products in the country has increasedfrom 97 MT (million tonnes) in 1999/2000 to 112 MT in 2003/04,growing at a CAGR of 2.64%. LPG, kerosene, HSD, and MScontinue to form over 60% of the total sales generated in the sector(Figure 2).
Against this consumption, production of petroleum products hasgrown at a CAGR of 9.33% since 1999/2000, standing at 118 MT in2003/04. The increased refining capacity in the country, contributedto significantly by private refining capacity, has almost completelyeliminated the need to import petroleum products in the short
2 World Energy Outlook 2002 – International Energy Agency (IEA) p. 285

5Petroleum pricing in India: balancing efficiency and equity
term. In 2004/05, petrol, diesel, LPG, and kerosene formed 61.56%of the total production of petroleum products in the country (diesel:38.18%, petrol: 9.69%, kerosene: 8.69%, LPG 4.71 %)(Figures 3and 4).
Figure 2 Consumption of four major petroleum products (million tonnes)
Figure 3 Trend in production of petroleum products (percentage)
Source PPACNote LPG – liquefied petroleum gas; MS – motor spirit; HSD – high speeddiesel; SKO – superior kerosene oil
Source PPAC

Petroleum pricing in India: balancing efficiency and equity6
Trade in Petroleum Products
Supported by increasing refining capacity in the country, in 2001/02India became a net exporter of petroleum products for the first time(Figure 5). In 2004/05, the country exported 17.53 MT of petro-leum products against an import of 8.83 MT. There has been anupsurge in the export market of diesel, petrol, naphtha, ATF (avia-
Figure 4 Production profile of petroleum products (2003/04) (percentage)
Source PPAC
Figure 5 Imports vs exports of petroleum products (million tonnes)
Source PPAC

7Petroleum pricing in India: balancing efficiency and equity
tion turbine fuel), and fuel oil (Figure 6). In the last four years, theexport market for diesel, petrol, and ATF has grown at a CAGR of40.30%, 26.41%, and a whopping 97.37% respectively. On theimport front, over the last four years, LPG imports have increased ata CAGR of 27.65%, standing at 2.33 MT in 2004/05 while keroseneimports have declined at a rate of 43.19%.
The present status of pricingStarting from April 2002, the vestiges of the controlled era in theform of APM (administered pricing mechanism) were officiallydismantled. However, substantial government control on the sectorprevails till date. The following section discusses the key implicationsof dismantling of APM on the petroleum pricing in the country.
Pricing of domestic crude
With the dismantling of APM, the price of indigenous crude hasbeen linked to international prices, which implies that the pricereceived by domestic crude oil producers is linked to internationalprices (as against the pooled price in the APM regime which was theweighted average of international prices and the domestic cost of
Figure 6 Composition of exports and imports of petroleum products (thousandtonnes)
Source PPAC (2005)
Petroleum pricing in India: balancing efficiency and equity8
production). In effect at the time of dismantling of the APM, domes-tic refineries were to pay international crude prices even for crudeprocured from domestic producers. Revenues of domestic crudeproducers, on the other hand, are over and above what would havebeen on the basis of their costs.
Pricing of petroleum products
Subsequent to dismantling of the APM, prices of petroleum prod-ucts in the market were to be based on the principle of import parity,except for PDS (public distribution system) kerosene and domesticLPG, on which the subsidy element was to gradually reduce to 33%and 15% respectively. Linkage to IPPs essentially meant that theprices of petroleum products should represent the opportunity costof importing these products from the international market as againstproducing them domestically. This, however, also translated into ahigher exposure of product prices in the domestic market to thevolatility in the international oil markets.
Petrol and diesel are the two major transportation fuels in thecountry. In 2003/04 these two fuels together formed 41.73% of totalsales of petroleum products. With the dismantling of APM, the retailprices of these products were linked to the IPPs. However, in aneffort to insulate consumers from the steep international priceincreases and volatility, the government was reluctant to allowOMCs (oil marketing companies) to increase retail prices of petroland diesel in line with the corresponding increase in internationalcrude oil prices.
The government did introduce a price band, from 1 August 2004,within which OMCs would be free to respond to international pricechanges. As per this mechanism, retail prices of petrol and dieselwere to be based on the previous fortnight’s average internationalprice (in line with the import parity principle), subject to the condi-tion that the exchange rate adjusted C&F (cost and freight) productprice was within the band of plus or minus 10% around the mean ofthe previous three months rolling average price and previous oneyear’s average price. In case of breach of this band, the OMCs wereto approach the Ministry of Finance through the MoPNG (Ministryof Petroleum and Natural Gas) to modulate the excise duty rates to
9Petroleum pricing in India: balancing efficiency and equity
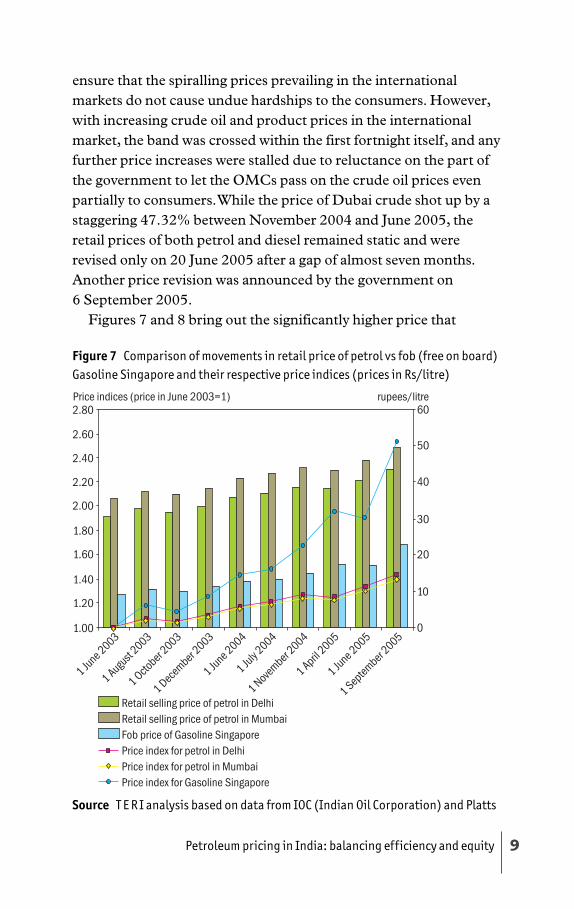
ensure that the spiralling prices prevailing in the internationalmarkets do not cause undue hardships to the consumers. However,with increasing crude oil and product prices in the internationalmarket, the band was crossed within the first fortnight itself, and anyfurther price increases were stalled due to reluctance on the part ofthe government to let the OMCs pass on the crude oil prices evenpartially to consumers. While the price of Dubai crude shot up by astaggering 47.32% between November 2004 and June 2005, theretail prices of both petrol and diesel remained static and wererevised only on 20 June 2005 after a gap of almost seven months.Another price revision was announced by the government on6 September 2005.
Figures 7 and 8 bring out the significantly higher price that
Figure 7 Comparison of movements in retail price of petrol vs fob (free on board)Gasoline Singapore and their respective price indices (prices in Rs/litre)
Source T E R I analysis based on data from IOC (Indian Oil Corporation) and Platts
Petroleum pricing in India: balancing efficiency and equity10
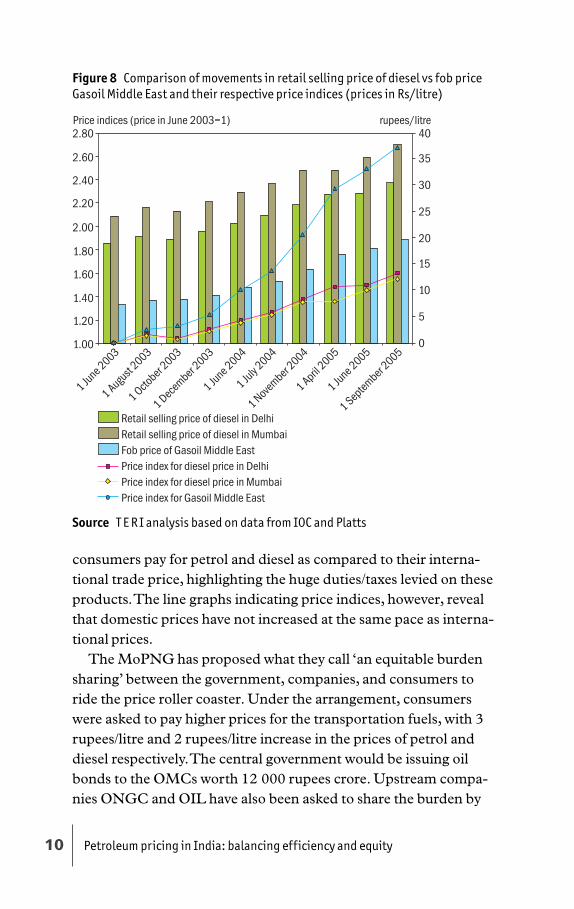
Figure 8 Comparison of movements in retail selling price of diesel vs fob priceGasoil Middle East and their respective price indices (prices in Rs/litre)
consumers pay for petrol and diesel as compared to their interna-tional trade price, highlighting the huge duties/taxes levied on theseproducts. The line graphs indicating price indices, however, revealthat domestic prices have not increased at the same pace as interna-tional prices.
The MoPNG has proposed what they call ‘an equitable burdensharing’ between the government, companies, and consumers toride the price roller coaster. Under the arrangement, consumerswere asked to pay higher prices for the transportation fuels, with 3rupees/litre and 2 rupees/litre increase in the prices of petrol anddiesel respectively. The central government would be issuing oilbonds to the OMCs worth 12 000 rupees crore. Upstream compa-nies ONGC and OIL have also been asked to share the burden by
Source T E R I analysis based on data from IOC and Platts
11Petroleum pricing in India: balancing efficiency and equity
providing crude oil to these companies at discounted prices. Stand-alone refineries like MRPL, KRL, and private refinery Reliance havebeen asked to supply LPG and kerosene to these OMCs at dis-counted rates. The discount is expected to be around 5000 rupeescrore. This discount offered by the refiners to the OMCs is over andabove the discounts given by them in supply of petrol and diesel. Theupstream companies such as ONGC, GAIL, and OIL are expectedto contribute towards meeting about one-third of the losses, which isequal to 13 000 rupees crore to 14 000 rupees crore. (The likelyprofit to the upstream oil companies on a 32 MT production perannum due to IPP is atleast about 34 000 rupees crore at an interna-tional price of 45 dollars/bbl.)
The frequent policy changes by the government, and often ad-hocreactions to international developments, have rendered the pricingprocess opaque: at least to the common citizen. So, who will be ableto absorb how much of the price increases? Who are the beneficiariesof the current pricing regime? What are the implications for increas-ing efficiencies? TERI has attempted to reconstruct the price buildup for the petroleum sector, and through an analysis based on themodel so developed, proposes a way forward.
Oil prices: burden-sharing potential
Revenue earnings by the governmentAs indicated earlier, crude oil and petroleum products are majorsources of revenue for the government: both central and state. In thepresent structure, a mix of specific and ad-valorem duties are im-posed on petroleum products. This essentially means that, with anincrease in prices of petroleum products, government realizationalso goes up. Figure 9 shows the increase in contribution of petro-leum products to the government exchequer over the last threeyears.
With our crude oil import dependency increasing from 56% in1997/98 to 77% in 2004/05, expenditure on crude oil import in-creased seven fold to 1 31 891 rupees crore in 2004/05. While thegovernment has attempted to reduce customs duties, it has in-

Petroleum pricing in India: balancing efficiency and equity12
creased excise duties disproportionately to more than offset the lossin revenue due to customs duty reductions. As a result, during thisperiod, total earnings of the central government from excise andcustoms duty on crude oil and petroleum products have more thandoubled (Figure 10).
The share of petrol and diesel in total excise duty realization frompetroleum products by the central government has increased from35.23% in 1990/91 to 67.4% in 2003/04 (Figure 11).
The sixth report of the Standing Committee of Petroleum andNatural Gas presented to the 14th Lok Sabha on 4 August 2005,states that we have a build up of prices in which more than 50% ofthe price is taxes. The percentage tax on petrol in Mumbai, Chennai,Kolkata, and Delhi is 146%, 138%, 132%, and 112% respectively ofthe basic price. Budget 2005/06 slashed customs duty on petrol anddiesel from 15% to 10%.3 This would have at least brought somerelief in the retail prices of petrol and diesel, if not for an effectiveincrease in the excise duty on these products. The excise duty onpetrol and diesel pre- and post-budget 2005/06 was as follows(Table 1).
Figure 9 Government revenue earnings from crude oil plus petroleum products(crore rupees)
Source Sixth Report of Committee on Petroleum and Natural Gas: placed duringthe 14th Lok Sabha
3 Both excise and customs duty on LPG and Kerosene were reduced to nil.

13Petroleum pricing in India: balancing efficiency and equity
Figure 10 Crude oil import bill vs central government earnings from crude oil andpetroleum products (crore rupees)
Figure 11 Composition of excise duty from crude oil and petroleum products(percentage)
Source PPAC 2005
Source PPAC 2005;TEDDY 2003/04, MoPNG Annual Report 2004/05
Petroleum pricing in India: balancing efficiency and equity14
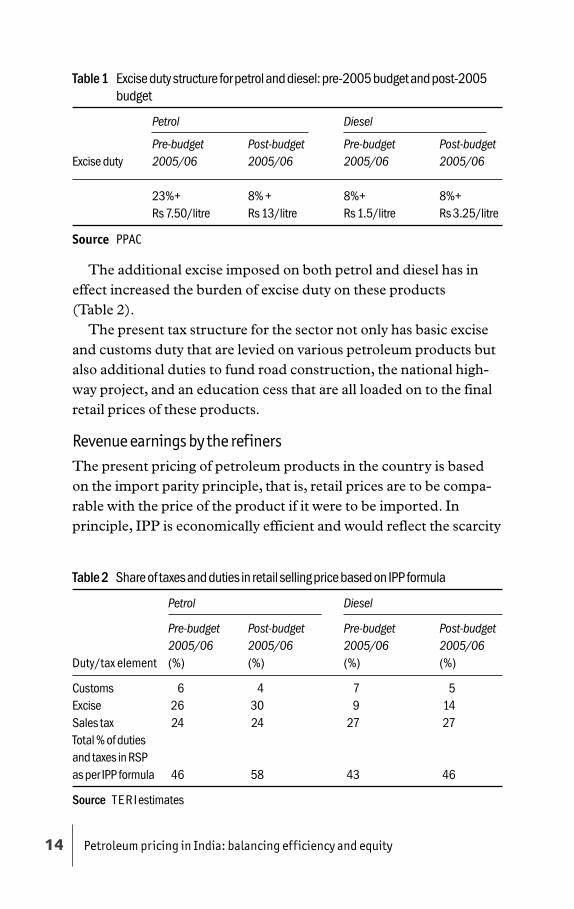
Table 1 Excise duty structure for petrol and diesel: pre-2005 budget and post-2005budget
Petrol Diesel
Pre-budget Post-budget Pre-budget Post-budgetExcise duty 2005/06 2005/06 2005/06 2005/06
23%+ 8% + 8%+ 8%+Rs 7.50/litre Rs 13/litre Rs 1.5/litre Rs 3.25/litre
Source PPAC
The additional excise imposed on both petrol and diesel has ineffect increased the burden of excise duty on these products(Table 2).
The present tax structure for the sector not only has basic exciseand customs duty that are levied on various petroleum products butalso additional duties to fund road construction, the national high-way project, and an education cess that are all loaded on to the finalretail prices of these products.
Revenue earnings by the refinersThe present pricing of petroleum products in the country is basedon the import parity principle, that is, retail prices are to be compa-rable with the price of the product if it were to be imported. Inprinciple, IPP is economically efficient and would reflect the scarcity
Table 2 Share of taxes and duties in retail selling price based on IPP formula
Petrol Diesel
Pre-budget Post-budget Pre-budget Post-budget2005/06 2005/06 2005/06 2005/06
Duty/tax element (%) (%) (%) (%)
Customs 6 4 7 5Excise 26 30 9 14Sales tax 24 24 27 27Total % of dutiesand taxes in RSPas per IPP formula 46 58 43 46
Source T E R I estimates
15Petroleum pricing in India: balancing efficiency and equity
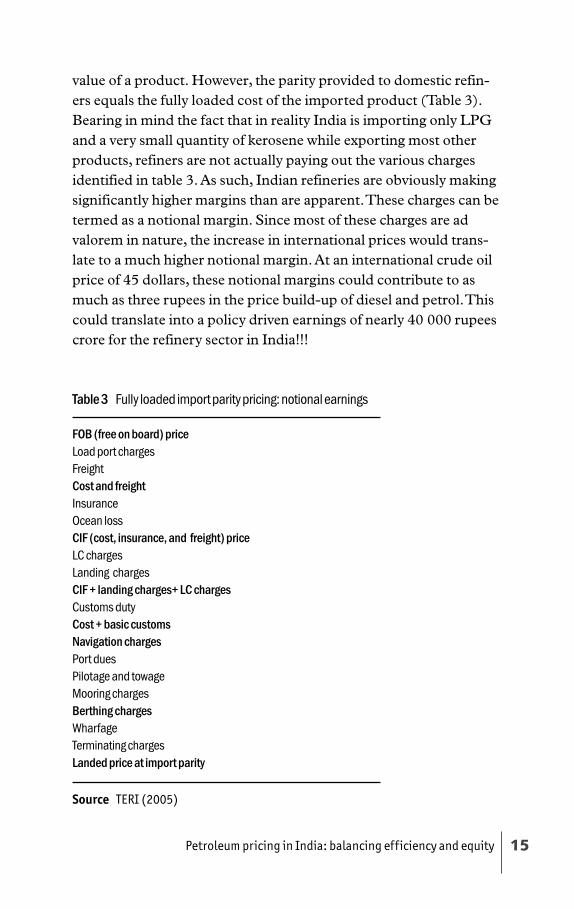
value of a product. However, the parity provided to domestic refin-ers equals the fully loaded cost of the imported product (Table 3).Bearing in mind the fact that in reality India is importing only LPGand a very small quantity of kerosene while exporting most otherproducts, refiners are not actually paying out the various chargesidentified in table 3. As such, Indian refineries are obviously makingsignificantly higher margins than are apparent. These charges can betermed as a notional margin. Since most of these charges are advalorem in nature, the increase in international prices would trans-late to a much higher notional margin. At an international crude oilprice of 45 dollars, these notional margins could contribute to asmuch as three rupees in the price build-up of diesel and petrol. Thiscould translate into a policy driven earnings of nearly 40 000 rupeescrore for the refinery sector in India!!!
Table 3 Fully loaded import parity pricing: notional earnings
FOB (free on board) priceLoad port chargesFreightCost and freightInsuranceOcean lossCIF (cost, insurance, and freight) priceLC chargesLanding chargesCIF + landing charges+ LC chargesCustoms dutyCost + basic customsNavigation chargesPort duesPilotage and towageMooring chargesBerthing chargesWharfageTerminating chargesLanded price at import parity
Source TERI (2005)
Petroleum pricing in India: balancing efficiency and equity16
Obviously, if integrated refining and marketing companies were todeal with subsidy levels that are higher than the notional margins,their incentive to export the product would increase substantially—given the uncertainties associated with domestic retail pricing andrecovering subsidies from the government. This could explain theincreasing level of exports, particularly from private refineries.
Impact of international price changes
Impact on retail prices
This section presents the results of sensitivity analysis of retail pricesof diesel and petrol in the country resulting from an increase in priceof crude oil in the international market as per current import parityformula. Seven scenarios have been built corresponding to crude oilprices of (a) $25/bbl, (b) $45/bbl, (c) $55/bbl, (d) $65/bbl, (e) $75/bbl, (f) $85/bbl, and, (g) $105/bbl. We have also analysed change inthe shares of notional price element, excise duty, and sales tax in thefinal retail prices based on IPP in each of these scenarios. Theprevailing rate of excise and customs duty, and the weighted averagesales tax rates in the country have been taken in the analysis.
Table 4 shows that with an increase in international crude pricefrom 45 dollars/bbl to 65 dollars/bbl, there would be an increase inretail price of diesel from 31.78 rupees/litre to 42.85 rupees/litre: ajump by 35%. It is interesting to note that inbuilt in this price in-crease is a 33% increase in notional price, a 15% increase in exciseduty and a 30% increase in sales tax earnings! In case of petrolsimilar results are seen in table 5. For increase in international crudeoil price from 45 dollars/bbl to 65 dollars/bbl, there would be a 24%increase in the retail price level of petrol. There is also a correspond-ing jump in earnings from notional prices, excise duty, and sales taxby 31%, 4%, and 22% respectively!
Impact on government revenues
To get an insight into the sensitivity of government revenues todifferent combinations of excise and customs duty, five scenarioswere built.

17Petroleum pricing in India: balancing efficiency and equity
• Scenario 1: Present duty structure, that is, post budget 2004/05• Scenario 2: Present structure without any specific excise compo-
nent• Scenario 3: Pre-budget duty structure• Scenario 4: Reduction in customs duty and in specific component
of excise duty• Scenario 5: Reduction in customs duty and nil specific duty
Table 6 shows the assumptions for each of these scenarios.
Table 4 Sensitivity analysis for retail price of diesel based on IPP (Rs/litre)
Crude oil Retail price Notional Total taxesprice FOB based on price in Excise Sales and
Scenario ($/bbl) price IPP IPP build-up duty tax duties
A 25 7.95 20.77 2.03 4.18 4.20 8.38B 45 15.33 31.78 3.00 4.8 6.03 10.87C 55 19.01 37.29 3.49 5.18 6.94 12.12D 65 22.70 42.85 3.98 5.51 7.85 13.36E 75 26.38 48.37 4.46 5.85 8.76 14.61F 85 30.07 53.88 4.95 6.18 9.68 15.86G 105 37.44 64.91 5.92 6.85 11.50 18.35
Source: T E R I estimates
Table 5 Sensitivity analysis for retail price of petrol l based on IPP (Rs/litre)
Crude oil Retail price Notional Total taxesprice FOB based on price in Excise Sales and
Scenario ($/bbl) price IPP IPP build-up duty tax duties
A 25 9.06 36.39 2.19 14.04 8.08 22.12B 45 16.36 47.83 3.16 14.70 10.41 25.11C 55 20.01 53.55 3.64 15.03 11.58 26.61D 65 23.66 59.43 4.13 15.36 12.75 28.11E 75 27.31 65.17 4.60 15.69 13.92 29.61F 85 30.97 70.91 5.09 16.02 15.08 31.10G 105 38.27 82.38 6.05 16.68 17.42 34.10
Source T E R I estimates

Petroleum pricing in India: balancing efficiency and equity18
Taking the typical barrel of consumption in India, figures 12 and13 depict the sensitivity of total excise revenue accruing to thecentral government from sale of diesel and petrol under each ofthese scenarios. The exercise illustrates that despite thegovernment’s claims that it has taken steps for rationalizing the dutystructure of petroleum, significant distortions remain, and have infact, increased over the last year. Budget 2004/05, for example,brought an increase in the specific excise duty component on dieselfrom Rs 1.5/litre to Rs 3.25/litre, ad valorem component remainingthe same, that is, eight per cent. Assuming last year’s price levels, thisalone translates into additional revenue of 7770 rupees crore to thecentral government! Add to this, additional sales tax earnings to thetune of 826 crores that would accrue to the state governments. Incase of petrol, the ad-valorem excise duty was decreased significantlyfrom previous level of 23% to 8%. However, this reduction did notbring much relief for the retail prices of petrol as the specific compo-nent was increased from 7.5 rupees/litre to 13 rupees/litre. This dutystructure translates into additional revenue of 2333 rupees crore tothe central government at last year’s price level. Besides, the stategovernment would gain from additional sales tax earnings of 364
Table 6 Various scenarios considered for sensitivity analysis
Scenario 2 Scenario 5Present Reductionstructure Scenario 4 in customs
Scenario 1 minus Scenario 3 Reduction in and excise,Assump- Present duty specific excise Pre-budget customs and nil specifiction structure component duty structure excise duty excise duty
Diesel Customs duty: Customs duty: Customs duty: Customs duty: Customs10%; excise 10%; excise 15%; excise 5%, excise duty:duty: 8% duty: 8% duty: 8% 8% + Rs 1.5/ 5%; excise+ Rs 3.25/litre + Rs 1.5/litre litre duty:5%
Petrol Customs duty: Customs duty: Customs duty: Customs duty: Customs10%, excise 10%, excise 15%, excise petrol 5%, duty:duty: 8% + duty: 8% duty: 23%+ excise duty: petrolRs 13/litre Rs 7.50/litre 8% + Rs 7.5/ 5% duty :
litre 5%
Source T E R I (2005)

19Petroleum pricing in India: balancing efficiency and equity
rupees crore. If one takes into account the significant increase incrude oil prices over the last year these figures would increasefurther.
Maintaining neutrality in central and state government revenuesGiven the present duty structure of the petroleum sector, an increasein crude oil prices leads to an increase in revenues accruing tocentral and state governments as also to the refineries. If the
Figure 12 Sensitivity of central government revenues from excise duty on diesel(million rupees)
Figure 13 Sensitivity of central government revenues from excise duty on petrol(million rupees)
Source T E R I’s analysis
Source T E R I’s analysis

Petroleum pricing in India: balancing efficiency and equity20
government did not control retail prices, disproportionately affect-ing some companies, retail price increases would need to reflectinternational price increases, and consumers would end up bearingmore than the burden of increase in the crude prices. Hence, thiscreates a need for adjusting the duty structure such that revenueaccruing to central and state governments remains constant and theentire burden of the high prices does not fall on consumers.
Stabilizing revenues of the central government is one side of thestory. For equitable burden sharing among all stakeholders it isimportant to stabilize revenues accruing to the state government.Hence when determining an equitable burden-sharing revenue/expenditure, implications to the following stakeholders are takeninto account: refiners, central government, state government, andconsumers. For determining the possible burden-sharing arrange-ments between the different stakeholders, revenues earned bycentral and state government under the prevailing duty structure atcrude oil price of 45 dollars/bbl have been assumed to be the bench-mark revenue. Sensitivity analysis was done for a range of crude oilprices keeping the revenue stream to the central and state revenueconstant. The customs duty (which is notional in reality) has alsobeen decreased to five per cent for ensuring refiners contribution inburden sharing. Consequently, adjustments in customs duty, exciseduty, and sales tax have led to decrease in the retail prices payable byconsumers. The impact of burden sharing can be appreciated fromthe fact that at 65 dollars/bbl, if there is no adjustment in the prevail-ing structure, the price to be paid by the consumer is 59.43 rupees/litre for petrol and 42.85 rupees/litre for diesel. However, if there isan equitable burden sharing between all stakeholders the pricecomes down to 55.11 rupees/litre (a decrease of 4.32 rupees/litre)and 39.06 rupees/litre (a decrease of 3.79 rupees/litre) for petrol anddiesel respectively.
Tables 7 and 8 summarize the impact on retail prices if thisburden sharing is done by all concerned stakeholders for petrol anddiesel respectively. The government may also decide to publish atable preparing consumers what price impact to expect, correspond-ing to international price changes and the consequent modificationsin excise duties and sales taxes.

21Petroleum pricing in India: balancing efficiency and equity
Tabl
e 7Re
vised
exci
se d
uty a
nd sa
les t
ax st
ruct
ure f
or m
aint
aini
ng ex
cise
reve
nue t
o ce
ntra
l gov
ernm
ent a
nd sa
les t
ax re
venu
e to
stat
e gov
ernm
ent a
t $45
/bbl
leve
l (Pe
trol)
Base
case
Revis
ed ex
cise
dut
y and
sale
s tax
stru
ctur
e for
mai
ntai
ning
exci
se re
venu
e to
cent
ral g
over
nmen
t and
sale
s tax
reve
nue
to st
ate g
over
nmen
t at $
45/b
bl le
vel (
Petro
l)
Crud
e oil p
rice
$/bb
l45
5560
6570
7580
8590
9510
010
5
Notio
nal
%10
55
55
55
55
55
5cu
stom
s dut
y
IPP
to re
finer
Rs/l
itre
19.8
622
.94
24.9
026
.87
28.8
330
.85
32.7
634
.72
36.7
738
.65
40.6
142
.57
Exci
se D
uty
Ad-v
alor
em%
86.
996.
476.
025.
635.
285
54.
474.
254.
053.
87
Spec
ific
Rs/l
itre
13.0
013
.00
13.0
013
.00
13.0
013
.00
13.0
013
.00
13.0
013
.00
13.0
013
.00
Tota
l Exc
ise
Rs/l
itre
14.7
014
.70
14.7
014
.70
14.7
014
.70
14.7
014
.70
14.7
014
.70
14.7
014
.70
Duty
Rs/M
T19
844
1984
419
844
1984
419
844
1984
419
844
1984
419
844
1984
419
844
1984
4
Sale
s Tax
%26
23.9
522
.80
21.7
620
.81
19.9
419
18.4
017
.72
17.0
816
.49
15.9
4
Rs/l
itre
9.45
9.54
9.54
9.54
9.54
9.54
9.54
9.54
9.54
9.54
9.45
9.54
Rs/M
T12
883
1288
312
883
1288
312
883
1288
312
883
1288
312
833
1288
312
833
1288
3
Earn
ings
toRs
1619
2716
1927
1619
2716
1927
1619
2716
1927
1619
2716
1927
1619
2716
1927
1619
2716
1927
cent
ral g
ovt
Mill
ion
Earn
ings
to st
ate
govt
Rs M
illio
n10
5125
1051
2510
5125
1051
2510
5125
1051
2510
5125
1051
2510
5125
1051
2510
5125
1051
25
Reta
il pric
e (wi
thou
tan
y adj
ustm
ent)
Rs/l
itre
47.8
353
.69
56.5
659
.43
62.3
65.1
768
.04
70.9
173
.77
76.6
479
.51
82.3
8
Reta
il pric
e (af
ter
burd
en sh
arin
g)Rs
/litr
e47
.83
51.1
053
.10
55.1
157
.11
59.1
861
.11
63.1
265
.12
67.1
269
.12
71.1
3
Pote
ntia
l incr
ease
in th
e ret
ail p
rice
avoi
ded*
%44
.20
39.5
937
.27
35.8
734
.54
34.2
933
.75
33.3
533
.04
32.0
832
.56
Sour
ceTE
RI’s
ana
lysi
s
If no
tiona
l par
t of t
he p
rice
build
up
is d
one
away
with
, the
reta
il pr
ice
will
com
e do
wn
by th
e Rs
4.8
4/lit
re to
Rs 1
3.64
/litr
e*
This
calc
ulat
es a
n in
crea
se in
reta
il pr
ice
due
to in
tern
atio
nal c
rude
oil
pric
es u
sing
orig
inal
IPP
form
ula
(A) a
nd re
vise
d IP
P fo
rmul
a (B
) ove
r the
bas
e ca
se. I
ncre
ase
in re
tail
pric
e av
oide
dre
pres
ents
the
ratio
(A–B
)/A.

Petroleum pricing in India: balancing efficiency and equity22
Tabl
e8
Revi
sed
exci
se d
uty
and
sale
s ta
x str
uctu
re fo
r mai
ntai
ning
exc
ise
reve
nue
to c
entr
al g
over
nmen
t and
sal
es ta
x rev
enue
to s
tate
gov
ern-
men
t at $
45/b
bl le
vel (
Die
sel)
Ba
se ca
seRe
vised
exci
se d
uty a
nd sa
les t
ax st
ruct
ure f
or m
aint
aini
ng ex
cise
reve
nue
to ce
ntra
l gov
ernm
ent a
nd sa
les t
ax re
venu
e to
stat
e gov
ernm
ent a
t $45
/bbl
leve
l (Di
esel
)
Crud
e oil
$/bb
l45
5560
6570
7580
8590
9510
010
5
Notio
nal c
usto
ms
duty
%10
55
55
55
55
55
5
IPP
to re
finer
Rs/l
itre
18.7
121
.88
23.8
625
.84
27.8
229
.81
31.7
933
.77
35.7
537
.73
39.7
241
.70
Exci
se D
uty
Ad-v
alor
em%
86.
906.
365.
895.
495.
144.
834.
564.
324.
103.
903.
72
Spec
ific
Rs/l
itre
3.25
3.25
3.25
3.25
3.25
3.25
3.25
3.25
3.25
3.25
3.25
3.25
Tota
l Exc
ise D
uty
Rs/l
itre
4.84
4.84
4.84
4.84
4.84
4.84
4.84
4.84
4.84
4.84
4.84
4.84
Rs/M
T58
6258
6258
6258
6258
6258
6258
6258
6258
6258
6258
6258
62
Sale
s Tax
%20
1816
15.4
214
.52
13.7
213
.00
12.3
511
.77
11.2
410
.75
10.3
1
Rs/l
itre
5.03
5.03
5.03
5.03
5.03
5.03
5.03
5.03
5.03
5.03
5.03
5.03
Rs/M
T60
8160
8160
8160
8160
8160
8160
8160
8160
8160
8160
8160
81
Earn
ings
toce
ntra
l gov
tRs
Mill
ion
2232
9722
3297
2232
9722
3297
2232
9722
3297
2232
9722
3297
2232
9722
3297
2232
9722
3297
Earn
ings
tost
ate g
ovt
Rs M
illio
n23
1649
2316
4923
1649
2316
4923
1649
2316
4923
1649
2316
4923
1649
2316
4923
1649
2316
49
Reta
il pric
e (wi
thou
tan
y adj
ustm
ent)
Rs/l
itre
31.7
837
.29
40.0
942
.85
45.6
148
.37
51.1
353
.88
56.6
459
.40
62.1
664
.91
Reta
il pric
e (af
ter
burd
en sh
arin
g)Rs
/litr
e31
.78
35.0
237
.04
39.0
641
.08
43.1
045
.12
47.1
549
.17
51.1
953
.21
55.2
3
Pote
ntia
l incr
ease
in th
e ret
ail
pric
e avo
ided
*%
41.3
136
.76
34.2
532
.74
31.7
431
.02
30.4
830
.06
29.7
329
.45
29.2
3
Sour
ceTE
RI’s
ana
lysi
s
If no
tiona
l par
t of t
he p
rice
build
up
is d
one
away
with
, the
reta
il pr
ice
will
com
e do
wn
by th
e Rs
5/l
itre
to R
s 15/
litre
* Th
is c
alcu
late
s an
incr
ease
in re
tail
pric
e du
e to
inte
rnat
iona
l cru
de o
il pr
ices
usi
ng o
rigin
al IP
P fo
rmul
a (A
) and
revi
sed
IPP
form
ula
(B) o
ver t
he b
ase
case
. Inc
reas
e in
reta
il pr
ice
avoi
ded
repr
esen
ts th
e ra
tio (A
–B)/
A.
23Petroleum pricing in India: balancing efficiency and equity
If notional part of the price build up is done away with, the de-crease in retail price will vary from 4.84 rupees/litre to 13.64 rupees/litre at different crude oil prices.
Impact on consumers: households
Despite any burden-sharing efforts by the government and theindustry, consumers would have to feel the impact of price increases.In the case of kerosene and LPG, the household sector is one of themajor consumers. It consumes these fuels primarily for lighting andcooking, or both. In fact, 78.8% of LPG is consumed by the domes-tic sector.
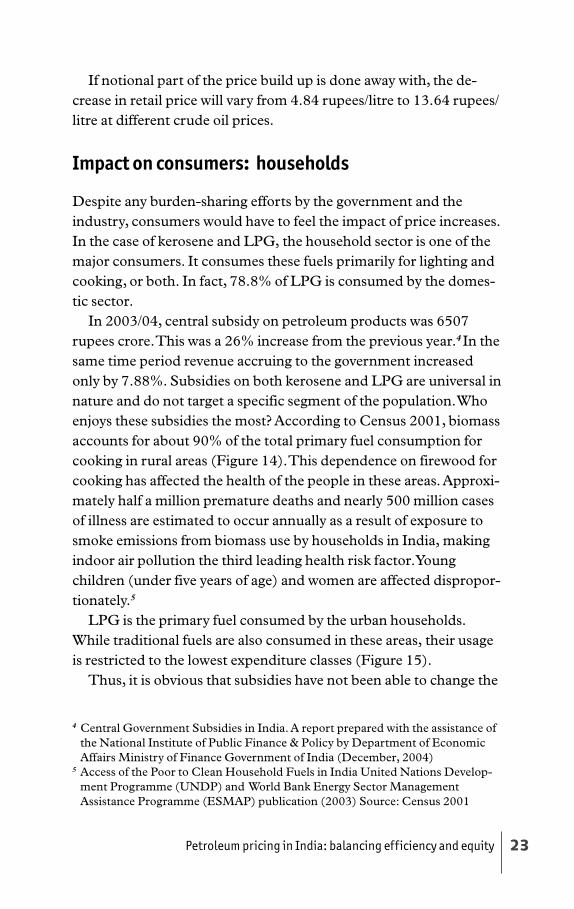
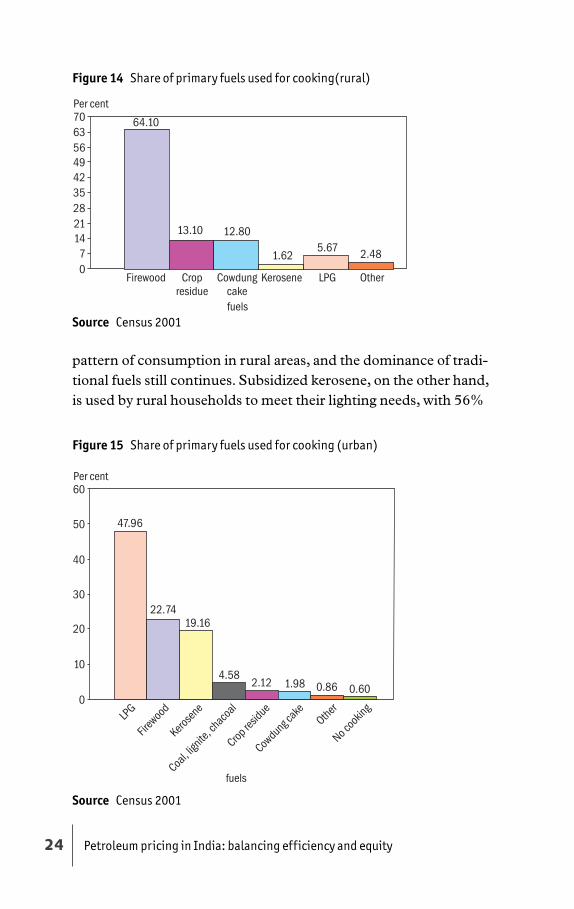
In 2003/04, central subsidy on petroleum products was 6507rupees crore. This was a 26% increase from the previous year.4 In thesame time period revenue accruing to the government increasedonly by 7.88%. Subsidies on both kerosene and LPG are universal innature and do not target a specific segment of the population. Whoenjoys these subsidies the most? According to Census 2001, biomassaccounts for about 90% of the total primary fuel consumption forcooking in rural areas (Figure 14). This dependence on firewood forcooking has affected the health of the people in these areas. Approxi-mately half a million premature deaths and nearly 500 million casesof illness are estimated to occur annually as a result of exposure tosmoke emissions from biomass use by households in India, makingindoor air pollution the third leading health risk factor. Youngchildren (under five years of age) and women are affected dispropor-tionately.5
LPG is the primary fuel consumed by the urban households.While traditional fuels are also consumed in these areas, their usageis restricted to the lowest expenditure classes (Figure 15).
Thus, it is obvious that subsidies have not been able to change the
4 Central Government Subsidies in India. A report prepared with the assistance ofthe National Institute of Public Finance & Policy by Department of EconomicAffairs Ministry of Finance Government of India (December, 2004)
5 Access of the Poor to Clean Household Fuels in India United Nations Develop-ment Programme (UNDP) and World Bank Energy Sector ManagementAssistance Programme (ESMAP) publication (2003) Source: Census 2001
Petroleum pricing in India: balancing efficiency and equity24
pattern of consumption in rural areas, and the dominance of tradi-tional fuels still continues. Subsidized kerosene, on the other hand,is used by rural households to meet their lighting needs, with 56%
Figure 14 Share of primary fuels used for cooking(rural)
Figure 15 Share of primary fuels used for cooking (urban)
Source Census 2001
Source Census 2001

25Petroleum pricing in India: balancing efficiency and equity
6 Census 2001
Figure 16 Share of primary fuels used for lighting (rural)
depending on kerosene as a primary fuel for meeting lighting re-quirements6 (Figure 16).
Figure 17 depicts the pattern of consumption of kerosene andLPG across various expenditure classes and the source of supply inthe rural areas. It is clearly visible that kerosene is the dominant fuelover all expenditure classes. Whereas kerosene distributed throughthe PDS is subsidized, kerosene distributed through the parallelmarketing system is not. Thus it is apparent that PDS kerosene is
Figure 17 Consumption of fuels per household- Rural
Source Census 2001
Source NSSO 55th Round (Report 461 and 471) and Planning Commission

Petroleum pricing in India: balancing efficiency and equity26
unable to meet the needs of the lowest-income classes while it isavailable to the higher-income classes. However, the important pointis that this kerosene is being used to meet lighting requirements in avery inefficient manner. If the kerosene were to be used for cooking,it has been estimated that around 26 kgs of kerosene per householdper month would suffice (Advisory Board on Energy 1985).
The consumption pattern of LPG is highly skewed towards thehigher expenditure classes in the rural areas. In fact, expenditureclasses below 420 MPCE7 do not consume LPG at all. This wouldcorrespond to a monthly household income of around 2100 rupees,assuming there are no savings. The rural poverty line in India is set at1637.808 rupees per household. An alternative method for estimat-ing the poverty line in India is based on the minimum calorificintake.9 In rural areas this is equivalent to 2400 kcal and 2100 kcal inurban areas. These correspond to higher MPCE class 525–615,where again consumption of LPG is marginal. LPG consumptionincreases rapidly at household income levels of greater than Rs 3000per month.
Even in the urban areas (Figure 18), LPG consumption increasessignificantly above the same MPCE class as in rural areas, but thequantities consumed are much larger, and therefore, the subsidybenefits in urban areas are much larger. Using the underlying data, itcan be deduced that 76% of the LPG subsidy goes to urban areaswith 25% of total population, and that 52% of this urban subsidy is
7 The household consumption analysis is based on the data provided under theNational Sample Survey (NSS) 55th Round (July 1999–June 2000) conductedby National Sample Survey Organisation (NSSO). The analysis of householdconsumption is based on Monthly per capita consumer expenditure (MPCE).The survey takes consumption expenditure as a proxy to the income levelsMPCE for a household is equivalent to its consumer expenditure over a period of30 days divided by its size. A person’s MPCE is understood as that of thehousehold to which he/she belongs.
8 According to Planning Commission estimates poverty line is around Rs 327.56per person. (Dhongde S. Decomposing Spatial Differences in Poverty inIndia) Research Paper No. 2004/53 WIDER (World Institute for DevelopmentEconomic Research). We have assumed an average household size of 5. http://www.wider.unu.edu/publications/rps/rps2004/rp2004–053.pdf.
9 Calorific intakes are mentioned in the NSS 55th round Report 471. (http://gamma.nic.fi/~otammile/povindia.htm)

27Petroleum pricing in India: balancing efficiency and equity
enjoyed by top 27% of households. In other words, nearly 40% ofthe LPG subsidy is enjoyed by top 6.75 % of the population! It alsoneeds to be noted that, for this segment of the population, the LPGsubsidy constitutes less than two per cent of their monthly house-hold expenditure at a crude price of 45 dollars and less than four percent at a crude price of 65 dollars!!
In the urban areas, per household monthly consumption ofkerosene is nearly double that required for cooking. While it is statedthat kerosene in the urban areas is also primarily used for lightingpurposes, it is apparent that a significant percentage of this is findingits way into the black market for adulteration purposes.
The cost of adulteration
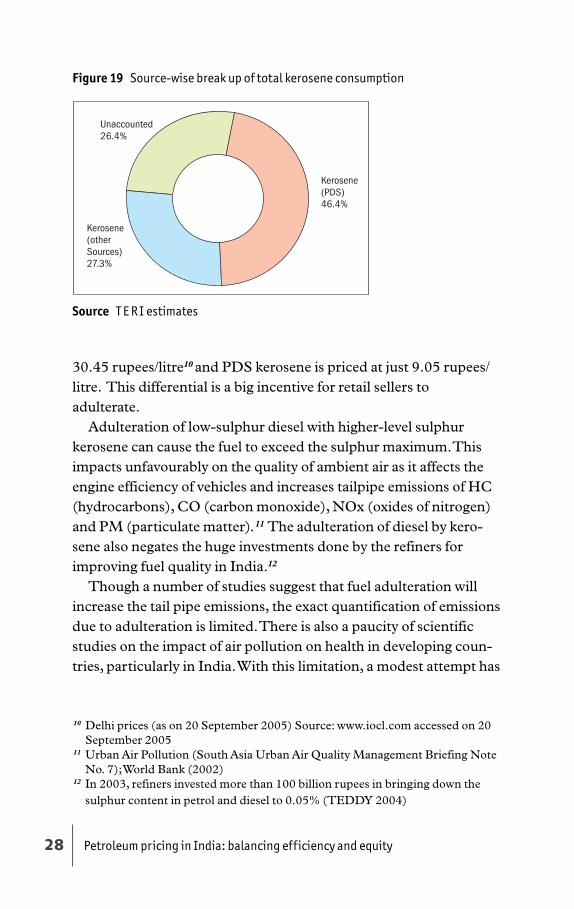
Based on the NSSO data, TERI estimates that around 26% of thetotal kerosene consumed in the country cannot be accounted for(Figure 19). (In a recent study NCAER [National Council of Ap-plied Economic Research] has put this figure at 40%.)
It is believed that the kerosene that is siphoned off is used foradulterating diesel, used as a transportation fuel, and in pumpsets/gensets in rural areas. A key reason for adulteration is the pricedifference between diesel and kerosene. At present diesel is priced at
Figure 18 Consumption of fuels per household (urban)
Source NSSO 55th Round (Reports 461 and 471) and Planning Commission
Petroleum pricing in India: balancing efficiency and equity28
30.45 rupees/litre10 and PDS kerosene is priced at just 9.05 rupees/litre. This differential is a big incentive for retail sellers toadulterate.
Adulteration of low-sulphur diesel with higher-level sulphurkerosene can cause the fuel to exceed the sulphur maximum. Thisimpacts unfavourably on the quality of ambient air as it affects theengine efficiency of vehicles and increases tailpipe emissions of HC(hydrocarbons), CO (carbon monoxide), NOx (oxides of nitrogen)and PM (particulate matter).11 The adulteration of diesel by kero-sene also negates the huge investments done by the refiners forimproving fuel quality in India.12
Though a number of studies suggest that fuel adulteration willincrease the tail pipe emissions, the exact quantification of emissionsdue to adulteration is limited. There is also a paucity of scientificstudies on the impact of air pollution on health in developing coun-tries, particularly in India. With this limitation, a modest attempt has
Figure 19 Source-wise break up of total kerosene consumption
10 Delhi prices (as on 20 September 2005) Source: www.iocl.com accessed on 20September 2005
11 Urban Air Pollution (South Asia Urban Air Quality Management Briefing NoteNo. 7); World Bank (2002)
12 In 2003, refiners invested more than 100 billion rupees in bringing down thesulphur content in petrol and diesel to 0.05% (TEDDY 2004)
Source T E R I estimates
29Petroleum pricing in India: balancing efficiency and equity
been made to get preliminary estimates of increase in emissions ofpollutants due to adulteration in the transport sector and the healthrisks associated with it, particularly the effect of PM on prematuremortality. Here we adopted exposure effectiveness approach anddose response function reported in the literature (Kandlikar andRamachandran 2000, Ostro 1994)13 and applied it to the city ofMumbai.
Major steps involved in the estimation of overall impact aresummarized below.
Fuel consumption × Emission factor = emissions/year ......................... (1)
Emissions/year × Exposure effectiveness = exposure impact
(exposure/year) .................................................................................. (2)
Excess mortality = dose response function × change in exposure unit ×crude mortality rate × exposed population .................................. (3)
Available information suggests that adulteration generally occursin three-wheelers and trucks, and often as much as 20%–30%(ESMAP 2002*). Lower and upper bound of damage due to adul-teration have been made conservatively. In the lower bound case ithas been assumed that the relative change in the emission factor dueto adulteration is about 20%, and in the upper bound the relativechange in emission factor is considered to be 50%.
With the above conservative assumptions, the estimates of theresulting change in particulate emissions vary from three per cent tosix per cent. Translated into concentration and exposure terms, thehealth damage due to adulteration could result in an additional 200cases of mortality with the lower-bound estimate, and as high as anadditional 600 cases of mortality in case of upper bound for the cityof Mumbai alone!
13 Kandilkar M, Ramachandran G. 2000.The Causes and Consequences of Particulate Air Pollution in UrbanIndia: A Synthesis of the Science.
* ESMAP, 2002. Catching gasoline and diesel adulteration South Asia UrbanAir Quality Management Briefing Note No. 7. World Bank.
Petroleum pricing in India: balancing efficiency and equity30
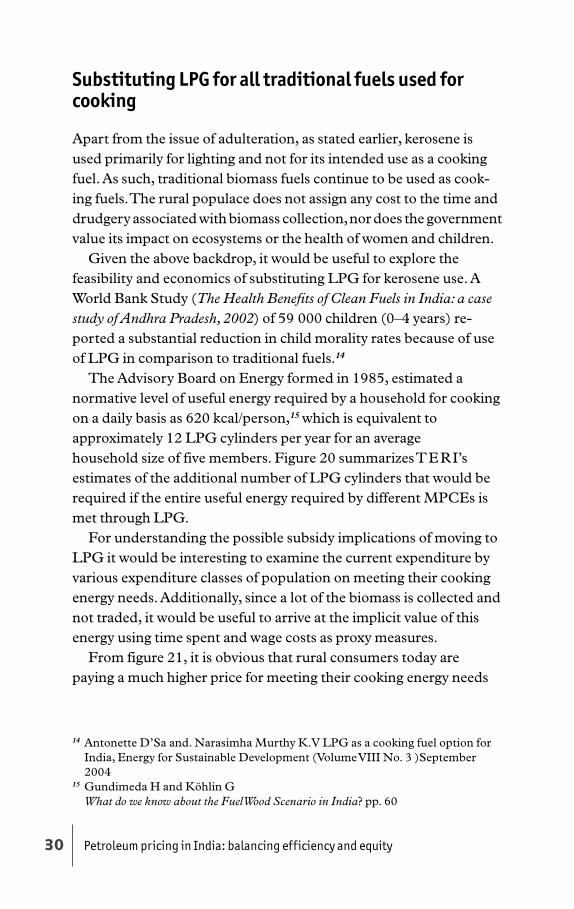
Substituting LPG for all traditional fuels used forcooking
Apart from the issue of adulteration, as stated earlier, kerosene isused primarily for lighting and not for its intended use as a cookingfuel. As such, traditional biomass fuels continue to be used as cook-ing fuels. The rural populace does not assign any cost to the time anddrudgery associated with biomass collection, nor does the governmentvalue its impact on ecosystems or the health of women and children.
Given the above backdrop, it would be useful to explore thefeasibility and economics of substituting LPG for kerosene use. AWorld Bank Study (The Health Benefits of Clean Fuels in India: a casestudy of Andhra Pradesh, 2002) of 59 000 children (0–4 years) re-ported a substantial reduction in child morality rates because of useof LPG in comparison to traditional fuels.14
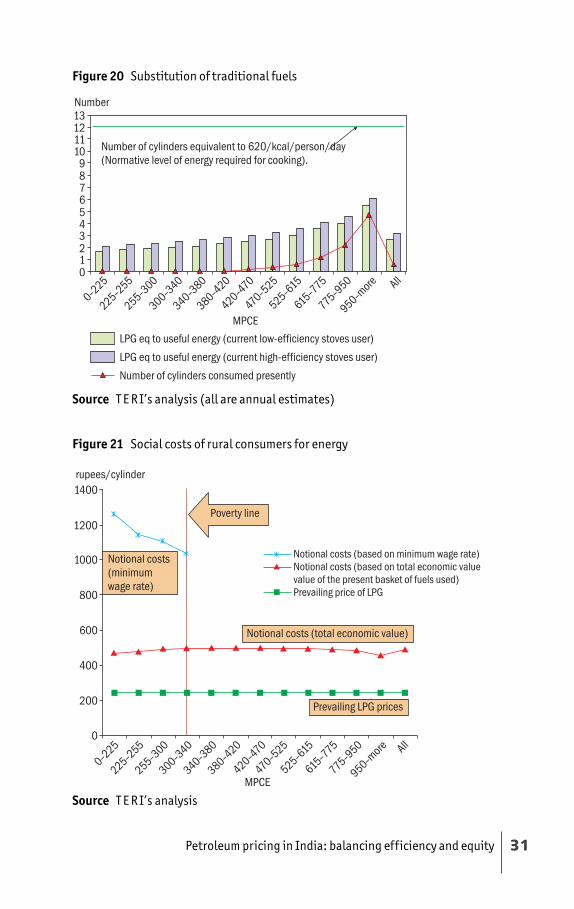
The Advisory Board on Energy formed in 1985, estimated anormative level of useful energy required by a household for cookingon a daily basis as 620 kcal/person,15 which is equivalent toapproximately 12 LPG cylinders per year for an averagehousehold size of five members. Figure 20 summarizes TERI’sestimates of the additional number of LPG cylinders that would berequired if the entire useful energy required by different MPCEs ismet through LPG.
For understanding the possible subsidy implications of moving toLPG it would be interesting to examine the current expenditure byvarious expenditure classes of population on meeting their cookingenergy needs. Additionally, since a lot of the biomass is collected andnot traded, it would be useful to arrive at the implicit value of thisenergy using time spent and wage costs as proxy measures.
From figure 21, it is obvious that rural consumers today arepaying a much higher price for meeting their cooking energy needs
14 Antonette D’Sa and. Narasimha Murthy K.V LPG as a cooking fuel option forIndia, Energy for Sustainable Development (Volume VIII No. 3 )September2004
15 Gundimeda H and Köhlin GWhat do we know about the Fuel Wood Scenario in India? pp. 60
31Petroleum pricing in India: balancing efficiency and equity
Figure 21 Social costs of rural consumers for energy
Figure 20 Substitution of traditional fuels
Source T E R I’s analysis (all are annual estimates)
Source T E R I’s analysis

Petroleum pricing in India: balancing efficiency and equity32
than if they were to use LPG for the purpose. Unfortunately, thepeople of India have been conditioned to expect subsidies on LPGprices.
Implications of phasing out kerosene production
In 2004/05, total subsidy on PDS kerosene, including actual pay-ments released from the union budget and the under recoveriessustained by OMCs on supply of PDS kerosene, was over 10 000rupees crore. Phasing out production of kerosene would have twobenefits: one, it will lead to huge savings arising from avoided cost ofsubsidy; two, it would translate into additional revenue accruingfrom excise duty and sales tax on the incremental production ofdiesel and ATF. Even at crude oil price of 45 dollars/bbl, thisamounts to 9644 rupees crore! Assuming 2004/05 sales levels,figure 22 shows sensitivity of this additional revenue to crude oilprice level.
The total amount, both from avoided cost of kerosene subsidyand from the additional revenues, is considerable and can instead bechannelled into provision of more efficient sources of energy such asLPG.
Source TERI estimates
Figure 22 Additional revenue accruing from diesel and aviation turbine fuel bystopping current kerosene production (crore rupees)
33Petroleum pricing in India: balancing efficiency and equity
Smart cards for delivery of energy subsidies
Smart cards are emerging as an effective tool for efficient deliverymechanism in a range of applications (Box 1). Use of smart cardscan also be used to effectively target energy subsidies. The subsidieson both LPG (for cooking needs) and electricity (for light and otherneeds) can be provided through smart cards. They can be designedto maintain personal identity and benefit eligibility details fortargeted beneficiaries of energy subsidies. The cards would also holdinformation on beneficiary’s transaction histories, which wouldmake it much easier to track the pattern and extent of subsidyutilization. This would also help in tracking any fraud in use ofallocated energy subsidies. The card could be renewed on an annualor monthly basis.
Box 1 Smart cards for smart subsidies
Internationally, there are several successful examples of use of smart cards forefficient delivery of a range of services. In 2002, the Moscow Social Card wasofficially launched as the world’s first integrated benefits and payment card of itsscope. Moscow distributes the card to those who receive state aid, includingstudents, pensioners, public employees, members of the armed forces, and thosewho traditionally benefit from reduced or free prices for goods and services,including Moscow’s underground system. Beneficiaries use the card for publictransit, health and medical insurance, access to government subsidies, anddiscounts from participating retail stores. In India itself several applications ofsmart cards are underway. These include provision of microfinance by SKS(Swayam Krishi Sangam) in the Medak district of Andhra Pradesh and SmartPrepaid Cards for electricity in Sundarbans. Tenth Five-year Plan also talks aboutthe need for restructuring PDS by exploring innovative approaches such as smartcards to eliminate hunger and make food available to the poor in a cost-effectivemanner.Source T E R I compilation
At this stage, a pilot project for introduction of smart cards fordelivery of energy subsidies should be undertaken on a prioritybasis. This would call for a proactive approach to bring togethersuitable government agencies, a card manufacturer, a bank withstrong rural network since, and NGO partners. In later stages, thescope of merging the scheme with other social delivery programmesfor the poor can also be explored.

Petroleum pricing in India: balancing efficiency and equity34
Summary and conclusions
1 India is today largely self-sufficient in its petroleum productproduction. Major imports are of LPG while exporting diesel,petrol, and ATF.
2 Current import parity linked pricing formula gives an advantageto domestic refineries. Internationally competitive benchmarkingwould require output price of products at refinery gate to be lessthan or equal to the FOB price. On an avoided cost basis, therefinery gate price can at best be linked to c.i.f. price of products.Today, on account of the notional cost elements inbuilt in the IPPbuild up, domestic refineries get a price that would be ~ 4.36rupees/litre higher in case of diesel and ~ 4.46 rupees/litre higherin case of petrol (at a crude price of 65 dollars/bbl), as comparedto the respective FOB prices. Even in the case of LPG and SKOthey would get a price that is ~ 57.40 rupees/14.2 kg cylinder and2.09 rupees/litre higher than the respective FOB prices.
3 Domestic petrol and diesel price increases have been extremelysluggish as compared to international prices (Figures 7 and 8),indicating that the move to distance pricing decisions frompolitical influence has failed under the current pricing formula.(1 June 2003 to 1 September 2005).
4 Contributions from POL (petroleum oil, and lubricants) tocentral government revenues have gone up from 33 806 rupeescrore in 2002/03 to 41 386 rupees crore in 2004/05, registering a22% increase! In 2004/05, 68% of this came from two products:petrol and diesel!
5 Assuming 2004/05 petroleum consumption basket, the taxstructure implemented in 2005/06 Finance Bill would add addi-tional revenues, to the tune of 11 000 rupees crore, to the centralgovernment exchequer.
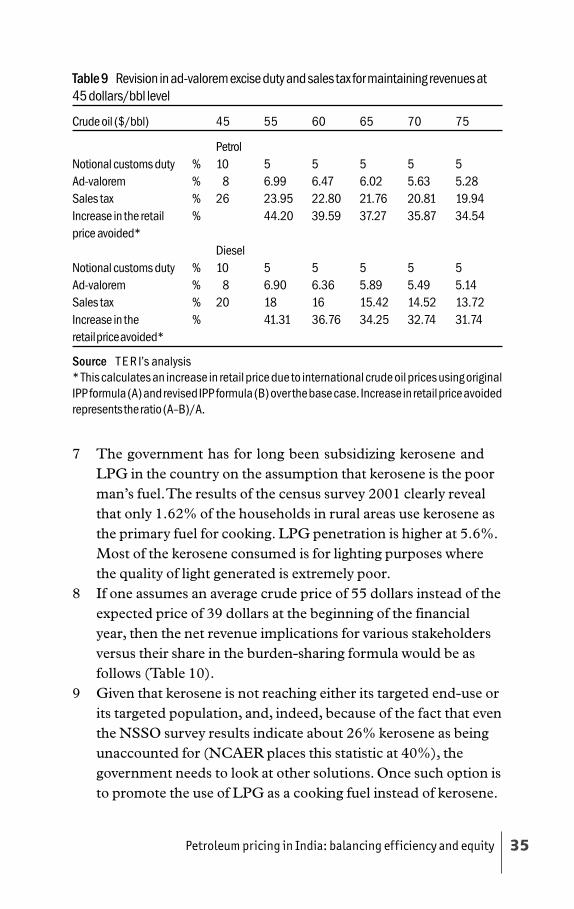
6 It is possible to devise a formula by which central and state gov-ernments could absorb part of the impact of price increases whileremaining revenue neutral. Table 9 indicates how the ad valoremcomponent of excise duties and sales tax could be reduced tomaintain revenues at levels that would accrue at a crude price of45 dollars.
35Petroleum pricing in India: balancing efficiency and equity
7 The government has for long been subsidizing kerosene andLPG in the country on the assumption that kerosene is the poorman’s fuel. The results of the census survey 2001 clearly revealthat only 1.62% of the households in rural areas use kerosene asthe primary fuel for cooking. LPG penetration is higher at 5.6%.Most of the kerosene consumed is for lighting purposes wherethe quality of light generated is extremely poor.
8 If one assumes an average crude price of 55 dollars instead of theexpected price of 39 dollars at the beginning of the financialyear, then the net revenue implications for various stakeholdersversus their share in the burden-sharing formula would be asfollows (Table 10).
9 Given that kerosene is not reaching either its targeted end-use orits targeted population, and, indeed, because of the fact that eventhe NSSO survey results indicate about 26% kerosene as beingunaccounted for (NCAER places this statistic at 40%), thegovernment needs to look at other solutions. Once such option isto promote the use of LPG as a cooking fuel instead of kerosene.
Table 9 Revision in ad-valorem excise duty and sales tax for maintaining revenues at45 dollars/bbl level
Crude oil ($/bbl) 45 55 60 65 70 75
PetrolNotional customs duty % 10 5 5 5 5 5Ad-valorem % 8 6.99 6.47 6.02 5.63 5.28Sales tax % 26 23.95 22.80 21.76 20.81 19.94Increase in the retail % 44.20 39.59 37.27 35.87 34.54price avoided*
DieselNotional customs duty % 10 5 5 5 5 5Ad-valorem % 8 6.90 6.36 5.89 5.49 5.14Sales tax % 20 18 16 15.42 14.52 13.72Increase in the % 41.31 36.76 34.25 32.74 31.74retail price avoided*
Source T E R I’s analysis* This calculates an increase in retail price due to international crude oil prices using originalIPP formula (A) and revised IPP formula (B) over the base case. Increase in retail price avoidedrepresents the ratio (A–B)/A.

Petroleum pricing in India: balancing efficiency and equity36
10 The end-use of lighting can be met through the implementa-tion of the government’s target of a 100% household electrifi-cation by 2010. Even if this target is underachieved in terms ofactual supply, it may be worthwhile to consider marketing solarlanterns for meeting this demand— not only would the qualityof light be better but the pollution and fire risks would be lowertoo. The lowest expenditure class households in rural areasspend 200 rupees per annum per household (net of subsidiesof close to 450 rupess provided by government) to meet theircurrent lighting needs. A 5Wp solar lantern, that would givethe light quality of a 40 watt bulb, would have an annualizedcost of approx 500 rupees. If the government was to subsidizesolar lanterns instead of providing kerosene, they could have anet saving of 150 rupees per household per annum whileproviding better quality service. As we move up the expendi-ture scale, the net savings to the government could increasesubstantially. If the government were, instead, to provide a freesolar lantern to each of the households comprising the 57%population with no access to electricity the annualized subsidyburden would amount to only 3796 rupees crore (point 3 inTable 11).
11 As far as cooking needs are concerned, the government needs totarget provision of LPG for atleast all non-slum urban house-holds (currently 48% of urban households use LPG as primarycooking fuel), and for that section of rural households that seem
Table 10 Burden-sharing
Incremental revenue due to Contribution to burden-international price increase sharingduring the year (Rs crore) (Rs crore)
Upstream companies 17 000 13 000–14 000Refinery sector –Total 6 500 1200–1500
(stand alone andprivate refiners)
Government (Central + State) 19 000 12 000(oil bonds)
Source T E R I’s analysis

37Petroleum pricing in India: balancing efficiency and equity
to be inclined to use LPG. LPG penetration in rural areasstarts at the expenditure level of above 470 rupees per capitaper month. The households above this expenditure level consti-tute 45% of rural households. At a crude price of 45 dollars/bbl,the subsidy cost of catering LPG to this target of householdswould amount to 11 185 rupees crore (point 4 in Table 11). Onthe other hand, if we were to stop production (and hence alsosubsidization) of kerosene and produce higher amounts ofdiesel or ATF, the net incremental revenue generation of thegovernment would be 19 644 rupees crore (sum of points 1and 2 in Table 11).
12 If, one was to recognize that the LPG subsidy benefits are todayprimarily going to the richer segments of society (40% subsidygoes to top 6.75% of households!) for whom the subsidy amountconstitutes less than 2% of their expenditure, then the rationalefor an LPG subsidy – both for rural and urban consumers –becomes suspect. As such, if the households identified in para-graph 10 were to pay the full cost of LPG, then the savings identi-fied could be used to extend LPG support to the uncoveredsegments. Ensuring that these households do not expend morethan 10% of their total monthly expenditure on energy, assumingthat the cooking energy needs of these households could be metwith half the energy needed by higher income households, at acrude price of 45 dollars, the required subsidy would be 13 675
Table 11 Utilization of funds earned through kerosene subsidy avoided andadditional tax revenues earned from other petroleum products (diesel, ATF)
$45/bbl $65/bbl(Rs crore) (Rs crore)
1 Kerosene subsidy avoided 10 000 * 15 0002 Tax revenues from other products 9 644 13 3353 Cost of solar lanterns subsidy 3 796 3 7964 Cost of LPG subsidy – Fixed subsidy based on
current price levels 11 185 21 9015 Cost of LPG Subsidy- supply to presently
un-served population 13 675 20 050
Source T E R I’s analysis* Total subsidy on kerosene for 2004/05 (includes government subsidy and underrecoveries)
Petroleum pricing in India: balancing efficiency and equity38
rupees crore (point 5 in Table 11). Thus after providing for thesolar lanterns (para 9) and LPG to the targeted populations, thegovernment would still be revenue positive!
13 The key to all the above, of course, is an effective deliverymechanism. Technological advancements today would makepossible a more effective delivery of required subsidy. Thegovernment could devise a system of energy debit cards (theequivalent of a prepaid telephone card) which could be issued tothe targeted households with a monthly expense limit. This debitcard could be used to procure solar lanterns or LPG cylinderswithout engaging in a cash transaction. Companies or financialinstitutions could recover these amounts from the governmentalso enabling much better account keeping. This would alsoeliminate the need to have a dual pricing system as in effect thereis a direct subsidy that would be provided to the poor.

About TERIA dynamic and flexible organization with a global vision and a local focus, TERI was established in 1974.
While in the initial period the focus was mainly on documentation and information dissemination, research activities in the fields of energy, environment, and sustainable development were initiated towards the end of 1982. The genesis of these activities lay in TERI's firm belief that efficient utilization of energy, sustainable use of natural resources, large-scale adoption of renewable energy technologies, and reduction of all forms of waste would move the process of development towards the goal of sustainability.
A unique developing-country institution, TERI is deeply committed to every aspect of sustainable development. From providing environment-friendly solutions to rural energy problems to helping shape the development of the Indian oil and gas sector; from tackling global climate change issues across many continents to enhancing forest conservation efforts among local communities; from advancing solutions to growing urban transport and air pollution problems to promoting energy efficiency in the Indian industry, the emphasis has always been on finding innovative solutions to make the world a better place to live in. However, while TERI's vision is global, its roots are firmly entrenched in Indian soil. All activities in TERI move from formulating local- and national-level strategies to suggesting global solutions to critical energy and environment-related issues. It is with this purpose that TERI has established regional centres in Bangalore, Goa, and Guwahati, and a presence in Japan, Malaysia, and the UAE. It has set up affiliate institutesTERI-North America in Washington, DC, USA, and TERI-Europe in London, UK.
TERI hosts the annual Delhi Sustainable Development Summit, which is swiftly gathering momentum as a major forum for the convergence of globally renowned leaders and thinkers dealing with the issue of sustainability.
With a staff strength of over 650, drawn from multidisciplinary and highly specialized fields, offices and regional centres equipped with state-of-the-art facilities, and a diverse range of activities, TERI is the largest developing-country institution working to move human society towards a sustainable future. TERI makes effective use of the latest developments in modern information technology in both its in-house and outreach activities.
TERI lays great emphasis on training, capacity building, and education. In 1999, it set up the TERI School of Advanced Studies, recognized as a deemed university by the University Grants Commission, India. The TERI School is evolving as a research university, offering doctoral and master's programmes in bioresources, biotechnology, energy, environment, and regulatory and policy studies.
Having celebrated its silver jubilee in February 2000, TERI is now poised for future growth, driven by a global vision and outreach, with a philosophy that assigns primacy to enterprise in government, industry, and individual actions.