petrochina company limited...overseas wholly-owned subsidiary of cnpc. on july 13, 2016, the...
TRANSCRIPT

1
Hong Kong Exchanges and Clearing Limited and The Stock Exchange of Hong Kong Limited take no responsibility for the
contents of this announcement, make no representation as to its accuracy or completeness and expressly disclaim any liability
whatsoever for any loss howsoever arising from or in reliance upon the whole or any part of the contents of this announcement.
PETROCHINA COMPANY LIMITED
(A joint stock limited company incorporated in the People’s Republic of China with limited liability)
(Hong Kong Stock Exchange Stock Code: 857; Shanghai Stock Exchange Stock Code: 601857)
ANNOUNCEMENT
Third Quarterly Report of 2016
1. Important Notice
1.1 The Board of Directors of PetroChina Company Limited (the “Company”), the
Supervisory Committee and the Directors, Supervisors and Senior Management of the
Company warrant that there are no material omissions from, or misrepresentation or
misleading statements contained in this quarterly report, and jointly and severally accept
full responsibility for the truthfulness, accuracy and completeness of the information
contained in this quarterly report.
1.2 This quarterly report has been approved at the sixth meeting of the Board of Directors
of the Company in 2016 (extraordinary). All Directors participated in the meeting of the
Board of Directors.
1.3 Mr. Wang Yilin, Chairman of the Board of the Company, Mr. Wang Dongjin, Vice
Chairman of the Board of the Company and President of the Company, and Mr. Zhao
Dong, Chief Financial Officer of the Company, warrant the truthfulness, accuracy and
completeness of the financial statements set out in this quarterly report.
1.4 The financial statements of the Company and its subsidiaries (the “Group”) have been
prepared in accordance with the China Accounting Standards (“CAS”) and the
International Financial Reporting Standards (“IFRS”), respectively. The financial
statements set out in this quarterly report are unaudited.

2
2. Basic Information of the Company
2.1 Key Financial Data and Financial Indicators
2.1.1 Key Financial Data and Financial Indicators Prepared under IFRS
Unit: RMB Million
Items
As at the end of
the reporting
period
As at the end of
the preceding
year
Changes from the end of the
preceding year to the end of the
reporting period (%)
Total assets 2,405,704 2,393,844 0.5
Equity attributable to
owners of the Company 1,181,910 1,179,716 0.2
Items
From the beginning of the
year to the end of
the reporting period
Changes over the
same period of the
preceding year (%)
Net cash flows from
operating activities 190,917 (4.2)
Unit: RMB Million
Items
For the three months ended
September 30
(July-September)
For the nine months ended
September 30
(January-September)
2016 2015
Changes over
the same period
of the preceding
year (%)
2016 2015
Changes over
the same period
of the preceding
year (%)
Revenue 411,370 427,481 (3.8) 1,150,437 1,305,105 (11.9)
Profit attributable to
owners of the
Company 1,200 5,195 (76.9) 1,731 30,601 (94.3)
Return on net assets
(%) 0.1 0.4
(0.3)
Percentage
point 0.1 2.6
(2.5)
Percentage
points
Basic earnings per
share (RMB) 0.01 0.03 (76.9) 0.01 0.17 (94.3)
Diluted earnings per
share (RMB) 0.01 0.03 (76.9) 0.01 0.17 (94.3)

3
2.1.2 Key Financial Data and Financial Indicators Prepared under CAS
Unit: RMB Million
Items
As at the end of
the reporting period
As at the end of
the preceding
year
Changes from the end of the
preceding year to the end of the
reporting period (%)
Total assets 2,405,988 2,394,094 0.5
Equity attributable to
equity holders of the
Company 1,182,176 1,179,968 0.2
Items
From the beginning of the year to
the end of the reporting period
Changes over the same period of
the preceding year (%)
Net cash flows from
operating activities 190,917 (4.2)
Unit: RMB Million
Items
For the three months ended
September 30
(July-September)
For the nine months ended
September 30
(January-September)
2016 2015
Changes over
the same period
of the preceding
year (%)
2016 2015
Changes over
the same period
of the preceding
year (%)
Operating income 411,370 427,481 (3.8) 1,150,437 1,305,105 (11.9)
Net profit attributable to
equity holders of the
Company 1,196 5,194 (77.0) 1,724 30,598 (94.4)
Net profit/(loss) after
deducting non-recurring
profit/loss items
attributable to equity
holders of the Company 448 5,462 (91.8) (9,043) 31,310 -
Weighted average return
on net assets (%) 0.1 0.4
(0.3)
Percentage
point 0.1 2.6
(2.5)
Percentage
points
Basic earnings per share
(RMB) 0.01 0.03 (77.0) 0.01 0.17 (94.4)
Diluted earnings per share
(RMB) 0.01 0.03 (77.0) 0.01 0.17 (94.4)
4
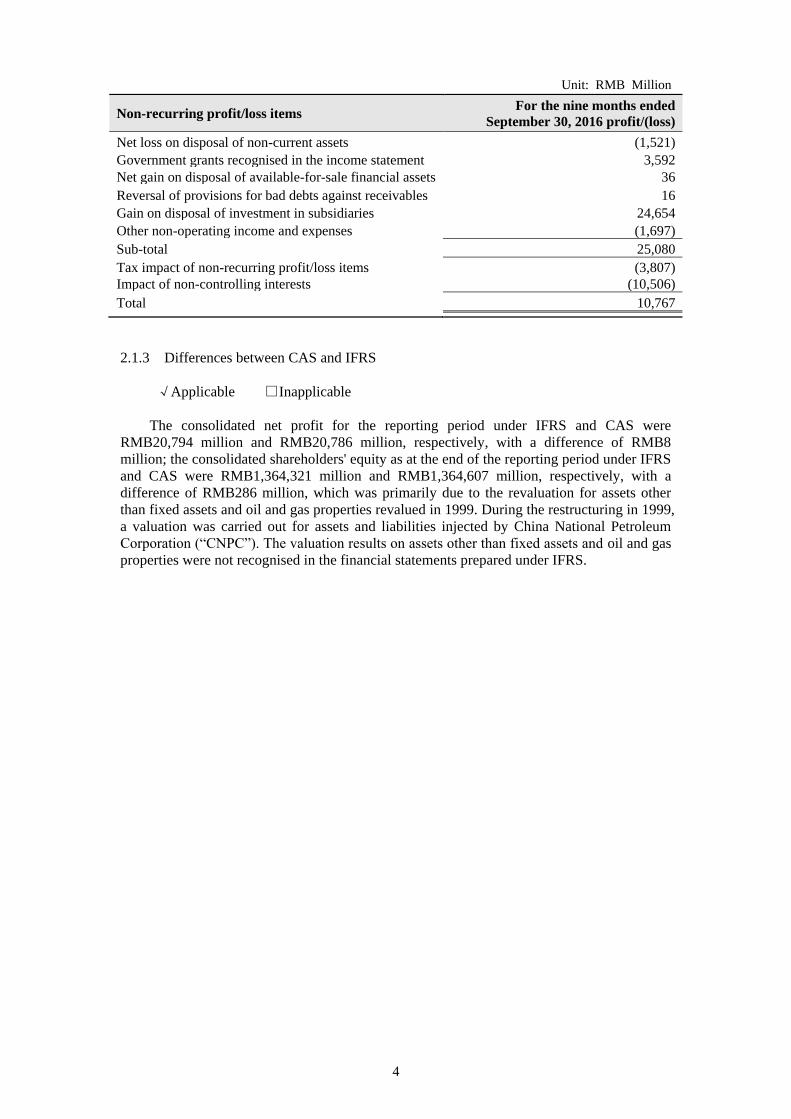
Unit: RMB Million
Non-recurring profit/loss items For the nine months ended
September 30, 2016 profit/(loss)
Net loss on disposal of non-current assets (1,521)
Government grants recognised in the income statement 3,592
Net gain on disposal of available-for-sale financial assets 36
Reversal of provisions for bad debts against receivables 16
Gain on disposal of investment in subsidiaries 24,654
Other non-operating income and expenses (1,697)
Sub-total 25,080
Tax impact of non-recurring profit/loss items (3,807)
Impact of non-controlling interests (10,506)
Total 10,767
2.1.3 Differences between CAS and IFRS
√Applicable □Inapplicable
The consolidated net profit for the reporting period under IFRS and CAS were
RMB20,794 million and RMB20,786 million, respectively, with a difference of RMB8
million; the consolidated shareholders' equity as at the end of the reporting period under IFRS
and CAS were RMB1,364,321 million and RMB1,364,607 million, respectively, with a
difference of RMB286 million, which was primarily due to the revaluation for assets other
than fixed assets and oil and gas properties revalued in 1999. During the restructuring in 1999,
a valuation was carried out for assets and liabilities injected by China National Petroleum
Corporation (“CNPC”). The valuation results on assets other than fixed assets and oil and gas
properties were not recognised in the financial statements prepared under IFRS.

5
2.2 Number of Shareholders, Shareholdings of Top Ten Shareholders of Shares without
Selling Restrictions and Shareholdings of Top Ten Shareholders as at the end of the
Reporting Period
Number of shareholders as at
the end of the reporting period
591,681 shareholders including 584,411 holders of A shares and
7,270 holders of H shares (including 231 holders of the
American Depository Shares)
Shareholdings of the top ten shareholders of shares without selling restrictions
Name of shareholders Number of
shares held
Type of
shares
1 CNPC 157,409,693,528 (1) A shares
2 HKSCC Nominees Limited(2) 20,853,237,386 (3) H shares
3 China Securities Finance Corporation Limited 1,131,911,498 A shares
4 Baosteel Group Corporation 624,000,000 A shares
5 Central Huijin Asset Management Co., Ltd. 206,109,200 A shares
6 Hong Kong Securities Clearing Company Limited (4) 37,864,935 A shares
7 Industrial and Commercial Bank of China Limited-Shanghai
50 Index ETF Securities Investment Fund 35,636,403 A shares
8 China Life Insurance Company Limited-dividend-individual
dividend-005L-FH002 Shanghai 22,132,986 A shares
9 China Construction Bank Corporation-Shanghai 180 Index
ETF Securities Investment Fund 13,568,056 A shares
10 Quanzheng (Shanghai) Investment Management Centre
(Limited Partnership)-Quanzheng No.1 Fund 12,515,328 A shares
Shareholdings of the top ten shareholders of shares
Name of shareholders Number of
shares held
Type of
shares
1 CNPC 157,409,693,528 A shares
2 HKSCC Nominees Limited 20,853,237,386 H shares
3 China Securities Finance Corporation Limited 1,131,911,498 A shares
4 Baosteel Group Corporation 624,000,000 A shares
5 Central Huijin Asset Management Co., Ltd. 206,109,200 A shares
6 Hong Kong Securities Clearing Company Limited 37,864,935 A shares
7 Industrial and Commercial Bank of China Limited-Shanghai
50 Index ETF Securities Investment Fund 35,636,403 A shares
8 China Life Insurance Company Limited-dividend-individual
dividend-005L-FH002 Shanghai 22,132,986 A shares
9 China Construction Bank Corporation-Shanghai 180 Index
ETF Securities Investment Fund 13,568,056 A shares
10 Quanzheng (Shanghai) Investment Management Centre
(Limited Partnership)-Quanzheng No.1 Fund 12,515,328 A shares
Statement on the connection or activities acting in concert among the above-mentioned shareholders:
Except for HKSCC Nominees Limited and Hong Kong Securities Clearing Company Limited,
both of which are wholly-owned subsidiaries of Hong Kong Exchanges and Clearing Limited, and
China Securities Finance Corporation Limited and Central Huijin Asset Management Co., Ltd, both
of which are holders of ordinary shares of Industrial and Commercial Bank of China Limited, China
Life Insurance Company Limited and China Construction Bank Corporation, the Company is not
aware of any connection among or between the other top ten shareholders or that they are persons
acting in concert as provided for in the Measures for the Administration of Acquisitions by Listed
Companies.
Notes: (1) Such figure excludes the H shares indirectly held by CNPC through Fairy King Investments Limited, an
overseas wholly-owned subsidiary of CNPC. On July 13, 2016, the State-owned Assets Supervision and
Administration Commission of the State Council approved the gratuitous transfer of 624,000,000 A
shares of the Company, representing 0.34% of the total issued shares of the Company, from CNPC to
Baosteel Group Corporation (the “Baosteel Group”) and the registration procedures for this
gratuitous shares transfer has been completed as at the date of this announcement. After the gratuitous
shares transfer, CNPC holds 157,409,693,528 A shares of the Company, representing 86.01% of the
total issued shares of the Company; Baosteel Group holds 624,000,000 A shares of the Company,

6
representing 0.34% of the total issued shares of the Company. The details are set out in the
announcements posted by the Company on the website of Shanghai Stock Exchange (No. Lin 2016-029,
Lin 2016-033 and Lin 2016-035).
(2) HKSCC Nominees Limited is a wholly-owned subsidiary of Hong Kong Exchanges and Clearing
Limited and acts as nominee on behalf of other corporate or individual shareholders to hold the H
shares of the company.
(3) 291,518,000 H shares were indirectly held by CNPC through Fairy King Investments Limited, an
overseas wholly-owned subsidiary of CNPC, representing 0.16% of the total issued shares of the
Company. These shares were held in the name of HKSCC Nominees Limited.
(4) Hong Kong Securities Clearing Company Limited is a wholly-owned subsidiary of Hong Kong
Exchanges and Clearing Limited and it holds the A shares of the Company listed on the Shanghai Stock
Exchange and invested by investors through the Hong Kong Stock Exchange as a nominal holder.
2.3 Number of Shareholders of Preferred Shares, Shareholdings of Top Ten Shareholders of
Preferred Shares and Shareholdings of Top Ten Shareholders of Preferred Shares without
Selling Restrictions as at the end of the Reporting Period
□Applicable √Inapplicable
2.4 Business Review
In the first three quarters of 2016, the world economy recovered weakly on an unbalanced
basis with an increase in uncertainty and risks. China’s economy was generally stable but still
faced with a downward pressure. The international crude oil prices recovered with
fluctuations after touching the bottom. The average spot price of North Sea Brent crude oil and
the average spot price of the West Texas Intermediate (“WTI”) crude oil were US$41.88 per
barrel and US$41.41 per barrel respectively, representing a decrease of 24.3% and 18.7% as
compared with the same period of last year. The domestic refined oil market reflected more
competition with abundant supply. Facing the severe and complicated operating situation at
home and abroad, the Group adhered to the guidelines of developing on a prudent basis, and
continued to broaden sources of income, reduce expenditure, cut costs and enhance efficiency.
The Group achieved stable and controlled production and operation and it’s operating results
met expectations.
In respect of exploration and production, adhering to the principle of profitability, the
Group continued to optimise its domestic crude oil production plan and output structure and
pushed forward its domestic production and operation of natural gas in a steady way while
maintaining a stable growth in the output of overseas oil and gas. In the first three quarters of
2016, the crude oil output of the Group amounted to 696.6 million barrels, representing a
decrease of 3.6% as compared with the same period of last year. Of which, the domestic crude
oil output was 575.2 million barrels, representing a decrease of 5.1% as compared with the
same period of last year. The marketable natural gas output of the Group amounted to 2,428.9
billion cubic feet, representing an increase of 6.1% as compared with the same period of last
year. The oil and gas equivalent output was 1,101.5 million barrels, representing a decrease of
0.3% as compared with the same period of last year, of which the overseas oil and gas
equivalent output was 154.7 million barrels, representing an increase of 7.8% as compared
with the same period of last year. In the first three quarters of 2016, in the exploration and
production segment, the Group took proactive measures to cope with changes in the market
and oil prices, strengthened control over capital expenditures, expenses and costs, and devoted
major efforts to control and reduce losses, thus, the oil and gas lifting cost was US$11.56 per
barrel, representing a decrease of 9.9% as compared with the same period of last year. The
operating loss was RMB3,949 million, representing a profit decrease of RMB50,462 million
as compared with the operating profit of RMB46,513 million for the same period of last year,
however it was growing quarter-on-quarter.
In respect of refining and chemicals, the Group made an integrated plan in light of
profitability, market and resources. The Group kept optimising the structure of products,
increased the production of highly value-added chemical products and strengthened control
over costs and expenses, thus maintaining the tendency to make profit and increase
profitability. In the first three quarters of 2016, the Group processed 707.9 million barrels of
crude oil, representing a decrease of 4.6% as compared with the same period of last year. The
Group produced 63.669 million tons of gasoline, diesel and kerosene, representing a decrease

7
of 7.5% as compared with the same period of last year. The Group reduced the diesel to
gasoline ratio of its production down to 1.41, while the commercialised chemical products
increased by 6.6% as compared with the same period of last year. In the first three quarters of
2016, the refining and chemicals segment achieved an operating profit of RMB34,311 million,
representing an increase of RMB31,252 million as compared with the operating profit of
RMB3,059 million for the same period of last year. The refining operations achieved an
operating profit of RMB25,716 million, representing an increase of RMB24,055 million as
compared with the operating profit of RMB1,661 million for the same period of last year. The
chemicals operations achieved an operating profit of RMB8,595 million, representing an
increase of RMB7,197 million as compared with the operating profit of RMB1,398 million for
the same period of last year.
In respect of marketing, facing such challenges as the slowdown in the growth of
consumption of refined products, the downward movements of prices and fierce competition,
the Group explored multiple marketing channels, optimised its sales structure, and fully
leveraged the role of international trade in regulating resources and creating profitability. In
the first three quarters of 2016, the Group sold 118.727 million tons of gasoline, diesel and
kerosene, staying stable as compared with the same period of last year. In the first three
quarters of 2016, the marketing segment achieved an operating profit of RMB6,805 million,
representing an increase in profit of RMB7,783 million as compared with the operating loss of
RMB978 million for the same period of last year.
In respect of natural gas and pipeline, the Group cut down comprehensive purchase costs
by coordinating and optimising the utilisation of various resources as domestically produced
gas and imported gas, kept improving the operating efficiency and profitability of pipelines
network, and adjusted its marketing strategy based on seasonal factors. In the first three
quarters of 2016, as a result of the drop in natural gas prices as compared with the same period
of last year and other factors, the natural gas and pipeline segment achieved an operating
profit of RMB17,857 million, representing a decrease of 29.7% as compared with the
operating profit of RMB25,384 million for the same period of last year. In the first three
quarters of 2016, the net loss incurred from sales of imported gas and LNG in the natural gas
and pipeline segment amounted to RMB10,573 million, representing a decrease in loss of
RMB1,198 million as compared with the same period of last year.
In the first three quarters of 2016, the average realised price for crude oil of the Group
was US$35.79 per barrel, representing a drop of 30.0% as compared with the same period of
last year, of which the domestic realised price was US$35.14 per barrel; and the average
realised price for natural gas was US$4.67 per thousand cubic feet, representing a decrease
of 27.0% as compared with the same period of last year, of which the domestic realised price
was US$4.98 per thousand cubic feet.

8
Summary of Key Operating Data for the First Three Quarters of 2016
Operating Data Unit
For the nine
months ended
September 30
Changes over the
same period of the
preceding year
(%) 2016 2015
Crude oil output Million barrels 696.6 722.9 (3.6)
of which: domestic Million barrels 575.2 606.2 (5.1)
overseas Million barrels 121.4 116.7 4.0
Marketable natural gas output Billion cubic feet 2,428.9 2,289.0 6.1
of which: domestic Billion cubic feet 2,229.1 2,128.1 4.8
overseas Billion cubic feet 199.8 160.9 24.1
Oil and natural gas equivalent
output Million barrels
1,101.5 1,104.5 (0.3)
of which: domestic Million barrels 946.8 960.9 (1.5)
overseas Million barrels 154.7 143.6 7.8
Processed crude oil Million barrels 707.9 741.7 (4.6)
Gasoline, kerosene and diesel
output Thousand tons
63,669 68,802 (7.5)
of which: Gasoline Thousand tons 24,563 23,827 3.1
Kerosene Thousand tons 4,475 4,035 10.9
Diesel Thousand tons 34,631 40,940 (15.4)
Gasoline, kerosene and diesel
sales Thousand tons
118,727 119,298 (0.5)
of which: Gasoline Thousand tons 46,773 45,854 2.0
Kerosene Thousand tons 12,191 10,710 13.8
Diesel Thousand tons 59,763 62,734 (4.7)
Output of key chemical products
Ethylene Thousand tons 4,147 3,595 15.4
Synthetic resin Thousand tons 6,781 5,898 15.0
Synthetic fiber raw
materials and polymer Thousand tons
1,054 989 6.6
Synthetic rubber Thousand tons 568 512 10.9
Urea Thousand tons 1,657 1,788 (7.3)
Notes: (1) Figures have been converted at the rate of 1 ton of crude oil = 7.389 barrels and 1 cubic
metre of natural gas = 35.315 cubic feet.

9
3 Significant Events
3.1 Significant changes in key accounting items and financial indicators under CAS and
explanation of such changes
√Applicable □Inapplicable
Unit: RMB Million
Items September
30, 2016
December
31, 2015
Changes
(%) Key explanation of the changes
Cash at bank and on
hand 120,822 73,692 64.0
Mainly due to the receipt of funds raised
from corporate bonds and short-term
borrowings
Advances to
suppliers 28,693 19,313 48.6
Mainly due to the increase in advances for
materials as compared with that at the end
of preceding year
Short-term
borrowings 100,436 70,059 43.4
Mainly due to the increase in short-term
borrowings for the purpose of reducing
financing costs and optimising the debt
structure
Employee
compensation
payable
11,770 5,900 99.5
Mainly due to the increase in the
outstanding amount of remuneration
payable as compared with that at the end
of last year
Other current
liabilities 9,709 4,326 124.4
Mainly due to the provision for 2016
interim dividend during the period
Debentures payable 141,620 105,014 34.9 Mainly due to the issuance of corporate
bonds during the reporting period
Items
For the nine months
ended September 30 Changes
(%) Key explanation of the changes
2016 2015
Asset impairment
losses 83 39 112.8
Mainly due to the provision for
impairment of long-term equity
investment recognized by the Group
during the reporting period
Investment income 28,417 3,525 706.2
Mainly due to the disposable gain of part
of equity interests of Trans-Asia Gas
Pipeline Co., Ltd. amounting to
RMB24,534 million during the reporting
period
Operating profit 31,456 46,673 (32.6) Mainly due to the drop of prices of oil and
gas products which resulted in a
significant decrease in revenue as
compared with the same period last year
Profit before
taxation 33,430 47,858 (30.1)
Net profit 20,786 35,889 (42.1)
Net profit
attributable to
non-controlling
interests
19,062 5,291 260.3 Mainly due to the increase in the net profit
of certain subsidiaries of the Group
Net profit
attributable to
equity holders of the
Company
1,724 30,598 (94.4) Mainly due to the combined impacts of the
decrease in profits of the Company as a
result of the drop of prices of oil and gas
products, and the increase in the net profit
attributable to non-controlling interests
Basic earnings per
share (RMB Yuan) 0.01 0.17 (94.4)
Diluted earnings per
share (RMB Yuan) 0.01 0.17 (94.4)

10
Items
For the nine months
ended September 30 Changes
(%) Key explanation of the changes
2016 2015
Other
comprehensive
income/(loss)
6,965 (14,999) -
Mainly due to the increase in translation
differences arising on translation of
foreign currency financial statements
caused by the appreciation of the foreign
currency such as US dollar and Tenge
against RMB
Share of other
comprehensive
income/(loss) of
equity-accounted
investee
247 (35) -
Mainly due to the increase in the market
value of available-for-sale financial assets
held by associates and joint ventures
Gains or losses
arising from
changes in fair
value of
available-for-sale
financial assets
(479) 56 -
Mainly due to the changes in fair value of
available-for-sale financial assets held by
the Group
Translation
differences arising
on translation of
foreign currency
financial statements
5,237 (11,881) - Mainly due to the increase in translation
differences arising on translation of
foreign currency financial statements
caused by the appreciation of the foreign
currency such as US dollar and Tenge
against RMB
Other
comprehensive
income/(loss)
attributable to
non-controlling
interests of the
Company, net of tax
1,960 (3,139) -
Total
comprehensive
income
27,751 20,890 32.8
Mainly due to the combined impacts of the
drop of prices of oil and gas product, the
increase in the net profit of certain
subsidiaries and the currency appreciation
of some overseas resource countries
Total
comprehensive
income attributable
to equity holders of
the Company
6,729 18,738 (64.1)
Mainly due to the combined impacts of the
decrease in the profits of the Company and
the currency appreciation of some
overseas resource countries
Total
comprehensive
income attributable
to non-controlling
interests of the
Company
21,022 2,152 876.9
Mainly due to the increase in the net profit
of certain subsidiaries of the Group and
and the currency appreciation of some
overseas resource countries

11
3.2 Developments and impacts of significant events as well as the analysis of and explanation
for the solutions
□Applicable √Inapplicable
3.3 Status of fulfilment of undertakings given by the Company and shareholders with a
shareholding of 5% or more
√Applicable □Inapplicable
During the reporting period, the undertaking given by CNPC, the controlling shareholder
of the Company, and the fulfilment thereof were consistent with the information disclosed in
the section headed “Significant Events” of the 2016 Interim Report of the Company. There
have been no events affecting the performance of these undertakings.
3.4 Caution and explanation as to the anticipated accumulated losses or significant changes
over the same period of the preceding year
√Applicable □Inapplicable
In the first three quarters of 2016, the prices of crude oil fluctuated at a low level, which
had a significant impact on the profitability of the Company. If the prices of crude oil remain at
the low level in the fourth quarter of 2016, it is expected that there will be a significant
decrease in the crude oil price realised by the Company as compared with the same period of
last year. The net profit of the Company attributable to equity holders of the Company for
2016 is expected to decrease substantially as compared with the same period of last year.
The above estimation was only preliminary, please refer to 2016 Annual Report to be
officially disclosed by the Company for specific and accurate financial information.
3.5 Matters after the Balance Sheet Date
√Applicable □Inapplicable
The Notice of National Development and Reform Commission Regarding the
Circulation of the Administrative Measures for the Transportation Price of Natural Gas
Pipelines (for trial implementation) and the Measures for Monitoring the Pricing Costs of
Transportation of Natural Gas by Pipelines (for trial implementation) (《國家發展改革委關
於印發<天然氣管道運輸價格管理辦法(試行)>和<天然氣管道運輸定價成本監審辦法
(試行)>的通知》) issued by the National Development and Reform Commission (the
“NDRC”) (Fa Gai Jia Ge Gui [2016] No.2142), in force as from January 1, 2017, stipulates
that: (1) the pricing method shall follow the principle of “permitted cost plus reasonable
income” and the method and procedures for determining and adjusting prices and the related
core indexes such as permitted income rate and load rate are also defined; (2) it is required that
independent accounting should be conducted in respect of the natural gas transportation
business with the related costs to be calculated separately, and the standards for determining
the major indexes constituting costs are also defined; and (3) appropriate public disclosure of
cost-related information is required.

12
By Order of the Board of Directors
PetroChina Company Limited
Wang Yilin
Chairman
Beijing, the PRC
October 28, 2016
As at the date of this announcement, the board of directors of the Company comprises Mr Wang
Yilin as the Chairman; Mr Zhang Jianhua as the Vice Chairman and non-executive Director, Mr
Wang Dongjin as the Vice Chairman and executive Director; Mr Yu Baocai, Mr Shen Diancheng,
Mr Liu Yuezhen, Mr Xu Wenrong and Mr Liu Hongbin as non-executive Directors; and Mr Zhao
Zhengzhang as executive Director; and Mr Chen Zhiwu, Mr Richard H. Matzke, Mr Lin Boqiang
and Mr Zhang Biyi as independent non-executive Directors.
This announcement is published in English and Chinese. In the event of any inconsistency between
the two versions, the Chinese version shall prevail.

13
4 Appendix
A. Financial statements for the third quarter of 2016 prepared in accordance with IFRS
1-1 Consolidated Statement of Comprehensive Income
Three months ended September 30
2016 2015
RMB million RMB million
REVENUE 411,370 427,481
OPERATING EXPENSES
Purchases, services and other (252,539) (265,706)
Employee compensation costs (28,223) (28,289)
Exploration expenses, including exploratory dry holes (6,783) (4,616)
Depreciation, depletion and amortisation (50,575) (45,664)
Selling, general and administrative expenses (17,792) (17,224)
Taxes other than income taxes (45,933) (50,045)
Other income, net 1,450 269
TOTAL OPERATING EXPENSES (400,395) (411,275)
PROFIT FROM OPERATIONS 10,975 16,206
FINANCE COSTS
Exchange gain 325 4,238
Exchange loss (314) (5,291)
Interest income 1,075 344
Interest expense (6,245) (5,787)
TOTAL NET FINANCE COSTS (5,159) (6,496)
SHARE OF PROFIT / (LOSS) OF ASSOCIATES AND
JOINT VENTURES 1,021 (285)
PROFIT BEFORE INCOME TAX EXPENSE 6,837 9,425
INCOME TAX EXPENSE (2,948) (2,124)
PROFIT FOR THE PERIOD 3,889 7,301
OTHER COMPREHENSIVE INCOME / (LOSS)
RECLASSIFIABLE TO PROFIT OR LOSS:
Currency translation differences 602 (10,458)
Fair value gain from available-for-sale financial assets,
net of tax 471 22
Share of the other comprehensive loss of associates and
joint ventures accounted for using the equity method 114 224
OTHER COMPREHENSIVE INCOME / (LOSS), NET
OF TAX 1,187 (10,212)
TOTAL COMPREHENSIVE INCOME / (LOSS) FOR
THE PERIOD 5,076 (2,911)
PROFIT FOR THE PERIOD ATTRIBUTABLE TO:
Owners of the Company 1,200 5,195
Non-controlling interests 2,689 2,106
3,889 7,301
TOTAL COMPREHENSIVE INCOME / (LOSS)
FOR THE PERIOD ATTRIBUTABLE TO:
Owners of the Company 2,013 (2,312)
Non-controlling interests 3,063 (599)
5,076 (2,911)
BASIC AND DILUTED EARNINGS PER SHARE
ATTRIBUTABLE TO OWNERS OF THE
COMPANY (RMB) 0.01 0.03

14
1-2 Consolidated Statement of Comprehensive Income
Nine months ended September 30
2016 2015
RMB million RMB million
REVENUE 1,150,437 1,305,105
OPERATING EXPENSES
Purchases, services and other (680,473) (793,728)
Employee compensation costs (85,069) (85,579)
Exploration expenses, including exploratory dry holes (15,804) (17,015)
Depreciation, depletion and amortisation (156,560) (137,547)
Selling, general and administrative expenses (53,022) (54,716)
Taxes other than income taxes (140,714) (155,327)
Other income, net 26,720 2,128
TOTAL OPERATING EXPENSES (1,104,922) (1,241,784)
PROFIT FROM OPERATIONS 45,515 63,321
FINANCE COSTS
Exchange gain 6,518 6,329
Exchange loss (5,970) (7,649)
Interest income 1,833 1,219
Interest expense (18,176) (18,352)
TOTAL NET FINANCE COSTS (15,795) (18,453)
SHARE OF PROFIT OF ASSOCIATES AND
JOINT VENTURES 3,717 2,994
PROFIT BEFORE INCOME TAX EXPENSE 33,437 47,862
INCOME TAX EXPENSE (12,643) (11,970)
PROFIT FOR THE PERIOD 20,794 35,892
OTHER COMPREHENSIVE INCOME
RECLASSIFIABLE TO PROFIT OR LOSS:
Currency translation differences 7,176 (15,012)
Fair value gains or losses from available-for-sale
financial assets, net of tax (479) 56
Share of the other comprehensive income / (loss) of
associates and joint ventures accounted for using the
equity method 247 (43)
OTHER COMPREHENSIVE INCOME / (LOSS), NET
OF TAX 6,944 (14,999)
TOTAL COMPREHENSIVE INCOME FOR THE
PERIOD 27,738 20,893
PROFIT FOR THE PERIOD ATTRIBUTABLE TO:
Owners of the Company 1,731 30,601
Non-controlling interests 19,063 5,291
20,794 35,892
TOTAL COMPREHENSIVE INCOME FOR THE
PERIOD ATTRIBUTABLE TO:
Owners of the Company 6,715 18,741
Non-controlling interests 21,023 2,152
27,738 20,893
BASIC AND DILUTED EARNINGS PER SHARE
FOR PROFIT ATTRIBUTABLE TO OWNERS OF
THE COMPANY (RMB) 0.01 0.17

15
2. Consolidated Statement of Financial Position
September 30, 2016 December 31, 2015
RMB million RMB million
NON-CURRENT ASSETS
Property, plant and equipment 1,719,739 1,784,905
Investments in associates and joint ventures 82,024 70,976
Available-for-sale financial assets 2,252 2,869
Advance operating lease payments 69,865 70,551
Intangible and other non-current assets 99,812 98,272
Deferred tax assets 16,910 16,927
TOTAL NON-CURRENT ASSETS 1,990,602 2,044,500
CURRENT ASSETS
Inventories 131,784 126,877
Accounts receivable 61,933 52,262
Prepayment and other current assets 91,892 88,280
Notes receivable 8,671 8,233
Time deposits with maturities over three months
but within one year 875 919
Cash and cash equivalents 119,947 72,773
TOTAL CURRENT ASSETS 415,102 349,344
CURRENT LIABILITIES
Accounts payable and accrued liabilities 331,602 331,040
Income taxes payable 9,242 7,879
Other taxes payable 27,147 26,262
Short-term borrowings 141,016 106,226
TOTAL CURRENT LIABILITIES 509,007 471,407
NET CURRENT LIABILITIES (93,905) (122,063)
TOTAL ASSETS LESS CURRENT
LIABILITIES 1,896,697 1,922,437
EQUITY
EQUITY ATTRIBUTABLE TO OWNERS OF
THE COMPANY:
Share capital 183,021 183,021
Retained earnings 705,030 711,755
Reserves 293,859 284,940
TOTAL EQUITY ATTRIBUTABLE TO
OWNERS OF THE COMPANY
1,181,910 1,179,716
NON-CONTROLLING INTERESTS 182,411 164,318
TOTAL EQUITY 1,364,321 1,344,034
NON-CURRENT LIABILITIES
Long-term borrowings 383,941 434,475
Asset retirement obligations 124,185 117,996
Deferred tax liabilities 12,073 13,120
Other long-term obligations 12,177 12,812
TOTAL NON-CURRENT LIABILITIES 532,376 578,403
TOTAL EQUITY AND NON-CURRENT
LIABILITIES
1,896,697 1,922,437
Chairman Vice Chairman and President Chief Financial Officer
Wang Yilin Wang Dongjin Zhao Dong

16
3. Consolidated Statement of Cash Flows
Nine months ended September 30
2016 2015
RMB million RMB million
CASH FLOWS FROM OPERATING ACTIVITIES
Profit for the period 20,794 35,892
Adjustments for:
Income tax expense 12,643 11,970
Depreciation, depletion and amortisation 156,560 137,547
Capitalised exploratory costs charged to expense 8,398 9,855
Safety fund reserve 3,553 3,744
Share of profit of associates and joint ventures (3,717) (2,994)
Reversal of provision for impairment of receivables, net 7 (73)
Write down in inventories, net 76 131
Gain on disposal of available-for-sale financial assets (36) (268)
Loss on disposal of property, plant and equipment 918 314
Gain on disposal of other non-current assets (10) (15)
Gain on disposal of subsidiaries (24,637) -
Loss on disposal of associates and joint ventures 24 -
Dividend income (51) (263)
Interest income (1,833) (1,219)
Interest expense 18,176 18,352
Changes in working capital:
Accounts receivable, prepayments and other current
assets (19,070) (19,885)
Inventories (4,914) 25,074
Accounts payable and accrued liabilities 38,378 (7,819)
CASH FLOWS GENERATED FROM OPERATIONS 205,259 210,343
Income taxes paid (14,342) (11,002)
NET CASH FLOWS FROM OPERATING
ACTIVITIES 190,917 199,341

17
3. Consolidated Statement of Cash Flows (Continued)
Nine months ended September 30
2016 2015
RMB million RMB million
CASH FLOWS FROM INVESTING ACTIVITIES
Capital expenditures (114,146) (147,864)
Acquisition of investments in associates and joint ventures (1,563) (1,217)
Acquisition of available-for-sale financial assets (395) (272)
Advance payments on long-term operating leases (1,663) (1,729)
Acquisition of intangible assets and other non-current assets (2,895) (1,357)
Proceeds from disposal of property, plant and equipment 173 344
Proceeds from disposal of other non-current assets 667 677
Interest received 1,655 1,277
Dividends received 10,135 6,869
Decrease in time deposits with maturities over three months 47 4,002
NET CASH FLOWS USED FOR INVESTING
ACTIVITIES (107,985) (139,270)
CASH FLOWS FROM FINANCING ACTIVITIES
Repayments of short-term borrowings (326,578) (382,176)
Repayments of long-term borrowings (246,665) (175,052)
Interest paid (14,043) (15,400)
Dividends paid to non-controlling interests (1,494) (3,641)
Dividends paid to owners of the Company (4,648) (27,452)
Increase in short-term borrowings 356,628 374,286
Increase in long-term borrowings 199,727 195,230
Capital contribution from non-controlling interests 652 289
Capital reduction of subsidiaries (1) (290)
Decrease in other long-term obligations (675) (3,437)
NET CASH FLOWS FROM FINANCING ACTIVITIES (37,097) (37,643)
TRANSLATION OF FOREIGN CURRENCY 1,339 (765)
Increase in cash and cash equivalents 47,174 21,663
Cash and cash equivalents at beginning of the period 72,773 73,778
Cash and cash equivalents at end of the period 119,947 95,441

18
4. Segment Information
Nine months ended September 30
2016 2015
RMB million RMB million
Revenue
Exploration and Production
Intersegment sales 229,820 293,672
Revenue from external customers 53,180 69,950
283,000 363,622
Refining and Chemicals
Intersegment sales 320,537 386,569
Revenue from external customers 102,428 105,853
422,965 492,422
Marketing
Intersegment sales 88,838 113,033
Revenue from external customers 840,221 943,184
929,059 1,056,217
Natural Gas and Pipeline
Intersegment sales 20,978 19,859
Revenue from external customers 153,706 185,166
174,684 205,025
Head Office and Other
Intersegment sales 223 252
Revenue from external customers 902 952
1,125 1,204
Total revenue from external customers 1,150,437 1,305,105
(Loss) / profit from operations
Exploration and Production (3,949) 46,513
Refining and Chemicals 34,311 3,059
Marketing 6,805 (978)
Natural Gas and Pipeline 17,857 25,384
Head Office and Other (9,509) (10,657)
45,515 63,321

19
B. Financial statements for the third quarter of 2016 prepared in accordance with CAS
1. Consolidated Balance Sheet
ASSETS
September 30, 2016 December 31, 2015
RMB million RMB million
Current assets
Cash at bank and on hand 120,822 73,692
Notes receivable 8,671 8,233
Accounts receivable 61,933 52,262
Advances to suppliers 28,693 19,313
Other receivables 17,690 14,713
Inventories 131,784 126,877
Other current assets 45,509 54,254
Total current assets 415,102 349,344
Non-current assets
Available-for-sale financial assets 2,215 2,832
Long-term equity investments 82,098 70,999
Fixed assets 655,371 681,561
Oil and gas properties 821,988 870,350
Construction in progress 234,134 225,566
Construction materials 7,494 6,917
Intangible assets 70,069 71,049
Goodwill 45,796 45,589
Long-term prepaid expenses 24,957 27,534
Deferred tax assets 16,910 16,927
Other non-current assets 29,854 25,426
Total non-current assets 1,990,886 2,044,750
TOTAL ASSETS 2,405,988 2,394,094
Chairman Vice Chairman and President Chief Financial Officer
Wang Yilin Wang Dongjin Zhao Dong

20
Chairman Vice Chairman and President Chief Financial Officer
Wang Yilin Wang Dongjin Zhao Dong
1. Consolidated Balance Sheet (Continued)
LIABILITIES AND
SHAREHOLDERS’ EQUITY
September 30, 2016
December 31, 2015
RMB million RMB million
Current liabilities
Short-term borrowings 100,436 70,059
Notes payable 6,116 7,066
Accounts payable 176,785 202,885
Advances from customers 62,722 50,930
Employee compensation payable 11,770 5,900
Taxes payable 36,389 34,141
Other payables 64,500 59,933
Current portion of non-current liabilities 40,580 36,167
Other current liabilities 9,709 4,326
Total current liabilities 509,007 471,407
Non-current liabilities
Long-term borrowings 242,321 329,461
Debentures payable 141,620 105,014
Provisions 124,185 117,996
Deferred tax liabilities 12,071 13,116
Other non-current liabilities 12,177 12,812
Total non-current liabilities 532,374 578,399
Total liabilities 1,041,381 1,049,806
Shareholders’ equity
Share capital 183,021 183,021
Capital surplus 128,516 128,008
Special reserve 15,075 11,648
Other comprehensive income (31,272) (36,277)
Surplus reserves 186,840 186,840
Undistributed profits 699,996 706,728
Equity attributable to equity holders of the
Company 1,182,176 1,179,968
Non-controlling interests 182,431 164,320
Total shareholders’ equity 1,364,607 1,344,288
TOTAL LIABILITIES AND
SHAREHOLDERS’ EQUITY 2,405,988 2,394,094

21
2. Company Balance Sheet
ASSETS
September 30, 2016 December 31, 2015
RMB million RMB million
Current assets
Cash at bank and on hand 47,029 12,970
Notes receivable 6,278 6,745
Accounts receivable 12,640 7,362
Advances to suppliers 12,336 2,986
Other receivables 60,044 124,601
Inventories 88,811 91,912
Other current assets 40,512 42,268
Total current assets 267,650 288,844
Non-current assets
Available-for-sale financial assets 1,464 1,528
Long-term equity investments 376,555 379,914
Fixed assets 340,808 356,658
Oil and gas properties 560,191 596,163
Construction in progress 117,037 116,889
Construction materials 3,286 2,843
Intangible assets 52,161 53,336
Long-term prepaid expenses 20,700 21,411
Deferred tax assets 13,230 13,490
Other non-current assets 13,360 12,312
Total non-current assets 1,498,792 1,554,544
TOTAL ASSETS 1,766,442 1,843,388
Chairman Vice Chairman and President Chief Financial Officer
Wang Yilin Wang Dongjin Zhao Dong
22
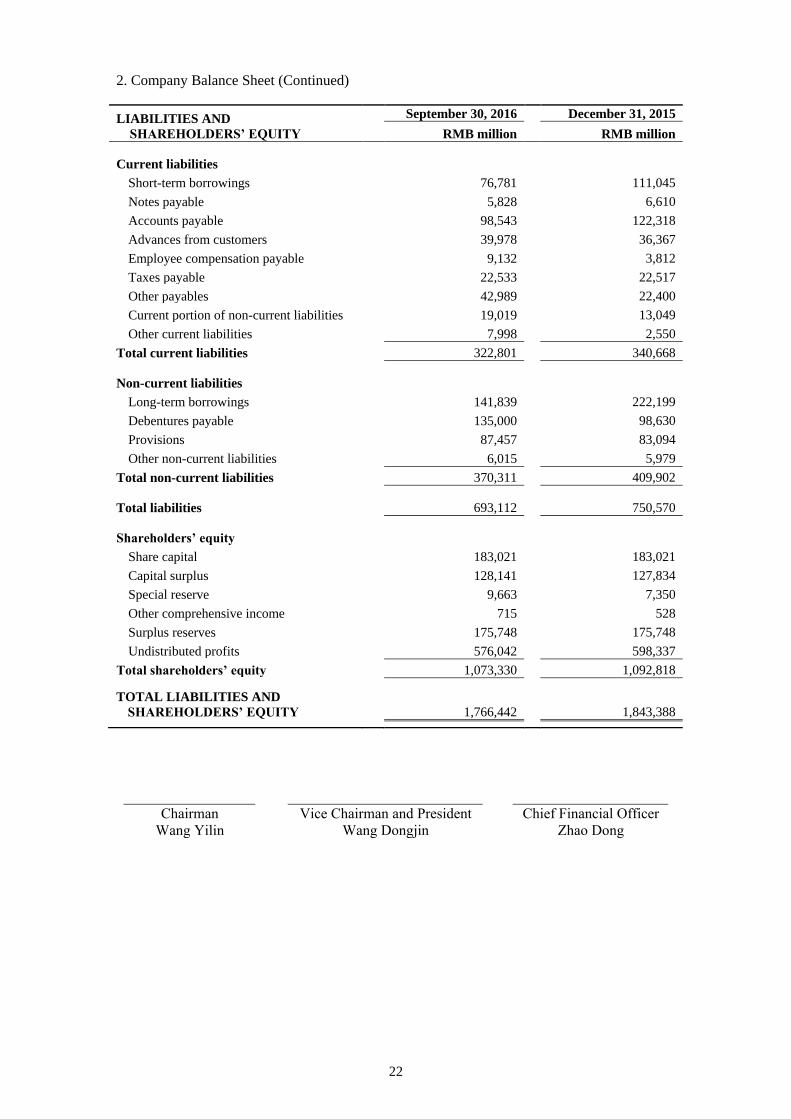
2. Company Balance Sheet (Continued)
LIABILITIES AND
SHAREHOLDERS’ EQUITY
September 30, 2016 December 31, 2015
RMB million RMB million
Current liabilities
Short-term borrowings 76,781 111,045
Notes payable 5,828 6,610
Accounts payable 98,543 122,318
Advances from customers 39,978 36,367
Employee compensation payable 9,132 3,812
Taxes payable 22,533 22,517
Other payables 42,989 22,400
Current portion of non-current liabilities 19,019 13,049
Other current liabilities 7,998 2,550
Total current liabilities 322,801 340,668
Non-current liabilities
Long-term borrowings 141,839 222,199
Debentures payable 135,000 98,630
Provisions 87,457 83,094
Other non-current liabilities 6,015 5,979
Total non-current liabilities 370,311 409,902
Total liabilities 693,112 750,570
Shareholders’ equity
Share capital 183,021 183,021
Capital surplus 128,141 127,834
Special reserve 9,663 7,350
Other comprehensive income 715 528
Surplus reserves 175,748 175,748
Undistributed profits 576,042 598,337
Total shareholders’ equity 1,073,330 1,092,818
TOTAL LIABILITIES AND
SHAREHOLDERS’ EQUITY 1,766,442 1,843,388
Chairman Vice Chairman and President Chief Financial Officer
Wang Yilin Wang Dongjin Zhao Dong

23
3-1. Consolidated Income Statement
Three months ended September 30
2016 2015
Items RMB million RMB million
Operating income 411,370 427,481
Less: Cost of sales (323,003) (328,410)
Taxes and levies on operations (44,471) (48,864)
Selling expenses (15,745) (15,813)
General and administrative expenses (18,158) (18,126)
Finance expenses (5,485) (6,737)
Asset impairment losses (4) 43
Add: Investment income / (loss) 1,154 (264)
Operating profit 5,658 9,310
Add: Non-operating income 2,632 1,773
Less: Non-operating expenses (1,457) (1,659)
Profit before taxation 6,833 9,424
Less: Taxation (2,948) (2,124)
Net profit 3,885 7,300
Attributable to:
Equity holders of the Company 1,196 5,194
Non-controlling interests 2,689 2,106
Earnings per share
Basic earnings per share (RMB Yuan) 0.01 0.03
Diluted earnings per share (RMB Yuan) 0.01 0.03
Other comprehensive income / (loss) 1,207 (10,212)
Other comprehensive income / (loss)
attributable to equity holders of the
Company, net of tax
834 (7,507)
Other comprehensive income / (loss) would
be reclassified to profit or loss
Including:
Share of other comprehensive income
of equity-accounted investee
114 222
Gains or losses arising from changes in
fair value of available-for-sale
financial assets
471 22
Translation differences arising on
translation of foreign currency
financial statements
249 (7,751)
Other comprehensive income / (loss)
attributable to non-controlling interests of
the Company, net of tax
373 (2,705)
Total comprehensive income / (loss) 5,092 (2,912)
Attributable to:
Equity holders of the Company 2,030 (2,313)
Non-controlling interests 3,062 (599)
Chairman Vice Chairman and President Chief Financial Officer
Wang Yilin Wang Dongjin Zhao Dong

24
3-2. Consolidated Income Statement
Nine months ended September 30
2016 2015
Items RMB million RMB million
Operating income 1,150,437 1,305,105
Less: Cost of sales (889,907) (984,100)
Taxes and levies on operations (136,555) (151,825)
Selling expenses (45,644) (46,268)
General and administrative expenses (58,534) (60,517)
Finance expenses (16,675) (19,208)
Asset impairment losses (83) (39)
Add: Investment income 28,417 3,525
Operating profit 31,456 46,673
Add: Non-operating income 6,820 6,021
Less: Non-operating expenses (4,846) (4,836)
Profit before taxation 33,430 47,858
Less: Taxation (12,644) (11,969)
Net profit 20,786 35,889
Attributable to:
Equity holders of the Company 1,724 30,598
Non-controlling interests 19,062 5,291
Earnings per share
Basic earnings per share (RMB Yuan) 0.01 0.17
Diluted earnings per share (RMB Yuan) 0.01 0.17
Other comprehensive income / (loss) 6,965 (14,999)
Other comprehensive income / (loss) attributable
to equity holders of the Company, net of tax
5,005 (11,860)
Other comprehensive income / (loss) would be
reclassified to profit or loss
Including:
Share of other comprehensive income /
(loss) of equity-accounted investee
247 (35)
Gains or losses arising from changes in fair
value of available-for-sale financial assets
(479) 56
Translation differences arising on
translation of foreign currency financial
statements
5,237 (11,881)
Other comprehensive income / (loss) attributable
to non-controlling interests of the Company,
net of tax
1,960 (3,139)
Total comprehensive income 27,751 20,890
Attributable to:
Equity holders of the Company 6,729 18,738
Non-controlling interests 21,022 2,152
Chairman Vice Chairman and President Chief Financial Officer
Wang Yilin Wang Dongjin Zhao Dong

25
4-1. Income Statement
Three months ended September 30
2016 2015
Items RMB million RMB million
Operating income 243,242 271,403
Less: Cost of sales (184,617) (203,675)
Taxes and levies on operations (37,793) (42,395)
Selling expenses (11,007) (11,200)
General and administrative expenses (12,202) (12,444)
Finance expenses (4,699) (5,567)
Asset impairment losses (7) (1)
Add: Investment income 1,458 6,031
Operating (loss) / profit (5,625) 2,152
Add: Non-operating income 1,576 1,368
Less: Non-operating expenses (1,731) (1,536)
(Loss) / profit before taxation (5,780) 1,984
Less: Taxation 108 (558)
Net (loss) / profit (5,672) 1,426
(Loss) / earnings per share
Basic (loss) / earnings per share (RMB Yuan) (0.03) 0.01
Diluted (loss) / earnings per share (RMB Yuan) (0.03) 0.01
Other comprehensive income 132 98
Other comprehensive income attributable to equity
holders of the Company, net of tax
132 98
Other comprehensive income would be reclassified
to profit or loss
Including:
Share of other comprehensive income of equity
accounted investee
115 212
Gains or losses arising from changes in fair value
of available-for-sale financial assets
17 (114)
Total comprehensive (loss) / income (5,540) 1,524
Chairman Vice Chairman and President Chief Financial Officer
Wang Yilin Wang Dongjin Zhao Dong

26
4-2. Income Statement
Nine months ended September 30
2016 2015
Items RMB million RMB million
Operating income 711,273 817,653
Less: Cost of sales (530,891) (594,995)
Taxes and levies on operations (117,828) (134,163)
Selling expenses (31,838) (31,836)
General and administrative expenses (41,644) (43,864)
Finance expenses (14,449) (16,152)
Asset impairment losses (19) 14
Add: Investment income 12,789 19,993
Operating (loss) / profit (12,607) 16,650
Add: Non-operating income 4,318 7,635
Less: Non-operating expenses (4,621) (4,250)
(Loss) / profit before taxation (12,910) 20,035
Less: Taxation (1,134) (1,802)
Net (loss) / profit (14,044) 18,233
(Loss) / earnings per share
Basic (loss) / earnings per share (RMB Yuan) (0.08) 0.10
Diluted (loss) / earnings per share (RMB Yuan) (0.08) 0.10
Other comprehensive income / (loss) 187 (171)
Other comprehensive income / (loss)
attributable to equity holders of the Company,
net of tax
187 (171)
Other comprehensive income / (loss) would be
reclassified to profit or loss
Including:
Share of other comprehensive income /
(loss) of equity-accounted investee
237 (38)
Gains or losses arising from changes in fair
value of available-for-sale financial
assets
(50) (133)
Total comprehensive (loss) / income (13,857) 18,062
Chairman Vice Chairman and President Chief Financial Officer
Wang Yilin Wang Dongjin Zhao Dong

27
5. Consolidated Cash Flow Statement
Items
Nine months ended September 30
2016 2015
RMB million RMB million
Cash flows from operating activities
Cash received from sales of goods and rendering of services 1,341,231 1,508,443
Refund of taxes and levies 1,353 1,189
Cash received relating to other operating activities 2,003 1,620
Sub-total of cash inflows 1,344,587 1,511,252
Cash paid for goods and services (813,893) (927,457)
Cash paid to and on behalf of employees (79,155) (80,522)
Payments of taxes and levies (222,604) (264,066)
Cash paid relating to other operating activities (38,018) (39,866)
Sub-total of cash outflows (1,153,670) (1,311,911)
Net cash flows from operating activities 190,917 199,341
Cash flows from investing activities
Cash received from disposal of investments 721 5,741
Cash received from returns on investments 11,790 8,146
Net cash received from disposal of fixed assets, oil and gas
properties, intangible assets and other long-term assets 189 375
Sub-total of cash inflows 12,700 14,262
Cash paid to acquire fixed assets, oil and gas properties,
intangible assets and other long-term assets (118,704) (150,950)
Cash paid to acquire investments (1,981) (2,582)
Sub-total of cash outflows (120,685) (153,532)
Net cash flows from investing activities (107,985) (139,270)
Chairman Vice Chairman and President Chief Financial Officer
Wang Yilin Wang Dongjin Zhao Dong

28
5. Consolidated Cash Flow Statement (Continued)
Items
Nine months ended September 30
2016 2015
RMB million RMB million
Cash flows from financing activities
Cash received from capital contributions 652 289
Including: Cash received from non-controlling
interests’ capital contributions to subsidiaries 652 289
Cash received from borrowings 556,355 569,516
Cash received relating to other financing activities 31 61
Sub-total of cash inflows 557,038 569,866
Cash repayments of borrowings (573,243) (557,228)
Cash payments for interest expenses and distribution
of dividends or profits (20,185) (46,493)
Including: Subsidiaries’ cash payments for
distribution of dividends or profits to
non-controlling interests (1,494) (3,641)
Capital reduction of subsidiaries (1) (290)
Cash payments relating to other financing activities (706) (3,498)
Sub-total of cash outflows (594,135) (607,509)
Net cash flows used for financing activities (37,097) (37,643)
Effect of foreign exchange rate changes on cash and
cash equivalents 1,339 (765)
Net increase in cash and cash equivalents 47,174 21,663
Add: Cash and cash equivalents at beginning of the
period 72,773 73,778
Cash and cash equivalents at end of the period 119,947 95,441
Chairman Vice Chairman and President Chief Financial Officer
Wang Yilin Wang Dongjin Zhao Dong

29
6. Company Cash Flow Statement
Items
Nine months ended September 30
2016 2015
RMB million RMB million
Cash flows from operating activities
Cash received from sales of goods and rendering of services 831,089 946,154
Refund of taxes and levies 437 374
Cash received relating to other operating activities 4,288 12,660
Sub-total of cash inflows 835,814 959,188
Cash paid for goods and services (435,704) (521,586)
Cash paid to and on behalf of employees (56,354) (56,999)
Payments of taxes and levies (174,181) (211,483)
Cash paid relating to other operating activities (1,706) (17,470)
Sub-total of cash outflows (667,945) (807,538)
Net cash flows from operating activities 167,869 151,650
Cash flows from investing activities
Cash received from disposal of investments 53,503 686
Cash received from returns on investments 10,549 26,740
Net cash received from disposal of fixed assets, oil and gas
properties, intangible assets and other long-term assets 146 261
Sub-total of cash inflows 64,198 27,687
Cash paid to acquire fixed assets, oil and gas properties,
intangible assets and other long-term assets (84,017) (109,211)
Cash paid to acquire investments (24,548) (1,442)
Sub-total of cash outflows (108,565) (110,653)
Net cash flows from investing activities (44,367) (82,966)
Chairman Vice Chairman and President Chief Financial Officer
Wang Yilin Wang Dongjin Zhao Dong

30
6. Company Cash Flow Statement (Continued)
Items
Nine months ended September 30
2016 2015
RMB million RMB million
Cash flows from financing activities
Cash received from borrowings 251,764 252,543
Cash received relating to other financing activities 25 40
Sub-total of cash inflows 251,789 252,583
Cash repayments of borrowings (324,058) (263,471)
Cash payments for interest expenses and distribution of
dividends or profits (17,174) (50,809)
Sub-total of cash outflows (341,232) (314,280)
Net cash flows from financing activities (89,443) (61,697)
Effect of foreign exchange rate changes on cash and
cash equivalents - -
Net increase in cash and cash equivalents 34,059 6,987
Add: Cash and cash equivalents at beginning of the
period 12,970 38,507
Cash and cash equivalents at end of the period 47,029 45,494
Chairman Vice Chairman and President Chief Financial Officer
Wang Yilin Wang Dongjin Zhao Dong