petrochemical applications of an entry level...
TRANSCRIPT

1. INTRODUCTIONWhereas wavelength dispersive spectrometers (WDXRF) using high power (above 2kW) aremainly used in central laboratories for a wide range of applications (oils, polymers, catalysts,geological materials and other organic matrices), the analysis of elements such as S, Ni,V, Pb andcertain elements of process control in refineries, can be carried out by energy dispersive(EDXRF) or wavelength dispersive (WDXRF) techniques equipped with X-ray tubes with lowerpower.
The use of WDXRF instruments for the dosage of elements such as Si, S, Pb, Ni,V, Cl, Br isparticularly suited to the requirements of certain standard methods and the increasing need toanalyze lower and lower contents. Different analytical methods are being used in the industry,including use of gross peak intensities, nett peak intensities, internal standards and are constantlybeing improved for better precision, reliability and easier use.This is allowing the operators inthe various pilot units to monitor elemental content by carrying out the analysis themselves.
The Institut Français du Pétrole (IFP) has acquired an ARL OPTIM’X WDXRF from ThermoElectron Corporation for its laboratory based in Lyon, France (Figure 1). Equipped with a lowpower tube (50W), the instrument is being used for the self-service monitoring of sulfur in thevarious oils and fuel samples obtained through different processes currently under investigationat the IFP.The main advantages of this solution include the processing speed of the analysis withthe constant availability of the apparatus and the ease of use of the instrument as a self-servicetool, while at the same time offering performances comparable to those of a high power system.
Figure 1:The Institut Français du Pétrole (IFP) site in Lyon
2. INSTRUMENT CONFIGURATIONThe spectrometer (Figure 2) can be used with agoniometer and/or fixed channels allowinghighly flexible configurations to suit the needs ofthe users’ laboratories. The IFP has chosen toinstall two fixed channels for the measurementof SKα and SBackground intensities.
Figure 2 (left): The ARL OPTIM’X WDXRFspectrometer from Thermo Electron Cor-poration is installed at the IFP- Lyon.
3. DETERMINATION OF THE MINIMUMVOLUMEThe various processes studied on pilot plants(Figure 3) at the IFP imply availability of onlyvery small volumes of samples. Although theWDXRF technique is non destructive for thesample, sample taking has been reduced to a
minimum without any noticeable deterioration in the quality of the analytical results.
The variations in the measured signal relating to the sample volume enabled an assessmentof the minimum volume of sample required for which the measured signal no longer varied.These practical trials were verified by calculating the theoretical volume necessary to work ininfinite thickness.
3.1 Experimental determination of the minimum volume The following graphs indicate the variation in the SKα signal expressed in kilocounts per second,considering the volume of the sample used, for two different concentrations of 38ppm and0.72%.
Figure 4 : Relation between sample volume and sulfur intensity – low level sulfurFigure 5 : Relation between sample volume and sulfur intensity – high level sulfur
These two different types of concentrations show a constant signal starting with a samplesize of about 0.8ml. For safety reasons, the sample size was set at 2ml. It is clear that this testhas allowed a considerable reduction of the sample size, since the volume usually required bythe laboratory to carry out the same measurement was 30 ml up to now.
3.2 Theoretical determination of the minimum volumeIn the monochromatic approximation ie. excitation of the SKα transition by the RhLα radiationof the X-ray tube- the intensity or fluorescence, Ie, depends on the thickness of the sample(expressed as e), on the sample density ρ and its average mass absorption coefficient µm.
From a thickness, labeled e∞, the fluorescence signal, I∞, becomes constant.This gives thefollowing standard equation:
Petrochemical Applications of anEntry Level Wavelength DispersiveXRF Spectrometer (WDXRF)
PIN April/May 2004
?ANALYTICAL INSTRUMENTATION
Petrochemical Applications of anEntry Level Wavelength DispersiveXRF Spectrometer (WDXRF)C. P. Lienemann, E. Roche, A. Kohler1, D. Bonvin1 and G. Matula2
Abstract : X-Ray Fluorescence (XRF) is a well established technique in the petrochemical industry. The availability of cost-effective entry level WDXRF, requiring no external water or detector gas has facilitated the widespread use of this technique.This paper describes the performance of a low power WDXRF instrument for the analysis of sulfur in petrochemical products.It reviews various methods that have been applied and their performance in terms of repeatability.
Figure 3: Pilot units in the new hall at IFP- Lyon.

σc = 0.22ppm (mg/kg)Ld = 1.3 ppm (mg/kg)Lq = 2.16ppm (mg/kg)
This quantification limit was tested by analyzing products close to this concentration and thecontent of which had previously been determined by UVF (ISO 20846 standard).Table 1 indicatesthe comparison for a series of samples containing very low sulfur concentrations (<10ppm).
6. STANDARDS USED FOR S DOSAGE IN OIL INDUSTRY PRODUCTSSeveral standards are available worldwide for the measurement of sulfur in oil industry products.Here we shall only consider the standards currently used or those recommended for analysis ofsulfur in gasoline leveling in Europe. Both ASTM D2622-98 and ISO/FDIS 20884 standardsrecommend the use of wavelength dispersive X-ray fluorescence (WDXRF).
The ISO/FDIS 20884 norm is valid between 5 and 500 ppm.The measurements are carriedout at the peak position of SKα and at a slightly different position, SBackground. The difference inintensity between these two measurements (nett intensity) is used for sulfur determination.Thisnorm is one of the two recommended norms European wide for the sulfur determination invehicle gasoline.
The ASTM D2622 standard uses the following method:• 10ppm to 1000ppm range : use of the
difference in intensity between SKα and SBackground (nett peak)
• Range above 1000ppm : use of theSKα signal (gross peak).
ISO 14596 standard:This normrecommends the use of WDXRF, with a Zrinternal standard.
• 1 000ppm to 2.5% range : use of gross peakratio between SKα and ZrLα
• 10ppm to 1000ppm range : use of nett peakratio between S and Zr
ISO/FDIS 20846 standard: This normadvocates combustion of the sampleassociated to a UVF detection of the SO2product. This norm is one of tworecommended at European level for the sulfurdosage in vehicle fuels.
ISO/FDIS 20847 standard: This normproposes the use of energy dispersive X-ray
fluorescence (EDXRF). It is valid from 30 to 500 ppm for vehicle fuels.
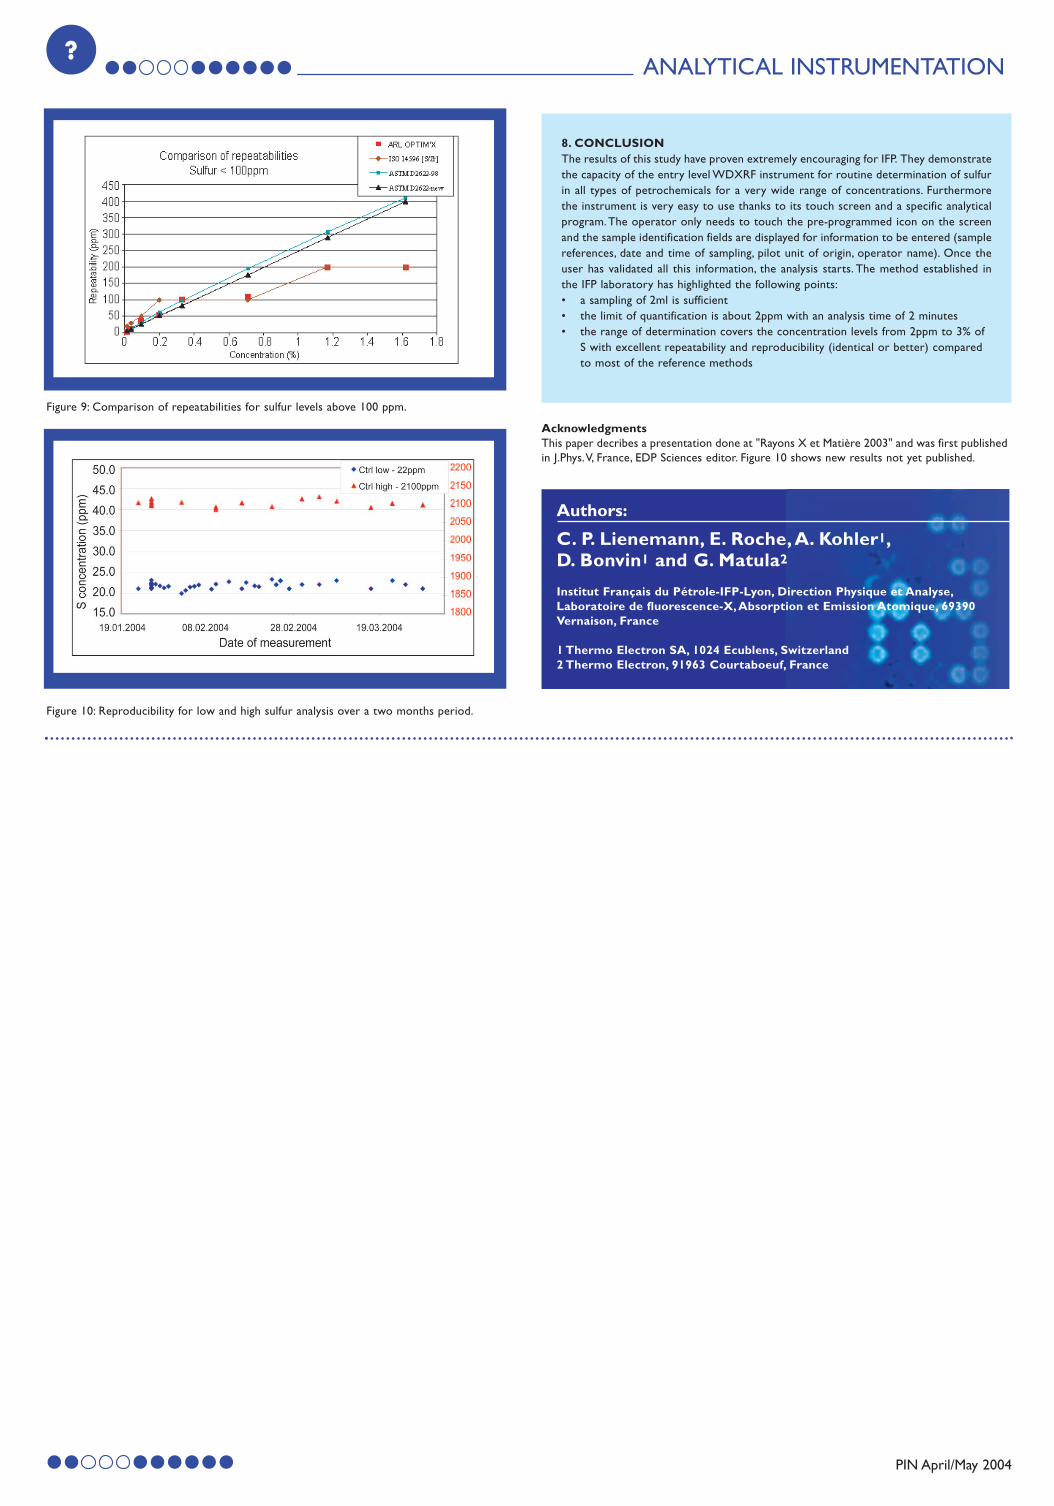
7.COMPARISON OF THE VARIOUS METHODSThe comparison of the various methods is based on repeatability tests. Several samples coveringthe 15ppm to 1.5% concentration range were analyzed ten times consecutively with the ARLOPTIM’X using the above described calibration curve.The standard deviation σc is estimated forten measurements at the concentration c of the sample. The repeatability rc is defined by theequation:rc = 2.8 σc
This repeatability is compared to the maximum values indicated by the different normsmentioned previously, for sulfur concentration ranges in the tested samples below 100ppm andabove 100ppm.
It is interesting to note that the instrument shows repeatability in line with the most recentnorms for sulfur determination by WDXRF. It is also clear that the repeatability of the ARLOPTIM’X is clearly better to the ISO/FDIS 20847 standard that regulates the use of EDXRFinstruments.This last observation is important as these low cost instruments are often deployedin refineries in order to monitor the concentration levels of various elements in oil industryproducts, but most of them are unable to measure sulfur content lower than 30 ppm.
Long term stability has also been tested by measuring two samples at different levels ofconcentration.A 22 ppm solution and a 2100 ppm made of white oil and dibenzothiophene havebeen measured for two months. Results obtained are shown in figure 10 for the two solutions.The excellent standard deviations obtained over a two months period are 0.76 ppm at a sulfurlevel of 21.8 ppm and 9.45 ppm at a sulfur level of 2102 ppm. For both concentrations, thesereproducibility values are well within the ISO 20884 requirements.
PIN April/May 2004
?ANALYTICAL INSTRUMENTATION
Ie = I∞ (1-exp(-ρµme))
with µm = µ(RhLα)/sin(θ1) + µ(SKα)/sin(θ2), θ1 and θ2 being the excitation and emission beams angles.
The variations of Ie are regarded as constant from Ie/I∞ ≈ 0.999. The thickness of thecorresponding sample is called infinite thickness (labeled e∞) and is defined by ρµme∞ ≈ 6.9
If D is the diameter of the cells used, the minimum volume will be defined by:
Vmin ≈ 6.9πD2/4ρµm
With D = 40mm, ρ = 0.7gcm3 and µm ≈ 180cm2g-1 we obtain Vmin ≈ 0.7ml, this resultmatches the value obtained experimentally with the side effects inside the measuring cell takeninto consideration.
4. CALIBRATIONThe method that was used is an extension to the one recommended by the ISO/FDIS 20884standard. Calibration was achieved by using the nett peak intensity of sulfur on the fullconcentration range spanning from 1ppm to 3%.
The excitation conditions were chosen as 40kV/1.25mA.The integration time was set at twominutes and was also the total time of analysis due to the simultaneous measurement of the twofixed channels.
At the IFP the sulfur analysis in oil industry products used to be carried out on a WDXRFinstrument equipped with a 3kW tube. Hence it was important to verify the correlation ofresults between the two instruments. In order to do this, over two hundred products fromvarious sources, including gasoline, gas oil, vacuum distillates and residues were selected andmeasured simultaneously with the two instruments. Figures 6 and 7 shown below compare themeasured concentrations, for a large variety of samples (up to 3%), on the high power WDXRFinstrument and on the WDXRF ARL OPTIM’X. Figure 6 offers a bird’s eye view of the lowconcentration levels (1 to 30ppm range) of the global curve.
This comparison confirms the performance of the ARL OPTIM’X, even at very lowconcentrations.
5. DETECTION LIMITS AND QUANTIFICATION LIMITS ESTIMATESA white oil used as blank was measured 10 times consecutively.The estimated standard errorcalculated from the analyses of this sample is called sc. It can ascertain the limits of detection Ldand the limits of quantification Lq by defining Ld = 6σc et Lq = 10σc.The following results wereobtained:
UVF ARL Absolute Relative(mg/kg) OPTIM’X Error) Error
(mg/kg) (mg/kg) (%)
Gasoline 1.33 2.0 0.67 50.38
Gas oil 2.79 2.7 0.09 3.23
Coupe 150-250 3 2.0 1 33.33
Pi-80 5.4 6.0 0.6 11.11
Distillate 6.6 5.0 1.6 24.24
Gas oil 7.6 6.3 1.3 17.11
Table 1: Comparison of sulfur determination at levels below 10ppm in various products usingUVF and ARL OPTIM’X
Figure 6 : Sulfur calibration curve from 0 to 3% (ARL OPTIM’X vs. high power WDXRF)Figure 7 : Detail of the sulfur calibration showing the 1 to 30ppm range.
Figure 8: Comparison of repeatabilities for sulfur levels below 100 ppm.
PIN April/May 2004
ANALYTICAL INSTRUMENTATION?
Figure 9: Comparison of repeatabilities for sulfur levels above 100 ppm.
Figure 10: Reproducibility for low and high sulfur analysis over a two months period.
8. CONCLUSIONThe results of this study have proven extremely encouraging for IFP. They demonstratethe capacity of the entry level WDXRF instrument for routine determination of sulfurin all types of petrochemicals for a very wide range of concentrations. Furthermorethe instrument is very easy to use thanks to its touch screen and a specific analyticalprogram.The operator only needs to touch the pre-programmed icon on the screenand the sample identification fields are displayed for information to be entered (samplereferences, date and time of sampling, pilot unit of origin, operator name). Once theuser has validated all this information, the analysis starts. The method established inthe IFP laboratory has highlighted the following points:• a sampling of 2ml is sufficient • the limit of quantification is about 2ppm with an analysis time of 2 minutes• the range of determination covers the concentration levels from 2ppm to 3% of
S with excellent repeatability and reproducibility (identical or better) comparedto most of the reference methods
Authors:
C. P. Lienemann, E. Roche,A. Kohler1,D. Bonvin1 and G. Matula2
Institut Français du Pétrole-IFP-Lyon, Direction Physique et Analyse,Laboratoire de fluorescence-X,Absorption et Emission Atomique, 69390Vernaison, France
1 Thermo Electron SA, 1024 Ecublens, Switzerland2 Thermo Electron, 91963 Courtaboeuf, France
AcknowledgmentsThis paper decribes a presentation done at "Rayons X et Matière 2003" and was first publishedin J.Phys.V, France, EDP Sciences editor. Figure 10 shows new results not yet published.