pet industry update august 2017 - brooks houghton · pet industry update august 2017. brooks,...
TRANSCRIPT

780 Third Avenue • 35th Floor • New York, NY 10017
Pet Industry Update
August 2017

BROOKS, HOUGHTON & COMPANY, INC. 2
Brooks, Houghton & Company, Inc.
Introduction
Brooks, Houghton & Company, Inc. (“BHC”) is a merchant banking firm dedicated to providing corporate finance advisory services and direct investment to:
• Middle-market public and private companies
• Emerging growth companies
Founded in 1989, BHC emphasizes building long-term relationships with its clients by:
• Providing innovative corporate finance solutions and professional execution at a reasonable cost
• Taking a partnership approach with clients based upon mutual trust and responsibility
• Delivering independent, objective and discreet advice
Applying these principles, BHC has earned a reputation for providing high quality, reliable professional services to its corporate clients, investors and referral sources in the United States and internationally
BHC’s merchant banking products and services include:
• Mergers and acquisitions advisory
• Debt and equity private placements through Brooks Houghton Securities, Inc. (BHS), a FINRA member
• Valuations and fairness opinions
• General corporate finance advisory
• Principal investments in interim and bridge capital
Additionally, BHC is a member of Globalscope Partners, a premier global mergers and acquisitions advisors network
Why Brooks, Houghton & Company
BHC is well suited to the task of serving as an exclusive M&A advisor
• Established and experienced merchant bank with both M&A and capital raising capabilities, as well as industry knowledge
• Provide senior-level attention to the assignment on a day-to-day basis
• Offer Wall Street-quality work product and experience
• Well versed in helping small and mid-sized business owners/operators achieve their liquidity and growth objectives
• Long-standing working relationships with third-party capital providers (i.e. senior debt, mezzanine debt and private equity) and strategic partners
• Confident in our ability to attain the best possible transaction outcome
For more information, please contact:
Kevin Centofanti, CFAPresident
Tel: 212-329-1675
Marc R. LeizmanExecutive Director
Tel: 216-287-4228
Anthony MorettiSenior Managing Director and Head of IB
Tel: 212-329-1667

BROOKS, HOUGHTON & COMPANY, INC.
Life Cycle Mature
Revenue Volatility Low
Capital Intensity High
Market Concentration Medium
Regulation Level Very High
Technology Change Medium
Entry Barriers Medium
Competition Level High
3
Industry Overview
Source: IBIS World; American Pet Products Association
Total U.S. pet industry revenue is estimated at almost $70 billion in 2017 with the pet food market segment projected at approximately $27 billion in 2017. An increase
in pet ownership has coincided with a growing tendency to treat pets as members of the family, thereby encouraging the purchase of higher-priced premium pet food
products that are marketed as possessing special benefits, formulations or specialized ingredients.
Products Segmentation
Major Companies in Pet Food Market (Market Share)
Pet Food Market – Revenue
Low Medium Very HighHigh
Industry Structure
Supply Industries
• Soybean Farming• Corn Farming• Vegetable Farming• Meat, Beef, & Poultry Processing• Seafood Preparation
Demand Industries
• Grocery Wholesaling • Supermarkets & Grocery Stores• Convenience Stores• Pet Stores• Consumers
Key Success Factors
Access to high-quality inputsProduction of premium
goods and services
Effective quality controlEconomies of scale and scope
0.0%
1.0%
2.0%
3.0%
24,000
26,000
28,000
30,000
32,000
2016 2017 2018 2019 2020 2021
$ million % Change
Natural and organic pet
food and treats, 31.3%
Dry dog food, 30.3%
Dry cat food, 12.4%
Dog treats, 8.7%
Wet cat food, 8.2%
Wet dog food, 7.1%
Cat treats, 2.0%
Nestle SA, 19.6%
Mars, Inc., 16.8%
The JM Smucker
Company, 9.0%
Colgate-Palmolive Company,
5.1%
Blue Bufflo Pet Products, Inc.,
4.3%
Other, 45.2%
BROOKS, HOUGHTON & COMPANY, INC. 4
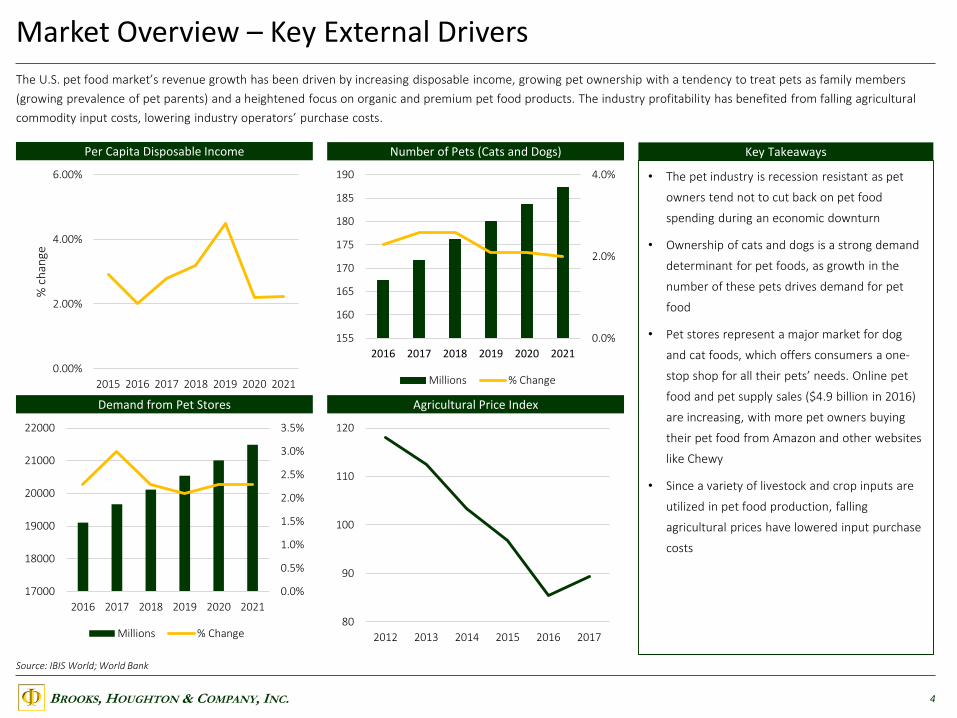
Market Overview – Key External Drivers
Source: IBIS World; World Bank
The U.S. pet food market’s revenue growth has been driven by increasing disposable income, growing pet ownership with a tendency to treat pets as family members
(growing prevalence of pet parents) and a heightened focus on organic and premium pet food products. The industry profitability has benefited from falling agricultural
commodity input costs, lowering industry operators’ purchase costs.
Per Capita Disposable Income Number of Pets (Cats and Dogs) Key Takeaways
Demand from Pet Stores Agricultural Price Index
• The pet industry is recession resistant as pet
owners tend not to cut back on pet food
spending during an economic downturn
• Ownership of cats and dogs is a strong demand
determinant for pet foods, as growth in the
number of these pets drives demand for pet
food
• Pet stores represent a major market for dog
and cat foods, which offers consumers a one-
stop shop for all their pets’ needs. Online pet
food and pet supply sales ($4.9 billion in 2016)
are increasing, with more pet owners buying
their pet food from Amazon and other websites
like Chewy
• Since a variety of livestock and crop inputs are
utilized in pet food production, falling
agricultural prices have lowered input purchase
costs
0.00%
2.00%
4.00%
6.00%
2015 2016 2017 2018 2019 2020 2021
% c
han
ge
0.0%
2.0%
4.0%
155
160
165
170
175
180
185
190
2016 2017 2018 2019 2020 2021
Millions % Change
0.0%
0.5%
1.0%
1.5%
2.0%
2.5%
3.0%
3.5%
17000
18000
19000
20000
21000
22000
2016 2017 2018 2019 2020 2021
Millions % Change80
90
100
110
120
2012 2013 2014 2015 2016 2017

BROOKS, HOUGHTON & COMPANY, INC. 5
M&A Deal Activity – Overview
Source: Pitchbook, Thompson One, GF Data *As of 3/31/2017
• Perceived high valuations and the anticipation of a tax reform contributed to the
slow down in the U.S. M&A market during 1Q 2017
• The lower middle market remains the most active market sector despite seeing a
slight decrease in terms of market share compared to 1Q 2016
• Valuation multiples for middle market transactions below $250mm remained steady
• 2016 represented a slow down in pet food M&A compared to the previous three
years
• Valuations for pet food companies are historically high, so investors are looking
elsewhere for values, and there is a scarcity of opportunities after the big deals in
recent years
M&A Deals by Deal Size U.S. M&A Activity
U.S. M&A Activity & Transactions in the Pet Food Market U.S. EV / EBITDA Multiples By Transaction Size
0%
10%
20%
30%
40%
50%
60%
70%
80%
90%
100%
1Q 2Q 3Q 4Q 1Q 2Q 3Q 4Q 1Q 2Q 3Q 4Q 1Q 2Q 3Q 4Q 1Q
2013 2014 2015 2016 2017
$5B+
$1B-$5B
$500M-$1B
$250M-$500M
$100M-$250M
Under $100M
$5
54
$5
88
$7
18
$6
85
$9
84
$1
,36
4
$1
,38
6
$265
7,104
8,175
9,2088,616
10,824
11,627
9,641
1,899
0
2,000
4,000
6,000
8,000
10,000
12,000
14,000
$0
$200
$400
$600
$800
$1,000
$1,200
$1,400
$1,600
2010 2011 2012 2013 2014 2015 2016 2017*
Deal Value ($B) Deal Count
5.6x 5.8x 6.0x6.6x 6.6x 6.4x
8.4x7.8x
7.3x7.8x
9.0x 9.0x
0.0x
2.0x
4.0x
6.0x
8.0x
10.0x
2014 2015 2016
$10-25mm $25-50mm $50-100mm $100-250mm

BROOKS, HOUGHTON & COMPANY, INC. 6
Private Equity Deal Activity – Overview
Source: Pitchbook, Thompson One, GF Data
• Across industry sectors, PE-backed transactions have slightly decreased compared to
the same period in 2016 for the same reasons as the overall M&A market
• Transactions up to $100mm still account for about 70% of all U.S. PE deals with a
focus on add-on transactions
• The percentage of add-on transactions has been growing at a steady pace since 2009
• The middle market transactions below $250mm have been stacked up with a large
portion of equity and senior debt, a small portion of subordinated debt for the past
three years
U.S. PE Deals by Deal Size U.S. add-on % of Buyout Activity
1,0
37
1,4
54
1,0
90
75
0 1,1
40
1,3
49
1,5
23
1,4
24 1,8
71
1,9
36
1,8
70
36
6
1,2
09
1,3
60
1,0
36
59
9
90
6 99
3 1,1
77
96
0
1,2
00
1,2
29
1,0
60
190
46%
52% 51%
56% 56%58% 56%
60% 61% 61%64%
66%
0%
10%
20%
30%
40%
50%
60%
70%
0
500
1,000
1,500
2,000
2,500
3,000
3,500
2006 2007 2008 2009 2010 2011 2012 2013 2014 2015 2016 2017
Add-on Non add-on Add-on % of buyout
U.S. Private Equity Deal Activity U.S. Middle Market Capital Stack
0%
10%
20%
30%
40%
50%
60%
70%
80%
90%
100%
2006 2007 2008 2009 2010 2011 2012 2013 2014 2015 2016 2017*
$2.5B+
$1B-$2.5B
$500M-$1B
$100M-$500M
$25M-$100M
Under $25M
39.4% 37.3% 37.2% 41.9% 44.0% 44.4% 41.8% 38.1% 43.1% 43.1% 43.6% 40.2%
17.1% 14.7% 12.3%12.3%
16.3% 10.8% 11.5% 14.4% 10.1% 12.6% 12.9%11.7%
43.5% 48.0% 50.5% 45.8% 39.7% 44.8% 46.7% 47.5% 46.8% 44.3% 43.5% 48.1%
0%
20%
40%
60%
80%
100%
2014 2015 2016
Senior Debt Sub Debt Equity

BROOKS, HOUGHTON & COMPANY, INC.
9.0x
9.9x
9.4x
9.1x
16.2x
16.9x
5.0x 10.0x 15.0x 20.0x
EV / EBITDA
EV / LTM EBITDA
EV / LTM EBITDA(Pet Products)
(Consumer Products w/Pet Lines
7
Valuation Summary
Key Takeaways
• The two powerful consumer trends, the
humanization of pets and growing demand for
premium and natural foods, in the pet food
sector have significant impact on the
valuations
• Based on precedent transactions since 2012,
the EV / Revenue range is 0.6x to 3.4x, while
the valuation range based on public
comparable companies ranges from 1.0x to
3.9x (pet products) and from 1.1x to 4.7x
(consumer products with pet lines)
• EV / EBITDA multiples of public comparable
companies range from 9.4x to 16.9x (pet
products) and from 9.9x to 16.2x (consumer
products with pet lines)
• The assessment of the EV / EBITDA multiple
for precedent transaction yields a broad
multiple range as a result of too few data
points, however, the average of the
transactions was 12.8x
EV / Revenue Multiple Range
EV / EBITDA Multiple Range
Public Comparable Companies
Precedent M&A Transactions
Public Comparable Companies
Precedent M&A Transactions
With most companies in the pet food space being private, this valuation summary is based on the limited data available on precedent transactions, four pet products
public companies, and six consumer products public companies with pet lines. In general, valuations remain high due to robust M&A activity fueled by private equity
interest, mainstream food companies looking to participate in the pet food market and companies within the space looking to consolidate over the past few years.
Source: CapitalIQ
0.6x
1.1x
1.1x
3.4x
4.7x
3.9x
0.0x 1.0x 2.0x 3.0x 4.0x 5.0x
EV / Revenue
EV / LTM Revenue
EV / LTM Revenue(Pet Products)
(Consumer Products w/Pet Lines

BROOKS, HOUGHTON & COMPANY, INC. 8
Public Comparable Companies – Detailed Overview
Source: CapitalIQ
Company Name Ticker Business DescriptionShare Price
Enterprise Value
LTM Revenue
LTM EBITDA
LTM Gross
Margin
LTM EBITDA Margin
LTM Revenue Growth
LTM EBITDA Growth
Pet Products
Blue Buffalo Pet Products, Inc.
NasdaqGS:BUFF
Dog and cat food made with whole meats, fruits and vegetables, and other high-quality, natural ingredients
$22.9 $4,624.8 $1,171.9 $273.4 45.3% 23.3% 10.7% 18.6%
Central Garden & Pet Company
NasdaqGS:CENT
Edible bones, edible and non-edible chews, dog and cat food and treats, toys, pet carriers, grooming supplies
31.7 2,130.8 1,917.4 190.3 30.7% 9.9% 9.8% 22.7%
Freshpet, Inc. NasdaqGM:FRPT
Natural fresh, refrigerated meals, and treats for dogs and cats
16.4 554.4 136.1 7.5 45.0% 5.5% 12.9% 48.2%
OurPet's Company OTCPK:OPCO
Various accessories and consumable pet products for improving the health, safety, comfort, and enjoyment of pets
1.4 32.1 27.4 3.4 33.0% 12.4% 12.4% 15.7%
Mean $1,835.5 $813.2 $118.7 38.5% 12.8% 11.4% 26.3%
Median 1,342.6 654.0 98.9 39.0% 11.2% 11.6% 20.6%
Low 32.1 27.4 3.4 30.7% 5.5% 9.8% 15.7%
High 4,624.8 1,917.4 273.4 45.3% 23.3% 12.9% 48.2%
$ in millions

BROOKS, HOUGHTON & COMPANY, INC. 9
Public Comparable Companies – Detailed Overview (cont’d)
Source: CapitalIQ
Company Name Ticker Business DescriptionShare Price
Enterprise Value
LTM Revenue
LTM EBITDA
LTM Gross
Margin
LTM EBITDA Margin
LTM Revenue Growth
LTM EBITDA Growth
Consumer Products w/Pet Lines
Nestlé S.A. SWX:NESN Pet food, treats and litter under the brands including Purina Pro Plan, Purina Dog Chow, Friskies, Beneful and Purina ONE
$85.4 $281,021.9 $93,012.6 $17,955.9 50.8% 19.3% 0.8% 2.0%
Colgate-Palmolive Company
NYSE:CL Pet nutrition products for everyday nutritional needs and markets its pet nutrition products for dogs and cats; owns Hill's Pet Nutrition
73.9 71,580.6 15,195.0 4,429.0 60.5% 29.1% -3.4% 2.1%
Unicharm Corporation TSE:8113 Pet care products that include pet foods, excrement cleanup sheets, system toilets, and disposable diapers
24.9 15,403.1 6,042.5 991.1 45.5% 16.4% -6.8% 2.2%
The J. M. Smucker Company
NYSE:SJM Pet products comprising dry and wet dog food, dry and wet cat food, dog snacks, and cat snacks; owns Big Heart Pet Pet Brands
118.2 18,887.5 7,392.3 1,666.3 38.4% 22.5% -5.4% -3.1%
Spectrum Brands Holdings, Inc.
NYSE:SPB Specialty pet supplies including dog and cat treats and small animal foods through its Global Pet Supplies business
125.3 11,151.1 4,993.0 897.0 38.6% 18.0% 0.2% 8.7%
Oil-Dri Corporation of America
NYSE:ODC Petcare products from clay minerals; a broad range of litters and liners.
42.6 284.1 261.4 28.6 29.3% 10.9% -0.6% -4.3%
Mean $66,388.0 $21,149.5 $4,328.0 43.9% 19.4% -2.5% 1.2%
Median 17,145.3 6,717.4 1,328.7 42.1% 18.6% -2.0% 2.0%
Low 284.1 261.4 28.6 29.3% 10.9% -6.8% -4.3%
High 281,021.9 93,012.6 17,955.9 60.5% 29.1% 0.8% 8.7%
$ in millions

BROOKS, HOUGHTON & COMPANY, INC. 10
Public Comparable Companies – Pet Products
Source: CapitalIQNotes: (1) FRPT has relatively high valuation multiples due to its strategy to drive annual sales growth in excess of 20% through 2020, resulting in EBITDA margin of 20% compared to its LTM EBITDA margin of 5.5%
EV / LTM Revenue
EV / LTM EBITDA
3.9x
1.1x 1.2x1.2x
0.0x
1.5x
3.0x
4.5x
NasdaqGS:BUFF NasdaqGS:CENT OTCPK:OPCO
EV / LTM Revenue Median
16.9x
11.2x9.4x
11.2x
0.0x
10.0x
20.0x
30.0x
40.0x
NasdaqGS:BUFF NasdaqGS:CENT OTCPK:OPCO
EV / LTM EBITDA Median

BROOKS, HOUGHTON & COMPANY, INC. 11
Public Comparable Companies – Consumer Products w/Pet Lines
Source: CapitalIQ
EV / LTM Revenue
EV / LTM EBITDA
3.0x
4.7x
2.5x 2.6x2.2x
1.1x
2.6x
0.0x
1.0x
2.0x
3.0x
4.0x
5.0x
SWX:NESN NYSE:CL TSE:8113 NYSE:SJM NYSE:SPB NYSE:ODC
EV / LTM Revenue Median
15.7x 16.2x15.5x
11.3x12.4x
9.9x
14.0x
0.0x
6.0x
12.0x
18.0x
SWX:NESN NYSE:CL TSE:8113 NYSE:SJM NYSE:SPB NYSE:ODC
EV / LTM EBITDA Median

BROOKS, HOUGHTON & COMPANY, INC. 12
Select U.S. M&A Precedent Transactions
Source: CapitalIQ
Strategic BuyerAcquisition Date
Select Corporate Acquisitions
Spectrum Brands Holdings, Inc. 04/28/1701/20/1509/23/14
• Petmatrix, LLC from Friend Skoler & Co. (a private equity firm)• Salix, LLC• P&G, Remaining European Pet Food Brands
Nestlé Purina PetCare Company 07/21/1501/20/14
• Merrick Pet Care, Inc. • Performance Pet Nutrition, LLC
The J.M. Smucker Company 02/03/15 • Big Heart Pet Brands (Big Heart Pet Brands acquired Natural Balance Pet Foods, Inc. on 05/22/13)
$ in millions
Select Active Strategic Buyers
Financial Sponsors(Portfolio Companies)
Acquisition Date
Select Corporate Acquisitions
Frontenac Company(Whitebridge Pet Brands: formerly known as Cloud Star)
04/18/1701/06/1507/16/14
• Arthur Dogswell, LLC (Arthur Dogswell acquired Natural Pet Products on 03/09/2015)
• Tiki brands of Petropics Gourmet Whole Foods• Cloud Star Corporation
Graham Partners, Inc.(Bright Pet)
11/11/1604/28/16
• Mercer Foods, LLC• Ohio Pet Foods, Inc.; Southern Tier Pet Nutrition, LLC; Blackwood
Pet Food, LLC
Berwind Corp.(WellPet)
02/07/1701/07/16
• Whimzees• Sojourner Farms, LLC
J.H. Whitney & Co.(C.J. Foods)
02/16/1606/04/14
• Day Six Pet Nutrition, LLC• C.J. Foods, Inc.
Select Sponsors with Active Portfolio Holdings
BROOKS, HOUGHTON & COMPANY, INC. 13
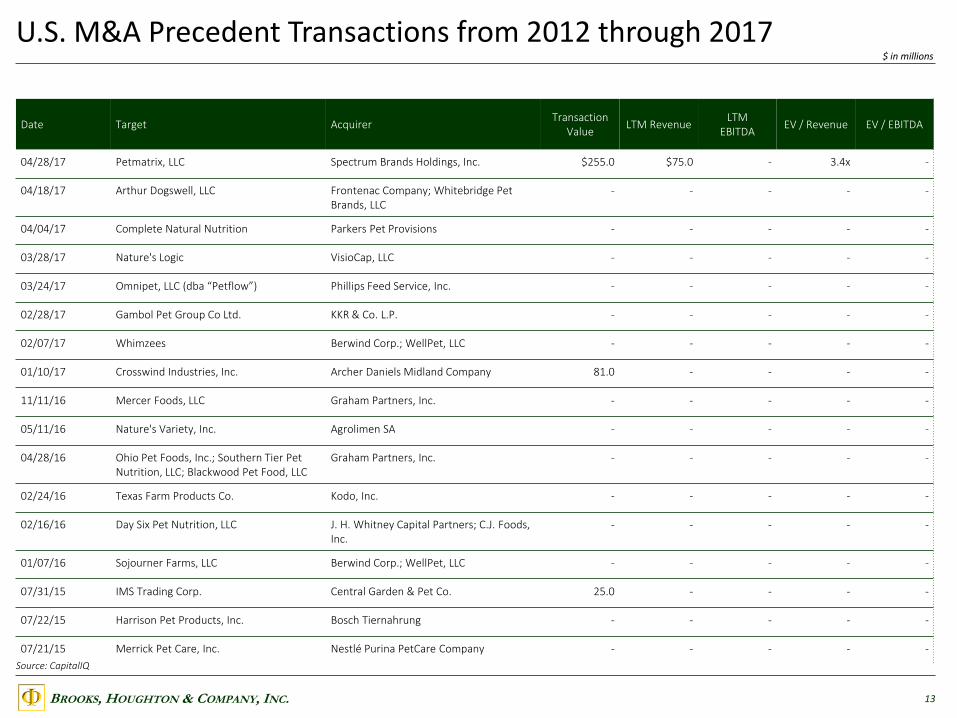
U.S. M&A Precedent Transactions from 2012 through 2017
Source: CapitalIQ
Date Target AcquirerTransaction
ValueLTM Revenue
LTMEBITDA
EV / Revenue EV / EBITDA
04/28/17 Petmatrix, LLC Spectrum Brands Holdings, Inc. $255.0 $75.0 - 3.4x -
04/18/17 Arthur Dogswell, LLC Frontenac Company; Whitebridge Pet Brands, LLC
- - - - -
04/04/17 Complete Natural Nutrition Parkers Pet Provisions - - - - -
03/28/17 Nature's Logic VisioCap, LLC - - - - -
03/24/17 Omnipet, LLC (dba “Petflow”) Phillips Feed Service, Inc. - - - - -
02/28/17 Gambol Pet Group Co Ltd. KKR & Co. L.P. - - - - -
02/07/17 Whimzees Berwind Corp.; WellPet, LLC - - - - -
01/10/17 Crosswind Industries, Inc. Archer Daniels Midland Company 81.0 - - - -
11/11/16 Mercer Foods, LLC Graham Partners, Inc. - - - - -
05/11/16 Nature's Variety, Inc. Agrolimen SA - - - - -
04/28/16 Ohio Pet Foods, Inc.; Southern Tier Pet Nutrition, LLC; Blackwood Pet Food, LLC
Graham Partners, Inc. - - - - -
02/24/16 Texas Farm Products Co. Kodo, Inc. - - - - -
02/16/16 Day Six Pet Nutrition, LLC J. H. Whitney Capital Partners; C.J. Foods, Inc.
- - - - -
01/07/16 Sojourner Farms, LLC Berwind Corp.; WellPet, LLC - - - - -
07/31/15 IMS Trading Corp. Central Garden & Pet Co. 25.0 - - - -
07/22/15 Harrison Pet Products, Inc. Bosch Tiernahrung - - - - -
07/21/15 Merrick Pet Care, Inc. Nestlé Purina PetCare Company - - - - -
$ in millions

BROOKS, HOUGHTON & COMPANY, INC. 14
U.S. M&A Precedent Transactions from 2012 through 2017 (cont’d)
Source: CapitalIQ
Date Target AcquirerTransaction
ValueLTM Revenue
LTMEBITDA
EV / Revenue EV / EBITDA
04/02/15 Partner in Pet Food Pamplona Capital Management, LLC 339.0 260.8 37.7 1.3x 9.0x
03/13/15 Manna Pro Products, LLC Broad Sky Partners - - - - -
03/09/15 Natural Pet Products Arthur Dogswell, LLC - - - - -
03/03/15 Protein For Pets Undisclosed Private Equity Firm - - - - -
02/03/15 Big Heart Pet Brands The J.M. Smucker Company 5,769.2 2,266.5 319.5 2.5x 18.1x
01/20/15 Salix LLC Spectrum Brands Holdings, Inc. 148.0 98.7 - 1.5x -
01/06/15 Tiki brands of Petropics Gourmet Whole Foods
Frontenac Company; Cloud Star Corporation
- - - - -
09/23/14 P&G, Remaining European Pet Food Brands
Spectrum Brands Holdings, Inc. 116.0 193.3 - 0.6x -
07/16/14 Cloud Star Corporation Frontenac Company - - - - -
07/01/14 Cat-Sip Real Milk Treats for Pets PET-AG, Inc. - - - - -
06/04/14 C.J. Foods, Inc. J.H. Whitney & Co LLC - - - - -
06/04/14 Scotts Miracle-Gro Company Global Harvest Foods - - - - -
04/09/14 P&G, Pet Food Brands (Lams, Eukanuba, Natura)
Mars Petcare US, Inc. 2,900.0 1,611.1 200.0 1.8x 14.5x
03/26/14 Three Dog Bakery Undisclosed Private Equity Firm - - - - -
02/10/14 Pet Carousel Inc. Cargill, Incorporated - - - - -
01/20/14 Performance Pet Nutrition, LLC Nestlé Purina PetCare Company - - - - -
12/04/13 Solid Gold Pets, LLC VMG Partners - - - - -
$ in millions

BROOKS, HOUGHTON & COMPANY, INC. 15
U.S. M&A Precedent Transactions from 2012 through 2017 (cont’d)
Source: CapitalIQ
Date Target AcquirerTransaction
ValueLTM Revenue
LTMEBITDA
EV / Revenue EV / EBITDA
11/06/13 PetAg, Inc. PBI/Gordon Corporation - - - - -
06/20/13 Hare Of The Dog Treat Planet, LLC - - - - -
05/22/13 Natural Balance Pet Foods, Inc. Big Heart Pet Brands 331.0 - - - -
01/11/13 Phelps Industries, LLC Wafra Investment Advisory Group - - - - -
09/13/12 Sergeant’s Pet Care Products, Inc. Perrigo Co. 285.0 142.5 30.0 2.0x 9.5x
08/31/12 Petmatrix, LLC Friend Skoler & Co., Inc. - - - - -
08/21/12 Prestige Pet Products, Inc. For The Earth Corp. - - - - -
Mean $1,024.9 $664.0 $146.8 1.9x 12.8x
Median 270.0 193.3 118.8 1.8x 12.0x
Low 25.0 75.0 30.0 0.6x 9.0x
High 5,769.2 2,266.5 319.5 3.4x 18.1x
$ in millions