pet data report 2017 - pet food manufacturing association report/pfma-pet-popula… · pet data...
TRANSCRIPT

6th Floor, 10 Bloomsbury WayLondon, WC1A 2SL
T 020 7379 9009E [email protected]
www.pfma.org.uk
Pet Data Report 2017PFMA
State of the Nation 03
UK Pet Population 2017 04
UK Regional Content 2017 05
Cats and Dogs Per Household 2017 06
Ages of Cat and Dog Owners 06
First Pets 07
Pet Nutrition Research 08
UK Market Data 10
Wild Birds and Feeding Habits 11
Worldwide Data 12
Dogs Trust Study 14
Summary and Methodology Overview 16
Contents
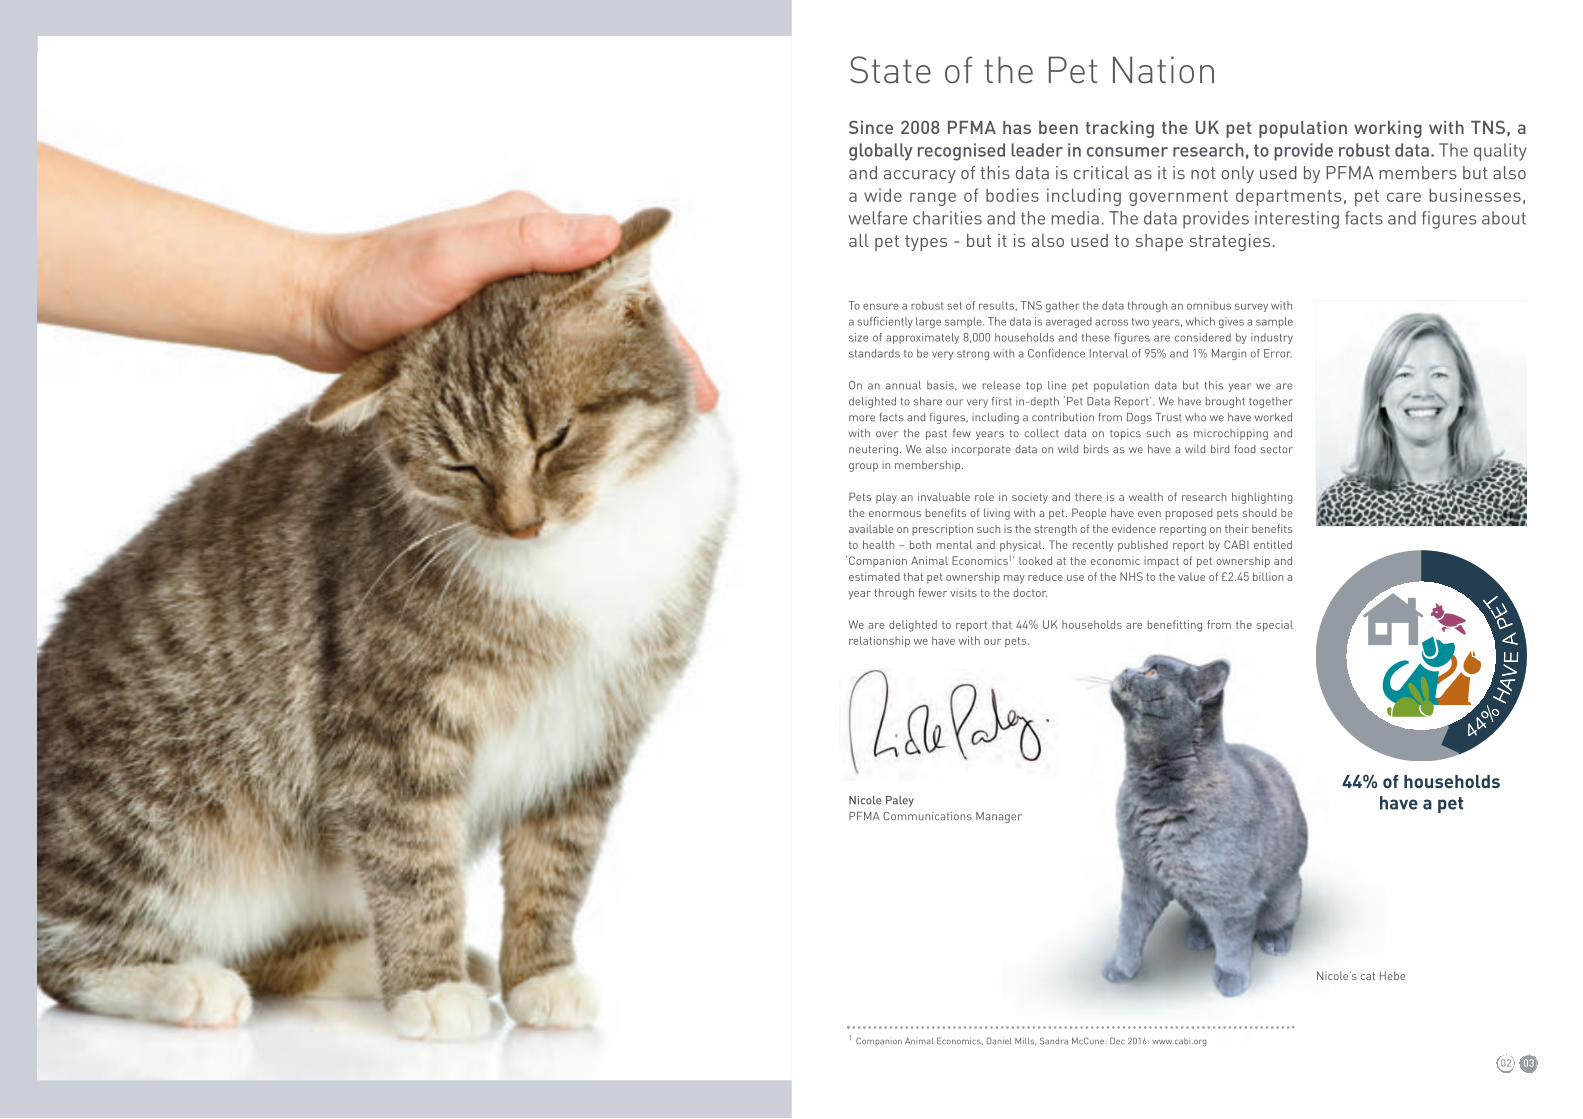
To ensure a robust set of results, TNS gather the data through an omnibus survey witha sufficiently large sample. The data is averaged across two years, which gives a samplesize of approximately 8,000 households and these figures are considered by industrystandards to be very strong with a Confidence Interval of 95% and 1% Margin of Error.
On an annual basis, we release top line pet population data but this year we aredelighted to share our very first in-depth ‘Pet Data Report’. We have brought togethermore facts and figures, including a contribution from Dogs Trust who we have workedwith over the past few years to collect data on topics such as microchipping andneutering. We also incorporate data on wild birds as we have a wild bird food sectorgroup in membership.
Pets play an invaluable role in society and there is a wealth of research highlightingthe enormous benefits of living with a pet. People have even proposed pets should beavailable on prescription such is the strength of the evidence reporting on their benefitsto health – both mental and physical. The recently published report by CABI entitled
‘Companion Animal Economics1’ looked at the economic impact of pet ownership andestimated that pet ownership may reduce use of the NHS to the value of £2.45 billion ayear through fewer visits to the doctor.
We are delighted to report that 44% UK households are benefitting from the specialrelationship we have with our pets.
Nicole PaleyPFMA Communications Manager
Since 2008 PFMA has been tracking the UK pet population working with TNS, aglobally recognised leader in consumer research, to provide robust data. The qualityand accuracy of this data is critical as it is not only used by PFMA members but alsoa wide range of bodies including government departments, pet care businesses,welfare charities and the media. The data provides interesting facts and figures aboutall pet types - but it is also used to shape strategies.
State of the Pet Nation
02 03
1 Companion Animal Economics, Daniel Mills, Sandra McCune: Dec 2016: www.cabi.org
44% of householdshave a pet
44% H
AV
E A
PE
T
T
4444
T
EET
PPE
AE
VA
HHA
%44%
Nicole’s cat Hebe
10
1
15
38
0
0
2
1
389
7
2
15
21
1
1
1
1
1098
11
4
22
31
3
1
1
2
606
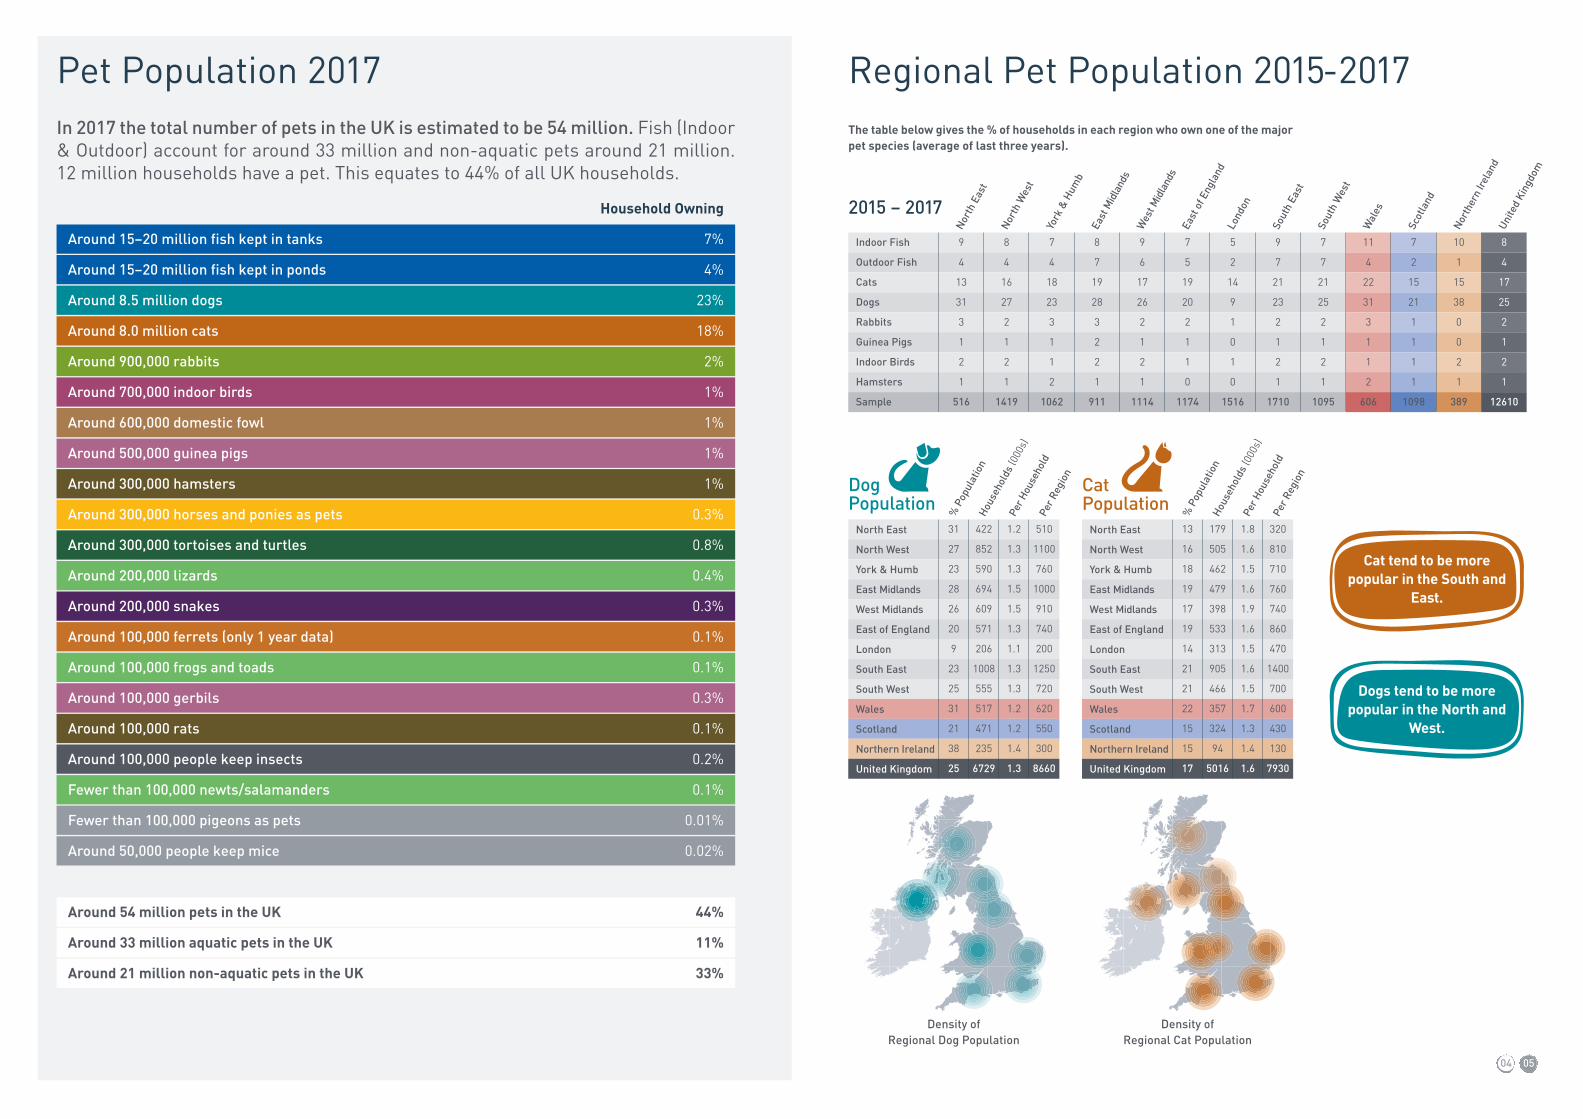
Pet Population 2017 Regional Pet Population 2015-2017
04 05
Density ofRegional Dog Population
Density ofRegional Cat Population
Cat tend to be morepopular in the South and
East.
Dogs tend to be morepopular in the North and
West.
The table below gives the % of households in each region who own one of the majorpet species (average of last three years).
2015 – 2017
8
4
17
25
2
1
2
1
12610
8
4
17
25
2
1
2
1
12610
31
27
23
28
26
20
9
23
25
31
21
38
25
422
852
590
694
609
571
206
1008
555
517
471
235
6729
1.2
1.3
1.3
1.5
1.5
1.3
1.1
1.3
1.3
1.2
1.2
1.4
1.3
510
1100
760
1000
910
740
200
1250
720
620
550
300
8660
Indoor Fish
Outdoor Fish
Cats
Dogs
Rabbits
Guinea Pigs
Indoor Birds
Hamsters
Sample
North East
North West
York & Humb
East Midlands
West Midlands
East of England
London
South East
South West
Wales
Scotland
Northern Ireland
United Kingdom
Unite
d Ki
ngdo
m
Nort
hern
Irel
and
Scot
land
Wal
es
Sout
h W
est
Sout
h Ea
st
Lond
on
East
of E
ngla
nd
Wes
t Mid
land
s
East
Mid
land
s
York
& H
umb
North
Wes
t
North
Eas
t
% P
opul
atio
nHo
useh
olds
(000
s)Pe
r Hou
seho
ldPe
r Reg
ion
13
16
18
19
17
19
14
21
21
22
15
15
17
179
505
462
479
398
533
313
905
466
357
324
94
5016
1.8
1.6
1.5
1.6
1.9
1.6
1.5
1.6
1.5
1.7
1.3
1.4
1.6
320
810
710
760
740
860
470
1400
700
600
430
130
7930
North East
North West
York & Humb
East Midlands
West Midlands
East of England
London
South East
South West
Wales
Scotland
Northern Ireland
United Kingdom
% P
opul
atio
nHo
useh
olds
(000
s)Pe
r Hou
seho
ldPe
r Reg
ion
CatPopulation
DogPopulation
In 2017 the total number of pets in the UK is estimated to be 54 million. Fish (Indoor& Outdoor) account for around 33 million and non-aquatic pets around 21 million.12 million households have a pet. This equates to 44% of all UK households.
Household Owning
Around 15–20 million fish kept in tanks 7%
Around 15–20 million fish kept in ponds 4%
Around 8.5 million dogs 23%
Around 8.0 million cats 18%
Around 900,000 rabbits 2%
Around 700,000 indoor birds 1%
Around 600,000 domestic fowl 1%
Around 500,000 guinea pigs 1%
Around 300,000 hamsters 1%
Around 300,000 horses and ponies as pets 0.3%
Around 300,000 tortoises and turtles 0.8%
Around 200,000 lizards 0.4%
Around 200,000 snakes 0.3%
Around 100,000 ferrets (only 1 year data) 0.1%
Around 100,000 frogs and toads 0.1%
Around 100,000 gerbils 0.3%
Around 100,000 rats 0.1%
Around 100,000 people keep insects 0.2%
Fewer than 100,000 newts/salamanders 0.1%
Fewer than 100,000 pigeons as pets 0.01%
Around 50,000 people keep mice 0.02%
Around 54 million pets in the UK 44%
Around 33 million aquatic pets in the UK 11%
Around 21 million non-aquatic pets in the UK 33%
8
4
16
27
2
1
2
1
1419
9
4
13
31
3
1
2
1
516
7
4
18
23
3
1
1
2
1062
8
7
19
28
3
2
2
1
911
9
6
17
26
2
1
2
1
1114
7
5
19
20
2
1
1
0
1174
5
2
14
9
1
0
1
0
1516
9
7
21
23
2
1
2
1
1710
7
7
21
25
2
1
2
1
1095

06 07
Cats and Dogs Per Household 2017Our research highlights the number of cats and dogs per household. Single cat andsingle dog owning households predominate. However almost a third of cat owninghomes have two cats and almost a quarter of dog owning households have two.
First Pets
Number of Dogs owned as pets
1 Dog
2 Dogs
3 Dogs
4 Dogs
5 or more Dogs
75%
21%
3%
1%
0%
74%
22%
3%
1%
0%
76%
20%
4%
0%
0%
69%
25%
5%
2%
0%
83%
11%
5%
1%
0%
76%
22%
2%
0%
0%
71%
23%
5%
1%
0%
76%
19%
3%
2%
0%
68%
29%
1%
0%
2%
84%
15%
1%
0%
0%
75+
65–7
4
55–6
4
45–5
4
35–4
4
25–3
4
16–2
4
Fem
ale
Mal
e
TOTA
L
AGE
Number of Cats owned as pets
1 Cat
2 Cats
3 Cats
4 Cats
5 or more Cats
60%
29%
7%
2%
2%
58%
31%
8%
2%
2%
61%
28%
6%
2%
3%
68%
24%
7%
1%
0%
58%
33%
7%
1%
1%
54%
32%
7%
2%
4%
56%
32%
7%
3%
1%
59%
24%
10%
5%
3%
69%
23%
4%
1%
3%
66%
30%
2%
0%
2%
75+
65–7
4
55–6
4
45–5
4
35–4
4
25–3
4
16–2
4
Fem
ale
Mal
e
TOTA
L
AGE
21% TWO DOGS
21% of dog owninghouseholds have two
29% TWO CATS
WTTW%92
OWWO
ST
AATC
O
29% of cat owninghouseholds have two
25% INCREASE IN M
ALE OWNERSHIP
53%
PERFECTPET
53% would define dogs as theperfect pet
23%
PERFECTPET
23% would define cats as theperfect pet
A rise of over 25% in thenumber of men owning cats
(approx. 1m more men in 2017than 2016)
As with general ownership patterns cats were more likely to have been a first pet inthe south-east and dogs in the north. Rabbits, hamsters and guinea pigs made up atotal of 10% (5%, 4% and 1% respectively). This is, in relative terms, a lot higher thanthe proportions of those species in the general population survey, suggesting thatsmall animals are more likely to be owned by households with children as ‘first pets’.
Of the 2,124* households asked, 28% said that they had or would consider owning asmall mammal. 35% of households with children reported that they would consider asmall mammal.
‘Some people assume it is difficult to look after a small mammal and they don’t know howto provide the right care. There is a wealth of educational resources out there to supportwould-be owners so they don’t need to miss out. Information is available from welfarecharities and organisations such as PDSA and RSPCA and as the experts in nutrition,PFMA provides feeding factsheets and guidance available at www.pfma.org.uk/pet-care.
The perfect pets were given as Dogs (53%) & Cats (23%)
The two reasons given for nominating a perfect pet were companionship (39%) andthe ease of looking after (28%). Variations in these two responses came with the ageof the respondents with predictable results… an older person was more likely to reportthe reason as companionship, a younger person for ease of looking after (althoughthe variations are not huge).
*Total sample size in 2017 was 4220. However, this question was only asked of 2124

08 09
Nutrition Feeding HabitsPFMA focuses on educating pet owners and pet professionals on nutrition andattends numerous events such as London Vet Show (LVS) and the British VeterinaryNursing Association (BVNA) Congress as well as visiting UK vet schools.
As a result of these findings, we want to investigate the numerous reasons why petowners are not always succeeding in providing their pets with optimum nutrition.
Reading The Facts
In terms of attitudes towards reading nutritional information on the pet food label,43% of owners never read this and the main reason (40%) is that they never readinformation on packaging. A further 9% claim no interest in the calorie consumptionby their pet(s). 35% claim to already have the relevant knowledge about the correctdiet for their pet(s).
Feeding guidelines are a vital piece of information on the pet food label as they providerecommended portion sizes based on the size/weight of a pet. PFMA advises ownersto follow the feeding guidelines, adapting to the individual needs of their pet. To helpowners feed to ideal body condition, PFMA has developed Pet Size-O-Meters availableat www.pfma.org.uk/pet-size-o-meter.
Our research shows that 88% of owners choose a commercially prepared pet foodbut we know that owners supplement with snacks. Our Obesity Report (2014)confirmed that over a third of owners use ‘human’ food to treat.
Making Choices 2017 PFMA/TNS
% Households Acquiring Feeding Knowledge
Did you know that 1 piece of cheese or ham for an average sized woman is theequivalent to 9 pieces for an average sized cat? To find out how calorific
common human food treats are for pets, download the PFMA ‘Did you Know’Poster, available at www.pfma.org.uk/weight-management-tools
From previous experience 40%40%
23%21%
19%22%
10%11%
8%4%
6%4%
5%5%
3%1%
Advice from the vet
From trial and error
Reading the labels on pet food
Reading about pet nutrition
From speaking to other owners
Online information on pet nutrition
Advice from breeder groups
Dogs
Cats
9x
1x 9x
1xx1 9x
x1 9x
Vets believe that 49% of dogs, 44% cats, 32% small mammals and 11% birds areoverweight/obese. LVS November 2016
49% OVERWEIG
HT
44% OVERWEIG
HT
32% OVERWEIG
HT
11% OVERWEIG
HT
43%never read
the pet foodlabel
40% never read any
packaging
35%claim to alreadyhave sufficient
knowledge aboutthe correct
diet
53% of dog owners who feedtable scraps do so daily
49% of cat owners who feedtable scraps do so daily
Data from LVS 2016/TNS 2017
90%
OF VETS AGREE WIT
H P
ET
FOO
D
90% of vets agree that prepared petfood provides optimum nutrition when
fed correctly72%
OF DOG OWNERS AG
RE
E W
ITH
PET FOOD
72% of dog owners agree thatprepared pet food provides optimum
nutrition when fed correctly
68%
OF CAT OWNERS AG
RE
E W
ITH
PET
FOOD
68% of cat owners agree that preparedpet food provides optimum nutrition
when fed correctly
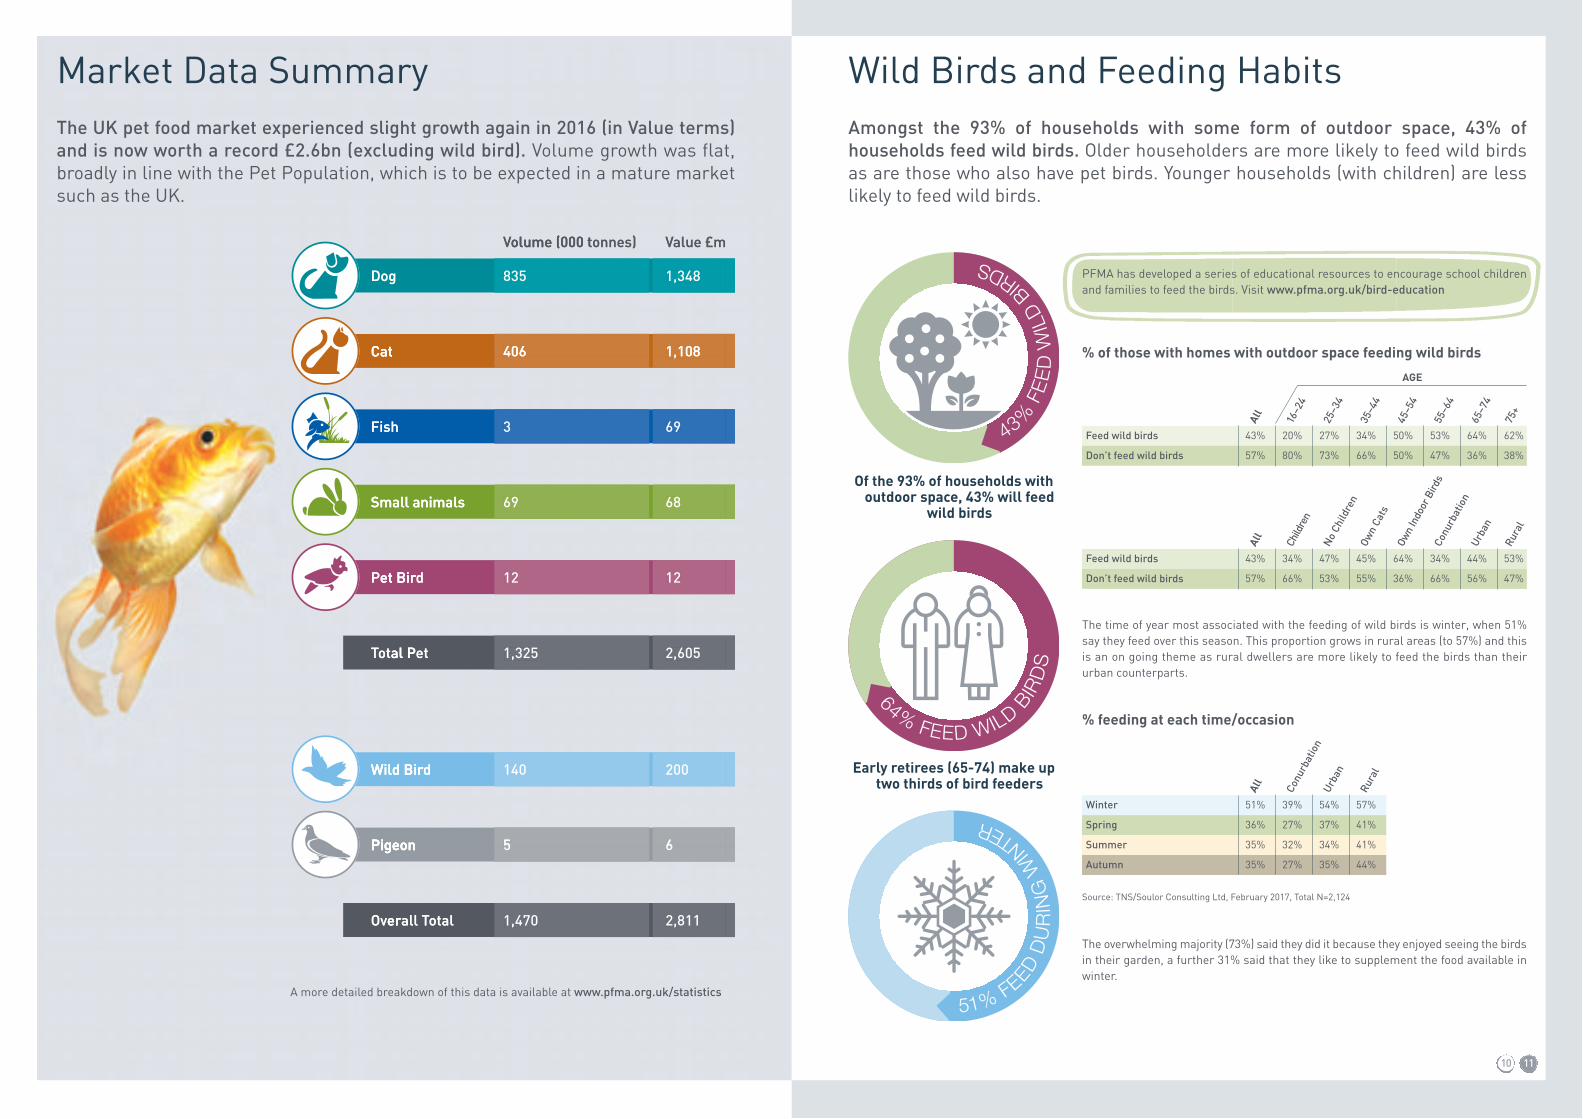
Wild Birds and Feeding HabitsAmongst the 93% of households with some form of outdoor space, 43% ofhouseholds feed wild birds. Older householders are more likely to feed wild birdsas are those who also have pet birds. Younger households (with children) are lesslikely to feed wild birds.
PFMA has developed a series of educational resources to encourage school childrenand families to feed the birds. Visit www.pfma.org.uk/bird-education
% of those with homes with outdoor space feeding wild birds
The time of year most associated with the feeding of wild birds is winter, when 51%say they feed over this season. This proportion grows in rural areas (to 57%) and thisis an on going theme as rural dwellers are more likely to feed the birds than theirurban counterparts.
% feeding at each time/occasion
Source: TNS/Soulor Consulting Ltd, February 2017, Total N=2,124
The overwhelming majority (73%) said they did it because they enjoyed seeing the birdsin their garden, a further 31% said that they like to supplement the food available inwinter.
Feed wild birds
Don’t feed wild birds
43%
57%
20%
80%
27%
73%
34%
66%
50%
50%
53%
47%
64%
36%
62%
38%
65–7
4
75+
55–6
4
45–5
4
35–4
4
25–3
4
16–2
4
All
AGE
Feed wild birds
Don’t feed wild birds
43%
57%
34%
66%
47%
53%
45%
55%
64%
36%
34%
66%
44%
56%
53%
47%
Urba
n
Rura
l
Conu
rbat
ion
Own
Indo
or B
irds
Own
Cats
No Ch
ildre
n
Child
ren
All
Winter
Spring
Summer
Autumn
51%
36%
35%
35%
39%
27%
32%
27%
54%
37%
34%
35%
57%
41%
41%
44%
Rura
l
Urba
n
Conu
rbat
ion
All
43% F
EE
D W
ILD
B
IRDS
Early retirees (65-74) make uptwo thirds of bird feeders
Of the 93% of households withoutdoor space, 43% will feed
wild birds
64% FEED WILD BIR
DS
51% FEED D
UR
ING
WIN
TER
10 11
Market Data SummaryThe UK pet food market experienced slight growth again in 2016 (in Value terms)and is now worth a record £2.6bn (excluding wild bird). Volume growth was flat,broadly in line with the Pet Population, which is to be expected in a mature marketsuch as the UK.
A more detailed breakdown of this data is available at www.pfma.org.uk/statistics
Dog 835 1,348
Volume (000 tonnes) Value £m
Cat 406 1,108
Pet Bird 12
1,325
12
2,605Total Pet
Small animals 69 68
Fish 3 69
Overall Total 1,470 2,811
Wild Bird 140 200
Pigeon 5 6
Dog
Cat
835
olume (000 tV
406
1,348
alue £mVonnes)olume (000 t
1,108Cat
Small animals
Fish
406
69Small animals
3
1,108
68
69
et BirP
al PotT
12det Bir
1,325etal P
12
2,605
Wild Bir
Pigeon
140dWild Bir
5Pigeon
200
6
erOv
Pigeon
1,470alotall Ter
5Pigeon
2,811
6
Worldwide Pet Populations Reasons for notowning a petThe following chart shows the proportions of households owning either a cat or dog
for each of the major EU economies and the USA (the countries are ranked indescending order of total pet populations).
12 13
The UK is on a par with her European counterparts in terms of the percentage ofhouseholds owning a dog, but behind the USA, whereas for cats the UK has a similarlevel of ownership to Germany, Italy and Spain but much lower than France and theUSA.
% Household Owning (at least one) Cat/Dog
Source: EU FEDIAF 2014; USA APPA 2015-16
Comparing data for 2014: In absolute terms the UK had around 20 million petscompared to around 30 million in Italy, France and Germany. According to 2015/2016data, the USA has a total of 200 million pets (excluding fish).
Europe Absolute Pet Populations (2014)
Source: EU FEDIAF 2014; USA APPA 2015-16
Source: EU FEDIAF 2014
Some of this disparity in the proportion of households owning a pet in the UK (vs. othersimilarly developed countries) could be due to differing attitudes towards homeownership and renting. In Germany for example renting a home rather than buying isthe norm, however with much longer tenancy periods and more rights for the tenantthan is often experienced in the UK rented sector.
In 2016, the PFMA and Dogs Trust asked the panel of householdsif they didn’t own a pet, what was the reason for this. The secondmost common answer (13% of the 1,300 people asked) was thatthey had moved into rented accommodation (with inference beingthat the landlord wouldn’t allow pets). The only other significantanswer was ‘lifestyle’, which is to suggest that the householderdidn’t feel that having a pet was appropriate given their frequencyand lengthy absences from the home.
35%44%
19%22%
28%20%
20%14%
19%24%19%26%
USA
Italy
France
Germany
UK
Spain
Dogs
Cats
0
5,000,000
10,000,000
15,000,000
20,000,000
25,000,000
30,000,000
35,000,000
Italy France Germany UK Spain
Cats Dogs Small Animal Reptile Birds
Dogs Trust StudyFor several years, Dogs Trust have been involved withthis study, looking at microchipping, neutering &training. Questions have also asked where ownersacquire their dogs as well as investigating the reasonsfor giving up a dog.
Microchipping
In April 2016 compulsory micro chipping came in to effect, so how has this translatedin to reality? In 2017, 93% of dog owners responded that their dog had beenmicrochipped. This is an increase of 9% on 2016 figures.
There are regional variations. Most areas report over 90% of dogs are micro chipped,but Yorkshire & The Humber and West Midlands report just under 90% (88% and 89%respectively).
88% of households report that they were aware of the legal requirement to microchip(by April 2016).
Whilst only 7% have moved house, we asked those who moved about the methods ofupdating the microchipping database. The most common method of doing this wasvia their vet (48%) and doing it themselves via the microchip suppliers’ website (39%).
One of the biggest increases in the take up of microchips over the period 2016 to 2017has been in C2DE households, reflecting the subsidies offered by vets or charities.
Neutering
There has been a modest increase in the number of households reporting that theirdog(s) have been neutered (68% in 2017 vs. 67% in 2016). By region this figure rangesfrom 60% to 75%.
One of the greatest disparities between those who neuter and those who do not is inSocial Class (i.e. household income), with 24% of ABC1 households not neuteringcompared to 39% of C2DE households. However, the proportion of C2DE householdsnot neutering their dogs increased between 2016 and 2017 from 36% to 39%. WhereasABC1 households have gone down from 28% in 2016 not neutered to 24% in 2017.
Training
Dogs Trust has enquired about the training habits of dog owners. In 2017, the numberof households who take their dog(s) or intend to take them to training classes hasincreased from 22% to 24%.
64% of owners simply do not see the need for training classes and this figure hasincreased from 62% in 2016. 22% claim that they have previously had other dogstrained and know what to do. This figure was 24% in 2016.
There is evidence from the microchipping questions that the vet is a trusted source ofinformation for dog owners, so this could be a conduit to communicate other keymessages such as training.
Did you know?77% of cat owners and 81% of
dog owners believe thatGovernment should do more
to protect animal welfare.
93% of dogs are microchipped
Acquisition
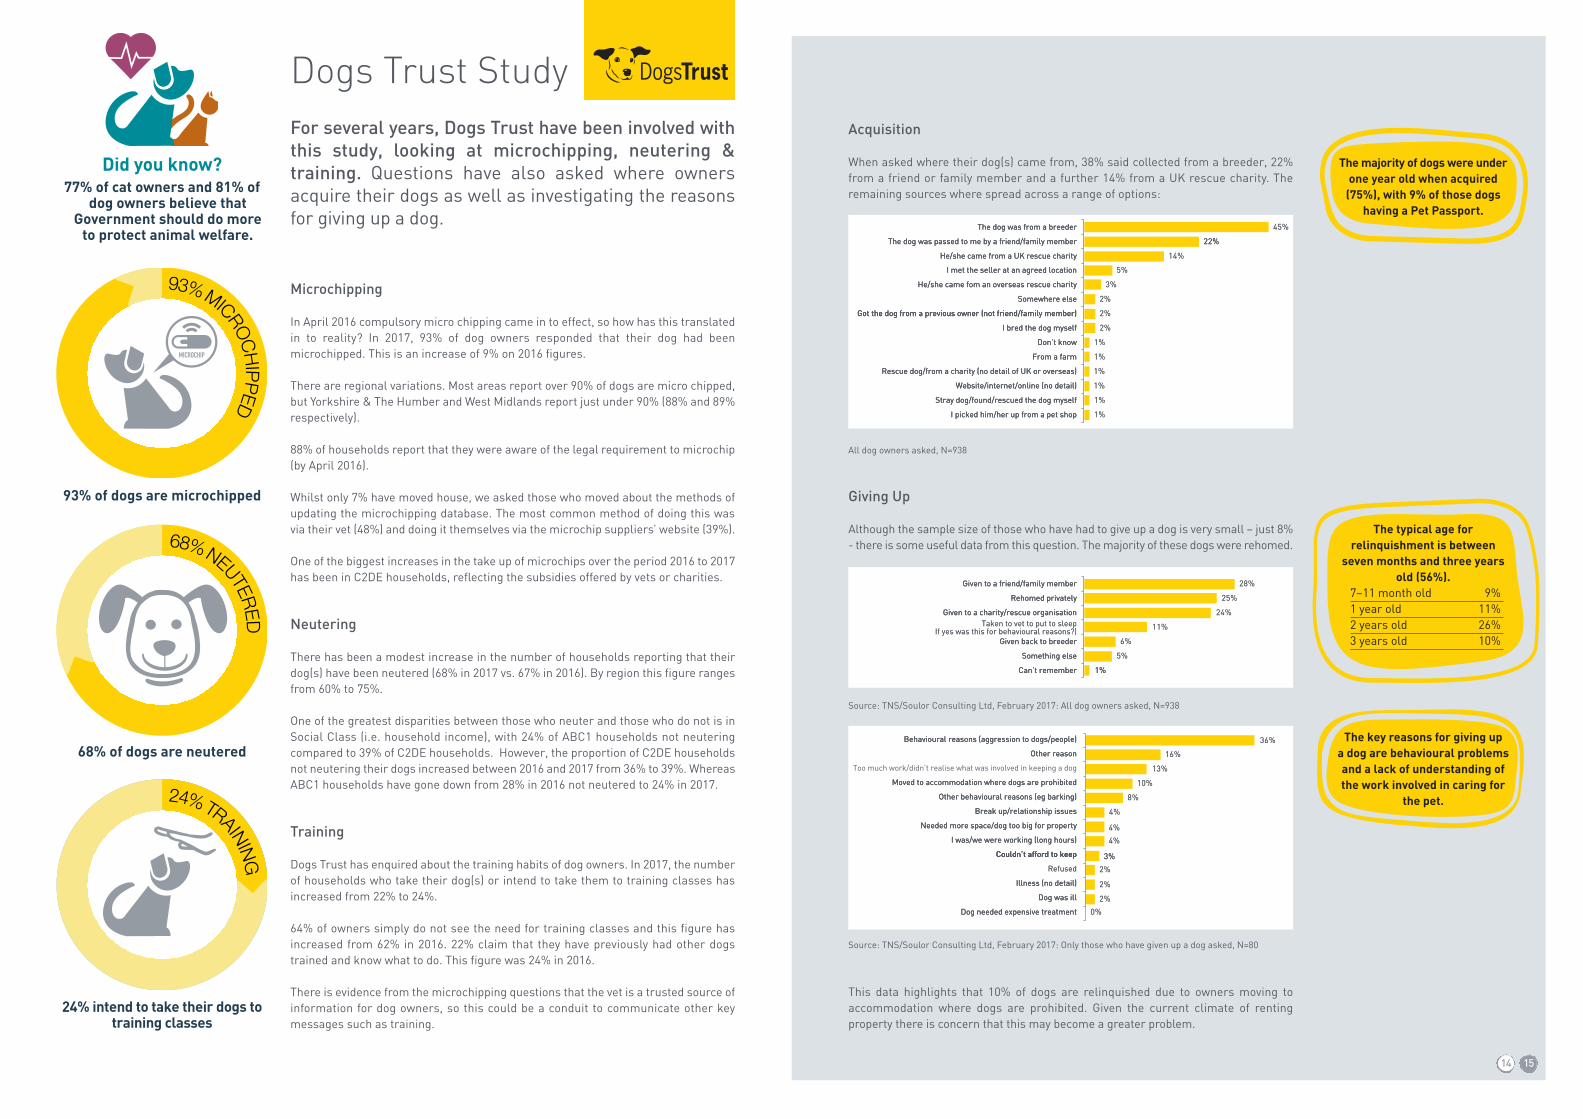
When asked where their dog(s) came from, 38% said collected from a breeder, 22%from a friend or family member and a further 14% from a UK rescue charity. Theremaining sources where spread across a range of options:
Graph
All dog owners asked, N=938
Giving Up
Although the sample size of those who have had to give up a dog is very small – just 8%- there is some useful data from this question. The majority of these dogs were rehomed.
Source: TNS/Soulor Consulting Ltd, February 2017: All dog owners asked, N=938
Source: TNS/Soulor Consulting Ltd, February 2017: Only those who have given up a dog asked, N=80
This data highlights that 10% of dogs are relinquished due to owners moving toaccommodation where dogs are prohibited. Given the current climate of rentingproperty there is concern that this may become a greater problem.
The majority of dogs were underone year old when acquired
(75%), with 9% of those dogshaving a Pet Passport.
The key reasons for giving upa dog are behavioural problemsand a lack of understanding ofthe work involved in caring for
the pet.
The typical age forrelinquishment is between
seven months and three yearsold (56%).
He/she came from a UK rescue charity
The dog was passed to me by a friend/family member
The dog was from a breeder
B
45%
22%
14%
I picked him/her up from a pet shop
Stray dog/found/rescued the dog myself
Website/internet/online (no detail)
Rescue dog/from a charity (no detail of UK or overseas)
From a farm
Don’t know
I bred the dog myself
Got the dog from a previous owner (not friend/family member)
Somewhere else
He/she came fom an overseas rescue charity
I met the seller at an agreed location 5%
3%
2%
2%
2%
1%
1%
1%
1%
1%
1%
The dog was from a breeder
The dog was passed to me by a friend/family member
He/she came from a UK rescue charity
I met the seller at an agreed location
He/she came fom an overseas rescue charity
14%
22%
The dog was from a breeder
The dog was passed to me by a friend/family member
He/she came from a UK rescue charity
3%
5%I met the seller at an agreed location
He/she came fom an overseas rescue charity
22%
45%
Got the dog from a previous owner (not friend/family member)
Somewhere else
Got the dog from a previous owner (not friend/family member)
I bred the dog myself
Don’t know
From a farm
Rescue dog/from a charity (no detail of UK or overseas)
Website/internet/online (no detail)
Stray dog/found/rescued the dog myself
I picked him/her up from a pet shop 1%
1%
1%
1%
1%
1%
2%
2%
2%Somewhere else
Got the dog from a previous owner (not friend/family member)
I bred the dog myself
Don’t know
From a farm
Rescue dog/from a charity (no detail of UK or overseas)
Website/internet/online (no detail)
Stray dog/found/rescued the dog myself
I picked him/her up from a pet shop
Can’t remember
Something else
Given back to breeder
Taken to vet to put to sleepIf yes was this for behavioural reasons?)
Given to a charity/rescue organisation
Rehomed privately
Given to a friend/family member 28%
25%
24%
11%
6%
5%
1%
Given to a friend/family member
Rehomed privately
Given to a charity/rescue organisation
If yes was this for behavioural reasons?)Taken to vet to put to sleep p
Given back to breeder
Something else
Can’t remember 1%
5%
6%
11%
Given to a friend/family member
Rehomed privately
Given to a charity/rescue organisation
reasons?) ut to sleep p
)Given back to breeder
Something else
Can’t remember
24%
25%
28%
1%
Behavioural reasons (aggression to dogs/people)
Other reason
Too much work/didn’t realise what was involved in keeping a dog
Moved to accommodation where dogs are prohibited
Other behavioural reasons (eg barking)
Break up/relationship issues
Needed more space/dog too big for property
I was/we were working (long hours)
Couldn’t afford to keep
Refused
Illness (no detail)
Dog was ill
Dog needed expensive treatment
4
36%
16%
13%
10%
8%
4%
4%
4%
3%
2%
2%
2%
0%
Couldn’t afford to keep
I was/we were working (long hours)
Needed more space/dog too big for property
Break up/relationship issues
Other behavioural reasons (eg barking)
Moved to accommodation where dogs are prohibited
Other reason
Behavioural reasons (aggression to dogs/people)
Couldn’t afford to keep
I was/we were working (long hours)
Needed more space/dog too big for property
Break up/relationship issues
Other behavioural reasons (eg barking)
Moved to accommodation where dogs are prohibited
Other reason
Behavioural reasons (aggression to dogs/people)
3%
4%
4%
4%
8%
10%
13%
16%
36%
Dog needed expensive treatment
Dog was ill
Illness (no detail)
Couldn’t afford to keep
Dog needed expensive treatment
Dog was ill
Illness (no detail)
Refused
Couldn’t afford to keep
0%
2%
2%
2%
3%
93% MICROC
HIPPED
68% of dogs are neutered
68% NEUTERED
24% intend to take their dogs totraining classes
24% TRAINING
7–11 month old 9%1 year old 11%2 years old 26%3 years old 10%
14 15

Summary and Methodology OverviewWe are pleased to report that both the proportion of households owning pets andpet food market value have increased. There are now 12 million households owningpets and the pet food market is worth 2.6bn (excluding wild bird). Ensuring that allthe pets in our society are well looked after and receive a healthy diet, is key to theactivity of PFMA.
PFMA is actively involved in organisations such as National Pet Month, the Canine FelineSector Group (CFSG) and the All Parliamentary Group for Animal Welfare (APGAW),these bodies work hard to raise standards and awareness of animal welfare issues.
PFMA has a very specific role in the area of pet nutrition and this is where we educateto make sure those at the front line of pet care have all the information they need tosupport owners in providing the best possible diets for their pets. The educationalwork of PFMA and the other organisations is ongoing and what is particularly uniqueabout the pet care sector is how well those organisations come together to bring aboutchange. PFMA looks forward to this continued collaboration and achieving real resultsfor our amazing companion animals in 2017 and beyond.
Nicole Paley, PFMA Communications Manager
More Detail on Survey MethodologyThe annual PFMA Pet Population study has a data set, which covers the period from2008 to 2017. The survey methodology is kept consistent to ensure that no bias isintroduced into the process, which will adversely affect the data quality.
The survey is carried out by TNS, a globally recognised leader in consumer research,and is managed for the PFMA by external consultants. To keep costs under controlthe survey is part of an ‘omnibus’ study which TNS carry out every week, which clientscan buy space in. The questionnaire for the PFMA study can change every year toinclude specific enquiries, which are not needed on an annual basis. However, theelements pertaining to the annual population survey are kept constant.
The sample size changed several years ago to ensure that the small animalpopulations were being adequately covered. To this end approximately four thousandhouseholds across the UK are sampled. This sample is based on naturally occurringdemographics however there are quotas imposed for the different Government regionsto ensure good geographic coverage.
The study is carried out at the same time of year (late January and early February),the only recent change to the study was an increase in the number of householdsasked whether or not they had indoor or outdoor fish. This increase in sample of 50%was designed as a one-off exercise to determine the effectiveness of the original (4,000per year) sample. The results were conclusive, that is to say that the boosted samplegave the same results as the more usual sample size.
From the TNS omnibus results, the proportion of households owning a pet (of whateverspecies) is applied to a calculated number of households in the UK (with the sourcesof data being the 2011 census and other Government published documents predictingthe change in household numbers). These estimates are then multiplied (per species)by the average number of animals per household from the survey.
Other sets of questions are sometimes asked in respect of Wild Bird feeding habits, generalquestions about pet ownership which can be asked in conjunction with pet charities.